effects of land-use-change scenarios on terrestrial carbon stocks in south korea
TRANSCRIPT

ORIGINAL PAPER
Effects of land-use-change scenarios on terrestrialcarbon stocks in South Korea
Dong Kun Lee • Chan Park • Dana Tomlin
Received: 1 June 2011 / Revised: 7 October 2013 / Accepted: 23 October 2013
� International Consortium of Landscape and Ecological Engineering and Springer Japan 2013
Abstract The amount of carbon stored in soil and vege-
tation varies according to land use. Land-use changes
(LUCs) affect those carbon stocks. Changes in carbon
stocks also affect greenhouse gas emissions. Predicting
LUCs is therefore necessary to establish quantitative targets
for carbon dioxide (CO2) reduction. This study attempts to
model LUCs and the associated changes in carbon stocks
for South Korea between 2005 and 2030. It examines four
LUC scenarios suggested by the Intergovernmental Panel
on Climate Change. Each scenario is assessed in terms of its
effect on South Korean carbon stocks. Under all four sce-
narios, afforestation leads to carbon sequestration with an
average net uptake of 22.4–31.5 MtC. The scenario yielding
the highest sequestration rate increase (from 12.4 to 14.1
MtC/year) results in levels of sequestration equal to 8.3 %
of South Korea’s 2005 CO2 emissions. This is equivalent to
a value of 304 million dollars in the European Union carbon
market. Clear differences among the scenarios tested sug-
gest that land use must be regarded as an important factor in
any plan for future carbon sequestration.
Keywords Biomass � Carbon sequestration �Climate change � Low carbon society (LCS) �Soil carbon
Introduction
Over the past several decades, it has become widely rec-
ognized and accepted that the observed increases in the
concentration of greenhouse gases (GHGs) have raised
global temperatures and altered climate patterns [Inter-
governmental Panel on Climate Change (IPCC) 2007].
Between 1989 and 1998, the net removal of carbon from the
atmosphere by terrestrial ecosystems has been estimated to
have averaged 2.3 GtC/year (IPCC 2000). Throughout the
1990s, however, anthropogenic releases from the carbon
pools of terrestrial ecosystems due to land-use changes
(LUCs) have been estimated at 1.6 GtC/year (IPCC 2000).
The combined result of these natural and anthropogenic
processes corresponds to the net removal of carbon from the
atmosphere by terrestrial ecosystems (Schlamadinger et al.
2007). Given the significance of emissions/removals and
the potential to influence both through policy measures, it
will be important to continue to include the Land use, Land-
Use Change, and Forestry (LULUCF) guidelines in future
international climate-change agreements (Parrotta 2002;
Schlamadinger et al. 2007).
LUCs not only affect GHG emissions but also carbon
stocks associated with soil and vegetation (Feddema et al.
2005; Schulp et al. 2008), as different land uses are associated
with different soils and differing amounts of vegetation
Electronic supplementary material The online version of thisarticle (doi:10.1007/s11355-013-0235-6) contains supplementarymaterial, which is available to authorized users.
D. K. Lee
Landscape Architecture, College of Agriculture & Life Science,
Seoul National University, San 56-1 Sillim-Dong, Gwanak-Gu,
Seoul 151-743, Korea
e-mail: [email protected]
C. Park (&)
Center for Social and Environmental Systems Research,
National Institute for Environmental Studies, 16-2 Onogawa,
Tsukuba, Ibaraki 305-8506, Korea
e-mail: [email protected]
D. Tomlin
Landscape Architecture, School of Design, The University of
Pennsylvania, 3451 Walnut street, Philadelphia, PA 19104, USA
e-mail: [email protected]
123
Landscape Ecol Eng
DOI 10.1007/s11355-013-0235-6

(Jeong et al. 1998; Arrouays et al. 2001; Bellamy et al. 2005;
Schulp et al. 2008). Soil carbon stocks in built-up areas and
croplands are generally lower than those in forestland
(Lamlom and Savidge 2003; Schulp et al. 2008). The con-
version of forestland to other land-use types has been found to
decrease carbon stocks, whereas conversion of other land-use
types to forestland usually leads to increased carbon stocks
[Korea Forest Research Institute (KFRI) 1996; Lettens et al.
2005]. Significantly, forests also store large amounts of car-
bon in vegetation (KFRI 1996; Jeong et al. 1998; Lamlom
and Savidge 2003; Schulp et al. 2008). Among the factors that
will influence future soil carbon stocks, LUCs are expected to
have the largest impact (Smith et al. 2005a).
LUCs occur as the result of complex socioeconomic
activity and physical factors (Verburg et al. 2002; Yim and
Choi 2002; Cho 2008), and future LUC is always uncertain.
To reduce this uncertainty, cellular automata are often used
in spatially explicit experiments that simulate LUC as a
function of user-specified relationships among neighboring
land uses (Verburg et al. 2002). Despite the recent progress
in integrating the biophysical and socioeconomic drivers of
LUC (Verburg et al. 2002; Yim and Choi 2002; Cho 2008),
however, the prediction of future land use remains quite
difficult (Rounsevell et al. 2006). One tool that has proven
helpful in this regard is scenario analysis (Alcamo 2001;
Rounsevell et al. 2006). Recently, a number of studies have
synthetically assessed relationships between LUC and car-
bon-stock change (e.g., Smith et al. 2005b; Zaehle et al.
2007; Schulp et al. 2008). Notwithstanding an increase in
attention to carbon-sink management in climate-change
negotiations and in academic studies, the role of future LUC
in carbon stocks is uncertain in South Korea (Ahn and Han
2004). These uncertainties can be attributed to gaps in our
understanding of both future LUCs and difficulties in
quantifying the response of carbon sequestration to LUCs.
The aim of this study was to model the effects of LUCs on
carbon stocks in South Korea between 2005 and 2030. LUCs
are analyzed using specific LUC scenarios. Carbon-stock
changes are analyzed using a set of high-resolution map.
Methodology
The overall approach to this effort is diagrammed in Fig. 1.
LUC modeling and its scenarios are discussed in more
detail in ‘‘LUC scenarios, LUC modeling’’. The carbon-
stock calculation method is described in ‘‘Calculation of
carbon stock changes’’.
LUC scenarios
Land use has changed significantly throughout South Korea
in recent years, and this trend is likely to continue in the
future. However, it is not easy to predict future LUC, so
several possible scenarios were explored. LUC scenarios
are created based on the four storylines presented in IPCC’s
Special Report on Emission Scenarios. The scenarios are
reviewed by many socioeconomic experts in South Korea.
The four LUC scenarios employed are respectively called
A1, A2, B1, and B2. The A1 and 2 scenarios assume future
oriented more toward economic development than envi-
ronment protection; B1 and 2 scenarios do just the opposite.
In the A and B1 scenarios, international cooperation is
emphasized over regionalism; in the A and B2 scenarios,
the opposite is true. In the A1 scenario, cropland and forest
are the most likely to be urbanized. Regulations protecting
greenbelt areas are lifted to accommodate economic growth
and the expansion of private property, and the control of
cropland development is relaxed due improvements in
agricultural productivity. In the A2 scenario, urbanization
progresses at the same level, but grassland and forest are
more likely to change into cropland because of an increased
need for agricultural products due to a crisis in food secu-
rity. Forest area decreases as it changes into grassland,
urbanization, and cropland, whereas greenbelt and agri-
cultural development regions are kept at present-day levels.
In the B1 scenario, urbanization progresses at a lower level,
and as interest in the natural environment increases, more
cropland and grassland areas are changed into forest as a
result of the Afforestation and Reforestation Clean Devel-
opment Mechanisms (A/R CDM) project that has been
adapted by IPCC to reduce actual carbon dioxide (CO2) in
the atmosphere. As the need to grow bioenergy resources
increases, grassland and forest areas are changed to crop-
land, and developmental controls protecting greenbelt and
cropland areas are kept at present-day levels. In the B2
scenario, as there is little new urbanization, land use
changes into forest occur mainly on marginal cropland
areas, where it is hard to grow agricultural products, and on
grassland areas such as golf courses. Additionally, devel-
opmental controls protecting cropland areas are kept in
place for the reasons of food security (Table 1).
LUC modeling
Land-change modeler (LCM) is used to predict future LUCs.
Land-use transition probabilities have been established by
analyzing correlations between past land usage and sus-
pected driving factors. Legal issues and policies, gross
regional domestic product (GRDP), and scenario-specific
populations were considered as driving factors. Topographic
elevation, slope, distance from roads, and distance from
built-up areas were also used. The multilayer perceptron
(MLP) neural network method is a primary method for
generating land-use transition probabilities. To analyze past
changes in land use, the Korean Ministry of Environment’s
Landscape Ecol Eng
123

Level 1 land-cover maps of 1989 and 1999 were converted
from their original 30 9 30-m resolution to a coarser
100 9 100-m resolution in order to encompass the entire
country, creating files of manageable size. The probabilities
of particular LUC in the future were calculated by applying a
Markov technique. Resulting transition matrixes were then
modified according to the level of urbanization and
economic growth associated with each scenario. The prob-
ability of LUC was also constrained in legislatively protected
conservation areas, such as greenbelts, national parks, the
Demilitarized Zone, the Baekdudaegan, wetlands, conser-
vation forests, waterfronts, agricultural development
regions, forest resource conservation areas, water source
conservation areas, and wild animal and plant protection
Fig. 1 Carbon-stock change calculation
Landscape Ecol Eng
123
areas. These transition rules were ultimately applied to
existing land-use patterns by employing a cellular automaton
technique, which simulates LUC incrementally by repeat-
edly updating discrete locations according to site conditions,
with an immediate vicinity (Yim and Choi 2002; Fang et al.
2005). This method of LUC modeling had demonstrated
good performance in previous regional studies of South
Korea (e.g., Yim and Choi 2002; Lee and Park 2009).
Calculation of carbon-stock changes
To calculate the effects of future LUC on carbon stocks, an
LUC and a carbon-stock calculation method were coupled
(Schulp et al. 2008). Such coupling is difficult due to the
different spatial and temporal resolutions of available LUC
and carbon-stock calculations (Smith et al. 2005a). Most
assessments that address the effect of LUC on carbon stock
strongly simplify the dynamics of LUC (Smith et al. 2005a;
Zaehle et al. 2007; Schulp et al. 2008). Changes in carbon
stock were calculated by considering changes in biomass
associated with LUC and natural growth. Carbon-stock
changes are calculated for each land use or LUC as follows:
Soil stock change ¼ soil carbon stock 2030ð Þ� soil carbon stock 2005ð Þ
Biomass stock change ¼ stem volume incrementation
þ afforestation� deforestation
� decomposition of litter
Changes in carbon stock ¼ soil stock change
þ biomass stock change
Soil carbon stocks start to change to a new equilibrium
after LUC. This is a rapid process that occurs immediately
Table 1 Land-use-change (LUC) scenarios and story lines
LUC
scenarios
Storylines
A1 scenario More cropland and forest is easy to change into urban
use than the other scenarios and are most likely to be
urbanized
Regulations protecting greenbelt areas are lifted to
accommodate economic growth and expansion of
private property
Control of cropland development is relaxed due to
improvements in agricultural productivity
A2 scenario Urbanization progresses at the same level
More grassland and forest are more likely to change
into cropland than other scenarios (food security)
Forest areas decrease as they change into grassland,
urban areas, and cropland
Greenbelt and agricultural development regions are
kept at present level
B1 scenario Urbanization progresses at a lower level
More cropland and grassland areas are changed into
forest (A/R CDM)
Grassland and forest are changed into cropland
(bioenergy)
Developmental controls preserved greenbelts, and
cropland areas are kept at present level
B2 scenario Little new urbanization
Land use changes into forest occur mainly on marginal
cropland areas
Developmental regulations for protecting cropland
areas are kept (food security)
A/R CDM Afforestation and Reforestation Clean Development
Mechanisms
Table 2 Soil carbon stock by land-use type
Forest Paddy
field
Upland
field
Grassland Other
Soil carbon (tC/
ha)
67.9 60.5 45.9 45.9 11.5
Lee et al. (2001)
Table 3 Annual growth rate of stem volume
Coniferous
forest
Deciduous
forest
Mixed
forest
Annual growth rate of stem
volume (m3/ha)
5.68 3.45 4.56
Korea Forest Research Institute (KFRI) (2006)
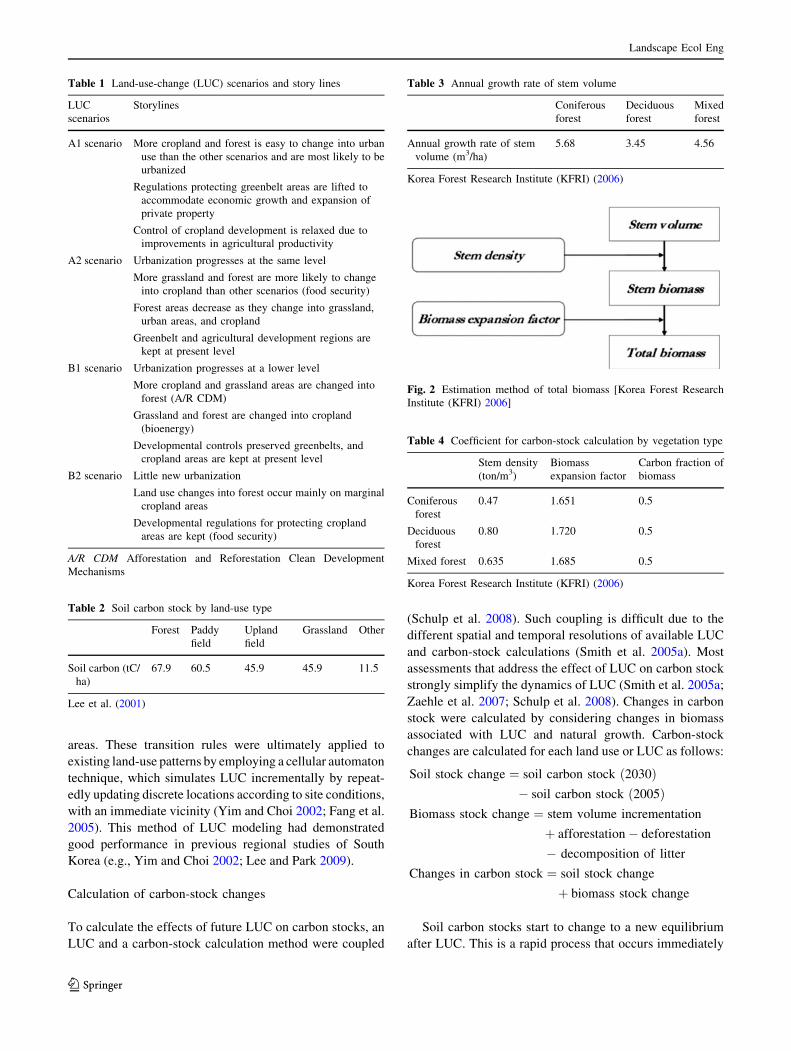
Fig. 2 Estimation method of total biomass [Korea Forest Research
Institute (KFRI) 2006]
Table 4 Coefficient for carbon-stock calculation by vegetation type
Stem density
(ton/m3)
Biomass
expansion factor
Carbon fraction of
biomass
Coniferous
forest
0.47 1.651 0.5
Deciduous
forest
0.80 1.720 0.5
Mixed forest 0.635 1.685 0.5
Korea Forest Research Institute (KFRI) (2006)
Landscape Ecol Eng
123

after conversion, and it levels off when soil carbon stocks
approach equilibrium (Freibauer et al. 2004; KFRI 2006).
It is expected that equilibrium is reached approximately
20 years after conversion (KFRI 2006). Carbon
accumulation can in fact differ according to the various
characteristics of soils (Lal 2004; Smith et al. 2008). The
change in soil carbon stock as a consequence of land-use
conversion depends on the differential sizes of the soil C
pool between land-use types at equilibrium (Zaehle et al.
2007). To estimate carbon accumulation in soil, the
methods of Lee et al. (2001) were used with five types of
land use: forest, paddy field, upland field, grassland, and
others (Table 2). Land-cover maps were converted into five
land-use categories: soil under forest area, 67.9 tC/ha;
paddy field, 60.5 tC/ha\; upland field, 45.9 tC/ha; grassland,
45.9 tC/ha; and other areas, 11.5 tC/ha (Lee et al. 2001).
All soil carbon-stock changes consider the upper 30 cm of
the soil (Lee et al. 2001; Schulp et al. 2008).
Carbon accumulation in vegetation was calculated by
considering stem-volume incrementation, afforestation,
deforestation, and decomposition of litter between 2005
and 2030. Stem-volume incrementation is considered in
Fig. 3 Land-use change
Fig. 4 Result of land-use change in A1 scenario (see text for definition)
Landscape Ecol Eng
123

areas designated as forest-land-remaining-forest-land,
afforestation, and deforestation areas. Tree growth acts as a
carbon sink in forest-land-remaining-forest-land and
afforestation areas, but it acts as a carbon source in
deforestation areas. For forest-land-remaining-forest-land
areas, we calculated stem-volume incrementation from
Fig. 5 Result of land-use change in A2 scenario (see text for definition)
Fig. 6 Result of land-use change in B1 scenario (see text for definition)
Landscape Ecol Eng
123

2005 to 2030. Stem-volume increase is shown in Table 3.
We also assumed a constant annual rate of LUC in order to
calculate carbon emissions caused by LUCs. Afforestation
and deforestation exhibit only half as much stem-volume
incrementation. Carbon budgets were calculated using the
total biomass and a carbon fraction of biomass. Total
biomass is the sum of stem, branch, and root biomass. To
calculate branch and root biomass, biomass expansion
factor measured by KFRI was used (Fig. 2; Table 4).
Stem-volume incrementation was applied to the annual
growth rate in stem volume for vegetation types suggested
by the KFRI. The coefficient of carbon-stock calculations
by vegetation type reflected the value suggested by KFRI
(Table 4). We assumed that land converted to forest area
will be an afforestation field covered by coniferous trees
averaging 15 years old. For forest converted to other land
uses, we assumed that vegetation was all deforested and
60 % of living biomass, such as litter and roots, would
decay (KFRI 2006). The drop caused by exploiting forests
was calculated considering total biomass, including growth
until forests and existing biomass were exploited. The
volume of the accumulation of standing trees in existing
forests was calculated by using inventory data from the
South Korea Forest Service, reflecting the accumulation
density for each region. The IPCC (1996) guidelines for
LULUCF were used as the basic method for calculating the
volume of carbon accumulation. Accumulated carbon stock
is described in tons of carbon units.
Results
LUC results
Four scenarios are generated with different land-use
options regarding the demands and present land-use pattern
prevailing in the country. Results of the LUC model are
presented in Fig. 3. Note here that all scenarios result in the
reduction of cropland, whereas forest area increase in every
scenario except for A1. The scenarios also differ in their
spatial patterns of LUC, particularly the conversion of
forest and cropland to other land-use types. Concrete
results for LUCs in each scenario are as follows (Figs. 3, 4,
5, 6, 7, Appendix 2):
In the A1 scenario, urbanization occurred rapidly. Built-
up areas ultimately encompass 7,264 km2 (Fig. 3, left), or
110 % more area than in 1999 (Fig. 3, right). By contrast,
the areas of cropland and forest are reduced, with the area
of forest decreased by 2.2 %. Urbanization primarily
occurs on flat lowlands, occasionally replacing agriculture.
Land around Seoul and other major metropolitan areas is
especially susceptible to urbanization (Fig. 4). In the A2
scenario, urbanization encompasses 41.8 % less area than
in the A1 scenario (Fig. 3, right), due largely to the con-
tainment of byways of greenbelts. In this scenario, devel-
opment tends to occur in the suburbs of Daejeon, Daegu,
and Busan rather than Seoul, reflecting GRDP growth
(Fig. 5). In the B1 scenario, urbanization increases by
Fig. 7 Result of land-use change in B2 scenario (see text for definition)
Landscape Ecol Eng
123

49.0 % of the A2 scenario in 2030. With the changeover of
croplands and grasslands into forests, the forest area
increases 3.85 % more than in 1999, and the decrease in
cropland of 5.2 % is lower than that in the A1 scenario of
8.6 % (Fig. 3, right). Fewer cropland areas near Seoul are
urbanized than in other scenarios, and urbanization focuses
on major cities throughout the country. Cropland increases
in the northeastern (Gangwon Province) and south-
western (Jeonnam Province) parts of South Korea, where
population levels drop sharply. Wetland areas also
increase. LUC also tends to occur within the city more
often than in suburbs (Fig. 6). In the B2 scenario, the
amount of urbanized, cropland, and other land-use areas
decreases. Forest areas, however, increase by 4.6 % com-
pared with 1999. Cropland decreases by 0.2 %, whereas
other areas decrease by 30.7 % and grassland by 56.7 %
compared with 1999 (Fig. 3, right). Urbanization occurs in
rural areas more frequently (Fig. 7).
Table 5 Accumulated carbon stock in living biomass in forest-land-
remaining-forest-land areas (2006–2030)
Coniferous
forest
Deciduous
forest
Mixed
forest
Total
A1
Area (1,000 ha) 2,527 1,618 1,553 5,700
Stem-volume
increment
(1,000 m3)
358,973 139,608 177,121 675,702
Accumulated
carbon stock
(MtC)
139.2 96.1 94.9 330.2
A2
Area (1,000 ha) 2,563 1,629 1,572 5,764
Stem-volume
increment
(1,000 m3)
363,901 140,556 179,278 683,735
Accumulated
carbon stock
(MtC)
141.2 96.7 96.1 334.0
B1
Area (1,000 ha) 2,543 1,629 1,561 5,734
Stem-volume
increment
(1,000 m3)
361,240 140,531 177,945 679,716
Accumulated
carbon stock
(MtC)
140.1 96.7 95.4 332.2
B2
Area (1,000 ha) 2,592 1,639 1,586 5,818
Stem-volume
increment
(1,000 m3)
368,139 141,352 180,859 690,350
Accumulated
carbon stock
(MtC)
142.8 97.2 96.9 337.0
Table 6 Accumulated carbon stock in living biomass in land con-
verted to forest land (2006–2030)
A1
(MtC)
B1
(MtC)
B1
(MtC)
B2
(MtC)
Accumulated carbon stock 22.4 28.8 32.5 31.5
Table 7 Accumulated decrease in carbon stocks in living biomass
due to deforestation (2006–2030)
Coniferous
forest
Deciduous
forest
Mixed
forest
Total
A1
Deforestation area
(1,000 ha)
303 82 129 514
Stem-volume
increment
(1,000 m3)
21,537 3,550 7,367 32,454
Accumulated stem
volume
(1,000 m3)
44,750 10,154 19,137 74,041
Decrease in carbon
stock (MtC)
17.3 6.9 10.2 34.6
A2
Deforestation area
(1,000 ha)
268 71 110 449
Stem-volume
increment
(1,000 m3)
19,073 3,076 6,288 28,437
Accumulated stem
volume
(1,000 m3)
39,630 8,798 16,335 64,763
Decrease in carbon
stock (MtC)
15.3 6.0 8.7 30.2
B1
Deforestation area
(1,000 ha)
287 72 122 481
Stem-volume
increment
(1,000 m3)
20,404 3,088 6,955 30,447
Accumulated stem
volume
(1,000 m3)
42,395 8,833 18,067 69,295
Decrease in carbon
stock (MtC)
16.5 6.1 9.7 32.2
B2
Deforestation area
(1,000 ha)
239 62 97 398
Stem-volume
increment
(1,000 m3)
16,955 2,678 5,498 25,131
Accumulated stem
volume
(1,000 m3)
35,228 7,660 14,282 57,170
Decrease in carbon
stock (MtC)
13.8 5.3 7.7 26.6
Landscape Ecol Eng
123

Future carbon-stock change
Predicted increases in biomass and carbon accumulation by
tree growth in forests are shown in Table 5. In all LUC
scenarios, coniferous forests accumulate a large amount of
carbon as a result of both tree growth and geographic
expansion. Deciduous forests are more effective in reducing
carbon; 337.0 MtC is predicted to accumulate in forest-land-
remaining-forest-land areas from 2005 to 2030 for the B2
scenario. The amount of accumulated carbon stocks by
afforestation over 25 years could be calculated as shown in
Table 6. Carbon stock by afforestation is largest in the B1
scenario due to land conversion. Carbon emissions resulting
from commercial cutting are greatest in A1. Coniferous
forest generally showed more carbon emission in total by
LUCs (Table 7). Scenario A1 showed the highest CO2
source in living biomass, i.e., branches and roots (Table 8).
Soil carbon reduction was the highest in scenario B2 and
lowest in scenario A1. Carbon uptake in soil is shown in
Table 9.
There were significant differences in carbon sequestra-
tion among the four scenarios. The dynamics of net carbon
uptake by forests follow carbon uptake through biomass
growth, and differences among scenarios were mainly the
Table 8 Accumulated decrease in branch and root carbon stocks
(2006–2030)
From To A1
(MtC)
A2
(MtC)
B1
(MtC)
B2
(MtC)
Coniferous
forest
Cropland 1.75 1.54 1.98 1.79
Grassland 0.90 0.81 0.32 0.47
Others 0.85 0.75 0.97 0.36
Deciduous
forest
Cropland 0.90 0.77 0.89 0.92
Grassland 0.56 0.53 0.20 0.33
Others 0.47 0.37 0.61 0.19
Mixed forest Cropland 1.03 0.88 1.22 1.05
Grassland 0.61 0.56 0.23 0.34
Others 0.58 0.45 0.64 0.22
Total 7.68 6.69 7.09 5.67
Table 9 Net change in soil
carbon stocks between 2005 and
2030
a soil carbon stock in 2005b soil carbon stock in 2030
Land Use Area (2005)
(1,000 ha)
Area (2030)
(1,000 ha)
Carbon stock
(2005)a (MtC)
Carbon stock
(2030)b (MtC)
Net change
(2030-2005)b-a (MtC)
A1 scenario
Paddy field 1,452 1,127 87.86 68.19 -19.67
Upland field 1,108 860 50.85 39.46 -11.39
Forest 6,215 6,517 422.01 442.48 20.47
Grassland 187 405 8.58 18.61 10.03
Others 1,062 1,115 12.21 12.82 0.61
Total 581.52 581.57 0.05
A2 scenario
Paddy field 1,452 1,127 87.86 68.19 -19.67
Upland field 1,108 860 50.85 39.46 -11.39
Forest 6,215 6,810 422.01 462.38 40.37
Grassland 187 292 8.58 13.39 4.81
Others 1,062 936 12.20 10.75 -1.45
Total 581.52 594.19 12.67
B1 senario
Paddy field 1,452 1,167 87.86 70.60 -17.25
Upland field 1,108 890 50.85 40.86 -9.98
Forest 6,215 6,916 422.01 469.57 47.55
Grassland 187 207 8.58 9.50 0.91
Others 1,062 844 12.21 9.70 -2.50
Total 581.53 600.25 18.72
B2 scenario
Paddy field 1,452 1,231 87.86 74.48 -13.38
Upland field 1,108 939 50.85 43.11 -7.74
Forest 6,215 6,962 422.01 472.71 50.70
Grassland 187 188 8.58 8.63 0.05
Others 1,062 704 12.20 8.09 -4.11
Total 581.52 607.03 25.51
Landscape Ecol Eng
123

result of the different amounts of biomass growth
(Table 10). In all scenarios, the amount of carbon increased
over that period; 11.6–42.2 MtC of carbon accumulation
will be reduced due to LUC.
In this study, results of carbon-stock change were
strongly influenced by the conversion rate of abandoned
agricultural areas to forest. This indicates that land-use
policy has the potential to exert a significant influence on
terrestrial carbon.
Discussion
Simulated present-day carbon stocks in soil and vegeta-
tion, as well as their temporal changes, are in reasonable
agreement with independent estimates based on the
extrapolation of soil surveys, forest inventories, and
modeling efforts (Zaehle et al. 2007). Terrestrial carbon
stock around the world sink 373 GtC in vegetation and
1,086 GtC in soil (Lal 2004). Forest ecosystems covering
about 4.1 billion hectares globally are a major reserve of
terrestrial carbon stock (Smith et al. 2008). Several studies
have estimated the carbon sequestration potential in Eur-
ope and other countries for various LUC scenarios. Smith
et al. (2005a, b) estimate future soil carbon changes of
pasture, cropland, and forest using LUC scenarios of
Rounsevell et al. (2005). For agricultural land, effects of
changes in climate and technology are assessed, whereas
for forest, the effect of changes in climate and litter input
are assessed. Zaehle et al. (2007) assess European terres-
trial carbon-stock change that results in changes in cli-
mate, net primary production (NPP), technology, and land
management. Schulp et al. (2008) assess only effect of
LUC on vegetation and soil carbon stock using Rounsevell
et al.’s (2005) LUC scenarios. Tavoni et al. (2007)
examine the role forestry may play in the context of
atmospheric CO2 stabilization in Organisation for Eco-
nomic Co-operation and Development (OECD) and non-
OECD countries.
Results of different studies on future carbon sequestra-
tion and LUC are hard to compare. Studies on the effect of
future LUC on carbon sequestration are different in
approach, time span, resolution, estimates of terrestrial
carbon balance, and scenario elaboration. A net sink of
12.4–14.1 MtC years-1 was found for South Korea
between 2005 and 2030 (Table 10). This sink is less than
that of 25.5–31.3 MtC years-1 assessed in the European
Union (EU) of 12 member states (EU12), and of 16.3–83.9
MtC years-1 in the EU of 15 member states (EU15)
(Table 11). Several factors can account for potential dif-
ferences in carbon sequestration. On average, European
forests annually sequester 1.24 tC ha-1 from the atmo-
sphere (Janssens et al. 2005). On the other hand, South
Korean forests annually sequester 2.32 tC ha-1 (KFRI
2006). Obviously, countries with high forest cover tend to
have a higher forest carbon sink per unit of total land area
than countries with low forest cover (Janssens et al. 2005).
The mean biomass density method used in this study is
widely used to estimate regional-, national-, and global-
scale forest biomass (Guo et al. 2010). Linear growth curve
is used for tree growth by vegetation type. In reality, this
could lead to underestimating young and overestimating
old forests (Fang et al. 2005). Nevertheless, some studies
found no significant difference in relationships across for-
est age classes for mixed forest types (Guo et al. 2010).
European studies [e.g., Smith et al. (2005a, b); Zaehle et al.
2007; Schulp et al. 2008] assumed that carbon losses are
estimated by multiplying carbon stocks with specific
Table 10 Accumulated carbon-stock change in the four scenarios (2006–2030)
A1 2030 (MtC) A2 2030 (MtC) B1 2030 (MtC) B2 2030 (MtC)
Vegetation Stem-volume increment 330.3 334.0 332.2 337.0
Afforestation � 22.4 28.7 32.2 26.5
Deforestation ` -34.6 -30.1 -32.5 -31.5
Litter ´ -7.6 -6.6 -7.1 -5.6
Soil Soil carbon stock ˆ 0.05 12.6 18.7 25.5
Direct carbon loss due to LUC (` ? ´ ?ˆ ) -42.2 -24.2 -20.9 -11.6
Net change of carbon stock due to LUC (� ? ` ? ´ ?ˆ ) -19.8 4.5 11.3 14.9
Total accumulated carbon stock 310.4 338.5 343.5 351.9
Average annual increment in carbon stock 12.4 13.5 13.7 14.1
Table 11 Carbon sequestration between 2005 and 2030 (MtC
years-1) in the four scenarios (recalculated from Zaehle et al. 2007;
Schulp et al. 2008)
Scenario A1 A2 B1 B2
Schulp et al. (2008) (EU15) 79.1 61.7 83.9 80.3
Schulp et al. (2008) (EU12) 25.5 28.8 27.6 31.3
Zaehle et al. (2007) (EU15) 34.6 37.1 21.2 16.3
This study (South Korea) 12.4 13.5 13.7 14.1
Landscape Ecol Eng
123

decomposition rates. Carbon emissions from croplands
are demonstrated to depend on the soil carbon content
(Bellamy et al. 2005).
KFRI (2006) reports that South Korean forest uptake
was 9.1 MtC in 2001. Considering afforestation and refor-
estation, the differences in carbon sequestration between
2001 and 2030 is reliable. Tavoni et al. (2007) estimate 25
MtC years-1 of carbon sequester in South Korea, South
Africa, and Australia. Compared with this research, results
are considerably unreliable. However, differences are in
basic assumptions. Tavoni et al. (2007) consider managed
forest and afforestation result from LUC.
When comparing our study presented here with the 2001
IPCC report, which presents carbon emission changes by
LUC until 2030, the emission pattern for each scenario is
similar. According to the IPCC report, for the A1 scenario,
carbon emission will steadily increase until 2020 and in
2030 will be absorbed by LUCs. Carbon will also be
continuously absorbed in the B1 and B2 scenarios (IPCC
2001). According to results of our study, 19.8 MtC will be
passed in scenario A1 in 2030. In the A2, B1, and B2
scenarios, carbon accumulation will increase by 4.6–14.9
MtC. The characteristics shown in the IPCC report are
similar to the characteristics of this study (Fig. 8).
Several studies in the forestry literature have estimated
the sequestration potential for various given carbon prices,
and most seem to agree that forestry can provide a sig-
nificant share of abatement. As an example, it is worth
remembering that tropical deforestation is a major source
of GHG emissions, accounting for as much as 25 % of
global anthropogenic GHG emissions (Houghton et al.
1999). In our A1 scenario, South Korea will lose 19 million
dollars annually due to direct effects of LUCs but will gain
14 million dollars annually in scenario B2. The maximum
difference in athe value of carbon reduction in the four
scenarios is 33 million dollars/years in the EU carbon
market (Table 12). Taking into account social and eco-
nomic constraints, however, a smaller amount of carbon
sequestration will more likely occur.
Conclusion
In this study, naturally absorbed carbon accumulation
resulting from LUC is analyzed in order to set reduction
goals and devise a strategy for building a low-carbon
society in South Korea. This is one of the first assessments
of carbon-stock changes that fully accounts for the
dynamics of LUC in South Korea. Based on LUC projec-
tions, we anticipate carbon reduction levels of between
12.5 MtC and 14.1 MtC each year in soil and vegetation. In
fact, the A1 scenario predicts a reduction of 19.8 MtC
annually over 25 years. In the B2 scenario, an annual
reduction of 14.9 MtC is predicted. The B1 scenario seems
to be most in line with a future low-carbon society (LCS),
as it has the highest carbon reduction effect. The B1
Fig. 8 Global carbon dioxide
(CO2) emissions due to land-use
change (Intergovernmental
Panel on Climate Change 2001)
Table 12 Effect of land-use change (LUC) on carbon stock and
economic value
A1
(millions
of dollars/
year)
A2
(millions
of dollars/
year)
B1
(millions
of dollars/
year)
B2
(millions
of dollars/
year)
Direct effect of
LUC
-19 4 11 14
Net change of
carbon stock
due to LUC
269 289 291 304
Landscape Ecol Eng
123

scenario, which reduces areas of development, uses bio-
mass energy sources from agriculture and allows for the
use of solar, wind, and geothermal energy, which is
appropriate when compared with the A1 scenario repre-
senting socioeconomic development in the past. When it
comes to land-use policy, it is necessary to break out of
existing paradigms. Policy should be shifted from the
expansion of urban areas for stimulating economic growth
to the increase of available land through renewal of exist-
ing urban areas and increasing the efficient use of space.
This study demonstrates the importance of LUC as a major
factor affecting both carbon sources and sinks. The high
release of carbon associated with old-growth deforestation
and the potential for carbon sequestration associated with
cropland abandonment stress the importance of carefully
assessing future LUC.
Acknowledgments This research was supported by a grant (07High
Tech A01) from High tech Urban Development Program funded by
Ministry of Land, Transportation and Maritime Affairs of Korean
government.
References
Ahn S, Han K (2004) Feasibility Study for Estimating the Cost of
Carbon Sink in Korea. Environment Institute, Korea
Alcamo J (2001) Scenarios as tools for international environmental
assessments. Environmental Issue Report No. 24, European
Environmental Agency, Copenhagen
Arrouays D, Deslais W, Badeau V (2001) The carbon content of
topsoil and its geographical distribution in France. Soil Use
Manag 17:7–13
Bellamy PH, Loveland PJ, Bradley RI, Lark RM, Kirk GJD (2005)
Carbon losses from all soils across England and Wales
1978–003. Nature 437:245–248
Cho D (2008) Cellular automata based urban landuse change
modeling considering development density. J Korean Geogr
Soc 41(3):117–133
Fang S, Gertner GG, Sun Z, Anderson AA (2005) The impact of
interactions in spatial simulation of the dynamics of Urban
Sprawl. Landscape Urban Plan 73(4):294–306
Feddema JJ, Oleson KW, Bonan GB, Mearns LO, Buja LE, Meehl GA,
Washington WM (2005) The importance of land-cover change in
simulating future climates. Science 310(5754):1674–1678
Freibauer A, Rounsevell MDA, Smith P, Verhagen J (2004) Carbon
sequestration in the agricultural soils of Europe. Geoderma
122:1–23
Guo Z, Fang F, Pan Y, Birdsey R (2010) Inventory-based estimates of
forest biomass carbon stocks in China: a comparison of three
methods. For Ecol Manage 259(7):1225–1231
Houghton RA, Hackler JL, Lawrence KT (1999) The U.S. carbon
budget: Contributions from land-use change. Science 285(5427):
574–578
Intergovernmental Panel on Climate Change (1996) Revised IPCC
Guideline for National Greenhouse Gas Inventories
Intergovernmental Panel on Climate Change (2000) Land use, land-
use change and forestry, a special report of the IPCC. Cambridge
University Press
Intergovernmental Panel on Climate Change (2001) IPCC Special
Report on Emissions Scenarios, GRID-Arendal website
Intergovernmental Panel on Climate Change (2007) IPCC Fourth
Assessment Report: Climate Change
Janssens IA, Freibauer A, Schlamadinger B, Ceulemans R, Ciais P,
Dolman AJ, Heiman M, Nabuurs GJ, Smith P, Valentini R,
Schulze ED (2005) The Carbon Budget of Terrestrial Ecosys-
tems at Country Scale—a European Case Study. Biogeosciences
2:15–26
Jeong J, Kim C, Lee W (1998) Soil organic carbon content in forest
soils of Korea. J Forest Sci (in Korean) 57:178–183
Korea Forest Research Institute (1996) Korean people and Carbon
dioxide, 126
Korea Forest Research Institute (2006) Development of GHGs
Emission Inventory System for climate change convention
Lal R (2004) Soil Carbon Sequestration impacts on global climate
change and food security. Science 304:1623–1627
Lamlom SH, Savidge RA (2003) A reassessment of carbon content in
wood: variation within and between 41 North American species.
Biomass Bioenergy 25(4):381–388
Lee D, Park C (2009) The Analysis of Potential Reduction of CO2
Emission in Soil and Vegetation. J Korean Soc Environ Restor
Technol 12(2):95–105
Lee K, Son Y, Kim Y (2001) Greenhouse gas inventory in land-use
change and forestry in Korea. J Forest Energy 20(1):53–61
Lettens S, Jv Orshoven, Bv Wesemael, Muys B, Perrin D (2005) Soil
organic carbon changes in landscape units of Belgium between
1960 and 2000 with reference to 1990. Glob Change Biol
11:2128–2140
Parrotta JA (2002) Restoration and management of degraded tropical
forest landscapes. In: Ambasht RS, Ambasht NK (eds) Modern
trends in applied terrestrial ecology. Kluwer Academic/Plenum
Press, New York, pp 135–148
Rounsevell MDA, Ewert F, Reginster I, Leemans R, Carter TR (2005)
Future scenarios of European agricultural land use. II. Proj
Changes Cropland Grassland Agriculture Ecosystem Environ
107(12):117–135
Rounsevell MDA, Reginster I, Araujo MB, Carter TR, Dendoncker N,
Ewert F, House JI, Kankaanpaa S, Leemans R, Metzger MJ,
Schmit C, Smith P, Tuck GA (2006) Coherent set of future land
use change scenarios for Europe. Agriculture Ecosystem Environ
114(1):57–68
Schlamadinger B, Bird N, Johns T, Brown S, Canadell J, Ciccarese L,
Dutschke M, Fiedler J, Fischlin A, Fearnside P, Forner C,
Freibauer A, Frumhoff P, Hoehne N, Kirschbaum MUF, Labat A,
Marland Michaelowa A, Montanarella L, Moutinho P, Murdiyarso
D, Pena N, Pingoud K, Rakonczay Z, Rametsteiner E, Rock J, Sanz
MJ, Schneider UA, Shvidenko A, Skutsch M, Smith P, Somogyi Z,
Trines E, Ward M, Yamagata Y (2007) A synopsis of land use,
land-use change and forestry (LULUCF) under the Kyoto protocol
and marrakech accords. Environ Sci Policy 10(4):271–282
Schulp CJE, Nabuurs GJ, Verburg PH (2008) Future carbon
sequestration in Europe: effects of land use change. Agric
Ecosyst Environ 127(3–4):251–264
Smith JU, Smith P, Wattenbach M, Zaehle S, Hiederer R, Jones RJA,
Montanarella L, Rounsevell MDA, Reginster I, Ewert F (2005a)
Projected changes in mineral soil carbon of European croplands
and grasslands, 1990–2080. Glob Change Biol 11(12):2141–2152
Smith P, Smith JU, Wattenbach M, Meyer J, Lindner M, Zaehle S,
Hiederer R, Jones RJA, Montanarella L, Rounsevell MDA,
Reginster I, Kankaanpaa S (2005b) Projected changes in mineral
soil carbon of European forests, 1990–2100. Can J Soil Sci
86:159–169
Smith P, Fang C, Dawson JJC, Moncrieff JB (2008) Impact of global
warming on soil organic carbon. Adv Agron 97:1–43
Landscape Ecol Eng
123

Tavoni M, Sohngen B, Bosetti V (2007) Forestry and the carbon market
response to stabilize climate. Energy Policy 35:5346–5353
United Nations Framework Convention on Climate Change (2003)
Land use, Land-use change and forestry: definitions and
modalities for including afforestation and reforestation activities
under Article 12 of the Kyoto Protocol. Submissions from
Parties, FCCC/SBSTA/2003/MISC, Bonn
Verburg PH, Soepboer W, Veldkamp A, Limpiada R, Espaldon V,
Mastura SSA (2002) The spatial dynamics of regional land use:
the CLUE-S model. Environ Manage 30(3):391–405
Yim C, Choi D (2002) Predicting micro land use dynamics. A cellular
automata modelling Approach, Journal of the Korean planners
association 37(4):229–239
Zaehle S, Bondeau A, Carter T, Cramer W, Erhard M, Prentice I,
Reginster I, Rounsevell M, Sitch S, Smith B, Smith P, Sykes M
(2007) Projected changes in terrestrial carbon storage in Europe
under climate and land-use change, 1990–2100. Ecosystems
10(3):380–401
Landscape Ecol Eng
123