effects of lake oxygenation on mercury accumulation in zooplankton … · · 2011-04-20effects of...
TRANSCRIPT
Effects of Lake Oxygenation on Mercury Accumulation in
Zooplankton in Twin Lakes, Washington
By
BRANDON REED
A thesis submitted in partial fulfillment of the requirements for the degree of
MASTERS OF SCIENCE IN ENVIRONMENTAL ENGINEERING
WASHINGTON STATE UNIVERSITY Department of Civil and Environmental Engineering
MAY 2011

ii
To the Faculty of Washington State University:
The members of the Committee appointed to examine the thesis of BRANDON REED find it satisfactory and recommend that it be accepted.
___________________________________ Marc W. Beutel, Ph.D., Chair ___________________________________ Dave Yonge, Ph.D. ___________________________________ Richard Watts, Ph.D.
___________________________________ Barry Moore, Ph.D.

iii
ACKNOWLEDGEMENTS
This thesis would not have been possible without the expertise and support I received from many
of my colleagues. First off I would like to thank Dr. Marc Beutel for providing guidance, support
and belief in me. Also I would like to thank Dr. Barry Moore, Dr. Rick Watts, and Dr. David
Yonge for providing advice and sharing their wealth of knowledge in and out of the classroom.
Also, important recognition and thanks goes to the Confederated Tribes of the Colville Indian
Reservation and Dr. Ed Shallenberger and Ms. Sheri Sears. The tribe funded much of this project
and I acknowledge that the data, which was collected on the Colville Reservation, is the property
of the Tribe and will be treated accordingly. Special thanks Stephen Dent for sharing his passion
for research with me, without his tireless efforts in the lab none of this would be possible.
Thanks also goes to the Natural Resource Science Group, including Brian Lanouette, Ellen
Preece, Sandra Mead, Ben Cross, and Amy Martin, for sharing data, and more importantly being
great people to work in the field. Thanks to my Civil Engineering colleagues, Seyoum
Gebremariam, Lanka Desilva, Piper Marshall, Suzanne Cox, and Ricardi Duvil, for their support
and encouragement. Finally I’d like to thank my family, for their endless love and support, and
always being a phone call away.

iv
Effects of Lake Oxygenation on Mercury Accumulation in
Zooplankton in Twin Lakes, Washington
ABSTRACT by Brandon Reed, M.S.
Washington State University May 2011
Chair: Marc W. Beutel
Mercury is an important global pollutant due to its mobility in the environment, high
toxicity, and ability to bioaccumulate in aquatic food webs. This study examined total mercury
and methylmercury in water and in zooplankton at oxygenated North Twin Lake and non-
oxygenated South Twin Lake in 2009 and 2010. Hypolimnetic oxygenation is a lake treatment
strategy that was hypothesized to limit the amount of methylmercury in lake water and
subsequent uptake into zooplankton.
Water and zooplankton were collected using trace metal sampling and handling
techniques, and are analyzed for THg and MeHg with ultrasensitive DMA-80 and the MERX-M
autoanalyzers. In both 2009 and 2010, the hypolimnion of South Twin Lake was anoxic, while
the oxygenation of North Twin Lake maintained dissolved oxygen levels generally above 5
mg/L. In 2009 bottom waters of South Twin Lake accumulated MeHg up to 0.5 ng/L and MeHg
concentration was negatively correlated with dissolved oxygen concentration (ANOVA, p =
0.023). Hypolimnetic MeHg concentrations in North Twin were below 0.05 ng/L, likely as a
result of oxygenation. In contrast to water column results, THg and MeHg in zooplankton from
North Twin were consistently higher than in South Twin. Average zooplankton MeHg
concentrations in North Twin were 63.8 and 127.9 µg/kg in 2009 and 2010, while in South Twin

v
they were 46.0 and 40.3 µg/kg. Potential explanations behind these perplexing results included:
difference in pH and dissolved organic carbon, key water quality parameters known to control
mercury accumulation in zooplankton; biodilution in the form of both zooplankton density
dilution and bloom dilution; and enhancement of mercury uptake by zooplankton due to the
presence of metal oxides in the water column. The first two explanations were discounted based
on a review of lake water quality. The third explanation is thought to be the most plausible and
suggests that the presence of metal oxides is more important than the level of MeHg in the water
column in controlling mercury uptake into zooplankton. In addition, results suggest that to limit
mercury uptake into zooplankton, hypolimnetic oxygenation systems must inhibit the release of
metal oxides by maintaining a well-oxygenated sediment-water interface.

vi
TABLE OF CONTENTS
ACKNOWLEDGEMENTS ......................................................................................................................... iii
ABSTRACT ................................................................................................................................................. iv
1. INTRODUCTION .................................................................................................................................... 1
2. STUDY SITE ............................................................................................................................................ 6
3. METHODS ............................................................................................................................................. 14
3.1 Zooplankton Sample Collection and Mercury Analysis ................................................................... 14
3.2 Water Column Sampling and Mercury Analysis .............................................................................. 15
3.3 Other Water Quality Sampling and Analysis .................................................................................... 16
4. RESULTS ............................................................................................................................................... 18
4.1 Hypolimnetic Dissolved Oxygen Content ........................................................................................ 18
4.2 Hypolimnetic Mercury Content ........................................................................................................ 19
4.3 Zooplankton Mercury Content .......................................................................................................... 20
5. DISCUSSION ......................................................................................................................................... 28
5.1 Mercury Levels in Zooplankton ........................................................................................................ 28
5.2 Zooplankton Mercury Levels in North versus South Twin Lake...................................................... 29
5.3 Biodilution and Zooplankton Mercury Uptake ................................................................................. 32
5.4 Enhanced Uptake of Mercury due to Metal Oxides .......................................................................... 36
6. CONCLUSION ....................................................................................................................................... 46
7. REFERENCES ....................................................................................................................................... 48
8. ZOOPLANKTON MERCURY DATA APPENDIX ............................................................................. 54

vii
LIST OF FIGURES & TABLES
Figure 1.1. A simplified schematic of the mercury cycle in aquatic systems ...................... 5
Figure 2.1. Location of Twin Lakes Watershed ................................................................... 9
Figure 2.2. Bathymetric map of Twin Lakes ..................................................................... 10
Figure 2.3. Native inland redband trout in Twin Lakes ..................................................... 11
Figure 2.4. On-shore liquid oxygen tank ........................................................................... 12
Figure 2.5. Schematic of submerged oxygen diffuser line ................................................ 13
Figure 4.1. 2009 and 2010 Thermoclines .......................................................................... 21
Figure 4.2. 2009 hypolimnetic dissolved oxygen concentration ....................................... 22
Figure 4.3. 2009 hypolimnetic total mercury concentration .............................................. 23
Figure 4.4. 2009 hypolimnetic methylmercury concentration ........................................... 24
Table 1. Summary of mercury in zooplankton data ........................................................... 25
Figure 4.5. 2009 and 2010 total mercury in zooplankton .................................................. 26
Figure 4.6. 2009 and 2010 methylmercury in zooplankton ............................................... 27
Figure 5.1. 2010 large-body zooplankton density .............................................................. 40
Figure 5.2. 2010 phytoplankton density............................................................................. 41
Figure 5.3. 2009 and 2010 Secchi depth ............................................................................ 42
Figure 5.4. 2010 total mercury mass in zooplankton ......................................................... 43
Figure 5.5. 2010 methylmercury mass in zooplankton ...................................................... 44
Figure 5.6. 2009 iron and manganese profiles ................................................................... 45

viii

1
1. INTRODUCTION
Mercury pollution is a global health concern (Megler et al., 2007). Once emitted into the
atmosphere it can be transported anywhere on earth and deposited into remote and otherwise
pristine lakes. While there are natural releases of mercury from volcanic eruptions and
weathering of rocks containing mercury, the development and popularity of coal fired power
plants has led to the anthropogenic release of mercury into the atmosphere (Morel et al., 1998).
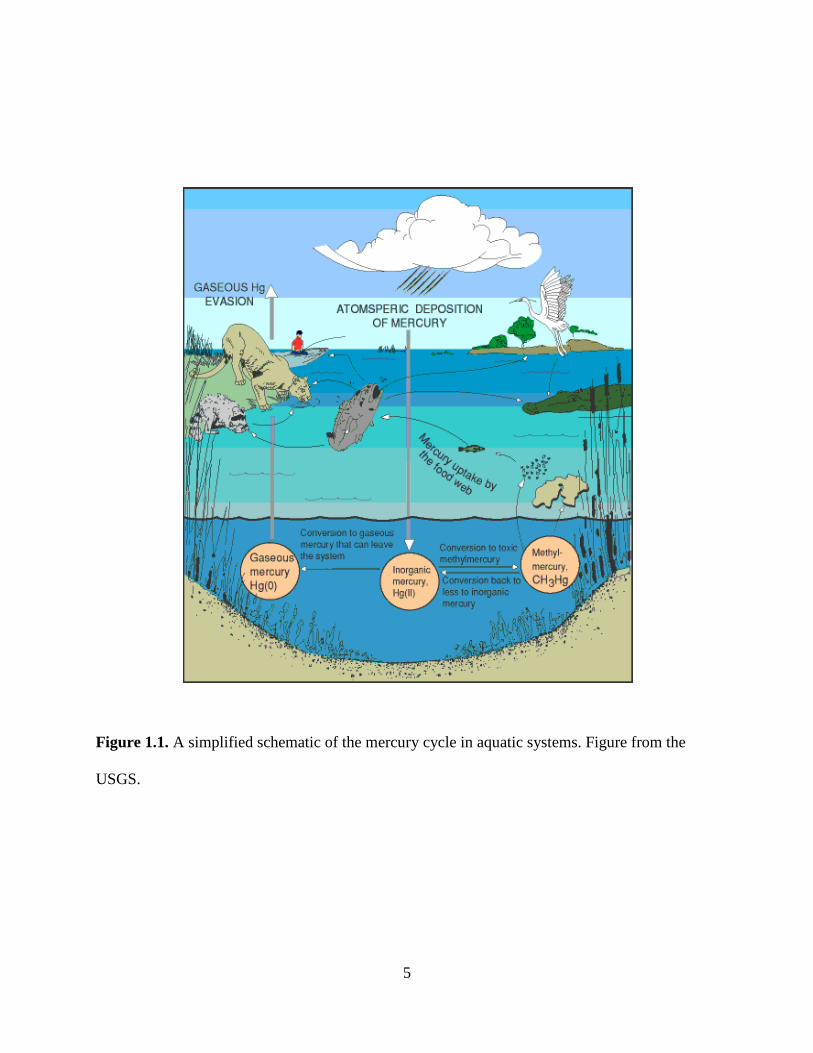
Almost all mercury in the atmosphere is in the elemental form Hg(0). When elemental
mercury dissolves into water droplets or sorbs onto dust particles, it can be oxidized then
deposited, primarily through wet deposition, in its inorganic ionic form Hg(II) (Fig. 1.1). The
deposited ionic mercury can be transformed to toxic methylmercury in the form CH3Hg+ by
anaerobic bacteria, most notably sulfate-reducing bacteria, in anoxic aquatic environments
(Benoit et al., 2003). Once produced, methylmercury is taken up by algae and other microscopic
biota, and then biomagnified up the aquatic food web with concentrations increasing in
successive trophic levels (water → algae → zooplankton → planktivores → piscivores) (Watras
et al., 1998).
Mercury concentrations in fish are prominently in the form of methylmercury and
typically account for over 95% of the total mercury (Morel et al., 1998). Biomagnification can
lead to high levels of mercury in fish, even in pristine ecosystems. In humans and wildlife that
eat contaminated fish, methylmercury is a potent neurotoxin that impairs reproduction and fetal
development (Megler et al., 2007). Currently, half of US states have statewide fish consumption
advisories with regards to mercury, and every state has at least one lake under advisory (USGS,

2
2009). Washington has a statewide fish consumption advisory in place for all lakes and rivers
(USEPA, 2004).
Methylmercury cycling in lakes is tied to dissolved oxygen levels in bottom waters. In a
recent review, Watras (2009) noted that anoxic hypolimnia can accumulate both ionic mercury
and methylmercury to levels much higher than those in surface waters, but accumulation is not
typically observed in oxic hypolimnia. The onset of anaerobic conditions enhances a range of
complex and interrelated processes that enhance methylmercury cycling (Watras, 2009). The
presence of sulfide in bottom waters can strip ionic mercury and methylmercury from settling
particulate matter, as well as surficial sediments, resulting in the buildup soluble mercury-sulfide
complexes in bottom waters, rather than their burial in the sediments. The reduction and
dissolution of iron and manganese oxides in sediments can also lead to the associated release of
bound dissolved organic carbon, to which ionic mercury and methylmercury are commonly
attached. Anaerobic conditions also support the activity of anaerobes like sulfate-reducing
bacteria that convert ionic mercury into methylmercury.
Zooplankton are key conduits of mercury into aquatic food webs. The use of zooplankton
as indicators of eco-toxicity is widespread because of their relatively short lifespan and their
position in the food chain (APHA, 1998). Zooplankton, which are typically filter feeders, take up
ionic and methylmercury both from the water column and through the consumption of
contaminated pray and particles (Watras et al., 1998). In contrast, consumption of contaminated
prey such as zooplankton is the primary pathway for mercury uptake in fish (Hall et al., 1997).
Large bodied zooplankton such as daphnia can make up a large fraction of diet of pelagic fish
such as trout (Christensen and Moore, 2008). A handful of studies have linked hypolimnetic
accumulation of MeHg with uptake into the aquatic food chain (Herrin et al., 1998; Slotton et al.,

3
1995). For example, Slotton et al. (1995) found that mercury levels in zooplankton in a small
northern California reservoir impacted by historical mercury mining showed a seasonal increase
in fall. They concluded that autumn mixing of anaerobic methylmercury-rich bottom waters into
the lake enhanced mercury uptake into the aquatic food web. While aquatic food webs are very
complex, the conventional wisdom regarding mercury uptake into these food webs is captured in
the following quote by Morel et al. (1998): “the key factor determining the concentration of
mercury in the biota is the methylmercury concentration in the water."
Twin Lakes, the focus of this study, are located in northeastern Washington on the
Colville Indian Reservation. The lakes provide a vital fishery, as well as a tourist attraction that
provides an important source of income to the tribe. It is important to note that tribal populations
tend to eat fish and wildlife from their reservations, resulting in high risk of human exposure to
mercury. Levels of mercury in American Indian populations can be six times higher than the
general population, and diet (e.g., contaminated fish) is typically a key exposure pathway (Xue et
al., 2010). Trout in Twin Lakes have experienced high levels of disease and limited growth due
to poor summertime habitat. During the summer, the oxygen rich surface waters are too warm
for cold water fish, and the deep cold waters do not contain enough dissolved oxygen for trout.
To expand and improve habitat for trout, an oxygenation system was installed in North Twin
Lake and operated in 2009 and 2010. Twin Lakes offer a unique scientific opportunity to
compare the effects of oxygenation on fish habitat, health and water quality. Since only North
Twin was oxygenated in 2009 and 2010, its sister lake South Twin was monitored as an
anaerobic “reference” lake.
The objective of this research was to evaluate the effects of lake oxygenation on the
uptake of mercury into the aquatic food web. This was done by quantifying total and

4
methylmercury in zooplankton in Twin Lakes during the first two years of oxygenation, 2009
and 2010. The original working hypothesis was that hypolimnetic oxygenation would result in
lower mercury concentrations in zooplankton in North Twin Lake relative to South Twin Lake.
This is based on the assumption that cycling of methylmercury is a function of the
aerobic/anaerobic states of the sediment water interface. High oxygen should inhibit release of
methylmercury which should result in less mercury in zooplankton. However, we found that
methylmercury dropped dramatically, but mercury in zooplankton was higher in oxygenated
North Twin compared to the anaerobic reference lake, South Twin. This thesis includes a
discussion of two possible mechanisms for this observation, biodilution and metals-enhanced
uptake. Our results point to the complexity of mercury cycling in lake ecosystems and the need
for continued study to better elucidate these factors.
5
Figure 1.1. A simplified schematic of the mercury cycle in aquatic systems. Figure from the
USGS.

6
2. STUDY SITE
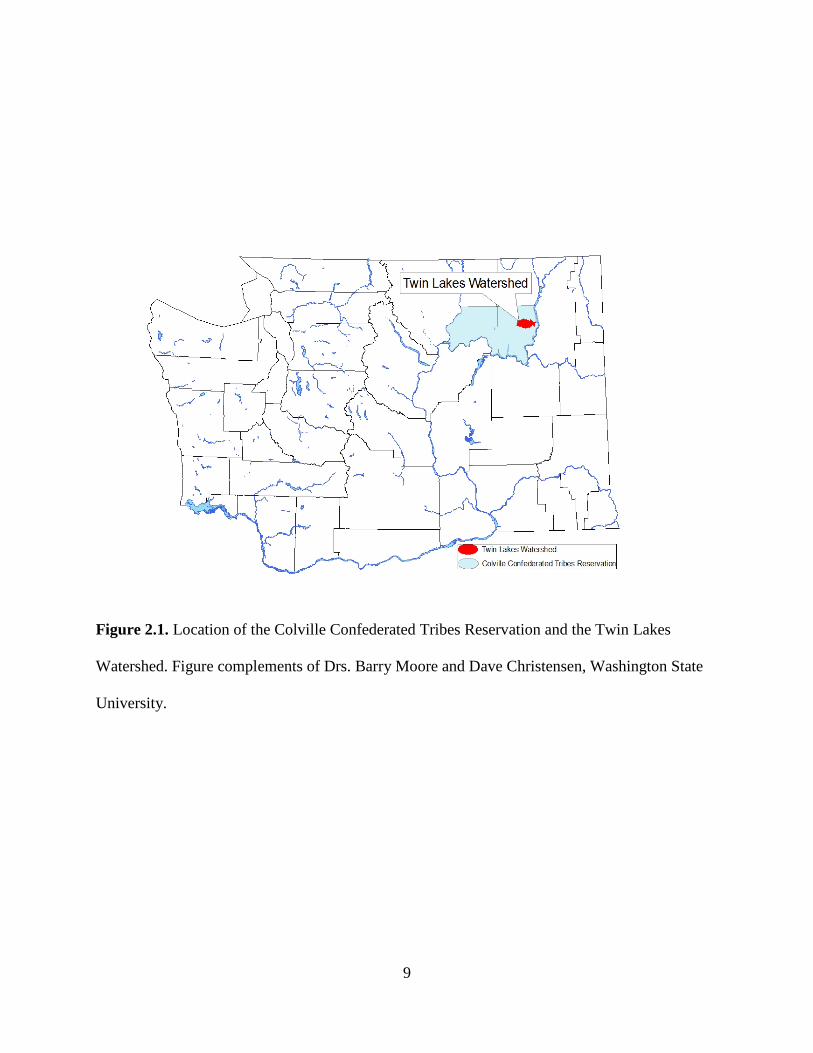
North and South Twin Lakes are located on the Colville Indian Reservation near
Inchelium, Washington (Fig. 2.1). The Confederated Tribes of the Colville Indian Reservation
include nearly 10,000 descendants from 12 aboriginal tribes in northeastern Washington State
(Confederated Tribes of the Colville Reservation, 2000). The Reservation was established in
1872, and today encompasses over 1.4 million acres (2,100 square miles), rich in timber,
wildlife, fish, and water resources. The tribe has an intense cultural connection to their water and
land, and wild game and fish are important sources of food for many tribal members.
The lakes are especially prized for recreational and fishing opportunities. These lakes are
the only reservation waters open to non-tribal members, and are economically important to the
region. The dimictic, mesotrophic lakes are similar in size with a mean depth around 10 m, a
maximum depth around 15 m, and a surface area around 400 ha (Fig. 2.2). As with many lakes
throughout the country, the Twin Lakes fish communities have been dramatically altered due to
human activity. The lakes once supported populations of native inland redband trout
(Onchorhynchus mykiss gairdneri) (Fig. 2.3). The fish community is now dominated by non-
native species including Eastern brook trout (Salvilinus fontinalis), largemouth bass
(Micropterus salmoides), and the non-game golden shiners (Notemigonus crysoleucas). The
lakes have remained a popular fishing destination for both trout and bass, but public perception is
that the trout fishery has been declining in recent decades.
Extensive field studies by Christensen and Moore (2007, 2008, 2009, and 2010) showed
that the classic temperature-dissolved oxygen “squeeze” was dramatically and negatively
impacting trout health. In both lakes, stable thermal stratification typically begins by late April or

7
early May and persists through the summer into September or October. With thermal
stratification and increasing water temperatures, hypolimnetic oxygen demand results in rapid
development of anoxia at the sediment-water interface. Anoxia continues to ascend in the water
column, so that by late July, the entire hypolimnion is devoid of oxygen. These conditions lead
to greatly reduced summer habitat availability. The summer epilimnion is too warm, and cold-
water refuge afforded by the hypolimnion becomes inaccessible due to lack of oxygen, forcing
trout to live within the metalimnion. Stocked rainbow and brook trout health declines throughout
the summer and rainbow trout caught in Twin Lakes often display infestations of parasitic
copepods, likely a result of stress and overcrowding. Estimates suggest that total mortality of
stocked trout in recent years exceeds 90%.
Hypolimnetic oxygenation is the use of engineered systems to enhance dissolved oxygen
levels in bottom waters of lakes and reservoirs using pure oxygen gas without disrupting
stratification (Beutel and Horne, 1999). The technology has been installed in a number of lakes
and reservoirs to improve water quality and enhance fish habitat. In the fall of 2008, a
hypolimnetic oxygenation system was installed in North Twin Lake to improve summertime
trout habitat. The system in North Twin Lake was operated during the summer and fall of 2009
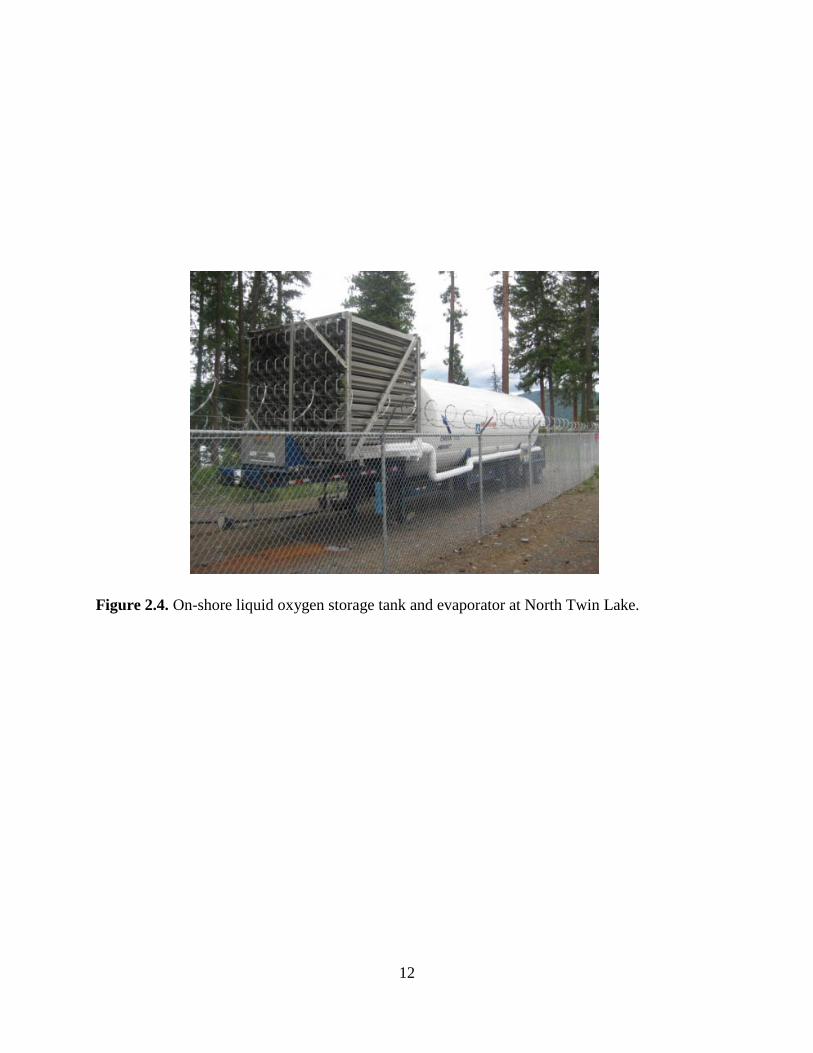
and 2010 during which this study was conducted. The oxygenation system consisted of a 6,000
gallon temporary on-shore liquid oxygen storage tank and evaporator (Fig. 2.4) connected to
2,500 feet of submerged line diffuser located at the bottom of the lake. The ultimate system
capacity, which accounted for diffuser induced oxygen demand, recovery from unanticipated
shutdown, diffuse oxygen transfer efficiency, and an additional safety factor, was 80 standard
cubic feet per minute or 4.3 metric tons per day.

8
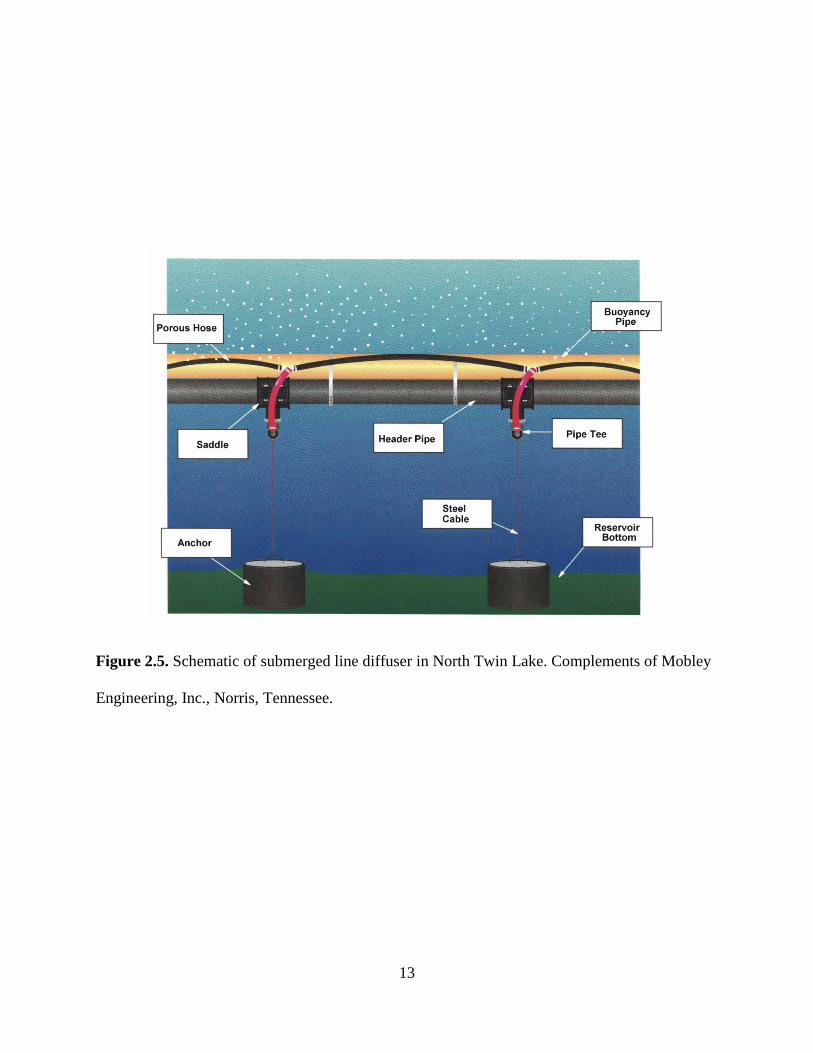
The line diffuser is a simple design that spreads fine bubbles over a large area (Mobley
and Brock, 1996). The system uses long lines of flexible porous hose connected to a high density
polyethylene supply pipe that distributes the gas along the length of the diffuser (Fig. 2.5). Flow
control orifices regulate the oxygen flow to independent lengths of porous hose to maintain a
continuous flow of fine pure oxygen bubbles along the full length of the diffuser. A second
buoyancy pipe can support the entire weight of the diffuser system when filled with air, thereby
bringing the entire system to the surface for maintenance as needed. Concrete anchors are
attached to the diffuser piping with stainless steel cable and saddle connections. The line diffuser
has proven to be an economical diffuser design that transfers oxygen efficiently, minimizes
temperature destratification, and minimizes sediment disruption.
9
Figure 2.1. Location of the Colville Confederated Tribes Reservation and the Twin Lakes
Watershed. Figure complements of Drs. Barry Moore and Dave Christensen, Washington State
University.

10
Figure 2.2. Bathymetric map of Twin Lakes showing the location of the oxygen line diffuser and
liquid oxygen (LOX) storage tank in North Twin Lake. Sampling sites are shown with a dark
circle. Depth contours are in meters. Modified from figure provided by Drs. Barry Moore and
Dave Christensen, Washington State University.
LOX Storage Tank
Line Diffuser

11
Figure 2.3. The native inland redband trout (Onchorhynchus mykiss gairdneri) from Twin
Lakes, Washington. Photo compliments of the Colville Indian Tribe's Department of Fish and
Wildlife.
12
Figure 2.4. On-shore liquid oxygen storage tank and evaporator at North Twin Lake.
13
Figure 2.5. Schematic of submerged line diffuser in North Twin Lake. Complements of Mobley
Engineering, Inc., Norris, Tennessee.

14
3. METHODS
3.1 Zooplankton Sample Collection and Mercury Analysis
Zooplankton were collected every three to four weeks from May through October in 2009
and 2010 at stations located in the deepest area of each lake (Fig. 2.2). Samples consisted of
multiple full vertical tows with a 0.29-m-diameter non-metallic zooplankton net with a 73-
micron mesh connected to a 250-µm-mesh dolphin bucket. The zooplankton were concentrated
into acid washed glassware and stored in the dark in a chilled in a cooler. Approximately 4 to 6
tows per lake were performed during monitoring in 2009, however there was insufficient
material for complete mercury analysis on some sampling dates. In the 2010 sampling season, 15
tows per lake were performed to ensure sufficient biomass for mercury analysis. Zooplankton
were filtered and rinsed into size fractions (>1000 µm, >500 µm, >250 µm) in the laboratory
using acid rinsed non-metallic simple sink sieves. Zooplankton greater than 1,000 µm were
considered large-bodied zooplankton and were the primary focus of this study since they are a
primary food source for planktivorous trout in Twin Lakes (Christensen and Moore, 2008, 2009).
After separation, zooplankton were freeze dried and stored in a freezer for later mercury analysis.
Zooplankton total mercury (THg) samples were analyzed using a Direct Mercury
Analyzer 80 (DMA-80), following EPA method 7473 (Mercury in solids and solutions by
thermal decomposition, amalgamation and atomic absorption spectrophotometer; USEPA, 2007).
The DMA-80 was calibrated using water-phase calibration standards ranging from 0.005 ng to
30 ng. Water-phase calibration standards were created by dilution of a mercury standard
reference sample from the National Institute of Standards and Technology. Samples were run in
triplicate, and additional samples were run if relative standard deviation was greater than 20%.

15
Values are presented as micrograms of mercury per kilogram dry weight of zooplankton (µg/kg).
Certified reference material MESS-3, a low mercury marine sediment from the National
Research Council of Canada (Ottawa, Ontario), was analyzed in tandem with each batch of
samples to ensure adequate recovery. THg recovery for the MESS-3 averaged 86.7% (n = 65).
Method blanks were also consistently run and blank THg levels averaged 0.06 ng (n = 87), which
was around 5% of the mercury mass detected in a typical zooplankton sample. The detection
limit for the DMA-80 is 0.002 ng.
For methylmercury (MeHg) analysis, zooplankton were first crushed into a powder using
a mortar and pestle, and then digested in five mL of 5 M nitric acid at 65 °C for 8 hours (USGS,
2010). The digestate was analyzed with a Brooks Rand “MERX” Automated Methylmercury
Analyzer following EPA method 1630 (Analysis of methylmercury in biological samples by cold
vapor atomic fluorescence detection; USEPA, 2001). Values are presented as micrograms of
MeHg per kilogram dry weight of zooplankton (µg/kg). The detection limit for MeHg was 0.002
ng/L. Standard quality control procedures for MeHg included duplicates (< 25% relative percent
difference), matrix spikes (77-125% recovery), and method blanks. Certified reference material
TORT-2, lobster biomass from the National Research Council of Canada (Ottawa, Ontario), was
digested and analyzed in tandem with each batch of samples to ensure adequate ongoing
recovery.
3.2 Water Column Sampling and Mercury Analysis
Methods are briefly presented here, more detailed methods will be presented in Dent,
(2011). Water samples were collected every 3 to 4 weeks from around May through October in
2009 and 2010 at central deep stations in each lake. Samples were collected every two meters
16
with a Teflon sampler following the EPA clean hand dirty hand Technique to avoid sample
contamination (USEPA, 1996). Sample bottles were acid washed and had Teflon lined caps.
Great care was taken while retrieving, storing and transporting to maintain integrity of samples
for trace mercury analysis. Samples were stored in the dark and chilled with sealed ice containers
during transport. THg samples were preserved within 12 hours with 1% bromine monochloride
(BrCl) and MeHg samples were preserved with 0.5% hydrochloric acid and stored at 4 °C.
MeHg samples were shielded from photodegredation by UV light by storage in amber bottles.
THg in water samples were analyzed using a Brooks Rand MERX-T mercury auto
analyzer based on EPA method 1631, cold vapor atomic fluorescence spectroscopy (CVAFS)
(USEPA, 2002). MeHg water samples were analyzed using EPA Method 1630 as noted above.
3.3 Other Water Quality Sampling and Analysis
A range of supporting limnological measurements were performed concurrent with
mercury sampling (Clegg et al., 2009, and Lanouette, 2010). Data presented here is preliminary
in nature and based on an initial development of the raw data, particularly for zooplankton and
phytoplankton densities. Methods for some key analyses are briefly described here. Temperature,
pH, conductivity were measured at 1 meter intervals using a MS5 Sonde Hydrolab (Hach Corp.,
2008). For zooplankton enumeration, 2 replicate samples of vertical tows each were collected,
and preserved with formaldehyde. In the lab a 1-mL subsample is drawn from the sample, and
added to a Sedgwick-Rafter counting cell. Zooplankton are counted using a microscope, and this
process is performed in duplicate for each sample and averaged together. Zooplankton counts
were then extrapolated over the volume of the tow to get density of zooplankton per cubic meter
using this formula:

17
Algae counts were also performed. Samples were collected by pumping at top, middle
and bottom depths using tubing attached to a marine utility pump. Samples were preserved with
gluteraldehyde. A 1-mL subsample was drawn from the preserved sample and counted with a
microscope on a Sedgwick-Rafter counting cell. Results were reported as biovolume per volume
of water in units of µm3/mL.
For this effort, iron and manganese were analyzed using inductively coupled plasma mass
spectrometry (ICP-MS) at the WSU School of Earth and Environmental Sciences Laboratory
(APHA, 1998). Detection limits were on the order of 50 µg/L for iron and 0.1 µg/L for
manganese. Duplicate analyses were performed on every tenth sample. Percent relative standard
deviation on duplicate samples averaged around 2% for both manganese and iron.
18
4. RESULTS
4.1 Hypolimnetic Dissolved Oxygen Content
Oxygenation had a significant impact on DO content in North Twin Lake. Volume-
weighted hypolimnetic DO concentrations in North and South Twin lakes were calculated by
multiplying discrete concentrations at one-meter intervals by the total volume for each interval,
summing those values, then dividing the sum by the hypolimnetic volume, which was found
using thermocline depths (Fig. 4.1, Fig. 4.2). North Twin had significantly higher hypolimnetic
DO concentration than those in South Twin over the course of the 2009 and 2010 sampling
season (paired two sample t-test for means, p = 0.0012). Peak DO uptake rate early the season in
the South Twin hypolimnion was around 0.05 mg/L/day in 2009 and 0.1 mg/L/day in 2010.
Beginning in July 2009 the entire hypolimnion of South Twin Lake was hypoxic (less than 4
mg/) around September the hypolimnion was primarily anoxic (less than 1 mg/L).
Volume-weighted hypolimnetic DO concentration in North Twin showed a slight
increase in 2009 and a slow decrease in 2010 at a rate of around 0.03 mg/L/day. The lowest
volume-weighted hypolimnetic DO concentrations in North Twin were 7.4 mg/L in August 2009
and 5.3 mg/L in September 2010. The low DO in 2009, which includes a dramatic dip in DO
from early to late August, was the result of a short-term experimental decrease in oxygen
delivery to the lake in mid August. While oxygenation in North Twin in 2009 and 2010 led to a
well-oxygenated water column, as indicated by elevated volume-weighted hypolimnetic DO
concentrations throughout the stratified season, DO concentrations near the sediment-water
interface experienced anoxic conditions (Lanouette, 2011). North Twin had two recordings of
19
sediment-water hypoxia in 2009, including in August when the oxygenation system was turned
down, and four recordings of sediment-water hypoxia in 2010.
4.2 Hypolimnetic Mercury Content
Mercury data for hypolimnetic waters suggest that oxygenation had an effect on
decreasing mercury levels in the bottom waters of North Twin relative to South Twin. 2009
volume-weighted hypolimnetic THg concentration (Fig. 4.3) and MeHg concentration (Fig. 4.4)
were estimated in the same fashion as for DO. 2010 data was not available at the time of this
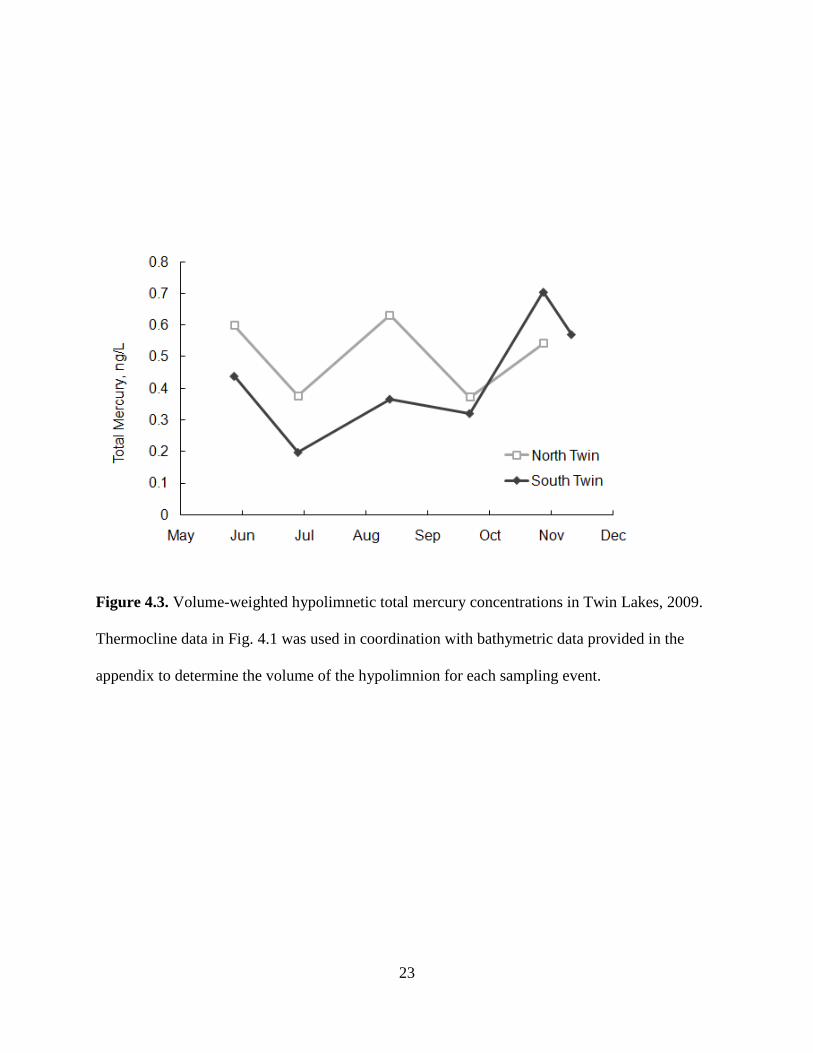
draft. Mean 2009 volume-weighted hypolimnetic THg concentrations in North and South Twin
were fairly similar at 0.50 ng/L and 0.43 ng/L, respectfully. The data sets were not statistically
significant using a paired two sample t-test for means (p ~ 0.2). However, if we look at the
temporal trend in THg from late June to late October, North Twin shows no accumulation while
South Twin shows an accumulation rate of around 0.12 ng/L/month.
2009 volume-weighted hypolimnetic MeHg concentrations in North and South Twin
showed a greater divergence than for THg, with mean MeHg levels of 0.033 ng/L and 0.063
ng/L, respectfully. Again, the data sets were not statistically significant using a paired two
sample t-test for means (p ~ 0.15). However, there is a dramatic difference in the temporal tends
in 2009 MeHg. Levels remained below 0.06 ng/L in North Twin. Levels in South Twin gradually
increased from July until the beginning of October, and then peaked to nearly 5 times the
seasonal average in late October at 0.2 ng/L. This was followed by a dramatic decrease in
November once the lake turned over. 2009 South Twin volume-weighted hypolimnetic MeHg
concentrations were significantly and negatively correlated with 2009 volume-weighted
hypolimnetic DO concentrations (ANOVA, p = 0.023), suggesting a linkage between these two
20
variables. THg to MeHg ratios, a surrogate for the relative importance of MeHg production in
aquatic systems (DiPasquale et al., 2003), was approximately 15 for North Twin and 7 for South
Twin, indicating the higher importance of MeHg production in North Twin. These multiple
observations suggest that hypolimnetic oxygenation was effective in repressing MeHg
accumulation in North Twin Lake.
4.3 Zooplankton Mercury Content
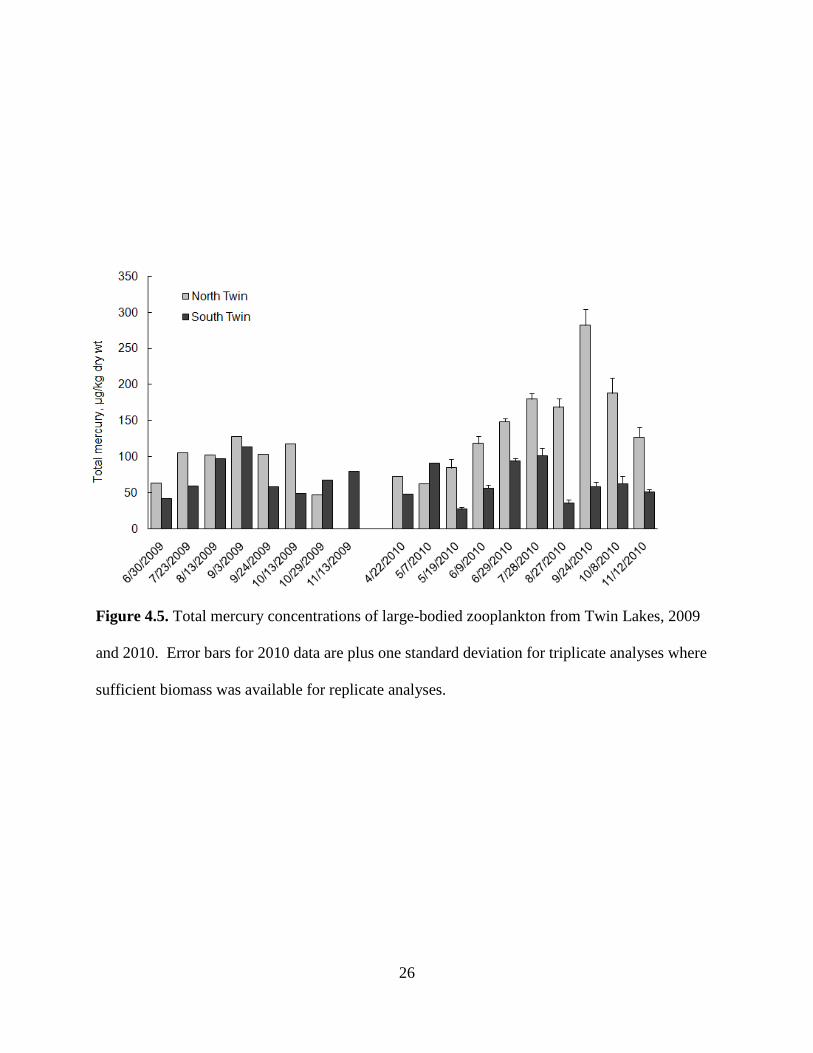
THg in North Twin zooplankton shows a clear trend of higher concentrations relative to
South Twin (Table 4.1, Fig. 4.5). 2009 THg zooplankton concentrations ranged from 46.7 to
127.4 µg/kg (mean of 95.1 µg/kg) in North Twin and from 41.9 to 113.9 µg/kg (mean of 70.9
µg/kg) in South Twin. Levels in North Twin in 2010 were 62.0 to 282.3 µg/kg (mean of 143.2
µg/kg), an approximate 50% increase compared to 2009. In contrast, South Twin experienced a
slight decrease in 2010, ranging from 27.2 to 101.3 µg/kg (mean of 62.5 µg/kg). A paired two
sample t-test for means for the 2009-2010 dataset confirms that North Twin zooplankton
concentrations were significantly higher than South Twin (p = 0.0012). A general seasonal trend
can be seen in both lakes with increasing concentrations early in the season followed by a drop
later in the season, though the reduction appears to occur earlier in South Twin.
MeHg concentrations in zooplankton were also higher in North Twin (Fig. 4.6). 2009 and
2010 mean concentrations in North Twin were 63.8 and 127.9 µg/kg. Values for South Twin
were 46.0 and 40.3 µg/kg. Note that the 2009 dataset was fairly limited (n = 3-4) due to limited
availability of biomass after the THg analysis. The 2010 dataset was more comprehensive (n =
7). The ratio of MeHg to THg ranged from 0.42 to 1.0 (mean of 0.73) for North Twin and from
0.30 to 0.87 (mean of 0.62) for South Twin. Based on the 2009-2010 dataset, MeHg

21
concentrations in zooplankton were significantly higher in North Twin (paired two sample t-test
for means; p = 0.006). The MeHg to THg ratio in the two lakes was nearly significantly different
(p = 0.084).
Figure 4.1. Thermocline depths for North and South Twin lakes, 2009 and 2010, a lack of a data
point indicates isothermic conditions.
0
2
4
6
8
10
12
14
Dep
th (m
)
North Twin
South Twin

22
Figure 4.2. Volume-weighted hypolimnetic dissolved oxygen concentration in Twin Lakes,
2009 and 2010. Thermocline data in Fig. 4.1 was used in coordination with bathymetric data
provided in the appendix to determine the volume of the hypolimnion for each sampling event.
23
Figure 4.3. Volume-weighted hypolimnetic total mercury concentrations in Twin Lakes, 2009.
Thermocline data in Fig. 4.1 was used in coordination with bathymetric data provided in the
appendix to determine the volume of the hypolimnion for each sampling event.

24
Figure 4.4. Volume-weighted hypolimnetic methylmercury concentrations in Twin Lakes, 2009.
Thermocline data in Fig. 4.1 was used in coordination with bathymetric data provided in the
appendix to determine the volume of the hypolimnion for each sampling event.

25
Table 1. Summary of mercury burdens in zooplankton in North and South Twin lakes, 2009 and 2010. THg, and MeHg, are determined using DMA-80 and MERX-M respectively and units are µg of mercury per kg of dry weight
North Twin Lake South Twin Lake Date THg,
µg/kg MeHg, µg /kg MeHg:THg
THg, µg/kg
MeHg, µg /kg
MeHg:THg
6/30/2009 63.5 41.9 7/23/2009 105.4 59.5 8/13/2009 102.2 97.5 9/3/2009 127.4 113.9 9/24/2009 103.4 69.5 0.67 58.0 10/13/2009 117.2 78.2 0.67 49.2 22.3 0.45 10/29/2009 46.7 43.8 0.94 67.5 38.5 0.57 11/13/2009 79.4 64.6 0.81 12/9/2009 58.7 2009 Average 95.1 63.8 0.76 70.9 46.0 0.61
4/22/2010 73.0 47.8 5/7/2010 62.0 27.1 0.44 90.6 26.7 0.29 5/19/2010 84.4 35.7 0.42 27.2 19.5 0.72 6/9/2010 118.3 56.5 6/29/2010 148.6 118.3 0.80 93.8 56.2 0.60 7/28/2010 179.8 175.0 0.97 101.3 68.8 0.68 8/11/2010 174.4 43.7 8/27/2010 168.6 174.0 1.03 35.3 30.5 0.86 9/24/2010 282.3 190.6 0.68 58.5 36.7 0.63 10/8/2010 188.0 62.6 11/12/2010 127.3 51.0 2010 Average 143.2 127.9 0.72 62.5 40.3 0.63
26
Figure 4.5. Total mercury concentrations of large-bodied zooplankton from Twin Lakes, 2009
and 2010. Error bars for 2010 data are plus one standard deviation for triplicate analyses where
sufficient biomass was available for replicate analyses.

27
Figure 4.6. Methylmercury concentrations of large-bodied zooplankton from Twin Lakes, 2009
and 2010. There is limited data for 2009 due to a lack of sufficient zooplankton biomass for both
THg and MeHg analyses.
28
5. DISCUSSION
5.1 Mercury Levels in Zooplankton
THg levels measured in zooplankton in 2009 and 2010 ranged from 47 to 282 µg/kg for
North Twin and 27 to 114 µg/kg for South Twin, and are similar to values reported in the
literature. Chen et al. (2000) studied 20 lakes in the Northeast US and reported THg ranges in
zooplankton of 28 to over 7,000 µg/kg dry weight. In a comprehensive study of 20 Wisconsin
lakes, THg in zooplankton ranged from 33 to 206 µg/kg dry weight (Watras et al. 1998).
Zooplankton MeHg concentrations ranged from 36 to 196 µg/kg in North Twin and 19 to
69 µg/kg in South Twin. These levels were also very similar to those reported by Watras et al.
(1998) of 60 to 161 µg/kg. MeHg is the primary form of mercury to bioaccumulate in biota
because of its ability to efficiently transfer and be retained up the food chain (Watras, 2009).
This is reflected in our results. The average percentage of MeHg in THg zooplankton body
burden for North Twin was 75% in 2009 and 73% in 2010. Values in South Twin were 61% and
63%, respectively. Again, these values were similar to the 57% average for 20 lakes studied in
Watras et al. (1998).
Watras (1992) introduced the simple concept of a mercury bioconcentration factor (BF)
to quantify the relationship between how much of mercury is in biota versus how much is in the
water. The formula is where Cb (µg/kg wet weight) is mercury concentration in
the biota and Cw (µg/kg) is the mercury concentration in water. BF values were calculated for
2009 using mean THg and MeHg concentrations in zooplankton and hypolimnetic waters. Dry
weight concentrations for zooplankton were converted to wet weight assuming 80% water
content (Watras, 1992). For THg, North Twin and South Twin had similar BFs of 4.58 and 4.54,

29
respectively. BFs for MeHg were higher and showed a considerable difference, 5.82 for North
Twin and 5.18 for South Twin. The higher BF for MeHg was expected since it has a greater
potential to bioaccumulate than total mercury. The difference between BF of MeHg between
North and South is strong evidence that there is an enhancement of the uptake of MeHg in North
Twin. BF values for zooplankton of a remote meso-oligiotrophic lake in Wisconsin were
approximately 4.8 and 6.0 for THg and MeHg, respectively (Watras 1992). These values are
similar to the values calculated for Twin Lakes, and exhibited the same trend of increased BF for
MeHg relative to THg. Watras et al. (1998) also presented BF values for MeHg for 15 Wisconsin
lakes. Values typically ranged from 5 to 6 and again were in close agreement with this study.
One interesting observations in this study, which I did not find previously documented in
the literature, was an apparent seasonal trend in the MeHg to THg ratio. In 2010 in both lakes the
ratio was relatively low in May (~0.4 in North Twin; 0.3-0.7 in South Twin) and then peaked in
late August (1.0 in North Twin; 0.87 in South Twin). The lower ratios in the spring may be
because thermal stratification and related anoxia in bottom waters, which should stimulate MeHg
production and accumulation in bottom waters and uptake into biota, has yet to occur.
5.2 Zooplankton Mercury Levels in North versus South Twin Lake
For a long time researchers have acknowledged the difference in mercury cycling in
eutrophic lakes with seasonally anaerobic bottom waters and oligotrophic lakes with oxic bottom
waters. In an early study somewhat similar to this one, Larson (1977) found substantial
differences in mercury uptake into fish in two nearby lakes in southwestern Oregon, eutrophic
Upper Squaw Lake and oligotrophic Big Squaw Lake. Both lakes exhibited summer thermal
stratification, but only Upper Squaw Lake exhibited hypolimnetic anoxia. On two sampling dates

30
THg levels in cutthroat trout were higher in Upper Squaw versus Big Squaw (April 1975, 0.205
versus 0.090 mg/kg, August 1975, 0.149 versus 0.049 mg/kg). This was the case even though the
fish from Upper Squaw were relative large, indicating they were older fish that had more time to
uptake mercury. The author attributed this difference to the fact that Upper Squaw exhibited
anoxia in bottom waters and that summertime trout habitat, like in Twin Lakes, was drastically
limited to a warm metalimnion, though no direct mechanism was proposed. In a general review
of mercury cycling in lakes Watras (2009) notes that anoxic bottom waters of eutrophic lakes
tend to accumulate mercury compared to the aerobic bottom waters of oligotrophic lakes. As
noted in the introduction, the mixing of MeHg-rich bottom waters into surface waters has been
implicated as an important mechanism that enhances the uptake of mercury into zooplankton
(Herrin et al., 1998; Slotton et al., 1995).
Based on monitoring related to this study, oxygenation repressed MeHg accumulation in
bottom waters of North Twin in 2009. In contrast, the bottom waters of South Twin accumulated
MeHg (Fig. 4.3). While water column mercury data for 2010 is not available, DO data shows
that levels in the bottom of North Twin in 2010 were high as a result of oxygenation. Thus it is
assumed that MeHg accumulation in North Twin was again repressed in 2010. In the Morel et al.
(1998) review of the chemical cycle and bioaccumulation of mercury, they state that “the key
factor for determining the concentration of mercury in the biota is the MeHg concentration in the
water”. So based on the conventional model of mercury uptake into aquatic biota, a drop in
MeHg in the water column should translate to a drop in levels in biota at the base of the food
web. But as demonstrated in the results, South Twin had higher concentrations in the water while
North Twin zooplankton had higher concentrations in both THg and MeHg, especially in 2010.

31
Two fundamental parameters that have been shown to affect mercury uptake into biota in
aquatic systems is dissolved organic carbon (DOC) and pH. DOC is a strong ligand for mercury
and other metals, acting as a competitor for mercury with methylating microbes (Watras, 2009).
Since DOC molecules are generally too large to cross cell membranes, higher DOC
concentrations are generally associated with lower MeHg concentrations (Ravichandran, 2004).
Once MeHg is formed, DOC facilitates MeHg solubility and transport through complexation,
making MeHg more soluble in the water column (Miskimmin, 1991). Monson (1998) evaluated
the effect of aquatic humus DOC on mercury concentrations in the zooplankton Daphnia magna.
While THg concentrations in zooplankton were positively correlated with DOC concentrations in
the study, MeHg concentrations were inversely correlated. So DOC appeared to depress MeHg
uptake. But the correlate between DOC and MeHg uptake in aquatic biota has been inconsistent
(Watras, 1998). Supporting this idea, a comprehensive study of 20 Northeastern lakes with a
wide range of water quality characteristics found that DOC did not significantly correlate with
mercury burdens in fish (Chen et al., 2000).
In addition to DOC, the relationship between pH and the aquatic mercury cycle has been
studied extensively. Chételat et al. (2010) statistically analyzed 52 mid-latitude lakes in North
America for a variety of different variables and their correlation with mercury in invertebrates;
pH was the only environmentally significant factor explaining variation (p<0.001). Supporting
this observation, a lake that was experimentally acidified from 6.1 to 4.7 had higher levels of
MeHg concentrations in water, phytoplankton and zooplankton (Watras, 1992). It is thought that
pH affects DOC’s ability to complex with mercury. At low pH a more negatively charged DOC
is less available to bind with mercury, and this may increase bacterial methylation rates
(Miskimmin et al., 1992).

32
While DOC and pH have been proven to affect MeHg uptake into zooplankton, large
amounts of uncertainty exists regarding their effect. From limited sampling events in this study,
mean DOC from North and South Twin for 2010 were 5.11 and 4.15 mg/L, respectively. This
compares to the Chen et al. (2000) dataset ranging from 2.9 to 12.6 mg/L. 2010 mean pH values
also exhibited the same similarity, 7.1 and 7.7 for North and South respectively. Note the lakes
are also in close proximity and share the same watershed. The likeness of the means of DOC and
pH suggest that these variables are not substantially controlling the dramatic differences
observed in mercury uptake into zooplankton in North and South Twin Lake. Below I explore
two other potential mechanisms that may explain these puzzling results, biodilution and
enhanced mercury uptake via metal oxide.
5.3 Biodilution and Zooplankton Mercury Uptake
Zooplankton are primarily filter feeders, and large bodied zooplankton such as Daphnia
are especially effective and efficient filter feeders (Dodds, 2002). Zooplankton filter and feed on
plankton, bacteria, organic matter, and other particles. Particles and water ingested by
zooplankton contain Hg and MeHg which are accumulated in the organisms. Kainz et al. (2002)
analyzed fatty acid biomarkers of zooplankton and found that they were composed of more than
60% algal fatty acids and less than 10% bacterial fatty acids. These percentages offer insight into
what zooplankton eat - primarily phytoplankton. While ingestion of mercury is the main pathway
for mercury accumulation in zooplankton, a number of recent studies described below present a
very interesting picture of the complexity of mercury uptake by zooplankton, and how it can be
affected by a range of factors including relative amounts of phytoplankton and zooplankton.
33
These dynamics may have some bearing on the observed patterns of mercury uptake in
zooplankton in Twin Lakes.
A potential reason why THg and MeHg concentrations are higher in North Twin relative
to South Twin is a phenomenon known as biodilution. Biodilution can be defined as higher
biomass concentration resulting in less mercury mass per unit mass of biomass. Three different
types of biodilution have been detailed in the literature: algal bloom dilution, zooplankton
density dilution, and growth dilution (Chen and Folt, 2005, Watras, 2009). A negative correlation
between phytoplankton density and zooplankton mercury concentration is known as bloom
dilution, while a negative correlation between zooplankton density and mercury concentration of
zooplankton is defined as zooplankton density dilution. Growth dilution is the concept of growth
rates exceeding the rate of mercury uptake.
There have been multiple studies on the effect of eutrophication and associated increases
in phytoplankton density on the assimilation of mercury in freshwater food webs (Chen et al.,
2000; Kainz and Mazumder, 2005; Pickhardt et al., 2002). Pickhardt et al. (2005) looked at the
effects of phytoplankton density on mercury accumulation in zooplankton in 12 artificially
fertilized mesocosms. As the phytoplankton density increased with the addition of nitrogen and
phosphorus, mercury accumulation as measured by mercury mass per mass of zooplankton
decreased significantly. THg and MeHg concentrations in zooplankton from the mesocosm with
the lowest nutrient concentration were around four times higher than in zooplankton from the
mesocosm with the highest nutrient concentration. Chen et al. (2000) looked at data from 38
Northeastern lakes and found both bloom dilution and zooplankton density dilution. In the
dataset of lakes, they found a negative correlation between algal density and THg and MeHg

34
concentrations in zooplankton. They also found that with an increase in large-body zooplankton
there was a reduction in mercury burden in zooplankton and ultimately in fish.
Another concept affecting mercury accumulation rates in biota is growth dilution.
Organisms in the presence of an overabundance of nutrients can grow faster than they
accumulate mercury, thus lessening the mercury burden (Sunda and Huntsman, 1998). A nutrient
pulse or a sudden change causing rapid growth can elicit lower mercury concentrations in biota.
Another aspect of growth dilution is the effect of food quality. Karimi et al. (2006) fed high
quality algae (C:P ratio ~130) and low quality algae (C:P ~1,300) spiked with MeHg to
zooplankton. They determined that zooplankton fed the high quality algae grew approximately
3.5 times faster than the lower quality algae, and as a result had lower mercury burdens attributed
to them.
To evaluate the possibility that biodilution accounted for the relatively lower mercury
concentrations in South Twin Lake zooplankton, I looked at several different data sets of
environmental variables for Twin Lakes. One possibility was that zooplankton density dilution in
South Twin resulted in lower mercury burden in zooplankton. In order for this to occur,
zooplankton populations in South Twin would need to be higher than North Twin, but this is not
the case (Fig. 5.1). Both magnitude (generally 2,000-8,000 #/m3) and seasonal pattern (peak
density in June) of zooplankton density in 2010 appeared similar. A paired t-test for means
confirmed that the difference between the two data sets were not statistically significant. To
assess the potential for of algal bloom dilution, two metrics were evaluated including
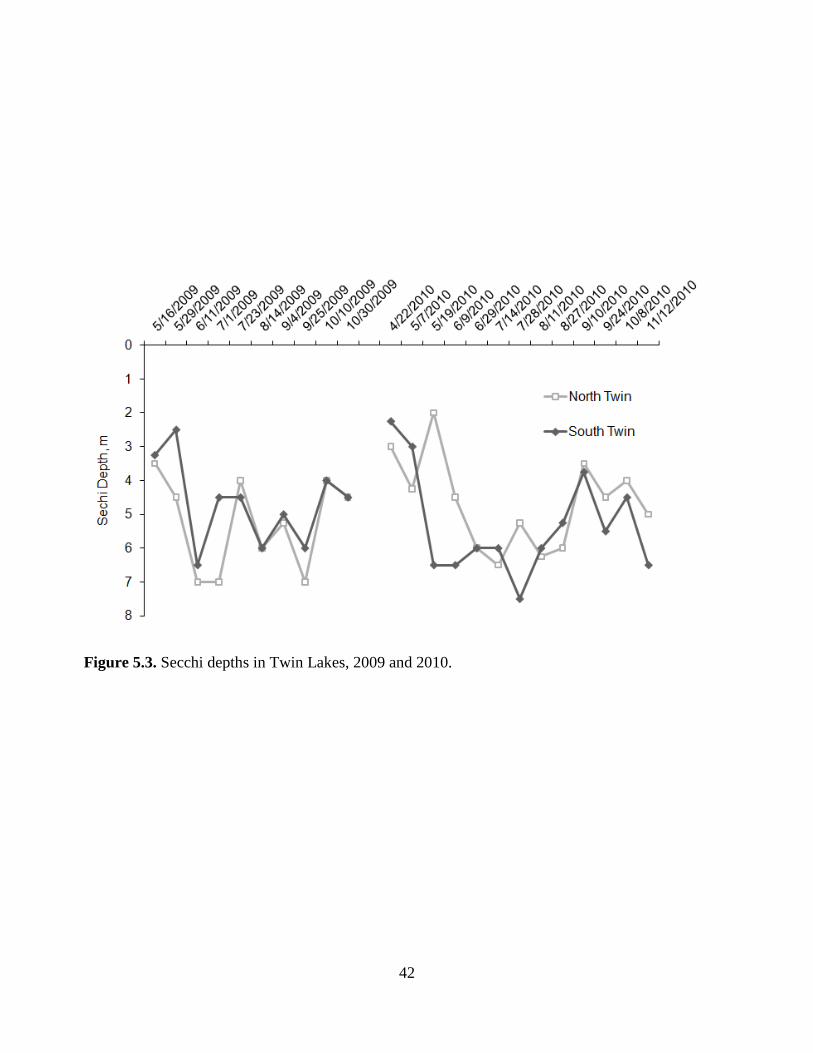
phytoplankton biovolume (Fig 5.2) and Secchi depth (Fig 5.3). Phytoplankton biovolume for
2010 in North and South Twin peaked in the fall and spring, which corresponds to higher
nutrient availability. Biovolumes were low in the summer, likely a result of nutrient limitation
35
and zooplankton grazing. Secchi depth followed a related inverse pattern with comparable peak
transparency in the summer during periods of low phytoplankton biovolume. A paired sample t-
test for means showed that algal biovolumes and Secchi depths were not significantly different
for the two lakes (p = 0.12 and 0.73, respectively), suggesting that bloom dilution was not a
factor. In addition, there was no corresponding decrease in THg or MeHg concentrations in
South Twin zooplankton during peak of algal biovolume, further undermining the role of bloom
dilution. The evaluation of zooplankton and phytoplankton density does not support the
contention that biodilution in South Twin Lake is responsible for the lower levels of mercury
burden in South Twin zooplankton compared to North Twin zooplankton.
In another effort to assess the effects of zooplankton density on zooplankton mercury
content, the total mass of THg and MeHg contained in the entire large-bodied zooplankton
population was estimated. This unique metric was calculated by multiplying the following
factors: zooplankton mercury concentration (µg/kg), average zooplankton weight (µg/#),
zooplankton population density (#/m3), and lake volume (m3). The calculation yielded grams of
total mass of THg and MeHg in zooplankton (Fig. 5.4 and 5.5). If the working hypothesis of this
study was valid, that lake oxygenation led to a decrease in water column MeHg and a resulting
decrease in zooplankton MeHg, the total mass of MeHg in the zooplankton in North Twin should
be lower than South Twin. Again, this was not the case. Total mass of THg in zooplankton in
2010 in North Twin ranged from around 0.2 to 0.9 g, while levels in South Twin ranged from
around 0.05 to 0.6 g. For MeHg, total mass ranged from around 0.1 to 0.5 g in North Twin and
0.05 to 0.2 g in South Twin Lake. A paired sample t-test for means showed that both THg (p =
0.005) and MeHg (p = 0.02) were significantly higher in North Twin, the exact opposite of what
was hypothesized to occur. MeHg zooplankton mass in 2010 in both North and South Twin

36
shared the same distinct seasonal trend of increasing early in the season before decreasing in the
late summer. Presuming that South Twin accumulated MeHg in bottom waters as it did in 2009
(Fig. 4.3), it is surprising that MeHg mass did not continue to increase. Perhaps anoxia in bottom
waters excludes zooplankton form accessing high MeHg waters. In contrast, the expansion of
habitat provided by hypolimnetic oxygenation may have allowed zooplankton in North Twin to
access deeper waters with low MeHg levels, resulting in greater MeHg uptake. Further data
analysis is underway by others examining the impacts of oxygenation on zooplankton vertical
migration, and these results should shed some light on the potential for zooplankton migration to
partly explain the observed high THg and MeHg levels in North Twin zooplankton.
5.4 Enhanced Uptake of Mercury due to Metal Oxides
Another potential explanation for the higher mercury levels in zooplankton from North
Twin Lake is that the continual presence of iron and manganese oxides in the water column
enhanced mercury uptake. A surprising aspect of this project was that oxygen addition in North
Twin Lake did not repress metals release from sediments. Such repression is typically observed
after oxygen addition to the bottom of lakes and reservoirs (Beutel and Horne, 1999). For
example, a recent study by Gantzer et al. (2009) documented a greater than 95% decrease in iron
and manganese in a raw water reservoir in Virginia oxygenated with the same line diffuser
system used in Twin Lakes. In contrast, iron and manganese levels in North Twin Lake remained
elevated after oxygen addition (Fig. 5.6). During oxygenation in 2009, levels in North Twin were
around 100 µg/L for manganese and 500 µg/L for iron in the upper hypolimnetic water column.
Near the sediment water interface levels increased to around 500 µg/L for manganese and 4,000
µg/L for iron. Similar results were observed for 2010. In non-oxygenated South Twin, levels

37
were roughly the same, though iron in particular was only observed on the lower hypolimnion.
Since the water column in North Twin was oxygenated with DO levels above 4-5 mg/L, a
large fraction of the iron and manganese in the hypolimnion was likely in the form of metal
oxides. These precipitates have a strong affinity to sorb metals including mercury (Davison,
1993). This phenomenon was observed in North Twin Lake in the fall of 2008 during a test of
the line diffuser system (Dent, in preparation). After only a day after oxygenation of the anoxic
hypolimnion, iron and MeHg levels in bottom waters plummeted. A few weeks after the system
was turned off, the hypolimnion had re-accumulated iron and MeHg to levels observed before
the oxygen test. The explanation for this observation could be the reversible and redox-mediated
sorption of MeHg to iron oxides. Hurley et al. (1994) also found a correlation with between the
settling of iron and MeHg in a study of Wisconsin seepage lakes, and this supports the
observation during the North Twin Lakes oxygen test.
Since zooplankton are filter feeders and are known to ingest small particulates (Burns,
1968), the ingestion of mercury-rich metal oxides could result in enhanced mercury uptake into
zooplankton. An additional intriguing mechanism could be the conversion of inorganic mercury
taken up via metal oxide ingestion to MeHg within the zooplankton (Kainz et al., 2002; Tsui and
Wang, 2004). These researchers hypothesize that microfolds in zooplankton gastrointestinal
tracts could provide anaerobic habitat for sulfate-reducing bacteria that produce MeHg from
ingested inorganic mercury.
A few limnological studies have suggested linkage between metal oxides and mercury
uptake by zooplankton. Slotton et al. (1995) monitored seasonal cycles of THg in zooplankton in
Davis Creek Reservoir, a small eutrophic reservoir in California impacted by historical mercury
mining. They found that mercury levels in zooplankton increased dramatically at fall overturn,
38
from around 100-200 µg/kg, levels similar to those observed in this study, to peak levels of 300-
500 µg/kg just after fall destratification. A related study also tracked MeHg and manganese in
the water column (Gill and Bruland, 1992). That study found that MeHg accumulated in anoxic
bottom waters along with elevated levels of dissolved manganese. Manganese levels in anoxic
bottom waters were around 500 µg/L, while iron levels were two orders of magnitude lower.
This contrasts with North Twin which had waters enriched with iron relative to manganese. This
difference may be because Davis Creek is a reservoir with flooded terrestrial soils while North
Twin is a natural lake with sediments that are fairly rich in iron (Dent, personal correspondence).
Dissolved MeHg levels in anoxic bottom waters were around 20 ng/L. This is two orders of
magnitude higher than the levels observed in Twin Lakes and reflects the mercury impacted
status of the reservoir. These extreme levels of MeHg in the water column also likely account for
the relatively high levels of THg in the zooplankton in Davis Creek Reservoir. Upon overturn
much of the mercury was associated with newly oxidized manganese. Slotton et al. (1995)
suggested that this may have facilitated MeHg uptake into zooplankton during the overturn
episode. In Davis Creek Reservoir, the zooplankton likely ingested the fine, mercury-rich metal
oxide particulates at overturn and accumulated higher levels of mercury.
Another interesting study the evaluated the impact of anoxia and lake overturn on
mercury uptake into zooplankton was performed by Herrin et al. (1998). This study looked at
seasonal patterns of total and MeHg in zooplankton and fine particulates. As with the Slotton et
al. (1995) study, this study reported an accumulation of MeHg in anoxic bottom waters, though
at less than 0.5 ng/L, these levels were more comparable to those observed in Twin Lakes.
Herrin et al. (1998) also found that mercury levels in zooplankton peaked to around 200 µg/kg at
lake turnover, with roughly 50-80% of this being in the MeHg form. This study also evaluated

39
mercury levels of particulates in the edible size fraction for zooplankton, which included algae
and inorganic particles such as iron and manganese oxides. They found that levels tripled during
erosion of the mercury-rich hypolimnion and fall destratification. They concluded that the
enrichment of edible particulates with mercury as a result of lake overturn fueled a subsequent
increase in zooplankton mercury. The Herrin et al. (1998) study points out the important role that
edible particulates, whether they be organic or inorganic, play in transferring mercury from the
water column and into zooplankton.
Based on the current literature regarding seasonal mercury uptake into zooplankton, the
presence of metal oxides in North Twin Lake may have been a key mechanism that resulted in
relatively high levels of mercury uptake into zooplankton compared to non-oxygenated South
Twin Lake. As noted earlier, oxygen did repress MeHg accumulation in bottom waters in North
Twin Lake, yet zooplankton had higher levels of mercury relative to South Twin Lake. If this
idea is correct, it suggests that the presence of metal oxides is more important than the level of
MeHg in the water column in controlling mercury uptake into zooplankton.

40
Figure 5.1. Large-bodied zooplankton densities in Twin Lakes, 2010. Densities are expressed in
number of zooplankton per m3. Data is preliminary.

41
Figure 5.2. Phytoplankton densities in surface waters of Twin Lakes, 2010. Densities are
expressed in phytoplankton biovolume µm3 per ml x 1,000. Data is preliminary.
42
Figure 5.3. Secchi depths in Twin Lakes, 2009 and 2010.

43
Figure 5.4. Total mercury mass contained in the zooplankton population in Twin Lakes, 2010

44
Figure 5.5. Methylmercury mass contained in zooplankton population in Twin Lakes, 2010.

45
Figure 5.6. Iron and manganese profiles in Twin Lakes. A. North Twin manganese; B. North
Twin iron; C. South Twin iron; and D. South Twin iron, 2009
46
6. CONCLUSION
Hypolimnetic oxygenation of North Twin Lake lowered MeHg concentrations in the
hypolimnetic water column as predicted. We can attribute this to elevated dissolved oxygen
concentrations suppressing a range process that enhance MeHg mobility and production in
bottom waters, including methylation by sulfate-reducing bacteria. While MeHg concentrations
in the hypolimnion decreased, THg showed little response to the hypolimnetic treatment, with
North Twin levels only slightly above those in South Twin. The most compelling finding of this
study is also the most difficult to understand. THg and MeHg concentrations in large-bodied
zooplankton did not respond to lower water column MeHg concentrations in North Twin.
With many variables and multiple pathways for zooplankton to accumulate mercury, it is
unknown why this occurred, but possible mechanisms that may enhance uptake of mercury were
explored. Several types of biodilution were investigated. Zooplankton density and algal bloom
dilution were ruled out since there was no significant difference between zooplankton and
phytoplankton density in North and South Twin lakes. With regards to growth dilution, it is not
known how oxygenation effects algal nutrient composition and related zooplankton growth rates.
If it were to decrease algal C:P ratio and induce higher zooplankton growth rates, as illustrated in
Pickhardt et al. (2005), then this could be a plausible explanation. But oxygenation generally
decreases internal nutrient loading, thus the C:P ratio in North Twin would be expected to
increase.
The conjecture that showed the most promise was the enhancement of mercury uptake by
metal oxides. Metal oxides in the bottom waters of North Twin Lake, which were unexpectedly
present all summer and fall, may have sorbed mercury and then been ingested by zooplankton,

47
resulting in elevated mercury uptake. If this idea is correct, it suggests that the presence of metal
oxides is more important than the level of MeHg in the water column in controlling mercury
uptake into zooplankton. If true, this observation also has important implications of lake
oxygenation. Systems must be sized and engineered in such a way as to inhibit iron and
manganese release form sediments by maintaining a well-oxygenated sediment-water interface.
Further research is necessary to understand how metal oxides affect mercury uptake into
zooplankton. A first start could be a laboratory bioassay experiment in which mercury uptake
into zooplankton is measured in water that contains MeHg with and without metal oxides. In
addition, future field work at Twin Lakes should include sampling for total MeHg and dissolved
MeHg to evaluate if water column MeHg is associated with fine particulates that could be
ingested by zooplankton.
One of the strength if this study, the side by side study of North and Twin Lakes, was
also a bit of a limitation. While North Twin Lake showed an increase in zooplankton MeHg
relative to South Twin, MeHg trends in North Twin Zooplankton before the 2009 hypolimnetic
oxygenation are not known. The lakes are similar and it is assumed that the differences in
hydrology, biogeochemistry, and mercury loading between the two lakes is negligible.
Thankfully this limitation is a short-term one. After collecting two years of data for non-
oxygenated South Twin, an oxygenation system was installed in this basin in fall 2010 and start-
up is set for summer 2011. Continued sampling of South Twin will offer a more conclusive
before and after study of the effects of lake oxygenation on mercury uptake in zooplankton.

48
7. REFERENCES
American Public Health Association (APHA). 1998. Standard Methods for Examination of
Water and Wastewater, 20th ed. American Public Health Association, Washington, D.C.
Benoit, J.M., C.C. Gilmour, A. Heyes, R.P. Mason and C. Miller. 2003. Geochemical and
biological controls over methylmercury production and degradation in aquatic ecosystems.
In: Cai, Y., Braids, O.C. (Eds.), Biogeochemistry of Environmentally Important Trace
Element. Amer. Chem. Soc. Washington, DC, pp. 262-297.
Beutel, M.W. and A.J. Horne. 1999. A review of the effects of hypolimnetic oxygenation on lake
and reservoir water quality. Lake and Reservoir Management. 15:285-297.
Burns, C.W. 1968. The relationship between body size of filter-feeding cladocera and the
maximum size of particle ingested. Limnology and Oceanography. 13:675-678.
Chételat, J., M. Amyot and E. Garcia. 2010. Habitat-specific bioaccumulation of methylmercury
in invertebrates of small mid-latitude lakes in North America. Environmental Pollution.
159:10-17.
Chen, C. Y. and C.L. Folt. 2005. High Plankton Densities Reduce Mercury Biomagnification.
Environmental Science and Technology. 39:115-121.
Chen, C.Y., R.S. Stemberger, B. Klaue, J.D. Blum, P.C. Pickhardt and C.L. Folt. 2000.
Accumulation of heavy metals in food web components across a gradient of lakes.
Limnology and Oceanography. 45:1525-1536.
Christensen, D.R. and B.C. Moore. 2007. Differential prey selectivity of largemouth bass
functional feeding groups in Twin Lakes, Washington. Lake and Reservoir Management.
23:39-48.

49
Christensen, D.R. and B.C. Moore. 2008. Diet composition and overlap in a mixed warm and
cold water fish community. Journal of Freshwater Ecology. 23:195-204.
Christensen, D.R. and B.C. Moore. 2009. Using stable isotopes and a multiple mixing model to
evaluate fish dietary niches in a mesotrophic lake. Lake and Reservoir Management. 25:167-
175.
Christensen, D.R and B.C. Moore. 2010. Largemouth bass consumption demand on hatchery
rainbow trout in two Washington Lakes. Lake and Reservoir Management. 26:200-211.
Clegg, E. M, B.C. Moore, D. Christensen, M. Biggs, E. Shallenberger, M.W. Beutel and S.R.
Dent. 2009. Movements and distribution of trout following hypolimnetic oxygenation in
North Twin Lake, Washington. Lake and Reservoir Management.
Davison W. 1993. Iron and manganese in lakes. Earth-Sciences Rev. 34:119-163.
"Demographics of the Confederated Tribes of the Colville Indian Reservation." Demographics.
Confederated Tribes of the Colville Reservation, 2000. Web. 18 Apr. 2011.
<http://www.colvilletribes.com/demograph.htm>.
DiPasquale, M.C., J.L Agee, R.M. Bouse and B.E. Jaffe. 2003. Microbial cycling of mercury in
contaminated pelagic and wetland sediments of San Pablo Bay, California. Environ. Geo.
43:260-267.
Dodds, W. 2002. Freshwater Ecology. Concepts and Environmental Applications. Academic
Press.
Gantzer, P., L. Bryant and J. Little. 2009. Controlling soluble iron and manganese in a water-
supply reservoir using hypolimnetic oxygenation. Water Research. 43:1285-1294.
Gill, B. and K. Bruland. 1992. Mercury Speciation and cycling in a Seasonally Anoxic
freshwater system: Davis Creek Reservoir. Electric Power Research Institute.

50
Hall, B.D., R.A. Bodaly, R.J.P. Fudge, J.W.M. Rudd and D.M. Rosenberg. 1997. Food as the
dominant pathway of methylmercury uptake by fish. Water Air Soil Pollution. 100:13-24.
Herrin, R.T., R.C. Lathrop, P.R. Gorski and A.W. Andren. 1998. Hypolimnetic methylmercury
and its uptake by plankton during fall destratification: A key entry point of mercury into lake
food chains. Limnology and Oceanography. 43(7):1476-1486.
Hurley, J.P., C.J. Watras and N.S. Bloom. 1994. Distribution and flux particulate mercury in four
stratified seepage lakes, p. 69-81. In C.J. Watras and J.W. Huckabee (Eds.), Mercury
Pollution: Integration and Synthesis. Lewis Publishers.
Kainz, M., M. Lucotte and C.C Parrish. 2002. Methyl mercury in zooplankton - the role of size,
habitat and food quality. Can. J. Fish. Aquat. Sci. 59:1606-1615.
Kainz, M. and A. Mazumder. 2005. Effect of Algal and Bacterial Diet on Methyl Mercury
Concentrations in Zooplankton. Environmental Science and Technology 39:1666-672.
Karimi, R., C.Y. Chen, P.C. Pickhardt, N.S. Fisher and C.L. Folt. 2006. Stoichiometric controls
of mercury dilution by growth. Proceedings of the National Academy of Sciences. 104:7477-
7482.
Lanouette, B. P. 2011 Changes in Salmonid Vertical Distribution Following Hypolimnetic
Oxygenation in North Twin Lake, Washington. Thesis, Washington State University
Larson, D.W. 1977. Enhancement of methylmercury uptake in fish by lake temperature, pH and
dissolved oxygen gradients: Hypothesis. Northwest Science. 2:131-137.
Monson, B.A. and B.L. Brezonik. 1998. Seasonal patterns of mercury species in water and
plankton from softwater lakes in northeastern Minnesota. Biogeochemistry. 40: 147-162.

51
Megler, D., H.A. Anderson, L.H.M. Chan, K.R. Mahaffey, M. Murry, M. Sakamoto and A.H.
Stern. 2007. Methylmercury exposure and health effects in humans: A worldwide concern.
Ambio. 36(1):3-11.
Miskimmin, B.M. 1991. Effect of natural levels of Dissolved Organic Carbon (DOC) on methyl
mercury formation and sediment-water partitioning. Bull. Environ. Contam. Toxicol. 47:
473-750.
Miskimmin, B.M., J.W.M. Rudd and C.A. Kelly. 1992. Influence of dissolved organic carbon,
pH, and microbial respiration rates on mercury methylation and demethylation in lake water.
Canadian Journal of Fisheries and Aquatic Sciences. 49: 17-22.
Mobley, M.H. and W.G. Brock. 1995. Widespread oxygen bubbles to improve reservoir releases.
Lake and Reservoir Management. 11:231-234.
Morel, F.M.M., A.M.L. Kraepiel and M. Amyot. 1998. The chemical cycle and bioaccumulation
of mercury. Annual Review Ecological Systems. 29:543-66.
Pickhardt, P.C., C.L. Folt, C.Y. Chen, B. Klaue, and J. D. Blum. 2005. Impacts of zooplankton
composition and algal enrichment on the accumulation of mercury in an experimental
freshwater food web. Science of the Total Environment. 399:89-101.
Pickhardt, P.C., C.L. Folt, C.Y. Chen, B. Klaue and J.D. Blum. 2002. Algal blooms reduce the
uptake of toxic methyl mercury in freshwater food webs. Proceedings of the National
Academy of Sciences. 99:4419-4423.
Ravichandran, M. 2004. Interactions between mercury and dissolved organic matter––a review.
Chemosphere. 55:319-331.
Slotton, D.G., J.E. Reuter and C.R. Goldman. 1995. Mercury uptake patterns of biota in a
seasonally anoxic northern California reservoir. Water Air Soil Pollution. 80:841-850.

52
Sunda, W.G. and S.A. Huntsman. 1998. Processes regulating cellular metal accumulation and
physiological effects: Phytoplankton as model systems. Science of the Total Environment.
219:165-181.
Tsui, M.T.K. and W.X. Wang. 2004. Uptake and elimination routes of inorganic mercury and
methylmercury in Daphnia magna. Environmental Science. 38: 808-816.
United State Environmental Protection Agency (USEPA). 1996. Method 1669: Sampling
Ambient Water for Trace Metals at EPA Water Quality Criteria Levels. EPA-821-R-96-008.
US EPA, Washington, D.C.
United States Environmental Protection Agency (USEPA). 2001. Method 1630: methyl mercury
in water by distillation, aqueous ethylation, purge and trap, and CVAFS. EPA-821-R-01-
020. US EPA, Washington, D.C.
United States Environmental Protection Agency (USEPA). 2002. Method 1631, revision E:
mercury in water by oxidation, purge and trap, and cold vapor atomic fluorescence
spectrometry. EPA-821-R-02-019. US EPA, Washington, D.C.
United States Environmental Protection Agency (USEPA). 2004. National listing of fish
advisories. EPA-823-F-04-016. US EPA. Washington, D.C.
United States Environmental Protection Agency (USEPA). 2007. Method 7473: Mercury in
solids and solutions by thermal decomposition, amalgamation and atomic absorption
spectrometry. US EPA, Washington, D.C.
United States Geological Survey (USGS). 2010. Analysis of Methylmercury in Biological
Samples by Cold Vapor Atomic Fluorescence Detection with the Brooks-Rand “MERX”
Automated Methylmercury Analytical System. http://wi.water.usgs.gov/mercury-
lab/analysis-methods.html

53
United States Geological Survey (USGS). 2009. USGS Contributes to the Design of a Proposed
National Mercury Monitoring Network (MercNet). USGS Toxic Substances Hydrology
Program. June 2009. http://toxics.usgs.gov/highlights/mercnet.html.
Watras, C.J. 1992, Mercury and Methylmercury in individual zooplankton: Implications for
bioaccumulation. Limnology and Oceanography. 37:1313-1318
Watras, C.J., R. Back, S. Halvorsen, R. Hudson, K. Morrison and S. Wente. 1998.
Bioaccumulation of mercury in pelagic freshwater food webs. Science of the Total
Environment. 219:183-208.
Watras, C.J. 2009. Mercury pollution in remote freshwater lakes. In: Likens, G., editor.
Encyclopedia of Inland Waters. New York: Elsevier Inc. p. 100-109.
Xue, J., V.G. Zartarian, S.V. Liu and A.M. Geller. 2010. Methyl Mercury Exposure in Tribal
Populations from Fish Consumption. Proc. of USEPA 2010 National Tribal Science Forum,
Traverse City, Michigan.

APPENDIX

55
Total Mercury Analysis DMA-80
First Run Hg [ng] R [µg/kg] Weight [g] blank 1.947441459 1.947441459 1
nt 042210 zoo >243 0.689300358 37.05915833 0.0186
nt 042210 zoo >500 1.133992076 36.46276855 0.031099999 nt 042210 zoo > 1000 1.394925237 73.03273773 0.019099999
blank 0.218296364 0.218296364 1 mess 3 5.549000263 112.1010132 0.0495 blank 2.723473549 2.723473549 1
st 042210 zoo >243 0.88712424 47.43980026 0.0187 st 042210 zoo >500 0.607736349 59.00352859 0.0103
blank 0.481320441 0.481320441 1 mess 3 5.103563309 106.1031876 0.048099998
Second Run Hg [ng] R [µg/kg] Weight [g] blank 1E-05 1E-05 1 mess3 2.254884243 101.5713654 0.0222 mess3 2.015029192 103.8674927 0.019400001 mess3 2.406787395 101.5522156 0.023700001 blank 0.016408831 0.016408831 1
st 042210 zoo >1000 0.754556179 47.7567215 0.015799999 nt 050710 zoo >250 0.607736349 38.70932388 0.015699999 nt 050710 zoo >500 1.622133255 58.35011673 0.027799999
nt 050710 zoo >1000 1.54293251 61.96516418 0.024900001 blank 0.251888633 0.251888633 1
mess 3 2.256936073 107.9873734 0.0209 st 050710 zoo >250 0.858568907 32.3988266 0.0265 st 050710 zoo >500 1.755285859 72.5324707 0.0242
st 050710 zoo >1000 1.5587672 90.62600708 0.017200001 blank 0.102063797 0.102063797 1
mess 3 2.306184769 112.4968262 0.020500001

56
Total Mercury Analysis DMA-80
Third Run Hg [ng] R [µg/kg] Weight [g] blank 0.059237551 0.059237551 1
mess 3 4.6435709 103.1904678 0.045000002 mess 3 2.437598944 102.4201279 0.023800001 mess 3 1.095218539 104.3065262 0.0105 blank 0.040882699 0.040882699 1
nt 051910 zoo >243 0.432386607 39.66849518 0.0109 nt 051910 zoo >500 1.117147803 83.36923981 0.0134 nt 051910 zoo >500 1.305462718 80.08973694 0.0163 nt 051910 zoo >500 0.966679156 77.95800018 0.0124
nt 051910 zoo >1000 0.991159976 86.18782043 0.0115 nt 051910 zoo >1000 1.119706631 95.70142365 0.0117 nt 051910 zoo >1000 1.076303124 71.27835846 0.0151
blank 0.167318776 0.167318776 1 mess 3 1.44025588 109.9431992 0.0131 blank 0.0143693 0.0143693 1
st 051910 zoo >243 0.381413907 27.05063248 0.0141 st 051910 zoo >500 0.617931545 46.81299591 0.0132 st 051910 zoo >500 0.593463182 43.31848526 0.0137 st 051910 zoo >500 0.734163165 53.20022964 0.0138
st 051910 zoo >1000 0.825935781 53.28617859 0.0155 st 051910 zoo >1000 1.250337481 73.11915588 0.017100001 st 051910 zoo >1000 1.865551472 128.6587219 0.0145
blank 0.513943315 0.513943315 1 mess 3 2.078545094 152.8342133 0.0136

57
Total Mercury Analysis DMA-80
Fourth Run Hg [ng] R [µg/kg] Weight [g] blank 0.138770282 0.138770282 1 mess 2.423219204 145.977066 0.0166 mess 1.381020904 107.0558853 0.0129 mess 2.031418085 113.4870453 0.017899999 blank 0.057198141 0.057198141 1
nt 060910 zoo >250 0.411997527 63.3842392 0.0065 nt 060910 zoo >500 1.268711448 96.84819794 0.0131
nt 060910 zoo >1000 1.385105491 116.3954239 0.0119 nt 060910 zoo >1000 1.244213104 129.605545 0.0096 nt 060910 zoo >1000 1.340176105 108.9574127 0.0123
blank 0.427801609 0.427801609 1 mess 1.454105735 106.1391068 0.0137 blank 0.134691864 0.134691864 1
st 060910 >250 0.57715112 59.50011826 0.0097 st 060910 zoo >500 0.538410604 56.67480087 0.0095 st 060910 zoo >500 0.54912442 56.61076736 0.0097 st 060910 zoo >500 0.528215826 57.41476059 0.0092
st 060910 zoo >1000 0.61181438 59.39945221 0.0103 st 060910 zoo >1000 0.622009695 51.83414078 0.012 st 060910 zoo >1000 0.767563105 58.1487236 0.0132
blank 0.017706711 0.017706711 1 mess 2.585595369 109.0968552 0.023700001
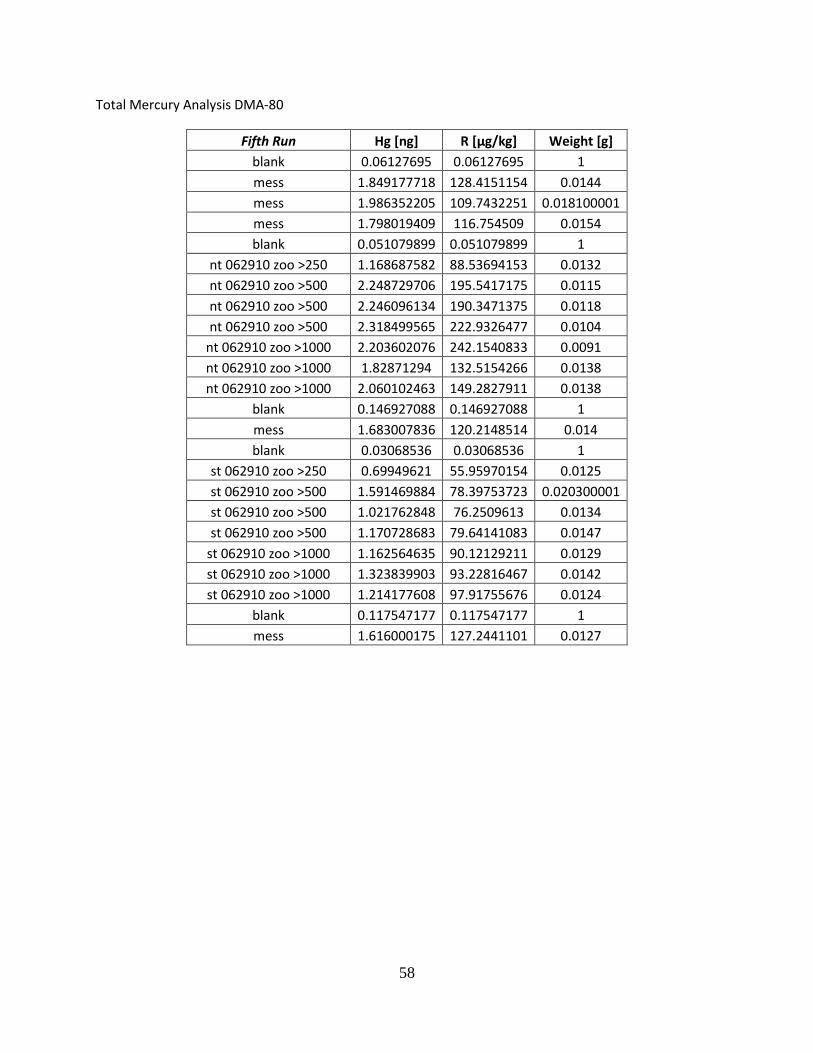
58
Total Mercury Analysis DMA-80
Fifth Run Hg [ng] R [µg/kg] Weight [g] blank 0.06127695 0.06127695 1 mess 1.849177718 128.4151154 0.0144 mess 1.986352205 109.7432251 0.018100001 mess 1.798019409 116.754509 0.0154 blank 0.051079899 0.051079899 1
nt 062910 zoo >250 1.168687582 88.53694153 0.0132 nt 062910 zoo >500 2.248729706 195.5417175 0.0115 nt 062910 zoo >500 2.246096134 190.3471375 0.0118 nt 062910 zoo >500 2.318499565 222.9326477 0.0104
nt 062910 zoo >1000 2.203602076 242.1540833 0.0091 nt 062910 zoo >1000 1.82871294 132.5154266 0.0138 nt 062910 zoo >1000 2.060102463 149.2827911 0.0138
blank 0.146927088 0.146927088 1 mess 1.683007836 120.2148514 0.014 blank 0.03068536 0.03068536 1
st 062910 zoo >250 0.69949621 55.95970154 0.0125 st 062910 zoo >500 1.591469884 78.39753723 0.020300001 st 062910 zoo >500 1.021762848 76.2509613 0.0134 st 062910 zoo >500 1.170728683 79.64141083 0.0147
st 062910 zoo >1000 1.162564635 90.12129211 0.0129 st 062910 zoo >1000 1.323839903 93.22816467 0.0142 st 062910 zoo >1000 1.214177608 97.91755676 0.0124
blank 0.117547177 0.117547177 1 mess 1.616000175 127.2441101 0.0127

59
Total Mercury Analysis DMA-80
Sixth Run Hg [ng] R [µg/kg] Weight [g] blank 0.195441723 0.195441723 1
nt 72810 zoop >1000 1.961326361 188.5890656 0.0104 nt 72810 zoop >1000 1.797994971 176.2740326 0.0102 nt 72810 zoop >1000 1.745743513 174.5743561 0.01
mess 3 3.102360964 111.1957397 0.027899999 blank 1E-05 1E-05 1
nt 72810 zoop >500 0.805444956 157.9303894 0.0051 nt 72810 zoop >500 0.96172303 192.3446045 0.005 nt 72810 zoop >500 0.971463799 202.3883057 0.0048
mess 3 2.75455451 109.7432098 0.0251 blank 1E-05 1E-05 1
mess 3 3.588589907 138.555603 0.025900001 blank 1.245343328 1.245343328 1
st 72810 zoop >1000 1.25494647 105.457695 0.0119 st 72810 zoop >1000
error 2.41725111 109.3778763 0.0221 st 72810 zoop >1000 1.290944695 89.03067017 0.0145
mess 3 2.8544662 112.8247528 0.0253 blank 3.485192776 3.485192776 1
st 72810 zoop >500 0.812000871 104.1026764 0.0078 st 72810 zoop >500 0.644585252 117.197319 0.0055 st 72810 zoop >500 0.580914557 69.15649414 0.0084
mess 3 4.393685341 171.6283417 0.025599999 blank 0.109455563 0.109455563 1
mess 3 2.962790966 113.9535065 0.026000001
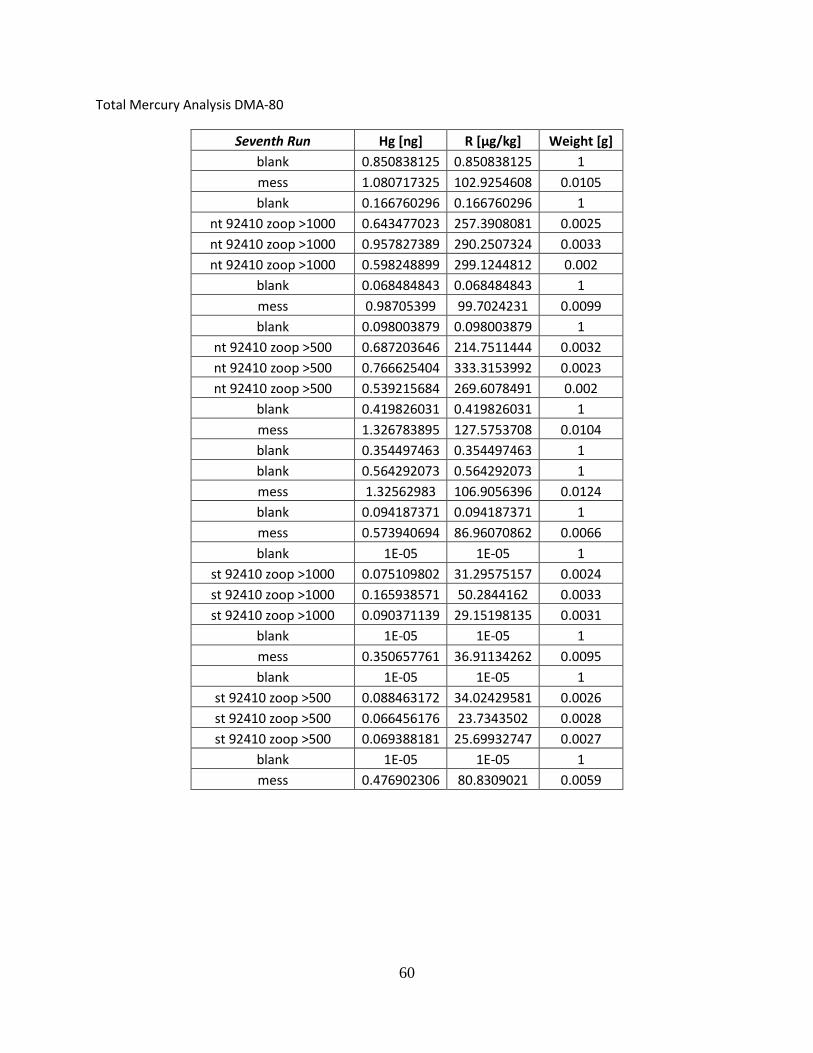
60
Total Mercury Analysis DMA-80
Seventh Run Hg [ng] R [µg/kg] Weight [g] blank 0.850838125 0.850838125 1 mess 1.080717325 102.9254608 0.0105 blank 0.166760296 0.166760296 1
nt 92410 zoop >1000 0.643477023 257.3908081 0.0025 nt 92410 zoop >1000 0.957827389 290.2507324 0.0033 nt 92410 zoop >1000 0.598248899 299.1244812 0.002
blank 0.068484843 0.068484843 1 mess 0.98705399 99.7024231 0.0099 blank 0.098003879 0.098003879 1
nt 92410 zoop >500 0.687203646 214.7511444 0.0032 nt 92410 zoop >500 0.766625404 333.3153992 0.0023 nt 92410 zoop >500 0.539215684 269.6078491 0.002
blank 0.419826031 0.419826031 1 mess 1.326783895 127.5753708 0.0104 blank 0.354497463 0.354497463 1 blank 0.564292073 0.564292073 1 mess 1.32562983 106.9056396 0.0124 blank 0.094187371 0.094187371 1 mess 0.573940694 86.96070862 0.0066 blank 1E-05 1E-05 1
st 92410 zoop >1000 0.075109802 31.29575157 0.0024 st 92410 zoop >1000 0.165938571 50.2844162 0.0033 st 92410 zoop >1000 0.090371139 29.15198135 0.0031
blank 1E-05 1E-05 1 mess 0.350657761 36.91134262 0.0095 blank 1E-05 1E-05 1
st 92410 zoop >500 0.088463172 34.02429581 0.0026 st 92410 zoop >500 0.066456176 23.7343502 0.0028 st 92410 zoop >500 0.069388181 25.69932747 0.0027
blank 1E-05 1E-05 1 mess 0.476902306 80.8309021 0.0059

61
Total Mercury Analysis DMA-80
Eighth Run Hg [ng] R [µg/kg] Weight [g] blank 1E-05 1E-05 1 mess 0.813941777 79.79821777 0.0102 blank 1E-05 1E-05 1
nt 10810 zoop >500 1.174592495 192.5561523 0.0061 nt 10810 zoop >500 0.975360751 168.1656494 0.0058 nt 10810 zoop >500 0.845010281 150.8946991 0.0056
blank 1E-05 1E-05 1 mess 3.104245663 86.95365906 0.035700001 blank 1E-05 1E-05 1
nt 10810 zoop >1000 2.218818665 207.3662415 0.0107 nt 10810 zoop >1000 1.886757493 190.5815735 0.0099 nt 10810 zoop >1000 1.61206913 166.1927032 0.0097
blank 1E-05 1E-05 1 mess 3.173326969 87.90379333 0.0361 blank 1E-05 1E-05 1 blank 0.035074718 0.035074718 1 mess 1.755370855 90.95186615 0.019300001 blank 1E-05 1E-05 1 mess 2.028531075 85.23239899 0.023800001 blank 1E-05 1E-05 1
st 10810 zoop >1000 0.664747238 54.04449081 0.0123 st 10810 zoop >1000 0.756788373 68.17913055 0.0111 st 10810 zoop >1000 0.386363626 43.90495682 0.0088
blank 1E-05 1E-05 1 blank 1E-05 1E-05 1 mess 1.168719172 83.47994232 0.014 blank 1E-05 1E-05 1
st 10810 zoop >500 0.057947289 26.33967781 0.0022 st 10810 zoop >500 0.00958355 2.738157272 0.0035 st 10810 zoop >500 0.061760601 24.70423889 0.0025
blank 1E-05 1E-05 1 blank 1E-05 1E-05 1 mess 1.549596548 163.1154327 0.0095
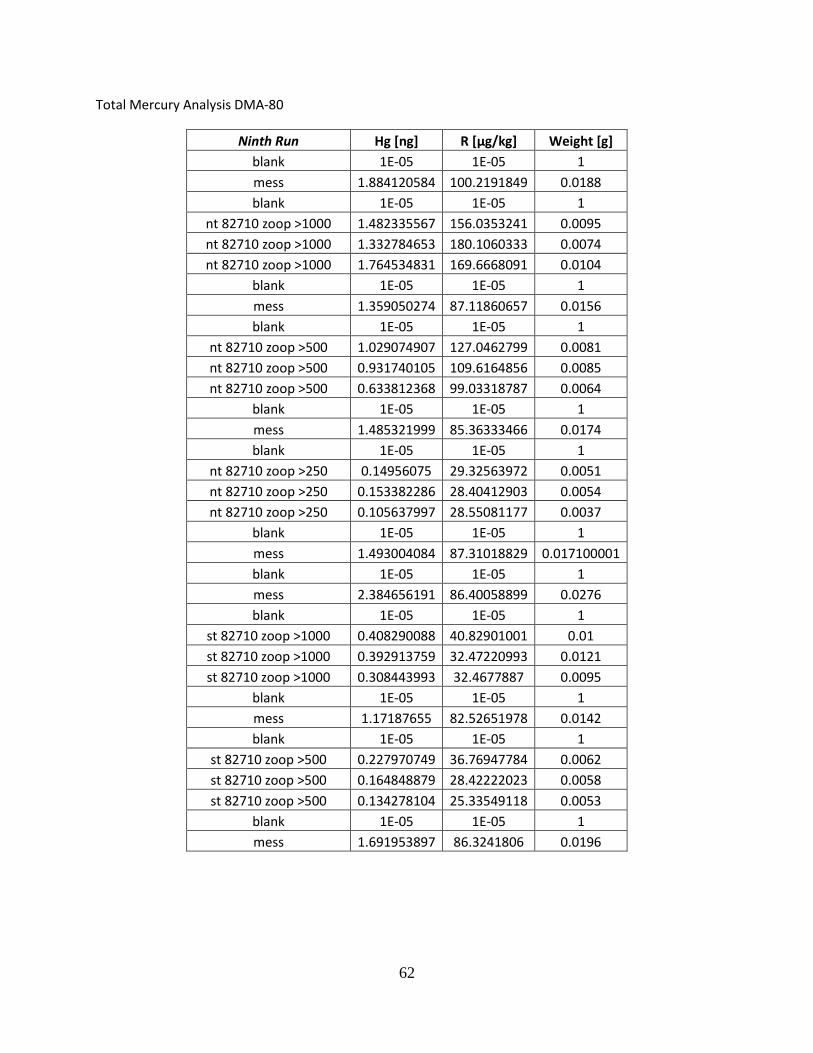
62
Total Mercury Analysis DMA-80
Ninth Run Hg [ng] R [µg/kg] Weight [g] blank 1E-05 1E-05 1 mess 1.884120584 100.2191849 0.0188 blank 1E-05 1E-05 1
nt 82710 zoop >1000 1.482335567 156.0353241 0.0095 nt 82710 zoop >1000 1.332784653 180.1060333 0.0074 nt 82710 zoop >1000 1.764534831 169.6668091 0.0104
blank 1E-05 1E-05 1 mess 1.359050274 87.11860657 0.0156 blank 1E-05 1E-05 1
nt 82710 zoop >500 1.029074907 127.0462799 0.0081 nt 82710 zoop >500 0.931740105 109.6164856 0.0085 nt 82710 zoop >500 0.633812368 99.03318787 0.0064
blank 1E-05 1E-05 1 mess 1.485321999 85.36333466 0.0174 blank 1E-05 1E-05 1
nt 82710 zoop >250 0.14956075 29.32563972 0.0051 nt 82710 zoop >250 0.153382286 28.40412903 0.0054 nt 82710 zoop >250 0.105637997 28.55081177 0.0037
blank 1E-05 1E-05 1 mess 1.493004084 87.31018829 0.017100001 blank 1E-05 1E-05 1 mess 2.384656191 86.40058899 0.0276 blank 1E-05 1E-05 1
st 82710 zoop >1000 0.408290088 40.82901001 0.01 st 82710 zoop >1000 0.392913759 32.47220993 0.0121 st 82710 zoop >1000 0.308443993 32.4677887 0.0095
blank 1E-05 1E-05 1 mess 1.17187655 82.52651978 0.0142 blank 1E-05 1E-05 1
st 82710 zoop >500 0.227970749 36.76947784 0.0062 st 82710 zoop >500 0.164848879 28.42222023 0.0058 st 82710 zoop >500 0.134278104 25.33549118 0.0053
blank 1E-05 1E-05 1 mess 1.691953897 86.3241806 0.0196

63
Total Mercury Analysis DMA-80
Tenth Run Hg [ng] R [µg/kg] Weight [g] blank 0.113273472 0.113273472 1 blank 1.388561487 1.388561487 1
111210 nt zoo >1000 1.485112309 111.6625824 0.0133 111210 nt zoo >1000 1.100257039 137.532135 0.008 111210 nt zoo >1000 1.154039264 132.6481934 0.0087
blank 1E-05 1E-05 1 mess 3.18730855 103.8211288 0.0307 blank 1E-05 1E-05 1
111210 nt zoo >500 1.118237138 157.4981842 0.0071 111210 nt zoo >500 0.870270252 161.1611633 0.0054 111210 nt zoo >500 1.044742227 155.9316864 0.0067
blank 1E-05 1E-05 1 mess 1.627395511 87.9673233 0.0185 blank 1E-05 1E-05 1
111210 nt zoo >250 0.098003879 75.38759613 0.0013 111210 nt zoo >250 0.151471466 116.51651 0.0013
blank 0.00078892 0.00078892 1 mess 1.666336894 90.07226563 0.0185 blank 1E-05 1E-05 1 mess 1.908512831 87.14670563 0.0219 blank 0.00180363 0.00180363 1
111210 st zoo >1000 0.546929896 55.24544525 0.0099 111210 st zoo >1000 0.606763005 48.54104233 0.0125 111210 st zoo >1000 0.527647078 49.31281281 0.0107
blank 1E-05 1E-05 1 mess 3.209183216 90.65489197 0.035399999 blank 1E-05 1E-05 1
111210 st zoo >500 0.221387729 42.57456207 0.0052 111210 st zoo >500 0.153382286 29.49659348 0.0052 111210 st zoo >500 0.296206832 44.87982178 0.0066
blank 1E-05 1E-05 1 mess 1.494078994 90.00476074 0.0166 blank 1E-05 1E-05 1
111210 st zoo >250 1E-05 0.033333339 0.0003 111210 st zoo >250 1E-05 0.0125 0.0008
blank 1E-05 1E-05 1 mess 2.344338894 98.08950043 0.0239

64
Total Mercury Analysis DMA-80
11th Run Hg [ng] R [µg/kg] Weight [g] blank 1E-05 1E-05 1 mess 1.541707635 85.17722321 0.018100001 blank 1E-05 1E-05 1
st 051910 zoop >1000 0.482395411 29.77749443 0.0162 st 051910 zoop >1000 0.306526184 23.76172066 0.0129 st 051910 zoop >1000 0.496166348 28.19127083 0.0176
blank 1E-05 1E-05 1 mess 1.544336915 83.93135071 0.0184 blank 1E-05 1E-05 1
nt 62910 >1000 zoop 1.801086068 147.6300049 0.0122 nt 62910 >1000 zoop 2.087594032 144.971817 0.0144 nt 62910 >1000 zoop 1.793231368 153.2676392 0.0117
blank 1E-05 1E-05 1 mess 2.261815071 89.39980316 0.0253 blank 1E-05 1E-05 1
st 72810 >500 zoop 0.133597851 30.36314774 0.0044 st 72810 >500 zoop 0.029358501 13.34477329 0.0022 st 72810 >500 zoop 0.00078892 0.525944531 0.0015
blank 1E-05 1E-05 1 mess 2.126478672 87.87101746 0.0242 blank 1E-05 1E-05 1
st 111210 >500 zoop 0.686028242 92.70652008 0.0074 st 111210 >500 zoop 0.600238264 95.27591705 0.0063 st 111210 >500 zoop 0.528841078 62.21660233 0.0085
blank 0.217479914 0.217479914 1 mess 2.228850365 98.18724823 0.022700001
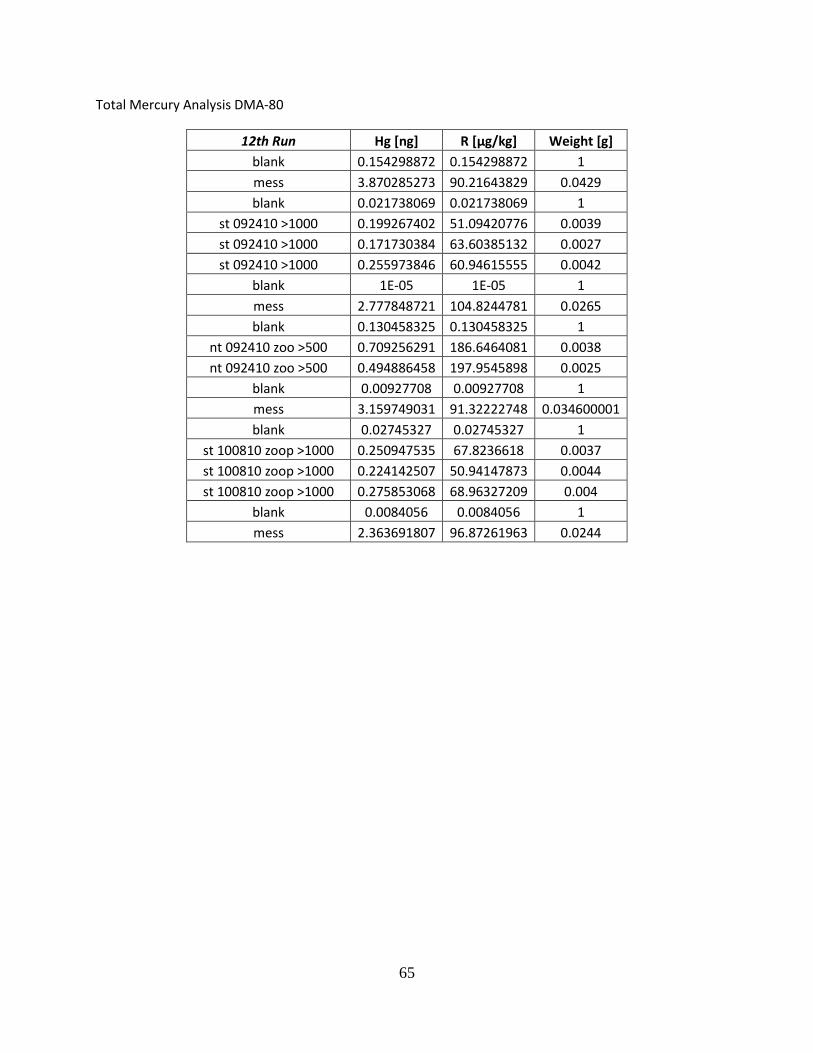
65
Total Mercury Analysis DMA-80
12th Run Hg [ng] R [µg/kg] Weight [g] blank 0.154298872 0.154298872 1 mess 3.870285273 90.21643829 0.0429 blank 0.021738069 0.021738069 1
st 092410 >1000 0.199267402 51.09420776 0.0039 st 092410 >1000 0.171730384 63.60385132 0.0027 st 092410 >1000 0.255973846 60.94615555 0.0042
blank 1E-05 1E-05 1 mess 2.777848721 104.8244781 0.0265 blank 0.130458325 0.130458325 1
nt 092410 zoo >500 0.709256291 186.6464081 0.0038 nt 092410 zoo >500 0.494886458 197.9545898 0.0025
blank 0.00927708 0.00927708 1 mess 3.159749031 91.32222748 0.034600001 blank 0.02745327 0.02745327 1
st 100810 zoop >1000 0.250947535 67.8236618 0.0037 st 100810 zoop >1000 0.224142507 50.94147873 0.0044 st 100810 zoop >1000 0.275853068 68.96327209 0.004
blank 0.0084056 0.0084056 1 mess 2.363691807 96.87261963 0.0244

66
Analysis 1
Analysis Type: MeHg
Calibration QA/QC
Method Number: 1630
Analyst Name:
Brandon Reed
Bias and Precision
Type Name/ID Final Units Spike Source %
REC % REC Notes
Result Units Result Limit
Matrix Spike NT12 0.98002 ng/L 1 0.069 91.09 71-125 accept
STT 0.91602 ng/L 1 0.017 89.93 71-125 accept
ST2 0.93522 ng/L 1 0.011 92.47 71-125 accept
ST10 0.88712 ng/L 1 0.019 86.85 71-125 accept
Ongoing Precision and Recovery OPR
ng/L 50
94.36 77-123 accept
OPR
ng/L 50
96.25 77-123 accept
OPR
ng/L 50
93.47 77-123 accept
OPR
ng/L 50
99.57 77-123 accept
Calibration
QA Sample Type Name/ID Analyzed Units Spike
% REC % REC Notes
Result
Level
Limit
Calibration 0.5 0.4667 pg 0.5
93.33 75-125 accept
1 0.9636 pg 1
96.36 75-125 accept
2 2.1164 pg 2
105.82 75-125 accept
10 9.9290 pg 10
99.29 75-125 accept
50 47.4308 pg 50
94.86 75-125 accept
250 257.5720 pg 250
103.03 75-125 accept
1000 1094.2944 pg 1000
109.43 75-125 accept
Calibration Factor
0.000012 pg/PA
accept
Blank Summary
QA Sample Type Name/ID Analyzed Units
Criteria Notes
Result
Calibration/Bubbler Blank CB1 0.028465 pg
< 50 accept
CB2 0.168181 pg
< 50 accept
CB3 0.027615 pg
< 50 accept
Average
0.074754 pg
< 25 accept
Method Blank A MB1 0.200771 pg
< 0.5 accept
MB2 0.321869 pg
< 0.5 accept
Average
0.261320 ng/L
Method Blank B MB3 0.168963 pg
< 0.7 accept
MB4 0.012392 pg
< 0.7 accept
Average 0.090678 ng/L
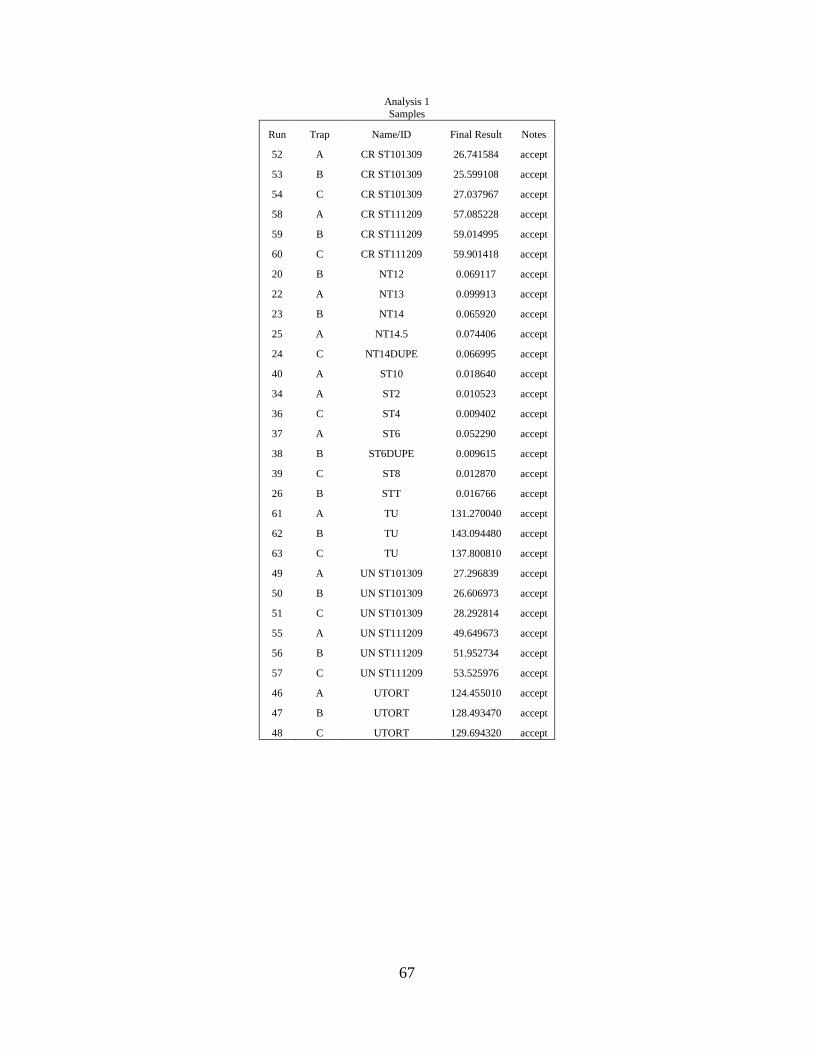
67
Analysis 1 Samples
Run Trap Name/ID Final Result Notes
52 A CR ST101309 26.741584 accept
53 B CR ST101309 25.599108 accept
54 C CR ST101309 27.037967 accept
58 A CR ST111209 57.085228 accept
59 B CR ST111209 59.014995 accept
60 C CR ST111209 59.901418 accept
20 B NT12 0.069117 accept
22 A NT13 0.099913 accept
23 B NT14 0.065920 accept
25 A NT14.5 0.074406 accept
24 C NT14DUPE 0.066995 accept
40 A ST10 0.018640 accept
34 A ST2 0.010523 accept
36 C ST4 0.009402 accept
37 A ST6 0.052290 accept
38 B ST6DUPE 0.009615 accept
39 C ST8 0.012870 accept
26 B STT 0.016766 accept
61 A TU 131.270040 accept
62 B TU 143.094480 accept
63 C TU 137.800810 accept
49 A UN ST101309 27.296839 accept
50 B UN ST101309 26.606973 accept
51 C UN ST101309 28.292814 accept
55 A UN ST111209 49.649673 accept
56 B UN ST111209 51.952734 accept
57 C UN ST111209 53.525976 accept
46 A UTORT 124.455010 accept
47 B UTORT 128.493470 accept
48 C UTORT 129.694320 accept
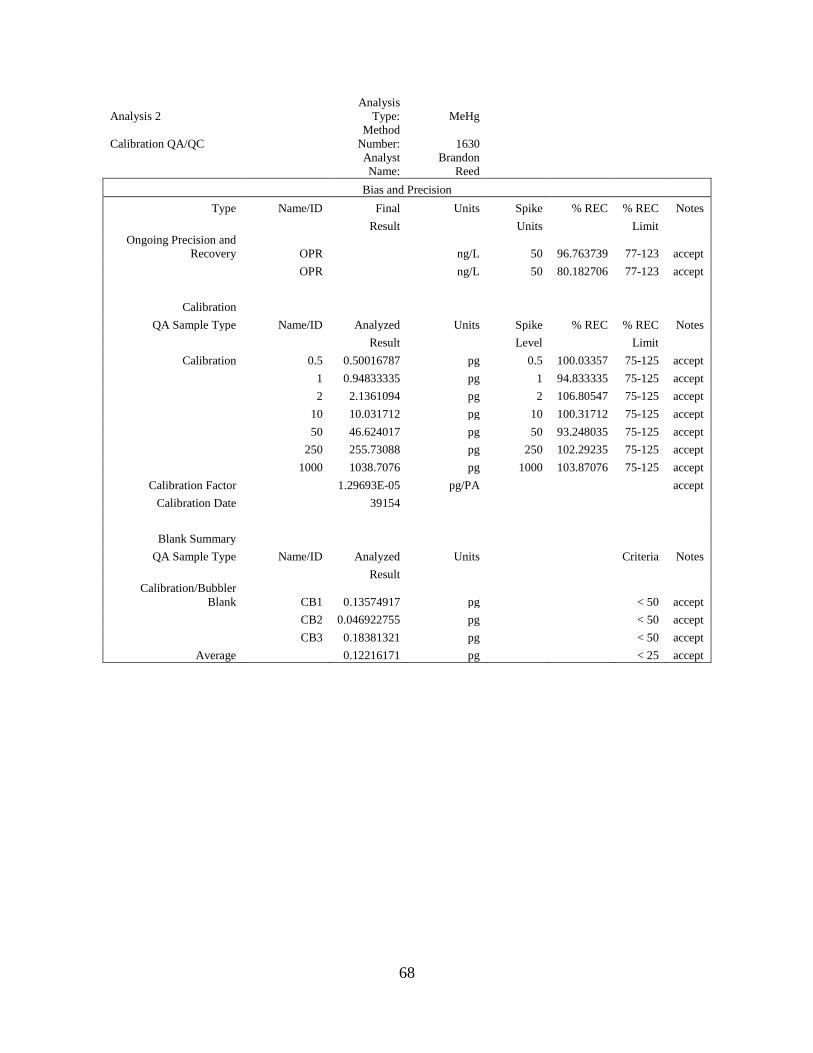
68
Analysis 2
Analysis Type: MeHg
Calibration QA/QC
Method Number: 1630
Analyst Name:
Brandon Reed
Bias and Precision Type Name/ID Final Units Spike % REC % REC Notes
Result
Units
Limit Ongoing Precision and
Recovery OPR
ng/L 50 96.763739 77-123 accept OPR
ng/L 50 80.182706 77-123 accept
Calibration
QA Sample Type Name/ID Analyzed Units Spike % REC % REC Notes
Result
Level
Limit
Calibration 0.5 0.50016787 pg 0.5 100.03357 75-125 accept 1 0.94833335 pg 1 94.833335 75-125 accept 2 2.1361094 pg 2 106.80547 75-125 accept 10 10.031712 pg 10 100.31712 75-125 accept 50 46.624017 pg 50 93.248035 75-125 accept 250 255.73088 pg 250 102.29235 75-125 accept 1000 1038.7076 pg 1000 103.87076 75-125 accept
Calibration Factor
1.29693E-05 pg/PA
accept Calibration Date
39154
Blank Summary
QA Sample Type Name/ID Analyzed Units
Criteria Notes
Result
Calibration/Bubbler Blank CB1 0.13574917 pg
< 50 accept
CB2 0.046922755 pg
< 50 accept CB3 0.18381321 pg
< 50 accept
Average 0.12216171 pg < 25 accept
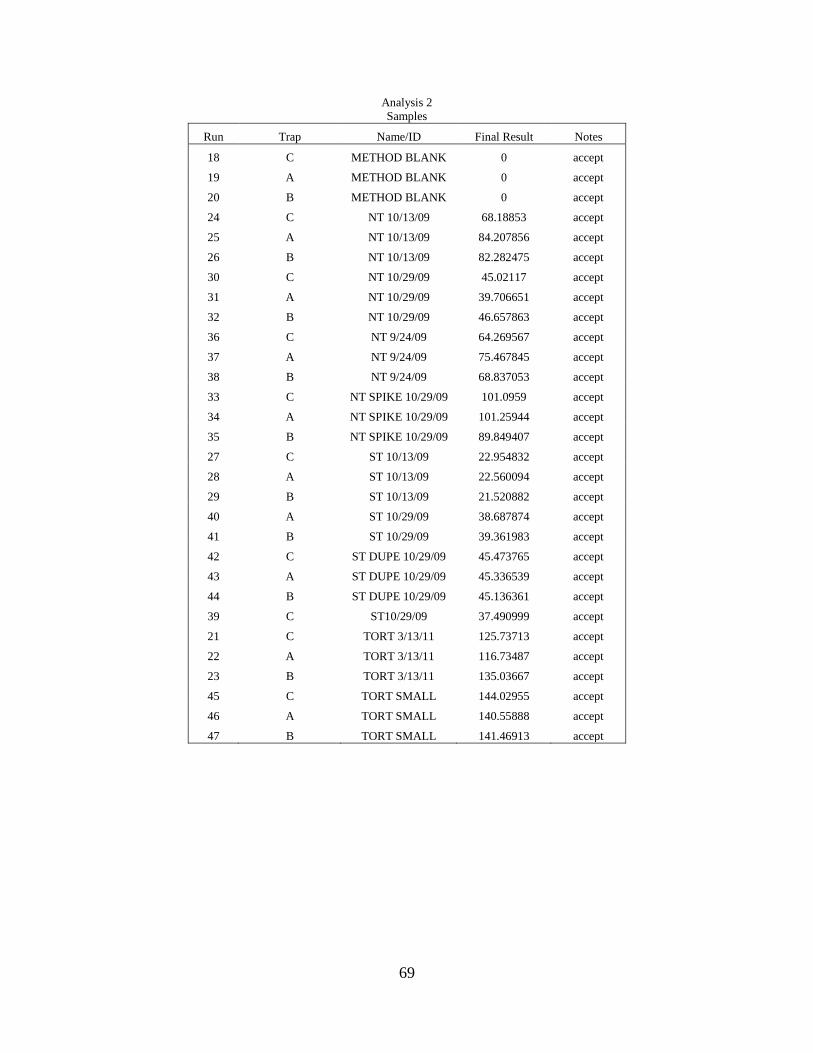
69
Analysis 2 Samples
Run Trap Name/ID Final Result Notes
18 C METHOD BLANK 0 accept
19 A METHOD BLANK 0 accept
20 B METHOD BLANK 0 accept
24 C NT 10/13/09 68.18853 accept
25 A NT 10/13/09 84.207856 accept
26 B NT 10/13/09 82.282475 accept
30 C NT 10/29/09 45.02117 accept
31 A NT 10/29/09 39.706651 accept
32 B NT 10/29/09 46.657863 accept
36 C NT 9/24/09 64.269567 accept
37 A NT 9/24/09 75.467845 accept
38 B NT 9/24/09 68.837053 accept
33 C NT SPIKE 10/29/09 101.0959 accept
34 A NT SPIKE 10/29/09 101.25944 accept
35 B NT SPIKE 10/29/09 89.849407 accept
27 C ST 10/13/09 22.954832 accept
28 A ST 10/13/09 22.560094 accept
29 B ST 10/13/09 21.520882 accept
40 A ST 10/29/09 38.687874 accept
41 B ST 10/29/09 39.361983 accept
42 C ST DUPE 10/29/09 45.473765 accept
43 A ST DUPE 10/29/09 45.336539 accept
44 B ST DUPE 10/29/09 45.136361 accept
39 C ST10/29/09 37.490999 accept
21 C TORT 3/13/11 125.73713 accept
22 A TORT 3/13/11 116.73487 accept
23 B TORT 3/13/11 135.03667 accept
45 C TORT SMALL 144.02955 accept
46 A TORT SMALL 140.55888 accept
47 B TORT SMALL 141.46913 accept

70
Analysis 3
Analysis Type: MeHg
Calibration QA/QC
Method Number: 1630
Analyst Name:
Brandon Reed
Bias and Precision Type Name/ID Final Units Spike Source % REC % REC Notes
Result
Units Result
Limit
Matrix Spike Duplicate
ST 72810 A 130.77981 ng/L 50 69.000128 123.55936 71-125 accept
ST 72810 A 131.17699 ng/L 50 69.000128 124.35373 71-125 accept
Ongoing Precision and Recovery OPR
ng/L 50
97.679898 77-123 accept
OPR
ng/L 50
104.34473 77-123 accept OPR
ng/L 50
86.964809 77-123 accept
OPR
ng/L 50
84.560391 77-123 accept OPR
ng/L 50
98.134036 77-123 accept
Calibration
QA Sample Type Name/ID Analyzed Units Spike
% REC % REC Notes
Result
Level
Limit
Calibration 0.5 0.57344654 pg 0.5
114.68931 75-125 accept 1 0.86772827 pg 1
86.772827 75-125 accept
2 2.1039838 pg 2
105.19919 75-125 accept 10 9.4435141 pg 10
94.435141 75-125 accept
50 54.954312 pg 50
109.90862 75-125 accept 250 220.09488 pg 250
88.037953 75-125 accept
1000 1086.4621 pg 1000
108.64621 75-125 accept Calibration Factor
1.65998E-05 pg/PA
accept
Calibration Date
39154
Blank Summary
QA Sample Type Name/ID Analyzed Units
Criteria Notes
Result
Calibration/Bubbler Blank CB1 0 pg
< 50 accept
CB2 0 pg
< 50 accept CB3 0.064423927 pg
< 50 accept
Average
0.021474642 pg
< 25 accept
Method Blank B METH B 2.1260615 pg
< 0.7 accept
METH B 0.70111581 pg
< 0.7 accept
METH B 0.14160205 pg
< 0.7 accept
Average 0.98959312 ng/L

71
Analysis 3 Samples
Run Trap Name/ID Final Result Notes
22 A 31910 TORT 2 187.82719 accept
23 B 31910 TORT 2 180.38388 accept
21 C 31910 TORT2 190.97826 accept
24 C NT 72810 174.57495 accept
25 A NT 72810 174.00244 accept
26 B NT 72810 176.33404 accept
37 A NT 81110 175.94375 accept
38 B NT 81110 172.30077 accept
39 C NT 81110 174.98719 accept
47 B NT 82710 162.30575 accept
48 C NT 82710 170.42983 accept
49 A NT 82710 167.67919 accept
50 B NT 82710 DUPE 179.64651 accept
51 C NT 82710 DUPE 182.21704 accept
52 A NT 82710 DUPE 181.67979 accept
63 C NT 92410 191.73312 accept
64 A NT 92410 194.86828 accept
65 B NT 92410 185.18597 accept
32 B ST 72810 68.430058 accept
33 C ST 72810 69.022475 accept
31 A ST 72810 A 69.000128 accept
40 A ST 81110 42.268964 accept
41 B ST 81110 43.417876 accept
42 C ST 81110 45.420341 accept
55 A ST 82710 30.185845 accept
53 B ST 82710 30.392224 accept
54 C ST 82710 A 30.957333 accept
66 C ST 92410 37.667672 accept
67 A ST 92410 36.720072 accept
68 B ST 92410 35.567633 accept
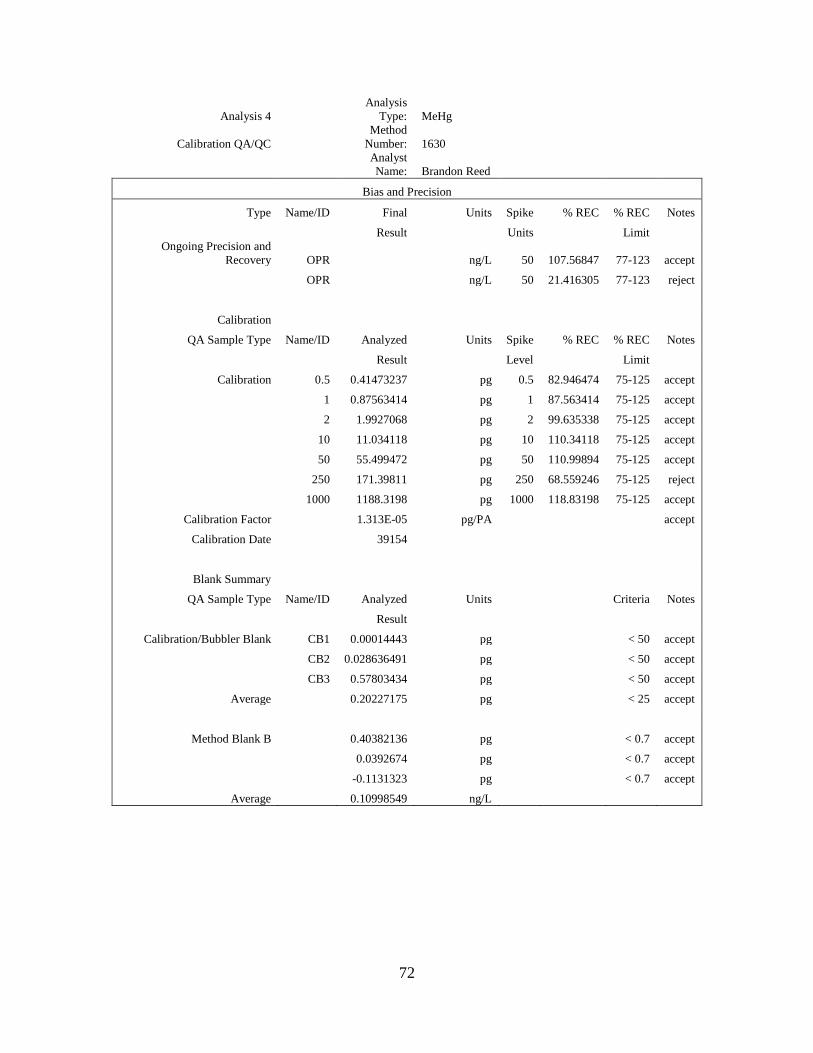
72
Analysis 4
Analysis Type: MeHg
Calibration QA/QC
Method Number: 1630
Analyst Name: Brandon Reed
Bias and Precision
Type Name/ID Final Units Spike % REC % REC Notes
Result
Units
Limit Ongoing Precision and
Recovery OPR
ng/L 50 107.56847 77-123 accept
OPR
ng/L 50 21.416305 77-123 reject
Calibration
QA Sample Type Name/ID Analyzed Units Spike % REC % REC Notes
Result
Level
Limit
Calibration 0.5 0.41473237 pg 0.5 82.946474 75-125 accept
1 0.87563414 pg 1 87.563414 75-125 accept
2 1.9927068 pg 2 99.635338 75-125 accept
10 11.034118 pg 10 110.34118 75-125 accept
50 55.499472 pg 50 110.99894 75-125 accept
250 171.39811 pg 250 68.559246 75-125 reject
1000 1188.3198 pg 1000 118.83198 75-125 accept
Calibration Factor
1.313E-05 pg/PA
accept
Calibration Date
39154
Blank Summary
QA Sample Type Name/ID Analyzed Units
Criteria Notes
Result
Calibration/Bubbler Blank CB1 0.00014443 pg
< 50 accept
CB2 0.028636491 pg
< 50 accept
CB3 0.57803434 pg
< 50 accept
Average
0.20227175 pg
< 25 accept
Method Blank B
0.40382136 pg
< 0.7 accept
0.0392674 pg
< 0.7 accept
-0.1131323 pg
< 0.7 accept
Average 0.10998549 ng/L

73
Analysis 4 Samples
Run Trap Name/ID Final
Result Notes
24 C NT 51910 16.54 accept
25 A NT 51910 38.41 accept
26 B NT 51910 36.69 accept
30 C NT 62910 36.19 accept
31 A NT 62910 111.9 accept
32 B NT 62910 105 accept
27 C ST 51910 7.427 accept
28 A ST 51910 18.68 accept
29 B ST 51910 17.48 accept
33 C ST 62910 15 accept
34 A ST 62910 54.27 accept
35 B ST 62910 48.79 accept
21 C TORT 70.17 accept
22 A TORT 145.8 accept
23 B TORT 137.7 accept

74
Analysis 5 Analysis
Type: MeHg
Calibration QA/QC Method
Number: 1630
Analyst Name:
Brandon Reed
Bias and Precision Type Name/ID Final Units Spike % REC % REC Notes
Result
Units
Limit
Matrix Spike STT 1.1052074 ng/L 1 109.29567 71-125 accept ST8 1.0738719 ng/L 1 105.5979 71-125 accept
ST 11/12/09 A 103.06845 ng/L 50 79.149415 71-125 accept
Matrix Spike Duplicate ST 11/12/09 A 108.20889 ng/L 50 89.430296 71-125 accept
ST 11/12/09 A 106.87917 ng/L 50 86.770859 71-125 accept
Ongoing Precision and Recovery OPR
ng/L 50 88.862842 77-123 accept OPR
ng/L 50 93.562143 77-123 accept
OPR
ng/L 50 88.813076 77-123 accept OPR
ng/L 50 97.180811 77-123 accept
Calibration
QA Sample Type Name/ID Analyzed Units Spike % REC % REC Notes
Result
Level
Limit
Calibration 0.5 0.25793287 pg 0.5 51.586573 75-125 reject 1 0.88298462 pg 1 88.298462 75-125 accept 2 2.0018881 pg 2 100.0944 75-125 accept 10 11.17158 pg 10 111.7158 75-125 accept 50 48.468186 pg 50 96.936372 75-125 accept 250 251.11593 pg 250 100.44637 75-125 accept 1000 1,056.94 pg 1000 105.69356 75-125 accept
Calibration Factor
1.38164E-05 pg/PA
accept
Calibration Date
3/14/2011
Blank Summary
QA Sample Type Name/ID Analyzed Units
Criteria Notes
Result
Calibration/Bubbler Blank CB1 0.19685538 pg
< 50 accept
CB2 0.13639503 pg
< 50 accept CB3 0.18471081 pg
< 50 accept
Average
0.17265374 pg
< 25 accept Method Blank A MB1 0.18560427 pg
< 0.5 accept
MB2 0.30220046 pg
< 0.5 accept Average
0.24390236 ng/L
Method Blank B MB 0.98970213 pg
< 0.7 accept MB -0.17265374 pg
< 0.7 accept
MB -0.17265374 pg
< 0.7 accept Average 0.21479822 ng/L

75
Analysis 5 Samples
Run Trap Name/ID Final Result Notes
51 C NT 5/7/10 27.642048 accept
52 A NT 5/7/10 26.813294 accept
53 B NT 5/7/10 26.457984 accept
54 C NT 5/7/10 DUPE 27.453347 accept
55 A NT 5/7/10 DUPE 27.384173 accept
56 B NT 5/7/10 DUPE 26.766042 accept
42 C ST 11/12/09 0.0027059 accept
43 A ST 11/12/09 65.701924 accept
41 B ST 11/12/09 A 63.493742 accept
57 C ST 5/7/10 26.829839 accept
58 A ST 5/7/10 26.887236 accept
59 B ST 5/7/10 26.497914 accept
38 B ST 9/24/09 114.4567 accept
39 C ST 9/24/09 98.063198 accept
40 A ST 9/24/09 97.066833 accept
22 A ST2 0.0064569 accept
23 B ST4 0.0063953 accept
24 C ST4DUPE 0.0076123 accept
25 A ST6 0.0115583 accept
26 B ST8 0.0178929 accept
20 B STT 0.0122508 accept
35 B TORT 3/16 152.30865 accept
36 C TORT 3/16 157.65591 accept
37 A TORT 3/16 158.8145 accept

76
Thermoclines (m) North Twin South Twin
5/16/2009 8 7 5/28/2009 5 5 6/10/2009 5 6 6/29/2009 5 7 7/22/2009 5 7 8/12/2009 6 7 8/29/2009 7 X 9/3/2009 6 8
9/24/2009 7 9 10/8/2009 Isothermic 11
10/17/2009 Isothermic 11 10/29/2009 Isothermic 13 4/21/2010 4 3 5/6/2010 x 8 6/8/2010 6 7
6/28/2010 5 5 7/13/2010 5 6 7/27/2010 5 6 8/10/2010 5 7 8/26/2010 6 8 9/9/2010 6 9
9/23/2010 7 9 10/7/2010 7 10

77
North Twin Volume Data Depth Surface Area Volume Below Depth Interval Volume per
(m) of Plane (m2) Plane (m3) m 1 m strata (m3) 0 3,155,645 32,371,943 0-1 3,102,651 1 3,034,020 29,269,292 1-2 2,951,090 2 2,880,569 26,318,202 2-3 2,816,424 3 2,760,818 23,501,778 3-4 2,711,328 4 2,669,160 20,790,450 4-5 2,624,315 5 2,584,196 18,166,135 5-6 2,540,368 6 2,501,738 15,625,767 6-7 2,458,214 7 2,417,153 13,167,553 7-8 2,366,080 8 2,313,680 10,801,472 8-9 2,246,577 9 2,179,936 8,554,896 9-10 2,108,602 10 2,035,861 6,446,294 10-11 1,945,290 11 1,845,931 4,501,004 11-12 1,707,657 12 1,552,675 2,793,348 12-13 1,367,812 13 1,168,329 1,425,536 13-14 962,655 14 741,659 462,881 14-15 449,626 15 122,012 13,254 15-bottom 13,254
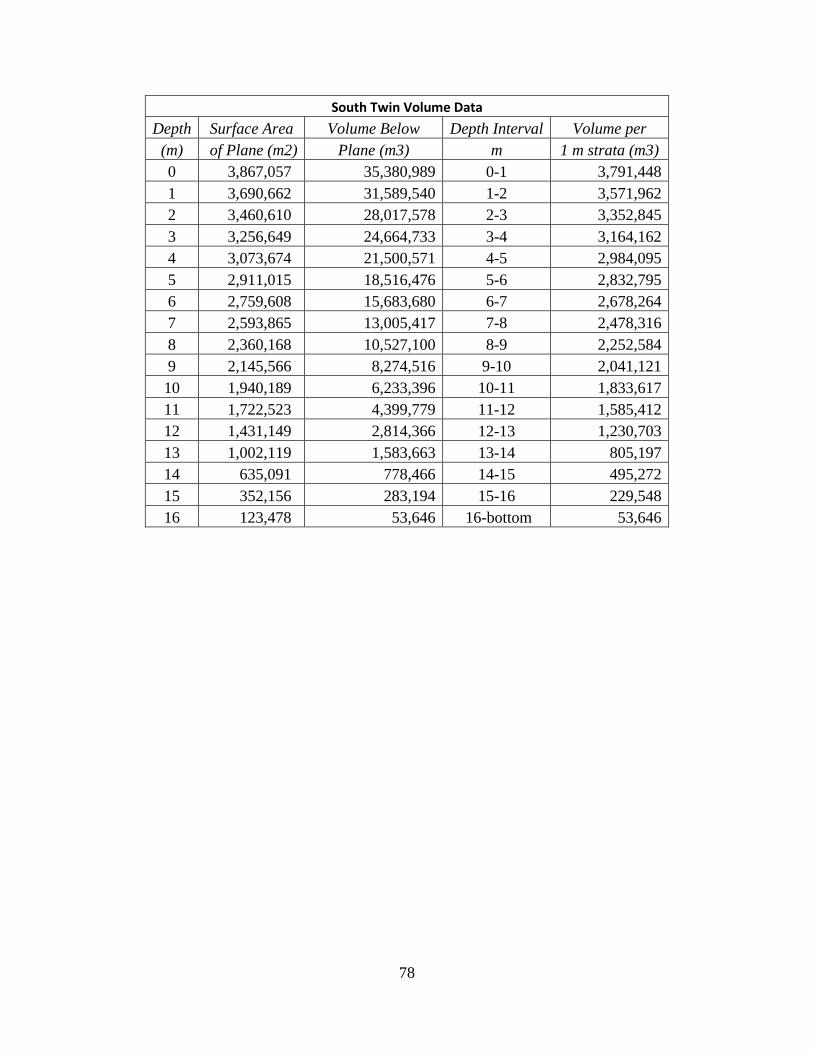
78
South Twin Volume Data
Depth Surface Area Volume Below Depth Interval Volume per (m) of Plane (m2) Plane (m3) m 1 m strata (m3) 0 3,867,057 35,380,989 0-1 3,791,448 1 3,690,662 31,589,540 1-2 3,571,962 2 3,460,610 28,017,578 2-3 3,352,845 3 3,256,649 24,664,733 3-4 3,164,162 4 3,073,674 21,500,571 4-5 2,984,095 5 2,911,015 18,516,476 5-6 2,832,795 6 2,759,608 15,683,680 6-7 2,678,264 7 2,593,865 13,005,417 7-8 2,478,316 8 2,360,168 10,527,100 8-9 2,252,584 9 2,145,566 8,274,516 9-10 2,041,121 10 1,940,189 6,233,396 10-11 1,833,617 11 1,722,523 4,399,779 11-12 1,585,412 12 1,431,149 2,814,366 12-13 1,230,703 13 1,002,119 1,583,663 13-14 805,197 14 635,091 778,466 14-15 495,272 15 352,156 283,194 15-16 229,548 16 123,478 53,646 16-bottom 53,646