effects of kibble characteristics on feeding behaviour in cats · hardness tester (amadeus kahl...
TRANSCRIPT

Effects of kibble characteristics on feeding
behaviour in cats
Agata Teresa Kozuchowicz
August, 2018
Wageningen University and Research:
Student registration number: 870914-471-050
Course code: ANU-80430
Aarhus University
Student registration number: 201604359
Course code: 210122U004
Supervisors:
Dr.ir. Thomas van der Poel
Associate Professor at Animal Nutrition Group
Department of Animal Sciences
Wageningen University and Research, the Netherlands
Dr.ir. Guido Bosch
Researcher at Animal Nutrition Group
Department of Animal Sciences
Wageningen University and Research, the Netherlands
Dr Helle Nygaard Lærke
Senior Researcher at Molecular Nutrition and Reproduction Group
Department of Science and Technology
Aarhus University, Denmark

Copyright
No part of this publication may be reproduced and/or published in any form or by any means,
electronic, mechanical, photocopying, recording or otherwise, without prior written permission
of the head of the Animal Nutrition Group of Wageningen University, The Netherlands.

Abstract
Research on the effect of extrusion on nutrients (proteins, starch and lipids) and texture
preferences of pet food and cat feeding behaviour are often held by the manufactures, but most
of the time are confidential. Consequently, there is only a limited public knowledge about the
influence of the different variables of kibble characteristics on the feline ingestion behaviour.
Studies in other species have shown that eating/feeding behaviour influences health to a
significant extent. Therefore, the primary aim of this project was to find out how the physical
and chemical properties of dry foods, translate into the way cats eat these foods. The secondary
aim was, to evaluate the precision of available texture measurement methodologies. Based on
shape and macronutrients level, 18 commercially available dry cat food kibbles were selected.
Texture parameters were measured by a texture analyser (Instron 3366) with four different
probes: platen, blade, cone and cat model. Additionally, hardness was evaluated by Kahl pellet
hardness tester (Amadeus Kahl Nachf 2057) and Soltac tablet hardness tester (MT 50). From
the 18 foods, twelve foods were chosen for in vivo ingestion behaviour evaluation based on
their physical (shape, hardness, surface area) and chemical characteristics. Each food was tested
in a randomised pattern, by eight domestic European shorthair cats. During the tests, cats were
recorded by a Go Pro camera (JVC Everio, Model GZ-MS150HE). The time of ingestion [s]
and a number of chews [rate per min (rpm)] were obtained by analysing obtained recordings.
The chemical composition did not explain the variation found in measured hardness values
among kibbles irrespective of the method of measurement (P>0.1). Ingestion time increased
with 0.93 s per %-unit of crude protein (P=0.013) and decreased with 10.69 s per kg of hardness
measured with the cat model probe on the Instron (P<0.001). Shape influenced biting rate
(P<0.001) with cats biting most on turbine-shaped kibbles (9.7±1.1; P=0.001) and triangle-
shaped kibbles (3.2±1.1) tended to be eaten with fewer bites than disc-shaped kibbles (5.4±1.1,
P=0.065). The biting rate decreased with 0.65 units per %-unit of crude protein (P<0.001). The
biting rate increased with 1.83 rpm per kg of hardness measured with the cat model on the
Instron (P=0.048). The lowest variability of results provides blade probe and the highest the cat
model probe. The outcomes give an inside of how cat food kibble characteristics are related to
eating behaviour and introduce precision of several texture evaluation methods.
Keywords: cat food texture; kibble hardness; biting rate; ingestion speed; chewiness
Table of content
1 Introduction ......................................................................................................................... 1
2 Literature review ................................................................................................................. 2
2.1 Texture parameters of food and methods of evaluation .............................................. 2
2.2 Texture Testing in the Pet Food Industry .................................................................... 6
2.3 Influence of macronutrient composition on kibble texture and palatability ................ 8
2.3 Feeding behaviour of cats .......................................................................................... 14
2.4 Influence of kibble physical characteristics on feeding behaviour ............................ 15
3 Hypothesis and research questions ................................................................................... 17
4 Material and methods ........................................................................................................ 18
4.1 Food selection ............................................................................................................ 18
4.2 Physical characteristics .............................................................................................. 19
4.3 Eating behaviour in vivo test ..................................................................................... 22
4.4 Calculations and statistical analysis ........................................................................... 23
5 Results ............................................................................................................................... 24
6 Discussion ......................................................................................................................... 28
7 Conclusion ........................................................................................................................ 31
8 Recommendations ............................................................................................................. 31
9 Literature references: ........................................................................................................ 32
Appendix I. Total number of texture measurements made with Instron .................................. 36
Appendix II. Correction formula for cat model probe ............................................................. 39
Appendix III. Detailed intake protocol ..................................................................................... 40
Appendix IV. Hardness mean ± SD, and CV, its average and range of investigated kibbles .. 58
Appendix V. Ingredients of experimental foods ...................................................................... 59
Appendix VI. Additional data .................................................................................................. 61

1
1 Introduction
Cats have become one of the most popular companion animals in the Western World. The
pet food companies aim to produce foods supporting long-term wellbeing due to increasing
cat lifetime. Expansion of the feline life and change in habits contribute to certain health
issues, such as dental problems, obesity and impaired functionality of inner organs (Shreve
et al., 2017). Pet food manufacturers try to come across those issues by improving nutritional
composition and texture properties of produced foods (Bradshaw et al., 2012).
Extruded cat food is a complete, easy to apply, safe and relatively cheap food with a long
shelf life. Therefore, kibbles are the most popular type of food offered to cats, and the
demand for it is still growing. In 2016 the global production of extruded pet food reached 25
million tons, and in the 2017 28 million tons (Pet Food Industry, 2018). Kibbles differ a lot
in nutrient composition and physical characteristics from the food available for felines in
(Deursen, 2017). In pet food science, ingestion behaviour and food preferences are referred
to palatability, what is usually described as mouth-feel (hardness, shape, surface area, etc.),
taste and aroma. The chemical and physical properties of kibbles are influenced by the
quality and kind of used ingredients, nutrient composition and processing conditions (Éles
et al., 2014). Research on the effect of extrusion on nutrients (proteins, starch and lipids) and
texture preferences of pet food and cat feeding behaviour are often held by the manufactures,
but most of the time are confidential. Therefore, there is only a limited public knowledge
about the influence of the different variables of kibble characteristics on the feline ingestion
behaviour. Studies in other species have shown that eating/feeding behaviour influences
health to a significant extent. For example obesity research in humans suggests that multiple
chews before swallowing decrease size of eaten meal lowering at the same time eating rate
and overall energy consumption, which helps to avoid digestion disorders and control weight
(Shah et al. 2014, Zhu et al., 2014). Furthermore, veterinarian publications stress out that the
prevalence of periodontal diseases in pets ranges from 60% to more than 80% (Niemiec,
2010). Tartar development on the teeth provides an excellent environment for the growth of
microorganisms, which causes unpleasant breath, inflammation and development of diseases
(Éles et al., 2014). Bailoni et al. (2005) suggested, that hardness of kibbles can be negatively
correlated with tartar formation and that certain physical properties of kibbles can benefit
the oral health of pets.
The introduction is followed by the literature review that describes the texture characteristics
of food and methods of their evaluation, the influence of inclusion of macronutrients on
texture properties of kibbles and feeding behaviour in cats. The next part introduces the
hypothesis and research questions. Thereafter, the methodology of kibble selection, the
texture measurements methods and the in vivo investigation of feeding behaviour are
explained. Next two chapters introduce and discuss the results, what is followed by the
conclusion and recommendations for further studies. Later, the list of publications referred
in this report is presented. Lastly, the appendix with additional information on performed
research is included.

2
2 Literature review
2.1 Texture parameters of food and methods of evaluation
Texture is an important characteristic of all extruded food products. Several researchers
measured the texture of dry pet food using instrumental analysis (e.g. Bailoni et al., 2005, Figge
et al., 2011, Éles et al. 2014, Monti et al., 2016), but there is no agreement regarding
methodology and which terms should be used, or if those terms are correlated with sensory
texture perceived by cat or dog.
According to Szczesniak’s initial research (1963), food texture is a sensory manifestation of
structure and the way in which the structure responds to the forces applied. It depicts the
junction of the mechanical (e.g. hardness, fracturability, chewiness), geometrical (e.g. shape,
size, particle orientation inside the food) and superficial (features related to the perception of
moisture or fat content) characteristics of a food sample (Table 1). Those parameters are
determined by the response of tested food to the applied stress of teeth, tongue and pallet while
the ingestion process (sensory investigation) is imitated by various texture objective tests
(mechanical investigation).
Table 1. Classification of textural characteristics*
Mechanical characteristics
Primary parameters Secondary parameters Popular term
Hardness Soft → Firm → Hard
Cohesiveness Brittleness/ Fracturability Crumbly → Crunchy → Brittle Chewiness Tender → Chewy → Tough Gumminess Short → Mealy → Pasty/Gummy
Viscosity Thin → Viscous
Springiness/Elasticity Plastic → Elastics
Adhesiveness Sticky → Tacky / Gooey
Geometrical characteristics
Class Examples
Particle size and shape Gritty, grainy, coarse, etc.
Particle shape and orientation Fibrous, cellular, crystalline, etc.
Other parameters
Primary parameters Secondary parameters Popular terms
Moisture content Dry → Moist → Wet → Watery
Fat content Oiliness Oily Greasiness Greasy
Szczesniak et al., 1963
Within the instrumental test machines, texturometers (Figure 1a) mimic the mastication
conditions in the mouth cavity and the obtained texture profile of a sample is correlated with
sensory evaluations of texture by humans (Szczesniak et al., 1963). This is why texture profile
analysers have been broadly used to evaluate the texture in food and later on in feed industry.
The technique of the texture profile analysis (TPA) contains several steps. First, the food sample
(standard bite-size) is placed on the base plate, then the platen probe compress and decompress
the specimen twice (Figure 1b; Bourne et al., 2002). The result of a measurement is a force-
time curve that depicts the texture characteristics of a sample with several parameters. A typical
TPA force-time curve is shown in Figure 2 (Bourne, 2002).

3
Figure 1. a) Example of a Texture Analyzer (TA.XT Plus, Texture Technologies, Scarsdale,
NY); b) Schema of the two-compressions test for the regular TPA: A- downstroke actions
during first and second compression, B-upstroke actions during the first and second
compression (Bourne, 2002)
Figure 2. TPA force-time curve obtained during double compression test with platen probe
(Bourne, 2002)
b a
moving platen
food sample
base
first bite
second bite
a A
A B
B

4
Figure 3. TPA of a kibble during a single compression with platen probe. Hardness (N) is
defined as the maximum achieved force during compression, fracturability (N) is the maximal
force of the first peak, chewability is the calculated positive area under the force curve, and
adhesiveness is the calculated negative area under the force curve (internal data, WUR 2018).
Civille et al. (1973) concluded that hardness is the force necessary to achieve deformation of a
food sample during mastication to compress a food between molars (Table 2). It is expressed
in kilogram (kg) or Newton (N). In the force-time curve created during the TPA test in the peak
of power reached during the first compression.
Cohesiveness is the force of internal bonds (structural integrity) that allows to withstands
compressive or tensile stress (Table 2). A product with a high cohesion is more tolerant to the
handling stress (packaging and transportation).
Elasticity (springiness) was described by Civille et al. (1973) as the recovered distance of food
sample of its original shape after deforming power is removed (Table 2). It is the height that
the sample retrieves during the time between the end of the first cycle and the start of the second
cycle in a double compression test.
Szczesniak and Civile defined adhesiveness as the adherence of the food to the palate and teeth,
or as the force needed to overcome the adherence between the surface of food and mouth cavity,
that the sample has contact with (teeth, palate, tongue). As the sensory feature, adhesives is
defined as the necessary force needed to remove the food material that adheres to the mouth
cavity (mainly the palate) during the usual ingestion process (Table 2, Szczesniak et al., 1963;
Civille et al., 1973). It is the negative part for the first chew, representing the effort to pull the
probe of the sample after compression. Inelastic foods are never adhesive (Novaković et al.,
2017).
5
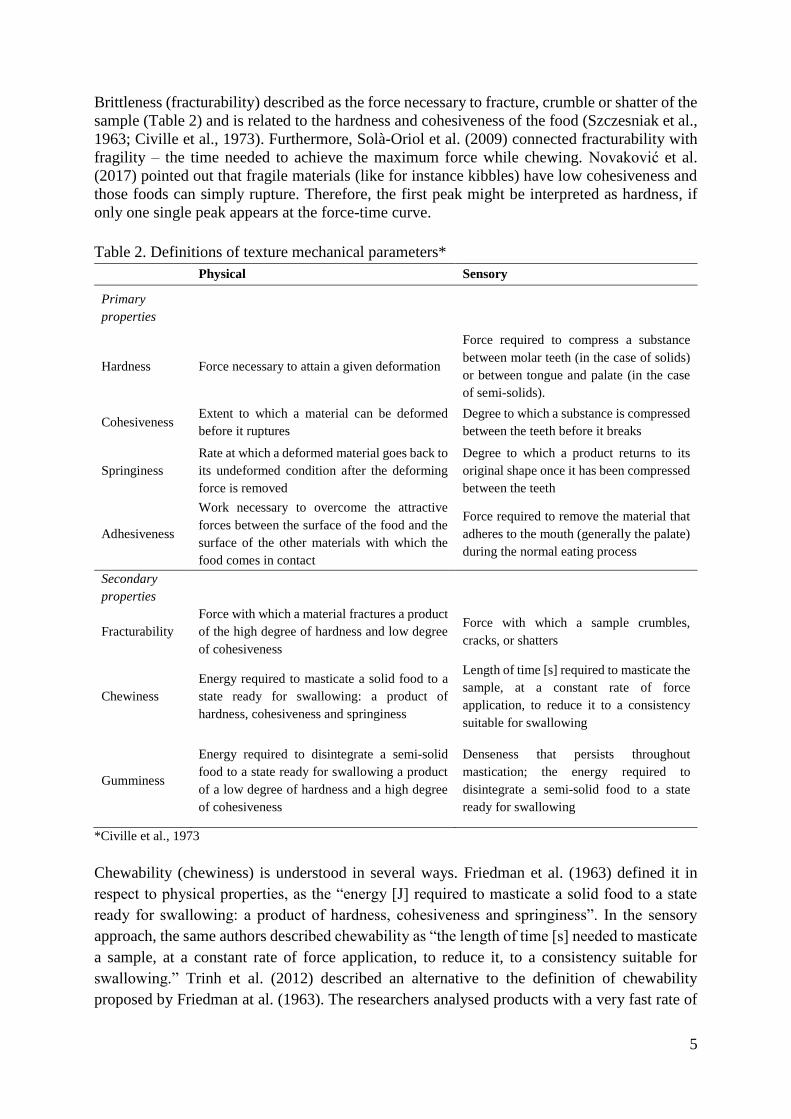
Brittleness (fracturability) described as the force necessary to fracture, crumble or shatter of the
sample (Table 2) and is related to the hardness and cohesiveness of the food (Szczesniak et al.,
1963; Civille et al., 1973). Furthermore, Solà-Oriol et al. (2009) connected fracturability with
fragility – the time needed to achieve the maximum force while chewing. Novaković et al.
(2017) pointed out that fragile materials (like for instance kibbles) have low cohesiveness and
those foods can simply rupture. Therefore, the first peak might be interpreted as hardness, if
only one single peak appears at the force-time curve.
Table 2. Definitions of texture mechanical parameters*
Physical Sensory
Primary
properties
Hardness Force necessary to attain a given deformation
Force required to compress a substance
between molar teeth (in the case of solids)
or between tongue and palate (in the case
of semi-solids).
Cohesiveness Extent to which a material can be deformed
before it ruptures
Degree to which a substance is compressed
between the teeth before it breaks
Springiness
Rate at which a deformed material goes back to
its undeformed condition after the deforming
force is removed
Degree to which a product returns to its
original shape once it has been compressed
between the teeth
Adhesiveness
Work necessary to overcome the attractive
forces between the surface of the food and the
surface of the other materials with which the
food comes in contact
Force required to remove the material that
adheres to the mouth (generally the palate)
during the normal eating process
Secondary
properties
Fracturability
Force with which a material fractures a product
of the high degree of hardness and low degree
of cohesiveness
Force with which a sample crumbles,
cracks, or shatters
Chewiness
Energy required to masticate a solid food to a
state ready for swallowing: a product of
hardness, cohesiveness and springiness
Length of time [s] required to masticate the
sample, at a constant rate of force
application, to reduce it to a consistency
suitable for swallowing
Gumminess
Energy required to disintegrate a semi-solid
food to a state ready for swallowing a product
of a low degree of hardness and a high degree
of cohesiveness
Denseness that persists throughout
mastication; the energy required to
disintegrate a semi-solid food to a state
ready for swallowing
*Civille et al., 1973
Chewability (chewiness) is understood in several ways. Friedman et al. (1963) defined it in
respect to physical properties, as the “energy [J] required to masticate a solid food to a state
ready for swallowing: a product of hardness, cohesiveness and springiness”. In the sensory
approach, the same authors described chewability as “the length of time [s] needed to masticate
a sample, at a constant rate of force application, to reduce it, to a consistency suitable for
swallowing.” Trinh et al. (2012) described an alternative to the definition of chewability
proposed by Friedman at al. (1963). The researchers analysed products with a very fast rate of

6
breakdown (what could relate to crispiness) and with a very slow rate of breakdown (what could
relate to toughness). They concluded that chewability is “the energy required to disintegrate the
food until it is ready to swallow” and it is a sum of energies expanded in each successive bite.
Paula et al. (2014) interpreted chewiness as “the number of chews necessary for food to be
swallowed” while investigating the texture properties of extruded snacks. Different approaches
to measuring chewability were introduced by Ambros et al. (1998) and Solà-Oriol et al. (2009).
Ambros et al. (1998) discussed the advantages of axial above radial breaking forces in
investigating the chewiness of tablets by using the three-point flexure tensile strength test. Solà-
Oriol et al. (2009) expressed chewiness (kg*mm) as the positive area under the curve during
evaluation of extruded food for swine in one compression test (Figure 3).
Gumminess is understood as the energy obligatory to disintegrate a semi-solid food sample to
a state allowing swallow (Table 2). It is a characteristic only for foods with low hardness and
calculated by multiplication of hardness and cohesiveness (Civille et al., 1973, Novaković et
al., 2017).
2.2 Texture Testing in the Pet Food Industry
According to information provided by Food Technology Corporation. The food industry
improved the basic TPA developed by Szczesniak et. al. (1963). Next, to the original platen
probe, it is proposed, to use different kinds of probes (cylinders, cones, knives etc.).
Consequently, in pet food industry apart from the basic compression TPA, there are four
additional methods of mechanical testing for sensory texture attributes: penetration and
puncture tests, shear tests, tension tests and snap, bend and break tests.
Penetration and puncture tests are conducted to obtain measures of hardness, bite force of a
sample and firmness. Penetration can be done with cone or needle probes (Figure 4a,b). A
variation of this method is a multiple point penetration test to measure firmness in canned wet
food.
Shear tests can measure the average hardness, tenderness, bite strength, and cook quality by
cutting the sample with a blade (Figure 4c,d) that mimic the action applied by the edge of teeth.
Tension tests (Figure 4e) help to assess the elasticity of chewy treats. During tension evaluation,
the texture analyser pulls or stretches the test sample, to measure the elasticity and the ultimate
strength of the product.
The Snap, Bend and Break method is a three-point bend test (figure 4f) is suitable for measuring
brittleness or flexibility of bar-shaped treats and their bend strength. According to (Bourne et
al., 2002) above methods should not be considered as the texture profile analyse developed by
Szczesniak et. al. (1963).

7
Figure 4. Examples of probes for texture analyser tasting in feed industry: a) 30° cone; b) needle
ø 3 mm, 25 mm long; c) knife blade with 45° chisel end; d) incisor knife blade; e) tensile grips;
f) three-point bend rig (TTC, 2018)
There are also several other methods for fast evaluation of texture properties. For instance, Kahl
pallet hardness tester was the first practical instrument that was widely used in the feed industry.
In this device, the specimen (single pellet) is placed between two bars and compressed at a
constant load rate until it brakes, and the breaking force recorded. Twelve measurements are
performed from which the highest and the lowest are skipped. The mean of 10 repetitions gives
a value called ‘Kahl-hardness’ (Van der Poel et al., 1996, Figure 5a). Another alternative for
testing hardness of dry pet food could be instruments used in pharmaceutical industry for
evaluating the hardness of tablets such as Monsanto tester, Strong-cobb tester, Pfizer tester or
Schleuniger tester.
The Monsanto Hardness Tester (Figure 5b) was developed in the 1979 year by Monsanto
Research in Miamisburg, OH, in the USA. The tester consists of a barrel with a compressible
spring held between two plungers. The lower plunger is put in contact with the specimen, and
a zero reading is taken. The upper plunger is then pushed against a spring by turning a threaded
screw until the sample breaks. When a spring is compressed, a pointer moves along a gauge in
the barrel to indicate the applied force. The breaking force is recorded and a zero reading is
deducted from it (McCallum et al., 1955).
The Strong-cobb tester (Figure 5c) is built out of a piston activated by pumping a lever arm,
which presses an anvil against a stationary platform with hydraulic pressure. The fracturing
force of a specimen is seen at the hydraulic gauge.

8
The Pfizer tester (Figure 5d) works on the same principle as a pair of pliers. When the plier's
grips are squeezed, the specimen is compressed between a holding anvil and a piston attached
to a reading gauge. The dial indicator stays at the reading where the specimen breaks and it
returns to zero after pushing the reset button (Fairchild et al., 1961).
The Schleuniger Pharmaton tester (Figure 5e) works in a horizontal position. An anvil,
controlled by an electrical motor, pushes on a specimen at statically increasing force until the
sample breaks. The braking force is taken from a scale indicator (Pharmatron, 2018).
Figure 5. Examples of hardness testers in feed and pharmaceutical industry: a) Kahl Pellet
Hardness Tester, model K3175-0000 (Industrial World, 2018); b) Monsanto Hardness Tester
(Farmalabor Tech, 2018); c) Strong Cobb Tablet Hardness Tester, model Sht 17 (Tim Trade,
2018); d) Pfizer tester (Pharmacy Instruments India, 2018); e) Schleuniger Pharmaton tester,
model MT50 (Cobra, 2018)
2.3 Influence of macronutrient composition on kibble texture and palatability
Extrusion
Extrusion is a complex process involving various operations, such as mixing, conveying,
heating, kneading, shearing, and shaping. Firstly, the raw materials are ground to the desired
size of particles and mixed. Then, the dry powder is passed through a pre-conditioner, in which
wet ingredients (meat, fat and water) are added. Afterwards, hot steam is injected to the mash
what induces the cooking process and then the mixture is pressed through an extruder (Tran,
2008). The extruder is built of a stationary barrel with a tightly fitting rotating screw inside,
ending with a die. The extruder's rotating screw forces the mash through the die and cut by
rotating blades to the required length. The kibbles expand, release moisture and heat. In the end,
they are cooled, dried and coated with palatability enhancer (Ye et al., 2018). The thermal
energy and the shearing effect created in the extrusion process, provoke physicochemical

9
reactions in the dough. The mash ingredients undergo numerous order-disorder changes,
gelatinization of starch, denaturation of protein and form variety complexes between them and
other nutrients. The characteristics of raw materials and the processing parameters determine
the nutritional value, structure and texture features of extruded foods (Tran, 2008). In general,
every food consists of protein, fats, carbohydrates (starch and fibres), and water.
Starch
Starch is made of two α-glucan polymer molecules, amylopectin and amylose. Native starch is
stored in plants in the form of partially crystalline granules characteristic for every species. In
an extruder, starch granules are processed with water. They hydrate, swell, break down and
degrade, changing at the end into a viscoelastic mass, which expands right after leaving the die
(Moraru et al., 2003). The expansion ratio of starch during the extrusion process and its
influence on extrudate physical properties have been studied in many research studies. In
general, the higher inclusion of starch, the higher expansion of kibbles, but the results are
inconsistent in obtained expansion degree of extrudates. Ye et al. (2018) concluded, that the
differences are due to the specific structure of different starch sources, characteristics of other
raw materials, and the interactions of starch with them, as well as the inconsistency in
processing conditions.
Figure 6. Scheme of the changes in starch granules during extrusion (Ye et al., 2018)
Commercially available foods for companion animals contain a high level of starch (Hewson-
Hughes et al. 2013). Domestic animals, like herbivores, are used to high levels and complex in
structure. Data in feline behavioural studies signify, that there is a ceiling amount (300 kJ) of
carbohydrates that cat can efficiently ingest per day and higher inclusion will reduce food intake
(Hewson-Hughes et al., 2013).

10
Protein
The protein inclusion of any pet food is the most nutritionally important and most expensive
constituent of the four major nutrients. The most desirable protein sources are those which
contain the essential amino acids profile required by the animal (Willard, 2003).
During extrusion, proteins undergo
many structural changes. They unfold,
realign, hydrolyse, denature and react
with other mash constituents. The
higher addition of protein, the more
intensive cross-linking between them
and starches, which results in the
higher rigidity of kibbles (Onwulata et
al., 2001). Depending on protein
source, concentration and its
processing before extrusion, created
complexes differ in expansion degree.
In extruded foods, protein inclusion is
normally lower than starch, which
favours expansion, crispness, and
increases bulk density (Day et al., 2013). The above theory is supported by research of
Onwulata et al. (2001) and Allan et al. (2007). Onwulata concluded that inclusion of whey
protein concentrate (250g/kg) or sweet whey solids (500 g/kg) to cornmeal flour, significantly
decreases (p < 0.05) the expansion index and increases the hardness of extrudates. Allan et al.
(2007) tested 3 different levels (16, 32 and 40%) of whey protein. The results clearly showed,
that the higher the inclusion of protein, the lower expansion of the extruded product (Figure 7).
Furthermore, scientific investigations conducted by SPF Diana Pet Food concluded that higher
inclusion of poultry meal in a food led to harder kibbles (Table 3, Fournier et. al., 2013).
Unfortunately, the method of texture measurements used in this research is not described.
Table 3. Impact of protein inclusion on the rigidity of kibbles*
Protein inclusion [%] Rigidity [N/mm]
25 22
35 36
40 49
Fournier et. al., 2013
Figure 7. Expansion of corn extrudates with different
level of whey protein (16% on the left, 32% in the
middle and 40% on the right, Allen et. al., 2007).
11
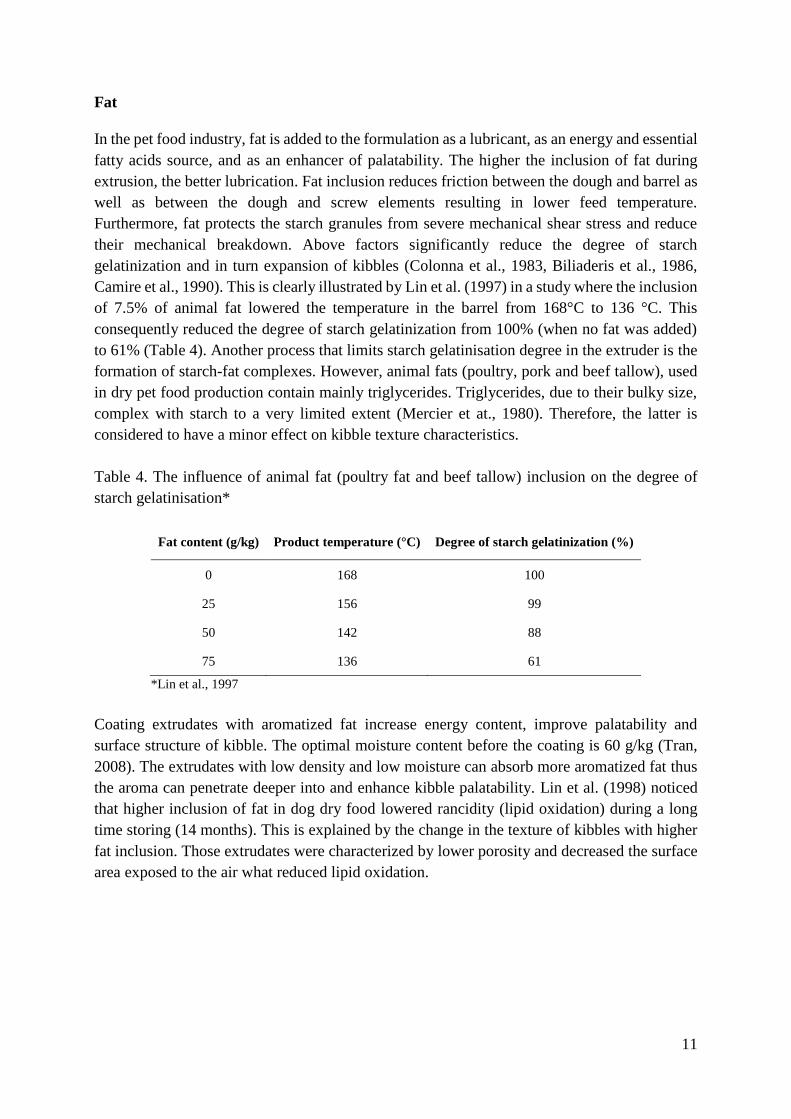
Fat
In the pet food industry, fat is added to the formulation as a lubricant, as an energy and essential
fatty acids source, and as an enhancer of palatability. The higher the inclusion of fat during
extrusion, the better lubrication. Fat inclusion reduces friction between the dough and barrel as
well as between the dough and screw elements resulting in lower feed temperature.
Furthermore, fat protects the starch granules from severe mechanical shear stress and reduce
their mechanical breakdown. Above factors significantly reduce the degree of starch
gelatinization and in turn expansion of kibbles (Colonna et al., 1983, Biliaderis et al., 1986,
Camire et al., 1990). This is clearly illustrated by Lin et al. (1997) in a study where the inclusion
of 7.5% of animal fat lowered the temperature in the barrel from 168°C to 136 °C. This
consequently reduced the degree of starch gelatinization from 100% (when no fat was added)
to 61% (Table 4). Another process that limits starch gelatinisation degree in the extruder is the
formation of starch-fat complexes. However, animal fats (poultry, pork and beef tallow), used
in dry pet food production contain mainly triglycerides. Triglycerides, due to their bulky size,
complex with starch to a very limited extent (Mercier et at., 1980). Therefore, the latter is
considered to have a minor effect on kibble texture characteristics.
Table 4. The influence of animal fat (poultry fat and beef tallow) inclusion on the degree of
starch gelatinisation*
Fat content (g/kg) Product temperature (°C) Degree of starch gelatinization (%)
0 168 100
25 156 99
50 142 88
75 136 61
*Lin et al., 1997
Coating extrudates with aromatized fat increase energy content, improve palatability and
surface structure of kibble. The optimal moisture content before the coating is 60 g/kg (Tran,
2008). The extrudates with low density and low moisture can absorb more aromatized fat thus
the aroma can penetrate deeper into and enhance kibble palatability. Lin et al. (1998) noticed
that higher inclusion of fat in dog dry food lowered rancidity (lipid oxidation) during a long
time storing (14 months). This is explained by the change in the texture of kibbles with higher
fat inclusion. Those extrudates were characterized by lower porosity and decreased the surface
area exposed to the air what reduced lipid oxidation.

12
Fibre
According to Monti et al. (2016), kibble characteristics are significantly impacted by the type
and particle size of the used fibre. The inclusion of fibre decreases the level of starch
gelatinisation, decreasing in turn expansion and reinforcing kibble structure (Robin et al., 2012).
However the mood of action of insoluble and soluble fibre fractions is different (Brennan et al.,
2008). Insoluble fibres, like for instance guava fibre, sugarcane or wheat bran, at a high
inclusion level increase the energy required to extrude the feed and by this reduce cooking of
starch. Above is proved by the research of Monti et. al. (2016) who investigated how the
increased inclusion of guava fibre (0-12%) in the formula affect the macrostructure of kibbles.
They concluded that different fibre inclusions significantly (p<0.001) affect kibble
characteristics, where the higher inclusion of guava fibre the lower starch gelatinisation degree
and radial expansion rate as well as increased cutting force (Table 5).
Table 5. The influence of different inclusion of guava fibre on starch gelatinisation degree,
radial expansion rate and cutting force*
inclusion of guava fibre
0% 3% 6% 12%
Starch gelatinization (%) 92.8 91.1 90.5 88.3
Radial expansion rate 4.1 3.9 3.5 3.2
Cutting force (kg.f) 2.4 2.9 3.1 3.4
*Monti et al., 2016
The main effect of higher inclusion of soluble fibre fractions in formulas is the increased water
absorption. When water is restricted, there is less starch degradation and gelatinisation during
extrusion (Dale et al., 2003). Furthermore, complex formation between starch and cellulose
molecules might alter the solubility of the paste and influence the texture properties. This
process is different for every individual mixture of used ingredients (native characteristics of
starch and fibres) in the formula, and there are no general conclusions on the mode of action
and effects on texture (Chinnaswamy et al., 1991, Robin et al., 2012).
Fibre, next to protein helps in regulation satiety in cats. Replacing protein with a source of
soluble and fermentable fibre in a food lowers the rate of gastric emptying. This helps to
increase the feeling of satiety in cats, which in turn limits the voluntary energy consumption
(Table 6, Biourge et al., 2014).
Table 6. The influence of crude protein and dietary fibre inclusion on daily energy intake in
cats feed ad libitum*
Crude protein [%] Dietary fibre [%] Daily energy intake (kcal/kg BW)
Food 1 41 16 43.1
Food 2 48 10 48.9
Food 3 36 21 39.6
*Biourge et al., 2014
13
Moisture
Water has two main functions in food processing. It plays an important role as a solvent and as
a lubricator. Mathew et al. (1999) described a positive correlation between increasing the mash
moisture in the range of 9.5-13.5% and expansion of pet food extrudate. Also, increasing
moisture level during extrusion causes higher nutrient retention and higher durability of
extrudate, what reduce the number of fines and generation of waste (Sørensen, 2003). Extruded
cat food has a moisture level between 200-300 g/kg (Lankhorst et al., 2007). In order to improve
it texture properties, palatability and extend shelf life the water content must be decreased.
Therefore, after extrusion kibbles are dried.
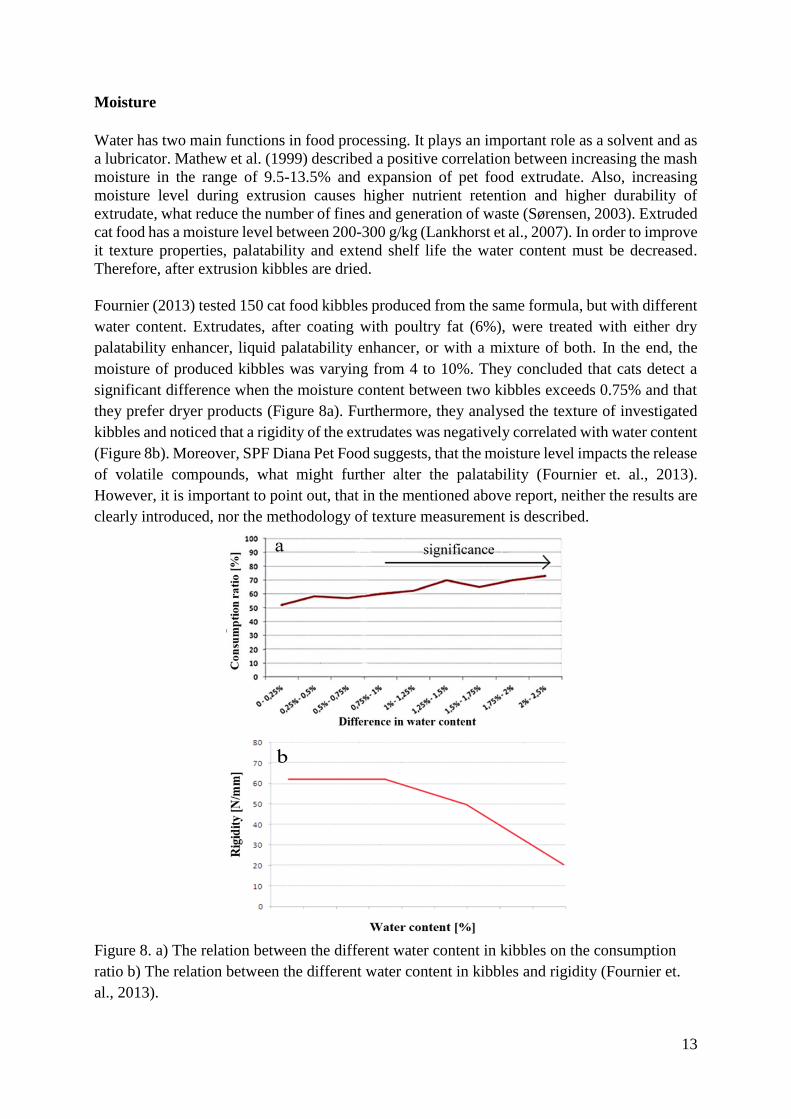
Fournier (2013) tested 150 cat food kibbles produced from the same formula, but with different
water content. Extrudates, after coating with poultry fat (6%), were treated with either dry
palatability enhancer, liquid palatability enhancer, or with a mixture of both. In the end, the
moisture of produced kibbles was varying from 4 to 10%. They concluded that cats detect a
significant difference when the moisture content between two kibbles exceeds 0.75% and that
they prefer dryer products (Figure 8a). Furthermore, they analysed the texture of investigated
kibbles and noticed that a rigidity of the extrudates was negatively correlated with water content
(Figure 8b). Moreover, SPF Diana Pet Food suggests, that the moisture level impacts the release
of volatile compounds, what might further alter the palatability (Fournier et. al., 2013).
However, it is important to point out, that in the mentioned above report, neither the results are
clearly introduced, nor the methodology of texture measurement is described.
Figure 8. a) The relation between the different water content in kibbles on the consumption
ratio b) The relation between the different water content in kibbles and rigidity (Fournier et.
al., 2013).

14
2.3 Feeding behaviour of cats
Cats are opportunistic eaters, and their feeding pattern depends on the food availability, whether
hunted, scavenged or delivered by the owner. When the difficulty of getting food increases, the
meal size increases as well. In general, cats do not follow a circadian rhythm. They prefer to
eat small, similar in size meals throughout the day and night. (Kane et al., 1987). Cats regulate
their energy intake not by reducing the number of meals, but by decreasing the content of each
meal. The way, in which the meal size and the break between meals are controlled, is not yet
completely understood (Bradshaw et al., 2012).
Cats are considered to be true carnivores. Throughout evolution, the feline diet has been based
on animal tissues, which determines their unique nutritional requirements. Therefore, their
metabolism is adapted to a high protein and low carbohydrate food. Dissimilar to other
mammals, feline saliva does not contain amylase. Cats also lack a functional Tas1r2 receptor
and cannot taste sugars, but in turn, they are very good at differencing the taste of amino acids.
Cats have 30 teeth (12 incisors, 4 canines, 10 premolars and 4 molars, Figure 9). Feline teeth
and mouth are small. Their jaw joints do not move laterally but only vertically, which is meant
to kill and hold a prey while hunting, rather than grind or chew (Hewson-Hughes et al., 2011).
Food, except the mechanical breakdown in the mouth, is also moistened with saliva in order to
lubricate the bolus to facilitate swallowing and further digestion.
Figure 9. Anatomy of the jaw of cats (Nutrition, 1997)
15
2.4 Influence of kibble physical characteristics on feeding behaviour
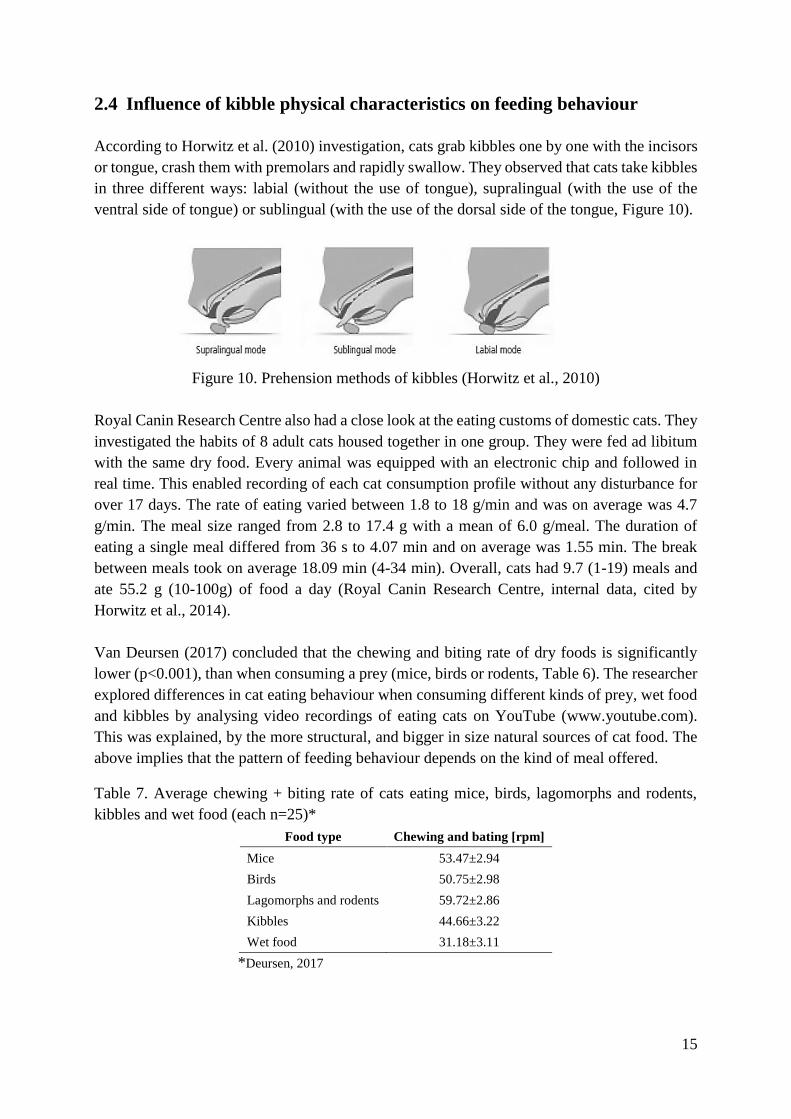
According to Horwitz et al. (2010) investigation, cats grab kibbles one by one with the incisors
or tongue, crash them with premolars and rapidly swallow. They observed that cats take kibbles
in three different ways: labial (without the use of tongue), supralingual (with the use of the
ventral side of tongue) or sublingual (with the use of the dorsal side of the tongue, Figure 10).
Figure 10. Prehension methods of kibbles (Horwitz et al., 2010)
Royal Canin Research Centre also had a close look at the eating customs of domestic cats. They
investigated the habits of 8 adult cats housed together in one group. They were fed ad libitum
with the same dry food. Every animal was equipped with an electronic chip and followed in
real time. This enabled recording of each cat consumption profile without any disturbance for
over 17 days. The rate of eating varied between 1.8 to 18 g/min and was on average was 4.7
g/min. The meal size ranged from 2.8 to 17.4 g with a mean of 6.0 g/meal. The duration of
eating a single meal differed from 36 s to 4.07 min and on average was 1.55 min. The break
between meals took on average 18.09 min (4-34 min). Overall, cats had 9.7 (1-19) meals and
ate 55.2 g (10-100g) of food a day (Royal Canin Research Centre, internal data, cited by
Horwitz et al., 2014).
Van Deursen (2017) concluded that the chewing and biting rate of dry foods is significantly
lower (p<0.001), than when consuming a prey (mice, birds or rodents, Table 6). The researcher
explored differences in cat eating behaviour when consuming different kinds of prey, wet food
and kibbles by analysing video recordings of eating cats on YouTube (www.youtube.com).
This was explained, by the more structural, and bigger in size natural sources of cat food. The
above implies that the pattern of feeding behaviour depends on the kind of meal offered.
Table 7. Average chewing + biting rate of cats eating mice, birds, lagomorphs and rodents,
kibbles and wet food (each n=25)*
Food type Chewing and bating [rpm]
Mice 53.47±2.94
Birds 50.75±2.98
Lagomorphs and rodents 59.72±2.86
Kibbles 44.66±3.22
Wet food 31.18±3.11
*Deursen, 2017

16
Ruth Van Koppen (2017) observed the difference in feeding behaviour of cats when consuming
normal and palatable food. Sixteen cats were recorded twice during consumption of each food.
The recordings were analyzed for the effects of palatability, sex and interactions between those
factors, on the eating behaviour. The chewing varied between 96.8 and 111.7 rpm but neither
the addition of taste enhancer nor the sex had a significant influence on the speed of ingestion
(p>0.1). Those results are in agreement with Becques et. al. (2014) who investigated the
influence of palatability of the same food with different taste enhancers applied on the kibbles.
One part of the food was coated with super-premium hydrolysate with a poultry basis and the
second part-less palatable with normal hydrolysate with a viscera basis. The speed of
consumption varied between 3.4 to 5.3 g/min and did not differ significantly between
investigated diets (p>0.1) but overall, cats consumed significantly more kibbles with more
palatable enhancer than the regular one.
Another crucial research concerning the influence of kibble shape and texture on palatability
was performed by the AFB International Research Group and presented by Figge at Petfood
Forum (2011). According to the results (Table 8), the main palatability driver was the shape of
the kibble. The most palatable shape within the exanimated group was a disc with mid-ranged
hardness, then the cross (the hardest kibble) followed by triangle-shaped kibbles and triangle
with a hole (lowest hardness score). The cylinder was the thickest kibble with moderate
hardness and was the least preferred one by cats. An unmentioned component in this research
is the surface area of kibbles that could influence introduced results because the bigger surface
area the larger contact area covered with flavour enhancer.
Table 8. The influence of kibble physical characteristics on preference in feline*
Texture Preference
Shape Moisture
[%]
Diameter
[cm]
Thickness
[cm]
Hardness
^ [kg]
7.40 0.36 0.19 5.39 >a = >
a >
a
8.59 0.54 0.18 8.08 < a
> a
> > a
8.59 0.45 0.18 7.06 = < a
= >
6.96 0.41 0.20 2.48 >
a = =
> a
8.58 0.32 0.39 4.23 < a
< a
< < a
*Figge et al., 2011; ^ measurements done with the Instron Texture Analyser (3342) and Cherry Pitter Needle
probe; a: p < 0.05

17
3 Hypothesis and research questions
Based on the literature review above, it can be deducted that research concerning the influence
of chemical and physical characteristic on the way of ingestion by cats is limited. Therefore,
the primary aim of this project is to determine how the physical and chemical properties of
foods translate into the way cats eat these foods. In addition, as various texture measurement
methodologies are available, the secondary aim is to evaluate the extent of accuracy of available
texture measurement methodologies. The specific aims are to study:
I. How physical and chemical properties of foods translate into the way cats eat these foods
Research questions:
1. How does the crude chemical composition (moisture, protein, fat, fibre and starch relate
to the physical properties of cat food kibbles (hardness)?
It is expected that a higher level of protein, fibre and lower starch, as well as moisture
content, will increase the hardness of kibbles.
2. How do the physical (hardness, shape) and chemical (protein, fat, fibre) characteristics
of kibbles relate to the ingestion of the kibbles in cats (chewing rate, time of ingestion)?
It is expected, that hardness will be positively related with chewing rate, and that disc and
triangle shaped kibbles will be eaten at a slower rate than the turbine shaped.
A higher protein, fat and fibre level is expected to lead to fewer chews and shorter time for
ingestion.
II. To evaluate the precision of available texture measurement methodologies
Research questions:
1. Which of available hardness tests (MT50, Instron, Kahl) is the most precise when
evaluating cat food kibbles?
It is expected that the MT 50 is the most precise method, i.e. yields lowest variation among
technical replicates.
2. What is the variability in Instron texture analysis outcomes when using different probes
(plate, blade, cone, cat jaw model)?
The highest variability is expected in measurements done with the platen probe.
18
4 Material and methods
4.1 Food selection
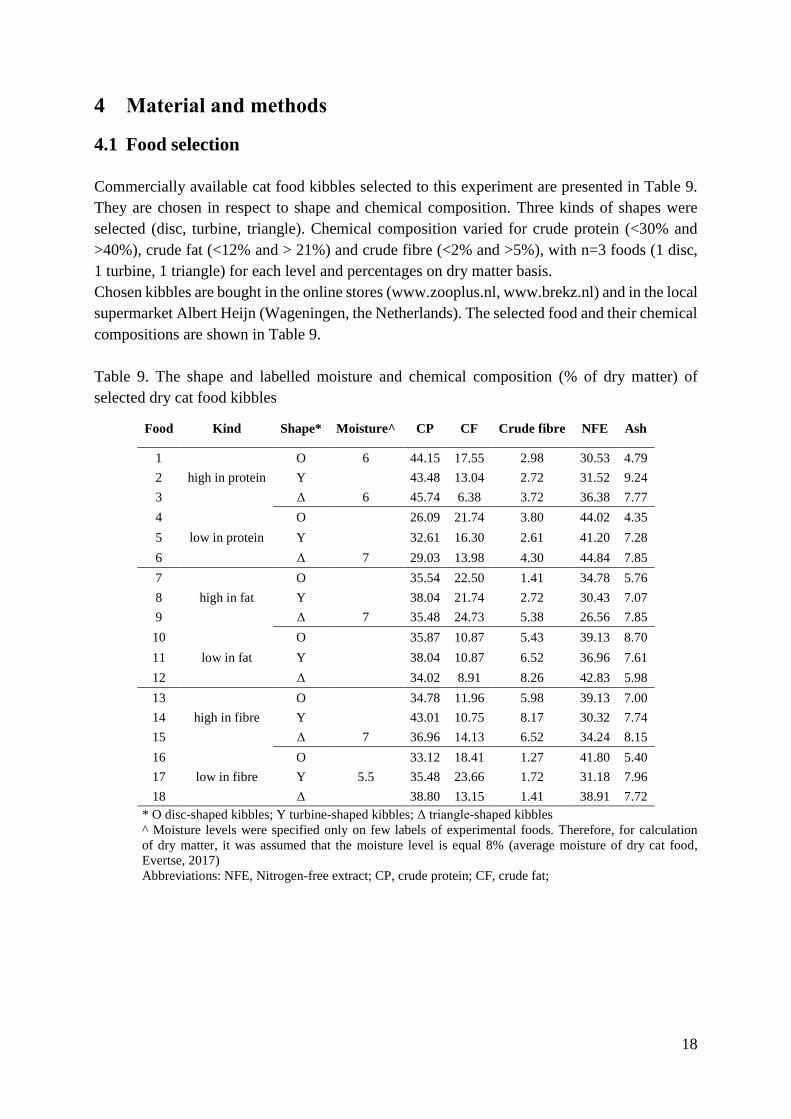
Commercially available cat food kibbles selected to this experiment are presented in Table 9.
They are chosen in respect to shape and chemical composition. Three kinds of shapes were
selected (disc, turbine, triangle). Chemical composition varied for crude protein (<30% and
>40%), crude fat (<12% and > 21%) and crude fibre (<2% and >5%), with n=3 foods (1 disc,
1 turbine, 1 triangle) for each level and percentages on dry matter basis.
Chosen kibbles are bought in the online stores (www.zooplus.nl, www.brekz.nl) and in the local
supermarket Albert Heijn (Wageningen, the Netherlands). The selected food and their chemical
compositions are shown in Table 9.
Table 9. The shape and labelled moisture and chemical composition (% of dry matter) of
selected dry cat food kibbles
Food Kind Shape* Moisture^ CP CF Crude fibre NFE Ash
1
high in protein
O 6 44.15 17.55 2.98 30.53 4.79
2 Y 43.48 13.04 2.72 31.52 9.24
3 Δ 6 45.74 6.38 3.72 36.38 7.77
4
low in protein
O 26.09 21.74 3.80 44.02 4.35
5 Y 32.61 16.30 2.61 41.20 7.28
6 Δ 7 29.03 13.98 4.30 44.84 7.85
7
high in fat
O 35.54 22.50 1.41 34.78 5.76
8 Y 38.04 21.74 2.72 30.43 7.07
9 Δ 7 35.48 24.73 5.38 26.56 7.85
10
low in fat
O 35.87 10.87 5.43 39.13 8.70
11 Y 38.04 10.87 6.52 36.96 7.61
12 Δ 34.02 8.91 8.26 42.83 5.98
13
high in fibre
O 34.78 11.96 5.98 39.13 7.00
14 Y 43.01 10.75 8.17 30.32 7.74
15 Δ 7 36.96 14.13 6.52 34.24 8.15
16
low in fibre
O 33.12 18.41 1.27 41.80 5.40
17 Y 5.5 35.48 23.66 1.72 31.18 7.96
18 Δ 38.80 13.15 1.41 38.91 7.72
* O disc-shaped kibbles; Y turbine-shaped kibbles; Δ triangle-shaped kibbles
^ Moisture levels were specified only on few labels of experimental foods. Therefore, for calculation
of dry matter, it was assumed that the moisture level is equal 8% (average moisture of dry cat food,
Evertse, 2017)
Abbreviations: NFE, Nitrogen-free extract; CP, crude protein; CF, crude fat;
19
4.2 Physical characteristics
Surface area, thinness and weight
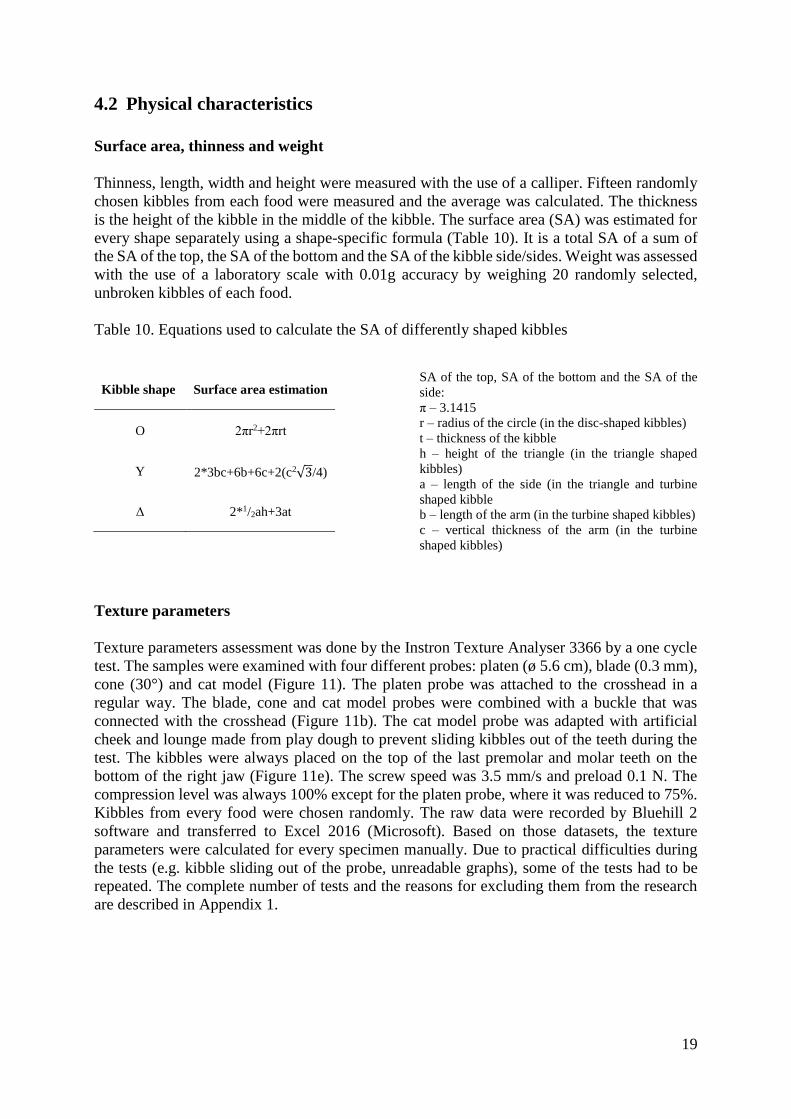
Thinness, length, width and height were measured with the use of a calliper. Fifteen randomly
chosen kibbles from each food were measured and the average was calculated. The thickness
is the height of the kibble in the middle of the kibble. The surface area (SA) was estimated for
every shape separately using a shape-specific formula (Table 10). It is a total SA of a sum of
the SA of the top, the SA of the bottom and the SA of the kibble side/sides. Weight was assessed
with the use of a laboratory scale with 0.01g accuracy by weighing 20 randomly selected,
unbroken kibbles of each food.
Table 10. Equations used to calculate the SA of differently shaped kibbles
Kibble shape Surface area estimation
O 2πr2+2πrt
Y 2*3bc+6b+6c+2(c2√3/4)
Δ 2*1/2ah+3at
SA of the top, SA of the bottom and the SA of the
side:
π – 3.1415
r – radius of the circle (in the disc-shaped kibbles)
t – thickness of the kibble
h – height of the triangle (in the triangle shaped
kibbles)
a – length of the side (in the triangle and turbine
shaped kibble
b – length of the arm (in the turbine shaped kibbles)
c – vertical thickness of the arm (in the turbine
shaped kibbles)
Texture parameters
Texture parameters assessment was done by the Instron Texture Analyser 3366 by a one cycle
test. The samples were examined with four different probes: platen (ø 5.6 cm), blade (0.3 mm),
cone (30°) and cat model (Figure 11). The platen probe was attached to the crosshead in a
regular way. The blade, cone and cat model probes were combined with a buckle that was
connected with the crosshead (Figure 11b). The cat model probe was adapted with artificial
cheek and lounge made from play dough to prevent sliding kibbles out of the teeth during the
test. The kibbles were always placed on the top of the last premolar and molar teeth on the
bottom of the right jaw (Figure 11e). The screw speed was 3.5 mm/s and preload 0.1 N. The
compression level was always 100% except for the platen probe, where it was reduced to 75%.
Kibbles from every food were chosen randomly. The raw data were recorded by Bluehill 2
software and transferred to Excel 2016 (Microsoft). Based on those datasets, the texture
parameters were calculated for every specimen manually. Due to practical difficulties during
the tests (e.g. kibble sliding out of the probe, unreadable graphs), some of the tests had to be
repeated. The complete number of tests and the reasons for excluding them from the research
are described in Appendix 1.

20
Figure 11. Instron Texture Analyser 3366 a) with the platen probe connected with the regular
crosshead, b) with the cat model probe installed to buckle combined with the crosshead, c) blade
probe, d) cone probe, e) kibble placed on the top of the last premolar and molar teeth on the
bottom right jaw in the cat model probe adapted with artificial cheek and tongue made from
play dough.
Seven successful replicates from every food were selected to further evaluation. The texture
parameters were derived or calculated as follows: Hardness (kg) was defined as the maximal
force that the kibble achieves during the compression of the probe. It is the highest peak in the
force-time curve (Figure 12a, Friedman et al., 1963, Szczesniak et al., 2002) Chewiness
(kg*mm) was interpreted as the positive area under the curve (area 1. Figure 12a, Solà-Oriol et
al., 2009). The area under the curve was obtained by the trapezoid rule. The area under the
curve was divided into a series of trapezoids and the sum of all areas of those trapezoids gave
the total area under the curve (Cruz-Uribe et al., 2002). Since the applied force was moved
horizontally 5 cm on the arm of the cat model, the actual force applied on the specimen had to
be adjusted (Archimedes law of the lever, described by Vince, 1797). Therefore, the obtained
with cat model probe results were multiplied by 1.77 (Appendix 2, Vince, 1797).

21
Figure 12 a) General force time curve from TPA single compression dry test on a single kibble
(internal data, WUR 2018); b) Horizontal shift of 5 cm of applied force on the cat model probe
arm.
Since two more methods were available, hardness was also measured by Kahl pellet hardness
tester (Amadeus Kahl Nachf 2057 Reinbek, Figure 13a) and Soltac Multi-Test Tablet Hardness
Tester (MT50, Figure 13b). Twelve randomly selected kibbles from every food were
individually tested. Every specimen was placed between two bars. During the test with Soltac,
the kibbles were held with tweezers to ensure proper position of the specimen (Figure 13b).
The force applied on the kibble was increasing statically until the kibble cracked. The applied
force at the moment of breaking the kibble was recorded. The highest and the lowest value were
skipped and the hardness was an average of 10 measurements (Ton Nu, 2009).
Figure 13. Hardness measurement by a) Kahl pallet hardness tester and b) by Soltac MT 50

22
4.3 Eating behaviour in vivo test
From the 18 foods, twelve foods were chosen for in vivo evaluation by cats. The foods were
selected based on the results obtained in a first part of the experiment (SA, thinness, hardness),
shape and chemical composition. Eight domestic European shorthair cats (four males, four
females) experienced with different kinds of dry foods were used in this study. Before the
observation started cats were gradually adapted (4 days) from the wet to the familiar dry food
(Perfect Fit Indoor, Mars Petcare, Verden, Germany). No changes were made to the housing
condition of the cats. The study lasted for 2 weeks. During this time, 4 rounds were conducted
of which the last one was a reserve round, where unsuccessful measurements from the previous
three rounds were repeated. Round 1 to 3 consisted of one adaptation day followed by one test
day. In round 4 the adaptation day was skipped. Rest days were included between the rounds
with 1 day between rounds 1 and 2 and rounds 3 and 4 and 2 days between rounds 2 and 3. The
adaptation and testing days followed the same pattern. At 8.00 h, all cats received 20% of the
daily portion of the familiar dry food in their individual feeding cages (1.00 x 0.74 x 1.74 m).
They were given 15 min for consuming the morning meal. Four food ingestion tests were
performed on each day for each cat. During each test, every the cats had 10 min time to consume
5 g of food in the individual feeding-cage. During the tests, eating behaviour was recorded by
a Go Pro camera (JVC Everio, Model GZ-MS150HE). Two cats were observed at the same
time (male in cage A and female in cage B). The first couple were starting at 10.00 h, the second
at 10.15 h, the third at 10.30 h and the fourth at 10.45 h. Cats had 2 h break between the tests
and return to their normal group room for the break time. The tests were finished no later than
16.55 h (Table 11).
Table 11. Cat feeding plan with experimental foods during adaptation and test days with an
indication of placing cats in the individual feeding cages.
round
1
cat (nr) in
feeding cage
(A or B)
round
2
cat (nr) in
feeding cage
(A or B)
round
3
cat (nr) in
feeding cage
(A or B)
round
4
cat (nr) in
feeding cage
(A or B)
A B A B A B A B
10.00 h 1 2 12.00 h 1 2 14.00 h 1 2 16.00 h 1 2
10.15 h 3 4 12.15 h 3 4 14.15 h 3 4 16.15 h 3 4
10.30 h 5 6 12.30 h 5 6 14.30 h 5 6 16.30 h 5 6
10.45 h 7 8 12.45 h 7 8 14.45 h 7 8 16.45 h 7 8
At 17.00 h, all cats were fed with the rest of their daily portion of their regular dry food corrected
for the energy intake during the tests. Order of testing the foods was random (Appendix III,
Attachment 2). The food was placed in a circle of one layer of kibbles in the corner of a cutting
board with a rough surface, which encouraged cats to sit in the desired position during the test
(Figure 14). In addition, because the break between tests was just 5 min, it was easier to
completely dry only the corner of the cutting board instead of the whole surface.
23
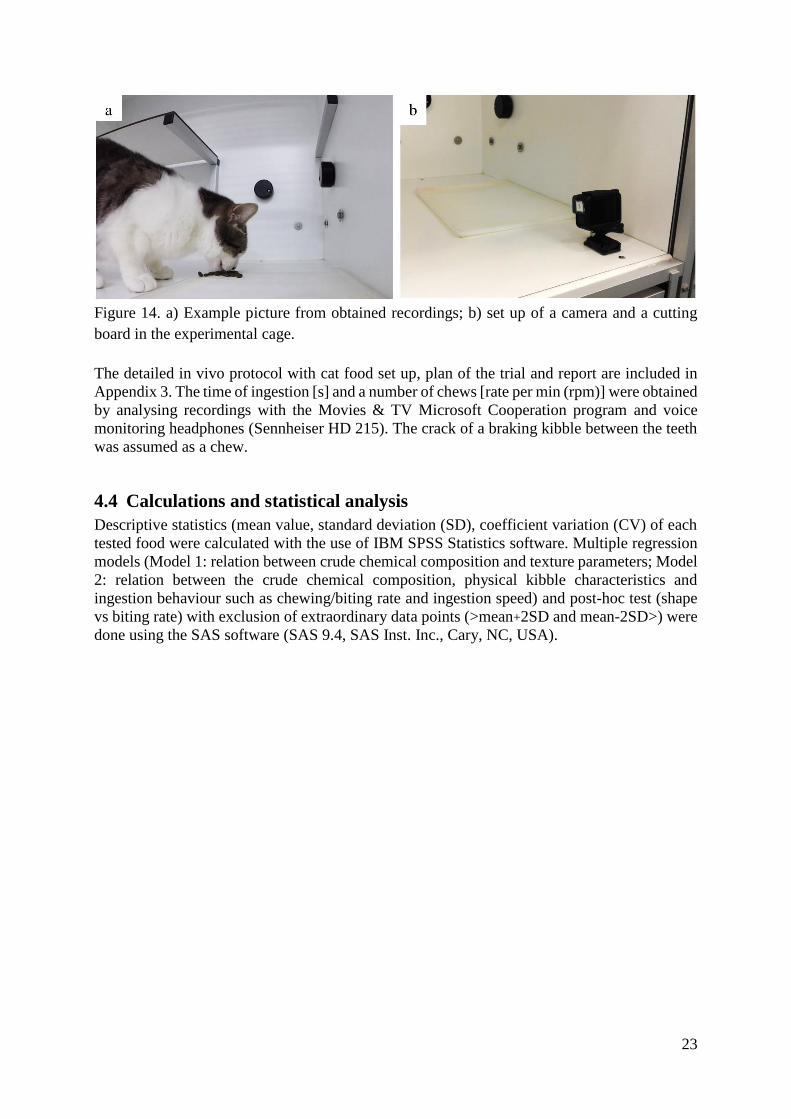
Figure 14. a) Example picture from obtained recordings; b) set up of a camera and a cutting
board in the experimental cage.
The detailed in vivo protocol with cat food set up, plan of the trial and report are included in
Appendix 3. The time of ingestion [s] and a number of chews [rate per min (rpm)] were obtained
by analysing recordings with the Movies & TV Microsoft Cooperation program and voice
monitoring headphones (Sennheiser HD 215). The crack of a braking kibble between the teeth
was assumed as a chew.
4.4 Calculations and statistical analysis
Descriptive statistics (mean value, standard deviation (SD), coefficient variation (CV) of each
tested food were calculated with the use of IBM SPSS Statistics software. Multiple regression
models (Model 1: relation between crude chemical composition and texture parameters; Model
2: relation between the crude chemical composition, physical kibble characteristics and
ingestion behaviour such as chewing/biting rate and ingestion speed) and post-hoc test (shape
vs biting rate) with exclusion of extraordinary data points (>mean+2SD and mean-2SD>) were
done using the SAS software (SAS 9.4, SAS Inst. Inc., Cary, NC, USA).

24
5 Results
Relation between the crude chemical composition and the physical properties of cat food
kibbles
The crude chemical composition of experimental foods varied between 26.09 and 45.74%, 6.38
and 24.73%, 1.27 and 8.26%, and between 27.41 and 45.69% for protein, fat, fibre and NFE
respectively (Table 9). Moisture was not part of the data set, as it was not declared on 12 out of
18 labels. Multiple regression was therefore performed without this factor. The outcomes of the
multiple regression analyses of hardness as measured with the Kahl test and with the cat model
on the Instron, as well as the chewiness obtained with cat model probe, are shown in Table 12.
The chemical components did not explain the variation found in measured hardness values
among kibbles irrespective of the method of measurement (P=0.890, P=0.935 and P=0.250
respectively).
Table 12. The relation between crude chemical composition and texture (hardness and
chewiness).
Parameter Estimates±SE
R2 P-value
Intercept CP CF Crude fibre NFE
Hardness
Kahl -44.0±114.4 0.61±1.23 0.63±1.23 0.96±1.39 0.51±1.25 0.083 0.890
Cat model -18.9±31.20 0.22±0.34 0.25±0.33 0.31±0.38 0.23±0.34 0.062 0.935
Chewiness
Cat model 37.44±34.50 0.45±0.36 0.32±0.39 0.47±0.37 0.47±0.37 0.340 0.250
Abbreviations: CP, crude protein; CF, crude fat; NFE, nitrogen-free extract

25
Relation between cat food kibble characteristics and ingestion
The relation between physical (hardness, weight, shape), as well as chemical (protein, fat, fibre)
characteristics of kibbles and the ingestion of the kibbles in cats (chewing rate, time for
ingestion), are presented in Table 13. Ingestion time increased with 0.93 s per %-unit of crude
protein (P=0.013) and decreased with 10.69 s per kg of hardness measured with the cat model
probe on the Instron (P<0.001). Crude fibre content tended to impact ingestion time with 1.30
s per %-unit (P=0.052). Other factors in the model did not significantly impact ingestion time
(P>0.10). Shape influenced biting rate (P<0.001) with cats biting most on turbine-shaped
kibbles (9.7±1.1; P=0.001, post hoc analysis) and triangle-shaped kibbles (3.2±1.1) tended to
be eaten with fewer bites than disc-shaped kibbles (5.4±1.1, P=0.065). The biting rate decreased
with 0.65 units per %-unit crude of protein (P<0.001). The biting rate increased with 1.83 rpm
per kg of hardness measured with the cat model on the Instron (P=0.048). Other factors in the
model did not significantly relate to biting rate (P>0.10).
Table 13. The relation between cat food kibble characteristics and ingestion
Effect Ingestion time P-value Bite rate P-value
Intercept 27.8±19.14 29.47±6.16
Shape
Disc 4.54±3.83
0.184
-4.28±1.25
<0.001 Triangle -1.99±3.37 -6.46±1.23
Turbine 0 0
Kibble weight 41.89±30.00 0.167 10.31±9.76 0.295
CP 0.93±0.36 0.013 -0.65±0.12 <0.001
CF 0.35±0.40 0.379 -0.19±0.13 0.139
Crude fibre 1.30±0.66 0.052 -0.13±0.22 0.558
Hardness-Cat model -10.69±2.78 <0.001 1.83±0.91 0.048
Abbreviations: CP, crude protein; CF, crude fat

26
Precision of available hardness tests (Kahl, Soltac, Instron) when evaluating cat food
kibbles
The measurements of hardness varied between the investigated foods from 4.29±0.52 to
16.4±1.47 kg for Kahl hardness tester, between 2.61±0.40 to 8.66±0.79 kg for Soltac and
between 8.22±1.94 and 68.6±12.32 kg when using Instron with platen probe for evaluation
(Table 14). The coefficient of variance (CV, %) results were in the range from 8 5 to 28%, 9%
32% and from 9% to 32 % for Kahl, Soltac and Instron with platen probe. The average equalled
15%, 17% and 21% respectively. Based on these data, Kahl hardness tester appears to be the
most precise method when evaluating the hardness of cat food kibbles and Instron platen gives
less precise outcomes than Soltac.
Table 14. Hardness mean ± SD, and CV, its average and range of investigated kibbles when
evaluated with Kahl, Soltac and Instron with platen probe
Food Kahl* Soltac* Instron platen^
Mean±SD CV [%] Mean±SD CV [%] Mean±SD CV [%]
1 12.83±2.68 21 5.88±1.48 25 14.73±3.79 26
2 10.25±1.31 13 3.517±1.12 32 12.73±1.74 14
3 4.29±0.52 12 4.23±0.65 15 68.6±12.32 18
4 8.31±1.68 20 4.25±0.45 10 19.07±6.18 32
5 8.42±2.34 28 5.15±1.42 28 11.79±3.07 26
6 11.63±1.75 15 6.41±0.70 11 13.16±2.13 16
7 14.23±2.24 16 5.75±1.39 24 17.99±4.44 25
8 4.44±0.35 8 2.61±0.40 15 8.22±1.94 24
9 16.4±1.47 9 8.66±0.79 9 24.12±6.18 26
10 12.42±1.12 9 6.38±0.76 12 15.48±1.94 13
11 15.9±2.13 13 7.07±0.88 13 23.66±5.09 21
12 8.44±1.06 13 6.82±0.66 1 23.39±7.42 32
13 13.69±1.38 10 6.23±1.40 23 36.08±3.30 9
14 11.18±2.15 19 6.88±1.00 14 12.43±1.32 11
15 5.44±0.91 17 3.92±0.55 14 8.53±1.40 16
16 7.94±1.01 13 4.8±0.96 20 13.55±2.16 16
17 10.9±1.36 12 5.15±0.94 18 15.14±3.31 22
18 8.95±2.4 27 6.38±1.12 18 14.92±3.98 27
Average 15 17 21
Range 8-28 9-32 9-32
* based on 12 replicate measurements with the omission of lowest and highest value (Ton Nu, 2009);
^ based on 7 replicate measurements (Ton Nu, 2009)
27
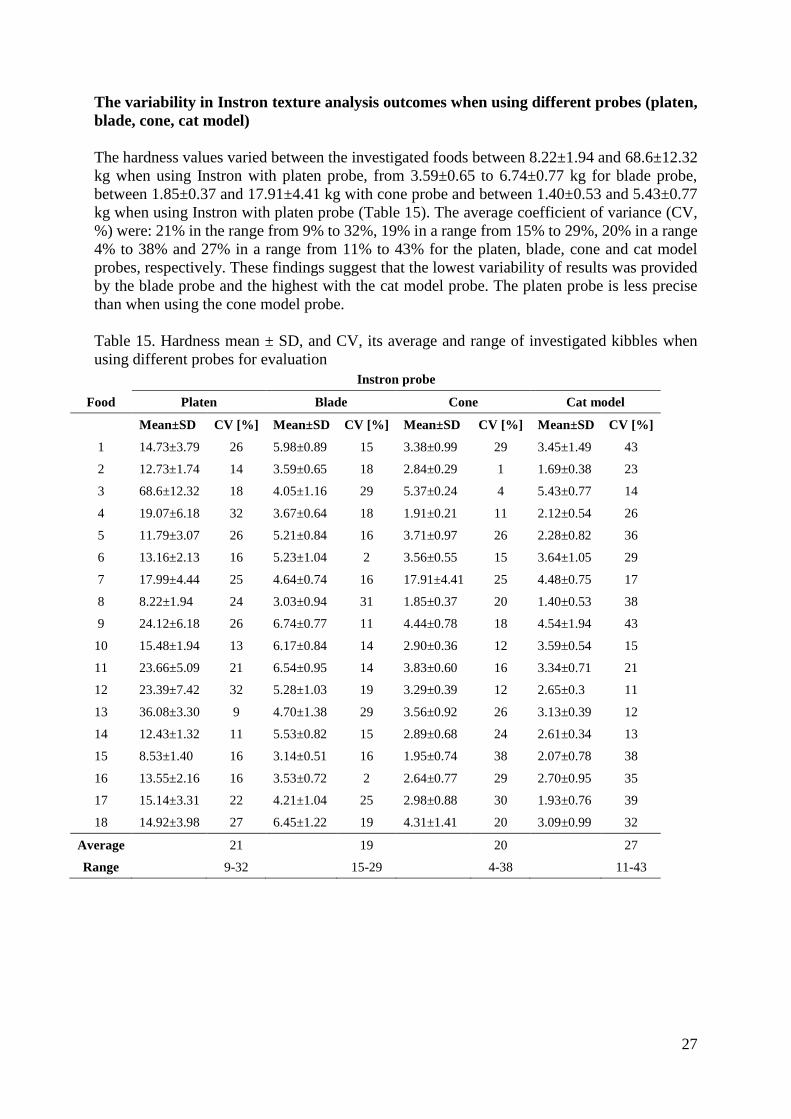
The variability in Instron texture analysis outcomes when using different probes (platen,
blade, cone, cat model)
The hardness values varied between the investigated foods between 8.22±1.94 and 68.6±12.32
kg when using Instron with platen probe, from 3.59±0.65 to 6.74±0.77 kg for blade probe,
between 1.85±0.37 and 17.91±4.41 kg with cone probe and between 1.40±0.53 and 5.43±0.77
kg when using Instron with platen probe (Table 15). The average coefficient of variance (CV,
%) were: 21% in the range from 9% to 32%, 19% in a range from 15% to 29%, 20% in a range
4% to 38% and 27% in a range from 11% to 43% for the platen, blade, cone and cat model
probes, respectively. These findings suggest that the lowest variability of results was provided
by the blade probe and the highest with the cat model probe. The platen probe is less precise
than when using the cone model probe.
Table 15. Hardness mean ± SD, and CV, its average and range of investigated kibbles when
using different probes for evaluation Instron probe
Food Platen Blade Cone Cat model
Mean±SD CV [%] Mean±SD CV [%] Mean±SD CV [%] Mean±SD CV [%]
1 14.73±3.79 26 5.98±0.89 15 3.38±0.99 29 3.45±1.49 43
2 12.73±1.74 14 3.59±0.65 18 2.84±0.29 1 1.69±0.38 23
3 68.6±12.32 18 4.05±1.16 29 5.37±0.24 4 5.43±0.77 14
4 19.07±6.18 32 3.67±0.64 18 1.91±0.21 11 2.12±0.54 26
5 11.79±3.07 26 5.21±0.84 16 3.71±0.97 26 2.28±0.82 36
6 13.16±2.13 16 5.23±1.04 2 3.56±0.55 15 3.64±1.05 29
7 17.99±4.44 25 4.64±0.74 16 17.91±4.41 25 4.48±0.75 17
8 8.22±1.94 24 3.03±0.94 31 1.85±0.37 20 1.40±0.53 38
9 24.12±6.18 26 6.74±0.77 11 4.44±0.78 18 4.54±1.94 43
10 15.48±1.94 13 6.17±0.84 14 2.90±0.36 12 3.59±0.54 15
11 23.66±5.09 21 6.54±0.95 14 3.83±0.60 16 3.34±0.71 21
12 23.39±7.42 32 5.28±1.03 19 3.29±0.39 12 2.65±0.3 11
13 36.08±3.30 9 4.70±1.38 29 3.56±0.92 26 3.13±0.39 12
14 12.43±1.32 11 5.53±0.82 15 2.89±0.68 24 2.61±0.34 13
15 8.53±1.40 16 3.14±0.51 16 1.95±0.74 38 2.07±0.78 38
16 13.55±2.16 16 3.53±0.72 2 2.64±0.77 29 2.70±0.95 35
17 15.14±3.31 22 4.21±1.04 25 2.98±0.88 30 1.93±0.76 39
18 14.92±3.98 27 6.45±1.22 19 4.31±1.41 20 3.09±0.99 32
Average 21 19 20 27
Range 9-32 15-29 4-38 11-43

28
6 Discussion
Although feline nutrition has been studied in depth by the industry, little is known about the
eating behaviour of dry cat food. Research in other species showed that the ingestion behaviour
influence health in many aspects. By finding a way to increase the chewing rate in cats, we
might reduce the problem of feline overeating and decrease plague development on their teeth.
Kibbles are the base of feline diet and therefore, this investigation focused on the associations
between the chemical and physical characteristics of cat food kibbles and feline ingestion
behaviour, as well as the evaluation of precision of several available texture assessment
methods.
Relation between the crude chemical composition and the physical properties of cat food
kibbles
Even though the experimental foods were selected in a wide range of macronutrients, the crude
chemical composition, seemed to not relate to the physical characteristics investigated in our
research. These results are in disagreement with our expectations. Earlier research showed that
higher inclusion of protein and fibre decrease expansion degree and increases the hardness of
extrudates (Onwulata et al., 2001, Allen et al. 2007, Fournier et. al., 2013, Monti et al., 2016).
Onwulata et. al. (2001) observed that addition 500g/kg of whey protein concentrate to the mash
significantly increased breaking strength index (BSI) from 3.8 N/mm (when no whey protein
concentrate was added) to 11.7 N/mm (P<0.01). A similar pattern was observed when the
inclusion of sweet whey solids was increased from 250 to 500 g/kg. The BSI increased from
5.9 to 9.8 N/mm (P<0.01) respectively. Onwulata et al. (2001) defined the BSI as hardness (N)
measured by texture analyser with Warner–Bratzler shear cell probe, divided by the diameter
of the extrudate (mm). Likewise, Fournier et. al. (2013) concluded that higher inclusion of
poultry meal in a dry pet food elevates rigidity. The rigidity of kibbles equalled 22 N/mm when
the inclusion of protein was 25% and increased to 49 N/mm when inclusion of protein was
increased to 40%. Monti et al. (2016) investigated the influence of fibre inclusion on extruded
dog foods. They reported that kibbes with 12% of guava fibre were characterised by
significantly higher (P<0.001) cutting force (3.4 kg.f) than extrudates with no addition of guava
fibre (2.4 kg.f). Furthermore, the cutting force differed significantly (P<0.001) depending on
the kind of fibre used: 4.1 kg.f for sugarcane fibre and 3.1 kg.f when adding guava fibre. The
level of total dietary fibre equalled 166 g/kg DM in both foods. To evaluate the cutting force
Monti et al. (2016) used texturometer with a Warner-Bratzler Knife probe. The researchers
concluded that in general the lower the inclusion of protein and fibre, the harder the kibbles are
when looking into the same kind of ingredients and providing the same conditions during
extrusion. However, when observing the relationship between the level of macronutrients from
various origin and texture of extrudates (expansion degree, hardness etc.), the outcomes are
inconsistent (Willard, 2003, Monti et al., 2016, Ye et al., 2018). This is due to the specific
physicochemical properties of macronutrients depending on the raw materials used, and the
interactions between them during extrusion. Those mechanisms are shortly described in the
literature review (chapter 2.3., Brennan et al., 2008, Alcázar-Alay et. al., 2015, Ye et al., 2018).
During the production of pet food kibbles, fats can be added before extrusion, as a lubricant,
and after drying as a carrier for palatability enhancers. Adding fat to the mash in the pre-
conditioner reduces share action and lower feed temperature in a barrel during extrusion, which
in turn significantly limits the starch gelatinization and expansion of extrudates (chapter 2.3.,
Lin et al., 1997). In case, fat is applied after extrusion on dry kibbles, it will penetrate the
structure without influencing the expansion ratio giving the kibble its low density and moisture
characteristic (Lin et al., 1998). Above implies, that depending on the production process. It is
29
possible to produce kibbles with high-fat content and different texture characteristics.
Additionally, the diversities in processing conditions such as the amount of water available, the
temperature and screw speed have a great influence on the physical properties of the extrudate
(Ye et al., 2018). In this research, neither the raw ingredients nor the production process, but
only the macronutrient level was considered during food selection which might explain the lack
of relation between the macronutrients level and physical characteristics ok kibbles. Another
shortcoming of this investigation is unknown moisture level in 12 out of 18 foods. A recent
study by Everse (2017) showed that the water content in commercially available dry cat food
range between 4 and 12% with an average of 8%. The assumed 8% for foods where the moisture
was not specified gives uncertainty of ± 4% which could meaningfully affect the outcomes. The
difference in macronutrients levels on DM basis could be up to 7% for starch and crude protein,
4% for crude fat and 1% for crude fibre. Moreover, we did not do our own chemical analysis
of the food samples to validate their nutrient levels. Therefore, results concerning the relation
between macronutrients inclusion and texture as well as eating behaviour might be different
when the exact moisture content is known.
Relation between cat food kibble characteristics and ingestion
Ingestion time was positively correlated with the crude protein level and negatively correlated
with hardness measured with the cat model probe on the Instron. Furthermore, biting rate was
positively correlated with hardness measured with the cat model on the Instron and was
negatively correlated with crude protein levels and this is in line with our expectation. We also
expected that the fibre and fat level will be negatively correlated with biting rate and positively
to the time of ingestion but there was no relation found. In this study, the ingestion speed of dry
cat food varied between 2.9 to 12.6 g/min with an average 5.8 g/min which is higher than the
value reported by Becques et. al. (2014) where the ingestion speed was in a range between 3.4
to 5.3 g/min with an average 4.4 g/min. However, our findings agree with Horwitz et al. (2014),
who recorded ingestion speed values between 2.9 to 12.6 g/min with an average of 5.8 g/min.
The higher average ingestion speed in the current study could be explained by the fact that the
cats were fed 5 g of food every 2 h whereas in the cited studies they were fed at libitum. Horwitz
et al. (2014) observed that the average size of a meal is 6.0 g (2.8 to 17.4 g) and an average
break between meals is 18.09 min (4-34 min) for cats with free access to food. This might
suggest that in our research the cats may have been hungrier and therefore ate faster.
Furthermore, Van Deursen (2017) when studying differences of eating behaviour between
natural cat food sources and commercial diets noted that the chewing rate when consuming dry
cat food was 44.66±3.22 rpm, much higher values were declared by Van Koppen (2017) who
observed 104±4.99 rpm. In our study, the chewing/biting rate values were much lower than in
the previous studies and the mean was 6.78±5.31rpm. This can be explained by the difference
in methodology. Both Van Deursen et. al. (2017) and Van Koppen et al. (2017), when
evaluating chewing rate, counted the up and down movement of cat jaws as a bite. In this study,
a bite/chew was defined as the sound of a cracking kibble between the teeth, because during
eating cat moves the jaws not only when biting, but also when moving a kibble in the mouth
cavity.
The optimal ratio of energy macronutrient composition of cat diet between protein, fat and
carbohydrate is 52%, 36% and 12% respectively (Hewson-Hughes et al., 2011). Commercial
dry cat food contains on average 34.97±3.77 % crude protein, 16.78±4.08 crude fat, 36.99±6.12
starch and 3.67±1.78 crude fibre (Van Deursen et. al., 2017), that gives a ratio of energy
macronutrient composition of 31%, 36%, and 33% respectively. Since cats instinctively strive
to eat and reach the desired level of nutrients (Hewson-Hughes et al., 2011), it could be assumed

30
that foods with desirable protein level are craved more and therefore consumed faster. In a
research by SPF Diana Pet Food (2013), in which foods with higher inclusion of protein
(chicken meal) were more palatable for cats, the researchers were wondering whether the
increased palatability was because of higher level of protein or because the high protein kibbles
were harder or if this occurrence was a resultant of these two factors (Fournier 2013).
Interestingly, we did not find correlations between crude protein content and hardness but
increased ingestion time of foods with higher protein inclusion. However, hardness was
positively related to biting rate and negatively correlated with the time of ingestion measured
by the cat model probe (P<0.001). Bailoni et al. (2005) suggested, that the hardness of kibbles
can be related with plaque formation since harder foods are more abrasive that soft foods and
more capable of removing the teeth plaque. Another interesting finding of our study is that cats
bite significantly more on turbine-shaped kibbles than on the triangle-shaped and disc-shaped.
If hardness and turbine shape are the factors that encourage cats to bite more, then hard turbine-
shaped kibbles should be recommended for cats with oral problems because the more bites the
better plaque removal from teeth and decreased tartar development. Besides, studies in human
eating behaviour proved that multiple chews before swallowing decrease size of the eaten meal,
lowering at the same time energy consumption (Shah et al. 2014, Zhu et al., 2014). The latter
suggests that desired texture and shape of dry cat food could help control speed of ingestion
and intake, but this assumption should be investigated in further research.
Precision of available hardness tests (Kahl, Soltac, Instron) and variability in Instron
texture analysis outcomes when using different probes (platen, blade, cone, cat model)
when evaluating cat food kibbles
Since there is no clear conclusion on the way of texture testing in pet food industry, several
methods suggested by Food Technology Corporation, as well as some technics currently used
in feed and pharmaceutical field in the literature review section (chapter 2.2) are presented. In
this research, when assessing hardness by Kahl (pellet hardness tester used in feed industry)
and Soltac MT50 (tablet hardness tester used in pharmacy) twelve measurements were
performed, from which the highest and the lowest were skipped and the mean of ten repetitions
was calculated. However, for the hardness analysis with Instron seven repetitions were made
for each experimental food. When comparing outcomes of Kahl, Soltac and Instron with platen
probe, Kahl hardeners tester provided the most precise results, what is different from our
expectations. If we had applied the same methodology and omitted the lowest and highest
values from the Instron tests, the CV would change from average 21% in the range from 9% to
32%, to an average 14% in a range from 5% to 23% for platen probe, from average 19% in the
range from to 19% in a range from 15% - 29% for blade probe, from average 0.19 in the range
from 15% to 29% to an average 13% in a range from 3% - 29% for blade probe, from an average
20% in the range from 4% to 38% to an average 12% in a range from 5% to 22% for cone probe
and from an average 27% in the range from 11% to 43% to an average 17% within a range from
10% to 33% for cat model probe (Table 16). The recalculated average and standard deviation
of investigated foods are presented in Appendix IV.
Table 16. Average and range of coefficient of variance [%] in results when using different
probes for evaluation Instron probe
Platen Blade Cone Cat model
Average 21 19 20 27
Range 9-32 15-29 4-38 11-43
Average* 14 13 12 17
Range* 5-23 3-29 5-22 1-33
*skipped the highest and lowest value (average means based on 5 repeated tests per food)

31
Omitting the highest and the lowest score improves the precision of measurements for all used
probes meaningfully but increases the gap between the probes used. Furthermore, there are no
reference values for use when evaluating dry cat food and the accuracy remains unknown. If
we compare the precision of hardness measurements made by Kahl, Soltac and Instron with
platen probe, keeping the methodology constant and skipping the highest and lowest value for
all devices, then the best results would be obtained by platen probe. However, if all data is
included, the Instron texture analyser with cone probe would provide the most precise
outcomes.
7 Conclusion
The primary aim of this project was to find out how the physical and chemical properties of dry
foods translate into the way cats eat these foods. The chemical components did not explain the
variation found in measured hardness values among kibbles irrespective of the method of
measurement. Ingestion time was positively correlated with the crude protein level and
negatively correlated with hardness measured with the cat model probe on the Instron. Cats
were biting significantly more on turbine-shaped kibbles than disc- and triangle-shaped. The
biting rate was positively correlated with hardness measured with the cat model on the Instron
and was negatively correlated with crude protein levels. The secondary aim was, to evaluate
the precision of available texture measurement methodologies. The study showed that the
lowest variability of results provided blade probe and the highest the cat model probe.
8 Recommendations
This study was focused on exploring the associations between the chemical and physical
characteristics of cat food kibbles and ingestion behaviour of cat. Besides, the precision of used
texture assessment methods was evaluated. During the research, some shortcomings of the
chosen methods appeared. Therefore it is suggested to:
1. Perform proximate analysis of investigated foods in order to validate the part of results
concerning the relation between macronutrient inclusion and texture as well as ingestion
behaviour
2. Improve the cat model with an artificial cheek and tongue that will protect the kibbles from
sliding off during the tests
3. Develop a method of comparing the size of differently shaped kibbles
4. Investigate the relation between size and texture parameters of cat food kibbles by
measuring surface area, volume, diameter for every specimen separately before performing
texture profile analysis
32
9 Literature references: Alcázar-Alay, S. C., and M. Angela A. Meireles. 2015. “Physicochemical Properties, Modifications and
Applications of Starches from Different Botanical Sources.” Food Science and Technology (Campinas)
35(2):215–36.
Allen, K. E., C. E. Carpenter, and M. K. Walsh. 2007. “Influence of Protein Level and Starch Type on an Extrusion-
Expanded Whey Product.” International Journal of Food Science and Technology 42(8):953–60.
Ambros, M. C., F. Podczeck, H. Podczeck, and J. M. Newton. 1998. “The Characterization of the Mechanical
Strength of Chewable Tablets.” Pharmaceutical Development and Technology 3(4):509-15.
Bailoni, L. and I. Cerchiaro. 2005. “The Role of Feeding in the Maintenance of Well-Being and Health of Geriatric
Dogs.” Veterinary Research Communications 29(Suppl. 2):51-55.
Becques, A. 2014. “Behaviour in Order to Evaluate the Palatability of Pet Food in Domestic Cats.” Applied Animal
Behaviour Science 159:55-61.
Biliaderis, C. G., C. M. Page, and T. J. Maurice. 1986. “On the Multiple Melting Transitions of
Starch/monoglyceride Systems.” Food Chemistry 22(4):279-95.
Biourge, V. 2014. “The ‘BARF’ Trend - Advantages, Drawbacks and Risks.”
Bourne, M. C. 2002. “Physics and Texture.” Food Texture and Viscosity 68.
Bradshaw J., R. Casey, S. Brown. 2012. “The Behaviour of the Domestic Cat.”
Brennan, M. A., J. A. Monro, and C. S. Brennan. 2008. “Effect of Inclusion of Soluble and Insoluble Fibres into
Extruded Breakfast Cereal Products Made with Reverse Screw Configuration.” International Journal of Food
Science and Technology 43(12):2278-88.
Camire, M. E. and K. Krumhar. 1990. “Chemical and Nutritional Changes in Foods During Extrusion.” Critical
Reviews in Food Science and Nutrition 29(1):35-57.
Chinnaswamy, R. and M. A. Hanna. 1991. “Physicochemical and Macromolecular Properties of Starch-Cellulose
Fiber Extrudates.” Food Structure 10(3):229-39.
Civille, G.V., and A.S. Szczesniak. 1973. “Guidelines to training a texture profile panel”. Journal of Texture
Studies 4, 204-223.
Colonna, P. and C. Mercier. 1983. “Macromolecular Modifications of Manioc Starch Components by Extrusion-
Cooking with and without Lipids.” Carbohydrate Polymers 3(2):87-108.
Cruz-Uribe, D. and C. J. Neugebauer. 2002. “Sharp Error Bounds for the Trapezoidal Rule and Simpson’s Rule.”
Journal of Inequalities in Pure and Applied Mathematics 3(4):1-22.
Dale, A. 2003. “Fiber, texturized protein and extrusion” Pet food technology 2003:361-363.
Day, L. and B. G. Swanson. 2013. “Functionality of Protein-Fortified Extrudates.” Comprehensive Reviews in
Food Science and Food Safety 12(5):546-64.
Deursen, W. 2017. “How Does a Cat Eat a Mouse ?” WUR (unpublished).
Éles, V., I. Hullár, and R. Romvári. 2014. “Texture of Dry Cat Foods and Its Relation to Preference.” 18:129-34.
Evertse, A. 2017. “Associations between Characteristics of Owner-Reported Cat Diets and Body Condition Scores
in an Adult Cat Population.” WUR (unpublished).
Fairchild, H.J., and F. M. Pfizer. 1961. “Tablet Hardness Tester” 50(11):966-969.

33
Figge, K. 2011. “Kibble Shape and Its Effect on Feline Palatability.” Pet Food Forum.
Friedman, H. H., J. E. Whitney, and A. Surmacka-Szczesniak. 1963. “The Texturometer? A New Instrument for
Objective Texture Measurement.” Journal of Food Science 28(4):390-96.
Fournier, M. 2013. “Impact of Kibble Formulation on Palatability.” Diana Petfood.
Hewson-Hughes, A. K. 2011. “Geometric Analysis of Macronutrient Selection in the Adult Domestic Cat, Felis
Catus.” Journal of Experimental Biology 214(6):1039-51.
Hewson-Hughes, A. K. 2013. “Consistent Proportional Macronutrient Intake Selected by Adult Domestic Cats
(Felis Catus) despite Variations in Macronutrient and Moisture Content of Foods Offered.” Journal of Comparative
Physiology B: Biochemical, Systemic, and Environmental Physiology 183(4):525-36.
Horwitz, D. F., Soulard, Y., Junien-Castagna, A. (2010) “The feeding behaviour of the cat.“ Encyclopedia Feline
Clinical nutrition, Royal Canin.
Kane, E., P. M. B. Leung, and J. G. Morris. 1987. “Diurnal Feeding Cats as Affected Fat in the Diet and Drinking
by Changes Patterns of Adult in the Level of.” 89-98.
Lankhorst, C., Q. D. Tran, R. Havenaar, W. H. Hendriks, and A. F. B. van der Poel. 2007. “The Effect of Extrusion
on the Nutritional Value of Canine Diets as Assessed by in Vitro Indicators.” Animal Feed Science and Technology
138(3-4):285-97.
Lin, S., F. Hsieh, and H. E. Huff. 1997. “Effects of Lipids and Processing Conditions on Degree of Starch
Gelatinization of Extruded Dry Pet Food.” LWT - Food Science and Technology 30(7):754–61
Lin, S., F. Hsieh, and H. Huff. 1998. “Effects of Lipids and Processing Conditions on Lipid Oxidation of Extruded
Dry Pet Food during Storage.” Animal Feed Science and Technology 71(3-4):283-94.
Mathew, J. M., R. C. Hoseney, and J. M. Faubion. 1999. “Effect of Corn Moisture on the Properties of Pet Food
Extrudates.” Cereal Chemistry 76(6):953-56.
Mercier, C. Charbonniere, R. Grebaut, and J. Gueriviere. 1980. “Formation of Amylose-Lipid Complexes by
Twin-Screw Extrusion Cooking of Manioc Starch.” 57(1):4-9.
Monti, M. et al. 2016. “Influence of Dietary Fiber on Macrostructure and Processing Traits of Extruded Dog
Foods.” Animal Feed Science and Technology 220:93-102.
Moraru, C. I. and J. L. Kokini. 2003. “Nucleation and Expansion During Extrusion and Microwave Heating of
Cereal Foods.” Comprehensive Reviews in Food Science and Food Safety 2(4):147-65.
Niemiec, B. A. 2010. “The Importance of Dental Radiology.” EJCAP 20(3).
Nutrition, Animal. 1997. “The Digestive System of Cats and Dogs.” WUR (unpublished).
Novaković S., and I. Tomašević. 2017. “A Comparison between Warner-Bratzler Shear Force Measurement and
Texture Profile Analysis of Meat and Meat Products: A Review.” Faculty of Agriculture, University of Belgrade
(IOP Conf. Series: Earth and Environmental Science 85 (2017) 012063).
Onwulata, C. I., P. W. Smith, R. P. Konstance, and V. H. Holsinger. 2001. “Incorporation of Whey Products in
Extruded Corn, Potato or Rice Snacks.” Food Research International 34(8):679-87.
Malando, P. A., and A. C. Conti-Silva. 2014. “Texture Profile and Correlation between Sensory and Instrumental
Analyses on Extruded Snacks.” Journal of Food Engineering 121(1):9-14.
McCallum, A., J. Buchter, R. Albrecht. 1955. “Comparison and correlation of the strong cobb and the Monsanto
tablet hardness testers” Journal of the American Pharmaceutical Association 44(2):83-85.
34
Moraru, C. I. and J. L. Kokini. 2003. “Nucleation and Expansion During Extrusion and Microwave Heating of
Cereal Foods.” Comprehensive Reviews in Food Science and Food Safety 2(4):147–65.
Robin, F., H. P. Schuchmann, and S. Palzer. 2012. “Dietary Fiber in Extruded Cereals: Limitations and
Opportunities.” Trends in Food Science and Technology 28(1):23-32.
Novaković, S., and I Tomašević. 2017. “A Comparison between Warner-Bratzler Shear Force Measurement and
Texture Profile Analysis of Meat and Meat Products: A Review.” Faculty of Agriculture, University of Belgrade
(IOP Conf. Series: Earth and Environmental Science 85 (2017) 012063).
Shah, M. 2014. “Slower Eating Speed Lowers Energy Intake in Normal-Weight but Not Overweight/Obese
Subjects.” Journal of the Academy of Nutrition and Dietetics 114(3):393-402.
Solà-Oriol, D., E. Roura, and D. Torrallardona. 2009. “Feed Preference in Pigs: Relationship with Feed Particle
Size and Texture.” Journal of Animal Science 87(2):571-82.
Sørensen, M. 2003. “Extrusion.” (August):1-33.
Szczesniak, A. S. 1963. “Objective Measurements of Food Texture.” Journal of Food Science 28(4):410–20.
Szczesniak, A. 2002. “Texture Is a Sensory Property.” Food Quality and Preference 13(4):215-25.
Paula, A. M., and A. C. Conti-Silva. 2014. “Texture Profile and Correlation between Sensory and Instrumental
Analyses on Extruded Snacks.” Journal of Food Engineering 121(1):9–14.
Tran, Q. 2008. Extrusion Processing: Effects on Dry Canine Diets.
Trinh, T. K. and S. Glasgow. 2012. “On the Texture Profile Analysis Test.” 1-12.
Ton Nu, M.A. 2009. “Texture and Texture Measurements of Extruded Pig Feed” WUR (unpublished).
Shreve, V. K. R., L. R. Mehrkam, and M. A. R. Udell. 2017. “Social Interaction, Food, Scent or Toys? A Formal
Assessment of Domestic Pet and Shelter Cat (Felis Silvestris Catus) Preferences.” Behavioural Processes
141(March):322-28.
Van der Poel, A.F.B. 1996. “Physical quality of pelleted animal feed. Criteria for pellet quality”. Animal Feed
Science Technology, 61, 89–112.
Van Koppen, R. 2017. “The Effect of Food Palatability on Eating Behaviour in Domestic Cats (Felis catus).” WUR
(unpublished).
Vince S. 1797. “Observations on the Fundamental Property of the Lever; With a Proof of the Principle
Assumed by Archimedes.” Royal Society. 84:33-38.
Willard, T. 2003. “Choosing and Sourcing the Best Ingredients.” Pet food technology 2003:76-81.
Ye, J. 2018. “Properties of Starch after Extrusion: A Review.” Starch/Staerke 1700110:1-8.
Zhu, Y. and J. H. Hollis. 2014. “Increasing the Number of Chews before Swallowing Reduces Meal Size in
Normal-Weight, Overweight, and Obese Adults.” Journal of the Academy of Nutrition and Dietetics 114(6):926-
31.
TTC www.texturetechnologies.com/accessories/probes-and-fixtures#puncture
Pets global www.petsglobal.com/website/product_12046/Dry_Dog_Food.html
Pharmatron www.pharmatron.com/ 2018
Jimtrade www.suppliers.jimtrade.com/149/148103/strong_cobb_tablet_hardness_tester_model_sht__17.htm

35
Industrial world www.industrialworld.com,
Tech farma labor www.tech.farmalabor.it
Pharmacy Instruments India www.pharmacyinstrumentsindia.com
Cobra www.cobra-eng.nl

36
Appendix I. Total number of texture measurements made with
Instron and reasons for excluding some of them from the research
Table 1. Total number of texture measurements made with Instron with platen probe and
reasons for excluding some of them from the research
*Instron was starting measurements at as soon as the crosshead started moving down, with 75% compression often
even not touching the kibble, this could be happening due to wrong test settings or high sensitivity of the machine,
because even a minimal shake when lowering the probe made the Instron start the measurements before the
compression began; ^ theoretically brittleness in the first pick on the graph, however in many cases there is no pic
or the collapse of the line is very “soft”, or there are several soft collapsions and the graphs were hard to interpret
Instron platen probe
Food total nr of
tests
unsuccessful nr of
tests
test performed incorrectly by
Instron*
impossible to obtain
results^
1 7 0
2 12 5 5
3 7 0
4 18 11 11
5 10 3 3
6 21 14 14
7 7 0
8 7 0
9 8 1 1
10 21 14 14
11 7 0
12 12 5 5
13 9 2 2
14 8 1 1
15 7 0 0
16 30 23 21 2
17 11 4 4
18 7 0

37
Table 2. Total number of texture measurements made with Instron with blade probe (ø 0.03
mm) and reasons for excluding some of them from the research
Instron blade probe
Food total number
of tests
unsuccessful nr
of tests
sliding
kibble
graph is not
closed
impossible to
obtain results^
outstanding
result
1 14 7 2 1 3 1
2 10 3 2 1
3 10 3 3
4 10 3 1 1 1
5 10 3 1 2
6 9 2 1 1
7 14 7 1 2 3 1
8* 29 22 9 3 10
9 8 1 1
10 8 1 1
11 9 2 1 1
12 8 1 1
13 13 6 4 2
14 11 4 3 1
15 11 4 3 1
16 15 8 1 6 1
17 10 3 3
18 9 2 1 1
*small turbine-shaped kibbles for kittens with an uneven surface. The kibbles were often sliding during the test
from underneath the probe; ^ theoretical brittleness in the first pick on the graph, however in many cases there is
no pic or the collapse of the line is very “soft”, or there are several soft collapsions and the graphs were hard to
interpret
Table 3. Total number of texture measurements made with Instron with cone probe (30°) and
reasons for excluding some of them from the research
*small turbine-shaped kibbles for kittens with an uneven surface. The kibbles were often sliding during the test
from underneath the probe; ^ theoretical brittleness in the first pick on the graph, however in many cases there is
no pic or the collapse of the line is very “soft”, or there are several soft collapsions and the graphs were hard to
interpret.
Instron cone probe
Food total number
of tests
unsuccessful nr
of tests
sliding
kibble
graph is not
closed
impossible to
obtain results^
outstanding
result
1 10 3 2 1
2 9 2 1 1
3 9 2 2
4 9 2 2
5 10 3 3
6 10 3 2 1
7 12 5 3 2
8* 27 20 13 2 3 1
9 11 4 1 3
10 12 5 1 4
11 11 4 4
12 12 5 5
13 12 5 1 4
14 13 6 6
15 14 7 4 3
16 12 5 4 1
17 12 5 3 2
18 10 3 3

38
Table 4. Total number of texture measurements made with Instron with cat model and reasons
for excluding some of them from the research Instron cat model probe
Food total number
of tests
unsuccessful nr
of tests
sliding
kibble
graph is not
closed
impossible to
obtain results^
outstanding
result
1 11 4 3 1
2 15 8 5 3 1
3 8 1 1
4 8 1 1
5 15 8 4 4
6 18 11 7 4
7 7 0
8* 20 13 8 5
9 10 3 3
10 8 1 1
11 18 11 7 4
12 9 2 1 1
13 10 3 1 2
14 14 7 4 2 1
15 11 4 3 1
16 8 1 1
17 10 3 3
18 11 4 2 2 1
*small turbine-shaped kibbles for kittens with an uneven surface. The kibbles were often sliding during the test
from underneath the probe; ^ theoretical brittleness in the first pick on the graph, however in many cases there is
no pic or the collapse of the line is very “soft”, or there are several soft collapsions and the graphs were hard to
interpret

39
Appendix II. Correction formula for cat model probe
S1 = 17 cm
S2 = 13 cm
cos 40° = 0.77
cos 55° = 5.75
cos 40° / cos 55° = 1.35
S1 / S2 = 1.31
F2 = 1.31*1.35 * F1 =1.77 * F1
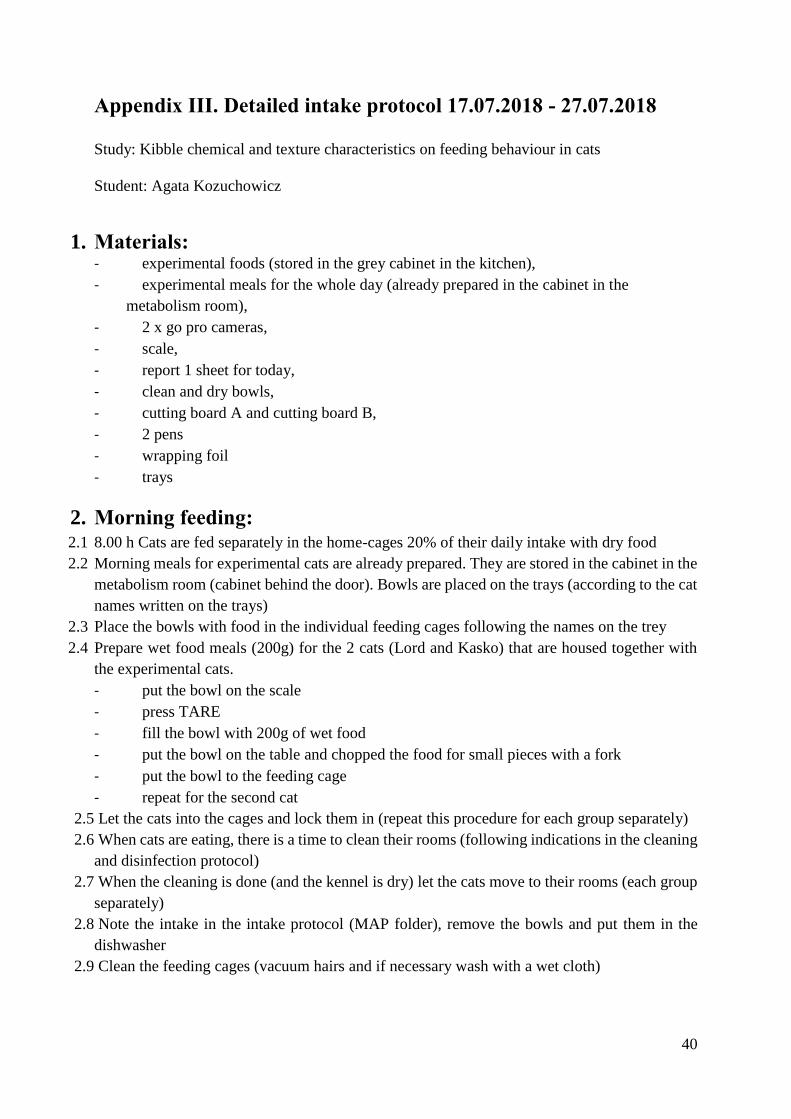
40
Appendix III. Detailed intake protocol 17.07.2018 - 27.07.2018
Study: Kibble chemical and texture characteristics on feeding behaviour in cats
Student: Agata Kozuchowicz
1. Materials: - experimental foods (stored in the grey cabinet in the kitchen),
- experimental meals for the whole day (already prepared in the cabinet in the
metabolism room),
- 2 x go pro cameras,
- scale,
- report 1 sheet for today,
- clean and dry bowls,
- cutting board A and cutting board B,
- 2 pens
- wrapping foil
- trays
2. Morning feeding: 2.1 8.00 h Cats are fed separately in the home-cages 20% of their daily intake with dry food
2.2 Morning meals for experimental cats are already prepared. They are stored in the cabinet in the
metabolism room (cabinet behind the door). Bowls are placed on the trays (according to the cat
names written on the trays)
2.3 Place the bowls with food in the individual feeding cages following the names on the trey
2.4 Prepare wet food meals (200g) for the 2 cats (Lord and Kasko) that are housed together with
the experimental cats.
- put the bowl on the scale
- press TARE
- fill the bowl with 200g of wet food
- put the bowl on the table and chopped the food for small pieces with a fork
- put the bowl to the feeding cage
- repeat for the second cat
2.5 Let the cats into the cages and lock them in (repeat this procedure for each group separately)
2.6 When cats are eating, there is a time to clean their rooms (following indications in the cleaning
and disinfection protocol)
2.7 When the cleaning is done (and the kennel is dry) let the cats move to their rooms (each group
separately)
2.8 Note the intake in the intake protocol (MAP folder), remove the bowls and put them in the
dishwasher
2.9 Clean the feeding cages (vacuum hairs and if necessary wash with a wet cloth)
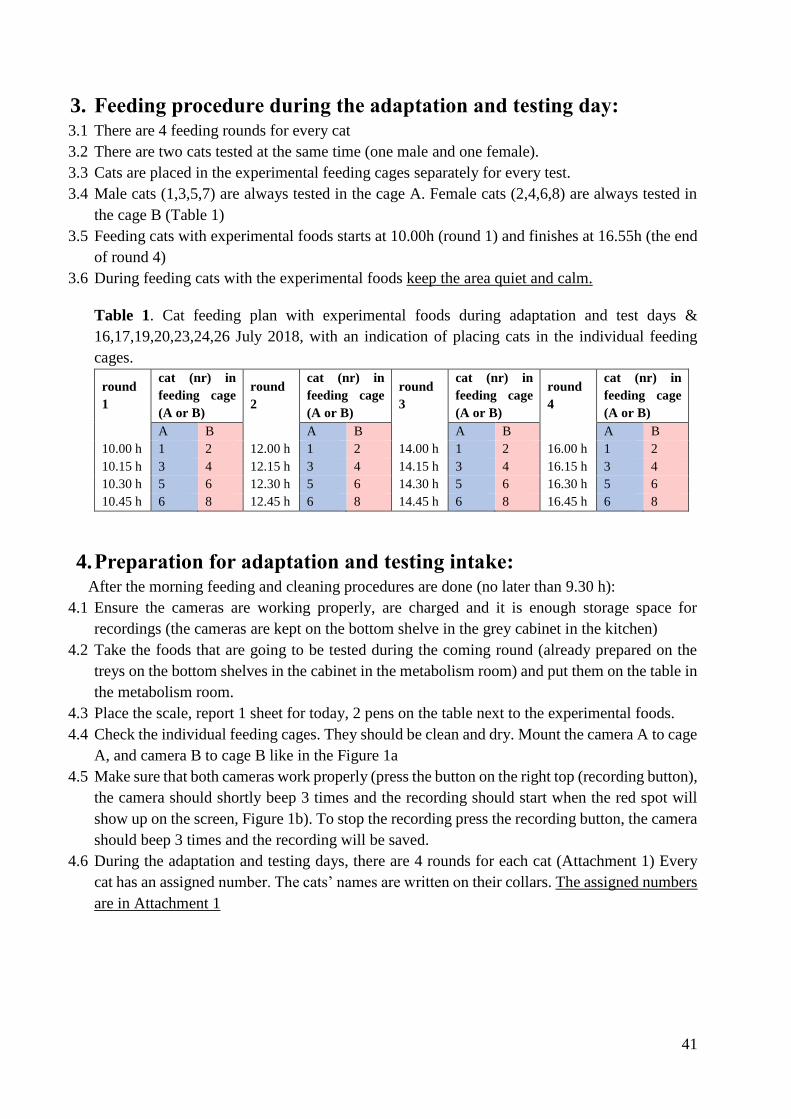
41
3. Feeding procedure during the adaptation and testing day: 3.1 There are 4 feeding rounds for every cat
3.2 There are two cats tested at the same time (one male and one female).
3.3 Cats are placed in the experimental feeding cages separately for every test.
3.4 Male cats (1,3,5,7) are always tested in the cage A. Female cats (2,4,6,8) are always tested in
the cage B (Table 1)
3.5 Feeding cats with experimental foods starts at 10.00h (round 1) and finishes at 16.55h (the end
of round 4)
3.6 During feeding cats with the experimental foods keep the area quiet and calm.
Table 1. Cat feeding plan with experimental foods during adaptation and test days &
16,17,19,20,23,24,26 July 2018, with an indication of placing cats in the individual feeding
cages.
round
1
cat (nr) in
feeding cage
(A or B)
round
2
cat (nr) in
feeding cage
(A or B)
round
3
cat (nr) in
feeding cage
(A or B)
round
4
cat (nr) in
feeding cage
(A or B)
A B A B A B A B
10.00 h 1 2 12.00 h 1 2 14.00 h 1 2 16.00 h 1 2
10.15 h 3 4 12.15 h 3 4 14.15 h 3 4 16.15 h 3 4
10.30 h 5 6 12.30 h 5 6 14.30 h 5 6 16.30 h 5 6
10.45 h 6 8 12.45 h 6 8 14.45 h 6 8 16.45 h 6 8
4. Preparation for adaptation and testing intake: After the morning feeding and cleaning procedures are done (no later than 9.30 h):
4.1 Ensure the cameras are working properly, are charged and it is enough storage space for
recordings (the cameras are kept on the bottom shelve in the grey cabinet in the kitchen)
4.2 Take the foods that are going to be tested during the coming round (already prepared on the
treys on the bottom shelves in the cabinet in the metabolism room) and put them on the table in
the metabolism room.
4.3 Place the scale, report 1 sheet for today, 2 pens on the table next to the experimental foods.
4.4 Check the individual feeding cages. They should be clean and dry. Mount the camera A to cage
A, and camera B to cage B like in the Figure 1a
4.5 Make sure that both cameras work properly (press the button on the right top (recording button),
the camera should shortly beep 3 times and the recording should start when the red spot will
show up on the screen, Figure 1b). To stop the recording press the recording button, the camera
should beep 3 times and the recording will be saved.
4.6 During the adaptation and testing days, there are 4 rounds for each cat (Attachment 1) Every
cat has an assigned number. The cats’ names are written on their collars. The assigned numbers
are in Attachment 1

42
Figure 1. a: Feeding cage with the correctly placed cutting board and camera; b: recording
button on the right top of the camera
5. Procedure for the test round: 5.1Place the cutting board A into cage A and the cutting board B into cage B, as indicated in
the picture (Figure 1a)
5.2 Put the food for the male cat on the cutting board A in the experimental cage A and for the
female cat on the cutting board B in the experimental cage B
5.3 Take male cat (1,3,5 or 7) from the room and place it in the waiting cage following the
order in Table 1. Close the cage
5.4 Take the female cat from the room. Start the cameras. After 3 short beeps from both cameras
place the female cat in the experimental cage B and close the cage
5.5 Bring the male cat from the waiting cage to the experimental cage A and close the
cage (Table 1) and quietly move behind the feeding cages where the cats can’t see you and stay
silent till the time you do not hear any cracking kibbles (ca. 1 minute). Check carefully if there
are no kibbles on the cutting boards. When the cats are finished, or after 10 minutes open the
cages and press the recording button to switch off the cameras (you should hear 3 beeps)
5.6 Take the cats back to their groups
5.7 Weight the remaining food and write the amount it the REPORT 1
5.8 Wash the cutting boards with hot water in the kitchen and dry with a towel
5.9 Clean the experimental cages if necessary (vacuum hairs and if necessary wash with
wet cloth)
5.10 Follow this routine starting from point 4.1 for the next 3 rounds. New round starts
every 15 minutes (e.g. 10.00 h, 10.15 h, 10.30 h, 10,45 h etc., Table 1)
6. Transferring obtained recordings from the camera to the computer
and creating a backup copy: 6.1 Transfer all recording to the computer (MEDION) in the kitchen (Folder EATING
BEHAVIOUR KIBBLES\recordings) on the pulpit and make a backup copy:
6.2 on the external disc (I:\EATING BEHAVIOUR KIBBLES\recordings). It is kept in the MAP
folder.
6.3 After each round check the battery level and storage space of the cameras and if the battery is
less than a half, plug the cameras to the power. If there is not sufficient storage space on the
device, delete the recordings that are already transferred to the computer and stored in the
backup copy.
a b

43
7. Preparing morning meal 7.1 During the break between round 1 and 2 prepare the
morning meal for the next day
7.2 Put the bowl on the scale
7.3 Press TARE
7.4 Weight the morning meal of the food (Table 2)
7.5 Secure the bowl with plastic foil
7.6 Put the ready food on the tray (following the names on
the tray)
7.7 Follow this steps (from p. 8.1) to prepare morning
meals for the 8 cats assigned to the experiment.
7.8 Put the treys with foods to the cabinet in the metabolic
room (behind the door)
8. Preparing experimental meals 8.1 During the break between round 2 and 4 prepare the morning meal for the next day
8.2 Put the bowl on the scale
8.3 Press TARE
8.4 Weight 5g of the food (Make sure there are no
broken kibbles or differently shaped kibbles in
the bowl) and write the exact amount in the
Report 1
8.5 Wrap the bowl with a protective foil and place
on the tray following the numbers of a cat for
whom the food is prepared and the number of
round (Attachment 2, Figure 2)
8.6 Follow the same steps (starting from point 8.2)
till all experimental meals for the next day are
prepared
8.7 Store the experimental food on the two bottom shelves in the cabinet in the metabolic room
9. Calculating the amount of afternoon meal.
When the 3rd round is finished calculating the afternoon intake for every cat separately (the rest
of daily intake corrected for the intake during the test (Attachment 2) and leftovers Report 1,
(the energy value [kcal] for all experimental foods are included in the Attachment 3) and prepare
the afternoon meals:
9.1 Put the bowl on the scale
9.2 Add leftovers from the morning feeding
9.3 Press TARE
9.4 Weight the proper amount of the food calculated in Report 1
9.5 Put the bowl on the tray following the names on it
9.6 Prepare meals for all 8 cats starting from the point 6.1 and for the 2 cats housed together with
them (point 1.4)
Table 2. Morning meal during
adaptation and tasting days (20% of
daily intake)
Figure 2. Experimental meals wrapped
with protective foil and placed on the tray
Catmorning meal [g] (20%
of daily intake)
Aal 7.6
Anouk 9.6
Bella 8.8
Jill 9.2
Bas 12
Kasko 12
Siske 16.4
Lord 9.6

44
9.7 In case there are leftovers of experimental food during round 4, correct the afternoon meal one
more time.
10. Afternoon feeding 10.1 The afternoon feeding starts at 17.00 h
10.2 Put the bowls with a meal for every cat separately in their regular individual feeding cages.
10.3 Let the cats into the cages and lock them in (repeat this procedure for each group separately)
10.4 When cats are done with eating, let them move into their room (each group separately)
10.5 Note the intake in the intake protocol (MAP folder), remove the bowls and put them in the
dishwasher
10.6 Clean the feeding cages (vacuum hairs and if necessary wash with a wet cloth)
11. Before leaving 11.1 Transfer all recording to the computer in the kitchen (Folder EATING BEHAVIOUR
KIBBLES\recordings) on the pulpit and make a backup copy: on the black flash drive (STORE
N GO:\EATING BEHAVIOUR KIBBLES\recordings) and on the blue flash drive
(Cnmemory:\EATING BEHAVIOUR KIBBLES\recordings). They are stored in the MAP
folder.
11.2 Take a picture of the REPORT 1 from this day and transfer it to the computer in the kitchen
and make two backup copies (Folder EATING BEHAVIOUR KIBBLES\Report 1; external
disc (I:\EATING BEHAVIOUR KIBBLES\Report 1)
11.3 Place all the documents and the two external discs in the MAP Folder and inform the co-
workers (WhatsApp group) if there are any unusual observation concerning cats or the facility.
11.4 Tidy up the kitchen and the metabolism room. Clean the feeding cages with hot water and
detergent if necessary. Put the bowls and cutting boards in the dishwasher. Start the dishwasher.
Turn off the light when leaving.
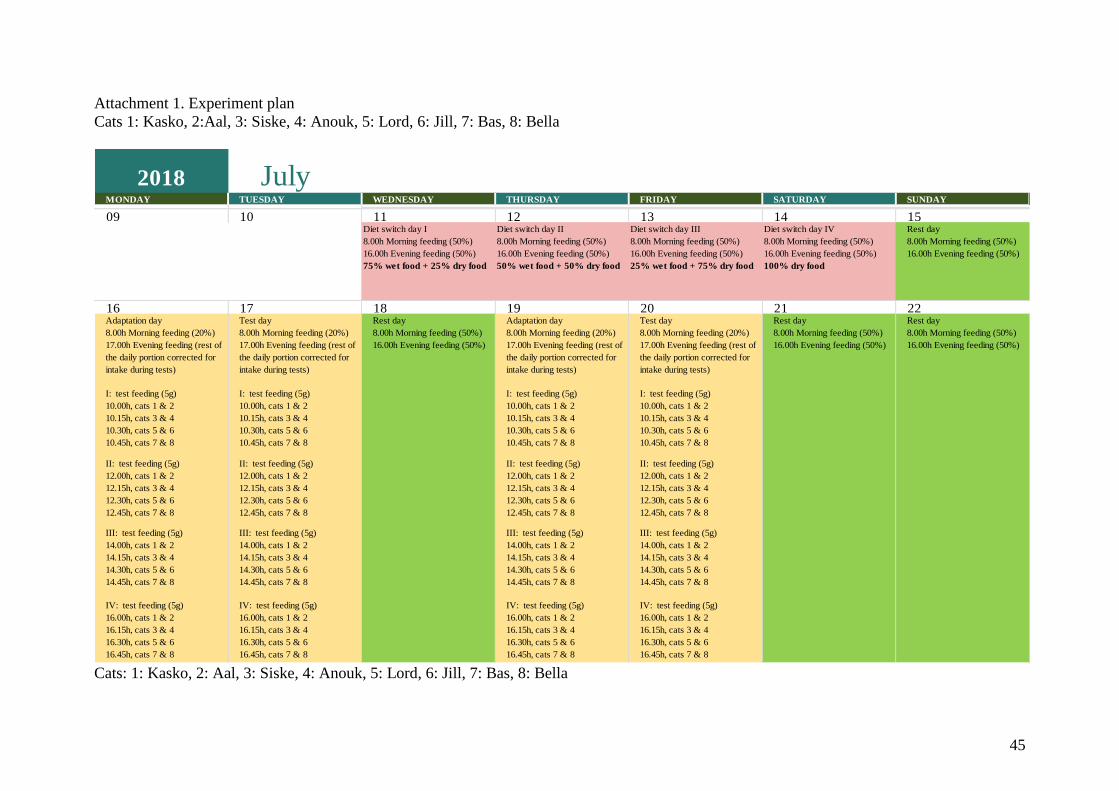
45
Attachment 1. Experiment plan
Cats 1: Kasko, 2:Aal, 3: Siske, 4: Anouk, 5: Lord, 6: Jill, 7: Bas, 8: Bella
Cats: 1: Kasko, 2: Aal, 3: Siske, 4: Anouk, 5: Lord, 6: Jill, 7: Bas, 8: Bella
2018MONDAY TUESDAY WEDNESDAY THURSDAY FRIDAY SATURDAY SUNDAY
09 10 11 12 13 14 15Diet switch day I
8.00h Morning feeding (50%)
16.00h Evening feeding (50%)
75% wet food + 25% dry food
Diet switch day II
8.00h Morning feeding (50%)
16.00h Evening feeding (50%)
50% wet food + 50% dry food
Diet switch day III
8.00h Morning feeding (50%)
16.00h Evening feeding (50%)
25% wet food + 75% dry food
Diet switch day IV
8.00h Morning feeding (50%)
16.00h Evening feeding (50%)
100% dry food
Rest day
8.00h Morning feeding (50%)
16.00h Evening feeding (50%)
16 17 18 19 20 21 22Adaptation day
8.00h Morning feeding (20%)
17.00h Evening feeding (rest of
the daily portion corrected for
intake during tests)
Test day
8.00h Morning feeding (20%)
17.00h Evening feeding (rest of
the daily portion corrected for
intake during tests)
Rest day
8.00h Morning feeding (50%)
16.00h Evening feeding (50%)
Adaptation day
8.00h Morning feeding (20%)
17.00h Evening feeding (rest of
the daily portion corrected for
intake during tests)
Test day
8.00h Morning feeding (20%)
17.00h Evening feeding (rest of
the daily portion corrected for
intake during tests)
Rest day
8.00h Morning feeding (50%)
16.00h Evening feeding (50%)
Rest day
8.00h Morning feeding (50%)
16.00h Evening feeding (50%)
I: test feeding (5g)
10.00h, cats 1 & 2
10.15h, cats 3 & 4
10.30h, cats 5 & 6
10.45h, cats 7 & 8
I: test feeding (5g)
10.00h, cats 1 & 2
10.15h, cats 3 & 4
10.30h, cats 5 & 6
10.45h, cats 7 & 8
I: test feeding (5g)
10.00h, cats 1 & 2
10.15h, cats 3 & 4
10.30h, cats 5 & 6
10.45h, cats 7 & 8
I: test feeding (5g)
10.00h, cats 1 & 2
10.15h, cats 3 & 4
10.30h, cats 5 & 6
10.45h, cats 7 & 8
II: test feeding (5g)
12.00h, cats 1 & 2
12.15h, cats 3 & 4
12.30h, cats 5 & 6
12.45h, cats 7 & 8
II: test feeding (5g)
12.00h, cats 1 & 2
12.15h, cats 3 & 4
12.30h, cats 5 & 6
12.45h, cats 7 & 8
II: test feeding (5g)
12.00h, cats 1 & 2
12.15h, cats 3 & 4
12.30h, cats 5 & 6
12.45h, cats 7 & 8
II: test feeding (5g)
12.00h, cats 1 & 2
12.15h, cats 3 & 4
12.30h, cats 5 & 6
12.45h, cats 7 & 8
III: test feeding (5g)
14.00h, cats 1 & 2
14.15h, cats 3 & 4
14.30h, cats 5 & 6
14.45h, cats 7 & 8
III: test feeding (5g)
14.00h, cats 1 & 2
14.15h, cats 3 & 4
14.30h, cats 5 & 6
14.45h, cats 7 & 8
III: test feeding (5g)
14.00h, cats 1 & 2
14.15h, cats 3 & 4
14.30h, cats 5 & 6
14.45h, cats 7 & 8
III: test feeding (5g)
14.00h, cats 1 & 2
14.15h, cats 3 & 4
14.30h, cats 5 & 6
14.45h, cats 7 & 8
IV: test feeding (5g)
16.00h, cats 1 & 2
16.15h, cats 3 & 4
16.30h, cats 5 & 6
16.45h, cats 7 & 8
IV: test feeding (5g)
16.00h, cats 1 & 2
16.15h, cats 3 & 4
16.30h, cats 5 & 6
16.45h, cats 7 & 8
IV: test feeding (5g)
16.00h, cats 1 & 2
16.15h, cats 3 & 4
16.30h, cats 5 & 6
16.45h, cats 7 & 8
IV: test feeding (5g)
16.00h, cats 1 & 2
16.15h, cats 3 & 4
16.30h, cats 5 & 6
16.45h, cats 7 & 8
July

46
2018MONDAY TUESDAY WEDNESDAY THURSDAY FRIDAY SATURDAY SUNDAY
23 24 25 26 27 28 29Adaptation day
8.00h Morning feeding (20%)
17.00h Evening feeding (rest of
the daily portion corrected for
intake during tests)
Test day
8.00h Morning feeding (20%)
17.00h Evening feeding (rest of
the daily portion corrected for
intake during tests)
Rest day
8.00h Morning feeding (50%)
16.00h Evening feeding (50%)
Test day
8.00h Morning feeding (20%)
17.00h Evening feeding (rest of
the daily portion corrected for
intake during tests)
Rest day
8.00h Morning feeding (50%)
16.00h Evening feeding (50%)
Rest day
8.00h Morning feeding (50%)
16.00h Evening feeding (50%)
Rest day
8.00h Morning feeding (50%)
16.00h Evening feeding (50%)
I: test feeding (5g)
10.00h, cats 1 & 2
10.15h, cats 3 & 4
10.30h, cats 5 & 6
10.45h, cats 7 & 8
I: test feeding (5g)
10.00h, cats 1 & 2
10.15h, cats 3 & 4
10.30h, cats 5 & 6
10.45h, cats 7 & 8
I: test feeding (5g)
10.00h, cats 1 & 2
10.15h, cats 3 & 4
10.30h, cats 5 & 6
10.45h, cats 7 & 8
II: test feeding (5g)
12.00h, cats 1 & 2
12.15h, cats 3 & 4
12.30h, cats 5 & 6
12.45h, cats 7 & 8
II: test feeding (5g)
12.00h, cats 1 & 2
12.15h, cats 3 & 4
12.30h, cats 5 & 6
12.45h, cats 7 & 8
II: test feeding (5g)
12.00h, cats 1 & 2
12.15h, cats 3 & 4
12.30h, cats 5 & 6
12.45h, cats 7 & 8
III: test feeding (5g)
14.00h, cats 1 & 2
14.15h, cats 3 & 4
14.30h, cats 5 & 6
14.45h, cats 7 & 8
III: test feeding (5g)
14.00h, cats 1 & 2
14.15h, cats 3 & 4
14.30h, cats 5 & 6
14.45h, cats 7 & 8
III: test feeding (5g)
14.00h, cats 1 & 2
14.15h, cats 3 & 4
14.30h, cats 5 & 6
14.45h, cats 7 & 8
IV: test feeding (5g)
16.00h, cats 1 & 2
16.15h, cats 3 & 4
16.30h, cats 5 & 6
16.45h, cats 7 & 8
IV: test feeding (5g)
16.00h, cats 1 & 2
16.15h, cats 3 & 4
16.30h, cats 5 & 6
16.45h, cats 7 & 8
IV: test feeding (5g)
16.00h, cats 1 & 2
16.15h, cats 3 & 4
16.30h, cats 5 & 6
16.45h, cats 7 & 8
July

47
Attachment 2. . Experimental diets set up
day date day round cat 1 cat 2 cat 3 cat 4 cat 5 cat 6 cat 7 cat 8
I
Monday
AD
AP
TA
TIO
N
16.0
7
1 12 4 9 3 2 12 1 11
2 5 14 11 16 9 11 18 4
3 3 1 18 12 13 16 5 14
4 1 9 16 14 18 2 13 3
kcal sum 82.65 88.47 86.88 80.91 85.41 82.09 86.11 81.27
Tues
day
TE
ST
17.0
7
1 3 1 16 12 13 11 5 14
2 5 14 18 16 9 12 13 3
3 1 9 11 3 2 16 18 4
4 12 4 9 14 18 2 1 11
kcal sum 82.65 88.47 86.88 80.91 85.41 82.09 86.11 81.27
II
Thurs
day
AD
AP
TA
TIO
N
19.0
7
1 14 3 13 9 14 18 9 5
2 16 5 2 1 12 4 14 13
3 2 16 4 2 4 5 3 12
4 18 11 12 13 11 1 16 1
kcal sum 84.04 83.60 83.25 87.28 80.81 88.40 85.18 84.06
Fri
day
TE
ST
20.0
7
1 16 5 2 1 11 4 3 12
2 14 3 13 9 4 18 16 1
3 18 11 12 13 14 1 9 5
4 2 16 4 2 12 5 14 13
kcal sum 84.04 83.60 83.25 87.28 80.81 88.40 85.18 84.06
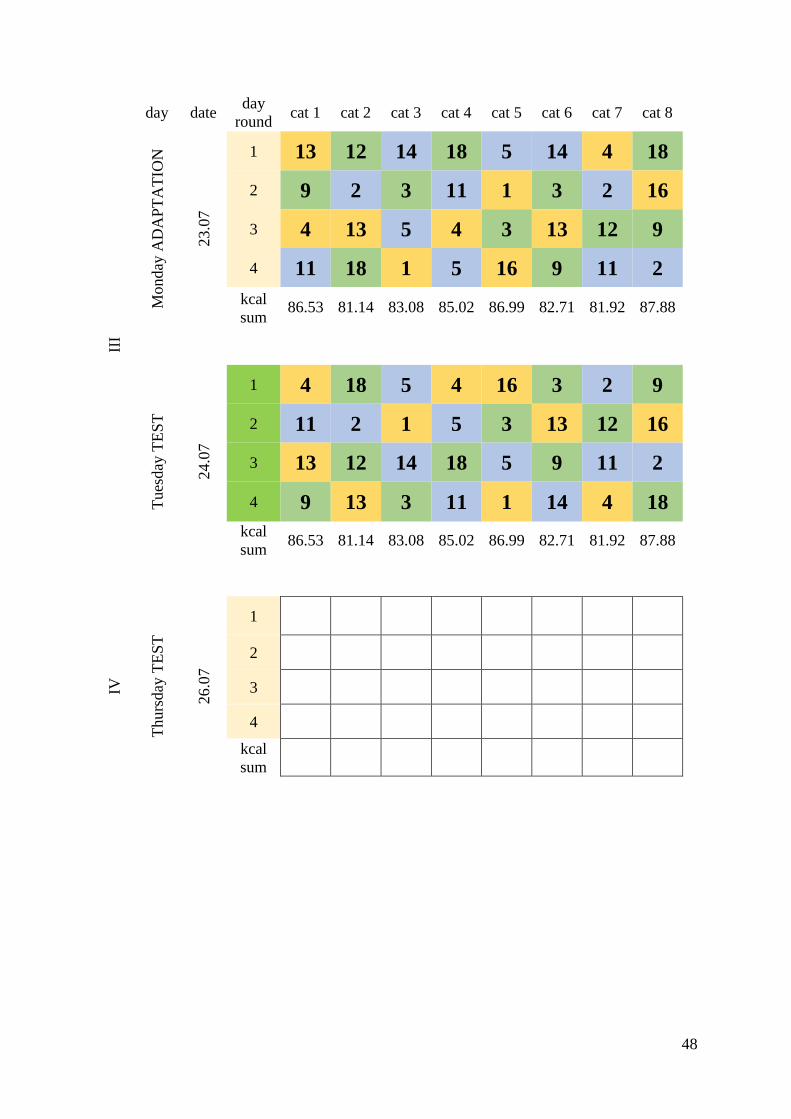
48
day date
day
round cat 1 cat 2 cat 3 cat 4 cat 5 cat 6 cat 7 cat 8
III
Monday
AD
AP
TA
TIO
N
23.0
7
1 13 12 14 18 5 14 4 18
2 9 2 3 11 1 3 2 16
3 4 13 5 4 3 13 12 9
4 11 18 1 5 16 9 11 2
kcal
sum 86.53 81.14 83.08 85.02 86.99 82.71 81.92 87.88
Tues
day
TE
ST
24.0
7
1 4 18 5 4 16 3 2 9
2 11 2 1 5 3 13 12 16
3 13 12 14 18 5 9 11 2
4 9 13 3 11 1 14 4 18
kcal
sum 86.53 81.14 83.08 85.02 86.99 82.71 81.92 87.88
IV
Thurs
day
TE
ST
26.0
7
1
2
3
4
kcal
sum

49
Attachment 3. List of experimental diets and their energy content Diet
Number in research kcal in 5g [as it is]
Animonda Integra Protect Adult Diabetes 1A 22.84
Purina Cat Chow Kitten Kip Kattenvoer 2A 20.46
Animonda Integra Protect Adult Obesitas 3 AD 19.38
Happy Cat Nierdieet 4 BC 23.08
Josera Marinesse 5B 21.51
Royal Canin Sphynx Adult 9 C 23.20
Josera Léger 11 D 19.46
Hill's Feline Indoor Cat Adult Kip 12 DE 18.92
Iams® Cat Mature Hairball Control with Whitefish 13E 20.79
Royal Canin Light Weight Care 14 AE 19.35
Hills science plan healthy ageing 16 AF 23.26
Almo Nature Orange Label Adult Sardientjes 18 F 20.97
Experimental diets – shapes defined by colours:
O ‘disc’ shaped kibbles – orange
Y ‘turbine’ shaped kibbles – blue
Δ ‘triangle’ shaped kibbles - green
Estimation of nutrient content in experimental diets:
A high protein </= 40%
B low protein </= 32.5%
C high fat </= 20%
D low fat </= 10%
E high fiber </= 5.5%
F low fiber </= 2%
O 1,4,13,16
Y 2,5,11,14
Δ 3,9,12,18

50
Report 1.
Mo
nd
ay A
DA
PT
AT
ION
16
.07
.18
day
round cat 1 cat 2 cat 3 cat 4 cat 5 cat 6 cat 7 cat 8 notes
1
diet 12 4 9 3 2 12 1 11
weight
[g] 5.13 5.22 4.99 5.28 5.04 5.15 5.07 5.11
2
diet 5 14 11 16 9 11 18 4
cat 8. 5 g
leftovers
weight
[g] 5.29 5.11 5.18 4.98 5.26 5.03 5.20 5.21
3
diet 3 1 18 12 13 16 5 14
cat 5 ate one
kibble before
recording started
weight
[g] 5.18 5.03 5.17 5.13 5.09 5.06 5.15 5.13
4
diet 1 9 16 14 18 2 13 3
cat 8. 5 g
leftovers
weight
[g] 5.04 5.30 5.08 5.10 5.50 5.10 5.02 5.36
leftovers [g] 10.00
leftovers
[kcal] 42.46
experiment
[kcal] 82.65 88.47 86.88 80.91 85.41 82.09 86.11 81.27
80 % intake
[kcal] 201.71 127.75 275.67 161.37 161.37 154.64 201.71 147.92
80 % intake -
exp. meals
[kcal]
119.06 39.28 188.79 80.46 75.95 72.55 115.60 109.11
80 % intake -
exp. meals [g] 28.33 9.35 44.93 19.15 18.07 17.26 27.51 25.97
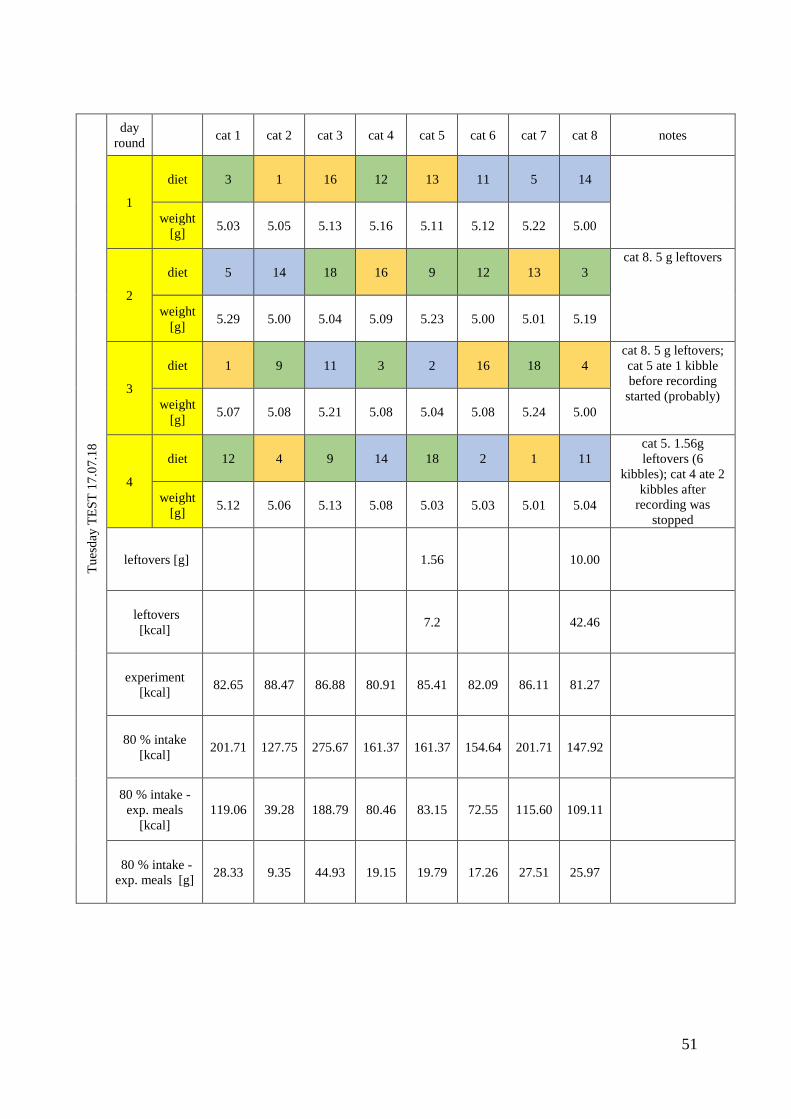
51
T
ues
day
TE
ST
17
.07.1
8
day
round cat 1 cat 2 cat 3 cat 4 cat 5 cat 6 cat 7 cat 8 notes
1
diet 3 1 16 12 13 11 5 14
weight
[g] 5.03 5.05 5.13 5.16 5.11 5.12 5.22 5.00
2
diet 5 14 18 16 9 12 13 3
cat 8. 5 g leftovers
weight
[g] 5.29 5.00 5.04 5.09 5.23 5.00 5.01 5.19
3
diet 1 9 11 3 2 16 18 4
cat 8. 5 g leftovers;
cat 5 ate 1 kibble
before recording
started (probably) weight
[g] 5.07 5.08 5.21 5.08 5.04 5.08 5.24 5.00
4
diet 12 4 9 14 18 2 1 11
cat 5. 1.56g
leftovers (6
kibbles); cat 4 ate 2
kibbles after
recording was
stopped
weight
[g] 5.12 5.06 5.13 5.08 5.03 5.03 5.01 5.04
leftovers [g] 1.56 10.00
leftovers
[kcal] 7.2 42.46
experiment
[kcal] 82.65 88.47 86.88 80.91 85.41 82.09 86.11 81.27
80 % intake
[kcal] 201.71 127.75 275.67 161.37 161.37 154.64 201.71 147.92
80 % intake -
exp. meals
[kcal]
119.06 39.28 188.79 80.46 83.15 72.55 115.60 109.11
80 % intake -
exp. meals [g] 28.33 9.35 44.93 19.15 19.79 17.26 27.51 25.97

52
T
hu
rsd
ay A
DA
PT
AT
ION
19
.07
.18
day
round cat 1 cat 2 cat 3 cat 4 cat 5 cat 6 cat 7 cat 8 notes
1
diet 14 3 13 9 14 18 9 5
cat 6. left one
kibble; cat 8. 5g
leftovers
weight
[g] 5.08 5.07 5.11 5.16 5.03 5.16 5.27 5.04
2
diet 16 5 2 1 12 4 14 13
cat 6. leftovers
4.79; cat 8 0.63
g (3 kibbles
leftovers) weight
[g] 5.12 5.18 5.06 5.00 5.15 5.05 5.02 5.18
3
diet 2 16 4 2 4 5 3 12
cat 8. 5g
leftovers
weight
[g] 5.04 5.00 5.09 5.04 5.08 5.11 5.15 5.02
4
diet 18 11 12 13 11 1 16 1
cat 8. 5g
leftovers
weight
[g] 5.16 5.15 5.09 5.09 5.11 5.02 5.05 5.09
leftovers [g] 4.79 16.00
leftovers
[kcal]
22
64.00
experiment
[kcal] 84.04 83.60 83.25 87.28 80.81 88.40 85.18 84.06
80 % intake
[kcal] 201.71 127.75 275.67 161.37 161.37 154.64 201.71 147.92
80 % intake -
exp. meals
[kcal]
117.67 44.15 192.42 74.08 80.56 88.24 116.53 127.86
80 % intake -
exp. meals [g] 28.00 10.51 45.79 17.63 19.17 21.00 27.73 30.43

53
Fri
day
TE
ST
20
.07
.18
day
round cat 1 cat 2 cat 3 cat 4 cat 5 cat 6 cat 7 cat 8 notes
1
diet 16 5 2 1 11 4 3 12
cat 6. 5.01 g
leftovers
weight
[g] 5.15 5.18 5.03 5.07 5.50 5.10 5.12 5.06
2
diet 14 3 13 9 4 18 16 1
cat 5. 0.65 g (3
kibbles)
leftovers;
cat 8 4.91 g
leftovers weight
[g] 5.02 5.10 5.14 5.01 5.13 5.17 5.00 5.16
3
diet 18 11 12 13 14 1 9 5
cat 8 5.25g
leftovers
weight
[g] 5.23 5.13 5.08 5.06 5.08 5.11 5.06 5.25
4
diet 2 16 4 2 12 5 14 13
cat 8 1.92g
leftovers
weight
[g] 5.08 5.01 5.06 5.00 5.00 5.05 5.00 5.00
leftovers [g] 0.65 5.01 12.08
leftovers
[kcal] 23.08 52.35
experiment
[kcal] 84.04 83.60 83.25 87.28 80.81 88.40 85.18 84.06
80 % intake
[kcal] 201.71 127.75 275.67 161.37 161.37 154.64 201.71 147.92
80 % intake -
exp. meals
[kcal]
117.67 44.15 192.42 74.08 80.56 89.32 116.53 116.21
80 % intake -
exp. meals [g] 28.00 10.51 45.79 17.63 19.17 21.26 27.73 27.65

54
Mo
nd
ay A
DA
PT
AT
ION
23
.07
.18
day
round cat 1 cat 2 cat 3 cat 4 cat 5 cat 6 cat 7 cat 8 notes
1
diet 13 12 14 18 5 14 4 18
weight
[g] 5.04 5.02 5.03 5.14 5.08 5.09 5.16 5.09
2
diet 9 2 3 11 1 3 2 16
noise outside
(drying during
the first 2 cats)
weight
[g] 5.18 5.10 5.15 5.20 5.01 5.22 5.06 5.02
3
diet 4 13 5 4 3 13 12 9
cat 4. 3.58g; cat
8 0.66g left (2
kibbles)
weight
[g] 5.08 5.13 5.13 5.02 5.21 5.05 5.09 5.29
4
diet 11 18 1 5 16 9 11 2
weight
[g] 5.01 5.03 5.02 5.09 5.00 5.10 5.05 5.01
leftovers [g] 3.58 0.66
leftovers [kcal] 17.00 3.00
experiment
[kcal] 86.53 81.14 83.08 85.02 86.99 82.71 81.92 87.88
80 % intake
[kcal] 201.71 127.75 275.67 161.37 161.37 154.64 201.71 147.92
80 % intake -
exp. meals
[kcal]
115.19 46.61 192.59 93.35 74.38 71.93 119.79 63.04
80 % intake -
exp. meals [g] 27.41 11.09 45.83 22.21 17.70 17.12 28.51 15.00

55
Tu
esd
ay T
ES
T 2
4.0
7.1
8
day
round cat 1 cat 2 cat 3 cat 4 cat 5 cat 6 cat 7 cat 8 notes
1
diet 4 18 5 4 16 3 2 9 cat 4 refusals; cat
8 refusals (ate
after, too big or
too hard kibbles,
pain during
biting them??, )
weight
[g] 5.13 5.22 5.14 5.02 5.12 5.18 5.06 5.33
2
diet 11 2 1 5 3 13 12 16
weight
[g] 5.16 5.09 5.20 5.17 5.11 5.11 5.12 5.05
3
diet 13 12 14 18 5 9 11 2
weight
[g] 5.13 5.07 5.03 5.03 5.04 5.03 5.08 5.08
4
diet 9 13 3 11 1 14 4 18 cat 5 0.48 g
leftovers (3
kibbles); cat 8
0.29 g leftovers
(1 kibble) weight
[g] 5.18 5.11 5.18 5.10 5.00 5.06 5.25 5.09
leftovers [g] 5.02 0.48 0.29
leftovers
[kcal] 23.08 3.00 2.00
experiment
[kcal] 86.53 81.14 83.08 85.02 86.99 82.71 81.92 87.88
80 % intake
[kcal] 201.71 127.75 275.67 161.37 161.37 154.64 201.71 147.92
80 % intake -
exp. meals
[kcal]
115.19 46.61 192.59 99.43 77.38 71.93 119.79 62.04
80 % intake -
exp. meals [g] 27.41 11.09 45.83 23.66 18.41 17.12 28.51 14.76

56
Th
urs
day
TE
ST
26
.07
.18
day round cat 1 cat 2 cat 3 cat 4 cat 5 cat 6 cat 7 cat 8 notes
1
diet 4 4 16 3
cats 4, 6, 8
refusal
weight [g] 5.15 5.07 5.15 5.22
2
diet 2 5
cat 8 refusal
weight [g] 5.01 5.07
3
diet 11 1
cat 8 refusal
weight [g] 5.27 5.17
4
diet 4 9
cat 8 refusal
weight [g] 5.12 5.14
leftovers [g] 5.15 5.07 20
leftovers [kcal] 23.08 23.08 86.93
experiment [kcal] 23.08 23.08 86.26 86.93
80 % intake [kcal] 161.37 154.64 201.71 147.92
80 % intake - exp. meals
[kcal] 161.37 154.64 115.45 147.92
80 % intake - exp. meals
[g] 38.40 36.80 27.47 35.20

57
The content of energy in experimental meals:
day day round cat 1 cat 2 cat 3 cat 4 cat 5 cat 6 cat 7 cat 8
Monday 16.07.18
1 18.92 23.08 23.20 19.38 20.46 18.92 22.84 19.46
2 21.51 19.35 19.46 23.26 23.20 19.46 20.97 23.08
3 19.38 22.84 20.97 18.92 20.79 23.26 21.51 19.35
4 22.84 23.20 23.26 19.35 20.97 20.46 20.79 19.38
kcal sum 82.65 88.47 86.88 80.91 85.41 82.09 86.11 81.27
Tuesday 17.07.18
1 19.38 22.84 23.26 18.92 20.79 19.46 21.51 19.35
2 21.51 19.35 20.97 23.26 23.20 18.92 20.79 19.38
3 22.84 23.20 19.46 19.38 20.46 23.26 20.97 23.08
4 18.92 23.08 23.20 19.35 20.97 20.46 22.84 19.46
kcal sum 82.65 88.47 86.88 80.91 85.41 82.09 86.11 81.27
Thursday 19.07.18
1 19.35 19.38 20.79 23.20 19.35 20.97 23.20 21.51
2 23.26 21.51 20.46 22.84 18.92 23.08 19.35 20.79
3 20.46 23.26 23.08 20.46 23.08 21.51 19.38 18.92
4 20.97 19.46 18.92 20.79 19.46 22.84 23.26 22.84
kcal sum 84.04 83.60 83.25 87.28 80.81 88.40 85.18 84.06
Friday 20.07.18
1 23.26 21.51 20.46 22.84 19.46 23.08 19.38 18.92
2 19.35 19.38 20.79 23.20 23.08 20.97 23.26 22.84
3 20.97 19.46 18.92 20.79 19.35 22.84 23.20 21.51
4 20.46 23.26 23.08 20.46 18.92 21.51 19.35 20.79
kcal sum 84.04 83.60 83.25 87.28 80.81 88.40 85.18 84.06
Monday 23.07.18
1 20.79 18.92 19.35 20.97 21.51 19.35 23.08 20.97
2 23.20 20.46 19.38 19.46 22.84 19.38 20.46 23.26
3 23.08 20.79 21.51 23.08 19.38 20.79 18.92 23.20
4 19.46 20.97 22.84 21.51 23.26 23.20 19.46 20.46
kcal sum 86.53 81.14 83.08 85.02 86.99 82.71 81.92 87.88
Tuesday 24.07.18
1 23.08 20.97 21.51 23.08 23.26 19.38 20.46 23.20
2 19.46 20.46 22.84 21.51 19.38 20.79 18.92 23.26
3 20.79 18.92 19.35 20.97 21.51 23.20 19.46 20.46
4 23.20 20.79 19.38 19.46 22.84 19.35 23.08 20.97
kcal sum 86.53 81.14 83.08 85.02 86.99 82.71 81.92 87.88

58
Appendix IV. Hardness mean ± SD, and CV, its average and range
of investigated kibbles when using different probes for evaluation
and skipped the highest and lowest value (average means based on
5 repeated tests per food)
Instron probe
Food Platen Blade Cone Cat model
Mean±SD CV [%] Mean±SD CV [%] Mean±SD CV [%] Mean±SD CV [%]
1 14.29±2.31 16 3.59±0.44 12 6.01±0.27 5 3.57±0.63 18
2 12.78±1.37 11 2.84±0.23 8 3.61±0.46 13 1.73±0.32 18
3 69.56±8.59 12 5.35±0.18 3 3.73±0.53 14 5.53±0.55 1
4 18.67±4.22 23 1.91±0.15 8 3.65±0.55 15 2.07±0.47 23
5 11.99±1.58 13 3.77±0.59 16 5.10±0.52 1 2.31±0.63 27
6 13.31±1.57 12 3.59±0.34 9 5.28±0.81 15 3.49±0.87 25
7 18.44±3.44 19 18.33±3.40 19 4.62±0.53 12 4.49±0.68 15
8 8.21±1.44 18 1.84±0.21 11 2.86±0.57 20 1.42±0.32 22
9 23.36±3.50 15 4.42±0.54 12 6.65±0.46 7 4.47±1.20 27
10 15.55±1.29 8 2.95±0.22 8 6.22±0.52 8 3.71±0.20 5
11 23.97±3.68 15 3.9±0.52 13 6.53±0.51 8 3.36±0.53 16
12 23.55±5.15 22 3.28±0.31 10 5.38±0.51 9 2.59±0.13 5
13 36.43±1.91 5 3.48±0.62 18 4.52±0.99 22 3.18±0.28 9
14 12.22±0.69 6 2.97±0.41 14 5.56±0.45 8 2.56±0.22 9
15 8.32±0.91 11 1.85±0.53 29 3.15±0.42 13 2.00±0.65 33
16 13.23±1.59 12 2.76±0.33 12 3.39±0.17 5 2.61±0.45 17
17 15.15±2.67 18 2.93±0.44 15 4.14±0.71 17 1.79±0.37 21
18 14.43±1.96 14 4.02±0.64 16 6.45±0.94 15 2.88±0.44 15
Average 14 13 12 17
Range 5-23 3-29 5-22 1-33

59
Appendix V. Ingredients of experimental foods
Food Ingredients
1.Animonda Integra
Protect Adult Diabetes
greaves meal, potatoes (dried), peas (mixed), pea protein, poultry fat, beef suet,
salmon oil, poultry liver, cellulose, calcium carbonate, sodium chloride, green-
lipped muscle powder
2. Purina Cat Chow
Kitten Chicken
meat and animal products (min. 4% of chicken), cereals, vegetables, vegetable
poultry extracts (min. 2% of soya), oils and fats, fish and fish products (min. 2%
of salmon), minerals, yeast
3. Animonda Integra
Protect Adult Obesity
poultry meal (low ash), potatoes (dried), pea protein, beet pulp, cellulose, poultry
meal, poultry liver, salmon oil, yeast, green lipped mussel powder, hydrolysed
cartilage
4. Happy Cat Kidney
rice flour, potato flakes, poultry fat, poultry protein, greaves, potato protein,
cellulose, fish meal, haemoglobin, sugar beet molasses (sugar), meat meal, apple
pomace (0.4%), sodium chloride, linseed (0.2%), yeast, potassium chloride,
seaweed (0.06%), yucca schidigera (0.04%), chicory root (0.04%), yeast
(extracted), milk thistle, artichoke, dandelion, ginger, birch leaves, nettle,
camomile, coriander, rosemary, sage, licorice root, thyme (dried herbs total:
0.05%) dried hydrolysed proportionately
5. Josera Marinesse dried salmon, rice, dried potato, poultry fat, sugar beet pulp, potato protein,
hydrolysed fish protein, minerals
6. Royal Canin Indoor 27
corn, poultry protein (dried), rice, vegetable protein isolate, wheat, animal fat,
animal protein (hydrolysed), lignocellulose, minerals, beet pulp, soya oil, fructo-
oligosaccharides, yeast, fish oil
7. Hill's Feline Optimal
Care Adult Chicken
poultry meat meal, wheat, animal fats, maize, maize gluten, rice, digest, minerals,
beet pulp, fish oil
8. Smølke kitten
chicken meal (25%), corn gluten, corn, chicken fat (stabilized with natural
tocopherols), rice, sorghum, beet pulp, lamb flour (4%), fish meal (2%), vitamins
and minerals mix, hydrolysed protein, cellulose ( 1.3%), yeast (1%), fish oil
(0.8%) , chicory (0.7%)
9. Royal Canin Sphynx
Adult
poultry protein (dried), animal fat, rice, vegetable protein isolate, maize, vegetable
fibres, pork protein (dried), animal protein (hydrolysed), wheat, corn gluten feed,
beet pulp, minerals, yeasts, fish oil, tomato (source of lycopene), soya oil, fructo-
oligosaccharides, yeast hydrolysate (source of mannan-oligosaccharides), borage
oil, marigold extract (source of lutein)
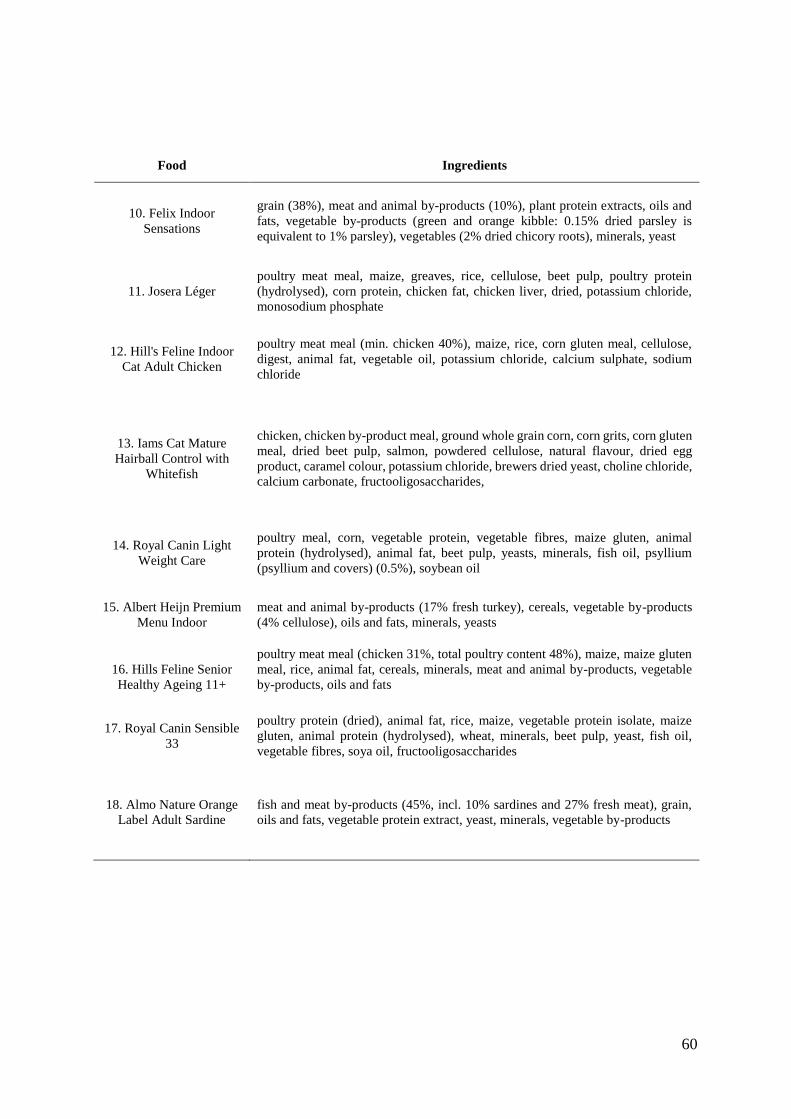
60
Food Ingredients
10. Felix Indoor
Sensations
grain (38%), meat and animal by-products (10%), plant protein extracts, oils and
fats, vegetable by-products (green and orange kibble: 0.15% dried parsley is
equivalent to 1% parsley), vegetables (2% dried chicory roots), minerals, yeast
11. Josera Léger
poultry meat meal, maize, greaves, rice, cellulose, beet pulp, poultry protein
(hydrolysed), corn protein, chicken fat, chicken liver, dried, potassium chloride,
monosodium phosphate
12. Hill's Feline Indoor
Cat Adult Chicken
poultry meat meal (min. chicken 40%), maize, rice, corn gluten meal, cellulose,
digest, animal fat, vegetable oil, potassium chloride, calcium sulphate, sodium
chloride
13. Iams Cat Mature
Hairball Control with
Whitefish
chicken, chicken by-product meal, ground whole grain corn, corn grits, corn gluten
meal, dried beet pulp, salmon, powdered cellulose, natural flavour, dried egg
product, caramel colour, potassium chloride, brewers dried yeast, choline chloride,
calcium carbonate, fructooligosaccharides,
14. Royal Canin Light
Weight Care
poultry meal, corn, vegetable protein, vegetable fibres, maize gluten, animal
protein (hydrolysed), animal fat, beet pulp, yeasts, minerals, fish oil, psyllium
(psyllium and covers) (0.5%), soybean oil
15. Albert Heijn Premium
Menu Indoor
meat and animal by-products (17% fresh turkey), cereals, vegetable by-products
(4% cellulose), oils and fats, minerals, yeasts
16. Hills Feline Senior
Healthy Ageing 11+
poultry meat meal (chicken 31%, total poultry content 48%), maize, maize gluten
meal, rice, animal fat, cereals, minerals, meat and animal by-products, vegetable
by-products, oils and fats
17. Royal Canin Sensible
33
poultry protein (dried), animal fat, rice, maize, vegetable protein isolate, maize
gluten, animal protein (hydrolysed), wheat, minerals, beet pulp, yeast, fish oil,
vegetable fibres, soya oil, fructooligosaccharides
18. Almo Nature Orange
Label Adult Sardine
fish and meat by-products (45%, incl. 10% sardines and 27% fresh meat), grain,
oils and fats, vegetable protein extract, yeast, minerals, vegetable by-products

61
Appendix VI. Additional data
Table 1. Surface area, thickness and kibbles weight of investigated foods.
Food Surface area [cm2] ± SD Thickness [mm] ± SD Weight of 100 kibbles [g]
1 3.64 ± 0.69 4.88 ± 0.75 14.80
2 2.54 ± 0.37 4.12 ± 0.44 11.95
3 2.79 ± 0.17 4.56 ± 0.39 27.45
4 5.16 ± 0.52 5.55 ± 0.57 25.95
5 4.47 ± 0.60 5.52 ± 0.56 27.30
6 3.34 ± 0.33 6.07 ± 0.37 22.65
7 4.41 ± 0.27 4.78 ± 0.25 27.90
8 2.90 ± 0.33 5.42 ± 0.24 9.15
9 3.77 ± 0.25 6.39 ± 0.30 32.70
10 6.59 ± 1.48 4.85 ± 0.24 20.50
11 4.28 ± 0.66 5.91 ± 0.50 25.35
12 3.03 ± 0.28 5.59 ± 0.52 21.55
13 8.03 ± 0.39 4.45 ± 0.30 21.05
14 3.41 ± 0.35 4.72 ± 0.29 14.25
15 2.75 ± 0.43 6.49 ± 0.75 18.00
16 6.21 ± 0.90 3.96 ± 0.25 15.95
17 3.63 ± 0.34 4.00 ± 0.34 18.20
18 2.46 ± 0.28 5.03 ± 0.51 26.45
Table 2. Hardness
Food Kahl [kg] ±
SD
Sotax [kg] ±
SD
I platen [kg] ±
SD
I cone [kg] ±
SD
I blade [kg] ±
SD
I cat [kg] ±
SD
1 12.83 ± 2.69 5.88 ± 1.48 14.73 ± 3.79 3.38 ± 0.99 5.98 ± 0.89 3.38 ± 1.49
2 10.25 ± 1.31 3.51 ± 1.12 12.73 ± 1.74 2.84 ± 0.29 3.59 ± 0.65 2.84 ± 0.38
3 4.29 ± 0.52 4.23 ± 0.65 68.60 ± 12.32 5.37 ± 0.24 4.05 ± 1.16 5.37 ± 0.77
4 8.31 ± 1.68 4.25 ± 0.45 19.07 ± 6.18 1.91 ± 0.21 3.67 ± 0.64 1.91 ± 0.54
5 8.42 ± 2.34 5.15 ± 1.42 11.79 ± 3.07 3.71 ± 0.97 5.21 ± 0.84 3.71 ± 0.82
6 11.63 ± 1.75 6.41 ± 0.70 13.16 ± 2.13 3.56 ± 0.55 5.23 ± 1.04 3.56 ± 1.05
7 14.23 ± 2.24 5.75 ± 1.39 17.99 ± 4.44 17.91 ± 4.41 4.64 ± 0.74 17.91 ± 0.75
8 4.44 ± 0.35 2.61 ± 0.40 8.22 ± 1.94 1.85 ± 0.37 3.03 ± 0.94 1.85 ± 0.53
9 16.4 ± 1.47 8.66 ± 0.79 24.12 ± 6.18 4.44 ± 0.78 6.74 ± 0.77 4.44 ± 1.94
10 12.42 ± 1.12 6.38 ± 0.76 15.48 ± 1.94 2.90 ± 0.36 6.17 ± 0.84 2.90 ± 0.54
11 15.9 ± 2.13 7.07 ± 0.88 22.95 ± 5.51 3.83 ± 0.60 6.54 ± 0.95 3.83 ± 0.54
12 8.44 ± 1.06 6.82 ± 0.66 23.39 ± 7.42 3.29 ± 0.39 5.28 ± 1.03 3.29 ± 0.30
13 13.69 ± 1.38 6.23 ± 1.40 36.08 ± 3.30 3.56 ± 0.92 4.70 ± 1.38 3.56 ± 0.39
14 11.18 ± 2.15 6.88 ± 1.00 12.43 ± 1.32 2.89 ± 0.68 5.53 ± 0.82 2.89 ± 0.34
15 5.44 ± 0.91 3.92 ± 0.55 8.53 ± 1.40 1.95 ± 0.74 3.14 ± 0.51 1.95 ± 0.78
16 7.94 ± 1.01 4.80 ± 0.96 13.55 ± 2.16 2.64 ± 0.77 3.53 ± 0.72 2.64 ± 0.95
17 10.9 ± 1.36 5.15 ± 0.94 15.14 ± 3.31 2.98 ± 0.88 4.21 ± 1.04 2.98 ± 0.76
18 8.95 ± 2.40 6.38 ± 1.12 14.92 ± 3.98 4.31 ± 1.41 6.45 ± 1.22 4.31 ± 0.99

62
Table 3. Brittleness
Food I platen [kg] ± SD I cone [kg] ± SD I blade [kg] ± SD
1 9.25 ± 1.56 1.62 ± 0.46 1.60 ± 0.15
2 6.29 ± 2.93 1.65 ± 0.09 1.55 ± 0.10
3 2.68 ± 0.34 1.79 ± 0.13 1.55 ± 0.15
4 9.86 ± 2.42 1.56 ± 0.39 1.61 ± 0.13
5 8.86 ± 3.41 1.80 ± 0.19 1.55 ± 0.11
6 7.30 ± 0.89 1.71 ± 0.02 1.65 ± 0.18
7 8.74 ± 6.81 4.89 ± 1.81 1.64 ± 0.12
8 3.28 ± 0.91 1.24 ± 0.27 1.63 ± 0.23
9 14.11 ± 1.72 1.72 ± 0.18 1.58 ± 0.13
10 12.53 ± 2.05 1.40 ± 0.47 1.72 ± 0.08
11 14.51 ± 1.19 1.76 ± 0.18 1.71 ± 0.02
12 11.19 ± 2.87 1.76 ± 0.12 1.66 ± 0.11
13 11.49 ± 8.10 1.19 ± 0.31 1.69 ± 0.10
14 8.16 ± 1.96 1.41 ± 0.30 1.70 ± 0.10
15 4.08 ± 0.94 1.20 ± 0.36 1.72 ± 0.16
16 7.09 ± 1.68 1.30 ± 0.34 1.65 ± 0.07
17 8.25 ± 1.23 1.47 ± 0.31 1.64 ± 0.10
18 5.52 ± 2.32 1.75 ± 0.13 1.67 ± 0.09
Table 4. Fragility
Food I platen [kg/s] ± SD I cone [kg/s] ± SD I blade [kg/s] ± SD I cat [kg/s] ± SD
1 21.43 ± 8.69 6.40 ± 3.18 14.77 ± 4.08 2.43 ± 0.66
2 13.61 ± 2.65 8.02 ± 1.41 12.38 ± 1.39 1.80 ± 0.60
3 70.28 ± 25.12 11.20 ± 1.00 9.75 ± 3.14 2.82 ± 0.28
4 15.82 ±6.43 7.34 ± 2.70 12.96 ± 1.12 2.23 ± 0.35
5 10.89 ± 5.62 10.44 ± 2.62 15.20 ± 3.03 1.50 ± 0.55
6 9.03 ± 1.31 6.48 ± 0.64 14.21 ± 3.20 1.91 ± 0.65
7 19.78 ± 9.16 12.53 ± 3.75 14.46 ± 2.70 2.50 ± 0.13
8 7.32 ± 2.43 5.60 ± 1.35 8.53 ± 2.42 1.21 ± 0.35
9 16.13 ± 4.43 6.70 ± 1.37 15.60 ± 1.62 2.35 ± 1.12
10 16.95 ± 8.76 5.42 ± 1.07 18.21 ± 2.49 2.16 ± 0.16
11 29.12 ± 12.81 9.13 ± 1.95 17.62 ± 4.19 2.13 ± 0.67
12 16.44 ± 5.42 7.51 ± 1.13 12.05 ± 3.96 2.04 ± 0.49
13 30.67 ± 3.41 4.73 ± 0.91 12.70 ± 3.75 2.02 ± 0.21
14 23.12 ± 7.27 6.23 ± 1.00 15.68 ± 2.40 1.83 ± 0.30
15 5.04 ± 1.32 4.62 ± 1.68 6.52 ± 3.25 1.32 ± 0.60
16 12.69 ± 3.00 5.71 ± 1.02 10.65 ± 1.60 1.68 ± 0.52
17 15.40 ± 3.64 5.44 ± 0.52 13.12 ± 2.87 1.52 ± 0.47
18 11.79 ± 3.20 14.99 ± 4.61 23.96 ± 5.66 2.31 ± 0.69

63
Table 5. Chewiness
Food I platen ±
SD I cone ± SD
I blade ±
SD I cat ± SD
1 7.85 ± 1.72 2.30 ± 0.37 1.50 ± 0.28 1.74 ± 1.66
2 6.59 ± 0.83 1.37 ± 0.13 0.63 ± 0.20 0.58 ± 0.35
3 27.57 ± 3.25 2.27 ± 0.77 1.15 ± 0.25 3.22 ± 1.57
4 8.98 ± 2.99 0.88 ± 0.26 0.67 ± 0.14 0.61 ± 0.32
5 5.82 ± 2.05 1.54 ± 0.47 1.26 ± 0.42 1.00 ± 0.99
6 7.41 ± 1.22 2.52 ± 0.80 1.35 ± 0.36 2.20 ± 2.08
7 8.99 ± 2.34 18.81 ± 4.39 0.94 ± 0.24 2.52 ± 1.43
8 3.17 ± 0.41 0.86 ± 0.38 0.79 ± 0.19 0.49 ± 0.46
9 16.93 ± 2.21 3.73 ± 0.77 1.72 ± 0.37 3.52 ± 3.44
10 9.12 ± 0.78 1.53 ± 0.65 1.30 ± 0.55 1.83 ± 0.79
11 12.12 ± 1.57 2.05 ± 0.66 1.59 ± 0.42 1.49 ± 0.25
12 13.17 ± 1.84 2.08 ± 0.19 1.22 ± 0.22 1.26 ± 0.47
13 17.24 ± 1.71 3.03 ± 0.90 1.13 ± 0.69 1.45 ± 0.57
14 7.61 ± 1.40 1.97 ± 0.56 1.31 ± 0.34 1.19 ± 0.46
15 5.36 ± 0.65 1.28 ± 0.52 1.29 ± 0.57 1.28 ± 1.09
16 6.64 ± 0.92 1.68 ± 0.65 0.72 ± 0.32 1.28 ± 1.02
17 7.45 ± 1.06 1.78 ± 0.74 0.83 ± 0.25 0.93 ± 0.47
18 6.70 ± 1.60 1.38 ± 0.43 0.73 ± 0.16 1.41 ± 1.24
Table 6. Ingestion speed
Food Ingestion speed [g/min]
cat 1 cat 2 cat 3 cat 4 cat 5 cat 6 cat 7 cat 8
1 4.99 4.89 7.43 4.61 4.05 5.20 7.91
2 5.44 4.18 7.02 3.06 4.88 3.97 5.33 3.76
3 10.06 8.27 10.36 5.44 5.29 7.23 9.91
4 7.70 5.15 8.43 2.89 7.50
5 6.90 4.71 10.28 4.03 3.83 5.22 8.70
9 9.71 6.63 11.84 7.33 6.54 6.71 9.79
11 6.32 6.28 8.02 5.10 7.50 4.21 7.43 3.98
12 6.14 4.91 7.62 4.49 5.56 5.17 7.14 4.98
13 5.70 5.20 8.12 5.42 3.98 4.79 8.12 5.66
14 6.85 4.35 6.56 5.75 4.84 4.53 5.56 5.00
16 7.73 8.35 8.32 5.18 7.68 5.98 6.67 5.51
18 10.46 8.95 12.60 6.16 3.47 5.26 10.84 5.24
Table 7. Biting + chewing rate
Food Biting + chewing rate [rpm]
cat 1 cat 2 cat 3 cat 4 cat 5 cat 6 cat 7 cat 8
1 3.93 0.97 2.86 0.00 1.79 2.03 1.58
2 4.29 1.64 5.58 0.00 0.97 6.32 3.16 4.44
3 22.00 9.73 14.00 2.14 12.41 12.56 13.55
4 12.00 9.15 8.33 9.03 4.29
5 11.74 16.36 20.00 4.68 22.03 16.55 11.67
9 5.63 1.30 11.54 1.46 5.00 9.33 7.74
11 9.80 4.90 12.31 5.00 12.27 9.04 2.93 12.77
12 4.80 3.87 9.00 2.61 6.67 5.17 1.40 12.79
13 12.22 14.24 9.47 2.14 8.57 11.25 11.35 7.92
14 2.73 1.74 5.22 4.53 0.95 7.16 3.33 9.00
16 4.50 0.00 16.22 1.02 3.00 1.18 0.00 13.09
18 0.00 3.43 5.00 0.00 0.00 4.07 4.14 6.55

64