effects of jet configuration on the performance of multi-nozzle impactors
TRANSCRIPT

Aerosol Science 33 (2002) 859–869www.elsevier.com/locate/jaerosci
E�ects of jet con guration on the performanceof multi-nozzle impactorsS.B. Kwon, M.C. Kim, K.W. Lee∗
Department of Environmental Science and Engineering, Kwangju Institute of Science and Technology, 1 Oryong-dong,Puk-gu, Kwangju 500-712, South Korea
Received 9 May 2001; received in revised form 5 December 2001; accepted 7 December 2001
Abstract
Multi-nozzle impactors are widely used for sampling aerosol particles under low Reynolds number conditionswithout large pressure drop, as compared to single-nozzle impactors at the same 6ow rate. The objective of thisstudy was to determine the optimal nozzle array for collecting PM2:5 with a 6ow rate of 50 l=min. Twentynozzles of the same size with di�erent nozzle positions were designed to produce ve di�erent models.Each nozzle plate was evaluated using monodisperse particles. Particle collection e9ciencies were measuredfor particles between 1 and 5 �m, by counting particle penetration through the individual test stages. Cuto�diameter at the 50% collection e9ciency was calculated using both linear and non-linear regression techniques.In addition, particle deposition patterns for each model were assessed visually. ? 2002 Elsevier Science Ltd.All rights reserved.
Keywords: Multi-nozzle impactor; Particle collection e9ciency; Cuto� diameter
1. Introduction
An impactor collects particles by making use of their inertial properties. Thus, large particles movethrough the air streamlines and deposit onto the impaction plates. Whether the particle will deposit onthe impaction plate or pass through the air streamlines depends not only on the physical propertiesof the particle, but also on the 6ow elds in the impactor jet. It was shown that the impactorswith sharp collection e9ciency curves can be obtained if the velocity pro les at the nozzle exit areuniform across the nozzle, in the case of the single-nozzle impactor (Marple & Liu, 1974). Basically,there is not much that can be done with the con guration to achieve a uniform 6ow at the nozzle
∗Corresponding author. Tel.: +82-62-970-2438; fax: +82-62-970-2434.E-mail address: [email protected] (K.W. Lee).
0021-8502/02/$ - see front matter ? 2002 Elsevier Science Ltd. All rights reserved.PII: S 0021-8502(02)00040-X
860 S.B. Kwon et al. / Aerosol Science 33 (2002) 859–869
exit with the exception of controlling the jet-to-plate distance (S). The S=W (W = jet diameter)value is designed generally, to be greater than 1.0 and 1.5 for round and rectangular impactors,respectively, to avoid sizable changes in the particle cuto� size resulting from small changes injet-to-plate distance (Rader & Marple, 1985). The Reynolds number of the 6uid at the nozzle throatis also important in terms of achieving a uniform velocity at the nozzle exit. In the design processof impactor, both the S=W ratio and the Reynolds number are considered as important parameters.In the case of multi-nozzle impactors, however, quantitative analysis has not been performed due
to the complexity of the 6ow elds. Nearly all the theoretical work, and much of the experimentalwork, have been performed on single-nozzle impactors. The results of single-nozzle impactor analysishave often been applied to multi-nozzle impactors, which are assumed to act as a group of individualnozzles. However, an important fact is ignored when considering this approach, i.e., the interactionbetween the 6ows from neighboring nozzles can change not only the 6uid mechanics in the impactionregion, but also the location of the jet stagnation points, and the impaction characteristics of eachnozzle. The cross-6ow in separation region can signi cantly de6ect the air jets of the outer nozzles,and hence a�ect the characteristics of impaction. Thus, the cross-6ow in6uences the particle collectione9ciency (May, 1964; Fletch, Norris, & Nugent, 1967; Vaughan, 1986; Fang, Marple, & Rubow,1991). However, there are no guidelines for the optimal arrangement of nozzles in the design ofmulti-nozzle impactors. This study was undertaken to determine the optimal nozzle arrangement forcollecting PM2:5 at a 6ow rate of 50 l=min. To determine the e�ects of nozzle array on the collectione9ciency, ve types of nozzle plates were designed and fabricated. All nozzle plates had the samenumber of nozzles with the same nozzle diameter. Particle collection e9ciencies were measuredusing monodisperse aerosol particles. The aerosol concentrations of upstream and downstream of theimpactor stage were determined. In addition, particle deposition patterns were examined for eachimpaction plate.
2. Design and fabrication
2.1. Design parameters of nozzle plate
An impactor is composed of a nozzle plate, an impaction plate, and a stage wall. Among theseimpactor components, the nozzle plate plays the most important role in determining the particlecollection e9ciency. The number of nozzles (N ) and nozzle diameter (W ) are major design param-eters in the multi-nozzle impactor. Marple and Willeke (1976) investigated the means to control theReynolds number by controlling the number of nozzles used in an impactor. However, the resultswere used only as guidelines when analyzing or designing impactors for Reynolds numbers of 500,3000 and 10,000. In this study, the number of nozzles was chosen on the basis of Reynolds number,and the nozzle diameter was calculated for a given impactor speci cation.The square root of the Stokes number at 50% particle collection e9ciency (
√St50) is de ned as
√St50 = D50
√�pVC9�W
; (1)
where �p is the particle density, V is the nozzle velocity, C is the slip correction factor, � is theair viscosity, W is the nozzle diameter, and D50 is the cuto� diameter at 50% collection e9ciency.
S.B. Kwon et al. / Aerosol Science 33 (2002) 859–869 861
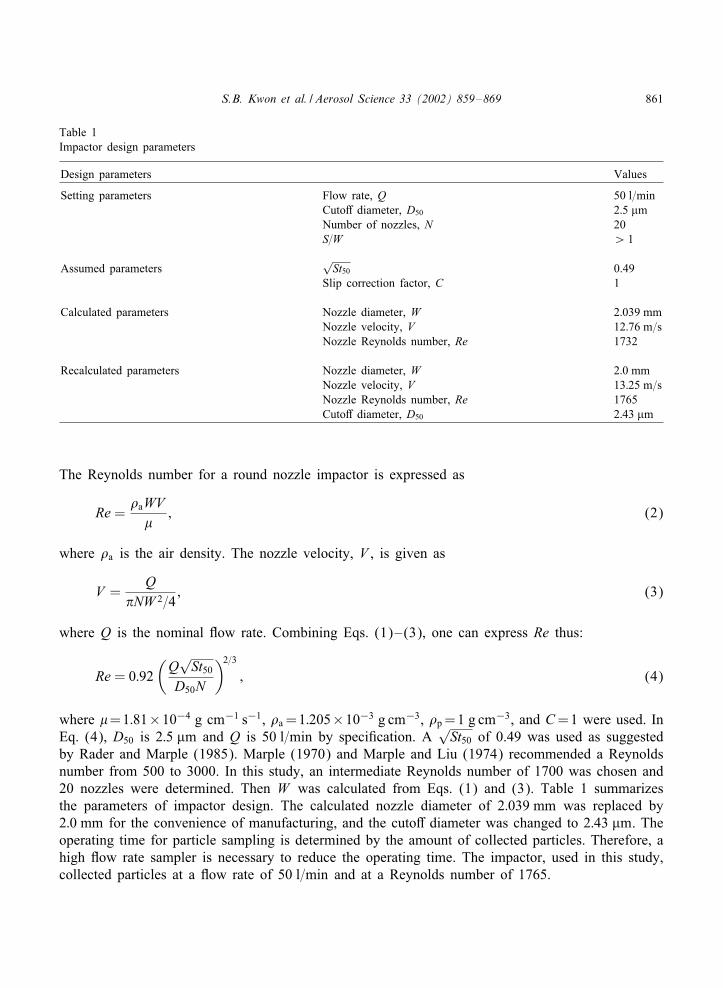
Table 1Impactor design parameters
Design parameters Values
Setting parameters Flow rate, Q 50 l=minCuto� diameter, D50 2:5 �mNumber of nozzles, N 20S=W ¿ 1
Assumed parameters√St50 0.49
Slip correction factor, C 1
Calculated parameters Nozzle diameter, W 2:039 mmNozzle velocity, V 12:76 m=sNozzle Reynolds number, Re 1732
Recalculated parameters Nozzle diameter, W 2:0 mmNozzle velocity, V 13:25 m=sNozzle Reynolds number, Re 1765Cuto� diameter, D50 2:43 �m
The Reynolds number for a round nozzle impactor is expressed as
Re =�aWV�
; (2)
where �a is the air density. The nozzle velocity, V , is given as
V =Q
�NW 2=4; (3)
where Q is the nominal 6ow rate. Combining Eqs. (1)–(3), one can express Re thus:
Re = 0:92(Q√St50
D50N
)2=3; (4)
where �=1:81×10−4 g cm−1 s−1, �a =1:205×10−3 g cm−3, �p=1 g cm−3, and C=1 were used. InEq. (4), D50 is 2:5 �m and Q is 50 l=min by speci cation. A
√St50 of 0.49 was used as suggested
by Rader and Marple (1985). Marple (1970) and Marple and Liu (1974) recommended a Reynoldsnumber from 500 to 3000. In this study, an intermediate Reynolds number of 1700 was chosen and20 nozzles were determined. Then W was calculated from Eqs. (1) and (3). Table 1 summarizesthe parameters of impactor design. The calculated nozzle diameter of 2:039 mm was replaced by2:0 mm for the convenience of manufacturing, and the cuto� diameter was changed to 2:43 �m. Theoperating time for particle sampling is determined by the amount of collected particles. Therefore, ahigh 6ow rate sampler is necessary to reduce the operating time. The impactor, used in this study,collected particles at a 6ow rate of 50 l=min and at a Reynolds number of 1765.
862 S.B. Kwon et al. / Aerosol Science 33 (2002) 859–869
Isokinetic sampler
O-ring
Outlet
(S/W adjustment)Auxiliary ring
Clamping ring
(Model 1~5)Nozzle plate
Impaction plate
Stage wall
Aerosol flow
Inlet
Fig. 1. Cross-sectional view of the impactor stage showing the impactor inlet and outlet for particle counting.
2.2. Design and fabrication of the impactor stage
A schematic diagram of the impactor stage with inlet and outlet is shown in Fig. 1. The 37 mmsubstrate was xed to the impaction plate using a clamping ring. The S=W ratio was adjusted usingthe auxiliary rings between the nozzle plate and impaction plate. The stage wall supports the nozzleplate and the impaction plate with the variable jet-to-plate distances (S), from 2.4 to 4:4 mm, whichcorrespond to S=W ratios from 1.25 to 2.25.A cross-6ow parameter was derived by Fang et al. (1991) which allows the prediction of jet
de6ection created by the cross-6ow. This parameter was expressed as a function of the geometricparameters of the multi-nozzle impactor, i.e. as WN=4Dc, where W is the nozzle diameter, N isthe number of nozzles and Dc is the nozzle cluster diameter. Two assumptions were made whenapplying this parameter to impactor design. First, the nozzles are assumed to be of the same size,that are distributed uniformly on the nozzle plate over the nozzle cluster diameter. Second, all thenozzles are assumed to experience equal upstream and downstream pressure. It was shown thatmulti-nozzle impactors operate satisfactorily, if the cross-6ow parameter is less than a critical valueof 1.2. In the design of the nozzle plate, ve di�erent plates were considered. Models 1–3 were
S.B. Kwon et al. / Aerosol Science 33 (2002) 859–869 863
Fig. 2. Plan view of 5 nozzle plates (nozzle plate diameter=63 mm, number of nozzles=20 and nozzle diameter=2 mm).
designed to satisfy the cross-6ow parameter. However, this was not done for Models 4 and 5, sincethe density of nozzles (number of nozzles per unit area) is not constant. Fig. 2 shows the schematicdesign of the ve nozzle plates. Each plate contains 20 nozzles with the same diameter of 2 mm. InModels 1–3, all the nozzles were drilled within a nozzle cluster diameter ¡ 22 mm, which satis esthe criteria of the cross-6ow parameter. Model 4 was designed to have ten nozzles on the peripheryof a 16 mm circle, and the other ten nozzles on a 20 mm circle, and Model 5 was designed tohave all the twenty nozzles on the periphery of a 20 mm circle. The layout of Model 3 was of thetype generally used in the commercial MOUDI and Andersen impactor (Andersen Instruments Inc.,Atlanta, GA), while Model 5 represents the Berner-type impactor in which the nozzles are locatedsymmetrically on the periphery of a circle. Table 2 shows the details of the nozzle plates.
3. Experimental
3.1. Experimental setup
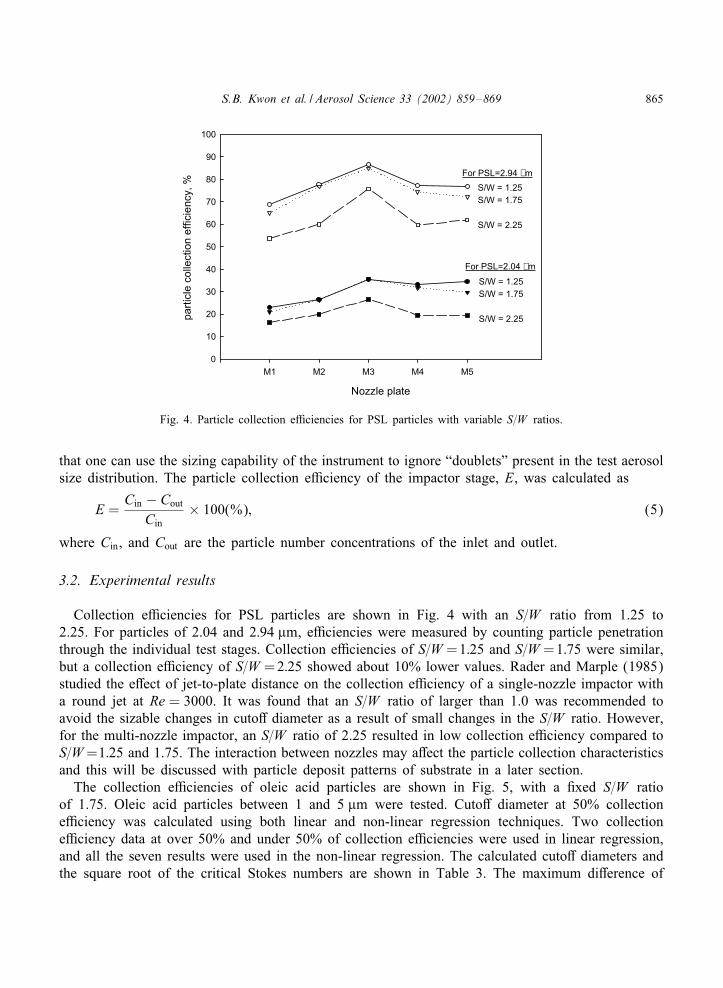
The schematic diagram of the test system is shown in Fig. 3. Two types of monodisperse aerosolparticles were generated. Liquid oleic acid particles (�=0:89 g cm−3) were generated by a vibratingori ce generator (VOAG, TSI Inc., model 3450) and the solid polystyrene latex particles (PSL,Duke Scienti c Corp., � = 1:05 g cm−3) were generated by an atomizer (TSI Inc., model 9302).Generated aerosols were passed through the Kr-85 neutralizer and diluted with ltered air. The
864 S.B. Kwon et al. / Aerosol Science 33 (2002) 859–869
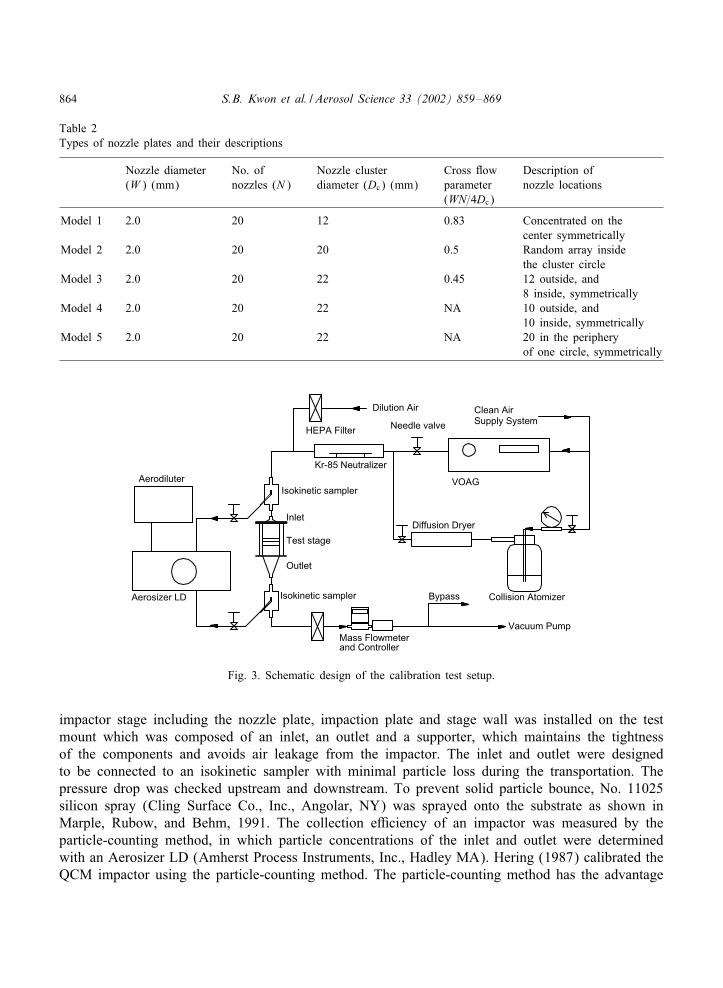
Table 2Types of nozzle plates and their descriptions
Nozzle diameter No. of Nozzle cluster Cross 6ow Description of(W ) (mm) nozzles (N ) diameter (Dc) (mm) parameter nozzle locations
(WN=4Dc)
Model 1 2.0 20 12 0.83 Concentrated on thecenter symmetrically
Model 2 2.0 20 20 0.5 Random array insidethe cluster circle
Model 3 2.0 20 22 0.45 12 outside, and8 inside, symmetrically
Model 4 2.0 20 22 NA 10 outside, and10 inside, symmetrically
Model 5 2.0 20 22 NA 20 in the peripheryof one circle, symmetrically
Mass Flowmeter
Kr-85 Neutralizer
Aerosizer LD
Aerodiluter
Isokinetic sampler
Test stage
Isokinetic sampler
Supply SystemClean Air
Vacuum Pump
Collision Atomizer
Diffusion Dryer
VOAG
Bypass
Dilution Air
and Controller
Outlet
Inlet
Needle valveHEPA Filter
Fig. 3. Schematic design of the calibration test setup.
impactor stage including the nozzle plate, impaction plate and stage wall was installed on the testmount which was composed of an inlet, an outlet and a supporter, which maintains the tightnessof the components and avoids air leakage from the impactor. The inlet and outlet were designedto be connected to an isokinetic sampler with minimal particle loss during the transportation. Thepressure drop was checked upstream and downstream. To prevent solid particle bounce, No. 11025silicon spray (Cling Surface Co., Inc., Angolar, NY) was sprayed onto the substrate as shown inMarple, Rubow, and Behm, 1991. The collection e9ciency of an impactor was measured by theparticle-counting method, in which particle concentrations of the inlet and outlet were determinedwith an Aerosizer LD (Amherst Process Instruments, Inc., Hadley MA). Hering (1987) calibrated theQCM impactor using the particle-counting method. The particle-counting method has the advantage
S.B. Kwon et al. / Aerosol Science 33 (2002) 859–869 865
Nozzle plate
M1 M2 M3 M4 M5
pa
rtic
le c
olle
ctio
n e
ffic
ien
cy,
%
0
10
20
30
40
50
60
70
80
90
100
For PSL=2.04 µm
For PSL=2.94 µm
S/W = 1.25
S/W = 1.75
S/W = 2.25
S/W = 1.25
S/W = 1.75
S/W = 2.25
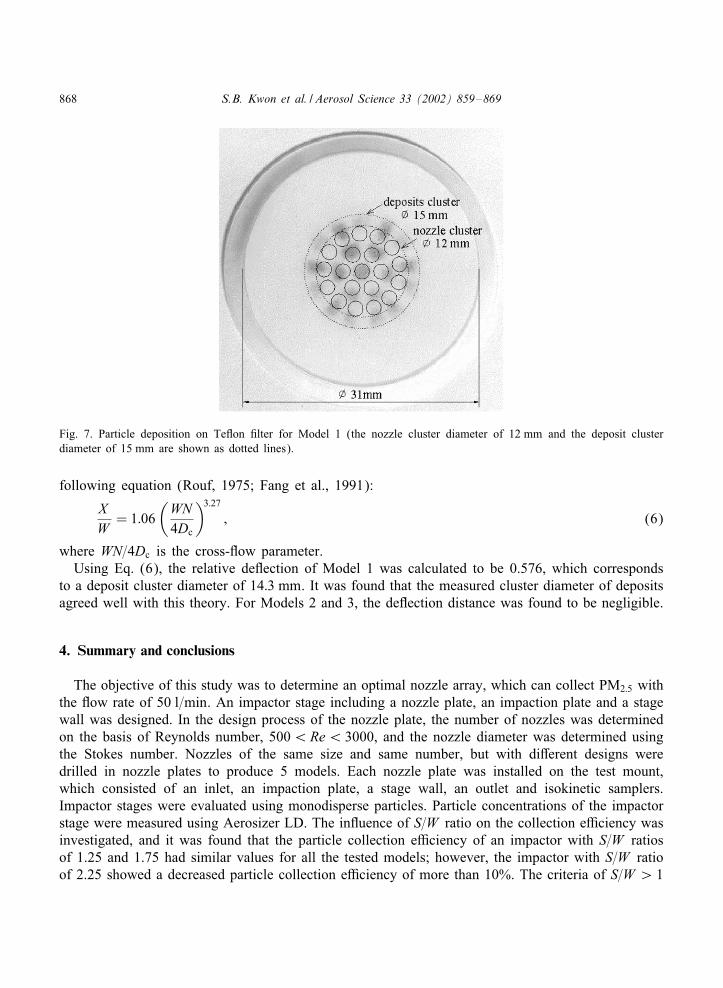
Fig. 4. Particle collection e9ciencies for PSL particles with variable S=W ratios.
that one can use the sizing capability of the instrument to ignore “doublets” present in the test aerosolsize distribution. The particle collection e9ciency of the impactor stage, E, was calculated as
E =Cin − Cout
Cin× 100(%); (5)
where Cin, and Cout are the particle number concentrations of the inlet and outlet.
3.2. Experimental results
Collection e9ciencies for PSL particles are shown in Fig. 4 with an S=W ratio from 1.25 to2.25. For particles of 2.04 and 2:94 �m, e9ciencies were measured by counting particle penetrationthrough the individual test stages. Collection e9ciencies of S=W =1:25 and S=W =1:75 were similar,but a collection e9ciency of S=W =2:25 showed about 10% lower values. Rader and Marple (1985)studied the e�ect of jet-to-plate distance on the collection e9ciency of a single-nozzle impactor witha round jet at Re = 3000. It was found that an S=W ratio of larger than 1.0 was recommended toavoid the sizable changes in cuto� diameter as a result of small changes in the S=W ratio. However,for the multi-nozzle impactor, an S=W ratio of 2.25 resulted in low collection e9ciency compared toS=W=1:25 and 1.75. The interaction between nozzles may a�ect the particle collection characteristicsand this will be discussed with particle deposit patterns of substrate in a later section.The collection e9ciencies of oleic acid particles are shown in Fig. 5, with a xed S=W ratio
of 1.75. Oleic acid particles between 1 and 5 �m were tested. Cuto� diameter at 50% collectione9ciency was calculated using both linear and non-linear regression techniques. Two collectione9ciency data at over 50% and under 50% of collection e9ciencies were used in linear regression,and all the seven results were used in the non-linear regression. The calculated cuto� diameters andthe square root of the critical Stokes numbers are shown in Table 3. The maximum di�erence of

866 S.B. Kwon et al. / Aerosol Science 33 (2002) 859–869
1.5 2 2.5 3 4 5 6 7 8 91 10
pa
rtic
le c
olle
ctio
n e
ffic
ien
cy, %
0
20
40
60
80
100
Model 1
Model 2
Model 3
Model 4
Model 5
Non linear regression curves
Model 1 (R=0.994)
Model 2 (R=0.987)
Model 3 (R=0.992)
Model 4 (R=0.999)
Model 5 (R=0.996)
Experimental data for
For oleic acid paticlesS/W = 1.75
aerodynamic particle diameter, µm
Fig. 5. Particle collection e9ciencies of oleic acid particles and non-linear regression curves.
Table 3Calculated cuto� diameters and the square root of the critical Stokes number (S=W = 1:75)
D50a D50
b D50c √
St50 Slope of e9ciency curved
Model 1 2.63 2.58 2.54 0.51 1.35Model 2 2.46 2.38 2.43 0.49 1.38Model 3 2.30 2.19 2.18 0.44 1.41Model 4 2.42 2.26 2.25 0.45 1.37Model 5 2.47 2.33 2.37 0.48 1.37
aCalculated cuto� diameter from linear regression for PSL particles.bCalculated cuto� diameter from linear regression for oleic acid particles.cCalculated cuto� diameter from non-linear regression of oleic acid particles.dThe ratio of diameters corresponding to 70% and 30% collection e9ciency.
cuto� diameter calculated from linear and non-linear regression was found to be 0:05 �m in Model 2for oleic acid particles. Cuto� diameter of 2:43 �m is the designed value. In non-linear regression,Model 2 showed the same cuto� diameter with the designed value and Model 3 showed the smallestcuto� diameter among other models. The slope of the e9ciency curve (de ned as the ratio ofthe diameters corresponding to 70% and 30% collection e9ciencies) was calculated by non-linearregression. Models 1–5 showed slopes between 1.35 and 1.41. Based on the cuto� diameter criteria,Models 2 and 5 behaved well. This is seen more clearly when the data are compared as a functionof particle Stokes number. The critical Stokes number,
√St50, corresponding to a 50% collection
e9ciency was calculated by non-linear regression and is shown in Table 3. The square root of thecritical Stokes number of 0.49 was assumed in the design process. Models 2, 5 and 1 well behavedwith respect to
√St50.

S.B. Kwon et al. / Aerosol Science 33 (2002) 859–869 867
Fig. 6. Photographs of methylene blue particle deposits on Te6on lters (W=Ring, 37 mm, pore size = 2 �m, GelmanLaboratory).
3.3. Particle deposition patterns
Methylene blue particles were chosen for visual analysis because of their color. Particles weredissolved in the isopropyl alcohol and generated in an atomizer. The size of the particles was adjustedusing the solution concentration and the atomizing pressure. The 37 mm Te6on lter (W=Ring, poresize = 2 �m, Gelman Laboratory) was used to collect the particles.Fig. 6 shows photographs of methylene blue particle deposits on a Te6on lter. In Models 1–4,
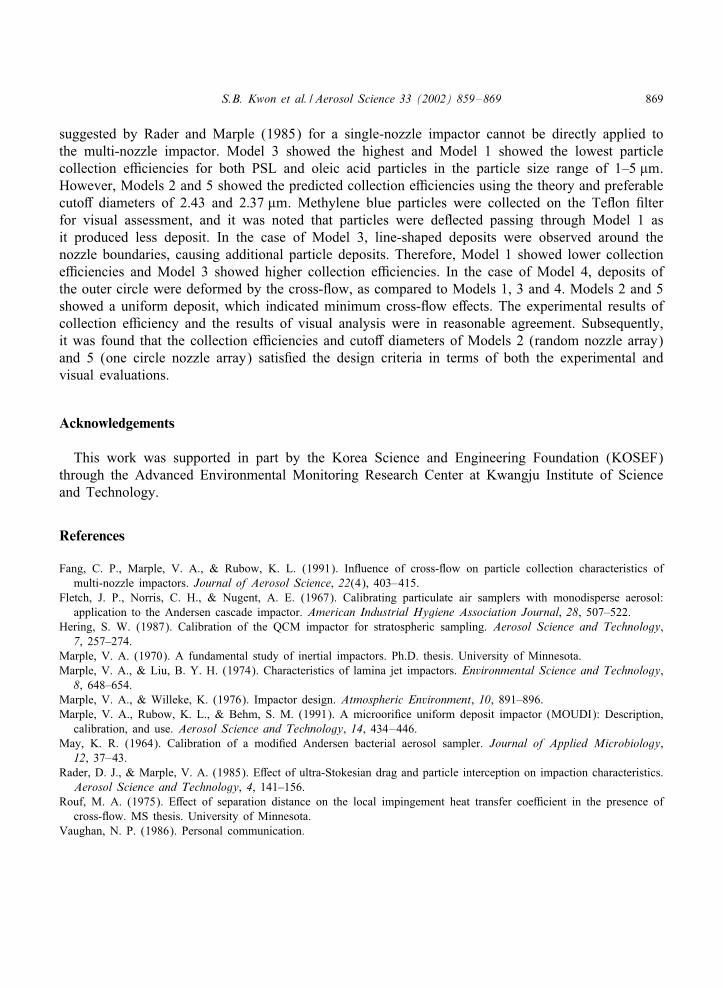
deposits near the center have a nearly round shape, since the cross-6ow is small here. As thecross-6ow increases, the round shapes of the deposits are distorted, which indicates that particlesin outer region jets have di9culty penetrating the cross-6ow to form deposits on the substrate.Compared to Models 1, 3 and 4, Models 2 and 5 showed uniform deposits, which indicate minimalcross-6ow e�ects. It is notable that line-shaped particle deposits were observed around the boundariesof the nozzle exits in Model 3. Deposits were formed by colliding jet-6ows. However, this kind ofdeposit was not observed clearly in the other models. This additional particle deposition increasedthe amount of particle collection and resulted in lower cuto� diameters than expected. In Model1, particles were de6ected from the jet centerline while they passed through the nozzle plate. Thedesigned nozzle cluster diameter of Model 1 was 12 mm; however, particles were collected insidethe 15 mm cluster diameter region of the substrate, as shown in Fig. 7. The distance of de6ection ofthe jet centerline, X , at the impaction plate from the centerline of nozzle was expressed as a functionof cross-6ow parameter. The relative de6ection of the jet centerline, X=W , can be represented by the
868 S.B. Kwon et al. / Aerosol Science 33 (2002) 859–869
Fig. 7. Particle deposition on Te6on lter for Model 1 (the nozzle cluster diameter of 12 mm and the deposit clusterdiameter of 15 mm are shown as dotted lines).
following equation (Rouf, 1975; Fang et al., 1991):
XW
= 1:06(WN4Dc
)3:27; (6)
where WN=4Dc is the cross-6ow parameter.Using Eq. (6), the relative de6ection of Model 1 was calculated to be 0.576, which corresponds
to a deposit cluster diameter of 14:3 mm. It was found that the measured cluster diameter of depositsagreed well with this theory. For Models 2 and 3, the de6ection distance was found to be negligible.
4. Summary and conclusions
The objective of this study was to determine an optimal nozzle array, which can collect PM2:5 withthe 6ow rate of 50 l=min. An impactor stage including a nozzle plate, an impaction plate and a stagewall was designed. In the design process of the nozzle plate, the number of nozzles was determinedon the basis of Reynolds number, 500¡Re¡ 3000, and the nozzle diameter was determined usingthe Stokes number. Nozzles of the same size and same number, but with di�erent designs weredrilled in nozzle plates to produce 5 models. Each nozzle plate was installed on the test mount,which consisted of an inlet, an impaction plate, a stage wall, an outlet and isokinetic samplers.Impactor stages were evaluated using monodisperse particles. Particle concentrations of the impactorstage were measured using Aerosizer LD. The in6uence of S=W ratio on the collection e9ciency wasinvestigated, and it was found that the particle collection e9ciency of an impactor with S=W ratiosof 1.25 and 1.75 had similar values for all the tested models; however, the impactor with S=W ratioof 2.25 showed a decreased particle collection e9ciency of more than 10%. The criteria of S=W ¿ 1
S.B. Kwon et al. / Aerosol Science 33 (2002) 859–869 869
suggested by Rader and Marple (1985) for a single-nozzle impactor cannot be directly applied tothe multi-nozzle impactor. Model 3 showed the highest and Model 1 showed the lowest particlecollection e9ciencies for both PSL and oleic acid particles in the particle size range of 1–5 �m.However, Models 2 and 5 showed the predicted collection e9ciencies using the theory and preferablecuto� diameters of 2.43 and 2:37 �m. Methylene blue particles were collected on the Te6on lterfor visual assessment, and it was noted that particles were de6ected passing through Model 1 asit produced less deposit. In the case of Model 3, line-shaped deposits were observed around thenozzle boundaries, causing additional particle deposits. Therefore, Model 1 showed lower collectione9ciencies and Model 3 showed higher collection e9ciencies. In the case of Model 4, deposits ofthe outer circle were deformed by the cross-6ow, as compared to Models 1, 3 and 4. Models 2 and 5showed a uniform deposit, which indicated minimum cross-6ow e�ects. The experimental results ofcollection e9ciency and the results of visual analysis were in reasonable agreement. Subsequently,it was found that the collection e9ciencies and cuto� diameters of Models 2 (random nozzle array)and 5 (one circle nozzle array) satis ed the design criteria in terms of both the experimental andvisual evaluations.
Acknowledgements
This work was supported in part by the Korea Science and Engineering Foundation (KOSEF)through the Advanced Environmental Monitoring Research Center at Kwangju Institute of Scienceand Technology.
References
Fang, C. P., Marple, V. A., & Rubow, K. L. (1991). In6uence of cross-6ow on particle collection characteristics ofmulti-nozzle impactors. Journal of Aerosol Science, 22(4), 403–415.
Fletch, J. P., Norris, C. H., & Nugent, A. E. (1967). Calibrating particulate air samplers with monodisperse aerosol:application to the Andersen cascade impactor. American Industrial Hygiene Association Journal, 28, 507–522.
Hering, S. W. (1987). Calibration of the QCM impactor for stratospheric sampling. Aerosol Science and Technology,7, 257–274.
Marple, V. A. (1970). A fundamental study of inertial impactors. Ph.D. thesis. University of Minnesota.Marple, V. A., & Liu, B. Y. H. (1974). Characteristics of lamina jet impactors. Environmental Science and Technology,8, 648–654.
Marple, V. A., & Willeke, K. (1976). Impactor design. Atmospheric Environment, 10, 891–896.Marple, V. A., Rubow, K. L., & Behm, S. M. (1991). A microori ce uniform deposit impactor (MOUDI): Description,
calibration, and use. Aerosol Science and Technology, 14, 434–446.May, K. R. (1964). Calibration of a modi ed Andersen bacterial aerosol sampler. Journal of Applied Microbiology,12, 37–43.
Rader, D. J., & Marple, V. A. (1985). E�ect of ultra-Stokesian drag and particle interception on impaction characteristics.Aerosol Science and Technology, 4, 141–156.
Rouf, M. A. (1975). E�ect of separation distance on the local impingement heat transfer coe9cient in the presence ofcross-6ow. MS thesis. University of Minnesota.
Vaughan, N. P. (1986). Personal communication.