effects of integrated marketing on … · communication, among others via advertising media, sales...
TRANSCRIPT

-Journal of Arts, Science & Commerce ■E-ISSN2229-4686■ISSN2231-4172
International Refereed Research Journal ■www.researchersworld.com■Vol.–VI, Issue – 3(1), July 2015 [89]
EFFECTS OF INTEGRATED MARKETING ON INCREASED
SALES WITH SATISFACTION AS AN INTERVENING
VARIABLE IN “ESSENTIAL COMPANY” OF
SURAKARTA INDONESIA
Riska Widha Hediarti,
Jawa Tengah, Indonesia
Mulyanto,
Jawa Tengah, Indonesia
ABSTRACT
The title of the research is effects of integrated marketing on increased sales with
satisfaction as an intervening Variable in “essential company” of Surakarta Indonesia. The
purpose of this research is to know structural model of integrated marketing on increased
sales with satisfaction as an intervening varibel. The population and sample of is customer in Surakarta. The methods used in this reseach are instrument test, descriptive
analysis, path diagram model analysis on based regression linear. This reseach The results
of research showed that (1) (a) factors of customers’ behavior; originating from the customer; using the contact form, creating synergies, and having relationships affect
customers’ satisfaction, were proven correct; (b) Factors in customers’ behavior and
customers’ satisfaction in a relationship and were not proven significantly affecting the
increase in product sales of Essential Ornaments Company of Surakarta. While, the factors originating from customers, using contact, creating synergies affect the increased
product sales in Essential Ornaments of Surakarta were attested (2) simultaneous test
results (Test F), seen from equation I and equation II know amount of values Fcount significance of 0,000 < 0,05. It can be concluded jointly that independent variables affect
the increases in product sales of Essential Ornaments of Surakarta. It is proven true that
(3) based on the analysis results obtained by test R2 coefficient of determination is 0,970
or 97,0%. It means that the increase in sales is explained by variables of customer
behavior, originating from customers, using contacts, creating synergies, having
relationships and customers’ satisfaction at 97,0 %, and the remaining 3,0% is explained
by other variables outside our model is explained by other variables that are not included in the regression model.
Keywords: customer behavior,originating from customers, using contacts, creating synergies, relationships, satisfaction, increasing sales.

-Journal of Arts, Science & Commerce ■E-ISSN2229-4686■ISSN2231-4172
International Refereed Research Journal ■www.researchersworld.com■Vol.–VI, Issue – 3(1), July 2015 [90]
INTRODUCTION:
The development of increasingly complex business world indirectly creates competition among players. Companies which are not smart enough to read the existing situation will lose in the
competition. The success of a company to be able to market a product produced depends on how the
company is capable of delivering effective messages to its consumers. Therefore, communication has a highly pivotal role for marketing success. The companies are demanded to be more creative in
conveying messages to their consumers. Besides, those who will be the targets of communication
should be noted.
In order to anticipate the increasingly firm competition, recently, companies are increasingly putting orientation on competitive advantage by using technology that is more productive, efficient and capable
of guarantying the excellence of a product consistently. At the same time, the company must also be
able to develop the appropriate marketing strategies to handle an increasingly open market competition. It is important to realize because by the presence of the market globalization, consumers will be more
critical and have many choices and flexibility to offer the products to fulfill their needs.
Phenomenon encountered by Essential Ornaments Company of Surakarta is a great opportunity to enter
the market, but in order to face of the company's competitors and the achievement of the potential customers’ quantity, the company marketing department continues to strive to: (1) improve the public
perception and (2) fulfill the entire demand in order to achieve higher accountability, but the results are
inadequate. (3) Efforts to improve the service performance services in order to achieve products’ equity. After going through a fundamental review, a strategy is set by conducting integrated marketing
communication, among others via advertising media, sales promotion, public relations, personal selling
and direct marketing. The successful integrated marketing is via the development of integrated marketing basis, i.e. considering the factors affecting the customers’ behavior, originating from
customers and prospective customers, using contact form, creating synergies, having relationships and
communication development.
THEORITICAL REVIEW:
Increased Sales:
Sales is the outflow of goods/services for fulfilling the existing market demand. Meanwhile, for
manufacturers or companies, sales is a process for obtaining increased revenue. In this case, each company has various policies in increasing revenue. There are two alternative chosen by the company
in increasing the sales volume of goods/services they have
Customer Satisfaction:
According to Brigham and Houston, (2007: 24) Satisfaction or dissatisfaction of customers is customer response to the evaluation of the perceived discrepancy between prior expectations (or other
performance norms) and the actual performance of the product that is felt after the wearer.
Thereby, the level of satisfaction is a function of the difference between the perceived performance and the expectations. If performance is below the expectations, the customers will be disappointed. In case
the performance in is accordance with expectations, the customers will be satisfied. Meanwhile, if the
performance exceeds expectations, the customers will be highly satisfied. Customers’ expectation can be formed by past experiences, comments from their relatives, as well as appointments and information
of the marketers and competitors. The customers’ appraisal of the goods is actually different from the
appraisal of the services.
Integrated Marketing Communication: Integrated marketing communication acts as a form of development and implementation of various
forms of prolonged persuasive communication programs towards the customers and prospective
customers. The objective of this integrated marketing communication is to influence or provide direct effect to the targeted public that they own.
Integrated marketing communication considers all sources that can connect the consumers or potential
consumers with the products or services of a company's product or company, is a potential pathway to
convey messages in the future. Furthermore, integrated marketing communication uses all forms of

-Journal of Arts, Science & Commerce ■E-ISSN2229-4686■ISSN2231-4172
International Refereed Research Journal ■www.researchersworld.com■Vol.–VI, Issue – 3(1), July 2015 [91]
relevant communication and can be accepted by consumers and potential consumers.Furthermore, as confirmed by Terence, (2007: 267) Integrated marketing communications process begins with
customers or potential customers and then turned to the company to determine and define the forms and
methods need to be developed for persuasive communication programs. There are five characteristics inherent in the philosophy and application of integrated marketing communications.
CONCEPTUAL FRAMEWORK:
Source: Siswanti (2009), Milla Siskawati (2009),Indira Mastuti (2011), Dodi Novianto (2010)
HYPOTHESES:
The hypotheses can be formulated as follows:
H1 : Influencing the customers’ behavior affect the customers’ satisfaction of Essential Ornaments
Company of Surakarta H2 : Having a start from customers and prospective customers affects the customers’ satisfaction on
Essential Ornaments Company of Surakarta
H3 : Using the contact form affects the customers’ satisfaction on Essential Ornaments Company of Surakarta H4 : Creating a synergy affects the customers’ satisfaction on Essential Ornaments Company of Surakarta
H5 : having a relationship affects customers’ satisfaction on Essential Ornaments Company of Surakarta
H6 : Influencing the customers’ behavior affect the increase in sales of Essential Ornaments Company
of Surakarta H7 : having a start from customers and prospective customers affect the increasing sales in Essential
Ornaments Company of Surakarta
H8 : Using the contact form affects the increased sales in Essential Ornaments Company of Surakarta H9 : Creating a synergy affects the increase in sales of Essential Ornaments Company of Surakarta
H10 : Having relationship affects the increasing sales in Essential Ornaments Company of Surakarta
Originating from customers and
prospective customers
(X2)
Creating synergies (X4)
Using contact forms (X3)
Influencing Customers’
Behavior
(X1)
Having relationships (X5)
H1
H2
H3
H4
H5
H6
H7
H8
H9
H10
H11 Customers’
satisfaction (Y1) Increasing sales (Y2)

-Journal of Arts, Science & Commerce ■E-ISSN2229-4686■ISSN2231-4172
International Refereed Research Journal ■www.researchersworld.com■Vol.–VI, Issue – 3(1), July 2015 [92]
METHODOLOGY
The reseach population is all of customer in “Essential Company” of Surakarta Indonesia. Data collecting technique in this reseach with random sampling technique, its means, each person customer
in population has an equal probability to come a contributor for this reseach. This sample in reseach
about 100 respondent. Data collecting methods with questionaire methode, observation methods dan documentation methods. Data analysis in this reseach is intrument test for validity, instrument test for
reliability, path diagram analysis with regression linear multiple.
RESULTS AND DISCUSSIONS:
Research Instrument Testing The main problem in this research is to determine the effect of service quality on customers’ loyalty
and satisfaction as an intervening variable in Essential Ornaments Company of Surakarta. Meanwhile,
those factors are; influencing the customers’ behavior (X1), originating from customers and prospective customers (X2), using the contacts (X3), creating synergies (X4), and having relationships (X5) on
increasing product sales of Essential Ornaments Company of Surakarta (Y1) with customers’
satisfaction as an intervening variable Y1. All of which are valid in the validity test result. Meanwhile,
the reliability test for all variables is also declared reliable.The analysis model used to solve these problems is the quantitative analysis. In this case, the pre-existing quantitative variables must be
qualified in advance, in order to obtain the same measurement for the entire analysis variables.
Linearity Test Results The linearity test using independent variable and dependent data is generated in the form of linearity
test result showing R2 value of 0.001 with a sample size of 150. The amount of c
2 count= 150 x 0.001 =
0.15, meanwhile the value of c2 table is 129.56. The value of C
2 count <c
2 table, thus it can be
concluded that the correct model is the linear model.
Research Hypothesis Test The path regression equation,This analysis is used to determine the effect of independent variables on
the dependent variable using the two (2) the following equations:
a. Dependent Variable: Customers’ Satisfaction
Equation 1:
Y1 = 1X1 + 2X2 + 3 X3 + 4X4 + 5 X5 0,838 X1 + 0,105 X2 - 0,212 X3 + 0,369 X4 - 0,078 X5
(0,000)** (0,005) (0,000) (0,000)** (0,000)** **= Significant at error rate of5%
1) b1 = the variable regression coefficient affects the customers’ behavior, at 0.838, it indicates that
the customers’ behavior positively affects the customers’ satisfaction. It means the increase in influencing customers’ behavior, the higher the customers’ satisfaction.
2) b2 = the variable regression coefficient is originating from customers at 0,105; it shows that the
variable originating from the customers has a positive effect on customers’ satisfaction. It means
the increase originating from the customers, the higher the customers’ satisfaction of Essential Ornaments Company of Surakarta.
3) b3 = the variable regression coefficient using the contact by - 0.212, it indicates that the variable
using the contact negatively affects the customers’ satisfaction. It means the increase originating from contacts, the customers’ satisfaction of Essential Ornaments Company of Surakarta decreases.
4) b4 = the variable regression coefficient creates synergies of 0.369; it shows that the variable
creating synergy positively affects the customer satisfaction of Essential Ornaments Company of
Surakarta. It means the increase in creating the synergies, the higher the customers’ satisfaction of Essential Ornaments Company of Surakarta.
5) b5 = the coefficient of regression of having relationship variable - 0.078, it indicates that having
relationships variable negatively affects the customers’ satisfaction. It means the increase in having relationship, the customers’ satisfaction of Essential Ornaments Company of Surakarta decreases.

-Journal of Arts, Science & Commerce ■E-ISSN2229-4686■ISSN2231-4172
International Refereed Research Journal ■www.researchersworld.com■Vol.–VI, Issue – 3(1), July 2015 [93]
b. The result of equation 2:
Dependent Variable: Increasing Sales:
Y2 = 1X1 + 2X2 + 3 X3 + 4X4 + 5 X5 + Y1
0,074 X1 - 0,135 X2 + 0,961 X3 + 0,162 X4 - 0,013 X5 - 0,077Y1
(0,300) (0,000)** (0,000)** (0,001)** (0,524)** (0,335) **
Description:
** = Significant at error rate of 5%
1) b1 = regression coefficient of influencing customers’ behavior variable is at 0.074, it indicates that the influencing customers’ behavior variable positively affects the customers’ satisfaction of
Essential Ornaments Company of Surakarta. It means if influencing the customers’ behavior is
good, the sales increases.
2) b2 = regression coefficient is originating from customers of -0.135, which means originating from
the customers negatively affect increasing sales of Essential Ornaments Company of Surakarta. It
means if originating from customers is good, Essential Ornaments Company's sales actually
decreases. 3) b3 = the regression coefficient of using the contacts variable of 0.961, it indicates that using the
contact variable positively affects the increasing sales. It means the better use of contacts, the
higher the sales. 4) b4 = the regression coefficient creating synergies of 0.162 indicates that the variable of creating
synergy positively affects the increasing sales. It means the better synergy creating, the Essential
Ornaments Company of Surakarta sales turnover increases.
5) b5 = the regression coefficient of having relationship at -0.013, meaning having relationship negatively affects Essential Ornaments of Surakarta Company's sales increase. It means having
better relationship the sales of Essential Ornaments Company decreases.
6) The regression coefficient of customers’ satisfaction at -0.077, meaning customers’ satisfaction negatively affects the increasing sales of Essential Ornaments Company of Surakarta. It means if
the customers’ satisfaction is better, the sales of Essential Ornaments Company actually decreases.
DIRECT AND INDIRECT EFFECTS:
Path analysis calculates the direct and indirect effects of independent variable on the dependent variables, including their intervening variables. The analysis conclusion of the results above can be
arranged thoroughly as follows:
Table of Results of Direct Effects, Indirect Effects and Total Effects
No Among Variables Direct Effects Indirect Effects Total Effects
1. Influencing Customers’ behavior
→ increasing sales
0,074
- -
2. Originating from customers → increasing sales
-0,135 - -
3. Using contacts → increasing sales 0,961
4.
5.
Creating synergies → increasing
sales Having relationship → increasing
sales
0,162
0,013
- -
1.
Influencing customers’ behavior → customers’ satisfaction →
increasing sales
- 0,838 x -0,077 = -0,064
0,074 + -0,064 = 0,010
2.
Originating from customers →
customers’ satisfaction → increasing sales
-
0,105 x -0,077
= -0,008
-0,135 + -
0,008 = -0,143

-Journal of Arts, Science & Commerce ■E-ISSN2229-4686■ISSN2231-4172
International Refereed Research Journal ■www.researchersworld.com■Vol.–VI, Issue – 3(1), July 2015 [94]
3.
4.
5.
Using contacts → customers’
satisfaction → increasing sales
Creating synergies → customers’ satisfaction → increasing sales
Having relationship → customers’
satisfaction → increasing sales
- -0,212 x -0,077 = 0,016
0,369 x -
0,077 = -0,028
-0,078 x
-0,077 =
0,006
0,961 + 0,016 = 0,977
0,162 +
-0,028 = 0,134
0,013 +
0,006 =
0,019
Based on the table above, Direct Effects, Indirect Effect and Total Effects can be presented as follows:
The direct effects are the effect of one independent to another dependent variable, without going
through other dependent variables.
a) Influencing customer behavior on increasing sales of direct effects of customer behavior towards
increasing sales = 0.074 and indirect effects of customers’ behavior towards the increase = -0.064,
and the total effect = 0,010. b) The direct effect originating from customers on the increasing sales = -0.135 and indirect effects,
originating from the customers towards the increase = -0.008 and total effect = -0.143.
c) The direct effects using the contact towards the increasing sales = 0.961 and indirect effects using the contacts towards the increase= 0.016, and total effects= 0.977.
d) The direct effect of creating synergies towards increasing sales= 0.162 and indirect effect of
creating a synergy towards the increase= -0.028 and total effect= 0.134. e) The direct effect of having relationships towards increasing sales= 0.013 and indirect effect of
having relationships towards the increase = 0.006, and total effects= 0.019.
THE CONCLUSION OF DIRECT EFFECTS AND INDIRECT EFFECTS IN PATH ANALYSIS:
a) Conclusion of path analysis shows the use of the intervening variable of customers’ satisfaction in increasing the sales, for the variable of customers’ behavior is less effective due to the direct effects
of customers’ behavior towards greater increasing, i.e. = 0.074 from the indirect effects or through
customer satisfaction, which is -0064. The result indicates in order to increase sales turnover, it is better to be conducted directly.
b) The conclusion of path analysis shows the use of the intervening variable of customers’ satisfaction
in increasing sales, for the variable of originating from the customers is effective due to direct
effects of originating from the customers towards smaller increasing sales, i.e. = -0.135, from indirect effects or through customers’ satisfaction, which is -0008. The result indicates in order to
increase sales turnover, it is better to be conducted indirectly through customers’ satisfaction.
c) The conclusion of path analysis shows the use of the intervening variable of customers’ satisfaction in increasing sales, for the variable of using contacts is less effective due to direct effects of
customers’ behavior towards smaller increasing sales, i.e. = -0.162, from indirect effects or through
customers’ satisfaction, which is 0.016. The result indicates in order to increase sales turnover, it is
better to be conducted directly through using contacts d) The conclusion of path analysis shows the use of the intervening variable of customers’ satisfaction
in increasing sales, for the variable of creating synergies is less effective due to direct effects of
customers’ behavior towards greater increasing sales, i.e. = 0.162, from indirect effects or through customers’ satisfaction, which is -0028. The result indicates in order to increase sales turnover, it is
better to be conducted indirectly through creating synergies.
e) The conclusion of path analysis shows the use of the intervening variable of customers’ satisfaction in increasing sales, for having relationship towards greater increasing sales, i.e. = 0.013, from
indirect effects or through customers’ satisfaction, which is 0.006. The result indicates in order to
increase sales turnover, it is better to be conducted directly through having relationship.
f) The variable being prioritized in order to increase the sales turnover is the variable form of using the contact, as it has the greatest coefficient, i.e. 0.961 among other variables.
-Journal of Arts, Science & Commerce ■E-ISSN2229-4686■ISSN2231-4172
International Refereed Research Journal ■www.researchersworld.com■Vol.–VI, Issue – 3(1), July 2015 [95]
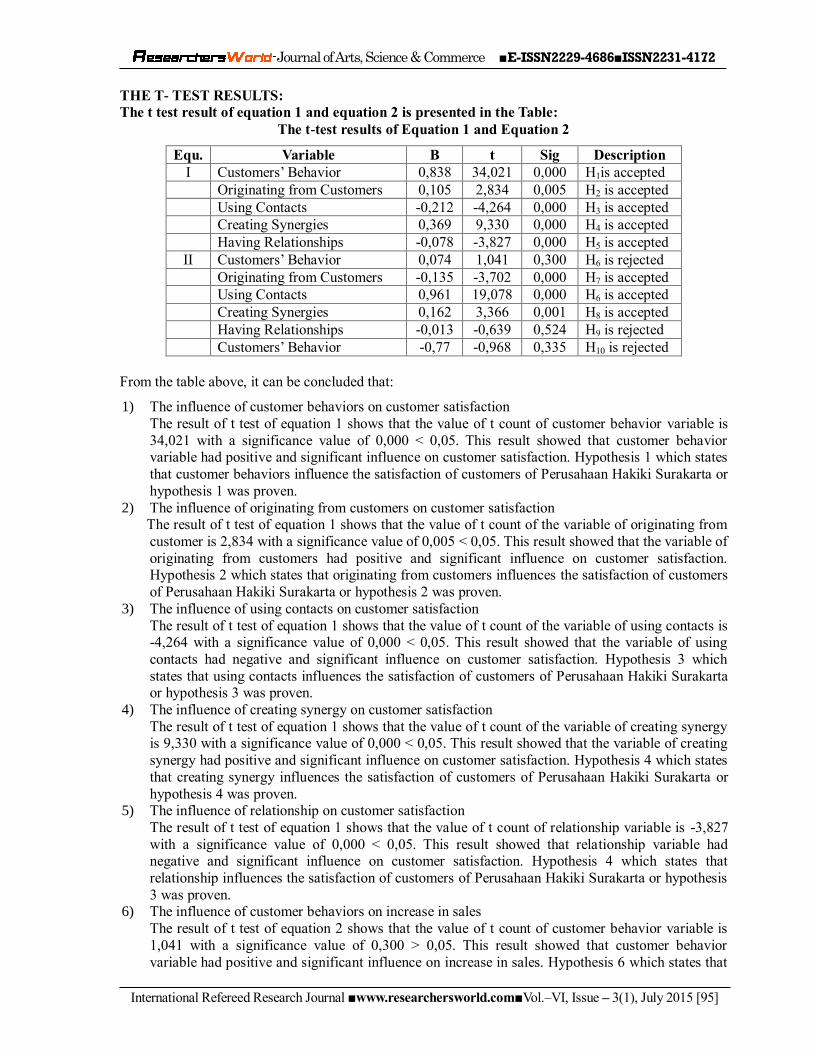
THE T- TEST RESULTS: The t test result of equation 1 and equation 2 is presented in the Table:
The t-test results of Equation 1 and Equation 2
Equ. Variable B t Sig Description
I Customers’ Behavior 0,838 34,021 0,000 H1is accepted
Originating from Customers 0,105 2,834 0,005 H2 is accepted
Using Contacts -0,212 -4,264 0,000 H3 is accepted
Creating Synergies 0,369 9,330 0,000 H4 is accepted
Having Relationships -0,078 -3,827 0,000 H5 is accepted
II Customers’ Behavior 0,074 1,041 0,300 H6 is rejected
Originating from Customers -0,135 -3,702 0,000 H7 is accepted
Using Contacts 0,961 19,078 0,000 H6 is accepted
Creating Synergies 0,162 3,366 0,001 H8 is accepted
Having Relationships -0,013 -0,639 0,524 H9 is rejected
Customers’ Behavior -0,77 -0,968 0,335 H10 is rejected
From the table above, it can be concluded that:
1) The influence of customer behaviors on customer satisfaction
The result of t test of equation 1 shows that the value of t count of customer behavior variable is
34,021 with a significance value of 0,000 < 0,05. This result showed that customer behavior variable had positive and significant influence on customer satisfaction. Hypothesis 1 which states
that customer behaviors influence the satisfaction of customers of Perusahaan Hakiki Surakarta or
hypothesis 1 was proven.
2) The influence of originating from customers on customer satisfaction The result of t test of equation 1 shows that the value of t count of the variable of originating from
customer is 2,834 with a significance value of 0,005 < 0,05. This result showed that the variable of
originating from customers had positive and significant influence on customer satisfaction. Hypothesis 2 which states that originating from customers influences the satisfaction of customers
of Perusahaan Hakiki Surakarta or hypothesis 2 was proven.
3) The influence of using contacts on customer satisfaction
The result of t test of equation 1 shows that the value of t count of the variable of using contacts is -4,264 with a significance value of 0,000 < 0,05. This result showed that the variable of using
contacts had negative and significant influence on customer satisfaction. Hypothesis 3 which
states that using contacts influences the satisfaction of customers of Perusahaan Hakiki Surakarta or hypothesis 3 was proven.
4) The influence of creating synergy on customer satisfaction
The result of t test of equation 1 shows that the value of t count of the variable of creating synergy is 9,330 with a significance value of 0,000 < 0,05. This result showed that the variable of creating
synergy had positive and significant influence on customer satisfaction. Hypothesis 4 which states
that creating synergy influences the satisfaction of customers of Perusahaan Hakiki Surakarta or
hypothesis 4 was proven. 5) The influence of relationship on customer satisfaction
The result of t test of equation 1 shows that the value of t count of relationship variable is -3,827
with a significance value of 0,000 < 0,05. This result showed that relationship variable had negative and significant influence on customer satisfaction. Hypothesis 4 which states that
relationship influences the satisfaction of customers of Perusahaan Hakiki Surakarta or hypothesis
3 was proven. 6) The influence of customer behaviors on increase in sales
The result of t test of equation 2 shows that the value of t count of customer behavior variable is
1,041 with a significance value of 0,300 > 0,05. This result showed that customer behavior
variable had positive and significant influence on increase in sales. Hypothesis 6 which states that

-Journal of Arts, Science & Commerce ■E-ISSN2229-4686■ISSN2231-4172
International Refereed Research Journal ■www.researchersworld.com■Vol.–VI, Issue – 3(1), July 2015 [96]
customer behaviors influence the increase in sales of Perusahaan Hakiki Surakarta or hypothesis 6 wasn’t proven.
7) The influence of originating from customers on increase in sales
The result of t test of equation 2 shows that the value of t count of the variable of originating from customer is -3,702 with a significance value of 0,000 < 0,05. This result showed the variable of
originating from customers had negative and significant influence on increase in sales. Hypothesis
7 which states that originating from customers influences the increase in sales of Perusahaan
Hakiki Surakarta or hypothesis 7 was proven. 8) The influence of using contacts on increase in sales
The result of t test of equation 2 shows that the value of t count of the variable of using contacts is
19,078 with a significance value of 0,000 < 0,05. This result showed that the variable of using contacts had positive and significant influence on increase in sales. Hypothesis 8 which states that
using contacts influences the increase in sales of Perusahaan Hakiki Surakarta or hypothesis 8 was
proven. 9) The influence of creating synergy on increase in sales
The result of t test of equation 2 shows that the value of t count of the variable of creating synergy
is 3,366 with a significance value of 0,001 < 0,05. This result showed that the variable of creating
synergy had positive and significant influence on increase in sales. Hypothesis 9 which states that creating synergy influences the increase in sales of Perusahaan Hakiki Surakarta or hypothesis 9
was proven.
10) The influence of relationship on increase in sales The result of t test of equation 2 shows that the value of t count of relationship variable is -0,639
with a significance value of 0,524 > 0,05. This result showed that relationship variable had
negative and insignificant influence on increase in sales. Hypothesis 10 which states that
relationship influences the increase in sales of Perusahaan Hakiki Surakarta or hypothesis 10 wasn’t proven.
11) The influence of customer satisfaction on increase of sales
The result of t test of equation 2 shows that the value of t count of relationship variable is -0,968 with a significance value of 0,335 > 0,05. This result showed that relationship variable had
negative and insignificant influence on increase in sales. Hypothesis 11 which states that customer
satisfaction has negative and insignificant influence on increase in sales of Perusahaan Hakiki Surakarta or hypothesis 11 wasn’t proven.
THE RESULTS OF VARIANCE TEST (F TEST):
The Result of Variance Test (F Test) is presented in the following data analysis result:
Table of F test of equation 1
The result of F test of the first equation shows that the value of F count is 166,335 and has significance value of 0,000 < 0,05, meaning customer behavior, originating from customer, using contact, creating
synergy and relationship variables simultaneously had positive and significant influence on the
satisfaction of customers of Perusahaan Hakiki Ornamen Surakarta.
ANOVAb
831,676 5 166,335 860,839 ,000a
27,824 144 ,193
859,500 149
Regression
Residual
Total
Model
1
Sum of
Squares df Mean Square F Sig.
Predictors: (Constant), Menjalin Hubungan, Perilaku Pelanggan, Menggunakan
Kontak, Berawal dari Pelanggan, Menciptakan Sinergi
a.
Dependent Variable: Kepuasan Pelangganb.

-Journal of Arts, Science & Commerce ■E-ISSN2229-4686■ISSN2231-4172
International Refereed Research Journal ■www.researchersworld.com■Vol.–VI, Issue – 3(1), July 2015 [97]
The Result of Variance Test (F Test) is presented in the following data analysis result:
Table of F test of equation 2
The result of F test of the second equation shows that the value of F count is 785,642 and has
significance value of 0,000 < 0,05, meaning customer behavior, originating from customer, using contact, creating synergy and relationship variables simultaneously had positive and significant
influence on the increase in sales of Perusahaan Hakiki Ornamen Surakarta.
THE RESULT OF DETERMINATION TEST OF MODEL 1:
1) The result of determination test of regression equation 1 is below:
Table of Determination Test of Equation 1
The amount of e1 was calculated by equation √ 1-R
2, so based on the table of results of determination
coefficient test of equation 1, e1= √ 1-R2 = √ 1-0,968 = 0,178.
2) The result of determination test of regression equation 2 is below: Table of Determination Test of Equation 2
The amount of e2 was calculated by equation √1-R
2, so based on the table of results of determination
coefficient test of equation 2, e2 = √1-R2 = ~ 1-0,971 = 0,170.
3) The Value of Total Determination (R)
Based on the values of el e2, the value of total R2 is: = 1 - (el x e2) = 1 - (0,178 x 0,170) = 1 - 0,030 =
0,970 or 97,0%. This meant that increase s sales was explained by customer behavior, originating from
customer, using contact, creating synergy, relationship and customer satisfaction variables by 97,0 %
and the remaining 3,0 % was explained by other variables outside of research mode, such as
ANOVAb
998,017 6 166,336 785,642 ,000a
30,276 143 ,212
1028,293 149
Regression
Residual
Total
Model
1
Sum of
Squares df Mean Square F Sig.
Predictors: (Constant), Kepuasan Pelanggan, Menjalin Hubungan, Menggunakan
Kontak, Berawal dari Pelanggan, Menciptakan Sinergi, Perilaku Pelanggan
a.
Dependent Variable: Peningkatan Penjualanb.
Model Summary
,984a ,968 ,967 ,440
Model
1
R R Square
Adjusted
R Square
Std. Error of
the Est imate
Predictors: (Constant), Menjalin Hubungan, Perilaku
Pelanggan, Menggunakan Kontak, Berawal dari
Pelanggan, Menciptakan Sinergi
a.
Model Summary
,985a ,971 ,969 ,460
Model
1
R R Square
Adjusted
R Square
Std. Error of
the Est imate
Predictors: (Constant), Kepuasan Pelanggan, Menjalin
Hubungan, Menggunakan Kontak, Berawal dari
Pelanggan, Menciptakan Sinergi, Perilaku Pelanggan
a.

-Journal of Arts, Science & Commerce ■E-ISSN2229-4686■ISSN2231-4172
International Refereed Research Journal ■www.researchersworld.com■Vol.–VI, Issue – 3(1), July 2015 [98]
distribution system, personal selling and integrated marketing strategy, etc.
CONCLUSION:
Based on research results and data analysis on “The influence on integrated marketing communitarian
(which consists of influencing customer behaviors, originating from customers and potential customers, using contacts, creating synergy, relationship) on increase in sales with customer satisfaction as the
intervening variable in Perusahaan Hakiki Ornamen Surakarta” the following conclusion was drawn:
1. Based on partial significance test (t test) the results were:
a) The influence of customer behaviors on customer satisfaction The result of t test of equation 1 shows that the value of t count of customer behavior variable is
34,021 with a significance value of 0,000 < 0,05. This result showed that customer behavior
variable had positive and significant influence on customer satisfaction. Hypothesis 1 which states that customer behaviors influence the satisfaction of customers of Perusahaan Hakiki Surakarta or
hypothesis 1 was proven.
b) The influence of originating from customers on customer satisfaction
The result of t test of equation 1 shows that the value of t count of the variable of originating from customer is 2,834 with a significance value of 0,005 < 0,05. This result showed that the variable of
originating from customers had positive and significant influence on customer satisfaction.
Hypothesis 2 which states that originating from customers influences the satisfaction of customers of Perusahaan Hakiki Surakarta or hypothesis 2 was proven.
c) The influence of using contacts on customer satisfaction
The result of t test of equation 1 shows that the value of t count of the variable of using contacts is -
4,264 with a significance value of 0,000 < 0,05. This result showed that the variable of using contacts had negative and significant influence on customer satisfaction. Hypothesis 3 which states
that using contacts influences the satisfaction of customers of Perusahaan Hakiki Surakarta or
hypothesis 3 was proven.
d) The influence of creating synergy on customer satisfaction
The result of t test of equation 1 shows that the value of t count of the variable of creating synergy
is 9,330 with a significance value of 0,000 < 0,05. This result showed that the variable of creating synergy had positive and significant influence on customer satisfaction. Hypothesis 4 which states
that creating synergy influences the satisfaction of customers of Perusahaan Hakiki Surakarta or
hypothesis 4 was proven.
e) The influence of relationship on customer satisfaction The result of t test of equation 1 shows that the value of t count of relationship variable is -3,827 with a
significance value of 0,000 < 0,05. This result showed that relationship variable had negative and
significant influence on customer satisfaction. Hypothesis 4 which states that relationship influences the satisfaction of customers of Perusahaan Hakiki Surakarta or hypothesis 3 was proven.
f) The influence of customer behaviors on increase in sales
The result of t test of equation 2 shows that the value of t count of customer behavior variable is 1,041 with a significance value of 0,300 > 0,05. This result showed that customer behavior variable had
positive and significant influence on increase in sales. Hypothesis 6 which states that customer
behaviors influence the increase in sales of Perusahaan Hakiki Surakarta or hypothesis 6 wasn’t proven.
g) The influence of originating from customers on increase in sales The result of t test of equation 2 shows that the value of t count of the variable of originating from
customer is -3,702 with a significance value of 0,000 < 0,05. This result showed the variable of
originating from customers had negative and significant influence on increase in sales. Hypothesis 7 which states that originating from customers influences the increase in sales of Perusahaan
Hakiki Surakarta or hypothesis 7 was proven.
h) The influence of using contacts on increase in sales
The result of t test of equation 2 shows that the value of t count of the variable of using contacts is

-Journal of Arts, Science & Commerce ■E-ISSN2229-4686■ISSN2231-4172
International Refereed Research Journal ■www.researchersworld.com■Vol.–VI, Issue – 3(1), July 2015 [99]
19,078 with a significance value of 0,000 < 0,05. This result showed that the variable of using contacts had positive and significant influence on increase in sales. Hypothesis 8 which states that using contacts
influences the increase in sales of Perusahaan Hakiki Surakarta or hypothesis 8 was proven.
i) The influence of creating synergy on increase in sales The result of t test of equation 2 shows that the value of t count of the variable of creating synergy is
3,366 with a significance value of 0,001 < 0,05. This result showed that the variable of creating synergy
had positive and significant influence on increase in sales. Hypothesis 9 which states that creating
synergy influences the increase in sales of Perusahaan Hakiki Surakarta or hypothesis 9 was proven.
j) The influence of relationship on increase in sales
The result of t test of equation 2 shows that the value of t count of relationship variable is -0,639
with a significance value of 0,524 > 0,05. This result showed that relationship variable had negative and insignificant influence on increase in sales. Hypothesis 10 which states that relationship
influences the increase in sales of Perusahaan Hakiki Surakarta or hypothesis 10 wasn’t proven.
k) The influence of customer satisfaction on increase of sales The result of t test of equation 2 shows that the value of t count of relationship variable is -0,968
with a significance value of 0,335 > 0,05. This result showed that relationship variable had negative
and insignificant influence on increase in sales. Hypothesis 11 which states that customer
satisfaction has negative and insignificant influence on increase in sales of Perusahaan Hakiki Surakarta or hypothesis 11 wasn’t proven.
2. Simultaneous Regression Test (F Test).
a) The Anova table of equation 1 shows a significance value of 0,000 < 0,05, so the variables (influencing customer behaviors, originating from customers and potential customers, using
contacts, creating synergy, relationship) simultaneously had significant influence on customer
satisfaction.
b) The Anova table of equation 2 shows a significance value of 0,000 < 0,05, so the variables (influencing customer behaviors, originating from customers and potential customers, using
contacts, creating synergy, relationship and customer satisfaction) simultaneously had
significant influence on increase of sales.
3. Determination Test (εi Variance).
Determination in path analysis was determined by variance denoted by ε, the amount of ε1..2 is
calculated by (1-R2)
or (1-Adj-R
2), so it was concluded that:
Based on the values of el e2, the value of total R2 is: = 1 - (el x e2) = 1 - (0,178 x 0,170) = 1 - 0,030
= 0,970 or 97,0%. This meant that increase s sales was explained by customer behavior, originating
from customer, using contact, creating synergy, relationship and customer satisfaction variables by
97,0 % and the remaining 3,0 % was explained by other variables outside of research mode, such as distribution system, personal selling and integrated marketing strategy, etc.
4. The Results of Path Analysis
Conclusion of Direct and Indirect Influences in Path Analysis
a) The conclusion of path analysis showed that the use of customer satisfaction intervening variable in increasing sales for customer behavior variable was ineffective because the direct
influence of customer behaviors on increase in sales is larger (0,074) than indirect influence or
through customer satisfaction (-0.064). This result indicated that increase in sales turnover should be done directly.
b) The conclusion of path analysis showed that the use of customer satisfaction intervening
variable in increasing sales for the variable of originating from customers was effective because the direct influence of originating from customers was smaller (-0,135) than indirect
influence or through customer satisfaction (-0.008). This result indicated that increase in sales
turnover should be done indirectly through customer satisfaction.

-Journal of Arts, Science & Commerce ■E-ISSN2229-4686■ISSN2231-4172
International Refereed Research Journal ■www.researchersworld.com■Vol.–VI, Issue – 3(1), July 2015 [100]
c) The conclusion of path analysis showed that the use of customer satisfaction intervening variable in increasing sales for the variable of using contacts was effective because the direct
influence of using contacts was bigger (0,162) than indirect influence or through customer
satisfaction (0.016). This result indicated that increase in sales turnover should be done directly by using contacts.
d) The conclusion of path analysis showed that the use of customer satisfaction intervening
variable in increasing sales for the variable of creating synergy was ineffective because the
direct influence of creating synergy on increase of sales was larger (0,162) than indirect influence or through customer satisfaction (-0.028). This result indicated that increase in sales
turnover should be done directly by creating synergy.
e) The conclusion of path analysis showed that the use of customer satisfaction intervening variable in increasing sales for relationship variable was because the direct influence of
relationships on increase of sales was larger (0,013) than indirect influence or through
customer satisfaction (0.006). This result indicated that increase in sales turnover should be done directly by building relationships.
f) Variable prioritized to increase sales turnover was variables of using contacts because it has the
largest coefficient (0,961) compared with other variables.
g) The conclusion of this path analysis showed that the usage of customer satisfaction intervening variable to increase sales for variables of influencing customer behaviors, creating synergy and
relationship was effective, the highest score was for the variable of using contacts, while
variable of originating from customers was ineffective.
REFERENCE:
[1] Alex, S. Nitisemito. (2001). Manajemen Personalia. Jakarta: Ghalia Indonesia, Revised Edition.
[2] Ahmad, B. (2006). Analisis Faktor Penyebab Perkembangan dan Kebangkrutan Perusahaan.
Jakarta : Penerbit Gramedia Putra. [3] Arikunto,S. (2003). Ánker,H.(2002).Customer Behavior and Marketing Action. Massachusetts :
Kent Publishing Company.
[4] Azwar, S.(2004). Dasar-dasar Psikometrika. Yogyakarta : Pustaka Pelajar. [5] Basu, S. (2004). Azas-azas Marketing. Penerbit Liberty. Yogyakarta.
[6] Basu.S. (2005). Manajemen Pemasaran Modern. Yogyakarta : Penerbit Liberty,
[7] Branan, D. W, (2005). Customer First, Alih Bahasa Anton Adiwiyoto. Jakarta : First Edition,
Binarupa Aksara. [8] Brigham, and Houston. (2007). Fundamentals of Financial Management. Eighth Edition, The
Dryden Press, Harcourt Brace College Publishers.
[9] D, Gujarati. (2004). Ekonometrika Dasar. Jakarta : Erlangga Publiser . [10] Djarwanto, P.S. (2002). Statistik Induktif. Yogyakarta : BPFE UGM.
[11] Donwey, B. Rothery. (2003). Analisis ISO-9000, Fourth Edition, (Translation) Lembaga PPM
and PT. Pustaka Binaman fresindo, Jakarta. [12] John N. Myer. (2006), Principles of Corporate Finance. International Edition. New York :
Mc.Graw-Hill, Inc.
[13] Lexy. J. Moleong. (2006). Metode Penelitian Kualitatif. Bandung: PT Remaja Rosdakarya.
[14] Philip Kotler. (2003). Manajemen Pemasaran : Analisis Perencanaan, Implementasi dan Pengendalian, Terjemahan Jaka Wasana. Jakarta : Volume I, Ninth Edition, Erlangga.
[15] Stanton. William & Charies Futrell. (2002), Fundamentals of Marketing, Eighth Edition, Mc.
Graw Hill.
-----