effects of gravity and crystal orientation on the growth … study the effect of gravity, similar...
TRANSCRIPT
Int. J. Microgravity Sci. Appl., 34 (1) (2017) 340111
DOI: 10.15011//jasma.34.340111
0915-3616/2017/34(1)/340111(12) 340111–1 ©2017 The Jpn. Soc. Microgravity Appl.
http://www.jasma.info/journal/
IIIII Semiconductor crystal growth by GHF IIIII (Review)
Effects of Gravity and Crystal Orientation on the Growth of InGaSb Ternary
Alloy Semiconductors
- Experiments at the International Space Station and on Earth-
Yasuhuro HAYAKAWA1, Velu NIRMAL KUMAR1, Mukannan ARIVANANDHAN2, Govindasamy RAJESH1,
Tadanobu KOYAMA1, Yoshimi MOMOSE1, Kaoruho SAKATA3, Tetsuo OZAWA4,
Yasunori OKANO5,6,1 and Yuko INATOMI6,7,1
Abstract
The manuscript reviews the microgravity experiments carried out onboard the International Space Station (ISS) to study the effects of gravity and
orientation on the dissolution and growth properties of InGaSb ternary alloys. To study the effect of gravity, similar growth experiments were
conducted under microgravity and normal gravity conditions. The effect of orientation was studied by the growth of InGaSb from (111)A and (111)B
faces of GaSb (Ga and Sb faces) under microgravity onboard the ISS. The experimental results revealed that the growth rate was higher with better
quality of crystal under microgravity than normal gravity. A model was proposed to explain the higher dissolution of GaSb (111)B than (111)A
direction under microgravity. The higher growth rate of InGaSb from GaSb (111)B was found to be because of its higher dissolution of GaSb(111)B
feed.
Keyword(s): InGaSb, crystal growth, gravity, crystal orientation, ISS
Received 3 November 2016, Accepted 14 December 2016, Published 31 January 2017
1. Introduction
InGaSb is a III-V ternary alloy that have tunable properties
between its binary compounds InSb and GaSb. The lattice constant
and wavelength of InxGa1-xSb can be varied in the range 6.096 ~
6.479 Å and 1.7 ~ 6.8 μm, respectively. The wavelength of InGaSb
is in the infrared (IR) region and it can be used as a substrate for
IR detector, thermophotovoltaic (TPV) and thermoelectric
applications1-4). The growth of InGaSb is affected by various
parameters including segregation, constitutional super cooling and
convection5-7). These typical physical phenomena can be
understood by diffusion controlled heat and mass transfer under
microgravity8-10).
To understand these phenomena our group has performed
various microgravity experiments using different space platforms
such as air plane, drop tower, space shuttle and recoverable
satellite11-13). The effects of diffusion and Marangoni convection
on the mixing of multi-component melts were investigated in the
space shuttle experiment11). In the drop tower experiments, in-situ
solidification process was observed using a high speed CCD
camera12). The effects of the gravitational direction on the
dissolution and growth processes were investigated by inclining
the electric furnace on Earth. The flow pattern and composition
profiles were calculated as a function of gravity level. The effects
of gravity on the shape of liquid-solid interface and composition
profiles were clarified by comparing the experimental results in
1. Research Institute of Electronics, Shizuoka University, 3-5-1, Johoku, Naka-ku,Hamamatsu, Shizuoka 432-8011, Japan
2. Centre for Nanoscience and Technology, Anna University, Chennai 600 025, India
3. Chemical System Engineering, University of Tokyo, 5-1-5 Kashiwanoha, Kashiwa, Chiba 277-8568, Japan
4. Department of Electrical Engineering, Shizuoka Institute of Science and Technology, 2200-2, Toyosawa, Fukuroi, Shizuoka 437-8555, Japan
5 Graduate school of Engineering Science, Osaka University, 1-3 Machiganeyama, Osaka 560-8531, Japan
6 Institute of Space and Astronautical Science, Japan Aerospace Exploration Agency, 3-1-1, Yoshinodai, Chuo-ku, Sagamihara, Kanagawa 252-5210, Japan
7 School of Physical Sciences, SOKENDAI (The Graduate University for Advanced Studies), 3-1-1, Yoshinodai, Chuo-ku, Sagamihara, Kanagawa
252-5210, Japan
(E-mail: [email protected])
Crystal growth experiments at ISS
340111–2
the Chinese recoverable satellite and on Earth. Recently Kinoshita
et al., grew SiGe crystal onboard the International space station
(ISS)14,15). The wettability test of GaSb, InSb and InxGa1-xSb
materials with boron nitride (BN), carbon sheet, Quartz and C-103
alloy at higher temperatures were analyzed to check the affinity of
the ampoule configuration as a preliminary study to grow InGaSb at the ISS16). Various numerical investigations were also carried
out to understand the growth kinetics17,18). The experimental and
numerical results indicated that the shape of growth interface and
composition profiles were strongly influenced by gravity.
Though various microgravity experiments were carried out to
investigate the growth process of InGaSb ternary alloys, the time
period by these space platforms were limited. Among these space
platforms, recoverable satellites can provide comparatively longer
duration for about a couple of weeks. Within the limited time
duration, a few physical properties such as dissolution and multi
component mixing during crystal growth were investigated. A
thorough investigation to analyze the heat and mass transfer
processes requires a long duration space platform. The ISS
provides solution for this problem. To analyze the effect of gravity
and orientation dependent dissolution and growth properties of
InGaSb ternary alloys, the crystal growth experiments were
carried out in the Japanese space experimental module “KIBO”, a
part in the ISS. These experiments were made in collaboration
with Japan Aerospace Exploration Agency (JAXA) through alloy
semiconductor project. The purpose of the ‘Alloy Semiconductor’
crystal growth project was to elucidate the factors affecting the
crystal growth of a high-quality bulk ternary alloy semiconductor
under μG conditions at the ISS. The ‘Alloy Semiconductor project’
involved 8 experiments, 4 under microgravity and 4 under normal
gravity conditions. The experimental results were being analyzed
comparatively and it was expected to reveal important results in
the field of “microgravity materials science”. The findings of the
microgravity experiments would be utilized for the growth of good
quality ternary alloy semiconductor crystals under normal gravity
on Earth. The high quality InGaSb crystals with tunable properties
could be used as a substrate material for the fabrication of high
speed electronic devices, IR detectors and TPV systems.
This project was selected as one of the 14 candidate missions of
the Kibo Second Phase Utilization in 2008. Our group recently
studied the effect of gravity and orientation on the growth
properties of InGaSb ternary alloys grown at the ISS19,20).
This manuscript reviews the recent microgravity experimental
results that revealed the effects of gravity and orientation on the
dissolution and growth properties of InGaSb ternary alloys.
2. Experimental Method
A GaSb(111)A/Te-doped InSb/GaSb(111)A and
GaSb(111)B/Te-doped InSb/GaSb(111)B sandwich samples were
used for the growth of the InGaSb bulk crystal by vertical gradient
freezing (VGF) method. GaSb single crystals along the <111>
orientation were grown by the Czochralski method for the
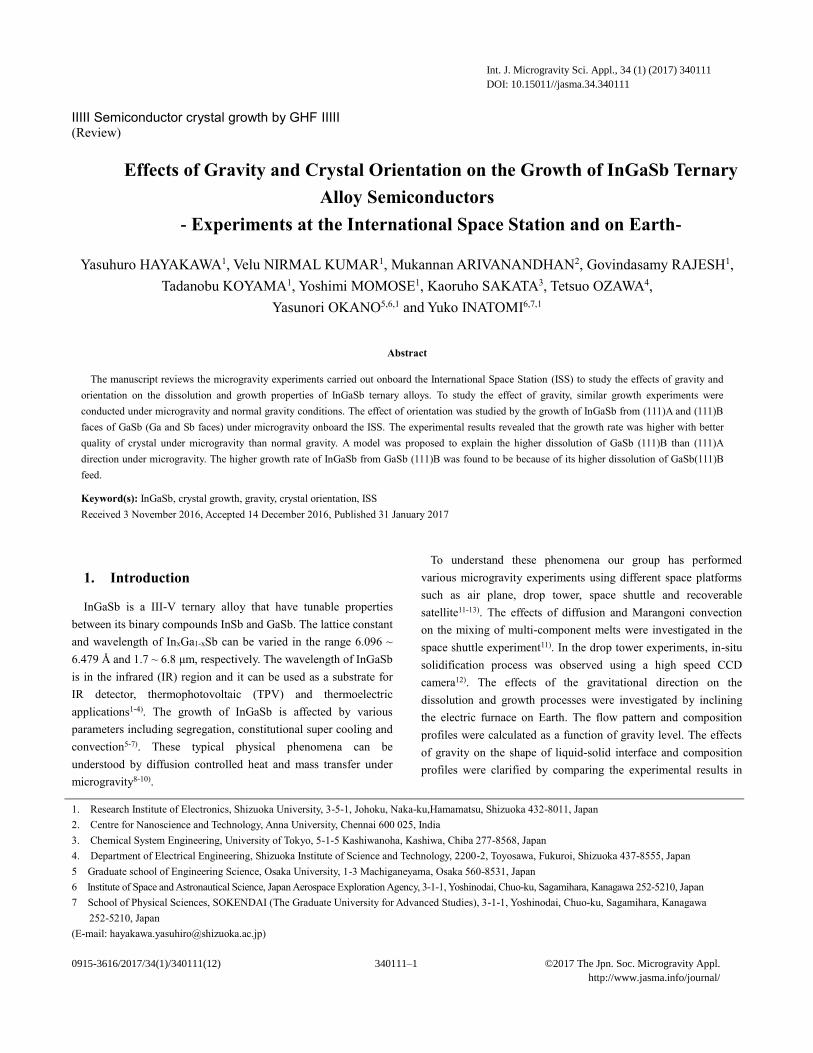
preparation of sandwich samples. Figure 1 shows schematic
diagram of VGF method which was employed for the growth
experiment.
Before the growth experiment, the temperature gradient of the
furnace was calibrated at the ISS. The InGaSb crystals were grown
at the ISS and on Earth using a similar heating profile. The
ampoule with (GaSb(seed)/InSb/GaSb(feed)) sandwich sample
was kept inside the furnace in which temperature gradient was
established (Fig. 1a). For the growth of InGaSb, the furnace
temperature was gradually increased at a rate of 0.06 °C/min up to
700 ˚C. This temperature was maintained as constant for about
107 h. Based on the reference temperature (measured by the
thermocouple) and the temperature gradient, the temperature at the
GaSb seed interface was determined and controlled.
During the high temperature growth process, InSb melted at its
melting point of 525 ˚C and GaSb seed and feed crystals were
started to dissolve in InSb melt thereby InGaSb solution was
formed (Fig. 1c). Because of the temperature gradient, solution at
the seed interface gets supersaturated and it provides the driving
force for the growth of InGaSb from GaSb seed crystal (Fig. 1d).
Once crystal was started to grow from seed interface, seed
dissolution was stopped and further growth was assisted by
dissolution of feed crystal at high temperature. Heat pulses were
applied during the holding process at particular interval to induce
Fig. 1 Schematic diagram of (a) vertical temperature profile,
(b) initial stage of sandwich sample, (c) dissolution and
(d) growth process of vertical gradient freezing method.
Yasuhuro HAYAKAWA, et al.
340100–3
the growth striations at the growth interface by Te-impurity in melt.
The change in temperature modulated the Te-impurity concentration
at the growth interface because of segregation of Te impurity. To
reveal the modulated Te concentration in the grown InGaSb crystals,
an etching process was applied. The etchant HF : CH3COOH :
KMnO4 in 1:1:1 volume ratio was used to reveal the striations. From
the distance between striations, the growth rate was calculated.
A total of 50 heat pulses were applied during the growth period
at intervals of 2 h. For clear identification of the striations which
are created by heat pulses, the introduction time interval between
pulse number 4 and 5 was changed to 1 h. After applying all the
pulses, the temperature was decreased to 400 °C at a cooling rate
of about 0.5 °C /min to reduce the thermal stress in the grown
crystals. Then, the temperature was decreased to room temperature
at a cooling rate of about 1 °C /min. A similar experiment was
conducted under normal gravity condition to study the effect of
gravity on the dissolution and growth process of InGaSb.
The cartridge containing InGaSb sample grown at the ISS was
returned to the Earth by a Russian rocket. The grown crystal in the
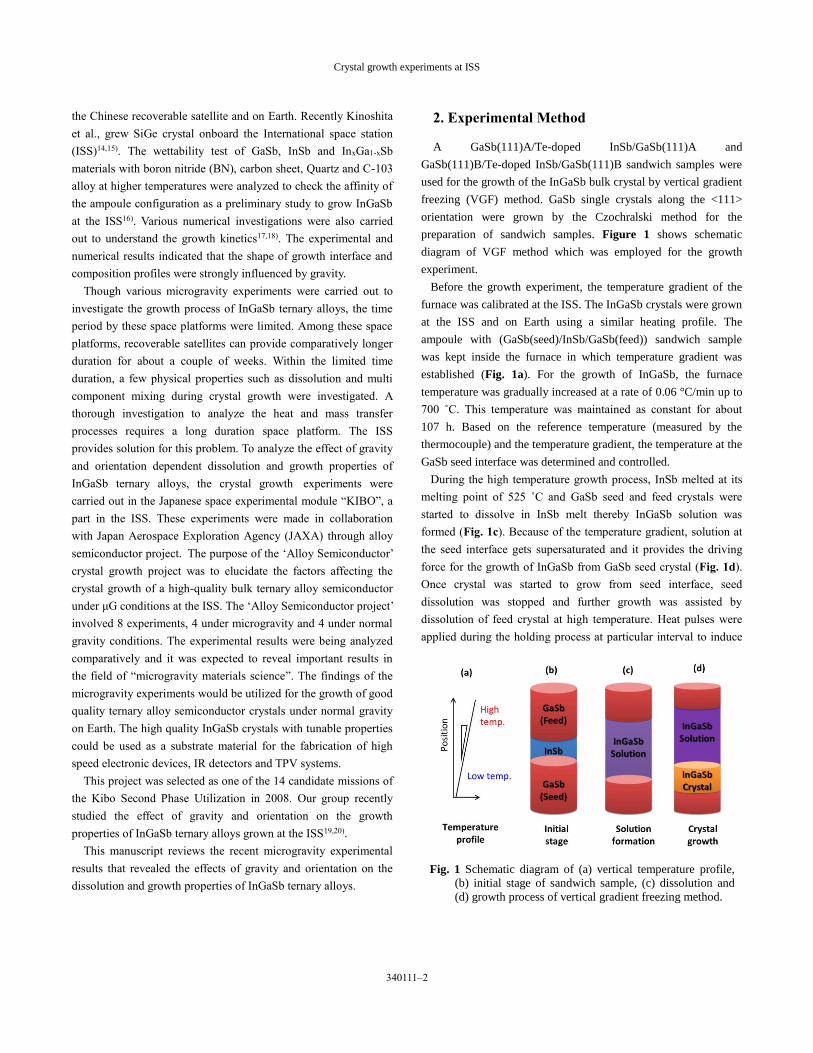
ampoule was taken Laue to fix the cut position along the growth
direction (Fig. 2). After Laue pattern was recorded, the sample
was cut along (110) plane that is perpendicular to growth plane
(111) using a diamond saw cutter. One half of the cut sample was
used for analyzing its compositional profile and growth properties.
Prior to the analysis, the sample was mirror polished
step-by-step using SiC and alumina abrasives of different particle
sizes. The mirror polished sample was etched in a 1:3:1 solution of
HF: KMnO4: CH3COOH for 30 min at room temperature to
observe the Te impurity striations and etch pits. The composition
profiles, interface shapes, and striations of the grown crystals were
analysed by Electron Probe Micro Analysis (EPMA), polarized
optical microscopy, and Field Emission Scanning Electron
Microscope (FE-SEM).
3. Results and Discussion
3.1 Effect of Gravity
3.1.1 Dissolution of GaSb Seed and Feed Crystals
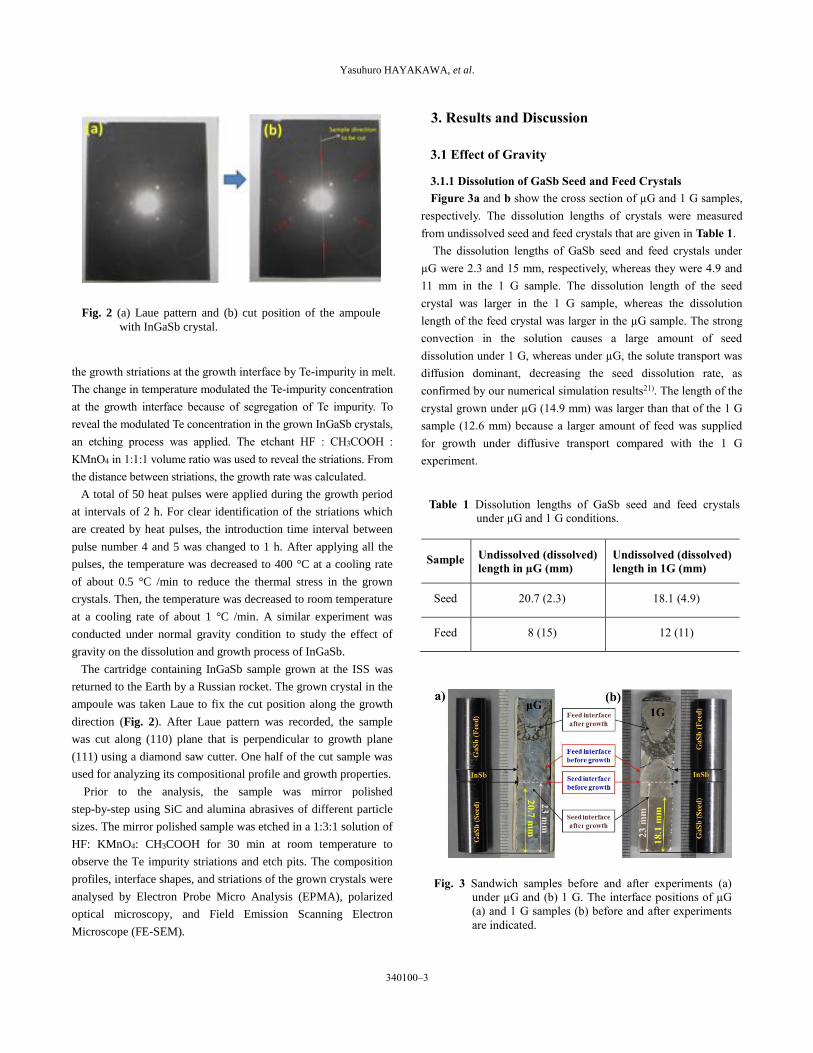
Figure 3a and b show the cross section of µG and 1 G samples,
respectively. The dissolution lengths of crystals were measured
from undissolved seed and feed crystals that are given in Table 1.
The dissolution lengths of GaSb seed and feed crystals under
µG were 2.3 and 15 mm, respectively, whereas they were 4.9 and
11 mm in the 1 G sample. The dissolution length of the seed
crystal was larger in the 1 G sample, whereas the dissolution
length of the feed crystal was larger in the µG sample. The strong
convection in the solution causes a large amount of seed
dissolution under 1 G, whereas under µG, the solute transport was
diffusion dominant, decreasing the seed dissolution rate, as
confirmed by our numerical simulation results21). The length of the
crystal grown under µG (14.9 mm) was larger than that of the 1 G
sample (12.6 mm) because a larger amount of feed was supplied
for growth under diffusive transport compared with the 1 G
experiment.
Fig. 2 (a) Laue pattern and (b) cut position of the ampoule
with InGaSb crystal.
Fig. 3 Sandwich samples before and after experiments (a)
under µG and (b) 1 G. The interface positions of µG
(a) and 1 G samples (b) before and after experiments
are indicated.
Table 1 Dissolution lengths of GaSb seed and feed crystals
under µG and 1 G conditions.
Sample Undissolved (dissolved)
length in µG (mm)
Undissolved (dissolved)
length in 1G (mm)
Seed 20.7 (2.3) 18.1 (4.9)
Feed 8 (15) 12 (11)
Crystal growth experiments at ISS
340111–4
3.1.2 Growth Rate under µG and 1 G Conditions
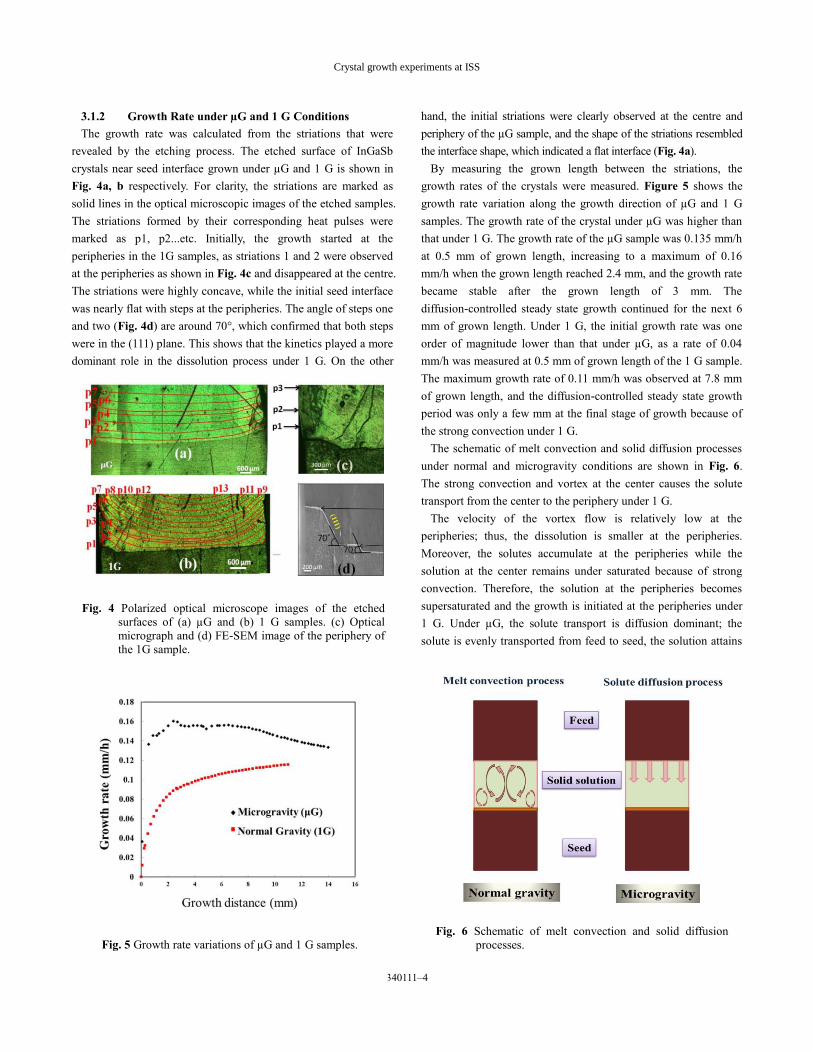
The growth rate was calculated from the striations that were
revealed by the etching process. The etched surface of InGaSb
crystals near seed interface grown under µG and 1 G is shown in
Fig. 4a, b respectively. For clarity, the striations are marked as
solid lines in the optical microscopic images of the etched samples.
The striations formed by their corresponding heat pulses were
marked as p1, p2...etc. Initially, the growth started at the
peripheries in the 1G samples, as striations 1 and 2 were observed
at the peripheries as shown in Fig. 4c and disappeared at the centre.
The striations were highly concave, while the initial seed interface
was nearly flat with steps at the peripheries. The angle of steps one
and two (Fig. 4d) are around 70°, which confirmed that both steps
were in the (111) plane. This shows that the kinetics played a more
dominant role in the dissolution process under 1 G. On the other
hand, the initial striations were clearly observed at the centre and
periphery of the µG sample, and the shape of the striations resembled
the interface shape, which indicated a flat interface (Fig. 4a).
By measuring the grown length between the striations, the
growth rates of the crystals were measured. Figure 5 shows the
growth rate variation along the growth direction of µG and 1 G
samples. The growth rate of the crystal under µG was higher than
that under 1 G. The growth rate of the µG sample was 0.135 mm/h
at 0.5 mm of grown length, increasing to a maximum of 0.16
mm/h when the grown length reached 2.4 mm, and the growth rate
became stable after the grown length of 3 mm. The
diffusion-controlled steady state growth continued for the next 6
mm of grown length. Under 1 G, the initial growth rate was one
order of magnitude lower than that under µG, as a rate of 0.04
mm/h was measured at 0.5 mm of grown length of the 1 G sample.
The maximum growth rate of 0.11 mm/h was observed at 7.8 mm
of grown length, and the diffusion-controlled steady state growth
period was only a few mm at the final stage of growth because of
the strong convection under 1 G.
The schematic of melt convection and solid diffusion processes
under normal and microgravity conditions are shown in Fig. 6.
The strong convection and vortex at the center causes the solute
transport from the center to the periphery under 1 G.
The velocity of the vortex flow is relatively low at the
peripheries; thus, the dissolution is smaller at the peripheries.
Moreover, the solutes accumulate at the peripheries while the
solution at the center remains under saturated because of strong
convection. Therefore, the solution at the peripheries becomes
supersaturated and the growth is initiated at the peripheries under
1 G. Under µG, the solute transport is diffusion dominant; the
solute is evenly transported from feed to seed, the solution attains
Fig. 4 Polarized optical microscope images of the etched
surfaces of (a) µG and (b) 1 G samples. (c) Optical
micrograph and (d) FE-SEM image of the periphery of
the 1G sample.
Fig. 5 Growth rate variations of µG and 1 G samples.
Fig. 6 Schematic of melt convection and solid diffusion
processes.
Yasuhuro HAYAKAWA, et al.
340100–5
equilibrium at the seed interface, and growth is initiated at the
peripheries and centre at nearly the same time. The growth was
initiated faster under µG compared to 1 G, as all the striations
were observed in the crystals (Fig. 4a), possibly because of the
absence of solutal convection. In the 1 G sample, the growth was
delayed because of the presence of convection, which hinders the
solution from attaining equilibrium. As a result, the initial
striations were not observed at the centre of the sample (Fig. 4b).
The solution exhibits two kinds of flows resulting from
compositional and temperature variations in the solution. One is
the dominant convective flow in the middle region from seed to
feed interface that returns to seed interface through periphery.
Another weak flow is at the periphery region from seed to feed
interface that returns to seed interface through middle. As time
elapses, the flow at the periphery region is suppressed by the flow
from central region. Therefore, higher amounts of solutes are
accumulated at the peripheries. As a consequence, the solution at
the periphery becomes supersaturated, leading to the initiation of
growth under 1 G condition.
Under microgravity the solutes dissolved at the seed interface
were not able to move up to the feed interface unlike the 1 G
condition due to the absence of convection and thus the solution at
the seed interface gets locally supersaturated. Therefore under
microgravity, the growth started earlier than 1 G condition.
Moreover, the dissolved solutes from feed interface sturdily
diffuse towards seed interfaces due to density gradient between
solute and solvent. Therefore, the growth rate is relatively high
under microgravity compared to 1 G. Whereas under 1 G,
convection is dominant that reduced the solute accumulation near
seed interface. Moreover seed dissolution is stopped once crystal
was started to grow from seed interface. Hence the initiation of
growth was delayed and growth rate was low compared to μG.
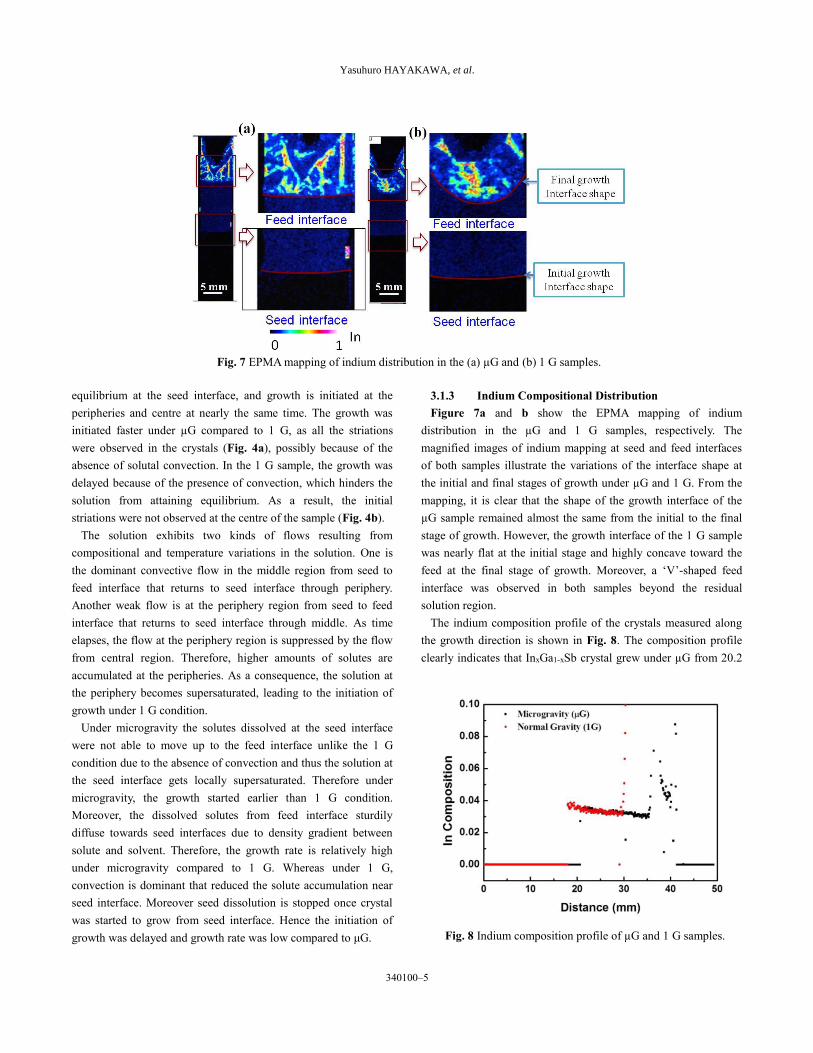
3.1.3 Indium Compositional Distribution
Figure 7a and b show the EPMA mapping of indium
distribution in the µG and 1 G samples, respectively. The
magnified images of indium mapping at seed and feed interfaces
of both samples illustrate the variations of the interface shape at
the initial and final stages of growth under µG and 1 G. From the
mapping, it is clear that the shape of the growth interface of the
µG sample remained almost the same from the initial to the final
stage of growth. However, the growth interface of the 1 G sample
was nearly flat at the initial stage and highly concave toward the
feed at the final stage of growth. Moreover, a ‘V’-shaped feed
interface was observed in both samples beyond the residual
solution region.
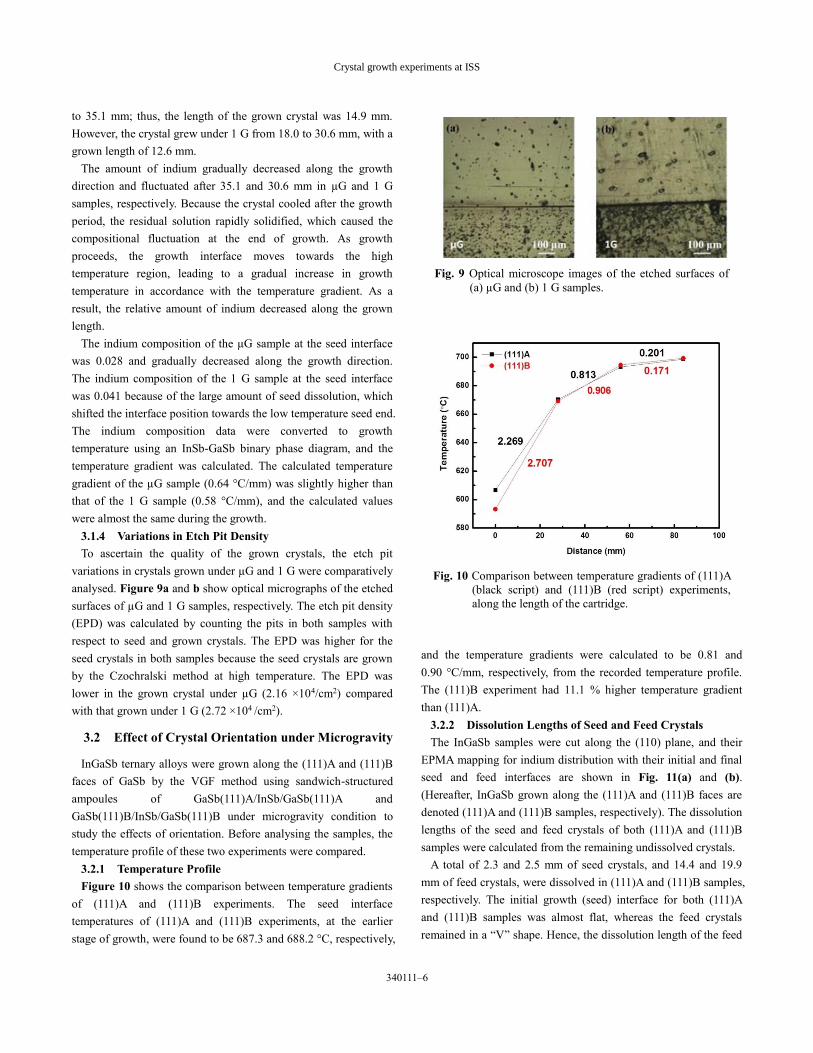
The indium composition profile of the crystals measured along
the growth direction is shown in Fig. 8. The composition profile
clearly indicates that InxGa1-xSb crystal grew under µG from 20.2
Fig. 7 EPMA mapping of indium distribution in the (a) µG and (b) 1 G samples.
Fig. 8 Indium composition profile of µG and 1 G samples.
Crystal growth experiments at ISS
340111–6
to 35.1 mm; thus, the length of the grown crystal was 14.9 mm.
However, the crystal grew under 1 G from 18.0 to 30.6 mm, with a
grown length of 12.6 mm.
The amount of indium gradually decreased along the growth
direction and fluctuated after 35.1 and 30.6 mm in µG and 1 G
samples, respectively. Because the crystal cooled after the growth
period, the residual solution rapidly solidified, which caused the
compositional fluctuation at the end of growth. As growth
proceeds, the growth interface moves towards the high
temperature region, leading to a gradual increase in growth
temperature in accordance with the temperature gradient. As a
result, the relative amount of indium decreased along the grown
length.
The indium composition of the µG sample at the seed interface
was 0.028 and gradually decreased along the growth direction.
The indium composition of the 1 G sample at the seed interface
was 0.041 because of the large amount of seed dissolution, which
shifted the interface position towards the low temperature seed end.
The indium composition data were converted to growth
temperature using an InSb-GaSb binary phase diagram, and the
temperature gradient was calculated. The calculated temperature
gradient of the µG sample (0.64 °C/mm) was slightly higher than
that of the 1 G sample (0.58 °C/mm), and the calculated values
were almost the same during the growth.
3.1.4 Variations in Etch Pit Density
To ascertain the quality of the grown crystals, the etch pit
variations in crystals grown under µG and 1 G were comparatively
analysed. Figure 9a and b show optical micrographs of the etched
surfaces of µG and 1 G samples, respectively. The etch pit density
(EPD) was calculated by counting the pits in both samples with
respect to seed and grown crystals. The EPD was higher for the
seed crystals in both samples because the seed crystals are grown
by the Czochralski method at high temperature. The EPD was
lower in the grown crystal under µG (2.16 ×10⁴/cm2) compared
with that grown under 1 G (2.72 ×10⁴ /cm2).
3.2 Effect of Crystal Orientation under Microgravity
InGaSb ternary alloys were grown along the (111)A and (111)B
faces of GaSb by the VGF method using sandwich-structured
ampoules of GaSb(111)A/InSb/GaSb(111)A and
GaSb(111)B/InSb/GaSb(111)B under microgravity condition to
study the effects of orientation. Before analysing the samples, the
temperature profile of these two experiments were compared.
3.2.1 Temperature Profile
Figure 10 shows the comparison between temperature gradients
of (111)A and (111)B experiments. The seed interface
temperatures of (111)A and (111)B experiments, at the earlier
stage of growth, were found to be 687.3 and 688.2 °C, respectively,
and the temperature gradients were calculated to be 0.81 and
0.90 °C/mm, respectively, from the recorded temperature profile.
The (111)B experiment had 11.1 % higher temperature gradient
than (111)A.
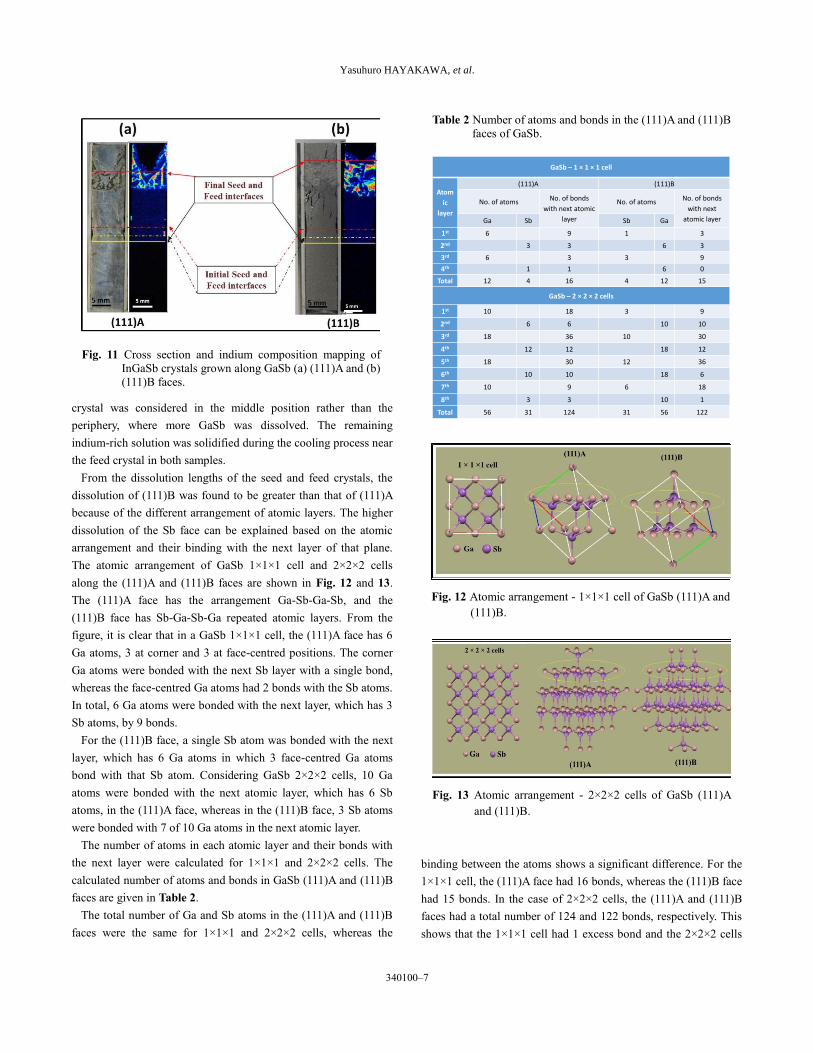
3.2.2 Dissolution Lengths of Seed and Feed Crystals
The InGaSb samples were cut along the (110) plane, and their
EPMA mapping for indium distribution with their initial and final
seed and feed interfaces are shown in Fig. 11(a) and (b).
(Hereafter, InGaSb grown along the (111)A and (111)B faces are
denoted (111)A and (111)B samples, respectively). The dissolution
lengths of the seed and feed crystals of both (111)A and (111)B
samples were calculated from the remaining undissolved crystals.
A total of 2.3 and 2.5 mm of seed crystals, and 14.4 and 19.9
mm of feed crystals, were dissolved in (111)A and (111)B samples,
respectively. The initial growth (seed) interface for both (111)A
and (111)B samples was almost flat, whereas the feed crystals
remained in a “V” shape. Hence, the dissolution length of the feed
Fig. 9 Optical microscope images of the etched surfaces of
(a) µG and (b) 1 G samples.
Fig. 10 Comparison between temperature gradients of (111)A
(black script) and (111)B (red script) experiments,
along the length of the cartridge.
Yasuhuro HAYAKAWA, et al.
340100–7
crystal was considered in the middle position rather than the
periphery, where more GaSb was dissolved. The remaining
indium-rich solution was solidified during the cooling process near
the feed crystal in both samples.
From the dissolution lengths of the seed and feed crystals, the
dissolution of (111)B was found to be greater than that of (111)A
because of the different arrangement of atomic layers. The higher
dissolution of the Sb face can be explained based on the atomic
arrangement and their binding with the next layer of that plane.
The atomic arrangement of GaSb 1×1×1 cell and 2×2×2 cells
along the (111)A and (111)B faces are shown in Fig. 12 and 13.
The (111)A face has the arrangement Ga-Sb-Ga-Sb, and the
(111)B face has Sb-Ga-Sb-Ga repeated atomic layers. From the
figure, it is clear that in a GaSb 1×1×1 cell, the (111)A face has 6
Ga atoms, 3 at corner and 3 at face-centred positions. The corner
Ga atoms were bonded with the next Sb layer with a single bond,
whereas the face-centred Ga atoms had 2 bonds with the Sb atoms.
In total, 6 Ga atoms were bonded with the next layer, which has 3
Sb atoms, by 9 bonds.
For the (111)B face, a single Sb atom was bonded with the next
layer, which has 6 Ga atoms in which 3 face-centred Ga atoms
bond with that Sb atom. Considering GaSb 2×2×2 cells, 10 Ga
atoms were bonded with the next atomic layer, which has 6 Sb
atoms, in the (111)A face, whereas in the (111)B face, 3 Sb atoms
were bonded with 7 of 10 Ga atoms in the next atomic layer.
The number of atoms in each atomic layer and their bonds with
the next layer were calculated for 1×1×1 and 2×2×2 cells. The
calculated number of atoms and bonds in GaSb (111)A and (111)B
faces are given in Table 2.
The total number of Ga and Sb atoms in the (111)A and (111)B
faces were the same for 1×1×1 and 2×2×2 cells, whereas the
binding between the atoms shows a significant difference. For the
1×1×1 cell, the (111)A face had 16 bonds, whereas the (111)B face
had 15 bonds. In the case of 2×2×2 cells, the (111)A and (111)B
faces had a total number of 124 and 122 bonds, respectively. This
shows that the 1×1×1 cell had 1 excess bond and the 2×2×2 cells
Fig. 12 Atomic arrangement - 1×1×1 cell of GaSb (111)A and
(111)B.
Table 2 Number of atoms and bonds in the (111)A and (111)B
faces of GaSb.
GaSb – 1 × 1 × 1 cell
Atom
ic
layer
(111)A (111)B
No. of atoms No. of bonds
with next atomic
layer
No. of atoms No. of bonds
with next
atomic layerGa Sb Sb Ga
1st 6 9 1 3
2nd 3 3 6 3
3rd 6 3 3 9
4th 1 1 6 0
Total 12 4 16 4 12 15
GaSb – 2 × 2 × 2 cells
1st 10 18 3 9
2nd 6 6 10 10
3rd 18 36 10 30
4th 12 12 18 12
5th 18 30 12 36
6th 10 10 18 6
7th 10 9 6 18
8th 3 3 10 1
Total 56 31 124 31 56 122
Fig. 11 Cross section and indium composition mapping of
InGaSb crystals grown along GaSb (a) (111)A and (b)
(111)B faces.
Fig. 13 Atomic arrangement - 2×2×2 cells of GaSb (111)A
and (111)B.

Crystal growth experiments at ISS
340111–8
had 2 excess bonds in their (111)A face. As the number of unit
cells increased, the excess bonds in the (111)A face increased.
When we consider a bulk material of n × n × n cells, it would
have n number of excess bonds in (111)A compared with the
(111)B face. In the above mentioned model if we consider that Sb
atoms are located at the corner, (111)B face will have more
number of atomic bonds than that of (111)A face. However,
irrespective of the position of corner atoms, the once face of
GaSb(111) had more number of bonds than that of other face.
Hence one face of GaSb (111) will dissolve more than that of the
other face because less activation energy is required to break the
bonds on that face compared with the other face. The experimental
results have shown that the (111)B face was dissolved more than
that of (111)A face. The consideration of Ga atoms at the corner
position in the above mentioned model supports the experimental
data and hence, the higher dissolution of GaSb (111)B was because
of the less number of atomic bonds on that face. The obtained result
was consistent with our previous microgravity experiment.
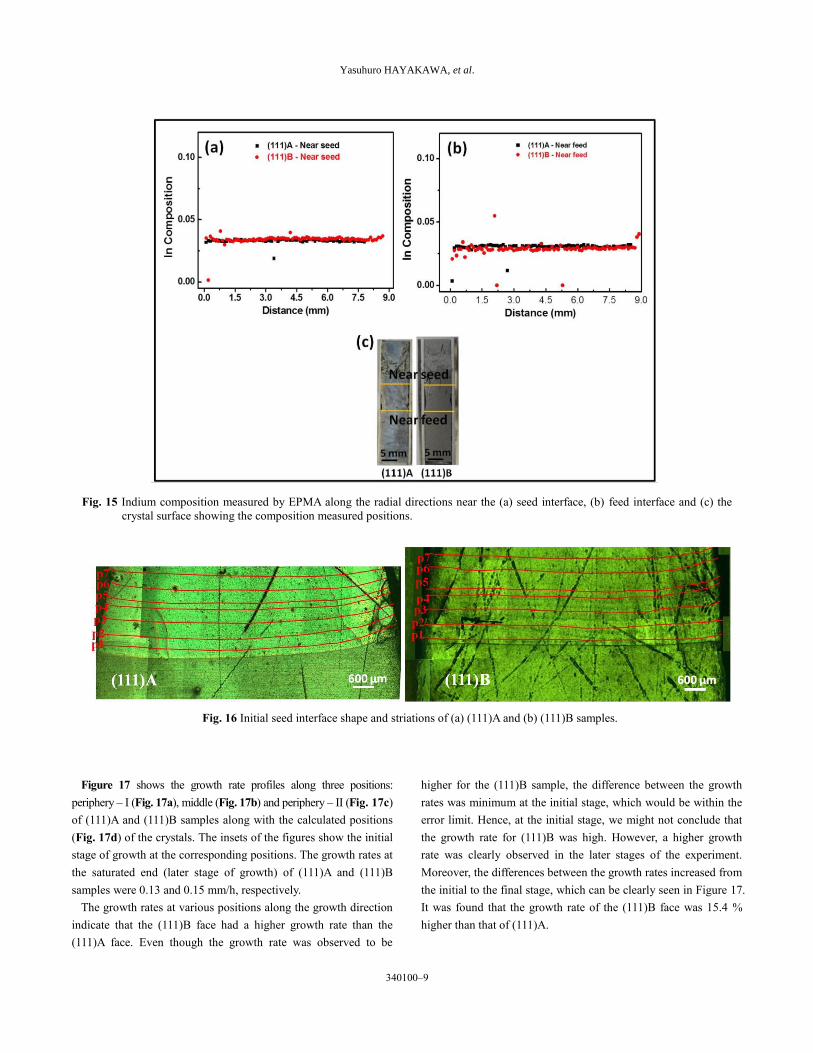
3.2.3 Indium Composition
The vertical distribution of indium composition was measured at
three positions (Periphery – I, Middle and Periphery – II) along the
growth direction, and the radial distribution was measured at two
positions near the seed and in the middle position. Figure 14(a)
and (c) show the indium composition along the vertical direction
with the measured position of both (111)A and (111)B samples
(Fig. 14d). The initial indium composition for both the samples
was approximately 0.034 and gradually decreased to 0.030 in the
(111)A sample, whereas it ended up at 0.026 in the (111)B sample.
During the growth process, the growth interface moved towards
the high-temperature feed region because the temperature gradient
was maintained in the furnace. Hence, the indium composition
along the growth region decreased according to the phase diagram.
The random distribution of indium in the later stages of growth
occurred because of the solidification of residual melt when
cooling was applied to the system.
The radial indium composition is shown in Fig. 15. The radial
distribution of indium was uniform in both samples.
3.2.4 Growth Rate
The etched surfaces of the (111)A and (111)B samples near the
growth interface are shown in Fig. 16, in which the striations are
marked with red lines for clear visibility. The initial growth
interface shape was almost flat in both samples, and the striations
had a flat interface. The growth rates of the (111)A and (111)B
samples were calculated along three vertical positions (Periphery –
I, Middle and Periphery – II) by measuring the distances between
the induced growth striations.
Fig. 14 Indium composition measured by EPMA along the vertical directions (a) periphery – I, (b) middle, (c) periphery – II; and (d)
the crystal surface showing the composition measured positions.
Yasuhuro HAYAKAWA, et al.
340100–9
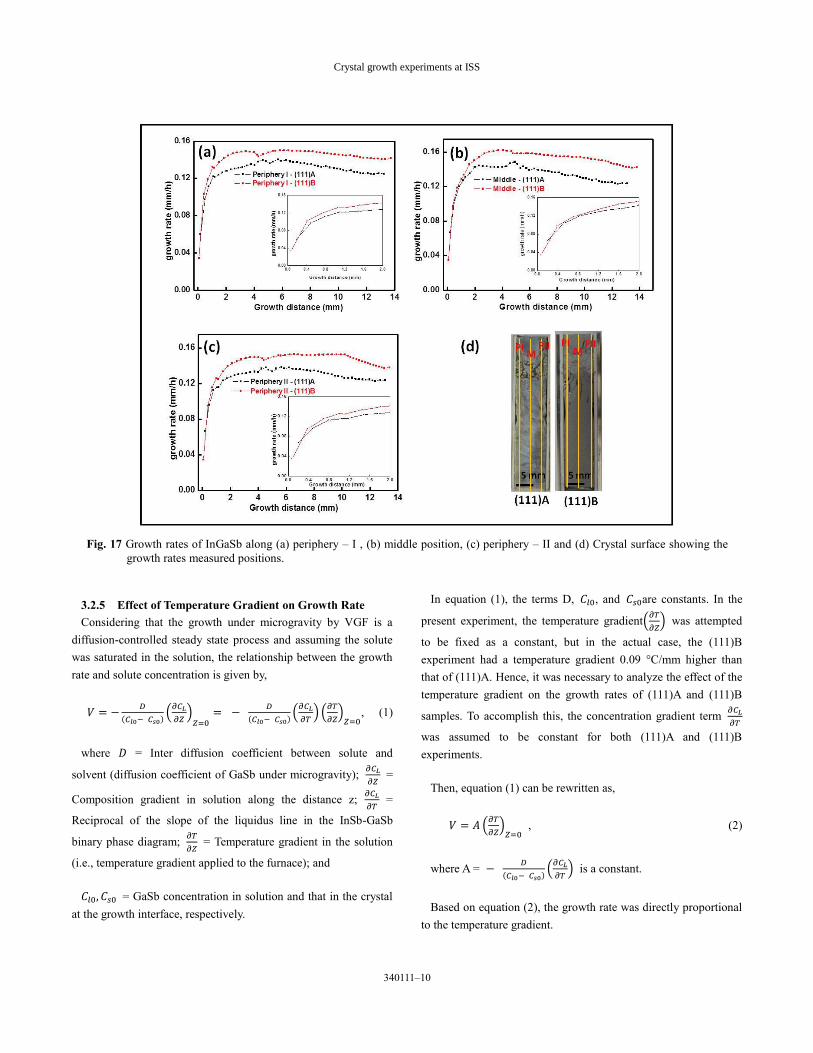
Figure 17 shows the growth rate profiles along three positions:
periphery – I (Fig. 17a), middle (Fig. 17b) and periphery – II (Fig. 17c)
of (111)A and (111)B samples along with the calculated positions
(Fig. 17d) of the crystals. The insets of the figures show the initial
stage of growth at the corresponding positions. The growth rates at
the saturated end (later stage of growth) of (111)A and (111)B
samples were 0.13 and 0.15 mm/h, respectively.
The growth rates at various positions along the growth direction
indicate that the (111)B face had a higher growth rate than the
(111)A face. Even though the growth rate was observed to be
higher for the (111)B sample, the difference between the growth
rates was minimum at the initial stage, which would be within the
error limit. Hence, at the initial stage, we might not conclude that
the growth rate for (111)B was high. However, a higher growth
rate was clearly observed in the later stages of the experiment.
Moreover, the differences between the growth rates increased from
the initial to the final stage, which can be clearly seen in Figure 17.
It was found that the growth rate of the (111)B face was 15.4 %
higher than that of (111)A.
Fig. 15 Indium composition measured by EPMA along the radial directions near the (a) seed interface, (b) feed interface and (c) the
crystal surface showing the composition measured positions.
Fig. 16 Initial seed interface shape and striations of (a) (111)A and (b) (111)B samples.
Crystal growth experiments at ISS
340111–10
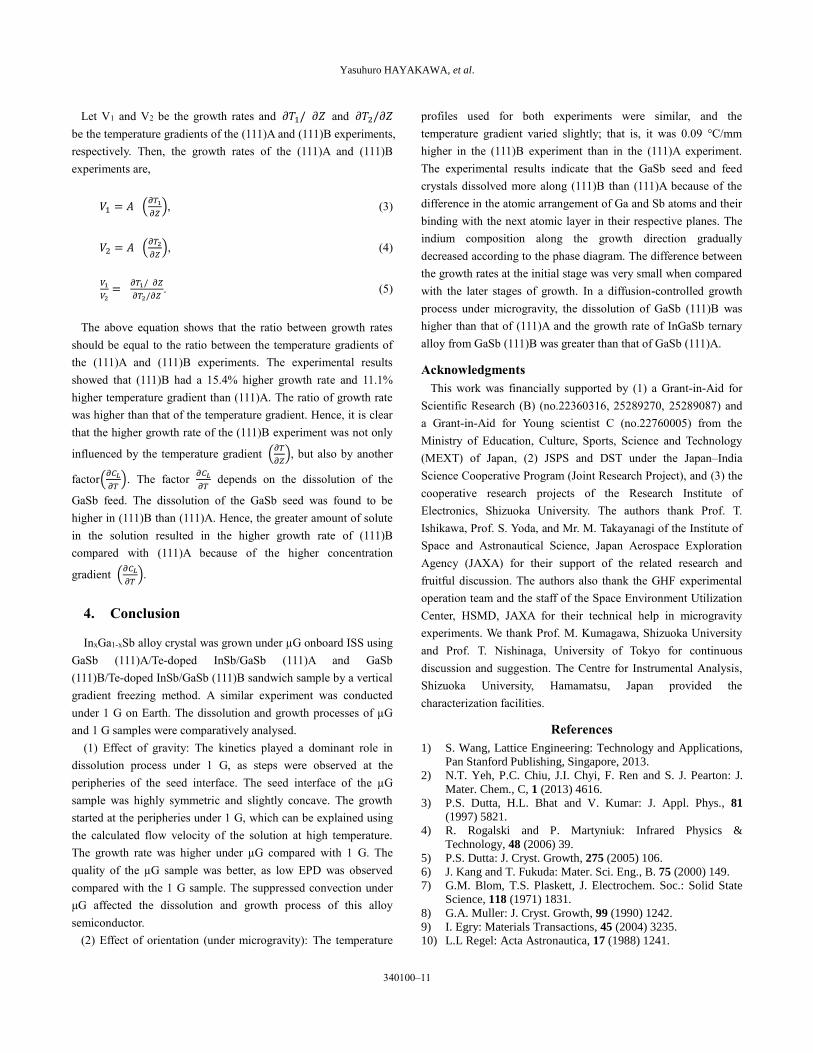
3.2.5 Effect of Temperature Gradient on Growth Rate
Considering that the growth under microgravity by VGF is a
diffusion-controlled steady state process and assuming the solute
was saturated in the solution, the relationship between the growth
rate and solute concentration is given by,
𝑉 = −𝐷
(𝐶𝑙0− 𝐶𝑠0)(
𝜕𝐶𝐿
𝜕𝑍)
𝑍=0= −
𝐷
(𝐶𝑙0− 𝐶𝑠0)(
𝜕𝐶𝐿
𝜕𝑇) (
𝜕𝑇
𝜕𝑍)
𝑍=0, (1)
where 𝐷 = Inter diffusion coefficient between solute and
solvent (diffusion coefficient of GaSb under microgravity); 𝜕𝐶𝐿
𝜕𝑍 =
Composition gradient in solution along the distance z; 𝜕𝐶𝐿
𝜕𝑇 =
Reciprocal of the slope of the liquidus line in the InSb-GaSb
binary phase diagram; 𝜕𝑇
𝜕𝑍 = Temperature gradient in the solution
(i.e., temperature gradient applied to the furnace); and
𝐶𝑙0, 𝐶𝑠0 = GaSb concentration in solution and that in the crystal
at the growth interface, respectively.
In equation (1), the terms D, 𝐶𝑙0, and 𝐶𝑠0are constants. In the
present experiment, the temperature gradient(𝜕𝑇
𝜕𝑍) was attempted
to be fixed as a constant, but in the actual case, the (111)B
experiment had a temperature gradient 0.09 °C/mm higher than
that of (111)A. Hence, it was necessary to analyze the effect of the
temperature gradient on the growth rates of (111)A and (111)B
samples. To accomplish this, the concentration gradient term 𝜕𝐶𝐿
𝜕𝑇
was assumed to be constant for both (111)A and (111)B
experiments.
Then, equation (1) can be rewritten as,
𝑉 = 𝐴 (𝜕𝑇
𝜕𝑍)
𝑍=0 , (2)
where A = − 𝐷
(𝐶𝑙0− 𝐶𝑠0)(
𝜕𝐶𝐿
𝜕𝑇) is a constant.
Based on equation (2), the growth rate was directly proportional
to the temperature gradient.
Fig. 17 Growth rates of InGaSb along (a) periphery – I , (b) middle position, (c) periphery – II and (d) Crystal surface showing the
growth rates measured positions.
Yasuhuro HAYAKAWA, et al.
340100–11
Let V1 and V2 be the growth rates and 𝜕𝑇1/ 𝜕𝑍 and 𝜕𝑇2/𝜕𝑍
be the temperature gradients of the (111)A and (111)B experiments,
respectively. Then, the growth rates of the (111)A and (111)B
experiments are,
𝑉1 = 𝐴 (𝜕𝑇1
𝜕𝑍), (3)
𝑉2 = 𝐴 (𝜕𝑇2
𝜕𝑍), (4)
𝑉1
𝑉2=
𝜕𝑇1/ 𝜕𝑍
𝜕𝑇2/𝜕𝑍. (5)
The above equation shows that the ratio between growth rates
should be equal to the ratio between the temperature gradients of
the (111)A and (111)B experiments. The experimental results
showed that (111)B had a 15.4% higher growth rate and 11.1%
higher temperature gradient than (111)A. The ratio of growth rate
was higher than that of the temperature gradient. Hence, it is clear
that the higher growth rate of the (111)B experiment was not only
influenced by the temperature gradient (𝜕𝑇
𝜕𝑍), but also by another
factor(𝜕𝐶𝐿
𝜕𝑇). The factor
𝜕𝐶𝐿
𝜕𝑇 depends on the dissolution of the
GaSb feed. The dissolution of the GaSb seed was found to be
higher in (111)B than (111)A. Hence, the greater amount of solute
in the solution resulted in the higher growth rate of (111)B
compared with (111)A because of the higher concentration
gradient (𝜕𝐶𝐿
𝜕𝑇).
4. Conclusion
InxGa1-xSb alloy crystal was grown under µG onboard ISS using
GaSb (111)A/Te-doped InSb/GaSb (111)A and GaSb
(111)B/Te-doped InSb/GaSb (111)B sandwich sample by a vertical
gradient freezing method. A similar experiment was conducted
under 1 G on Earth. The dissolution and growth processes of µG
and 1 G samples were comparatively analysed.
(1) Effect of gravity: The kinetics played a dominant role in
dissolution process under 1 G, as steps were observed at the
peripheries of the seed interface. The seed interface of the µG
sample was highly symmetric and slightly concave. The growth
started at the peripheries under 1 G, which can be explained using
the calculated flow velocity of the solution at high temperature.
The growth rate was higher under µG compared with 1 G. The
quality of the µG sample was better, as low EPD was observed
compared with the 1 G sample. The suppressed convection under
μG affected the dissolution and growth process of this alloy
semiconductor.
(2) Effect of orientation (under microgravity): The temperature
profiles used for both experiments were similar, and the
temperature gradient varied slightly; that is, it was 0.09 °C/mm
higher in the (111)B experiment than in the (111)A experiment.
The experimental results indicate that the GaSb seed and feed
crystals dissolved more along (111)B than (111)A because of the
difference in the atomic arrangement of Ga and Sb atoms and their
binding with the next atomic layer in their respective planes. The
indium composition along the growth direction gradually
decreased according to the phase diagram. The difference between
the growth rates at the initial stage was very small when compared
with the later stages of growth. In a diffusion-controlled growth
process under microgravity, the dissolution of GaSb (111)B was
higher than that of (111)A and the growth rate of InGaSb ternary
alloy from GaSb (111)B was greater than that of GaSb (111)A.
Acknowledgments
This work was financially supported by (1) a Grant-in-Aid for
Scientific Research (B) (no.22360316, 25289270, 25289087) and
a Grant-in-Aid for Young scientist C (no.22760005) from the
Ministry of Education, Culture, Sports, Science and Technology
(MEXT) of Japan, (2) JSPS and DST under the Japan–India
Science Cooperative Program (Joint Research Project), and (3) the
cooperative research projects of the Research Institute of
Electronics, Shizuoka University. The authors thank Prof. T.
Ishikawa, Prof. S. Yoda, and Mr. M. Takayanagi of the Institute of
Space and Astronautical Science, Japan Aerospace Exploration
Agency (JAXA) for their support of the related research and
fruitful discussion. The authors also thank the GHF experimental
operation team and the staff of the Space Environment Utilization
Center, HSMD, JAXA for their technical help in microgravity
experiments. We thank Prof. M. Kumagawa, Shizuoka University
and Prof. T. Nishinaga, University of Tokyo for continuous
discussion and suggestion. The Centre for Instrumental Analysis,
Shizuoka University, Hamamatsu, Japan provided the
characterization facilities.
References
1) S. Wang, Lattice Engineering: Technology and Applications,
Pan Stanford Publishing, Singapore, 2013.
2) N.T. Yeh, P.C. Chiu, J.I. Chyi, F. Ren and S. J. Pearton: J.
Mater. Chem., C, 1 (2013) 4616.
3) P.S. Dutta, H.L. Bhat and V. Kumar: J. Appl. Phys., 81
(1997) 5821.
4) R. Rogalski and P. Martyniuk: Infrared Physics &
Technology, 48 (2006) 39.
5) P.S. Dutta: J. Cryst. Growth, 275 (2005) 106.
6) J. Kang and T. Fukuda: Mater. Sci. Eng., B. 75 (2000) 149.
7) G.M. Blom, T.S. Plaskett, J. Electrochem. Soc.: Solid State
Science, 118 (1971) 1831.
8) G.A. Muller: J. Cryst. Growth, 99 (1990) 1242.
9) I. Egry: Materials Transactions, 45 (2004) 3235.
10) L.L Regel: Acta Astronautica, 17 (1988) 1241.
Crystal growth experiments at ISS
340111–12
11) K. Okitsu, Y. Hayakawa, T. Yamaguchi, M. Kumagawa,
A. Hirata, S. Fujiwara, Y. Okano, N. Imaishi, S. Yoda and
T. Oida: Cryst. Res., Technol. 31 (1996) 969.
12) Y. Hayakawa, K. Balakrishnan, H. Komatsu, N. Murakami,
T. Nakamura, T. Koyama, T. Ozawa, Y. Okano,
M. Miyazawa, S. Dost, L.H. Dao and M. Kumagawa: J. Cryst.
Growth, 237-239 (2002) 1831.
13) Y. Hayakawa, Y. Okano, A. Hirata, N. Imaishi, Y. Kumagiri,
X. Zhong, X. Xie, B. Yuan, F. Wu, H. Liu, T. Yamaguchi
and M. Kumagawa: J. Cryst. Growth, 213 (2000) 40.
14) K. Kinoshita, Y. Arai, Y. Inatomi, T. Tsukada, S. Adachi,
H. Mitaya, R. Tanaka, J. Yoshikawa, T. Kaihara,
M. Takayanagi and S. Yoda: J. Cryst. Growth, 388 (2014) 12.
15) K. Kinoshita, Y. Arai, Y. Inatomi, T. Tsukada, S. Adachi,
H. Mitaya, R. Tanaka, J. Yoshikawa, T. Kaihara,
M. Takayanagi and S. Yoda: J. Cryst. Growth, 419 (2015) 47.
16) K. Sakata, M. Mukai, M. Arivanandhan, G. Rajesh,
T. Ishikawa, Y. Inatomi and Y. Hayakawa: Trans. JSASS
Aerospace Tech., 12 (2014)31.
17) H. Mirsandi, T. Yamamoto, Y. Takagi, Y. Okano, Y. Inatomi,
Y. Hayakawa and S. Dost: Microgravity Sci. Technol., 27
(2015) 313.
18) X. Jin, H. Mirsandi, T. Yamamoto, Y. Takagi, Y. Okano,
Y. Inatomi, Y. Hayakawa and S. Dost: JJAP Conf. Proc., 4
(2016) 011107.
19) Y. Inatomi, K. Sakata, M. Arivanandhan, G. Rajesh,
V. Nirmal Kumar, T. Koyama, T. Ozawa, Y. Okano and
Y. Hayakawa: npj Microgravity, 1 (2015) 15011.
20) V. Nirmal Kumar, M. Arivanandhan, G. Rajesh, T. Koyama,
Y. Momose, K. Sakata, T. Ozawa, Y. Okano, Y. Inatomi and
Y. Hayakawa: npj Microgravity, 2 (2016) 16026.
21) G.Rajesh, M.Arivanandhan, N.Suzuki, A.Tanaka, H.Morii,
T.Aoki, T.Koyama, Y.Momose, T.Ozawa, Y.Inatomi,
Y.Takagi, Y.Okano and Y.Hayakawa: J. Cryst. Growth, 324
(2011) 157.
"Reprinted from the Publications listed below with permission
from npj Microgravity.”
1. Y. Inatomi, K. Sakata, M. Arivanandhan, G. Rajesh,
V. Nirmal Kumar, T. Koyama, T. Ozawa, Y. Okano and
Y. Hayakawa: npj Microgravity, 1 (2015) 15011.
2. V. Nirmal Kumar, M. Arivanandhan, G. Rajesh, T. Koyama,
Y. Momose, K. Sakata, T. Ozawa, Y. Okano, Y. Inatomi and
Y. Hayakawa: npj Microgravity, 2 (2016) 16026.