effects of femtocell ultradense deployment on downlink
TRANSCRIPT
Research ArticleEffects of Femtocell Ultradense Deployment on DownlinkPerformance in LTE Heterogeneous Networks
Motea Saleh Al-omari,1 Mohammad Ahmed Alomari ,2 Abdul Rahman Ramli,1
Aduwati Sali,1 Raja Syamsul Azmir,1 and M. Hafiz Yusoff3
1Faculty of Engineering, Universiti Putra Malaysia, Selangor, Malaysia2Institute of Informatics and Computing in Energy, Universiti Tenaga Nasional, Malaysia3School of Informatics and Computing, Albukhary International University (AIU), Malaysia
Correspondence should be addressed to Mohammad Ahmed Alomari; [email protected]
Received 18 December 2019; Revised 19 April 2021; Accepted 7 August 2021; Published 10 September 2021
Academic Editor: Vicente Casares-Giner
Copyright © 2021 Motea Saleh Al-omari et al. This is an open access article distributed under the Creative Commons AttributionLicense, which permits unrestricted use, distribution, and reproduction in any medium, provided the original work isproperly cited.
With huge number of smart gadgets and wireless devices being interconnected to each other, the demand for very high databandwidth is becoming critically challenging. With such density of nodes inside wireless networks, providing high-qualityservice as well as wide coverage in indoor environment is a real challenge, which is due to the limited radio frequency andintense interference between nodes. As a one way to solve such problem and improve indoor service quality, femtocells havebeen introduced as an extension to the existing macrocell stations. Although femtocell is a promising technology, the pervasivedeployment of huge number of femtocells without very tight network planning as well as coverage strategy may worsen theproblem and degrade the service quality. One important problem that needs to be addressed when deploying femtocelltechnology in heterogenous networks (HetNets) is mitigating the various types of cross-tier and cotier interferences in betweenwireless cells. This study investigates the effect of unplanned ultradensity femtocell deployment in the downlink performanceof two-tier heterogeneous networks in urban area based on LTE system. Instead of deploying femtocells one by one, grids ofsize either (3 × 3) or (5 × 5) of neighboring femtocell will be deployed inside each macrocell sector area. The simulation resultsshow that femtocell deployment improves overall average user throughput in case of low and medium density scenarios.However, for ultradensity scenario, there is no enhancement in terms of fairness and throughput. The results confirm that thisleads to high degradation for macrocell and femtocell user performance due to the severe interference between macrocells andfemtocells, as well as among neighboring femtocells in each grid.
1. Introduction
Due to the advances in modern cellular technology, wirelessdevices have become an essential indispensable element inour daily life. The rapid growth and proliferation of wirelessdevices and gadgets have turned the cellular networks frombeing basically voice networks to become mostly data net-works. To provide higher data rates, operators across theworld have switched to upper frequencies in order toincrease the bandwidth. However, increasing number ofwireless nodes in suburban and urban areas has created abigger challenge for the outdoor base station to providequality coverage in indoor environments. According to
recent studies, roughly 66% of the phone calls and 90% ofthe data services take place in indoor environments (e.g.,home, office, and enterprises) [1–3]. However, more andmore users complain of poor connectivity as the signalstrength received from outdoor base station (BS) weakensand deceases in performance due to the high loss of wallpenetration [4–6]. As stated in [7], 45% of the residentialsubscribers and 30% of the corporate subscribers complainof poor indoor coverage. The existing outdoor base stationcannot increase the transmission power in an infinite levelto ensure the coverage in outage areas. The growing demandfor broadband wireless access inside residential (indoors)environment along with the shortage of capacity in the
HindawiWireless Communications and Mobile ComputingVolume 2021, Article ID 2735935, 21 pageshttps://doi.org/10.1155/2021/2735935

existing outdoor base stations has motivated wireless serviceproviders to look for possible solutions to improve indoorcoverage with high data rates and enhanced quality of ser-vice (QoS). To handle these challenges, different deploymentstrategies have been proposed earlier including installationof extra macrocell, distributed antennas (DAs), hot spots,in-building solution (IBS), picocells, and multihop relays.The infrastructure for doing so, nonetheless, is expensiveand cannot guarantee high quality indoor coverage. Theconcept of femtocells has recently been introduced as thecheapest solution for indoor wireless broadband [8–10].Femtocell base station (FBS) or femtocell access point(FAP) is a small base station typically designed for indooruse in a small office home office (SOHO) environment toprovide voice and broadband services. FBS is a cost compet-itive, low power, short-range wireless device operating in thelicensed spectrum. The term femtocell itself was first coinedin 2006. FBS is not a new concept as it was first studied in1999 by Bell Labs, while GSM-based home base stationwas brought to the market by Alcatel in 2000. The first3G-based home base station was introduced by Motorolain 2002 [11]. In the metric measurement system, “Femto”means one-quadrillionth (1015). FBS is installed by the usersto ensure seamless indoor coverage with better voice anddata reception [12, 13]. FBS, on the air interface, providesradio coverage to a given cellular standard [14], such asGlobal System Mobile (GSM) communication, WidebandCode Division Multiple Access (WCDMA), UniversalMobile Telecommunications System (UMTS), WorldwideInteroperability for Microwave Access (WiMAX), andLong-Term Evolution (LTE). The 3rd Generation Partner-ship Project (3GPP) refers to this FBS as Home Node Basestation (HNBs). The LTE femtocell is referred to as Homeevolved Node Base station (HeNB) [15]. As illustrated inFigure 1, FBSs are connected to the Internet via broadbandbackhaul connection such as cable modem, digital subscriberline (DSL), on premise fiber optic link, separate radio fre-quency (RF) backhaul channel, satellite, or a similar IP back-haul technology. The wired connection is used to integratethe FBS with the mobile operator’s core network. FBSs wereintroduced in the 3GPP release 8 in 2008 [16].
Given the continuous evolving of technologies of cellularnetworks, several femtocell specifications and standards arebeing included in the technical reports of 3GPP and3GPP2 [14, 17, 18]. Triggered by its high spectral efficiencyand low implementation cost, OFDMA has been utilized inmany high-speed wireless transmission standards (e.g.,LTE, WiMAX, and Wi-Fi). Long-Term Evolution (LTE) isa broadband wireless access technology designed to supportmobile Internet access via cell phones or handheld devices.As LTE exhibits significant performance improvements overprevious cellular communication standards, it is commonlyreferred to as fourth generation (4G) technology [19]. Thispaper treats LTE as a standard to investigate the interferenceproblem in OFDMA-based femtocell networks. The stan-dard was developed by the 3GPP and was specified andenhanced in release 8 and release 9 of its document series,respectively [20]. Besides LTE, LTE-advanced has beendeveloped as successor standard of LTE. There are many
solutions which have been specified in release 10 and release11 (LTE-advanced) of LTE, and more solutions are studiedand developed in the next release (Rel-12 and beyond). Anumber of worldwide mobile operators showed interest inLTE HeNB technologies as a promising solution to increasesystem capacity in the near future [21, 22].
This paper is intended to focus on investigating thechallenges and impact of unplanned (random) femtocelldeployment density on downlink performance of MUE(macrouser equipment) in LTE heterogeneous networks.The rest of the paper moves as per the following roadmap;Section 2 provides various indoor coverage technologies inheterogeneous networks. Section 3 discusses in detail theinterference issue and provides different interference sce-narios in OFDMA two-tier macrofemtocell heterogeneousnetwork-based LTE. Section 4 describes the system modeland the effects of deployment FBS grid density in HetNets.Section 5 provides the performance evaluation metricswhile Section 6 provides the simulation environment andlists all simulation parameters. Finally, Section 7 presentsthe simulation results while Section 8 provides concludingremarks.
2. Indoor Coverage Technologies in HetNets
The traditional cellular network deployment approachexhibits to only macrocentric cell architecture where themacrocell base stations correspond to a planned layout. Suchmacrocell-based cellular network is referred as homogeneousnetwork. In homogeneous network, all the base stations havesimilar backhaul connectivity to the core network, sametransmit power levels, antenna heights, antenna patterns,and receiver noise floors, and provide unrestricted connec-tivity to all the user equipments (UEs) [22, 23]. A networkwhich includes the hierarchical layering of cells with macrobase stations coexisting with low-power and short-rangesmall cells (such as femtocells, picocells, distributed antennasystems (DASs), and relays) in the same service area isreferred to as a Heterogeneous Networks (HetNets) or a mul-titier network as illustrated in Figure 2. HetNets or a multi-tier network is considered to be an efficient solution toenhance the spectral-efficiency per unit area of the network.Additionally, it also provides significant improvement in thecoverage of the indoor and cell-edge users as well as assuringbetter quality of service (QoS) to various users. In recentyears, HetNet-based deployment model is considered bythe mobile operators. In other words, HetNets or multitieredcellular network comprises of existing homogeneous net-works overlaid with extended infrastructure in the form ofsmaller, low-complexity, low-power, and short-ranged basestations referred as femtocells (small cells) [24].
The radio base stations in HetNets can contain varioustypes such as macrocells, picocells, and relay nodes. Macro-cell base stations, which is referred as MeNBs, have the abil-ity to cover larger area (e.g., cell radius of 500m-1000m)with high transmit power (46 dBm or 40 watts) while pro-viding service to all the UEs in its coverage area [25]. Theabbreviations MBS, MC, and MeNBs are all stands formacro base station and may be used interchangeably.
2 Wireless Communications and Mobile Computing

Picocells are smaller wireless towers which are usuallydeployed to minimize coverage holes in a homogeneous cel-lular network. They help improving the capacity of the net-work. The coverage area of a picocell usually can spanbetween 75m and 150m. In comparison to MeNB, the pico-cells consist of omni-directional low-transmission powered
antennas with providing proper indoor coverage to theUEs in the public places such as shopping malls, stadiums,and airports [26]. DASs comprise of several separateantenna elements (AEs) connecting to macro base stations(MBSs) via dedicated radio frequency (RF) links or fiberoptic cables to extend the macrocoverage. Like picocells,
Mobile operatorcore network
Internet
MacrocellBS
MUE
FUE
FUE
Femto BS
FUEBroadband
router
Figure 1: A typical femtocell architecture.
Internet
Mobile operatorcore network
Pico & RRH dedicatedbackhuals
MacrocellBS
Picocell
MUE
Femto BS
Femto internetbackhual
RRH
Relay
Relay RF backhual
Broadbandrouter
Figure 2: Layout of a heterogeneous cellular wireless network concept.
3Wireless Communications and Mobile Computing
relay nodes are also used to improve service coverage in newareas such as exhibitions, events, tunnels, or high-speedtrains. However, relay nodes backhaul their data trafficthrough wireless link to a donor eNodeB (e.g., MeNB).
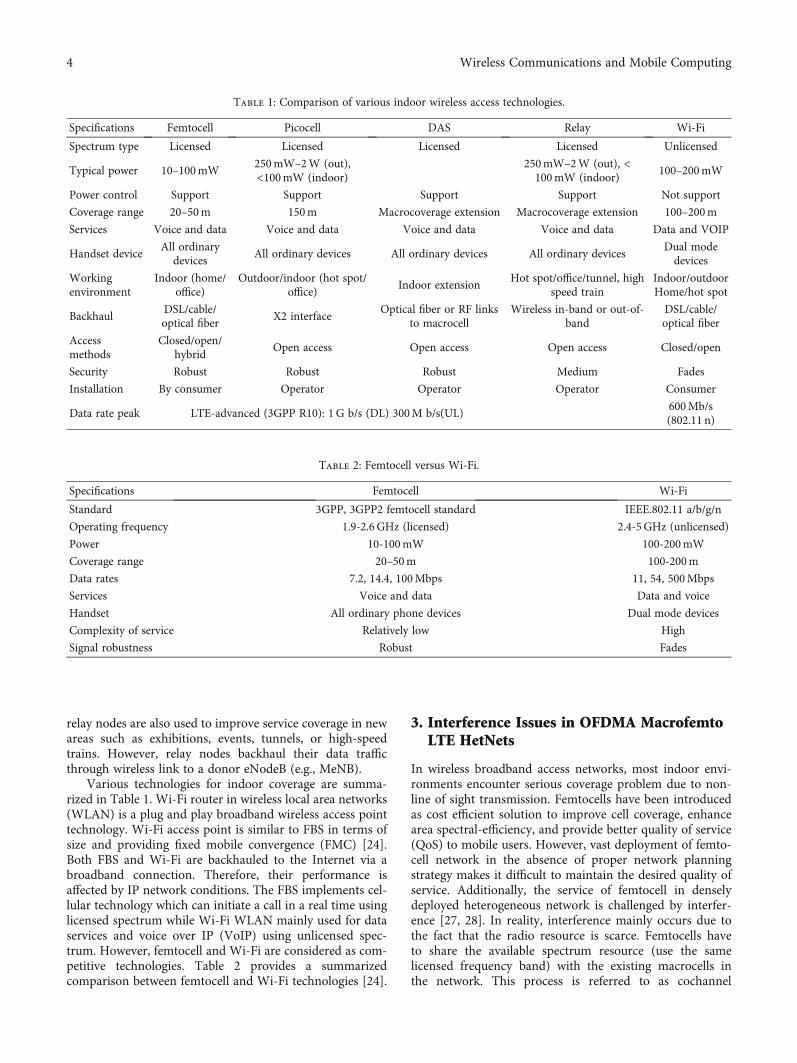
Various technologies for indoor coverage are summa-rized in Table 1. Wi-Fi router in wireless local area networks(WLAN) is a plug and play broadband wireless access pointtechnology. Wi-Fi access point is similar to FBS in terms ofsize and providing fixed mobile convergence (FMC) [24].Both FBS and Wi-Fi are backhauled to the Internet via abroadband connection. Therefore, their performance isaffected by IP network conditions. The FBS implements cel-lular technology which can initiate a call in a real time usinglicensed spectrum while Wi-Fi WLAN mainly used for dataservices and voice over IP (VoIP) using unlicensed spec-trum. However, femtocell and Wi-Fi are considered as com-petitive technologies. Table 2 provides a summarizedcomparison between femtocell and Wi-Fi technologies [24].
3. Interference Issues in OFDMA MacrofemtoLTE HetNets
In wireless broadband access networks, most indoor envi-ronments encounter serious coverage problem due to non-line of sight transmission. Femtocells have been introducedas cost efficient solution to improve cell coverage, enhancearea spectral-efficiency, and provide better quality of service(QoS) to mobile users. However, vast deployment of femto-cell network in the absence of proper network planningstrategy makes it difficult to maintain the desired quality ofservice. Additionally, the service of femtocell in denselydeployed heterogeneous network is challenged by interfer-ence [27, 28]. In reality, interference mainly occurs due tothe fact that the radio resource is scarce. Femtocells haveto share the available spectrum resource (use the samelicensed frequency band) with the existing macrocells inthe network. This process is referred to as cochannel
Table 1: Comparison of various indoor wireless access technologies.
Specifications Femtocell Picocell DAS Relay Wi-Fi
Spectrum type Licensed Licensed Licensed Licensed Unlicensed
Typical power 10–100mW250mW–2W (out),<100mW (indoor)
250mW–2W (out), <100mW (indoor)
100–200mW
Power control Support Support Support Support Not support
Coverage range 20–50m 150m Macrocoverage extension Macrocoverage extension 100–200m
Services Voice and data Voice and data Voice and data Voice and data Data and VOIP
Handset deviceAll ordinary
devicesAll ordinary devices All ordinary devices All ordinary devices
Dual modedevices
Workingenvironment
Indoor (home/office)
Outdoor/indoor (hot spot/office)
Indoor extensionHot spot/office/tunnel, high
speed trainIndoor/outdoorHome/hot spot
BackhaulDSL/cable/optical fiber
X2 interfaceOptical fiber or RF links
to macrocellWireless in-band or out-of-
bandDSL/cable/optical fiber
Accessmethods
Closed/open/hybrid
Open access Open access Open access Closed/open
Security Robust Robust Robust Medium Fades
Installation By consumer Operator Operator Operator Consumer
Data rate peak LTE-advanced (3GPP R10): 1G b/s (DL) 300M b/s(UL)600Mb/s(802.11 n)
Table 2: Femtocell versus Wi-Fi.
Specifications Femtocell Wi-Fi
Standard 3GPP, 3GPP2 femtocell standard IEEE.802.11 a/b/g/n
Operating frequency 1.9-2.6GHz (licensed) 2.4-5GHz (unlicensed)
Power 10-100mW 100-200mW
Coverage range 20–50m 100-200m
Data rates 7.2, 14.4, 100Mbps 11, 54, 500Mbps
Services Voice and data Data and voice
Handset All ordinary phone devices Dual mode devices
Complexity of service Relatively low High
Signal robustness Robust Fades
4 Wireless Communications and Mobile Computing
deployment which may cause severe interferences betweenfemtocells and macrocells [29]. One drawback of femtocellsis that its coverage will extend outside of a home to theneighboring premises causing interference among nearbyfemtocells. Moreover, adding new femtocells may causeoperational disruption to existing femtocells. Due to theireasy installation, femtocell base stations can be installed byend users or less experienced operators which make manag-ing the interference more difficult and highly degrade systemperformance. Such interference can impact not only femto-cell performance, but it may also severely affect the perfor-mance of other devices connected to macrocell networkleading at the end to “Dead Zones” [30, 31]. A dead zoneoccurs when the communication link can not be establisheddue to the SNIR (signal-to-interference-plus-noise ratio)reading falls below a particular threshold.
Generally, interference in two-tier macro and femtocellHetNets can classified into two types: cross-tier interferenceand cotier interference.
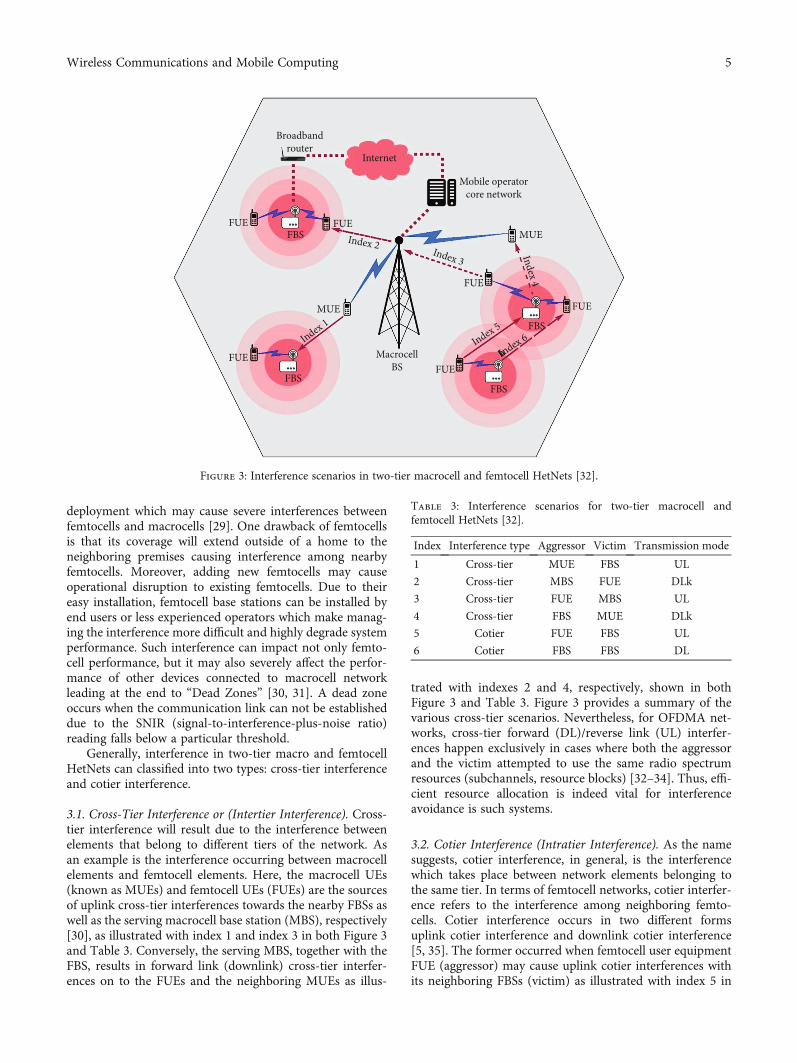
3.1. Cross-Tier Interference or (Intertier Interference). Cross-tier interference will result due to the interference betweenelements that belong to different tiers of the network. Asan example is the interference occurring between macrocellelements and femtocell elements. Here, the macrocell UEs(known as MUEs) and femtocell UEs (FUEs) are the sourcesof uplink cross-tier interferences towards the nearby FBSs aswell as the serving macrocell base station (MBS), respectively[30], as illustrated with index 1 and index 3 in both Figure 3and Table 3. Conversely, the serving MBS, together with theFBS, results in forward link (downlink) cross-tier interfer-ences on to the FUEs and the neighboring MUEs as illus-
trated with indexes 2 and 4, respectively, shown in bothFigure 3 and Table 3. Figure 3 provides a summary of thevarious cross-tier scenarios. Nevertheless, for OFDMA net-works, cross-tier forward (DL)/reverse link (UL) interfer-ences happen exclusively in cases where both the aggressorand the victim attempted to use the same radio spectrumresources (subchannels, resource blocks) [32–34]. Thus, effi-cient resource allocation is indeed vital for interferenceavoidance is such systems.
3.2. Cotier Interference (Intratier Interference). As the namesuggests, cotier interference, in general, is the interferencewhich takes place between network elements belonging tothe same tier. In terms of femtocell networks, cotier interfer-ence refers to the interference among neighboring femto-cells. Cotier interference occurs in two different formsuplink cotier interference and downlink cotier interference[5, 35]. The former occurred when femtocell user equipmentFUE (aggressor) may cause uplink cotier interferences withits neighboring FBSs (victim) as illustrated with index 5 in
Internet
Mobile operatorcore network
MacrocellBS
MUE
MUE
FBS
FBS
FBS
FUE
FUE
FUEFUE
Index 3
Index 5
Index 4
Index 6Index 1
Index 2
Broadbandrouter
FUE
FBS
FUE
Figure 3: Interference scenarios in two-tier macrocell and femtocell HetNets [32].
Table 3: Interference scenarios for two-tier macrocell andfemtocell HetNets [32].
Index Interference type Aggressor Victim Transmission mode
1 Cross-tier MUE FBS UL
2 Cross-tier MBS FUE DLk
3 Cross-tier FUE MBS UL
4 Cross-tier FBS MUE DLk
5 Cotier FUE FBS UL
6 Cotier FBS FBS DL
5Wireless Communications and Mobile Computing

both Figure 2 and Table 3. The latter interference occurredwhen an FBS (aggressor) may also cause downlink cotierinterferences to a nearby FUEs (victims) as illustrated withindex 6 shown in both Figure 1 and Table 3. For femtocellnetworks based on OFDMA, the occurrence of cotier uplink(UL)/downlink (DL) interferences takes place only whenboth the aggressor and the victim attempt to communicateusing the same spectrum resources (subchannels or resourceblocks). Thus, for interference mitigation in such networks,an intelligent and efficient radio resource allocation mecha-nism is required.
In orthogonal frequency division multiple access-(OFDMA-) based macrocellular long-term evolution (LTE)femtocell networks, (uplink/downlink) interferences occuronly when the aggressor and the victim attempted to shareand/or reuse the same radio frequency resource (subchan-nels, resource blocks). Since the radio spectrum (frequency)resources are limited, then the resource allocation considersan important factor in terms of interference avoidance intwo-tier HetNets [36–38]. Therefore, by adopting suitableresource allocation, the cross-tier interferences can be con-siderably minimized, while the cotier interferences can beeffectively avoided, and this will lead to improve the overallsystem performance.
Table 3 gives a brief description on interference types(cross-tier, cotier), source (aggressive), victim of interfer-ence, and transmission mode (UL, DL) for various interfer-ence scenarios that depicted in Figure 1 and indexed from1 to 6.
4. System Design Model and Effects ofDeploying FBS Grid Density in HetNets (DL)
Femtocell is deployed and installed randomly by users with-out any prior planning from the operator. However, femto-cell deployment is assumed either normal distribution orspecific location in most of previous studies [39, 40]. Suchfemtocell deployment is not simulated the real situationespecially for urban (enterprise with high building or high-rise residential condominiums). Therefore, the future is sup-posed to consider the most realistic or the worst scenario forfemtocell deployment. Moreover, large scale femtocelldeployment, especially when femtocell density increases dra-matically, still needs more research efforts [24]. This paperconsiders the worst scenario for femtocell deployment, toinvestigate the impact of high-density femtocell deploymenton downlink performance of MUEs in LTE heterogeneous.In the proposed model, femtocell density dramaticallyincreases because of large scale femtocell deployment asgrids of either size (3 × 3) or size (5 × 5). In addition, suchdeployment provides the worst scenario in terms of cotierinterference among neighboring femtocells.
In this section, system model assumes two-tier macroand femtocell HetNets. Figure 4 depicts a system modelhexagonal-grid macrocell scenario with seven BSs and 21sectors. This scenario is used in simulations throughout thepaper. The coverage of each macrocell can classify intotwo-types: outdoor and indoor area. The outdoor area iscovered by macro BS whereas the indoor area is covered
either by FBS or macro BS. The applied vertical/horizontalantenna radiation pattern corresponding to realistic antennais supplied by KATHEREIN-Werke KG according to a742215-panel antenna.
This model assumes that macro base stations (MBS) andfemto base stations (FBS) working in an autonomously man-ner (i.e., there is no coordination between them and employuniversal frequency reuse (reuse-1) in terms of their trans-mission). The resource allocation uses proportional fairscheduling in order to ensure fairness for users of bothmacrocell and femtocell [41].
4.1. Macrocell Geometry. A hexagonal layout is consideredfor each macrocell site. The model composed of seven hex-agonal macrocells labeled from BS0 to BS6 site separatedby distance d (BS0 is the label for macrocell site number0). In addition, each macrocell site is holding three hexago-nal sectors separated by 120° and equipped with three BSs,each one employing a tilted directional antenna with 15dBmaximum antenna gain, as depicted in Figures 5(a) and5(b), respectively.
4.2. User Distribution. Users are randomly distributed ineach macrocell sector according to a Poisson Cluster Process[42]. The label U ðx, yÞ in Figure 5(a) shows that a user posi-tioned at ðx, yÞ coordination. MUEs distributed randomly ineach sector-site and according user’s positions ðx, yÞ; theuser will be considered as outdoor or indoor macrouser. Aset of femtocell users (FUEs) are uniformly distributedwithin each indoor area of FBS. The FUE only located withinthe indoor coverage of FBS; otherwise, it will be handoff toMBS and on that time will consider as MUE. This studyassumes the wall isolate indoor environment from the out-door area, which is modeled as a penetration loss.
4.3. Femtocell Base Station. FBSs are equipped with omnidi-rectional antennas of 0 dB gain. In this model, the femtocellsassumed to be randomly distributed inside each macrohexagonal-sector site as (3 × 3) or (5 × 5) grids of neighbor-ing houses. Each square of houses, which combinly formsthe grid, will have a dimension of 10 × 10m. The FBS isinstalled by users themselves and randomly placed insidethe house. This is reflecting the fact that femtocell deploy-ments related to the unplanned part of the network and theninterference issue become a big challenge. The coverage areaof each femtocell is illustrated as circularly shaped of radius(R). The (3 × 3) or (5 × 5) femtocell grids are spreading ran-domly over a macrocell BS’s sector site coverage area. In thismodel, the total number of neighboring deployed femtocellsper grid is either 9 femtocells as in (3 × 3) grid or 25 femto-cells as in (5 × 5) grid as illustrated in both Figures 6(a) and7(a), respectively. In the simulations, the femtocell grids willadd to each macrocell network sector area as FBS griddeployments as shown in details models below.
4.3.1. Deployment of Femtocell as Grids (3 × 3). In this type,the femtocells deploy as a block and/or grid of squares.Figure 6(a) shows the model of such deployment. Each blockrepresents a grid of 3 × 3 squares for femtocell deploymentson each macrocell sector area. Each square from the grid
6 Wireless Communications and Mobile Computing
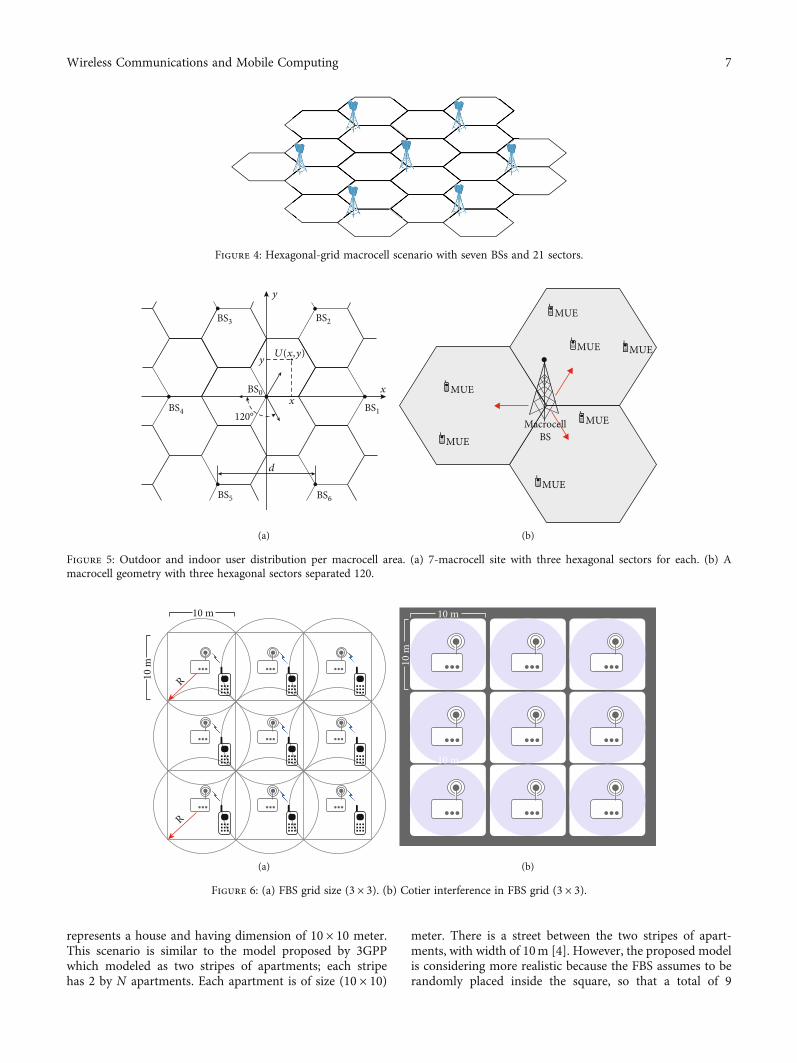
represents a house and having dimension of 10 × 10 meter.This scenario is similar to the model proposed by 3GPPwhich modeled as two stripes of apartments; each stripehas 2 by N apartments. Each apartment is of size (10 × 10)
meter. There is a street between the two stripes of apart-ments, with width of 10m [4]. However, the proposed modelis considering more realistic because the FBS assumes to berandomly placed inside the square, so that a total of 9
Figure 4: Hexagonal-grid macrocell scenario with seven BSs and 21 sectors.
BS3 BS2
BS4
BS0
U(x,y)
BS1
BS5 BS6
d
120°x
x
y
y
(a)
MUE
MUE MUE
MUE
MUE
MUE
MUE
MacrocellBS
(b)
Figure 5: Outdoor and indoor user distribution per macrocell area. (a) 7-macrocell site with three hexagonal sectors for each. (b) Amacrocell geometry with three hexagonal sectors separated 120.
10 m
R
R
10 m
(a)
10 m
10 m
10 m
(b)
Figure 6: (a) FBS grid size (3 × 3). (b) Cotier interference in FBS grid (3 × 3).
7Wireless Communications and Mobile Computing
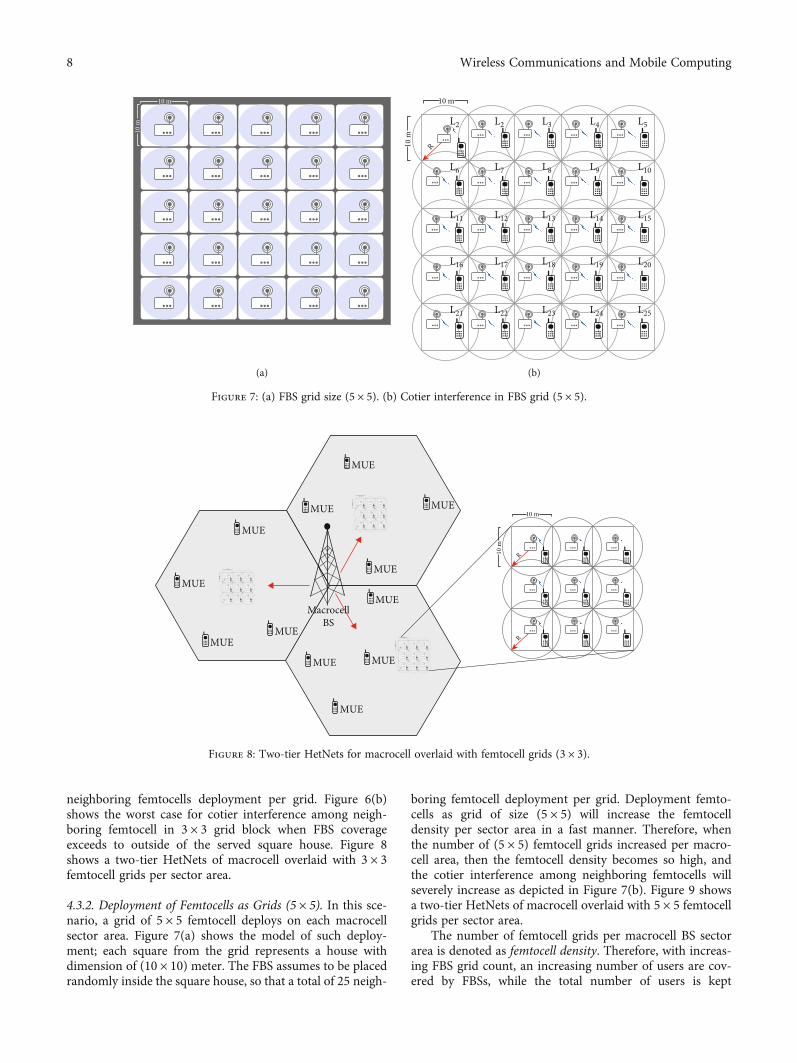
neighboring femtocells deployment per grid. Figure 6(b)shows the worst case for cotier interference among neigh-boring femtocell in 3 × 3 grid block when FBS coverageexceeds to outside of the served square house. Figure 8shows a two-tier HetNets of macrocell overlaid with 3 × 3femtocell grids per sector area.
4.3.2. Deployment of Femtocells as Grids (5 × 5). In this sce-nario, a grid of 5 × 5 femtocell deploys on each macrocellsector area. Figure 7(a) shows the model of such deploy-ment; each square from the grid represents a house withdimension of (10 × 10) meter. The FBS assumes to be placedrandomly inside the square house, so that a total of 25 neigh-
boring femtocell deployment per grid. Deployment femto-cells as grid of size (5 × 5) will increase the femtocelldensity per sector area in a fast manner. Therefore, whenthe number of (5 × 5) femtocell grids increased per macro-cell area, then the femtocell density becomes so high, andthe cotier interference among neighboring femtocells willseverely increase as depicted in Figure 7(b). Figure 9 showsa two-tier HetNets of macrocell overlaid with 5 × 5 femtocellgrids per sector area.
The number of femtocell grids per macrocell BS sectorarea is denoted as femtocell density. Therefore, with increas-ing FBS grid count, an increasing number of users are cov-ered by FBSs, while the total number of users is kept
MacrocellBS
MUE
MUE
MUE
MUE
MUE
MUE
MUEMUE
MUE
MUEMUE
MUE
MacrocellBS
10 m
R
R
10 m
Figure 8: Two-tier HetNets for macrocell overlaid with femtocell grids (3 × 3).
10 m
10 m
(a)
L2 L3 L4 L5L2
L7 L8 L9 L10L6
L12 L13 L14 L15L11
L17 L18 L19 L20L16
L22 L23 L24 L25L21
10 m
R10 m
(b)
Figure 7: (a) FBS grid size (5 × 5). (b) Cotier interference in FBS grid (5 × 5).
8 Wireless Communications and Mobile Computing

constant. In simulation setup, FBSs operate in closed sub-scriber group (CSG) access mode which means only usersof the corresponding indoor area are allowed to attach tothe FBS, while users in the close vicinity of the femtocellexperience strong interference. In the proposed systemmodel simulation setup, the femtocell grid deploymenteither with size (3 × 3) or with size (5 × 5) will be randomlyinside each macrocell sector area without any prior planningor coordination by either the user or the operator. The fem-tocell networks utilize from the same spectrum used bymacrocell networks in what is called cochannel deployment.The cochannel deployment femtocells may reuse the sameradio resources with macrocell and/or with the neighboringfemtocells which resulting in cross-tier interference andcotier interference that decrease the quality of communica-tion. So, under random densely deployments for femtocells,interference avoidance is considering the main challenge fornetwork operators. Each MUE will be a victim of interfer-ence coming from neighboring femtocells and macrocell, ifthey use the same frequency subbands.
The impact of various femtocell grid deployment densi-ties on downlink performance in two-tier HetNets will beinvestigated and evaluated using Vienna LTE system levelsimulator. Keep in mind that when both femtocell andmacrocell using the same bandwidth in the same time, thiswill cause what is called cross-tier interference betweenmacrocell and femtocell. In addition, from femtocell griddeployment models as illustrated in Figures 6(b) and 7(b),it is clear that some of the power and/or coverage of eachFBS will be radiated outside the user premise. This radiatedpower will cause cotier interference between the neighboringfemtocells in each FBS grid. Both co- and cross-tier interfer-ences have a negative impact on degrading the performanceof macrocell system. So, efficient resource allocation isindeed vital for interference avoidance is such systems. Byadopting a suitable resource allocation technique, cotier
interferences can be effectively avoided, while cross-tierinterferences can be considerably minimized in order toimprove the overall system throughput.
5. Performance Evaluation Metrics
The impact of various femtocell deployment densities ondownlink performance in two-tier HetNet for femtocell willbe investigated and evaluated using Vienna LTE system levelsimulator. The performance evaluation will be carried out interms of signal-to-interference-and-noise ratio SINR,throughput, fairness, outage probability, and spectralefficiency.
5.1. Signal-to-Interference-Noise Ratio. In two-tier heteroge-neous networks, some users will be under macrocell BS cov-erage while the remaining are covered by FBSs. If the user iscovered by an FBS indoor area then, the achieved SINR of afemtocell-attached user can formally be written as:
SINRFUE =Sfemto
Imacro + Ifemto + Nois, ð1Þ
where Sfemto is the FBS signal and Imacro and Ifemto arethe interference from neighboring macro- and femtocell,respectively, that use the same subbands as the serving FBS.
The formula in (2) for achievable downlink SINR for anyFUE served by FBS can be calculated by the formula
SINRFUE =PFR
∑Nmb=1∑
3s=1P
m,sR +∑
N f
f=1,f≠F
PfR +No
,ð2Þ
where PFR is the serving FBS received power and Pm,s
R
and PfR are the received power from interfering MBS and
MacrocellBS
MUEMUE
MUE
MUE
MUE
MUE
MUE
MUE
MUE
MUEMUE
MUE
MacrocellBS
Figure 9: Two-tier HetNets for macrocell overlaid with femtocell grids (5 × 5).
9Wireless Communications and Mobile Computing

FBS, respectively, in current sector area that used the samefrequency subbands as the base station that FUE attached
with Pm,sR ; Pf
R will consider as zero if the corresponding cellsuse different frequency subbands. Nm and Nf are the num-ber of MBSs and FBSs, respectively. Nm may set to 1, 7, and19 for one-tier or single macrocell (zero rings), one-tier/(onering) macrocell, and two tiers (two-rings), respectively. Thatsaid, the three types will have zero ring, one ring, and tworings which produce the 1, 7, and 19 designs. No is the noisepower. The received power PR can directly calculate usingthe formula
PR dBð Þ = PT dBð Þ − PLtot dBð Þ: ð3Þ
PT is the power transmitted from the serving base stationin dB. PLtot is the total path loss experience by the signal indB and can be expressed by the formula
PLtot dBð Þ = PL dBð Þ − GT dBð Þ, ð4Þ
where PLðdBÞ and GTðdBÞ are the macroscopic pathloss and gain of transmitting antenna in dB, respectively.
5.1.1. Propagation Path Loss Models. Path loss model isdepending on the propagation environment. The path losscalculation is depending on whether a signal originates froma MBS or a FBS; we choose between two propagation pathloss models; outdoor path loss denoted as PLoutdoor and/orPLm and indoor pathless which denoted as PLindoor and/orPLf . Path loss model for macro base station users ðPLmÞspecified according to [43] subclause 4.5.2 is utilized andcan be calculated by the formula
PLm = 28 + 35 log10 dð Þ dB, ð5Þ
where d is the distance between user and macrocell basestation in meters. Within the indoor area, the propagationpath loss model for FBS users ðPLf Þ specified as in [44] sub-clause 5.24 is employed and can be calculated by formula
PLf = 38:5 + 20 log10 Rið Þ + Lwalls dB, ð6Þ
where Ri is the indoor distance between user and FBS inmeters. The indoor area assumes to be isolated from the out-door environment by a wall. At distance Ri, the signal isattenuated by the wall penetration loss, which denoted asLwalls:Lwalls is explicitly modelled as
Lwalls dB = 7 dBm, 0 < d ≤ 10,
Lwalls dB = 10 dBm, 10 < d ≤ 20,
Lwalls dB = 15 dBm, 20 < d ≤ 30,
ð7Þ
(For light internal/internal/external walls, respectively,3 dB for doors and 1dB for window) As a transmittingantenna, the gain describes how well the antenna convertsinput power into radio waves headed in a specified direction.As a receiving antenna, the gain describes how well the
antenna converts radio waves arriving from a specifieddirection into electrical power. Antenna gain is usuallydefined as the ratio of the power produced by the antennafrom a far-field source on the antenna’s beam axis to thepower produced by a hypothetical lossless isotropic antenna,which is equally sensitive to signals from all directions. Usu-ally, this ratio is expressed in decibels. A plot of the gain as afunction of direction is called the radiation pattern. In thefield of antenna design, the term radiation pattern (orantenna pattern or far-field pattern) refers to the directional(angular) dependence of the strength of the radio wavesfrom the antenna or other source. The transmitting antennaradiation pattern is formulated as in [45]:
GT θð Þ = − min 12θ
θ3dB
� �2, Am
" #,−180o ≤ θ ≤ 180o: ð8Þ
When considered θ3dB = 65o for 3 dB beam width andAm = 20 dB as maximum attenuation, equation (8) can besimplified to
GT θð Þ = − min 12θ
65o� �2
, 20" #
,−180o ≤ θ ≤ 180o: ð9Þ
Similarly, if the MUE is located under outdoor MBS cov-erage or located indoor but not coverage by FBS, then it willbe considered as outdoor MUE and can communicate withthe nearest MBS in such case; MUE is a victim for interfer-ence originates from all MBSs and FBSs in the vicinity thatare using the same subbands which assigned to the servingMBS. The achievable SINR for any MUE can be expressed as
SINRMUE =Smacro
Imacro + Ifemto + Nois, ð10Þ
where Smacro is the MBS signal and Imacro and Ifemto arethe interference from neighboring macro- and femtocell,respectively, that use the (same subbands). If the indoor areais not covered by an FBS, then users are attached to the MBS,and the formula in (10) of the downlink SINR for any MUEserved by sector area S of MBS can be calculated as
SINRMUE =PM,SR
∑Nmm=1∑
3s=1,s≠S
Pm,sR +∑
N f
f=1PfR +No
, ð11Þ
where PM,SR is the serving MBS received power and Pm,s
R
and PfR are the received power from interfering MBS and
FBS, respectively, in current sector area that used the samefrequency subbands as the base station that MUE attached
with Pm,sR ; Pf
R will consider as zero if the corresponding cellsuse different frequency subbands.
Nm and Nf are the number of MBSs and FBSs, respec-tively. Nm may set to 1, 7, and 19 for one tier or singlemacrocell, two-tier/(two rings) macrocell, and three tiers(three rings), respectively. No is the noise power.
10 Wireless Communications and Mobile Computing

5.2. Outage Probability (SINR Distribution). The outageprobability metric is used to measure the QoS for differentdensities for femtocell grids deployment. Outage probabilityis defined as the probability of UEs (MUEs + FUEs) havingSINR values less than a predefined SINRthreshold γ , and it isgiven by the formula.
p outageð Þ = p SINRMUE/FUE < γð Þ: ð12Þ
Channel Quality Indicator (CQI) is reflected by userSINR. The serving BS receiving the CQI values as a feedbackfrom a user and according to these values, BS defines thesuitable Modulation and Coding Scheme (MCS) that willbe used in LTE system. The MCS in its turn decides theQoS and transmission rate in the network.
5.3. Throughput Performance. The throughput is the actualdata transfer rate after interference is considered. In otherwords, it is the actual achievable capacity in (Mbps) forany user in the network, regardless that this user is MUEor FUE can be expressed by Shannon’s Law as
TMUE/FUE =Wi log2 1 + SINRMUE/FUEð Þ, ð13Þ
where W is total allocated bandwidth of subcarriersgiven to user i, i ∈ ,N . Express the total number of all mobileusers in the network for both macrocell and femtocells(NMUE +NFUE). The downlink interference between user i(FUE or MUE) and his selected BS (FBS or/MBS) can bemeasured using signal-to-interference-and-noise ratioSINRFUE/MUE which can be calculated by equations (2) and(11), respectively. The total throughput for all MUEs in thenetwork can be calculated by the formula
TTot,MUEi = 〠NMUE
i=1W log2 1 + SINRMUEi
� �: ð14Þ
Similarly, the total throughput for all FUEs in the net-works can be calculated using the formula
TTot,FUEi = 〠NFUE
i=1W log2 1 + SINRFUEi
� �: ð15Þ
Average throughput of MUEs and average throughput ofFUEs are calculated by formulas
TMavg =
TTot,MUEiNMUE
,
TFavg =
TTot,FUEiNFUE
:
ð16Þ
The average throughput of all MUEs and FUEs is calcu-lated for all their possible locations. Then, the overall aver-age UE capacity can be calculated using equation (17).
Toverall =NMUET
Mavg +NFUET
Favg
NMUE +NFUE, ð17Þ
where NMUE represents the number of MUEs, NFUE rep-resents the number of FUEs, and CM
avg and CFavg are, respec-
tively, the average of MUE and FUE throughputs. Theaverage throughput of the network can be expressed usingthe overall average capacity of UEs. In order to evaluatethe throughput performance while changing the number offemtocell grids, this approach has to be repeated.
5.4. Fairness Performance. Fairness shows how equally aresource is distributed over N users. The fairness functionis applied in any system which share a resource. The imbal-ance between macrocell and femtocell users is quantified bythe widely used Jain’s Fairness Index (JFI) which formulatedas [46].
f Tð Þ =∑N
i=1Ti
� �2
N ∑Ni=1T
2i
, ð18Þ
where N is the total number of users (MUEs + FUEs) inthe network and Ti denotes a vector of length (N) which iscontaining the throughput achieved by each user i of the Nusers. Fairness index always lies between 0 and 1 (i.e., aresource distribution algorithm with fairness of 0.1 meansthat it is unfair for 90% of the users). Fairness is lowest fora small number of femtocells and increases with higher fem-tocell density.
5.5. Spectral Efficiency Performance. Spectrum or spectralefficiency (SE) is a measure how a limited frequency spec-trum is used by the physical layer protocol. It sometimecalled bandwidth efficiency since it refers to the informationrate which can be transferred over a given bandwidth in acellular system. Spectrum efficiency is usually measured in(bit/s)/Hz per cell or in (bit/s)/Hz per unit area or in(bit/s)/Hz per site. SE is expressed as the average of bitsper second successfully received by the UE device per unitspectrum. The average network spectral efficiency, from(13) and (14) SE, is thus given by equation (19):
SE =TTot,MUEi + TTot,FUEi
Btot, ð19Þ
where TTot,MUEi and TTot,FUEi are the total throughput forall MUEs and total throughput for all FUEs in the networkBtot, which is the total bandwidth.
11Wireless Communications and Mobile Computing
6. Simulation Environment andParameter Setup
In this paper, the Vienna LTE system level simulator isdeveloped in order to study the effects of various femtocelldeployment densities on downlink performance of two-tier
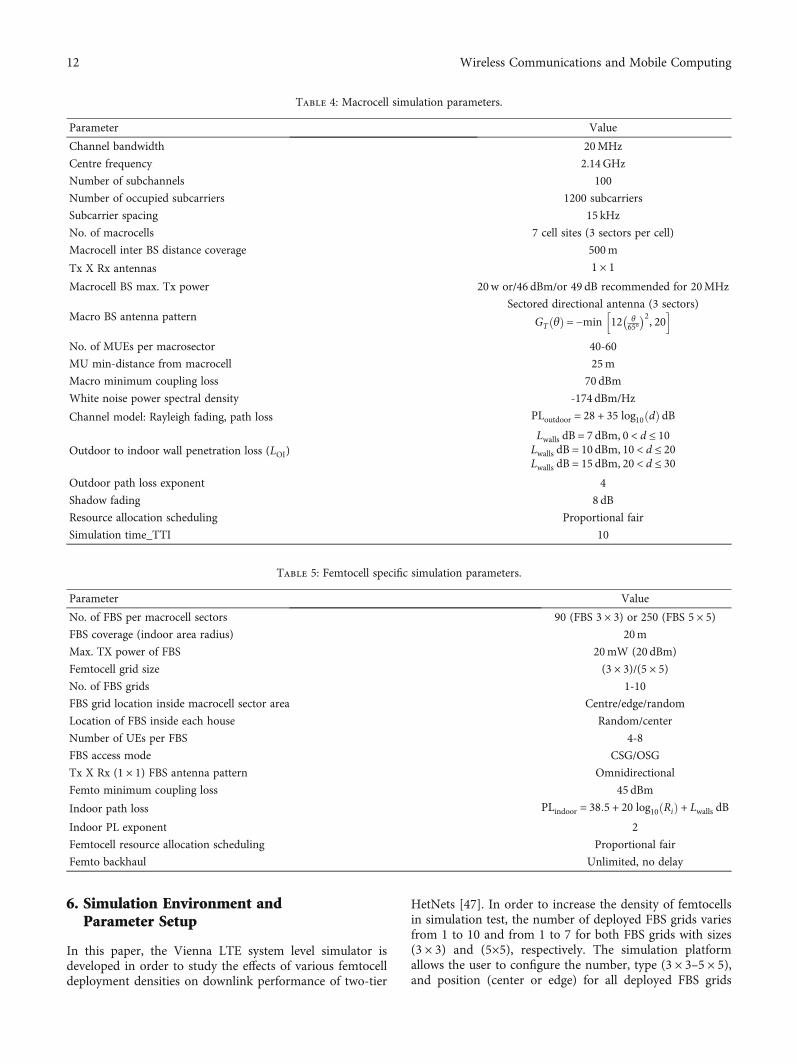
HetNets [47]. In order to increase the density of femtocellsin simulation test, the number of deployed FBS grids variesfrom 1 to 10 and from 1 to 7 for both FBS grids with sizes(3 × 3) and (5×5), respectively. The simulation platformallows the user to configure the number, type (3 × 3–5 × 5),and position (center or edge) for all deployed FBS grids
Table 4: Macrocell simulation parameters.
Parameter Value
Channel bandwidth 20MHz
Centre frequency 2.14GHz
Number of subchannels 100
Number of occupied subcarriers 1200 subcarriers
Subcarrier spacing 15 kHz
No. of macrocells 7 cell sites (3 sectors per cell)
Macrocell inter BS distance coverage 500m
Tx X Rx antennas 1 × 1Macrocell BS max. Tx power 20w or/46 dBm/or 49 dB recommended for 20MHz
Macro BS antenna patternSectored directional antenna (3 sectors)
GT θð Þ = −min 12 θ65o� �2, 20h i
No. of MUEs per macrosector 40-60
MU min-distance from macrocell 25m
Macro minimum coupling loss 70 dBm
White noise power spectral density -174 dBm/Hz
Channel model: Rayleigh fading, path loss PLoutdoor = 28 + 35 log10 dð Þ dB
Outdoor to indoor wall penetration loss (LOI)Lwalls dB = 7 dBm, 0 < d ≤ 10Lwalls dB = 10 dBm, 10 < d ≤ 20Lwalls dB = 15 dBm, 20 < d ≤ 30
Outdoor path loss exponent 4
Shadow fading 8 dB
Resource allocation scheduling Proportional fair
Simulation time_TTI 10
Table 5: Femtocell specific simulation parameters.
Parameter Value
No. of FBS per macrocell sectors 90 (FBS 3 × 3) or 250 (FBS 5 × 5)FBS coverage (indoor area radius) 20m
Max. TX power of FBS 20mW (20 dBm)
Femtocell grid size (3 × 3)/(5 × 5)No. of FBS grids 1-10
FBS grid location inside macrocell sector area Centre/edge/random
Location of FBS inside each house Random/center
Number of UEs per FBS 4-8
FBS access mode CSG/OSG
Tx X Rx (1 × 1) FBS antenna pattern Omnidirectional
Femto minimum coupling loss 45 dBm
Indoor path loss PLindoor = 38:5 + 20 log10 Rið Þ + Lwalls dBIndoor PL exponent 2
Femtocell resource allocation scheduling Proportional fair
Femto backhaul Unlimited, no delay
12 Wireless Communications and Mobile Computing

per macrocell sector. The proposed model for FBS griddeployment is implemented that the performance of theresult was evaluated using the developed Vienna LTE systemlevel simulator. The simulation parameters considered for
both macrocell and femtocells are listed in Tables 4 and 5,respectively.
Figures 10 and 11 present a GUI screen shot for the sim-ulation that show UEs, cells, and brief of simulation statistics
Figure 10: 10 FBS grid (3 × 3) deployments per macrocell sector area.
Figure 11: 10 FBS grid (5 × 5) deployments per macrocell sector area.
13Wireless Communications and Mobile Computing
when deploying two types of FBS grids (3 × 3) and (5 × 5),respectively.
7. Simulation Results
In this section, the simulation results and evaluation of perfor-mance are presented. The results show the effect of high-density femtocell deployment in downlink performance forboth macro- and femtocell network. The performance evalua-tion is carried out in terms of somemeasurement metrics suchas signal-to-interference-and-noise ratio (SINR) distribution(outage probability), average user throughput, outage, andfairness index and/or user average spectral efficiency.
7.1. Outage Probability. Outage probability (SINR distribu-tion) is the probability of SINR of random user less than aminimum threshold. In other words, a given user is consid-ered in outage probability if the SINR of the link between theuser and serving BS is not enough for a successful connec-tion. Figure 12 depicts the SINR distribution of various den-sities for FBS grid deployments. The FBS deployment withvarious grid densities of (3 × 3) and (5 × 5) also shows thedistribution when increasing the number of femtocellsand/or FBS grids. In Figure 12, there are two referencescurves; the leftmost line depicts the distribution of macrocellonly without FBSs, and the rightmost line shows the SINRdistribution for high density FBS which is 5 grids of FBSwith (5 × 5) size deployed per macrocell sector. In case ofmacrocell only, all users are communicated with macrocellBSs, and the interference only originates from the surround-ing MBSs in the vicinity of central MBS. The other curvesfrom left to right show the SINR distribution when the num-ber of FBS grids per macrocell sector area increases; twotypes of interference occurred which are cross-tier interfer-ence between macrocell BS and FBS, in addition to the cotierinterference among neighboring FBSs located in the sameFBS grid. The lines in between the left most curve and right-most curve represent the SINR distribution for various FBSgrid densities per macrocell sector area which are one grid(3 × 3) or 9 FBSs, two grids (3 × 3) or 18 FBSs, one grid(5 × 5) or 25 FBSs, three grids (3 × 3) or 27 FBSs, four grids(3 × 3) or 36 FBSs, five grids (3 × 3) or 45 FBSs, two grids(5 × 5) or 25 FBSs, three grids (5 × 5) or 75 FBSs, four grids(5 × 5) or 100 FBSs, and five grids (5 × 5) or 125 FBSs,respectively. It is clear from the graph that by increasingthe number of FBS, the SINR distribution inclined to therightmost curve which represents the reference for high den-sity FBS. This behavior of curves shows clearly that there is abig gap in the performance of MUEs and FUEs. Thus, interms of SINR, it is of benefit to increase the number ofFBS accompanied by a suitable effective interference man-agement technique.
7.2. Average User Throughput. In this section, the impact ofsignal-to-interference-and-noise ratio on the throughput hasbeen investigated. The throughput is evaluated for deploy-ment of various FBS grid density and compared with thethroughput with macrocell without any femtocell deploy-ment and with macrocell enhanced network with femtocell
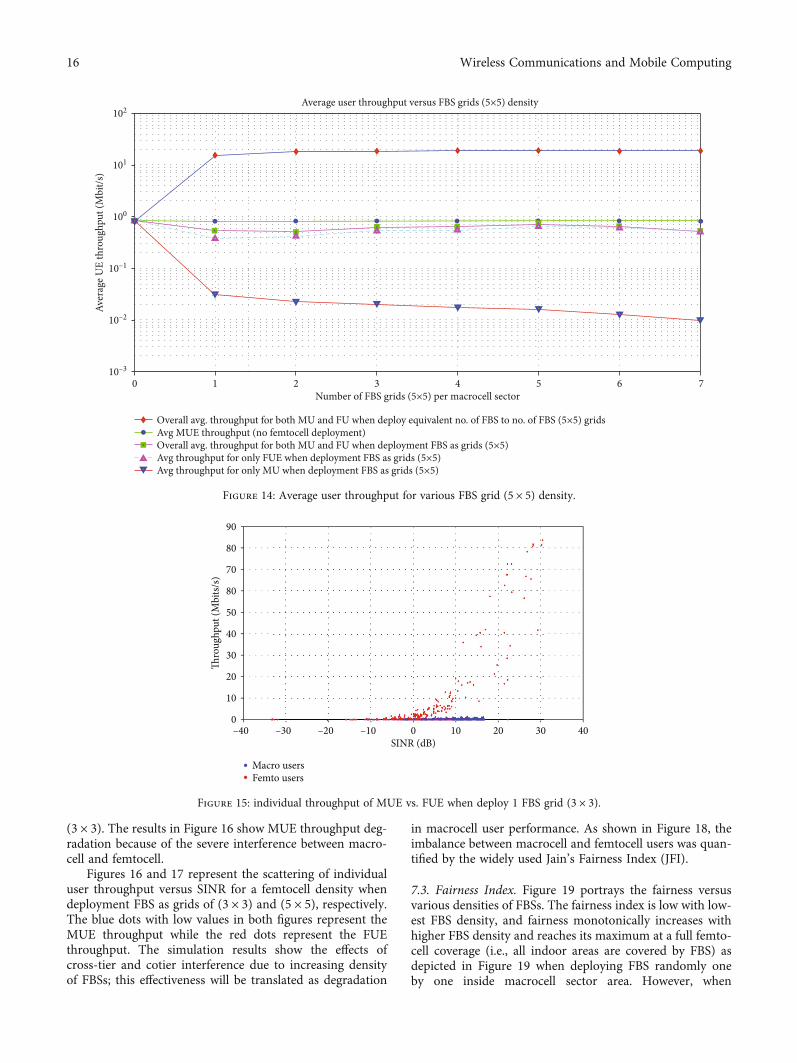
added one by one. When the number of FBS grids permacrocell sector area increases, the overall aggregate averagethroughput (for both MUEs and FUEs) also increases mono-tonically and reaches its maximum when all indoor area iscovered by FBS. In contrast, the simulation results show thatboth the average user throughput and overall averagethroughput decrease with high density deployment of FBSsbecause of severe interference and large number of users.Figures 13 and 14 depict the average user throughput(Mb/s) plotted versus various FBS grid densities. Althoughfemtocell deployment as 2nd overlaid tier in the existingmacrocell will improve the overall performance (i.e.,throughput overall/throughput macrocellonly>1), the resourcethat offloading from the macro BS can mostly compensatefor the harm caused by additional interference (i.e., through-put macrocellonly/throughput overall<1). The curves of macrocellonly without FBSs on both Figures 13 and 14 are consideredas reference. The simulation results show and compare theaverage user throughput for MUEs only (with no FBS griddeployment); overall average throughput for both MUEsand FUEs when increase FBS grid deployments with bothsizes (3 × 3) and (5 × 5), the results are compared with over-all average throughput for both MUs and FUs when deploy-ment equivalent number of femtocells one by one to the FBSgrids (3 × 3) and (5 × 5) as shown in Figures 13 and 14,respectively. The average throughput for FUEs onlyincreases when deploy the 1st and 2nd FBS grids (3 × 3),while after that no significant change has occurred in FUEthroughput, as shown clearly in Figure 13. On the otherhand, when deploying FBS as grid of size (5 × 5), the averagethroughput for FUE only increases when adding 1st, 2nd,3rd, 4th, and 5th; then, when adding FBS grid numbers 6thand 7th, the average throughput of FUEs slowly drops downas shown in Figure 14. The throughput degradation is due tothe severe interference between macrocell and femtocell, inaddition also to the interference between neighboring femto-cells in the deployed FBS grids either with size (3 × 3) or(5 × 5). In contrast, both Figures 13 and 14 show whendeployment FBS randomly one by one per macrocell sectorarea, the overall average throughput for both MUE andFUE will steadily improve when increasing the femtocelldensity, whereas the macrocell user’s performance is down-graded severely as a result of cross-tier interference betweenmacrocell and femtocells.
However, performance evaluation in terms of overallaverage throughput can be misleading, since the value isnot achieved by any user, as seen in Figure 14.
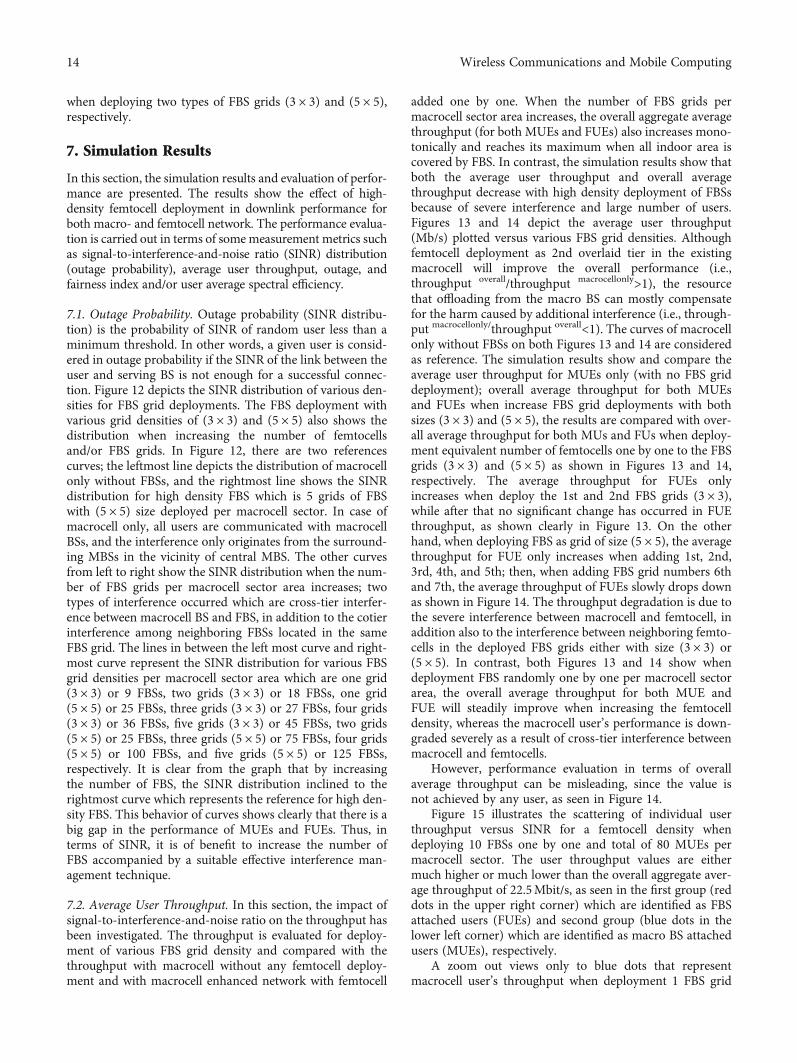
Figure 15 illustrates the scattering of individual userthroughput versus SINR for a femtocell density whendeploying 10 FBSs one by one and total of 80 MUEs permacrocell sector. The user throughput values are eithermuch higher or much lower than the overall aggregate aver-age throughput of 22.5Mbit/s, as seen in the first group (reddots in the upper right corner) which are identified as FBSattached users (FUEs) and second group (blue dots in thelower left corner) which are identified as macro BS attachedusers (MUEs), respectively.
A zoom out views only to blue dots that representmacrocell user’s throughput when deployment 1 FBS grid
14 Wireless Communications and Mobile Computing

1
0.9
0.8
0.7
0.6
0.5
ECD
F (S
INR)
0.4
0.3
0.2
0.1
0–20 –10 10SINR (db)
SINR vs ECDF for macrocell with different femtocell densities
20 30 40 500
Macro only1 FBS grid (3×3)2 FBS grids (3×3)1 FBS grids (5×5)3 FBS grids (3×3)4 FBS grids (3×3)
5 FBS grids (3×3)2 FBS grids (5×5)3 FBS grids (5×5)4 FBS grids (5×5)5 FBS grids (5×5)
Figure 12: Outage probability for macrocell with various femtocell densities.
102
101
100
Aver
age U
E th
roug
hput
(Mbi
t/s)
10–1
10–2
0 1 2 3 4 5Number of FBS grids (3×3) per macrocell sector
Average user throughput versus FBS grids (3×3) density
76 8 9 10
Overall avg. throughput for both MU and FU when deploy equivalent no. of FBS to no. of FBS (3×3) gridsAvg. FUE throughput when deployment FBS as grids (3×3)Overall avg. throughput for both MU and FU when deployment FBS as grids (3×3)Avg MUE throughput (no femtocell deployment)Avg. throughput for only MUE when deployment FBS as grids (3×3)
Figure 13: Average user throughput for various FBS grid (3 × 3) density.
15Wireless Communications and Mobile Computing
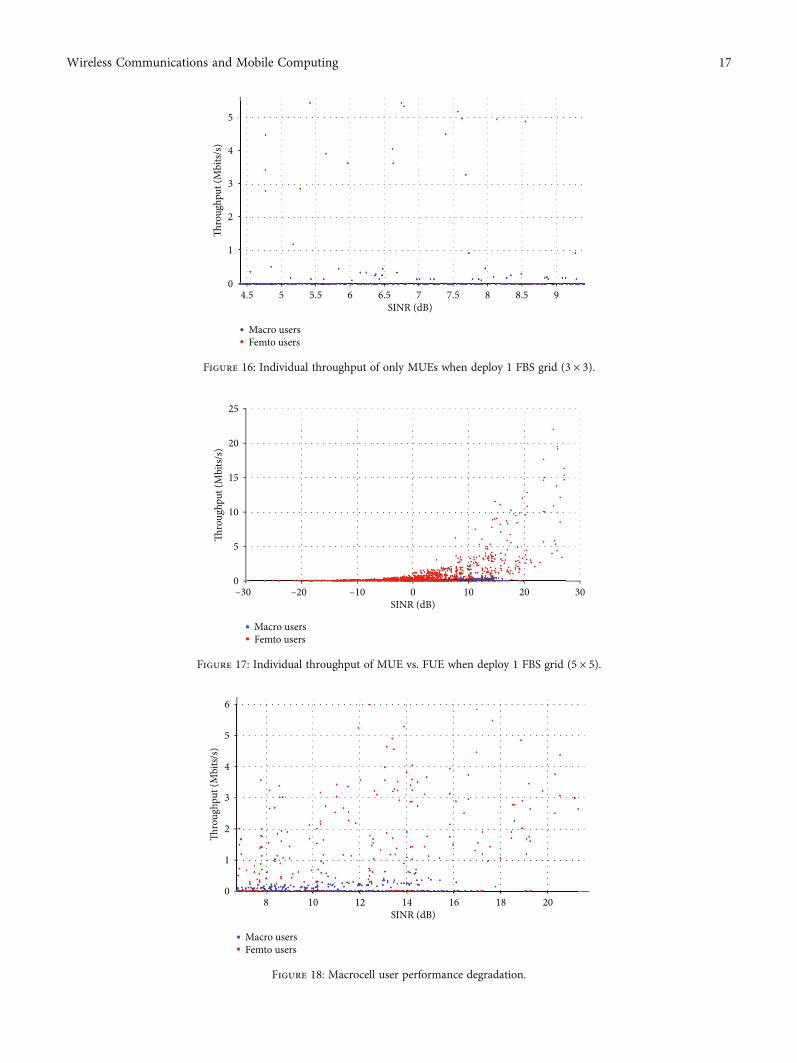
(3 × 3). The results in Figure 16 show MUE throughput deg-radation because of the severe interference between macro-cell and femtocell.
Figures 16 and 17 represent the scattering of individualuser throughput versus SINR for a femtocell density whendeployment FBS as grids of (3 × 3) and (5 × 5), respectively.The blue dots with low values in both figures represent theMUE throughput while the red dots represent the FUEthroughput. The simulation results show the effects ofcross-tier and cotier interference due to increasing densityof FBSs; this effectiveness will be translated as degradation
in macrocell user performance. As shown in Figure 18, theimbalance between macrocell and femtocell users was quan-tified by the widely used Jain’s Fairness Index (JFI).
7.3. Fairness Index. Figure 19 portrays the fairness versusvarious densities of FBSs. The fairness index is low with low-est FBS density, and fairness monotonically increases withhigher FBS density and reaches its maximum at a full femto-cell coverage (i.e., all indoor areas are covered by FBS) asdepicted in Figure 19 when deploying FBS randomly oneby one inside macrocell sector area. However, when
90
80
70
80
50
40
30
20
10
0–40 –30 –20 –10 0
SINR (dB)10 20 30 40
Thro
ughp
ut (M
bits/
s)
Macro usersFemto users
Figure 15: individual throughput of MUE vs. FUE when deploy 1 FBS grid (3 × 3).
102
101
100
Aver
age U
E th
roug
hput
(Mbi
t/s)
10–1
10–3
10–2
0 1 2 3 4 5Number of FBS grids (5×5) per macrocell sector
Average user throughput versus FBS grids (5×5) density
6 7
Avg throughput for only FUE when deployment FBS as grids (5×5)Avg throughput for only MU when deployment FBS as grids (5×5)
Overall avg. throughput for both MU and FU when deploy equivalent no. of FBS to no. of FBS (5×5) gridsAvg MUE throughput (no femtocell deployment)Overall avg. throughput for both MU and FU when deployment FBS as grids (5×5)
Figure 14: Average user throughput for various FBS grid (5 × 5) density.
16 Wireless Communications and Mobile Computing
5
6
4
3
2
1
08 10 12 14 16 18 20
SINR (dB)
Thro
ughp
ut (M
bits/
s)
Macro usersFemto users
Figure 18: Macrocell user performance degradation.
25
20
15
10
5
0–20–30 –10 0 10 20 30
SINR (dB)
Thro
ughp
ut (M
bits/
s)
Macro usersFemto users
Figure 17: Individual throughput of MUE vs. FUE when deploy 1 FBS grid (5 × 5).
5
4
3
2
1
04.5 5 5.5 6 6.5 7 7.5 8 8.5 9
SINR (dB)
Thro
ughp
ut (M
bits/
s)
Macro usersFemto users
Figure 16: Individual throughput of only MUEs when deploy 1 FBS grid (3 × 3).
17Wireless Communications and Mobile Computing
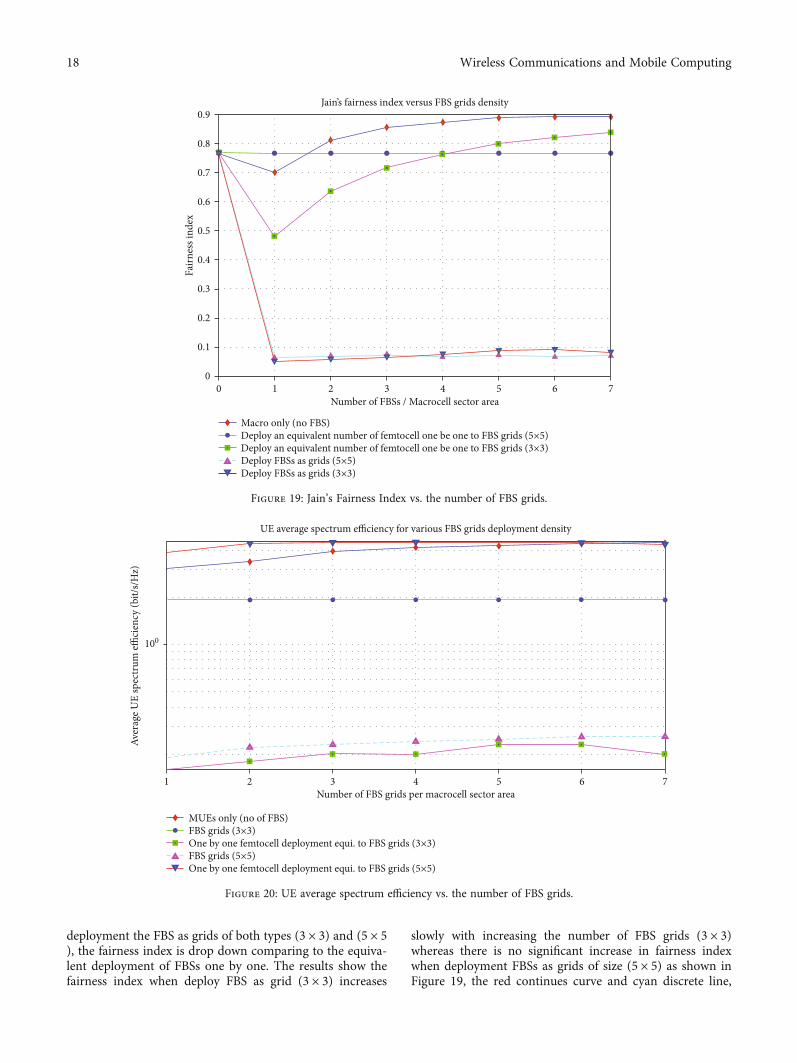
deployment the FBS as grids of both types (3 × 3) and (5 × 5), the fairness index is drop down comparing to the equiva-lent deployment of FBSs one by one. The results show thefairness index when deploy FBS as grid (3 × 3) increases
slowly with increasing the number of FBS grids (3 × 3)whereas there is no significant increase in fairness indexwhen deployment FBSs as grids of size (5 × 5) as shown inFigure 19, the red continues curve and cyan discrete line,
100
Aver
age U
E sp
ectr
um effi
cien
cy (b
it/s/
Hz)
1 2 3 4 5Number of FBS grids per macrocell sector area
UE average spectrum efficiency for various FBS grids deployment density
6 7
FBS grids (5×5)One by one femtocell deployment equi. to FBS grids (5×5)
MUEs only (no of FBS)FBS grids (3×3)One by one femtocell deployment equi. to FBS grids (3×3)
Figure 20: UE average spectrum efficiency vs. the number of FBS grids.
0.9Jain’s fairness index versus FBS grids density
Number of FBSs / Macrocell sector area
0.8
0.7
0.6
0.5
Fairn
ess i
ndex
0.4
0.3
0.2
0.1
00 1 2 3 4 5 6 7
Deploy FBSs as grids (5×5)Deploy FBSs as grids (3×3)
Macro only (no FBS)Deploy an equivalent number of femtocell one be one to FBS grids (5×5)Deploy an equivalent number of femtocell one be one to FBS grids (3×3)
Figure 19: Jain’s Fairness Index vs. the number of FBS grids.
18 Wireless Communications and Mobile Computing
respectively. According to the type of resource allocationscheme, there is a trade-off between the fairness and averagethroughput; in other words, some resource allocationschemes can achieve high fairness in the expense of through-put. In contrast, some other resource allocation schemes canprovide a higher throughput in the expense of fairness. Dueto imbalance between fairness and throughput, innovatedinterference management techniques based optimal resourceallocation are needed in order to achieve high throughputand acceptable fairness level. The fairness of high-densityscenario (i.e., 5 × 5 grid of FBS) highly decreases due to theunmanaged cross-tier interference between macrocell BSsand FBSs as well as cotier interference among neighboringFBSs.
7.4. UE Average Spectral Efficiency. Figure 20 shows thespectrum efficiency versus the number of deployed FBSgrids. The results of spectral efficiency for both (3 × 3) and(5 × 5) FBS grid deployments are compared with sum spec-tral efficiency for macrocell only without femtocell as a refer-ence. The result graph shows that, when increase thenumber of FBS grids per macrocell sector area, the spectrumefficiency increases until the curve is flattened with a highdensity of FBS grid deployment. The increase of spectrumefficiency is due to offloading macro users to be femtocellusers. In addition, increasing the number of FBS willincrease the reuse of frequency. Whereas the flatten of thecurves occurs because of the severe interference resultingfrom the increased number of FBS gird deployment insidemacrocell sector area as clearly seen in Figure 20.
8. Conclusion
The pervasive increase of wireless devices in last years whichare all connected to similar system makes managing andserving these devices highly challenging. The difficultyoccurs in providing high data rates with very low latencyand strong reliability to these devices. All that can be sum-marized as providing high-quality of wireless service. In thisregard, femtocells are considered as the most effective prom-ising small cell technology that can provide a high-qualitycoverage for indoor environments, as well as, to increasedata rates, capacity, and efficiency for the 5G wireless com-munication cells that will be deployed as close as 10 metersaway from each other, and by 2020, the number of wirelessdevices will reach up to 50 billion.
However, deploying huge number of femtocell networkswithout very tight network planning is a real challenge andmay worsen the service instead of improving it. The mainchallenge in deploying dense femtocell networks is avoidingand minimizing interference between nearby cells. Interfer-ence mainly occurs since the radio resource is scarce, andnew femtocells are randomly deployed and installed by userswithout any prior planning from the operator. Femtocellsneed to share the available spectrum (operating on the samelicensed frequency band) with the existing macrocells in thenetwork. This process is referred to as cochannel deploy-ment. In cochannel deployment, the femtocells and macro-cells can fully or partially share/reuse the available
bandwidth, thereby resulting in severe cross-tier interfer-ences between macrocells and femtocells and cotier interfer-ence among neighboring femtocells, respectively.
In this work, the proposed model of FBS grid deploy-ment was implemented and integrated, and the performanceof the impacts of various density of FBS grid deploymentwas evaluated with Vienna LTE system level simulator.The simulation results show that FBS grid deploymentimproves overall average user throughput in case of lowand medium density scenario. However, for high densityscenario, FBS grid deployment has no enhancement in termsof fairness and throughput. The results confirmed that whendeploying the FBS grids inside macrocell sector, there is atrade-off; in one hand, this technology offloads the macrocellbase station and increases the coverage and network capac-ity. In contrast, it brings an interference between macrocelland femtocell tiers (cotier interference) in addition to inter-ference between neighboring femtocells (cotier interference);this interference will lead to degrade the overall performanceof the network. Interferences happen exclusively in caseswhere both the aggressor and the victim attempted to usethe same radio resources. Thus, efficient resource allocationis vital for interference avoidance in such systems. In addi-tion, optimal interference mitigation techniques are neededto be developed not only in terms of enhancing overall userthroughput but also to enhance the individual user perfor-mance by means of fairness.
Data Availability
None of that is investigated or related to our work.
Conflicts of Interest
The authors declare that they have no conflicts of interest.
References
[1] L. Polak, L. Klozar, O. Kaller, J. Sebesta, M. Slanina, andT. Kratochvil, “Study of coexistence between indoor LTE fem-tocell and outdoor-to-indoor DVB-T2-Lite reception in ashared frequency band,” EURASIP Journal on Wireless Com-munications and Networking, vol. 2015, no. 1, 14 pages, 2015.
[2] S. Carlaw, IPR and the Potential Effect on Femtocell Markets,FemtoCells Europe, 2008.
[3] M. Ghanbarisabagh, G. Vetharatnam, E. Giacoumidis, andS. M. Malayer, “Capacity improvement in 5G networks usingfemtocell,” Wireless Personal Communications, vol. 105,no. 3, pp. 1027–1038, 2019.
[4] S.-p. Yeh, S. Talwar, N. Himayat, and K. Johnsson, “Powercontrol based interference mitigation in multi-tier networks,”in 2010 IEEE Globecom Workshops, pp. 701–705, Miami, FL,USA, 2010.
[5] C.-J. Liu, P. Huang, L. Xiao, and A.-H. Esfahanian, “Inter-fem-tocell interference identification and resource management,”IEEE Transactions on Mobile Computing, vol. 19, no. 1,pp. 116–129, 2019.
[6] A. Ghiamatyoun and A. Olfat, “Probability bounds of cross-layer interference in femtocell-underlay cellular networks
19Wireless Communications and Mobile Computing
employing interference alignment,” IET Communications,vol. 13, no. 16, pp. 2590–2600, 2019.
[7] J. Cullen, Radioframe Presentation, Femtocell Europe, Lon-don, UK, 2008.
[8] L. T. Ho and H. Claussen, “Effects of user-deployed, co-channel femtocells on the call drop probability in a residentialscenario,” in 2007 IEEE 18th International Symposium on Per-sonal, Indoor and Mobile Radio Communications, pp. 1–5,Athens, Greece, 2007.
[9] D. López-Pérez, G. de la Roche, A. Valcarce, A. Juttner, andJ. Zhang, “Interference avoidance and dynamic frequencyplanning for WiMAX femtocells networks,” in 2008 11th IEEESingapore International Conference on Communication Sys-tems, pp. 1579–1584, Guangzhou, China, 2008.
[10] M. Z. Chowdhury, Y. M. Jang, and Z. J. Haas, “Interferencemitigation using dynamic frequency re-use for dense femtocellnetwork architectures,” in 2010 Second international confer-ence on ubiquitous and future networks (ICUFN), Jeju, Korea(South), 2010.
[11] D. Chambers, Femtocell HistoryApril 2018, http://www.thinkfemtocell.com/FAQs/femtocell-history.html.
[12] V. Chandrasekhar, J. Andrews, and A. Gatherer, “Femtocellnetworks: a survey,” IEEE Communications Magazine,vol. 46, no. 9, pp. 59–67, 2008.
[13] H. Claussen, L. T. Ho, and L. G. Samuel, “An overview of thefemtocell concept,” Bell Labs Technical Journal, vol. 13, no. 1,pp. 221–245, 2008.
[14] D. N. Knisely and F. Favichia, “Standardization of femtocellsin 3GPP2,” IEEE Communications Magazine, vol. 47, no. 9,pp. 76–82, 2009.
[15] WiMAX Forum, Requirements for WiMAX Femtocell Systems,2009, Version 1.0.0.
[16] 3GPP Release 8http://www.3gpp.org/Release-8.
[17] D. N. Knisely, T. Yoshizawa, and F. Favichia, “Standardizationof femtocells in 3GPP,” IEEE Communications Magazine,vol. 47, no. 9, pp. 68–75, 2009.
[18] G. J. D. Harikumar, “Femtocells: implementation challengesand solutions,” in Director, CDMA Femtocell program, Air-vana Incorporated, IEEE Globecomm, 2008.
[19] S. Sesia, I. Toufik, and M. Baker, LTE-the UMTS Long TermEvolution: From Theory to Practice, John Wiley & Sons, 2011.
[20] 3GPP Technical Specification TS 36213 V1030, Evolved Uni-versal Terrestrial Radio Access (E-UTRA); Physical Layer Pro-cedures, 2011, http://www.3gpp.org/ftp/Specs/html-info/36213.htm.
[21] T. Nakamura, S. Nagata, A. Benjebbour et al., “Trends in smallcell enhancements in LTE advanced,” IEEE CommunicationsMagazine, vol. 51, no. 2, pp. 98–105, 2013.
[22] S. Xiao, X. Zhou, Y. Yuan-Wu, G. Y. Li, and W. Guo, “Robustresource allocation in full-duplex-enabled OFDMA femtocellnetworks,” IEEE Transactions on Wireless Communications,vol. 16, no. 10, pp. 6382–6394, 2017.
[23] A. Khandekar, N. Bhushan, J. Tingfang, and V. Vanghi, “LTE-advanced: heterogeneous networks,” in 2010 European wirelessconference (EW), pp. 978–982, Lucca, Italy, 2010.
[24] M. Al-Omari, A. R. Ramli, A. Sali, and R. S. Azmir, “Deploy-ment of femtocell and its interference managementapproaches in LTE heterogeneous networks,” Journal of Theo-retical and Applied Information Technology, vol. 87, no. 1,p. 54, 2016.
[25] L. Lindbom, R. Love, S. Krishnamurthy, C. Yao, N. Miki, andV. Chandrasekhar, “Enhanced inter-cell interference coordi-nation for heterogeneous networks in lte-advanced: a survey,”2011, https://arxiv.org/abs/1112.1344.
[26] R. Bendlin, V. Chandrasekhar, R. Chen, A. Ekpenyong, andE. Onggosanusi, “From homogeneous to heterogeneous net-works: a 3GPP long term evolution rel. 8/9 case study,” in2011 45th Annual Conference on Information Sciences and Sys-tems, pp. 1–5, Baltimore, MD, USA, 2011.
[27] D. López-Pérez, A. Valcarce, G. De La Roche, and J. Zhang,“OFDMA femtocells: a roadmap on interference avoidance,”IEEE Communications Magazine, vol. 47, no. 9, pp. 41–48,2009.
[28] J. Ghosh and D. N. K. Jayakody, “Game theoretic frequencyreuse approach in OFDMA femtocell networks,” Transactionson Emerging Telecommunications Technologies, vol. 29, no. 10,p. e3440, 2018.
[29] S.-Y. Pyun, W. Lee, and O. Jo, “Uplink resource allocation forinterference mitigation in two-tier femtocell networks,”Mobile Information Systems, vol. 2018, 6 pages, 2018.
[30] G. A. Safdar, “Coverage area-based power control for interfer-ence management in LTE femtocells,” in LTE Communica-tions and Networks: Femtocells and Antenna DesignChallenges, pp. 84–103, 2018.
[31] Z. Liu, Y. Yuan, H. Yuan, and X. Guan, “Power allocationbased on proportional-integral controller in femtocell net-works with consideration of maximum power constraint,”IEEE Systems Journal, vol. 13, no. 1, pp. 88–97, 2018.
[32] M. Al-omari, A. R. Ramli, A. Sali, and R. S. Azmir, “A femto-cell cross-tier interference mitigation technique in OFDMA-LTE system: a cuckoo search based approach,” Indian Journalof Science and Technology, vol. 9, no. 2, 2016.
[33] A. Salman, I. M. Qureshi, S. Saleem, S. Saeed, and B. R. Alyaei,“Novel sensing and joint beam and null steering basedresource allocation for cross-tier interference mitigation incognitive femtocell networks,” Wireless Networks, vol. 24,no. 6, pp. 2205–2219, 2018.
[34] N. Saquib, E. Hossain, L. B. Le, and D. I. Kim, “Interferencemanagement in OFDMA femtocell networks: issues andapproaches,” IEEE Wireless Communications, vol. 19, no. 3,pp. 86–95, 2012.
[35] K.-C. Ting, W. Lin, and C.-P. Wang, “A distributed power con-trol scheme for themitigation of co-tier downlink interference forfemtocell in the future 5G networks,” in International Conferenceon Internet of Things as a Service, pp. 73–85, Cham, 2017.
[36] T. Lee, J. Yoon, S. Lee, and J. Shin, “Interference managementin OFDMA femtocell systems using fractional frequencyreuse,” in 2010 international conference on communications,circuits and systems (ICCCAS), pp. 176–180, Chengdu, China,2010.
[37] K. C. Ting, W. Lin, and C. Wang, “Loading aware green powercontrol (LAGPC) for the mitigation of co-tier downlink inter-ference for femtocell in the future 5G networks,” Mobile Net-works and Applications, vol. 24, no. 3, pp. 864–877, 2019.
[38] E. S. Attia, S. A. El-Dolil, and M. Abd-Elnaby, “Spectrum allo-cation for enhanced cross-tier interference mitigation withthroughput improvement for femtocells in a heterogeneousLTE cellular network,” Wireless Personal Communications,vol. 101, no. 3, pp. 1671–1683, 2018.
[39] D. Calin, H. Claussen, and H. Uzunalioglu, “On femto deploy-ment architectures and macrocell offloading benefits in joint
20 Wireless Communications and Mobile Computing
macro-femto deployments,” IEEE Communications Magazine,vol. 48, no. 1, pp. 26–32, 2010.
[40] J. Ling, D. Chizhik, and R. Valenzuela, “On resource allocationin dense femto-deployments,” in Microwaves, Communica-tions, Antennas and Electronics Systems, 2009. COMCAS2009. IEEE International Conference on, pp. 1–6, Tel Aviv,Israel, 2009.
[41] Z. Sun, C. Yin, and G. Yue, “Reduced-complexity proportionalfair scheduling for OFDMA systems,” in 2006 InternationalConference on Communications, Circuits and Systems, vol. 2,pp. 1221–1225, Guilin, China, 2006.
[42] M. Haenggi and R. K. Ganti, “Interference in large wirelessnetworks,” Foundations Trends in Networking, vol. 3, no. 2,pp. 127–248, 2009.
[43] 3GPP, Evolved Universal Terrestrial Radio Access (EUTRA);Radio Frequency (RF) System Scenarios (Release 10), vol. TR36.942, 3rd Generation Partnership Project (3GPP), 2010.
[44] Alcatel-Lucent, Simulation Assumptions and Parameters forFDD HeNB RF Requirements, 2009.
[45] K. Han, Y. Choi, D. Kim, M. Na, S. Choi, and K. Han, “Opti-mization of femtocell network configuration under interfer-ence constraints,” in 2009 7th International Symposium onModeling and Optimization in Mobile, Ad Hoc, and WirelessNetworks, pp. 1–7, Seoul, Korea (South), 2009.
[46] R. K. Jain, D.-M. W. Chiu, and W. R. Hawe, A QuantitativeMeasure of Fairness and Discrimination, Eastern ResearchLaboratory, Digital Equipment Corporation, Hudson, MA,1984.
[47] M. Rupp, S. Schwarz, and M. Taranetz, The Vienna LTE-Advanced Simulators, Springer, 2016.
21Wireless Communications and Mobile Computing