effects of fabrication procedures and weld melt-through on fatigue
TRANSCRIPT
Effects of Fabrication Procedures and Weld Melt-Through on Fatigue Resistance of Orthotropic Steel Deck Welds Final Report
Report CA08-0607 December 2008
Division of Research & Innovation
Effect of Fabrication Procedures and Weld Melt-Through on Fatigue Resistance of Orthotropic Steel Deck Welds
Final Report
Report No. CA08-0607
December 2008
Prepared By:
Department of Structural Engineering
University of California, San Diego La Jolla, CA 92093
Prepared For:
California Department of Transportation Engineering Services Center
1801 30th Street Sacramento, CA 95816
California Department of Transportation Division of Research and Innovation, MS-83
1227 O Street Sacramento, CA 95814

DISCLAIMER STATEMENT
This document is disseminated in the interest of information exchange. The contents of this report reflect the views of the authors who are responsible for the facts and accuracy of the data presented herein. The contents do not necessarily reflect the official views or policies of the State of California or the Federal Highway Administration. This publication does not constitute a standard, specification or regulation. This report does not constitute an endorsement by the Department of any product described herein.
STATE OF CALIFORNIA DEPARTMENT OF TRANSPORTATION TECHNICAL REPORT DOCUMENTATION PAGE TR0003 (REV. 10/98)
1. REPORT NUMBER
CA08-0607
2. GOVERNMENT ASSOCIATION NUMBER
3. RECIPIENT’S CATALOG NUMBER
4. TITLE AND SUBTITLE Effects of Fabrication Procedures and Weld Melt-Through on Fatigue Resistance of Orthotropic Steel Deck Welds
5. REPORT DATE
December, 2008 6. PERFORMING ORGANIZATION CODE
7. AUTHOR(S) Hyoung-Bo Sim, Chia-Ming Uang
8. PERFORMING ORGANIZATION REPORT NO.
SSRP-07/13
9. PERFORMING ORGANIZATION NAME AND ADDRESS
Department of Structural Engineering University of California, San Diego La Jolla, CA 92093-0085
10. WORK UNIT NUMBER
11. CONTRACT OR GRANT NUMBER
DRI Research Task No. 0607 Contract No. 59A0442
12. SPONSORING AGENCY AND ADDRESS California Department of Transportation Engineering Services Center 1801 30th Street Sacramento, CA 95816 California Department of Transportation Division of Research and Innovation, MS-83 1227 O Street Sacramento, CA 95814
13. TYPE OF REPORT AND PERIOD COVERED
Final Report
14. SPONSORING AGENCY CODE
913
15. SUPPLEMENTAL NOTES
This report may also be referenced as report SSRP-07/13 published by the UCSD. 16. ABSTRACT
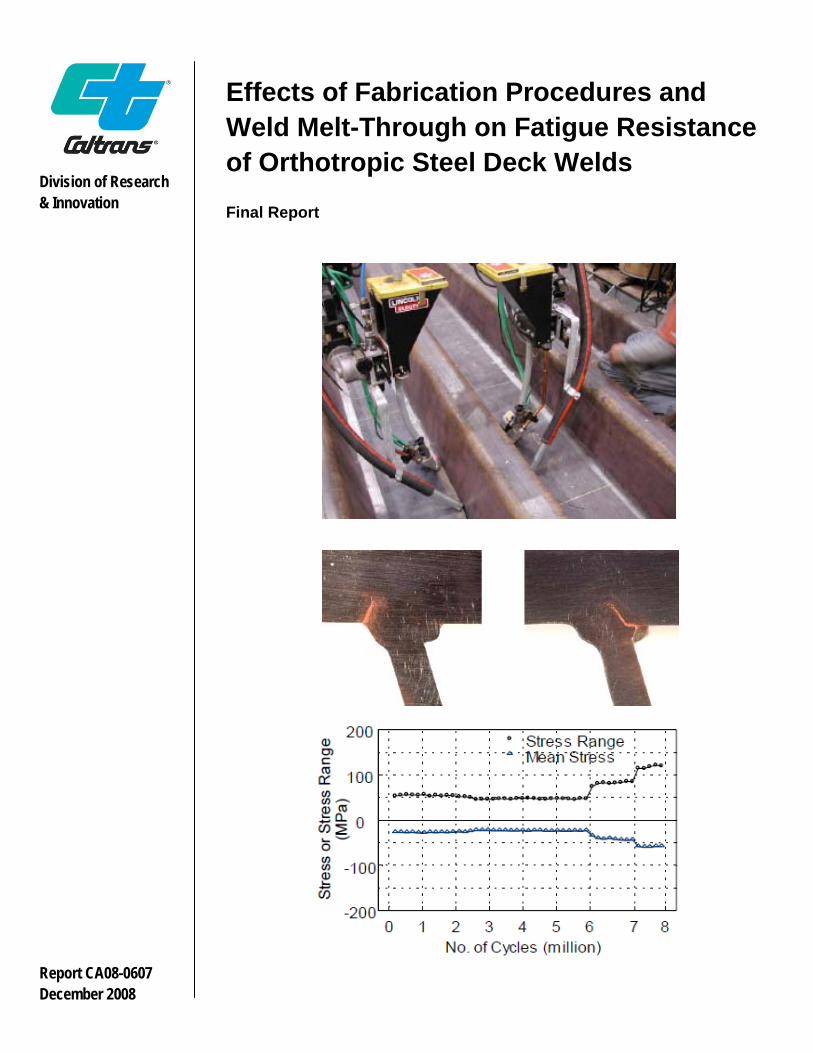
A common practice for the fabrication of orthotropic bridge deck in the US involves using 80% partial-joint-penetration groove welds (PJP) to join closed ribs to a deck plate. Avoiding weld melt-through with the thin rib plate may be difficult to achieve in practice because a tight fit may not always be achievable. When weld melt-through occurs, which is difficult to inspect inside the ribs, it is not clear how the geometric discontinuities would affect the fatigue resistance. Furthermore, a distortion control plan, which involves heat straightening or even pre-cambering, is also used for the fabricated orthotropic deck in order to meet the flatness requirement. It is unclear how repeated heating along the PJP weld line would affect the fatigue resistance.
Six 2-span, full-scale orthotropic steel deck specimens (10 m long by 3 m wide) were fabricated and tested in order to study the effects of both weld melt-through and distortion control measures on the fatigue resistance of the deck-to-rib PJP welded joint. Three of the specimens were only heat straightened, and the other three were pre-cambered to minimize the need for subsequent heat straightening. For the two distortion control schemes one of the three weld conditions [80% PJP weld, 100% PJP weld with evident continuous weld melt-through, and alternating the above two weld conditions every 1 m] was used for each specimen. Up to 8 million cycles of loading, which simulated the expected maximum stress range corresponding to axle loads of 3×HS15 with 15% impact, were applied at the mid-length of each span and were out of phase to simulate the effect of a moving truck. The load level and boundary conditions were modified slightly based on the observed cracks that occurred in the diaphragm cutouts in the first specimen.
Based on the loading scheme applied and the test results of the remaining five specimens, it was observed that three specimens experienced cracking at the rib-to-deck PJP welds at seven loaded locations. It was thought initially that weld melt-through which creates geometric discontinuities at the weld root was the main concern. But only one of the seven cracks initiated from the weld root inside the closed rib, and all the other six cracks initiated from the weld toe outside the closed rib. Based on the loading pattern applied, therefore, it appears that these welds are more vulnerable to cracks initiating from the weld toe, not weld root. Of the only one crack that developed at the weld root, the crack initiated from a location transitioning from 80% PJP weld to 100% PJP weld. This type of geometric discontinuity may be representative of the effect of weld melt-through in actual production of orthotropic steel decks. Two of the five specimens did not experience PJP weld cracks, and were the ones that were effectively pre-cambered; a third panel was insufficiently pre-cambered and the resulting distortion and heat straightening were the same as required for the un-cambered panels. Therefore, effective pre-cambering is beneficial to mitigate the crack potential in rib-to-deck PJP welds.
17. KEY WORDS
Orthotropic steel deck, closed rib, weld melt-through, heat straightening, pre-cambering, fatigue test
18. DISTRIBUTION STATEMENT No restrictions. This document is available to the public through the National Technical Information Service, Springfield, VA 22161
19. SECURITY CLASSIFICATION (of this report)
Unclassified
20. NUMBER OF PAGES 189 Pages
21. PRICE
Reproduction of completed page authorized
STRUCTURAL SYSTEMS
RESEARCH PROJECT
Report No.
SSRP-07/13
FINAL
EFFECTS OF FABRICATION PROCEDURES
AND WELD MELT-THROUGH ON FATIGUE
RESISTANCE OF ORTHOTROPIC STEEL
DECK WELDS
by
HYOUNG-BO SIM
CHIA-MING UANG
Final Report Submitted to the California Department of Transportation (Caltrans) Under Contract No. 59A0442
August 2007
Department of Structural Engineering
University of California, San Diego
La Jolla, California 92093-0085
University of California, San Diego
Department of Structural Engineering
Structural Systems Research Project
Report No. SSRP-07/13
FINAL
Effects of Fabrication Procedures and Weld Melt-Through on
Fatigue Resistance of Orthotropic Steel Deck Welds
by
Hyoung-Bo Sim
Graduate Student Researcher
Chia-Ming Uang
Professor of Structural Engineering
Final Report to Submitted to the California Department of Transportation
(Caltrans) Under Contract No. 59A0442
Department of Structural Engineering
University of California, San Diego
La Jolla, California 92093-0085
August 2007
Technical Report Documentation Page 1. Report No.
FHWA/CA/ES-2007/13
2. Government Accession No.
3. Recipient’s Catalog No.
4. Title and Subtitle
Effects of Fabrication Procedures and Weld Melt-Through on Fatigue Resistance of
Orthotropic Steel Deck Welds
5. Report Date
August 2007
6. Performing Organization Code
7. Author(s)
Hyoung-Bo Sim
Chia-Ming Uang
8. Performing Organization Report No.
SSRP 07/13
9. Performing Organization Name and Address
Division of Structural Engineering
School of Engineering
10. Work Unit No. (TRAIS)
University of California, San Diego
La Jolla, California 92093-0085
11. Contract or Grant No.
59A0442
12. Sponsoring Agency Name and Address
California Department of Transportation
13. Type of Report and Period Covered
Final Report, July 2004 – September 2006
Engineering Service Center
1801 30th St., West Building MS-9
Sacramento, California 95807
14. Sponsoring Agency Code
15. Supplementary Notes
Prepared in cooperation with the State of California Department of Transportation.
16. Abstract
A common practice for the fabrication of orthotropic bridge deck in the US involves using 80% partial-joint-penetration groove welds (PJP) to join closed ribs to a deck plate. Avoiding weld melt-through with the thin rib plate may be difficult to achieve in practice because a tight fit may not always
be achievable. When weld melt-through occurs, which is difficult to inspect inside the ribs, it is not clear how the geometric discontinuities would affect
the fatigue resistance. Furthermore, a distortion control plan, which involves heat straightening or even pre-cambering, is also used for the fabricated
orthotropic deck in order to meet the flatness requirement. It is unclear how repeated heating along the PJP weld line would affect the fatigue
resistance.
Six 2-span, full-scale orthotropic steel deck specimens (10 m long by 3 m wide) were fabricated and tested in order to study the effects of both weld
melt-through and distortion control measures on the fatigue resistance of the deck-to-rib PJP welded joint. Three of the specimens were only heat
straightened, and the other three were pre-cambered to minimize the need for subsequent heat straightening. For the two distortion control schemes
one of the three weld conditions [80% PJP weld, 100% PJP weld with evident continuous weld melt-through, and alternating the above two weld
conditions every 1 m] was used for each specimen. Up to 8 million cycles of loading, which simulated the expected maximum stress range
corresponding to axle loads of 3×HS15 with 15% impact, were applied at the mid-length of each span and were out of phase to simulate the effect of a
moving truck. The load level and boundary conditions were modified slightly based on the observed cracks that occurred in the diaphragm cutouts in
the first specimen.
Based on the loading scheme applied and the test results of the remaining five specimens, it was observed that three specimens experienced
cracking at the rib-to-deck PJP welds at seven loaded locations. It was thought initially that weld melt-through which creates geometric discontinuities
at the weld root was the main concern. But only one of the seven cracks initiated from the weld root inside the closed rib, and all the other six cracks
initiated from the weld toe outside the closed rib. Based on the loading pattern applied, therefore, it appears that these welds are more vulnerable to
cracks initiating from the weld toe, not weld root. Of the only one crack that developed at the weld root, the crack initiated from a location transitioning
from 80% PJP weld to 100% PJP weld. This type of geometric discontinuity may be representative of the effect of weld melt-through in actual
production of orthotropic steel decks.
Two of the five specimens did not experience PJP weld cracks, and were the ones that were effectively pre-cambered; a third panel was
insufficiently pre-cambered and the resulting distortion and heat straightening were the same as required for the un-cambered panels. Therefore,
effective pre-cambering is beneficial to mitigate the crack potential in rib-to-deck PJP welds.
17. Key Words
Orthotropic steel deck, closed rib, weld melt-through, heat
straightening, pre-cambering, fatigue test
18. Distribution Statement
No restrictions
19. Security Classification (of this report)
Unclassified
20. Security Classification (of this page)
Unclassified
21. No. of Pages
182
22. Price
Form DOT F 1700.7 (8-72) Reproduction of completed page authorized

i
DISCLAIMER
The contents of this report reflect the views of the authors who are responsible for
the facts and the accuracy of the data presented herein. The contents do not necessarily
reflect the official views or policies of the State of California. This report does not
constitute a standard, specification or regulation.
ii
ACKNOWLEDGEMENTS
Funding for this research was provided by the California Department of
Transportation under Contract No. 59A0442. We would like to thank Dr. C. Sikorsky
(project manager), Mr. B. Boal, Dr. M. Wahbeh, Dr. E. Thimmhardy, and Dr. L. Duan of
the California Department of Transportation. Professor John Fisher from Lehigh
University served as an independent consultant for this project.
The testing was conducted in the Charles Lee Powell Structures Laboratories at
the University of California, San Diego. Assistance from Dr. T. Hanji, Messrs. Jong-
Kook Hong and James Newell throughout the testing is much appreciated.
iii
ABSTRACT
A common practice for the fabrication of orthotropic bridge deck in the US
involves using 80% partial-joint-penetration groove welds (PJP) to join closed ribs to a
deck plate. Avoiding weld melt-through with the thin rib plate may be difficult to
achieve in practice because a tight fit may not always be achievable. When weld melt-
through occurs, which is difficult to inspect inside the ribs, it is not clear how the
geometric discontinuities would affect the fatigue resistance. Furthermore, a distortion
control plan, which involves heat straightening or even pre-cambering, is also used for
the fabricated orthotropic deck in order to meet the flatness requirement. It is unclear how
repeated heating along the PJP weld line would affect the fatigue resistance.
Six 2-span, full-scale orthotropic steel deck specimens (10 m long by 3 m wide)
were fabricated and tested in order to study the effects of both weld melt-through and
distortion control measures on the fatigue resistance of the deck-to-rib PJP welded joint.
Three of the specimens were only heat straightened, and the other three were pre-
cambered to minimize the need for subsequent heat straightening. For the two distortion
control schemes one of the three weld conditions [80% PJP weld, 100% PJP weld with
evident continuous weld melt-through, and alternating the above two weld conditions
every 1 m] was used for each specimen. Up to 8 million cycles of loading, which
simulated the expected maximum stress range corresponding to axle loads of 3×HS15
with 15% impact, were applied at the mid-length of each span and were out of phase to
simulate the effect of a moving truck. The load level and boundary conditions were
modified slightly based on the observed cracks that occurred in the diaphragm cutouts in
the first specimen.
Based on the loading scheme applied and the test results of the remaining five
specimens, it was observed that three specimens experienced cracking at the rib-to-deck
PJP welds at seven loaded locations. It was thought initially that weld melt-through
which creates geometric discontinuities at the weld root was the main concern. But only
one of the seven cracks initiated from the weld root inside the closed rib, and all the other
six cracks initiated from the weld toe outside the closed rib. Based on the loading pattern
applied, therefore, it appears that these welds are more vulnerable to cracks initiating
iv
from the weld toe, not weld root. Of the only one that developed at the weld root, the
crack initiated from a location transitioning from 80% PJP weld to 100% PJP weld. This
type of geometric discontinuity may be representative of the effect of weld melt-through
in actual production of orthotropic steel decks.
Two of the five specimens did not experience PJP weld cracks, and were the ones
that were effectively pre-cambered; a third panel was insufficiently pre-cambered and the
resulting distortion and heat straightening were the same as required for the un-cambered
panels. Therefore, effective pre-cambering is beneficial to mitigate the crack potential in
rib-to-deck PJP welds.
v
TABLE OF CONTENTS
DISCLAIMER ........................................................................................................................... i
ACKNOWLEDGEMENTS...................................................................................................... ii
ABSTRACT............................................................................................................................. iii
TABLE OF CONTENTS.......................................................................................................... v
LIST OF TABLES.................................................................................................................. vii
LIST OF FIGURES ............................................................................................................... viii
LIST OF FIGURES ............................................................................................................... viii
LIST OF SYMBOLS ............................................................................................................. xiv
1. INTRODUCTION ............................................................................................................ 1
1.1 Background............................................................................................................... 1
1.2 Objectives ................................................................................................................. 7
2. TESTING PROGRAM ..................................................................................................... 8
2.1 Panel Fabrication ...................................................................................................... 8
2.1.1 General........................................................................................................... 8
2.1.2 Rib-to-Deck Plate PJP Welded Joint ............................................................. 8
2.1.3 Distortion Controls (Pre-Cambering and Heat Straightening)..................... 11
2.1.4 Distortion Measurements ............................................................................. 16
2.1.5 Intersection of Closed Rib to Diaphragms................................................... 24
2.2 Material Properties.................................................................................................. 26
2.3 Test Setup................................................................................................................ 28
2.4 Loading ................................................................................................................... 32
2.5 Instrumentation ....................................................................................................... 34
2.5.1 General......................................................................................................... 34
2.5.2 Strain Gages in Deck Plate near Rib-to-Deck Welds .................................. 34
2.5.3 Strain Gages in Ribs near Rib-to-Deck Welds ............................................ 37
2.5.4 Strain Gages in Ribs, Diaphragms, and Bulkheads at Supports .................. 45
3. FINITE ELEMENT ANALYSIS ................................................................................... 50
3.1 Introduction............................................................................................................. 50
3.2 Predicted Global Behavior...................................................................................... 50
3.3 Predicted Stresses for Model 1 ............................................................................... 60
3.3.1 Stress Contour on Ribs at Support Diaphragms .......................................... 60
vi
3.3.2 Principal Stress Distribution on Bulkhead and Diaphragm Plates............... 64
3.3.3 Stress Distribution on Ribs near Rib-to-Deck Joints ................................... 67
3.4 Predicted Stresses for Model 2 ............................................................................... 70
3.4.1 Stress Contour on Ribs at Support Diaphragms .......................................... 70
3.4.2 Principal Stress Distribution on Bulkhead and Diaphragm Plates............... 74
3.4.3 Stress Distribution on Ribs near Rib-to-Deck Welded Joints...................... 77
4. SPECIMEN 1 TEST RESULTS..................................................................................... 80
4.1 Testing Program...................................................................................................... 80
4.2 Fatigue Cracks in Ribs at End Support Diaphragms .............................................. 82
4.3 Measured Response ................................................................................................ 90
4.3.1 Rib Stress Distribution near the Rib-to-Deck Welds................................... 90
4.3.2 Stress Distribution on Bulkheads and Diaphragms ..................................... 94
4.3.3 Stress Comparisons between Predicted and Measured Responses .............. 99
4.4 Modifications for Testing of Specimens 2 to 6..................................................... 100
5. SPECIMENS 2 TO 6 TEST RESULTS ....................................................................... 103
5.1 Testing Program.................................................................................................... 103
5.2 Measured Response near the Rib-to-Deck PJP Welds ......................................... 105
5.2.1 Deck Plate Stress Distribution ................................................................... 105
5.2.2 Rib Stress Distribution near Rib-to-Deck Welds....................................... 117
5.2.3 Fatigue Cracks near Rib-to-Deck Welds ................................................... 141
5.3 Measured Response at Support Diaphragms ........................................................ 146
5.3.1 Stress Distribution in Ribs, Diaphragms, and Bulkheads .......................... 146
5.3.2 Fatigue Cracks Observed in Ribs below Bulkhead and Diaphragm Cutout......................................................................................................... 157
5.4 Comparison of Test Results .................................................................................. 161
5.4.1 Effect of Heat Straightening on Fatigue Resistance of Rib-to-Deck Welds ......................................................................................................... 161
5.4.2 Effect of Weld Melt-Through on Fatigue Resistance of Rib-to-Deck Welds ......................................................................................................... 161
6. SUMMARY AND CONCLUSIONS ........................................................................... 163
6.1 Summary ............................................................................................................... 163
6.2 Conclusions........................................................................................................... 164
REFERENCES ..................................................................................................................... 166
vii
LIST OF TABLES
Table 2.1 Designation of Specimens ................................................................................ 11
Table 2.2 Pre-cambering Measures................................................................................... 16
Table 2.3 Measured Value of d......................................................................................... 26
Table 2.4 Mechanical Properties....................................................................................... 27
Table 2.5 Chemical Analysis (from Certified Mill Test Report)...................................... 27
Table 2.6 Test Matrix........................................................................................................ 29
Table 4.1 Specimen 1: Stress Range and Mean Stresses in Ribs near Rib-to-Deck Welds
................................................................................................................................... 91
Table 4.2 Specimen 1: Stress Range and Mean Stresses on Bulkheads and Diaphragms 95
Table 4.3 Specimen 1: Comparison between predicted and Measured Responses .......... 99
Table 5.1 Specimen 4: Stress Range and Mean Stress in Deck Plate near the PJP Welds
................................................................................................................................. 106
Table 5.2 Specimen 5: Stress Range and Mean Stress in Deck Plate near the PJP Welds
................................................................................................................................. 107
Table 5.3 Specimen 6: Stress Range and Mean Stress in Deck Plate near the PJP Welds
................................................................................................................................. 108
Table 5.4 Specimen 2: Stress Range and Mean Stress in Ribs near the PJP Welds....... 118
Table 5.5 Specimen 3: Stress Range and Mean Stress in Ribs near the PJP Welds....... 119
Table 5.6 Specimen 4: Stress Range and Mean Stress in Ribs near the PJP Welds....... 120
Table 5.7 Specimen 5: Stress Range and Mean Stress in Ribs near the PJP Welds....... 121
Table 5.8 Specimen 6: Stress Range and Mean Stress in Ribs near the PJP Welds....... 122
Table 5.9 Specimen 2: Stress Range and Mean Stress at Support Diaphragms ............. 147
Table 5.10 Specimen 3: Stress Range and Mean Stress at Support Diaphragms ........... 147
Table 5.11 Specimen 4: Stress Range and Mean Stress at Support Diaphragms ........... 148
Table 5.12 Specimen 5: Stress Range and Mean Stress at Support Diaphragms ........... 148
Table 5.13 Specimen 4: Crack Length Below Rib-to-Bulkhead Connection (mm) ....... 157
Table 5.14 Number of Cracks and Crack Types at Loading Locations.......................... 162
viii
LIST OF FIGURES
Figure 1.1 Typical Cross Section of Orthotropic Box Girder............................................. 2
Figure 1.2 Fatigue Cracks on Orthotropic Steel Deck (Machida et al. 2003) .................... 3
Figure 1.3 Cross Sectional Dimensions (Wolchuk 2004)................................................... 4
Figure 1.4 Diaphragm Cutout Details of New Carquinez Bridge (Wolchuk 2004) ........... 5
Figure 1.5 Typical PJP Welds at Rib-to-Deck Plate Joint .................................................. 7
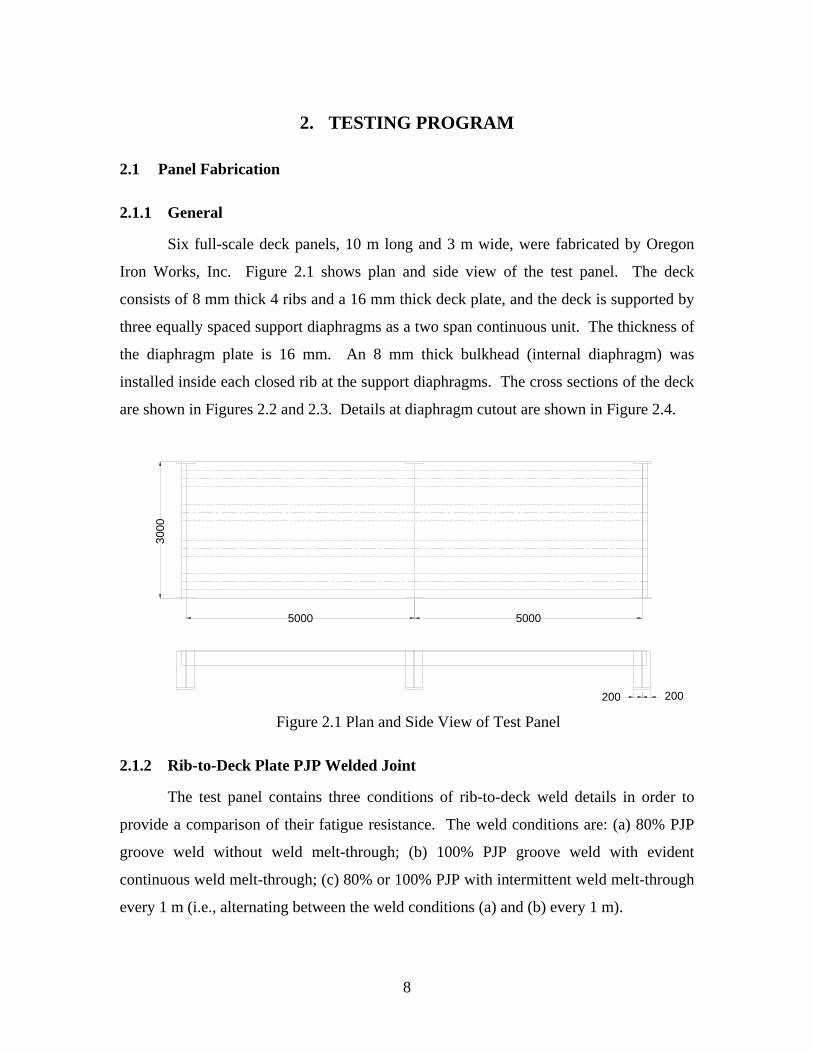
Figure 2.1 Plan and Side View of Test Panel ..................................................................... 8
Figure 2.2 Cross Section between Support Diaphragms .................................................... 9
Figure 2.3 Cross Section at Support Diaphragms............................................................... 9
Figure 2.4 Details at Diaphragm Cutout ............................................................................. 9
Figure 2.5 Submerged Arc Welding Operation ................................................................ 10
Figure 2.6 View of Weld Melt-through Inside of Rib ...................................................... 11
Figure 2.7 Heat Straightening Operation .......................................................................... 12
Figure 2.8 Heat-Straightened Locations ........................................................................... 14
Figure 2.9 Pre-Cambering................................................................................................. 15
Figure 2.10 Pre-Cambering Scheme ................................................................................. 15
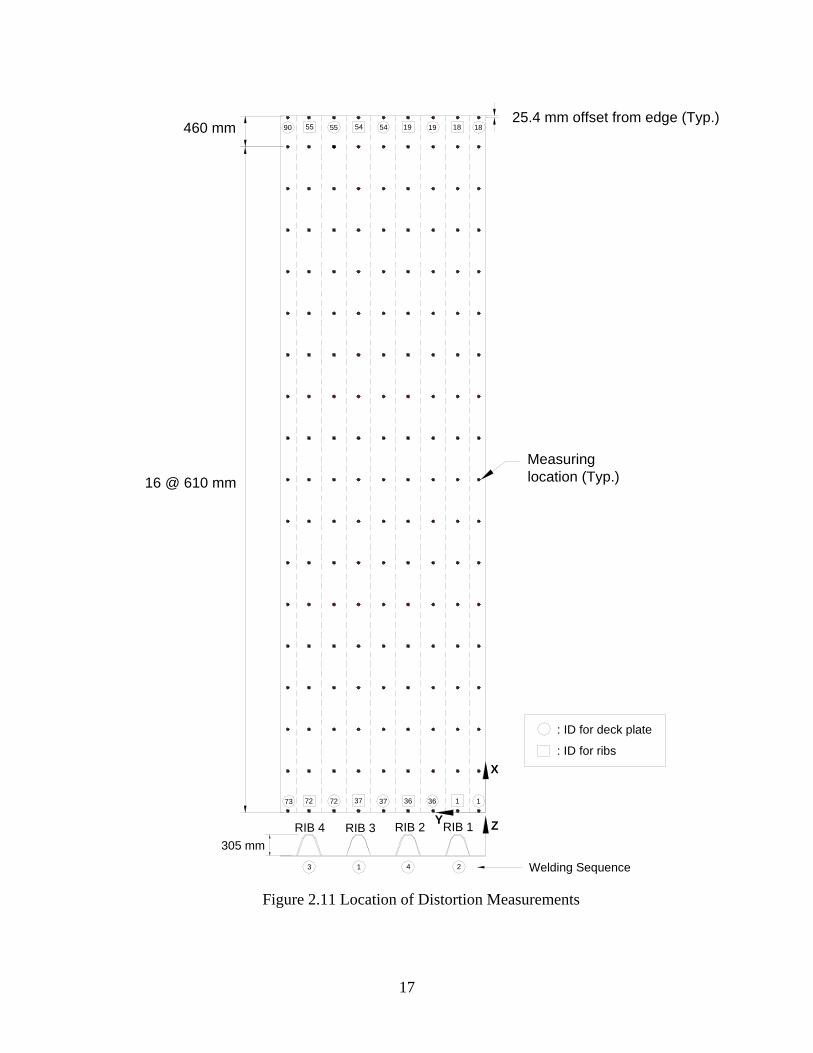
Figure 2.11 Location of Distortion Measurements ........................................................... 17
Figure 2.12 Specimen 1: Distortion Measurements.......................................................... 18
Figure 2.13 Specimen 2: Distortion Measurements.......................................................... 19
Figure 2.14 Specimen 3: Distortion Measurements.......................................................... 20
Figure 2.15 Specimen 4: Distortion Measurements.......................................................... 21
Figure 2.16 Specimen 5: Distortion Measurements.......................................................... 22
Figure 2.17 Specimen 6: Distortion Measurements.......................................................... 23
Figure 2.18 Deck Distortion in the Longitudinal Direction.............................................. 24
Figure 2.19 Deck Distortion in the Transverse Direction................................................. 24
Figure 2.20 Intersection of Rib with Diaphragms ............................................................ 25
Figure 2.21 HRB Hardness Test (Specimen 5)................................................................. 28
Figure 2.22 End View of Test Setup................................................................................. 30
Figure 2.23 Elevation of Test Setup ................................................................................. 30
Figure 2.24 East Test Setup (Specimens 2 and 3) ............................................................ 31
Figure 2.25 West Test Setup (Specimens 1, 4, 5, and 6) .................................................. 31
ix
Figure 2.26 Specimen 1: Loading Scheme ....................................................................... 33
Figure 2.27 Specimens 2 to 6: Loading Scheme............................................................... 33
Figure 2.28 Specimen 1: Uni-axial Strain Gages in Deck Plate near Rib-to-Deck Welds35
Figure 2.29 Specimen 2: Uni-axial Strain Gages in Deck Plate near Rib-to-Deck Welds35
Figure 2.30 Specimen 3: Uni-axial Strain Gages in Bottom of Deck Plate near Rib-to-
Deck Welds............................................................................................................... 36
Figure 2.31 Specimen 4: Strain Gage Rosettes in Bottom of Deck Plate near Rib-to-Deck
Welds ........................................................................................................................ 36
Figure 2.32 Specimen 5: Uni-axial Strain Gages in Deck Plate Near Rib-to-Deck Welds
................................................................................................................................... 36
Figure 2.33 Specimen 6: Uni-axial Strain Gages in Deck Plate near Rib-to-Deck Welds37
Figure 2.34 Specimen 1: Strain Gages in Outer Surface of Rib R2 near Rib-to-Deck
Welds ........................................................................................................................ 38
Figure 2.35 Specimen 1: Strain Gages in Rib R3 near Rib-to-Deck Welds ..................... 38
Figure 2.36 Specimen 2: Strain Gages in Outer Surface of Rib R2 near Rib-to-Deck
Welds ........................................................................................................................ 39
Figure 2.37 Specimen 2: Strain Gages in Outer Surface of Rib R3 near Rib-to-Deck
Welds ........................................................................................................................ 39
Figure 2.38 Specimen 2: Strain Gages in Outer Surface of Rib R4 near Rib-to-Deck
Welds ........................................................................................................................ 40
Figure 2.39 Specimen 3: Strain Gages in Outer Surface of Rib R2 near Rib-to-Deck
Welds ........................................................................................................................ 40
Figure 2.40 Specimen 3: Strain Gages in Outer Surface of Rib R3 near Rib-to-Deck
Welds ........................................................................................................................ 41
Figure 2.41 Specimen 4: Strain Gages in Outer Surface of Rib R2 near Rib-to-Deck
Welds ........................................................................................................................ 41
Figure 2.42 Specimen 4: Strain Gages in Outer Surface of Rib R3 near Rib-to-Deck
Welds ........................................................................................................................ 42
Figure 2.43 Specimen 4: Strain Gages in Inner Surface of Rib R3 near Rib-to-Deck
Welds ........................................................................................................................ 42
x
Figure 2.44 Specimen 5: Strain Gages in Outer Surface of Rib R2 near Rib-to-Deck
Welds ........................................................................................................................ 43
Figure 2.45 Specimen 5: Strain Gages in Inner Surface of Rib R2 near Rib-to-Deck
Welds ........................................................................................................................ 43
Figure 2.46 Specimen 6: Strain Gages in Outer Surface of Rib R2 near Rib-to-Deck
Welds ........................................................................................................................ 44
Figure 2.47 Specimen 6: Strain Gages in Outer Surface of Rib R3 Near Rib-to-Deck
Welds ........................................................................................................................ 44
Figure 2.48 Strain Gage Instrumentation Inside of Ribs .................................................. 45
Figure 2.49 Specimen 1: Gages in Bulkheads and Diaphragms at Supports.................... 46
Figure 2.50 Specimen 2: Gages in Ribs, Bulkheads and Diaphragms at Supports .......... 47
Figure 2.51 Specimen 3: Gages in Ribs, Bulkheads and Diaphragms at Supports .......... 48
Figure 2.52 Specimen 4: Gages in Ribs at Supports......................................................... 49
Figure 2.53 Specimen 5: Gages in Ribs at Supports......................................................... 49
Figure 3.1 ABAQUS Modeling ........................................................................................ 50
Figure 3.2 Model 1: Plan View and Loading Steps .......................................................... 52
Figure 3.3 Model 2: Plan View and Loading Steps .......................................................... 53
Figure 3.4 Model 1: Deformed Shape (Amplification Factor = 50) ................................. 54
Figure 3.5 Model 2: Deformed Shape (Amplification Factor = 50) ................................. 55
Figure 3.6 Model 1: Deformed Shape at Cross Section 1 (Amplification Factor = 50) ... 56
Figure 3.7 Model 1: Deformed Shape at Cross Section 2 (Amplification Factor = 50) ... 57
Figure 3.8 Model 1: Deformed Shape at Cross Section 3 through Load Steps 1, 2, and 3
................................................................................................................................... 58
Figure 3.9 Model 2: Deformed Shape at Cross Section 1 (Amplification Factor = 50) ... 58
Figure 3.10 Model 2: Deformed Shape at Cross Section 2 (Amplification Factor = 50) . 59
Figure 3.11 Model 2: Deformed Shape at Cross Section 3 through Load Steps 1, 2, and 3
................................................................................................................................... 60
Figure 3.12 Model 1: Location of Detail A ...................................................................... 61
Figure 3.13 Model 1: Stress Contour Inside the Rib of Detail A (MPa) .......................... 62
Figure 3.14 Model 1: Stress Contour Outside the Rib of Detail A (MPa)........................ 63
Figure 3.15 Model 1: Principal Stress Contour or Tensor at Detail A (MPa) .................. 65
xi
Figure 3.16 Designation of Rib-to-Deck Joints ................................................................ 68
Figure 3.17 Location and Direction of Stresses in Deck Plate and Ribs .......................... 68
Figure 3.18 Model 1: Predicted Stresses in Ribs at Joint 1 .............................................. 69
Figure 3.19 Model 1: Predicted Stresses in Deck Plate at Joint 1 .................................... 69
Figure 3.20 Model 1: Predicted Stresses in Ribs at Joint 2 .............................................. 69
Figure 3.21 Model 1: Predicted Stresses in Deck Plate at Joint 2 .................................... 70
Figure 3.22 Model 2: Location of Detail B....................................................................... 71
Figure 3.23 Model 2: Stress Contour Inside the Rib of Detail B (MPa) .......................... 72
Figure 3.24 Model 2: Stress Contour Outside the Rib of Detail B (MPa)........................ 73
Figure 3.25 Model 2: Principal Stress Contour or Tensor at Detail B (MPa) .................. 75
Figure 3.26 Model 2: Predicted Stresses in Deck Plate at Joint 1 .................................... 78
Figure 3.27 Model 2: Predicted Stresses in Ribs at Joint 1 .............................................. 78
Figure 3.28 Model 2: Predicted Stresses in Deck Plate at Joint 2 .................................... 78
Figure 3.29 Model 2: Predicted Stresses in Ribs at Joint 2 .............................................. 79
Figure 4.1 Specimen 1: Plan View with Rib and Diaphragm Designations..................... 81
Figure 4.2 Specimen 1: Test Setup and Diaphragm Locations......................................... 81
Figure 4.3 Specimen 1: Typical Applied Load and Measured Deflection Time History . 82
Figure 4.4 Specimen 1: Crack Pattern on the Rib below bulkhead and diaphragm cutout
................................................................................................................................... 83
Figure 4.5 Specimen 1: Fatigue Crack at D1-R2-East...................................................... 84
Figure 4.6 Specimen 1: Fatigue Crack at D1-R2-West .................................................... 85
Figure 4.7 Specimen 1: Fatigue Crack at D1-R3-East...................................................... 86
Figure 4.8 Specimen 1: Fatigue Crack at D1-R3-West .................................................... 87
Figure 4.9 Specimen 1: Fatigue Crack at D3-R2-East...................................................... 88
Figure 4.10 Specimen 1: Fatigue Crack at D3-R3-West .................................................. 89
Figure 4.11 Specimen 1: Stress Range and Mean Stresses in Rib R2 .............................. 92
Figure 4.12 Specimen 1: Stress Range and Mean Stresses in Rib R3 near Rib-to-Deck
Welds ........................................................................................................................ 93
Figure 4.13 Specimen 1: Stress Range and Mean Stresses on Bulkhead ......................... 96
Figure 4.14 Specimen 1: Stress Range and Mean Stresses on Diaphragms ..................... 97
Figure 4.15 Specimen 1: Comparison between Predicted and Measured responses ...... 100
xii
Figure 4.16 Model Configuration and Predicted Rib Stresses at Cutout Location (MPa)
................................................................................................................................. 101
Figure 4.17 Boundary Condition Modifications............................................................. 102
Figure 5.1 Specimens 2 to 6: Plan View with Rib and Diaphragm Designations .......... 104
Figure 5.2 Specimens 2 to 6: Typical Applied Load and Measured Deflection Time
History..................................................................................................................... 105
Figure 5.3 Specimen 4: Stress Range and Mean Stress in Deck Plate near the PJP Welds
................................................................................................................................. 109
Figure 5.4 Specimen 5: Stress Range and Mean Stress in Deck Plate near the PJP Welds
................................................................................................................................. 111
Figure 5.5 Specimen 6: Stress Range and Mean Stress in Deck Plate near the PJP Welds
................................................................................................................................. 115
Figure 5.6 Specimen 2: Stress Range and Mean Stress in Rib R2 near the PJP Welds . 123
Figure 5.7 Specimen 2: Stress Range and Mean Stress in Rib R3 near the PJP Welds . 124
Figure 5.8 Specimen 2: Stress Range and Mean Stress in Rib R4 near the PJP Welds . 125
Figure 5.9 Specimen 3: Stress Range and Mean Stress in Rib R2 near the PJP Welds . 126
Figure 5.10 Specimen 3: Stress Range and Mean Stress in Rib R3 near the PJP Welds 127
Figure 5.11 Specimen 4: Stress Range and Mean Stress in Rib R2 near the PJP Welds 129
Figure 5.12 Specimen 4: Stress Range and Mean Stress in Rib R3 near the PJP Welds 130
Figure 5.13 Specimen 5: Stress Range and Mean Stress in Rib R2 near the PJP Welds 133
Figure 5.14 Specimen 6: Stress Range and Mean Stress in Rib R2 near the PJP Welds 138
Figure 5.15 Specimen 6: Stress Range and Mean Stress in Rib R3 near the PJP Welds 140
Figure 5.16 Four Cutting Locations with Designations (C1 to C4)................................ 142
Figure 5.17 Sliced Pieces................................................................................................ 142
Figure 5.18 Typical Crack Pattern at Rib-to-Deck PJP Welds....................................... 143
Figure 5.19 Specimen 2: Depth of Crack Initiating from Rib-to-Deck PJP Welds........ 143
Figure 5.20 Specimen 2: Indication of Linear Crack at Rib-to-Deck PJP Weld ............ 144
Figure 5.21 Specimen 3: Crack Depth at Rib-to-Deck PJP Welds (Location C1) ......... 144
Figure 5.22 Specimen 6: Crack Depth at Rib-to-Deck PJP Welds................................. 145
Figure 5.23 Specimen 2: Stress Range and Mean Stress in Ribs at Supports ................ 149
Figure 5.24 Specimen 2: Stress Range and Mean Stress in Bulkheads and Diaphragms150

xiii
Figure 5.25 Specimen 3: Stress Range and Mean Stress in Ribs at Supports ................ 152
Figure 5.26 Specimen 3: Stress Range and Mean Stress in Bulkheads and Diaphragms153
Figure 5.27 Specimen 4: Stress Range and Mean Stress in Ribs at Supports ................ 154
Figure 5.28 Specimen 5: Stress Range and Mean Stress in Ribs at Supports ................ 156
Figure 5.29 Specimen 5: Observed Crack Pattern at End Supports (at 8 M cycles) ...... 158
Figure 5.30 Cross Section through the Crack at End Support ........................................ 159
Figure 5.31 Specimen 4: Cracks at Rib-to-Bulkhead Welded Joint (D1-R2-East) ........ 160

xiv
LIST OF SYMBOLS
C1 Cutting location 1
C2 Cutting location 2
C3 Cutting location 3
C4 Cutting location 4
CJP Complete Joint Penetration
D1 Diaphragm 1
D2 Diaphragm 2
D3 Diaphragm 3
E Modulus of elasticity
MT Magnetic particle test
P Applied load
PJP Partial Joint Penetration
R1 Rib 1
R2 Rib 2
R3 Rib 3
R4 Rib 4
Sm Mean stress
Sr Stress range
UT Ultrasonic test
a Larger of the spacing of the rib walls
d Distance from the top of the free cutout to the bottom of the bulkhead
h’ Length of the inclined portion of the rib wall
td,eff Effective thickness of the deck plate
tr Thickness of the rib wall
1
1. INTRODUCTION
1.1 Background
Modern orthotropic steel bridge decks were developed in Europe over five
decades ago. In an effort to create a bridge with limited resources available during World
War II, European bridge engineers developed lightweight steel bridge decks that feature
not only economical but also excellent structural characteristics. An orthotropic steel
deck typically consists of thin steel plate stiffened by a series of closely spaced
longitudinal ribs and transverse floor beams supporting the deck plate (see Figure 1.1).
The longitudinal ribs are welded to the underside of the deck plate in a parallel pattern
perpendicular to the floor beams, thus the deck becomes much more rigid in the
longitudinal direction than the transverse direction. As the structural behavior is different
in the longitudinal and transverse directions, the system is orthogonal-anisotropic and is
called orthotropic for short (Troitsky 1987).
Longitudinal ribs welded to the deck plate can be either open ribs or closed ribs.
Open ribs which have small torsional stiffness are usually made from flat bars, inverted
T-sections, bulb shapes, angles, or channels. For closed ribs with much larger torsional
stiffness than the open ribs, semicircular, triangular, boxed, or trapezoidal shapes are
often used, and among which the trapezoidal rib section is most commonly used.
Advantages to the deck system with open ribs may lie in the simplicity for fabrication
and ease of maintenance due to availability of getting access to both sides of the rib-to-
deck welds. Disadvantages to the open rib deck system are that the wheel-load
distribution capacity in the transverse direction is relatively small, and the deck is heavier
compared to the closed ribs deck system due to close spacing of floor beams. The deck
system stiffened by closed ribs has more efficiency for transverse distribution of the
wheel load than the open rib system due to high torsional and flexural stiffness (Troitsky
1987). In addition, the deck with closed ribs uses less welding than is necessary with
open ribs due to wide spacing of floor beams. Nevertheless, closed ribs can be welded to
the deck plate from one side (i.e., outside) only, thus making weld inspection impossible
after welding due to a lack of access to the inside of the closed ribs.
2
Despite their light weight and other excellent structural characteristics, orthotropic
steel deck bridges have recently experienced a variety of fatigue problems resulting from
high cyclic stresses in conjunction with poor welding details (Kaczinski et al. 1997,
Bocchieri et al. 1998).
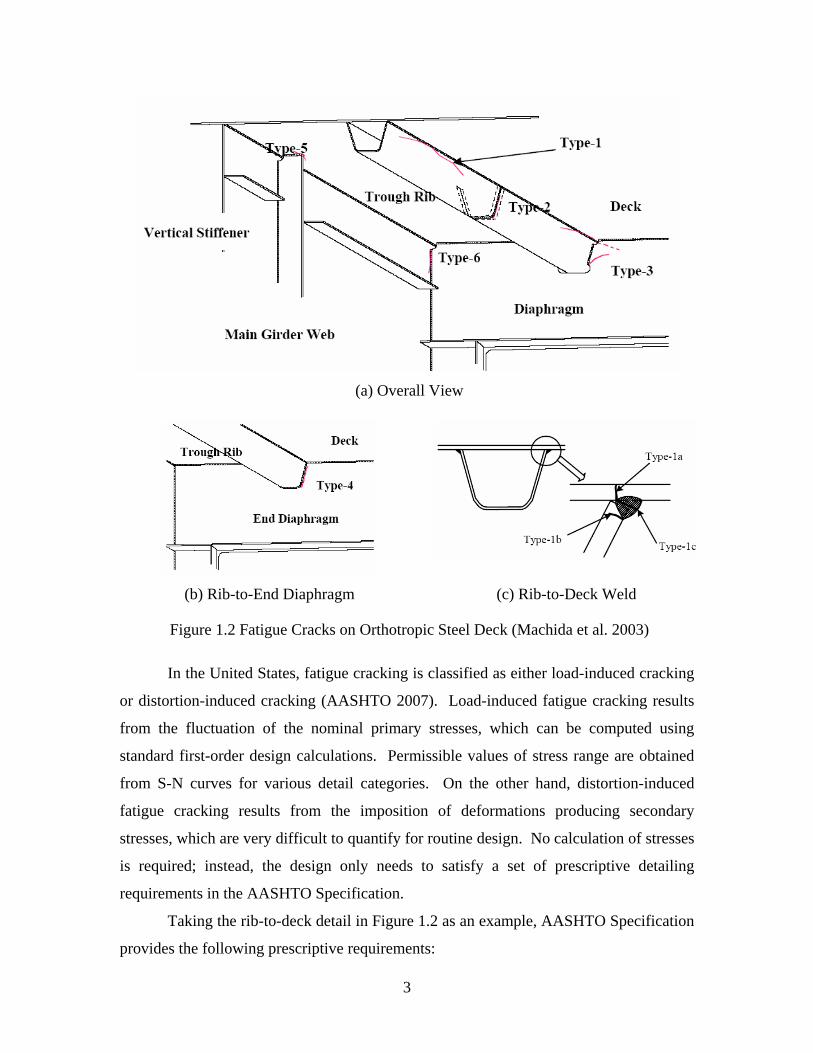
In Japan, a detailed investigation of the occurrence of fatigue cracks of
orthotropic steel bridges in urban cities was reported by Machida et al. (2003). Figure 1.2
shows typical crack patterns. In addition to the crack at the rib-to-diaphragm junction,
crack at the rib-to-deck welded joint is also a concern. The latter joints are prone to
fatigue cracking because they are subjected to wheel load directly; stress concentration
occurs both in the weld toe due to local plate bending and bearing stresses and in the
weld root due to the characteristic deformation made of the joint from wheel load
(Machida et al. 2003). Unfortunately, inspection and repair of the back side of this weld
(i.e., weld root) for closed ribs is not practical due to lack of access. Cracks like type 1a
in Figure 1.2(c) will not be discovered until the crack propagates thorough the entire
thickness of the plate and shows sign in wearing surface.
Figure 1.1 Typical Cross Section of Orthotropic Box Girder
3
(a) Overall View
(b) Rib-to-End Diaphragm (c) Rib-to-Deck Weld
Figure 1.2 Fatigue Cracks on Orthotropic Steel Deck (Machida et al. 2003)
In the United States, fatigue cracking is classified as either load-induced cracking
or distortion-induced cracking (AASHTO 2007). Load-induced fatigue cracking results
from the fluctuation of the nominal primary stresses, which can be computed using
standard first-order design calculations. Permissible values of stress range are obtained
from S-N curves for various detail categories. On the other hand, distortion-induced
fatigue cracking results from the imposition of deformations producing secondary
stresses, which are very difficult to quantify for routine design. No calculation of stresses
is required; instead, the design only needs to satisfy a set of prescriptive detailing
requirements in the AASHTO Specification.
Taking the rib-to-deck detail in Figure 1.2 as an example, AASHTO Specification
provides the following prescriptive requirements:
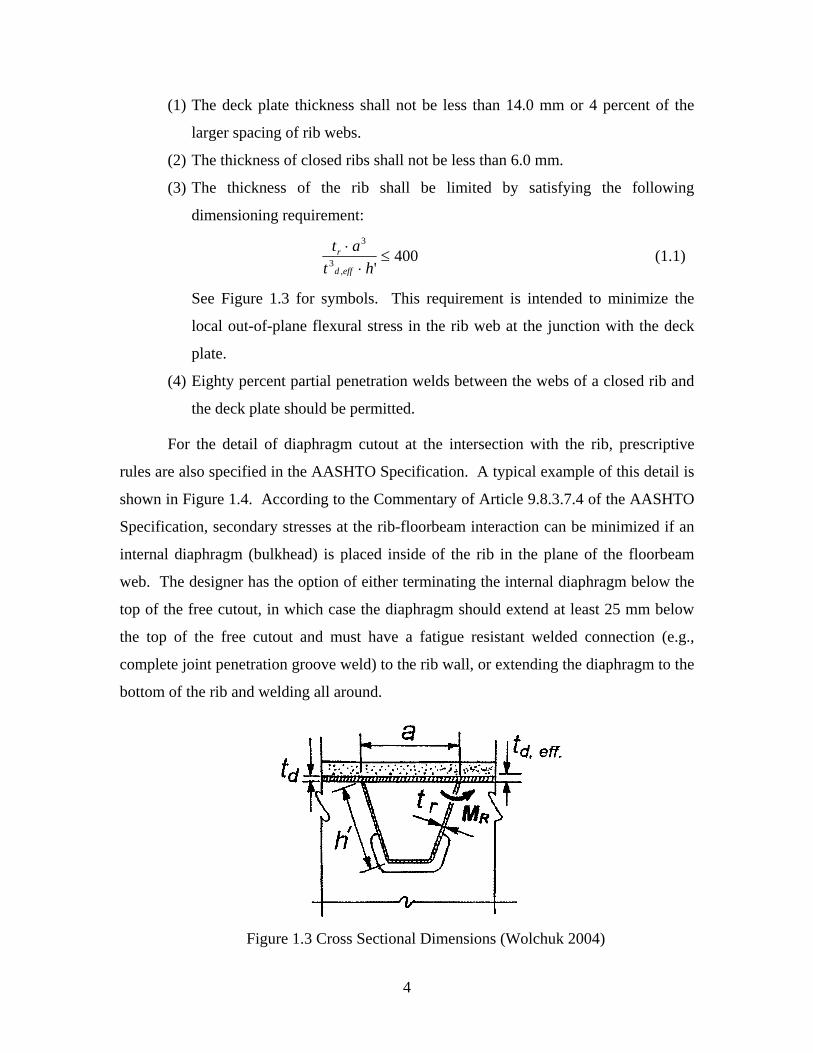
4
(1) The deck plate thickness shall not be less than 14.0 mm or 4 percent of the
larger spacing of rib webs.
(2) The thickness of closed ribs shall not be less than 6.0 mm.
(3) The thickness of the rib shall be limited by satisfying the following
dimensioning requirement:
400',
3
3
≤⋅
⋅ht
ateffd
r (1.1)
See Figure 1.3 for symbols. This requirement is intended to minimize the
local out-of-plane flexural stress in the rib web at the junction with the deck
plate.
(4) Eighty percent partial penetration welds between the webs of a closed rib and
the deck plate should be permitted.
For the detail of diaphragm cutout at the intersection with the rib, prescriptive
rules are also specified in the AASHTO Specification. A typical example of this detail is
shown in Figure 1.4. According to the Commentary of Article 9.8.3.7.4 of the AASHTO
Specification, secondary stresses at the rib-floorbeam interaction can be minimized if an
internal diaphragm (bulkhead) is placed inside of the rib in the plane of the floorbeam
web. The designer has the option of either terminating the internal diaphragm below the
top of the free cutout, in which case the diaphragm should extend at least 25 mm below
the top of the free cutout and must have a fatigue resistant welded connection (e.g.,
complete joint penetration groove weld) to the rib wall, or extending the diaphragm to the
bottom of the rib and welding all around.
Figure 1.3 Cross Sectional Dimensions (Wolchuk 2004)
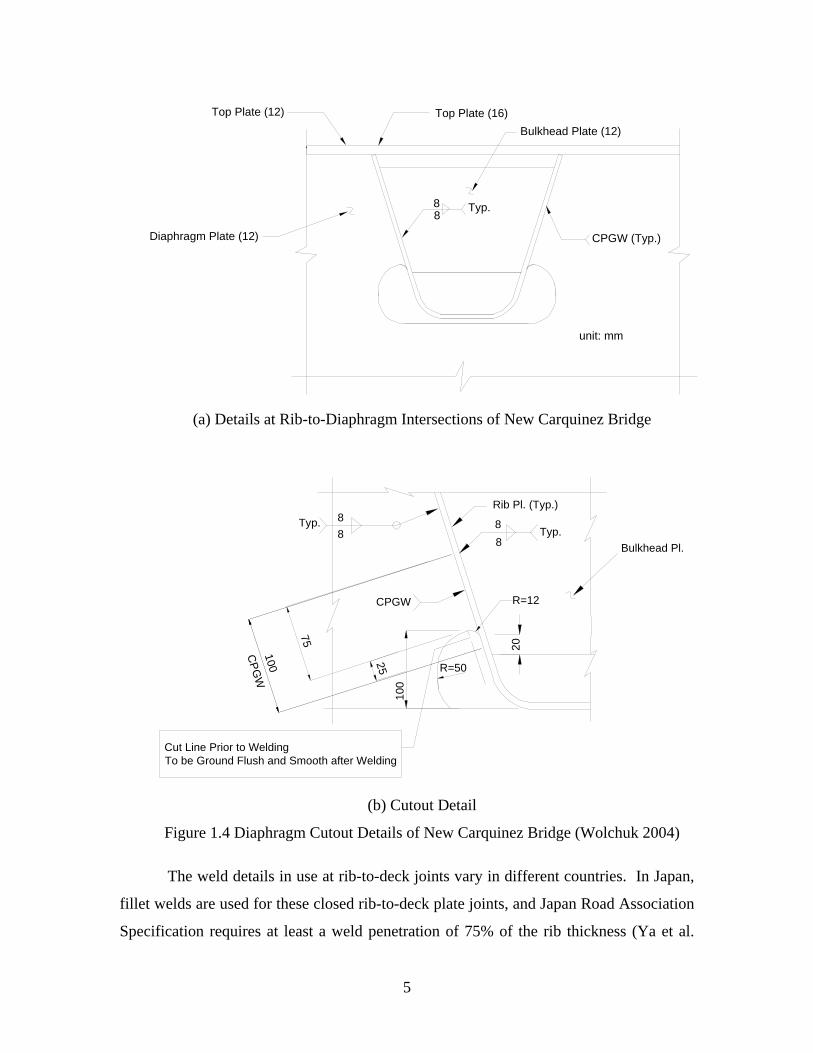
5
Bulkhead Plate (12)
88
Typ.
CPGW (Typ.)
Top Plate (12) Top Plate (16)
Diaphragm Plate (12)
unit: mm
(a) Details at Rib-to-Diaphragm Intersections of New Carquinez Bridge
Cut Line Prior to WeldingTo be Ground Flush and Smooth after Welding
Bulkhead Pl.
88
Typ.
Rib Pl. (Typ.)88
Typ.
CPGW
CPG
W
20100
75
25
100
R=50
R=12
(b) Cutout Detail
Figure 1.4 Diaphragm Cutout Details of New Carquinez Bridge (Wolchuk 2004)
The weld details in use at rib-to-deck joints vary in different countries. In Japan,
fillet welds are used for these closed rib-to-deck plate joints, and Japan Road Association
Specification requires at least a weld penetration of 75% of the rib thickness (Ya et al.
6
2007). In the United States, Article 9.8.3.7.2 of the AASHTO Specification code
specifies 80% partial penetration groove welds. The Commentary states that partial
penetration welds are generally used for connecting closed ribs with thickness greater
than 6.35 mm (1/4 in) to deck plates. Such welds, which require careful choice of
automatic welding processes and a tight fit, are less susceptible to fatigue failure than full
penetration groove welds requiring backup bars. In practice, however, the amount of
penetration into the joint components is difficult to control, and the actual weld size
achieved varies due to many parameters, including power source, material, and fit-up
tolerances. Because of the thin thickness (say, 8 mm) of the rib plate, weld melt-through
to the back side of this weld is also difficult to avoid. Some are of the opinion that this
weld melt-through might affect the fatigue resistance at these welded joints. Figure 1.5
shows two weld details of 80% PJP without weld melt-through and with weld melt-
through.
As an orthotropic steel deck is fabricated from thin steel plates and closed ribs
joined together by extensive welding, thermal distortion would result. To satisfy the
flatness requirement of the deck plate, heat straightening is commonly used. Some are of
the opinions that heat straightening, especially used repeatedly, may affect the fatigue
resistance of the PJP weld. Pre-cambering prior to welding is also common in practice to
minimize the need for heat straightening (Masahiro et al. 2006).

7
(a) with Weld Melt-Through (b) without Weld Melt-Through
Figure 1.5 Typical PJP Welds at Rib-to-Deck Plate Joint
1.2 Objectives
The main objective of this study was to evaluate through full-scale testing the
effects of the following two factors on the fatigue resistance of closed rib-to-deck PJP
welds:
(1) weld melt-through, and
(2) distortion control measures including pre-cambering
t
0.8 t
t
0.8 t
8
2. TESTING PROGRAM
2.1 Panel Fabrication
2.1.1 General
Six full-scale deck panels, 10 m long and 3 m wide, were fabricated by Oregon
Iron Works, Inc. Figure 2.1 shows plan and side view of the test panel. The deck
consists of 8 mm thick 4 ribs and a 16 mm thick deck plate, and the deck is supported by
three equally spaced support diaphragms as a two span continuous unit. The thickness of
the diaphragm plate is 16 mm. An 8 mm thick bulkhead (internal diaphragm) was
installed inside each closed rib at the support diaphragms. The cross sections of the deck
are shown in Figures 2.2 and 2.3. Details at diaphragm cutout are shown in Figure 2.4.
3000
50005000
200 200 Figure 2.1 Plan and Side View of Test Panel
2.1.2 Rib-to-Deck Plate PJP Welded Joint
The test panel contains three conditions of rib-to-deck weld details in order to
provide a comparison of their fatigue resistance. The weld conditions are: (a) 80% PJP
groove weld without weld melt-through; (b) 100% PJP groove weld with evident
continuous weld melt-through; (c) 80% or 100% PJP with intermittent weld melt-through
every 1 m (i.e., alternating between the weld conditions (a) and (b) every 1 m).
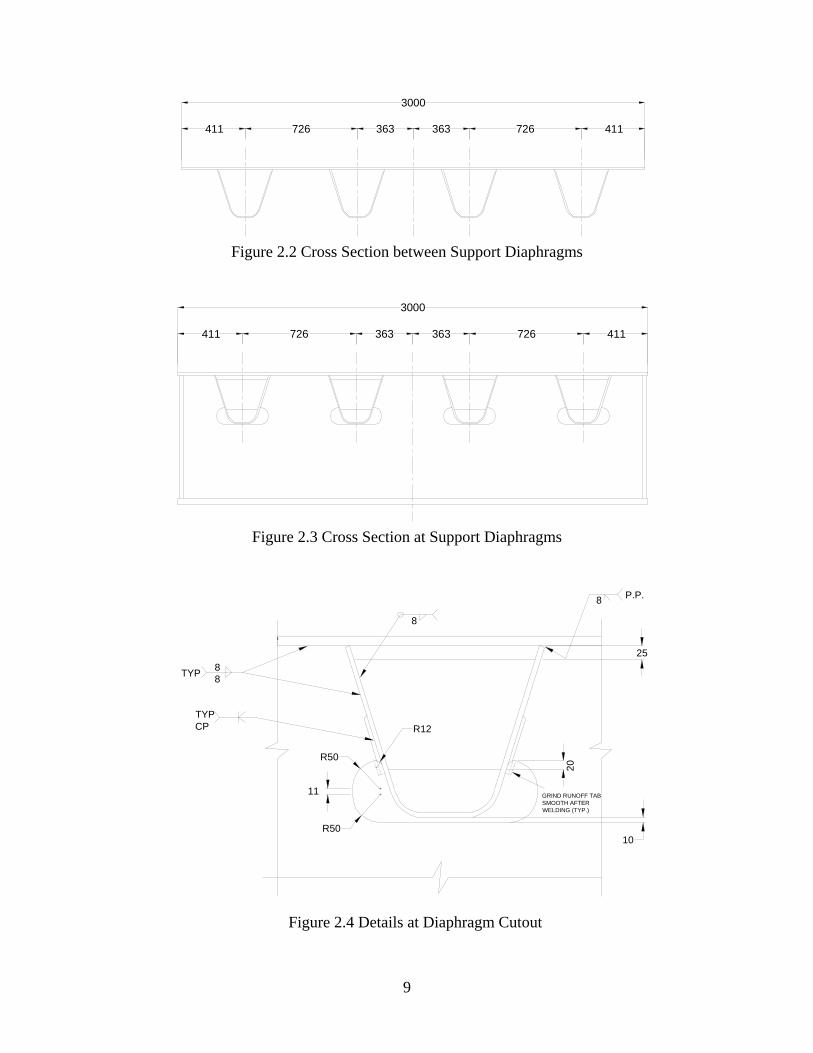
9
411 726 363 363 726 411
3000
Figure 2.2 Cross Section between Support Diaphragms
411 726 363 363 726 411
3000
Figure 2.3 Cross Section at Support Diaphragms
11
R12
R50
R50
88TYP
8
25
10
8 P.P.
TYPCP
GRIND RUNOFF TABSMOOTH AFTERWELDING (TYP.)
20
Figure 2.4 Details at Diaphragm Cutout
10
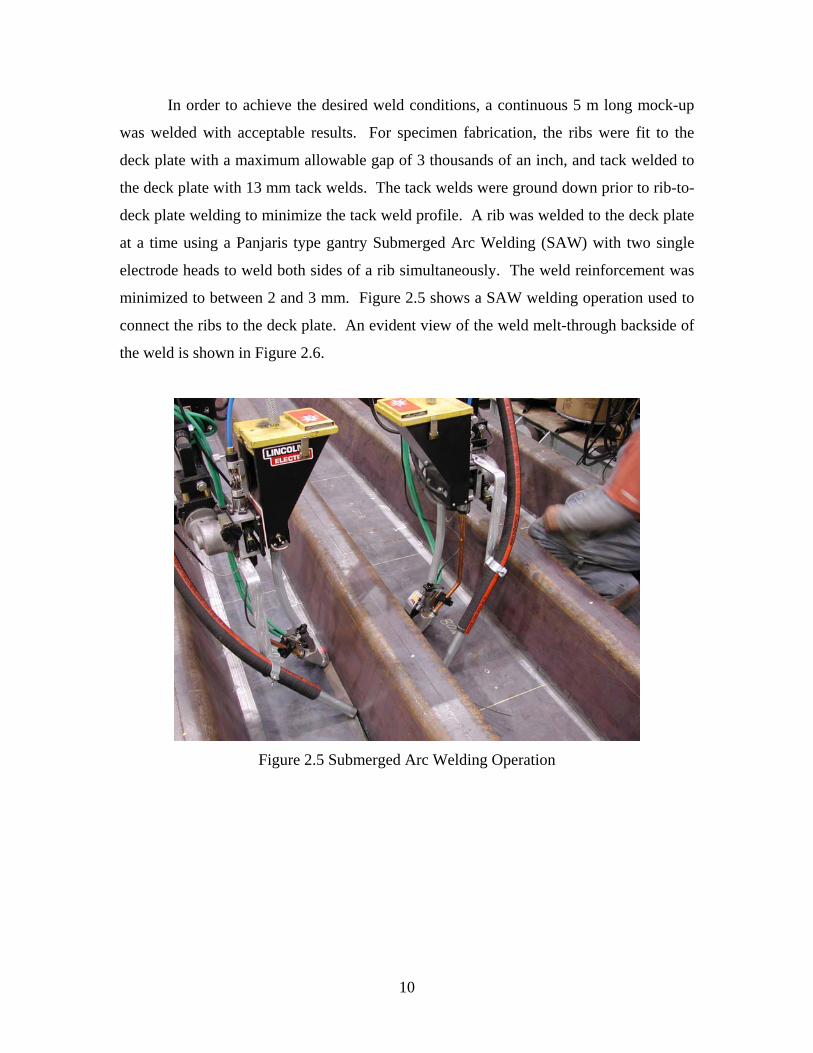
In order to achieve the desired weld conditions, a continuous 5 m long mock-up
was welded with acceptable results. For specimen fabrication, the ribs were fit to the
deck plate with a maximum allowable gap of 3 thousands of an inch, and tack welded to
the deck plate with 13 mm tack welds. The tack welds were ground down prior to rib-to-
deck plate welding to minimize the tack weld profile. A rib was welded to the deck plate
at a time using a Panjaris type gantry Submerged Arc Welding (SAW) with two single
electrode heads to weld both sides of a rib simultaneously. The weld reinforcement was
minimized to between 2 and 3 mm. Figure 2.5 shows a SAW welding operation used to
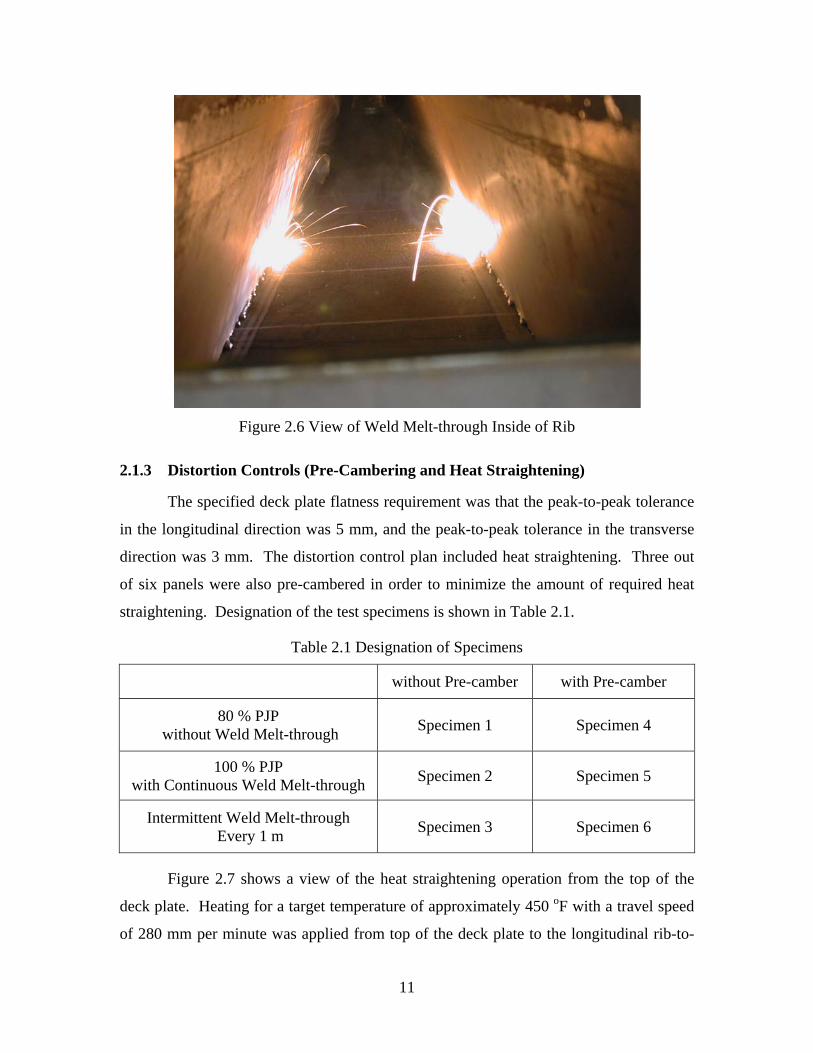
connect the ribs to the deck plate. An evident view of the weld melt-through backside of
the weld is shown in Figure 2.6.
Figure 2.5 Submerged Arc Welding Operation
11
Figure 2.6 View of Weld Melt-through Inside of Rib
2.1.3 Distortion Controls (Pre-Cambering and Heat Straightening)
The specified deck plate flatness requirement was that the peak-to-peak tolerance
in the longitudinal direction was 5 mm, and the peak-to-peak tolerance in the transverse
direction was 3 mm. The distortion control plan included heat straightening. Three out
of six panels were also pre-cambered in order to minimize the amount of required heat
straightening. Designation of the test specimens is shown in Table 2.1.
Table 2.1 Designation of Specimens
without Pre-camber with Pre-camber
80 % PJP without Weld Melt-through Specimen 1 Specimen 4
100 % PJP with Continuous Weld Melt-through Specimen 2 Specimen 5
Intermittent Weld Melt-through Every 1 m Specimen 3 Specimen 6
Figure 2.7 shows a view of the heat straightening operation from the top of the
deck plate. Heating for a target temperature of approximately 450 oF with a travel speed
of 280 mm per minute was applied from top of the deck plate to the longitudinal rib-to-
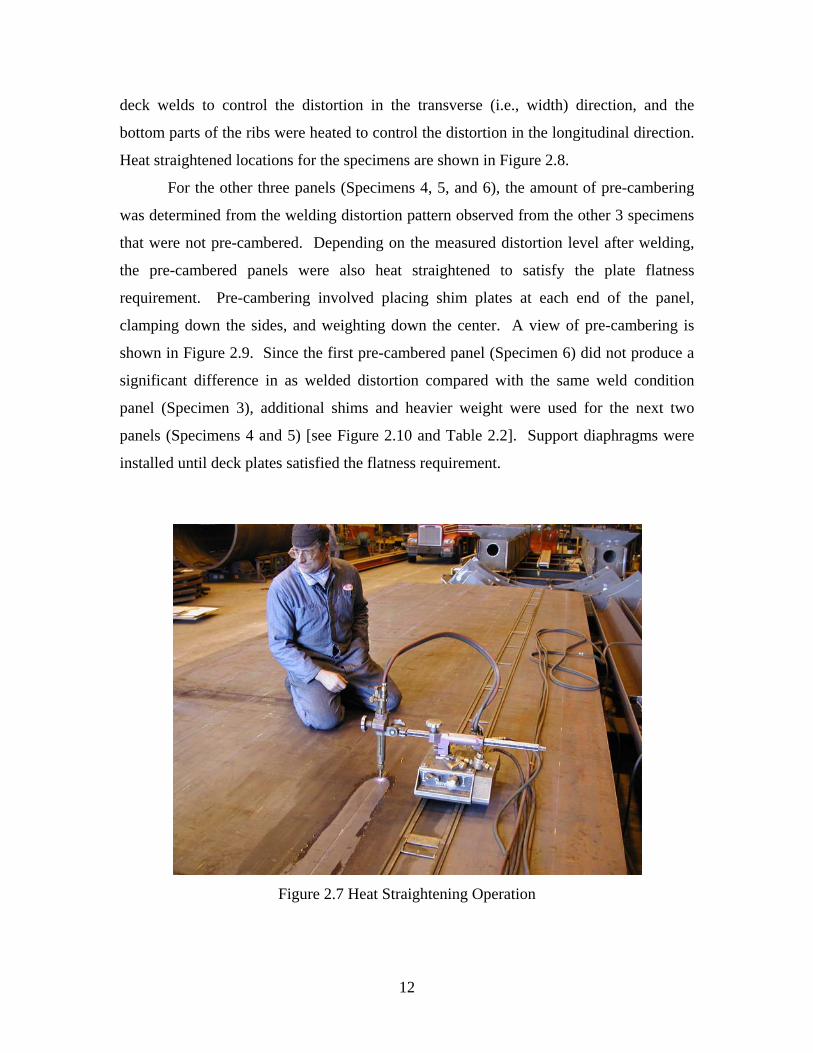
12
deck welds to control the distortion in the transverse (i.e., width) direction, and the
bottom parts of the ribs were heated to control the distortion in the longitudinal direction.
Heat straightened locations for the specimens are shown in Figure 2.8.
For the other three panels (Specimens 4, 5, and 6), the amount of pre-cambering
was determined from the welding distortion pattern observed from the other 3 specimens
that were not pre-cambered. Depending on the measured distortion level after welding,
the pre-cambered panels were also heat straightened to satisfy the plate flatness
requirement. Pre-cambering involved placing shim plates at each end of the panel,
clamping down the sides, and weighting down the center. A view of pre-cambering is
shown in Figure 2.9. Since the first pre-cambered panel (Specimen 6) did not produce a
significant difference in as welded distortion compared with the same weld condition
panel (Specimen 3), additional shims and heavier weight were used for the next two
panels (Specimens 4 and 5) [see Figure 2.10 and Table 2.2]. Support diaphragms were
installed until deck plates satisfied the flatness requirement.
Figure 2.7 Heat Straightening Operation
13
No Heat on Ribs
3000
mm
5000 mm5000 mm
No Heat on Ribs
3000
mm
5000 mm5000 mm
(a) Specimen 1
3000
mm
5000 mm5000 mm
3000
mm
5000 mm5000 mm
(b) Specimen 2
3000
mm
5000 mm5000 mm
3000
mm
5000 mm5000 mm
(c) Specimen 3
heating area on deck
heating area on rib
14
3000
mm
5000 mm5000 mm
No Heat on Ribs
3000
mm
5000 mm5000 mm
No Heat on Ribs (d) Specimen 4
3000
mm
5000 mm5000 mm
No Heat on Ribs
3000
mm
5000 mm5000 mm
No Heat on Ribs (e) Specimen 5
3000
mm
5000 mm5000 mm
3000
mm
5000 mm5000 mm
(f) Specimen 6
Figure 2.8 Heat-Straightened Locations
15
Figure 2.9 Pre-Cambering
CC
CC
CC
CC
CC
C : Clamp
: Weight
: SupportCC
CC
CC
CC
CC
: Shim Plate
Specimen 6 Specimens 4 and 5
CC
CC
CC
CC
CC
C : Clamp
: Weight
: SupportCC
CC
CC
CC
CC
: Shim Plate
Specimen 6 Specimens 4 and 5
Figure 2.10 Pre-Cambering Scheme
16
Table 2.2 Pre-cambering Measures
Weight (lb) Shim height (mm)
Shim height (mm)
Specimen 4 42,000 20 10 Specimen 5 38,000 50 25 Specimen 6 7,300 22 10
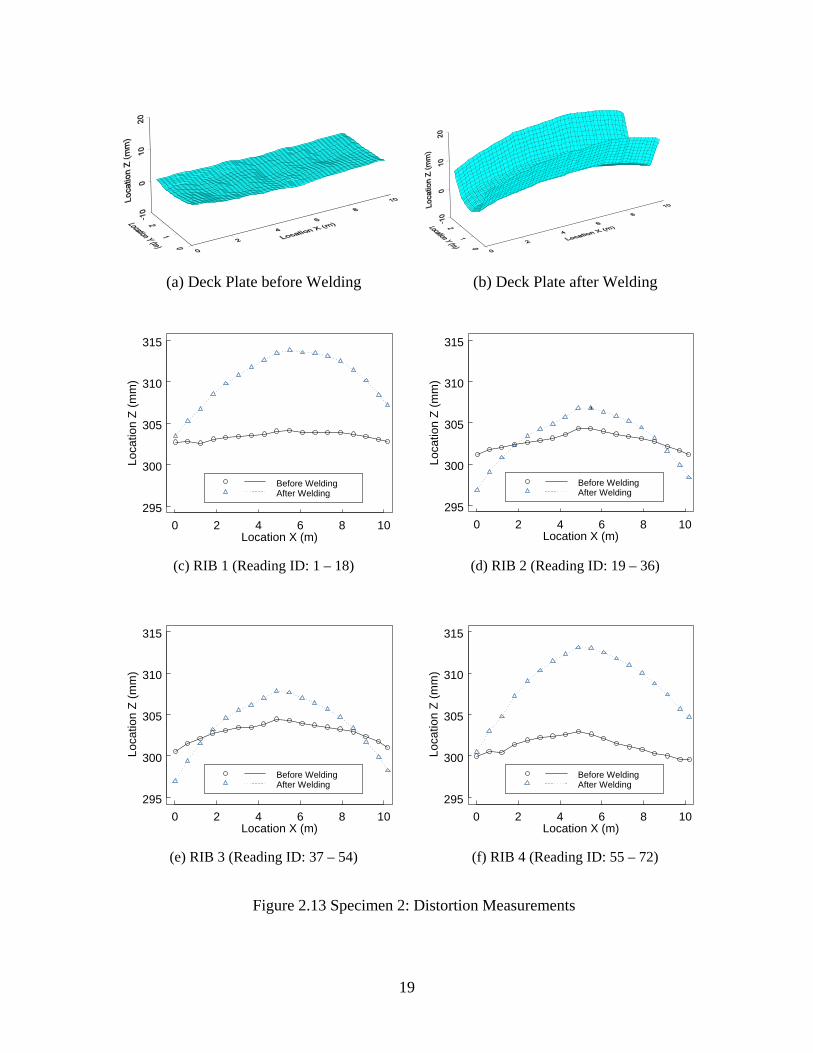
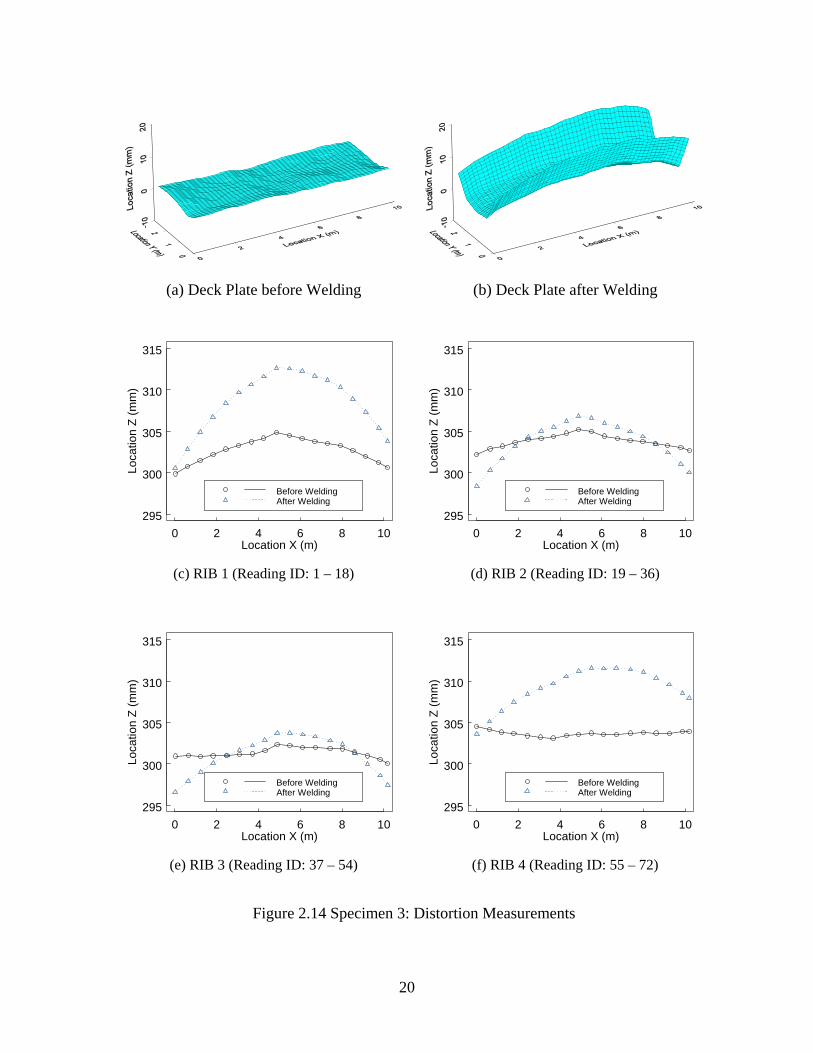
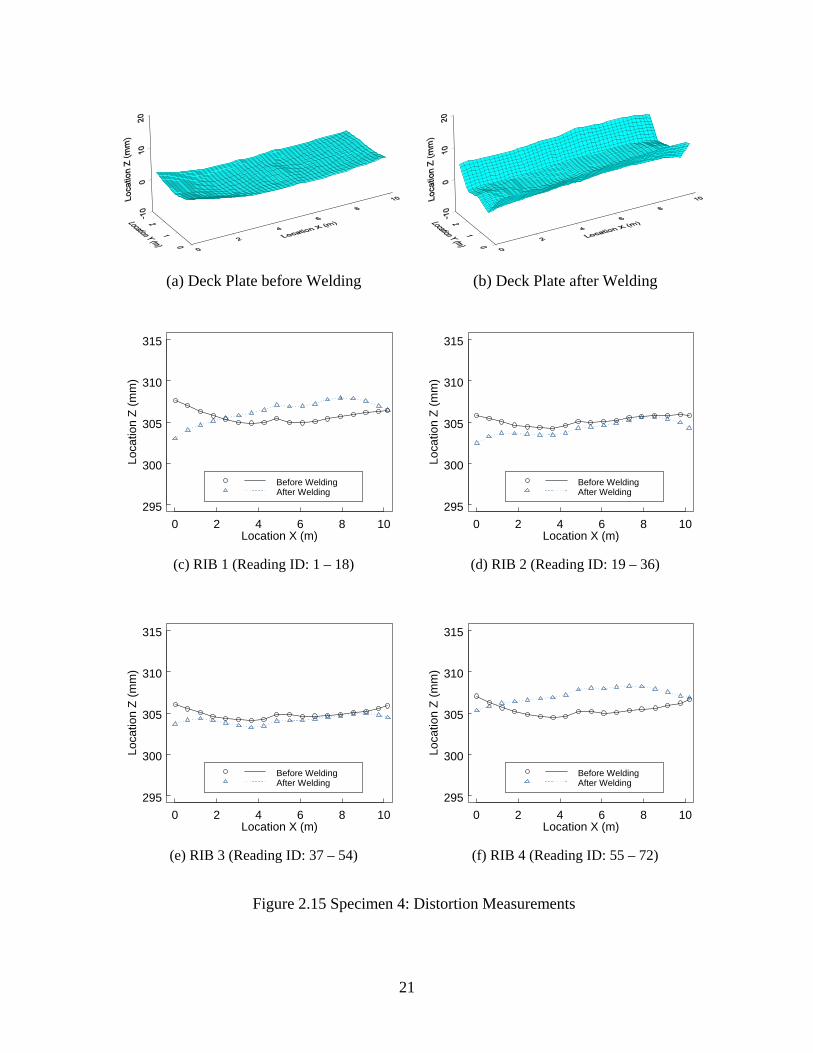
2.1.4 Distortion Measurements
Distortion measurements on the panels were performed with the Laser Tracker
system. Measurements were taken from 9 locations across the width of the panel and at
the center of each rib, center of the space between adjacent two ribs, and at each edge of
the panel. These measurements were taken at 600 mm spacing along the length of the
panel. Figure 2.11 shows the locations of the measurement points. Figures 2.12 to 2.17
show plots of distortion measurements for each of the six specimens. From the
measurements, it was shown that the maximum height deviation of the deck plate was
approximately 20 mm. Plots of the deck distortions for comparison of six specimens are
shown in Figures 2.18 and 2.19. From the plots, it was found that the two effectively pre-
cambered specimens (Specimens 4 and 5) had less welding distortion than the other
specimens. No strain measurements of the components were taken during fabrication.
17
RIB 4 RIB 3 RIB 2 RIB 1
16 @ 610 mm
460 mm25.4 mm offset from edge (Typ.)
305 mm
X
Y
Measuringlocation (Typ.)
136377273 72 37 36 1
90 55 55 54 1954 19 18 18
: ID for deck plate
: ID for ribs
1 243 Welding Sequence
Z
Figure 2.11 Location of Distortion Measurements

18
(a) Deck Plate before Welding (b) Deck Plate after Welding
0 2 4 6 8 10295
300
305
310
315
Location X (m)
Loca
tion
Z (m
m)
Before WeldingAfter Welding
0 2 4 6 8 10
295
300
305
310
315
Location X (m)
Loca
tion
Z (m
m)
Before WeldingAfter Welding
(c) RIB 1 (Reading ID: 1 – 18) (d) RIB 2 (Reading ID: 19 – 36)
0 2 4 6 8 10295
300
305
310
315
Location X (m)
Loca
tion
Z (m
m)
Before WeldingAfter Welding
0 2 4 6 8 10
295
300
305
310
315
Location X (m)
Loca
tion
Z (m
m)
Before WeldingAfter Welding
(e) RIB 3 (Reading ID: 37 – 54) (f) RIB 4 (Reading ID: 55 – 72)
Figure 2.12 Specimen 1: Distortion Measurements
19
(a) Deck Plate before Welding (b) Deck Plate after Welding
0 2 4 6 8 10295
300
305
310
315
Location X (m)
Loca
tion
Z (m
m)
Before WeldingAfter Welding
0 2 4 6 8 10
295
300
305
310
315
Location X (m)
Loca
tion
Z (m
m)
Before WeldingAfter Welding
(c) RIB 1 (Reading ID: 1 – 18) (d) RIB 2 (Reading ID: 19 – 36)
0 2 4 6 8 10295
300
305
310
315
Location X (m)
Loca
tion
Z (m
m)
Before WeldingAfter Welding
0 2 4 6 8 10
295
300
305
310
315
Location X (m)
Loca
tion
Z (m
m)
Before WeldingAfter Welding
(e) RIB 3 (Reading ID: 37 – 54) (f) RIB 4 (Reading ID: 55 – 72)
Figure 2.13 Specimen 2: Distortion Measurements
20
(a) Deck Plate before Welding (b) Deck Plate after Welding
0 2 4 6 8 10295
300
305
310
315
Location X (m)
Loca
tion
Z (m
m)
Before WeldingAfter Welding
0 2 4 6 8 10
295
300
305
310
315
Location X (m)
Loca
tion
Z (m
m)
Before WeldingAfter Welding
(c) RIB 1 (Reading ID: 1 – 18) (d) RIB 2 (Reading ID: 19 – 36)
0 2 4 6 8 10295
300
305
310
315
Location X (m)
Loca
tion
Z (m
m)
Before WeldingAfter Welding
0 2 4 6 8 10
295
300
305
310
315
Location X (m)
Loca
tion
Z (m
m)
Before WeldingAfter Welding
(e) RIB 3 (Reading ID: 37 – 54) (f) RIB 4 (Reading ID: 55 – 72)
Figure 2.14 Specimen 3: Distortion Measurements
21
(a) Deck Plate before Welding (b) Deck Plate after Welding
0 2 4 6 8 10295
300
305
310
315
Location X (m)
Loca
tion
Z (m
m)
Before WeldingAfter Welding
0 2 4 6 8 10
295
300
305
310
315
Location X (m)
Loca
tion
Z (m
m)
Before WeldingAfter Welding
(c) RIB 1 (Reading ID: 1 – 18) (d) RIB 2 (Reading ID: 19 – 36)
0 2 4 6 8 10295
300
305
310
315
Location X (m)
Loca
tion
Z (m
m)
Before WeldingAfter Welding
0 2 4 6 8 10
295
300
305
310
315
Location X (m)
Loca
tion
Z (m
m)
Before WeldingAfter Welding
(e) RIB 3 (Reading ID: 37 – 54) (f) RIB 4 (Reading ID: 55 – 72)
Figure 2.15 Specimen 4: Distortion Measurements
22
(a) Deck Plate before Welding (b) Deck Plate after Welding
0 2 4 6 8 10295
300
305
310
315
Location X (m)
Loca
tion
Z (m
m)
Before WeldingAfter Welding
0 2 4 6 8 10
295
300
305
310
315
Location X (m)
Loca
tion
Z (m
m)
Before WeldingAfter Welding
(c) RIB 1 (Reading ID: 1 – 18) (d) RIB 2 (Reading ID: 19 – 36)
0 2 4 6 8 10295
300
305
310
315
Location X (m)
Loca
tion
Z (m
m)
Before WeldingAfter Welding
0 2 4 6 8 10
295
300
305
310
315
Location X (m)
Loca
tion
Z (m
m)
Before WeldingAfter Welding
(e) RIB 3 (Reading ID: 37 – 54) (f) RIB 4 (Reading ID: 55 – 72)
Figure 2.16 Specimen 5: Distortion Measurements
23
(a) Deck Plate before Welding (b) Deck Plate after Welding
0 2 4 6 8 10295
300
305
310
315
Location X (m)
Loca
tion
Z (m
m)
Before WeldingAfter Welding
0 2 4 6 8 10
295
300
305
310
315
Location X (m)
Loca
tion
Z (m
m)
Before WeldingAfter Welding
(c) RIB 1 (Reading ID: 1 – 18) (d) RIB 2 (Reading ID: 19 – 36)
0 2 4 6 8 10295
300
305
310
315
Location X (m)
Loca
tion
Z (m
m)
Before WeldingAfter Welding
0 2 4 6 8 10
295
300
305
310
315
Location X (m)
Loca
tion
Z (m
m)
Before WeldingAfter Welding
(e) RIB 3 (Reading ID: 37 – 54) (f) RIB 4 (Reading ID: 55 – 72)
Figure 2.17 Specimen 6: Distortion Measurements
24
0 2 4 6 8 10-20-15-10
-505
101520
Dis
torti
on (m
m)
Location (m)
Specimen 1Specimen 2Specimen 3
Specimen 4Specimen 5Specimen 6
0 2 4 6 8 10
-20-15-10
-505
101520
Dis
torti
on (m
m)
Location (m)
Specimen 1Specimen 2Specimen 3
Specimen 4Specimen 5Specimen 6
(a) Edge (b) Center
Figure 2.18 Deck Distortion in the Longitudinal Direction
0.0 0.5 1.0 1.5 2.0 2.5 3.0-20-15-10
-505
101520
Dis
torti
on (m
m)
Location (m)
Specimen 1Specimen 2Specimen 3
Specimen 4Specimen 5Specimen 6
0.0 0.5 1.0 1.5 2.0 2.5 3.0
-20-15-10
-505
101520
Dis
torti
on (m
m)
Location (m)
Specimen 1Specimen 2Specimen 3
Specimen 4Specimen 5Specimen 6
(a) Midspan (b) Interior Support Diaphragm
Figure 2.19 Deck Distortion in the Transverse Direction
2.1.5 Intersection of Closed Rib to Diaphragms
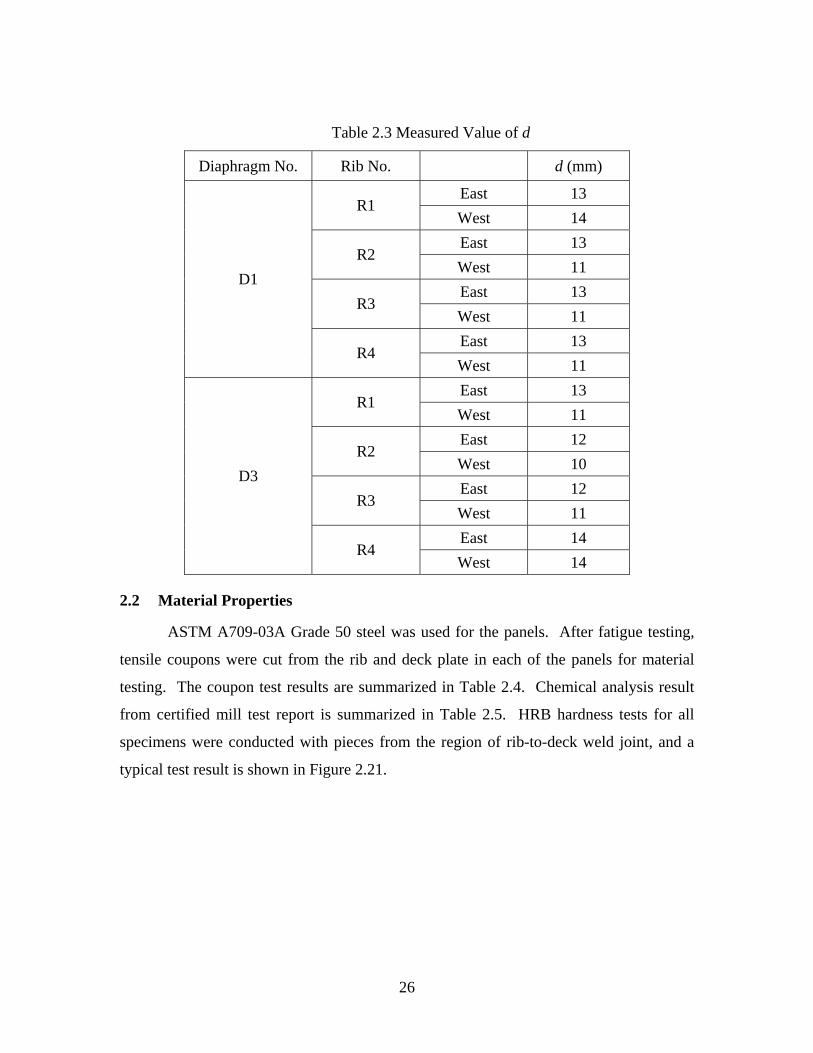
As explained in Section 1.1, the AASHTO Specification requires at least a
distance of 25 mm from the top of the free cutout to the bottom of the bulkhead plate [see
dimension d in Figure 2.20(a)]. Figure 2.20(b) and (c) shows the photo views of the
corresponding detail of one fabricated specimen (Specimen 1). The specified d in the
design drawing was 20 mm, which was slightly less than the required 25 mm (see Figure
2.4). The measured values of d are summarized in Table 2.3. As shown in the table, the
measured d values were less than the required 25 mm.
25
Bulkhead
Diaphragm
d
(a) Designation of distance “d”
(b) Left Side (c) Right Side
Figure 2.20 Intersection of Rib with Diaphragms
d
26
Table 2.3 Measured Value of d
Diaphragm No. Rib No. d (mm)
East 13 R1
West 14 East 13
R2 West 11 East 13
R3 West 11 East 13
D1
R4 West 11 East 13
R1 West 11 East 12
R2 West 10 East 12
R3 West 11 East 14
D3
R4 West 14
2.2 Material Properties
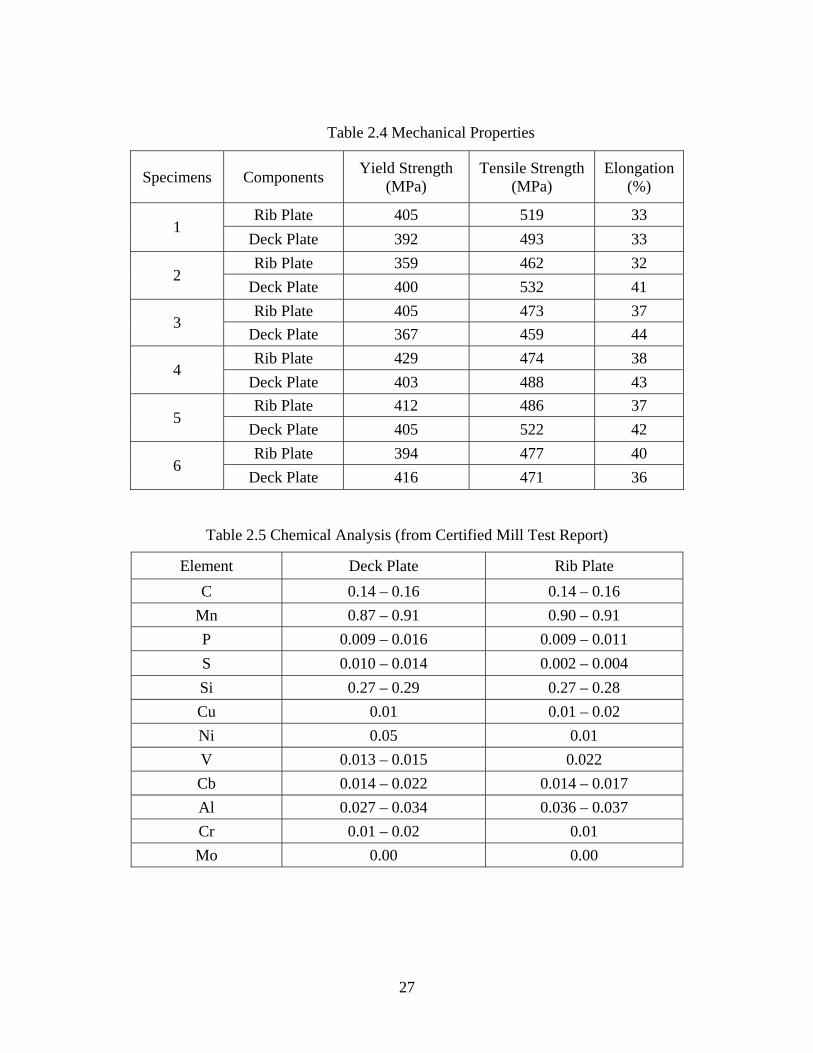
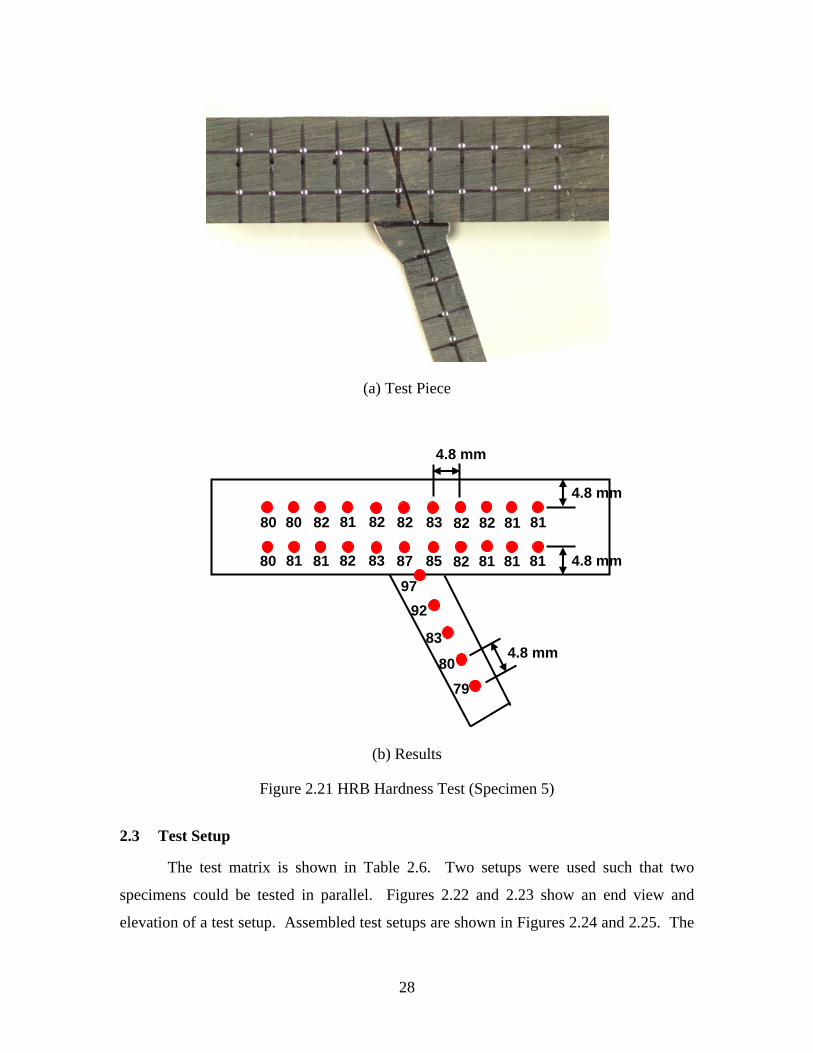
ASTM A709-03A Grade 50 steel was used for the panels. After fatigue testing,
tensile coupons were cut from the rib and deck plate in each of the panels for material
testing. The coupon test results are summarized in Table 2.4. Chemical analysis result
from certified mill test report is summarized in Table 2.5. HRB hardness tests for all
specimens were conducted with pieces from the region of rib-to-deck weld joint, and a
typical test result is shown in Figure 2.21.
27
Table 2.4 Mechanical Properties
Specimens Components Yield Strength (MPa)
Tensile Strength (MPa)
Elongation (%)
Rib Plate 405 519 33 1
Deck Plate 392 493 33 Rib Plate 359 462 32
2 Deck Plate 400 532 41 Rib Plate 405 473 37
3 Deck Plate 367 459 44 Rib Plate 429 474 38
4 Deck Plate 403 488 43 Rib Plate 412 486 37
5 Deck Plate 405 522 42 Rib Plate 394 477 40
6 Deck Plate 416 471 36
Table 2.5 Chemical Analysis (from Certified Mill Test Report)
Element Deck Plate Rib Plate C 0.14 – 0.16 0.14 – 0.16
Mn 0.87 – 0.91 0.90 – 0.91 P 0.009 – 0.016 0.009 – 0.011 S 0.010 – 0.014 0.002 – 0.004 Si 0.27 – 0.29 0.27 – 0.28 Cu 0.01 0.01 – 0.02 Ni 0.05 0.01 V 0.013 – 0.015 0.022 Cb 0.014 – 0.022 0.014 – 0.017 Al 0.027 – 0.034 0.036 – 0.037 Cr 0.01 – 0.02 0.01 Mo 0.00 0.00
28
(a) Test Piece
(b) Results
Figure 2.21 HRB Hardness Test (Specimen 5)
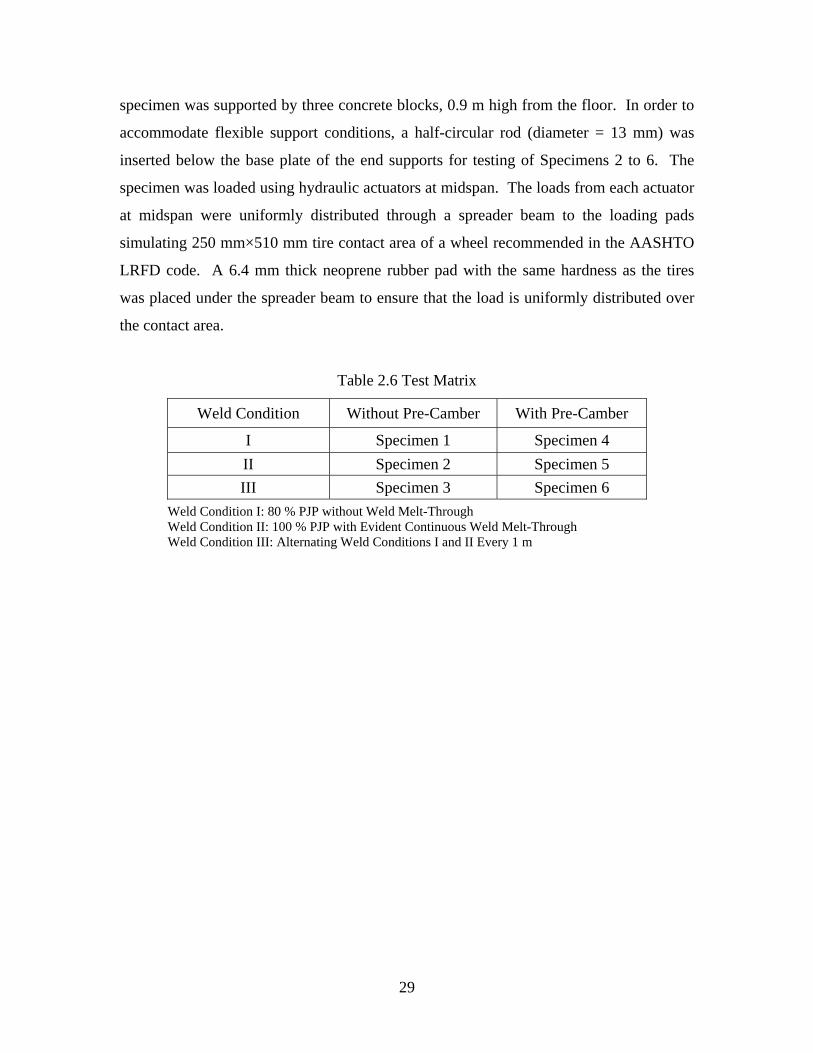
2.3 Test Setup
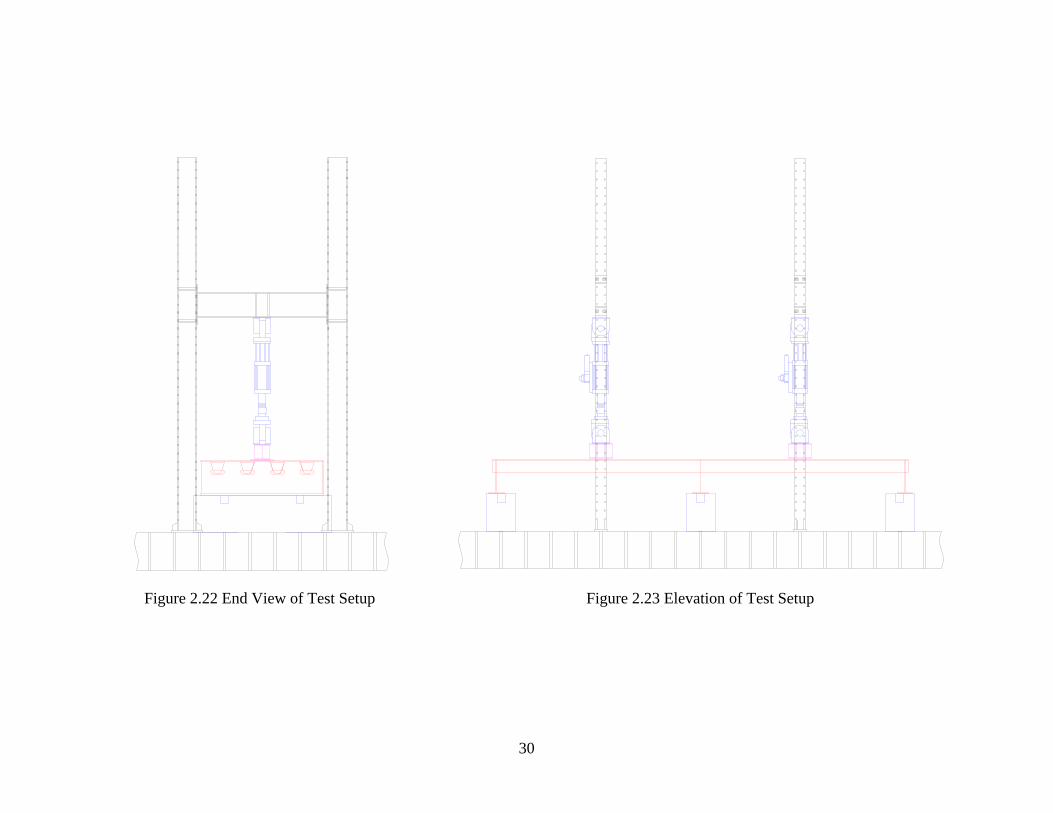
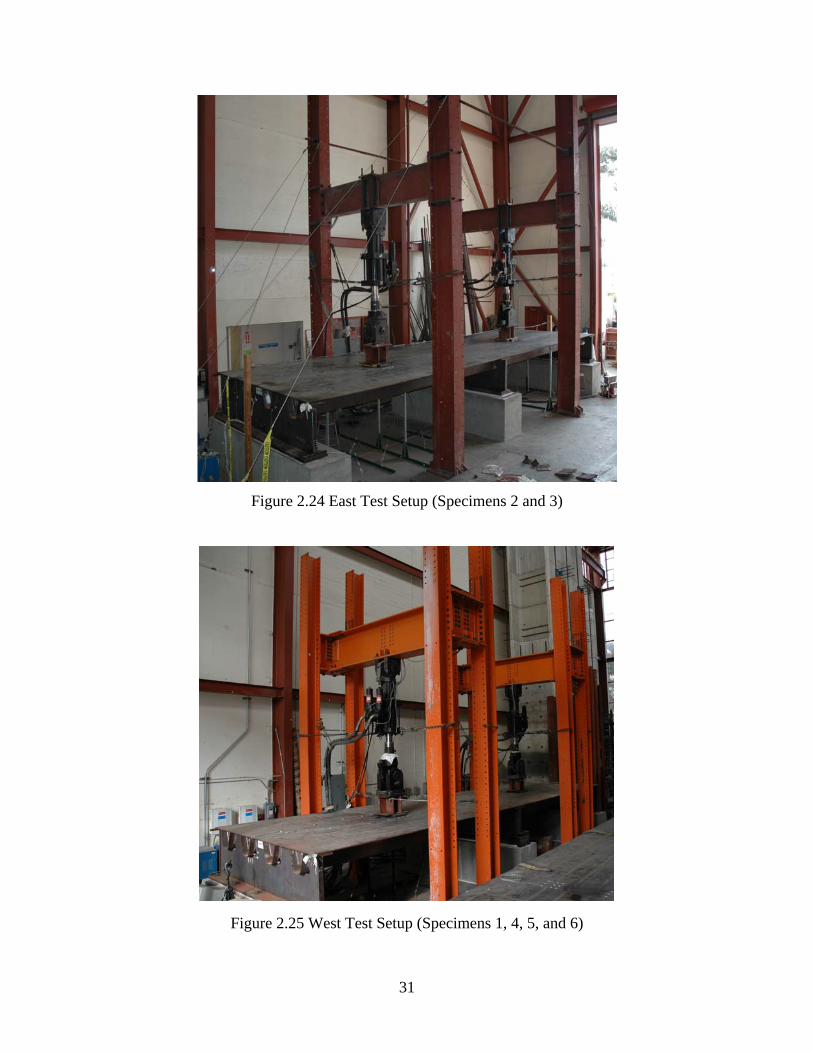
The test matrix is shown in Table 2.6. Two setups were used such that two
specimens could be tested in parallel. Figures 2.22 and 2.23 show an end view and
elevation of a test setup. Assembled test setups are shown in Figures 2.24 and 2.25. The
4.8 mm
4.8 mm
4.8 mm
4.8 mm
80 80
80 81
82
81
81
82
82
83
82
87
83
85
82
82
82
81
81
81
81
81 97
92
83
80 79
29
specimen was supported by three concrete blocks, 0.9 m high from the floor. In order to
accommodate flexible support conditions, a half-circular rod (diameter = 13 mm) was
inserted below the base plate of the end supports for testing of Specimens 2 to 6. The
specimen was loaded using hydraulic actuators at midspan. The loads from each actuator
at midspan were uniformly distributed through a spreader beam to the loading pads
simulating 250 mm×510 mm tire contact area of a wheel recommended in the AASHTO
LRFD code. A 6.4 mm thick neoprene rubber pad with the same hardness as the tires
was placed under the spreader beam to ensure that the load is uniformly distributed over
the contact area.
Table 2.6 Test Matrix
Weld Condition Without Pre-Camber With Pre-Camber
I Specimen 1 Specimen 4 II Specimen 2 Specimen 5 III Specimen 3 Specimen 6
Weld Condition I: 80 % PJP without Weld Melt-Through Weld Condition II: 100 % PJP with Evident Continuous Weld Melt-Through Weld Condition III: Alternating Weld Conditions I and II Every 1 m
30
Figure 2.22 End View of Test Setup Figure 2.23 Elevation of Test Setup
31
Figure 2.24 East Test Setup (Specimens 2 and 3)
Figure 2.25 West Test Setup (Specimens 1, 4, 5, and 6)

32
2.4 Loading
The 2007 AASHTO LRFD Specification specifies a design truck HS 20. For
fatigue design, a factor of 0.75 is used for the HS20, meaning implicitly HS15 truck. The
load of each axle for HS15 is 108.75 kN (0.75×145 kN), and the spacing between the
108.75 kN axles is specified as 9000 mm. A half of each axle was considered for loading
scheme because the width of the test specimen could not accommodate a full axle load of
truck. A single axle load was centered at midspan using hydraulic actuators for testing of
Specimens 2 to 6. The loads from actuators at midspan were out-of-phase to simulate the
effect of a truck passage. The AASHTO Specification uses 2×(HS15+15% Impact) for
calculating the maximum stress range. Testing at Lehigh University (Tsakopoulos 1999)
reported that fatigue cracking under the single axle loads away from the diaphragm was
not observed at the rib-to-deck connection. Based on the field measurements on
orthotropic decks, it was also demonstrated that the specified load of 2×(HS15+15%
Impact) was not conservative for certain deck elements such as the rib-to-diaphragm
connections and other elements such as expansion joints. For the rib-to-deck connection,
it was close to a factor of 2. Based on the above information, an axle load of
3×(HS15+15% Impact) was used (Fisher 2005). The magnitude of the loading on the
single axle was 188 kN based on three times HS15 plus 15% impact (i.e., 3×108.75
kN×1.15×½ (a half axle) = 188 kN). Testing of the first specimen (Specimen 1) was
carried out at a full axle load, 380 kN, on the dual axles (tandem configuration) centered
at midspan. Figure 2.26 shows a loading scheme used for testing of Specimen 1, and
Figure 2.27 for testing of Specimens 2 through 6.
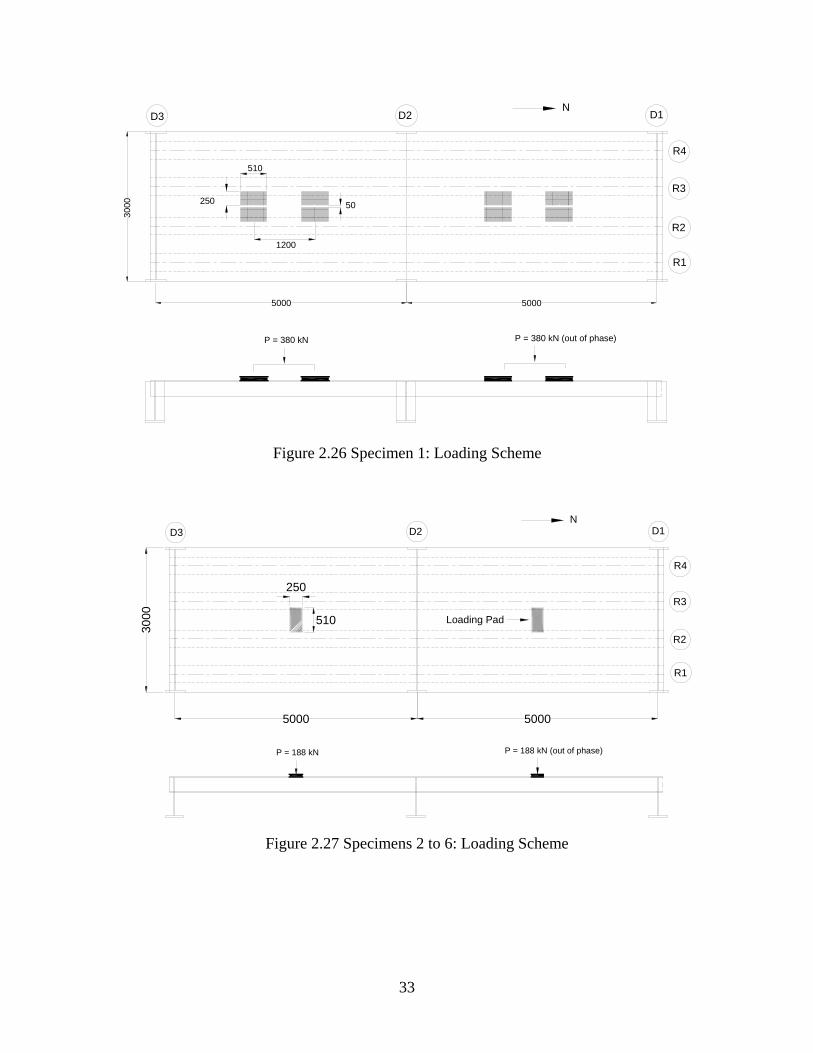
33
P = 380 kN (out of phase)
3000
50005000
510
250
1200
50
P = 380 kN
R4
R3
R2
R1
D3 D2 D1N
Figure 2.26 Specimen 1: Loading Scheme
P = 188 kN (out of phase)
3000
50005000
510
250
P = 188 kN
R4
R3
R2
R1
D3 D2 D1N
Loading Pad
Figure 2.27 Specimens 2 to 6: Loading Scheme
34
2.5 Instrumentation
2.5.1 General
The test specimens were instrumented with strain gages at fatigue sensitive
connection details and displacement transducers at midspan. Either uni-axial strain gages
or strain gage rosettes were used for monitoring local distribution of cyclic stresses at
details of rib-to-deck welds and diaphragms. The strain gage locations for Specimens 2
to 6, which vary slightly from one specimen to the other, were determined from both the
finite element analysis and test results of Specimen 1.
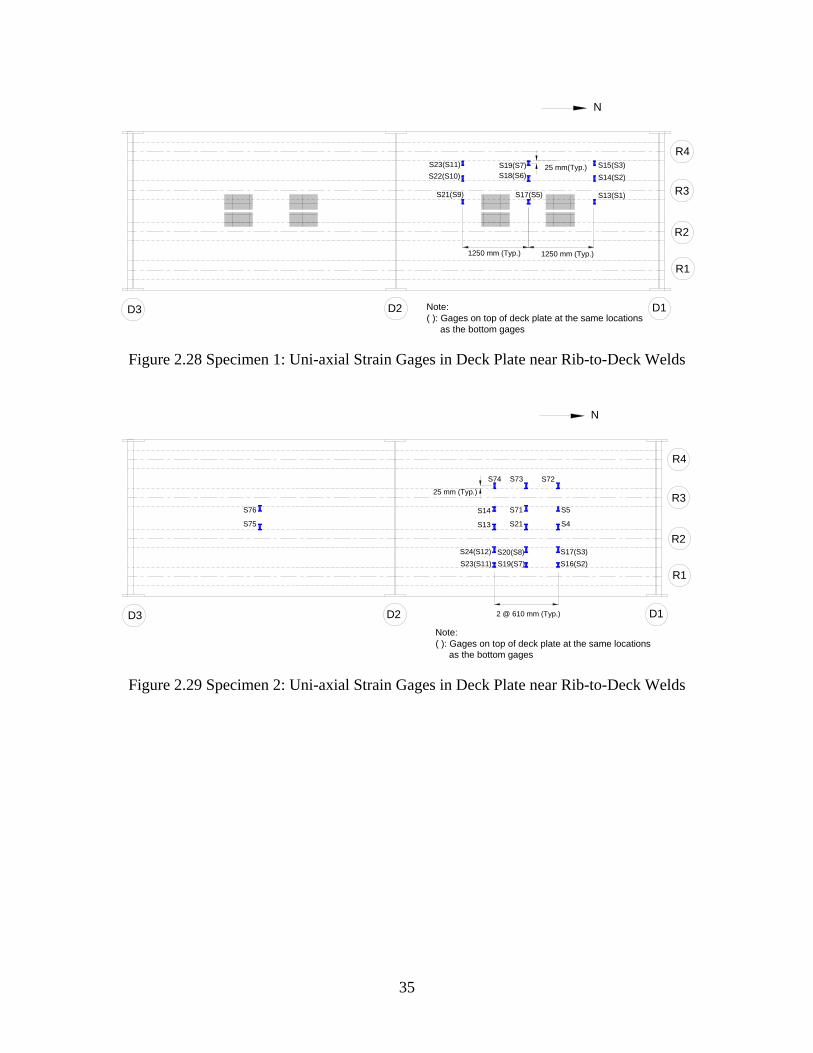
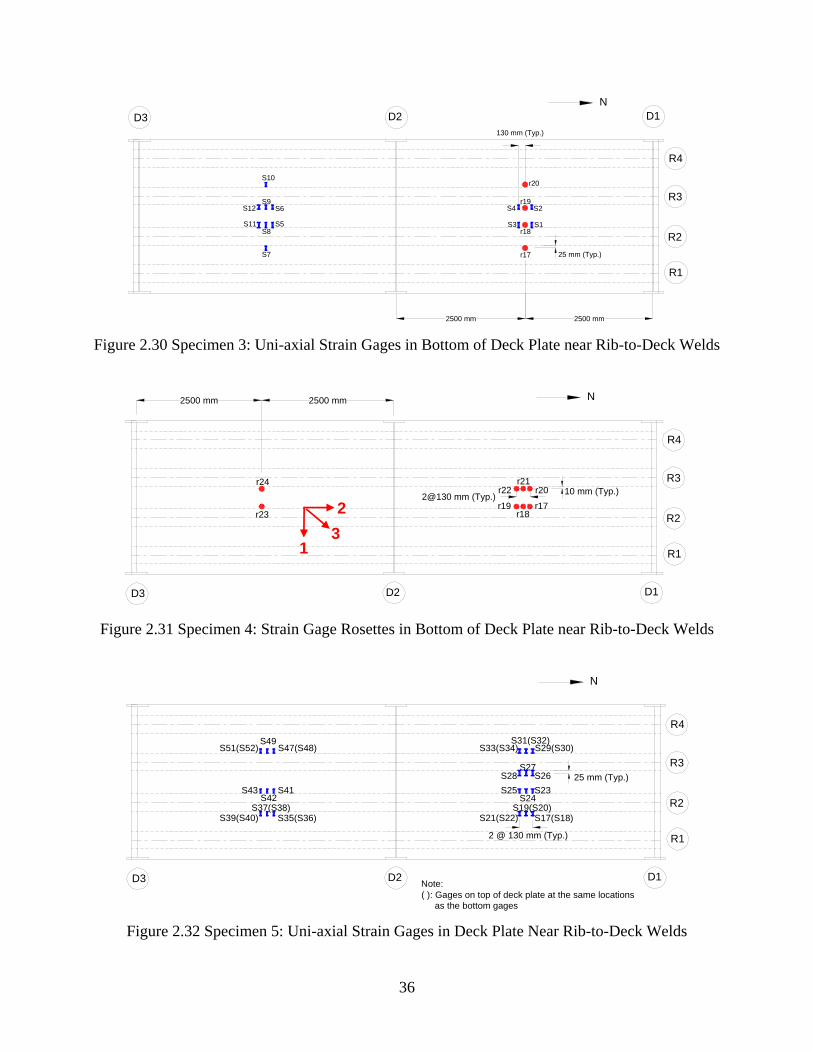
2.5.2 Strain Gages in Deck Plate near Rib-to-Deck Welds
Figures 2.28 to 2.33 show the locations of strain gages placed on the deck plate to
measure the transverse strains, perpendicular to the rib-to-deck welds. Most strain gages
were placed on the bottom of the deck plate. Some strain gages, labeled in parentheses in
the figures, were placed on the top of the deck plate. The strain gages on the bottom of
the deck plate were positioned 10 mm or 25 mm away from the weld toe. As shown in
the figures, both uni-axial strain gages and component 1 of strain gage rosettes were
oriented in the transverse (or width) direction, perpendicular to the rib-to-deck welds, and
component 2 was oriented in the longitudinal direction, parallel to the rib-to-deck weld.
The strain gages in Specimen 1 were placed at quarter points of the north span in the
longitudinal direction. The strain gages in Specimens 3 to 6 were placed under the
loading pads with a spacing of 130 mm in the longitudinal direction.
35
D3 D2 D1
25 mm(Typ.)
1250 mm (Typ.)
N
R3
R1
R2
R4
S13(S1)
S14(S2)S15(S3)
S17(S5)
S18(S6)S19(S7)
S21(S9)
S22(S10)S23(S11)
1250 mm (Typ.)
Note:( ): Gages on top of deck plate at the same locations as the bottom gages
Figure 2.28 Specimen 1: Uni-axial Strain Gages in Deck Plate near Rib-to-Deck Welds
S4
S14 S71 S5
S73
S75
S76
Note:( ): Gages on top of deck plate at the same locations as the bottom gages
D3 D2 D1
25 mm (Typ.)
2 @ 610 mm (Typ.)
S24(S12) S20(S8)
S13 S21
S17(S3)
S72S74
N
R3
R1
R2
R4
S23(S11) S19(S7) S16(S2)
Figure 2.29 Specimen 2: Uni-axial Strain Gages in Deck Plate near Rib-to-Deck Welds
36
S3r18
S1
S2r19
S8
S9
S10
S7
S6S12
S5S11
D3 D2 D1
25 mm (Typ.)
130 mm (Typ.)
r17
r20
N
R3
R1
R2
R4
S4
2500 mm 2500 mm Figure 2.30 Specimen 3: Uni-axial Strain Gages in Bottom of Deck Plate near Rib-to-Deck Welds
r24
r23
2500 mm 2500 mm
D3 D2 D1
10 mm (Typ.)2@130 mm (Typ.)
r21r20
N
R3
R1
R2
R4
r22
r18r17r19
Figure 2.31 Specimen 4: Strain Gage Rosettes in Bottom of Deck Plate near Rib-to-Deck Welds
Note:( ): Gages on top of deck plate at the same locations as the bottom gages
D3 D2 D1
25 mm (Typ.)
2 @ 130 mm (Typ.)
S21(S22) S17(S18)
S27
S23
S19(S20)
S29(S30)
N
R3
R1
R2
R4
S33(S34)S31(S32)
S28 S26S25
S39(S40) S35(S36)
S41
S37(S38)
S47(S48)S51(S52)S49
S43S24S42
Figure 2.32 Specimen 5: Uni-axial Strain Gages in Deck Plate Near Rib-to-Deck Welds
2
1 3
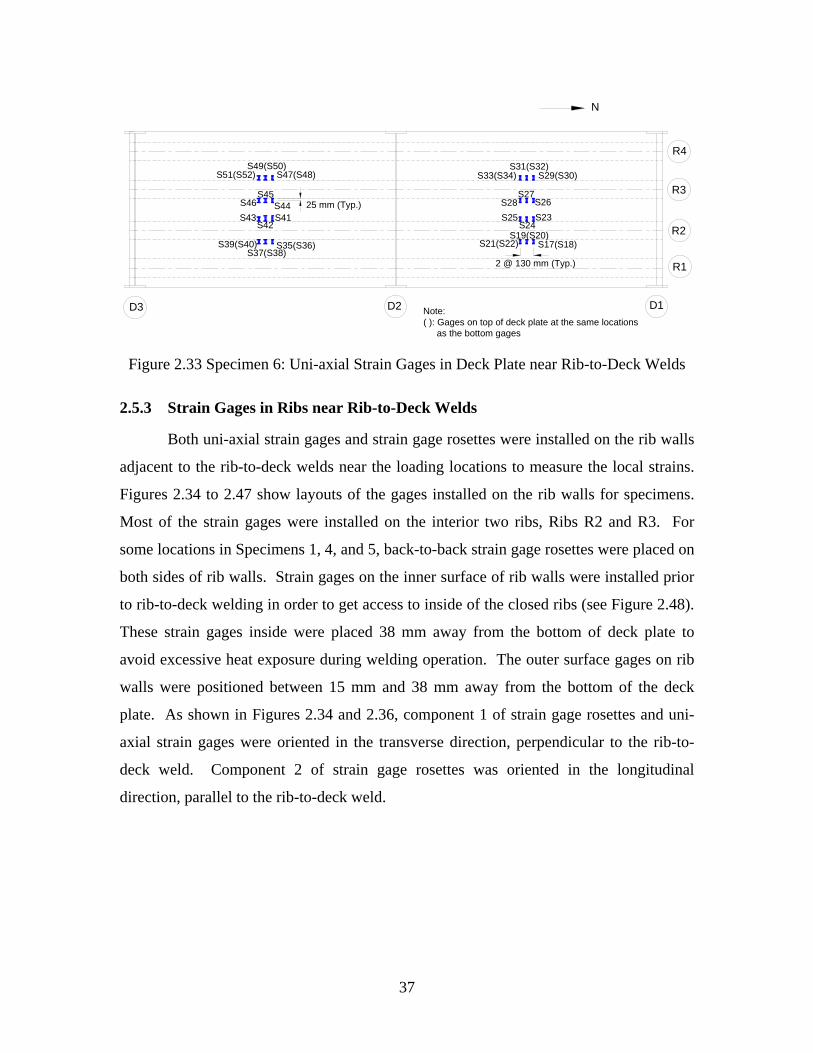
37
S23S25S24
S26S27
S28S41
S42
S45S44
D3 D2 D1
25 mm (Typ.)
2 @ 130 mm (Typ.)
S21(S22) S17(S18)S19(S20)
S29(S30)
N
R3
R1
R2
R4
S33(S34)S31(S32)
S39(S40) S35(S36)S37(S38)
S47(S48)S51(S52)S49(S50)
S43S46
Note:( ): Gages on top of deck plate at the same locations as the bottom gages
Figure 2.33 Specimen 6: Uni-axial Strain Gages in Deck Plate near Rib-to-Deck Welds
2.5.3 Strain Gages in Ribs near Rib-to-Deck Welds
Both uni-axial strain gages and strain gage rosettes were installed on the rib walls
adjacent to the rib-to-deck welds near the loading locations to measure the local strains.
Figures 2.34 to 2.47 show layouts of the gages installed on the rib walls for specimens.
Most of the strain gages were installed on the interior two ribs, Ribs R2 and R3. For
some locations in Specimens 1, 4, and 5, back-to-back strain gage rosettes were placed on
both sides of rib walls. Strain gages on the inner surface of rib walls were installed prior
to rib-to-deck welding in order to get access to inside of the closed ribs (see Figure 2.48).
These strain gages inside were placed 38 mm away from the bottom of deck plate to
avoid excessive heat exposure during welding operation. The outer surface gages on rib
walls were positioned between 15 mm and 38 mm away from the bottom of the deck
plate. As shown in Figures 2.34 and 2.36, component 1 of strain gage rosettes and uni-
axial strain gages were oriented in the transverse direction, perpendicular to the rib-to-
deck weld. Component 2 of strain gage rosettes was oriented in the longitudinal
direction, parallel to the rib-to-deck weld.
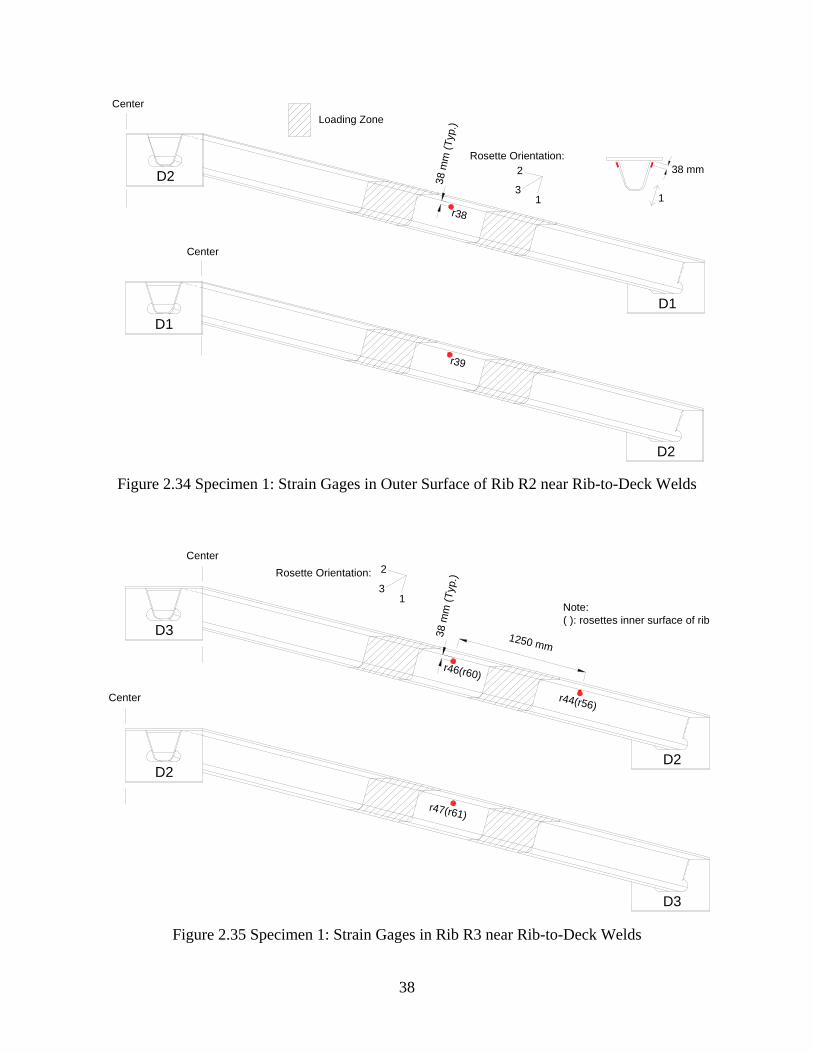
38
r38
D2
D1
38 m
m (T
yp.)
Rosette Orientation:
CenterLoading Zone
13
2 38 mm
1
r39
D1
D2
Center
Figure 2.34 Specimen 1: Strain Gages in Outer Surface of Rib R2 near Rib-to-Deck Welds
1250 mm
r46(r60)
r44(r56)
D3
D2
38 m
m (T
yp.)
Center
r47(r61)
D2
D3
Center
Rosette Orientation:3
2
1Note:( ): rosettes inner surface of rib
Figure 2.35 Specimen 1: Strain Gages in Rib R3 near Rib-to-Deck Welds
39
Rosette Orientation:
1610 mm
[S33]
D2
D1
38 m
m (T
yp.)
Center
3
2
1
Note:[ ]: Gage on opposite span,between D2 and D3
38 mm
r19
610 mm
[S34]
D1
D2
Center
r24[S32]
Figure 2.36 Specimen 2: Strain Gages in Outer Surface of Rib R2 near Rib-to-Deck Welds
610 mm
S39
D2
D1
38 m
m (T
yp.)Center
610 mm
S40
D1
D2
Center
S42
S41
Figure 2.37 Specimen 2: Strain Gages in Outer Surface of Rib R3 near Rib-to-Deck Welds
40
610 mm
S47
D2
D1
38 m
m (T
yp.)End
S49
610 mm
S45
Figure 2.38 Specimen 2: Strain Gages in Outer Surface of Rib R4 near Rib-to-Deck Welds
Rosette Orientation:
r1[r2]
D2
D1
25 m
m (T
yp.)
Center
2@130 mm
[r7] r5[r6]
D1
D2
Center
[r8]
3
2
1
Note:[ ]: Gage on opposite span, between D2 and D3
Figure 2.39 Specimen 3: Strain Gages in Outer Surface of Rib R2 near Rib-to-Deck Welds
41
Rosette Orientation:
r10[r13]
D2
D1
25 m
m (T
yp.)
Center
r15[r16]
D1
D2
Center
3
2
1
Note:[ ]: Gage on opposite span, between D2 and D3
2@130 mm
[r12]r11[r12]
Figure 2.40 Specimen 3: Strain Gages in Outer Surface of Rib R3 near Rib-to-Deck Welds
Rosette Orientation:
2@130 mm
r2[r4] r3
D1
D2
Center
r1
3
2
1
Note:[ ]: Gage on opposite span, between D2 and D3
15 m
m (T
yp.)
Figure 2.41 Specimen 4: Strain Gages in Outer Surface of Rib R2 near Rib-to-Deck Welds
42
3
2
1
Note:[ ]: Gage on opposite span, between D2 and D3
Rosette Orientation:
2@130 mm
r6[r9]
r5
D2
D1
Center
r8
15 m
m (T
yp.)
38 mmr7
Figure 2.42 Specimen 4: Strain Gages in Outer Surface of Rib R3 near Rib-to-Deck Welds
Rosette Orientation:
r10
D2
D1
38 m
m (T
yp.)
Center
1250 mm
r12 3
2
1
r11
D1
D2
Center
Figure 2.43 Specimen 4: Strain Gages in Inner Surface of Rib R3 near Rib-to-Deck Welds
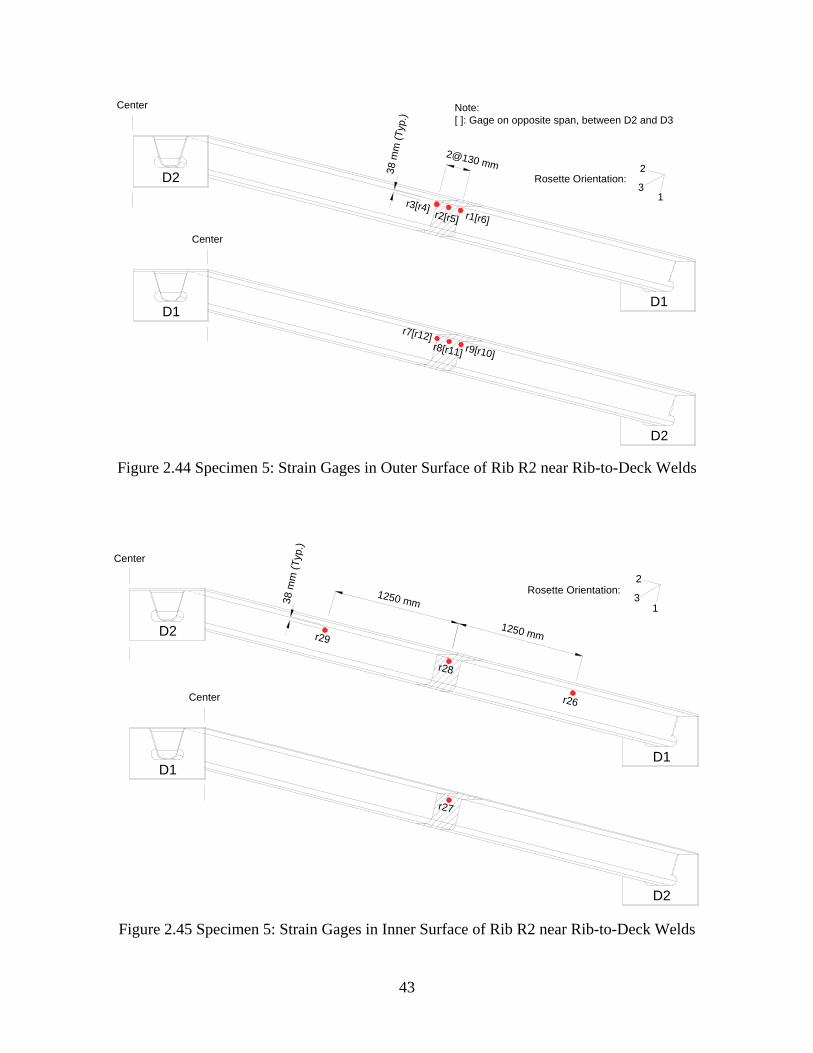
43
Rosette Orientation:
2@130 mm
r2[r5] r1[r6]
D2
D1
Center
r3[r4]
3
2
1
Note:[ ]: Gage on opposite span, between D2 and D3
38 m
m (T
yp.)
r9[r10]
D1
D2
Center
r7[r12]r8[r11]
Figure 2.44 Specimen 5: Strain Gages in Outer Surface of Rib R2 near Rib-to-Deck Welds
Rosette Orientation:
r28
D2
D1
38 m
m (T
yp.)
Center
1250 mm
r29
3
2
1
r27
D1
D2
Center
1250 mm
r26
Figure 2.45 Specimen 5: Strain Gages in Inner Surface of Rib R2 near Rib-to-Deck Welds
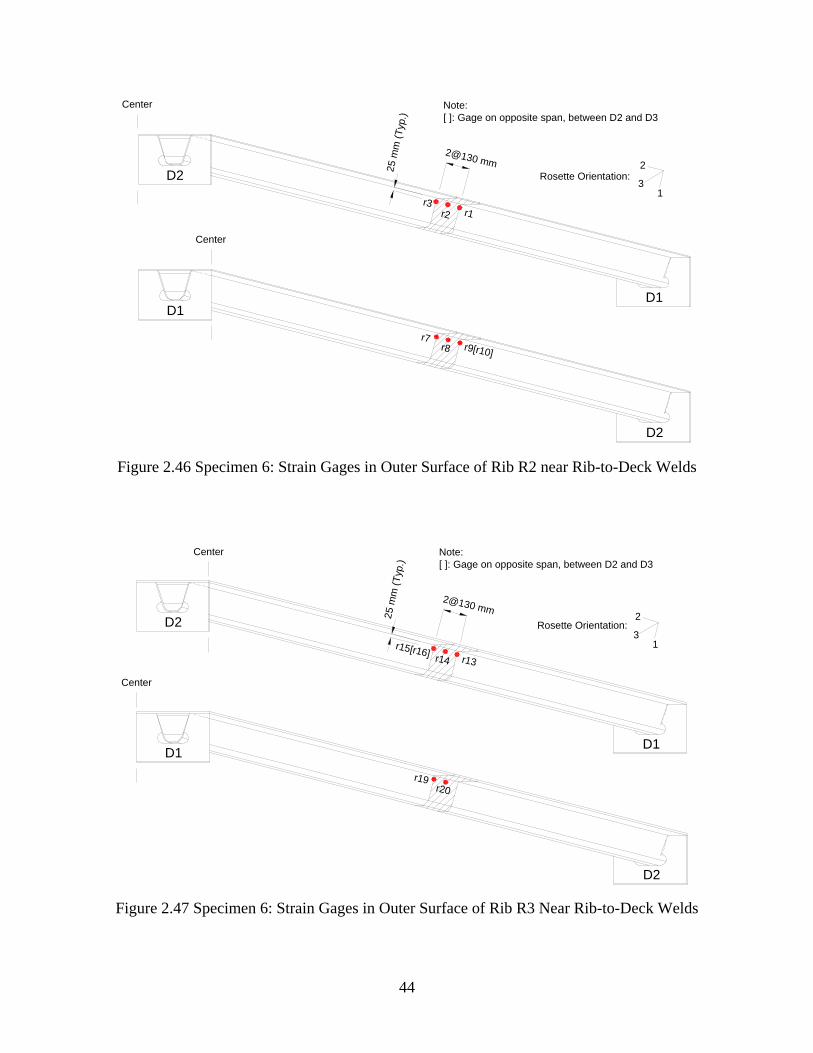
44
Rosette Orientation:
2@130 mm
r2 r1
D2
D1
Center
r3
3
2
1
Note:[ ]: Gage on opposite span, between D2 and D3
25 m
m (T
yp.)
r9[r10]
D1
D2
Center
r7r8
Figure 2.46 Specimen 6: Strain Gages in Outer Surface of Rib R2 near Rib-to-Deck Welds
Rosette Orientation:
2@130 mm
r14 r13
D2
D1
Center
r15[r16]
3
2
1
Note:[ ]: Gage on opposite span, between D2 and D3
25 m
m (T
yp.)
D1
D2
Center
r19r20
Figure 2.47 Specimen 6: Strain Gages in Outer Surface of Rib R3 Near Rib-to-Deck Welds
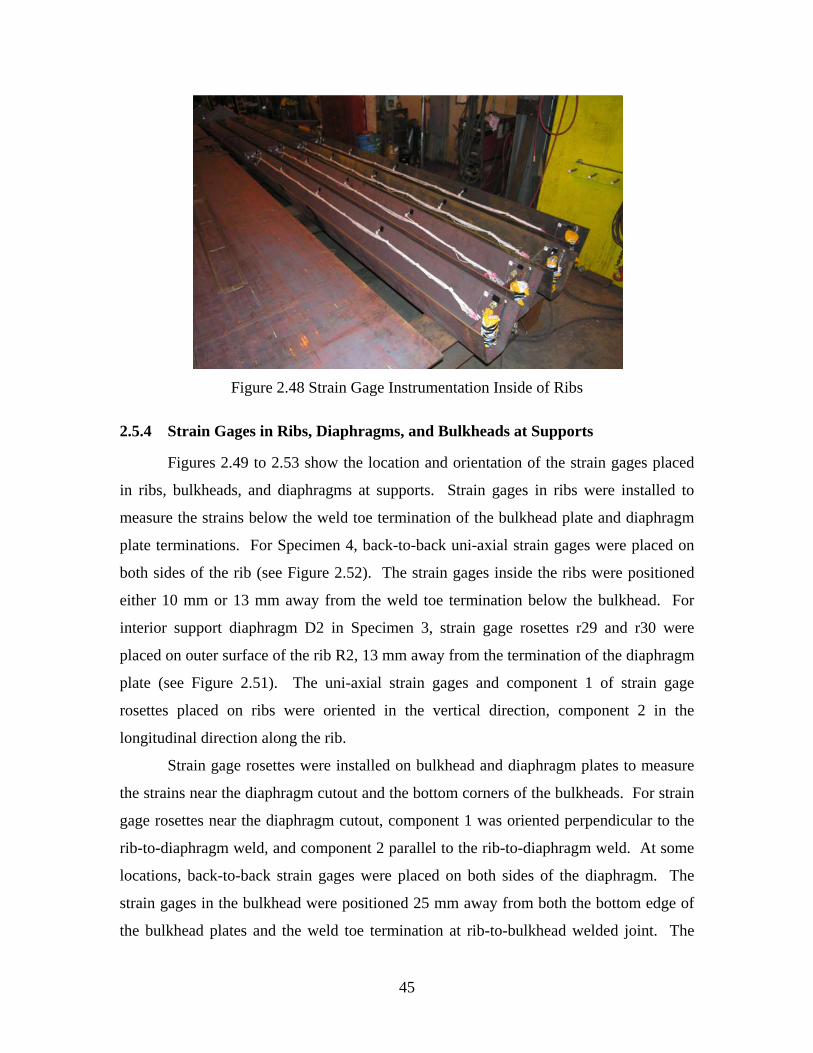
45
Figure 2.48 Strain Gage Instrumentation Inside of Ribs
2.5.4 Strain Gages in Ribs, Diaphragms, and Bulkheads at Supports
Figures 2.49 to 2.53 show the location and orientation of the strain gages placed
in ribs, bulkheads, and diaphragms at supports. Strain gages in ribs were installed to
measure the strains below the weld toe termination of the bulkhead plate and diaphragm
plate terminations. For Specimen 4, back-to-back uni-axial strain gages were placed on
both sides of the rib (see Figure 2.52). The strain gages inside the ribs were positioned
either 10 mm or 13 mm away from the weld toe termination below the bulkhead. For
interior support diaphragm D2 in Specimen 3, strain gage rosettes r29 and r30 were
placed on outer surface of the rib R2, 13 mm away from the termination of the diaphragm
plate (see Figure 2.51). The uni-axial strain gages and component 1 of strain gage
rosettes placed on ribs were oriented in the vertical direction, component 2 in the
longitudinal direction along the rib.
Strain gage rosettes were installed on bulkhead and diaphragm plates to measure
the strains near the diaphragm cutout and the bottom corners of the bulkheads. For strain
gage rosettes near the diaphragm cutout, component 1 was oriented perpendicular to the
rib-to-diaphragm weld, and component 2 parallel to the rib-to-diaphragm weld. At some
locations, back-to-back strain gages were placed on both sides of the diaphragm. The
strain gages in the bulkhead were positioned 25 mm away from both the bottom edge of
the bulkhead plates and the weld toe termination at rib-to-bulkhead welded joint. The
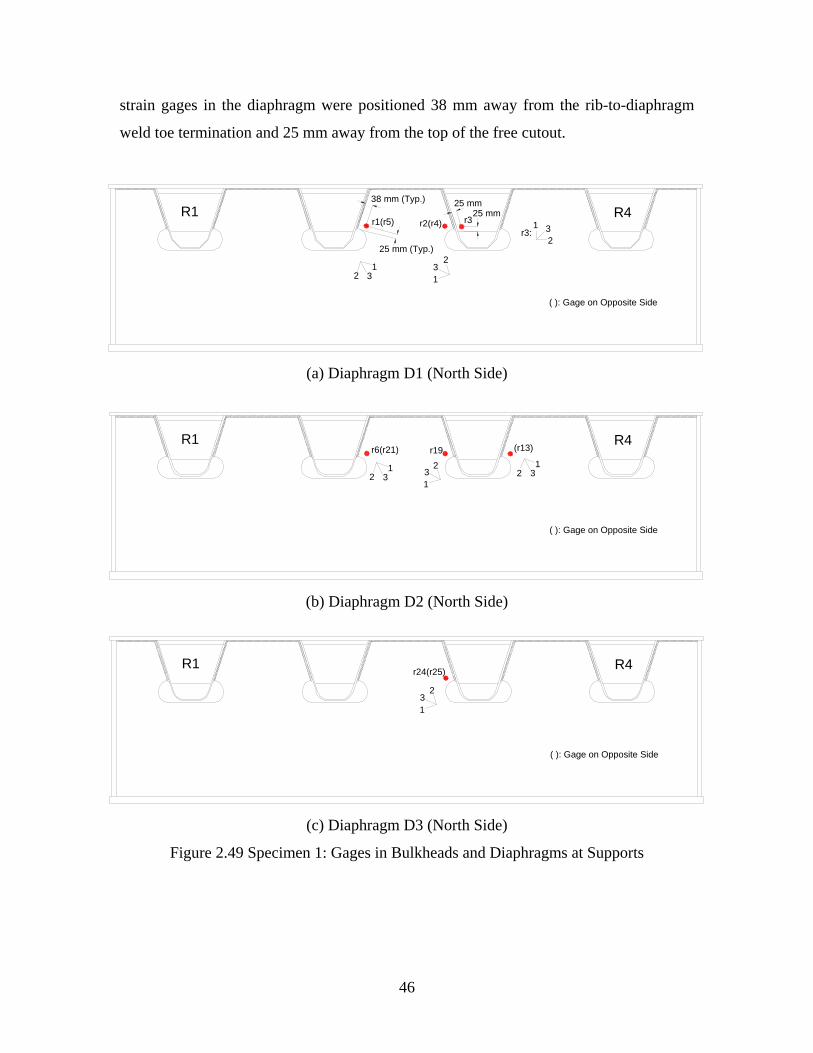
46
strain gages in the diaphragm were positioned 38 mm away from the rib-to-diaphragm
weld toe termination and 25 mm away from the top of the free cutout.
r3:
25 mm (Typ.)
38 mm (Typ.)
r1(r5)
25 mm25 mm
r2(r4) r3R1 R4
Diaphragm D1 (North Side)
( ): Gage on Opposite Side
2 31
13
2
231
(a) Diaphragm D1 (North Side)
2 31
Diaphragm D2 (North Side)
r6(r21) r19R1 R4
( ): Gage on Opposite Side
2 31
13
2
(r13)
(b) Diaphragm D2 (North Side)
13
2
Diaphragm D3 (North Side)
r24(r25)R1 R4
( ): Gage on Opposite Side
(c) Diaphragm D3 (North Side)
Figure 2.49 Specimen 1: Gages in Bulkheads and Diaphragms at Supports
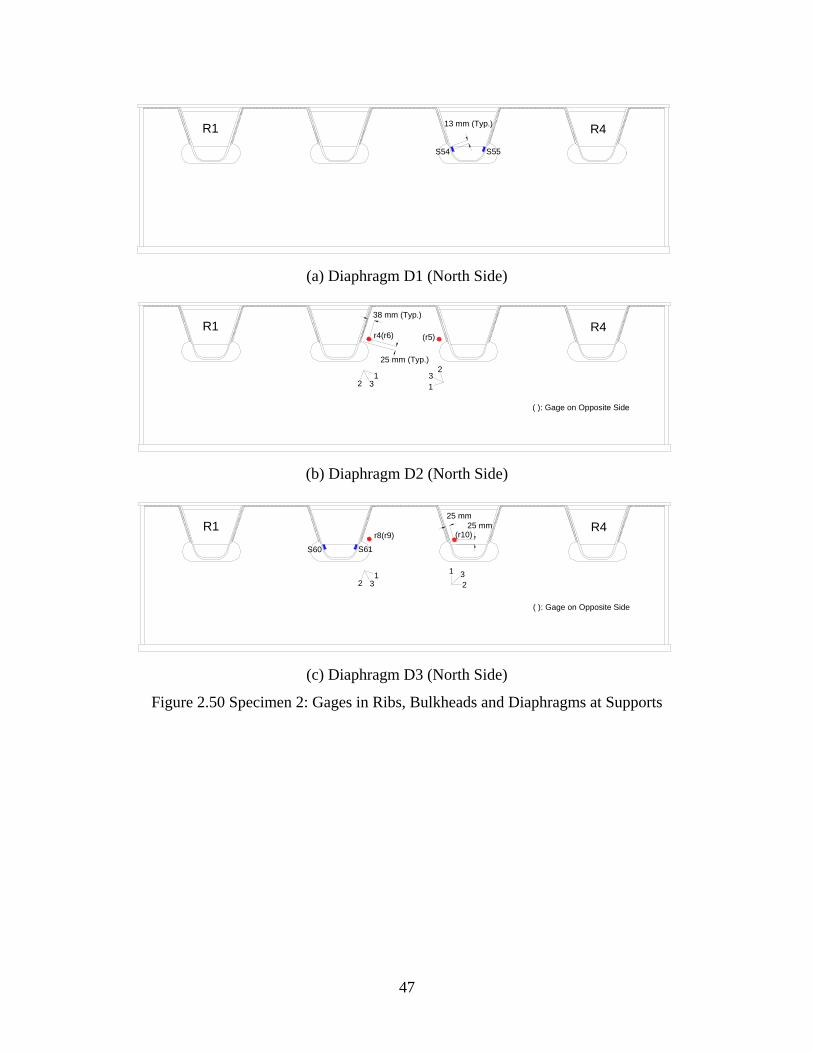
47
R1 R4
Diaphragm D1 (North Side)
S54 S55
13 mm (Typ.)
(a) Diaphragm D1 (North Side)
25 mm (Typ.)
38 mm (Typ.)
r4(r6) (r5)R1 R4
Diaphragm D2 (North Side)
( ): Gage on Opposite Side
2 31
13
2
(b) Diaphragm D2 (North Side)
r8(r9)
25 mm25 mm
(r10)R1 R4
Diaphragm D3 (North Side)
( ): Gage on Opposite Side
2 31
231
S60 S61
(c) Diaphragm D3 (North Side)
Figure 2.50 Specimen 2: Gages in Ribs, Bulkheads and Diaphragms at Supports
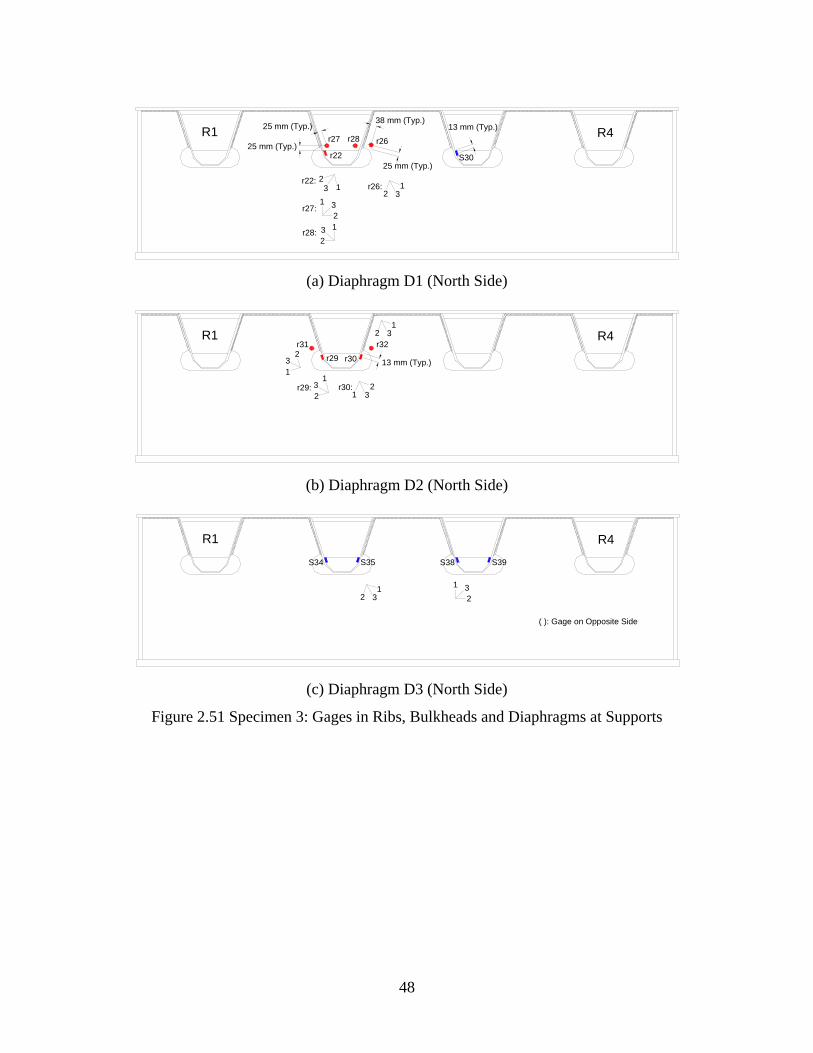
48
R1 R4
Diaphragm D1 (North Side)
S30
13 mm (Typ.)
25 mm (Typ.)
38 mm (Typ.)
r26
25 mm (Typ.)
25 mm (Typ.)r27 r28
r22
2 31
231
r27:
r26:132r22:
23 1
r28:
(a) Diaphragm D1 (North Side)
2 31
13
2 r29 r30
23
1
1 32r29: r30:
13 mm (Typ.)
r32R1 R4
Diaphragm D2 (North Side)
r31
(b) Diaphragm D2 (North Side)
R1 R4
Diaphragm D3 (North Side)
( ): Gage on Opposite Side
2 31
231
S34 S35 S38 S39
(c) Diaphragm D3 (North Side)
Figure 2.51 Specimen 3: Gages in Ribs, Bulkheads and Diaphragms at Supports
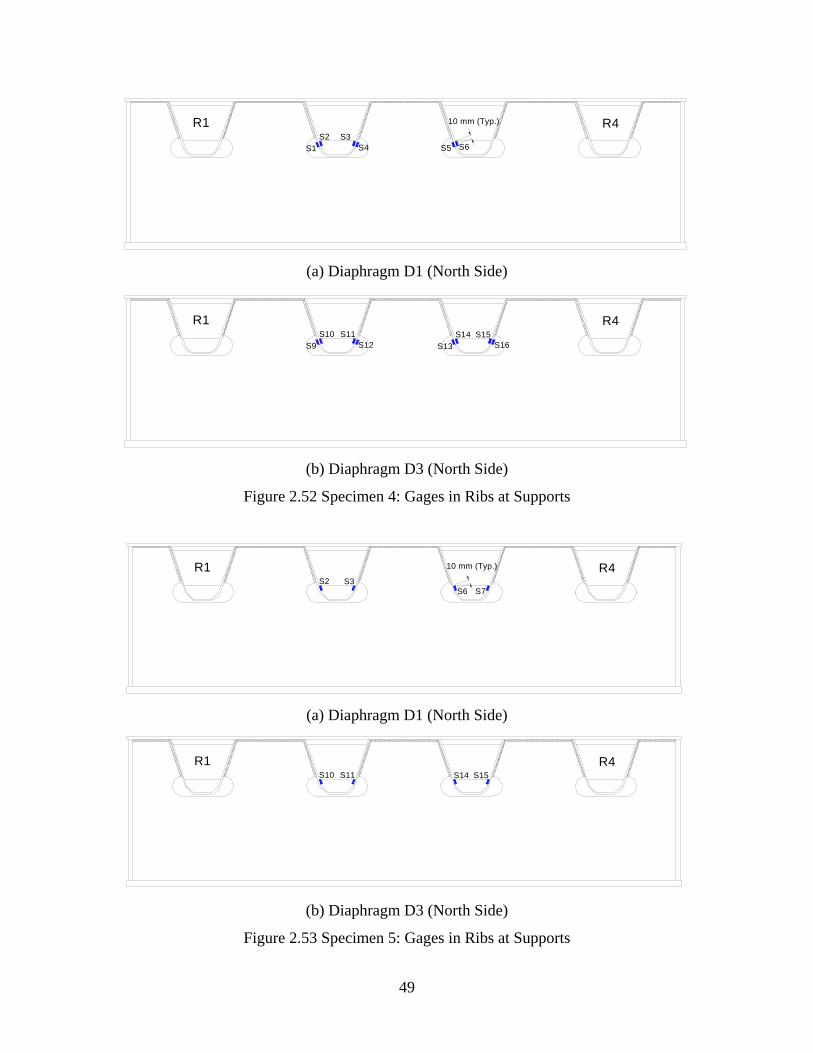
49
R1 R4
Diaphragm D1 (North Side)
S1S2 S3
S4 S5 S6
10 mm (Typ.)
(a) Diaphragm D1 (North Side)
R1 R4
Diaphragm D3 (North Side)
S9S10 S11
S12 S13S14 S15
S16
(b) Diaphragm D3 (North Side)
Figure 2.52 Specimen 4: Gages in Ribs at Supports
R1 R4
Diaphragm D1 (North Side)
S2 S3S6
10 mm (Typ.)
S7
(a) Diaphragm D1 (North Side)
R1 R4
Diaphragm D3 (North Side)
S10 S11 S14 S15
(b) Diaphragm D3 (North Side)
Figure 2.53 Specimen 5: Gages in Ribs at Supports
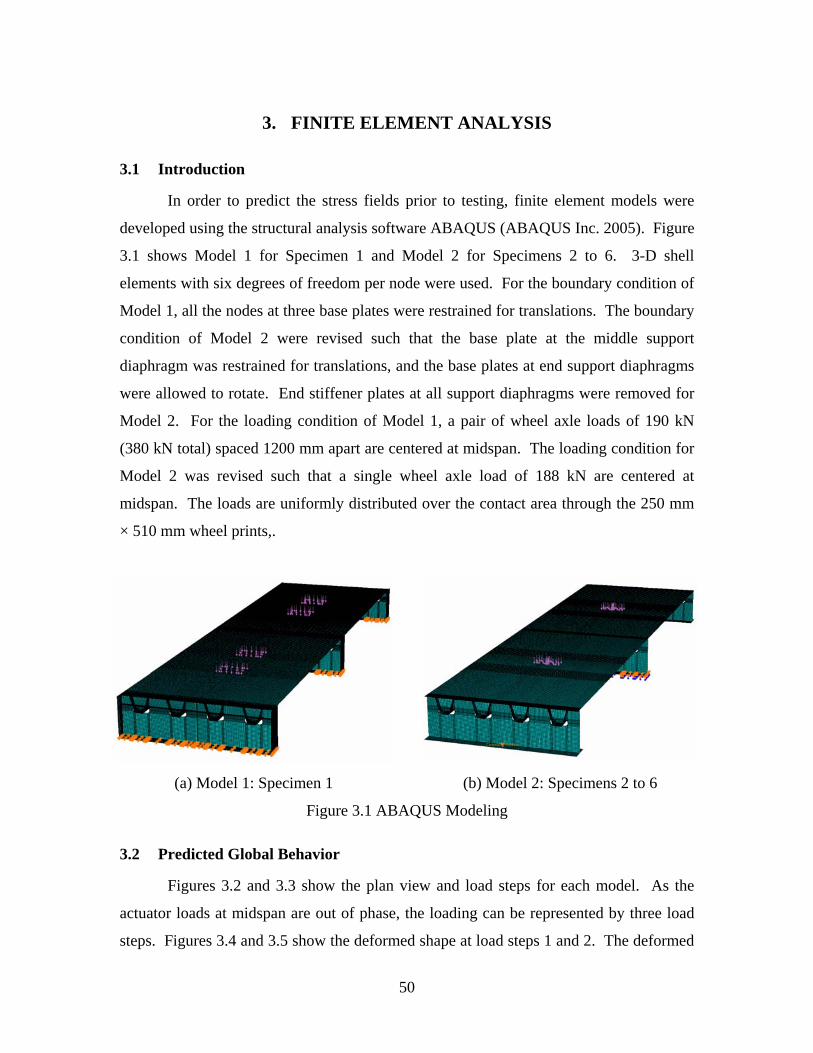
50
3. FINITE ELEMENT ANALYSIS
3.1 Introduction
In order to predict the stress fields prior to testing, finite element models were
developed using the structural analysis software ABAQUS (ABAQUS Inc. 2005). Figure
3.1 shows Model 1 for Specimen 1 and Model 2 for Specimens 2 to 6. 3-D shell
elements with six degrees of freedom per node were used. For the boundary condition of
Model 1, all the nodes at three base plates were restrained for translations. The boundary
condition of Model 2 were revised such that the base plate at the middle support
diaphragm was restrained for translations, and the base plates at end support diaphragms
were allowed to rotate. End stiffener plates at all support diaphragms were removed for
Model 2. For the loading condition of Model 1, a pair of wheel axle loads of 190 kN
(380 kN total) spaced 1200 mm apart are centered at midspan. The loading condition for
Model 2 was revised such that a single wheel axle load of 188 kN are centered at
midspan. The loads are uniformly distributed over the contact area through the 250 mm
× 510 mm wheel prints,.
(a) Model 1: Specimen 1 (b) Model 2: Specimens 2 to 6
Figure 3.1 ABAQUS Modeling
3.2 Predicted Global Behavior
Figures 3.2 and 3.3 show the plan view and load steps for each model. As the
actuator loads at midspan are out of phase, the loading can be represented by three load
steps. Figures 3.4 and 3.5 show the deformed shape at load steps 1 and 2. The deformed
51
shape at load step 3 is not shown due to symmetry of geometry and loading.
Designations of cross sections are also labeled in these figures. Section 1 represents the
cross section at midspan, Section 2 for the cross section at end support diaphragm, and
Section 3 for the cross section at interior support diaphragm. The maximum vertical
displacement of the deck plate at midspan is 7.4 mm for Model 1, and 4.8 mm for Model
2. Deformed shapes of the cross sections at each load step are shown in Figures 3.6 to
3.11. From the deformed shapes in these figures, it can be seen that the loading centered
at midspan produce torsion being resisted at the supports, and the torsion twist the ribs at
the supports. With this loading distribution mechanism, the out-of-plane transverse
bending in the rib wall below the bulkhead and diaphragm plates are produced. The
deformed shape of Sections 1 and 2 varies in the transverse direction with the load steps,
but the deformed shape of Section 3 (interior support diaphragm) remains the same in the
transverse direction through the load steps (see Figures 3.8 to 3.11).
52
N30
00 m
m
5000 mm5000 mm
510 mm
250 mm
1200 mm
50 mm
R4
R3
R2
R1
D3 D2 D1
(a) Plan View with Rib and Diaphragm Designations
P = 380 kN
(b) Load Step 1
P/2 P/2
(c) Load Step 2
P
(d) Load Step 3
Figure 3.2 Model 1: Plan View and Loading Steps
53
3000
mm
5000 mm5000 mm
510 mm
250 mm
R4
R3
R2
R1
D3 D2 D1N
(a) Plan View with Rib and Diaphragm Designations
P = 188 kN
(b) Load Step 1
P/2 P/2
(c) Load Step 2
P
(d) Load Step 3
Figure 3.3 Model 2: Plan View and Loading Steps
54
(a) Load Step 1
(b) Load Step 2
Figure 3.4 Model 1: Deformed Shape (Amplification Factor = 50)
Section 1
Section 2
Section 3
N
N
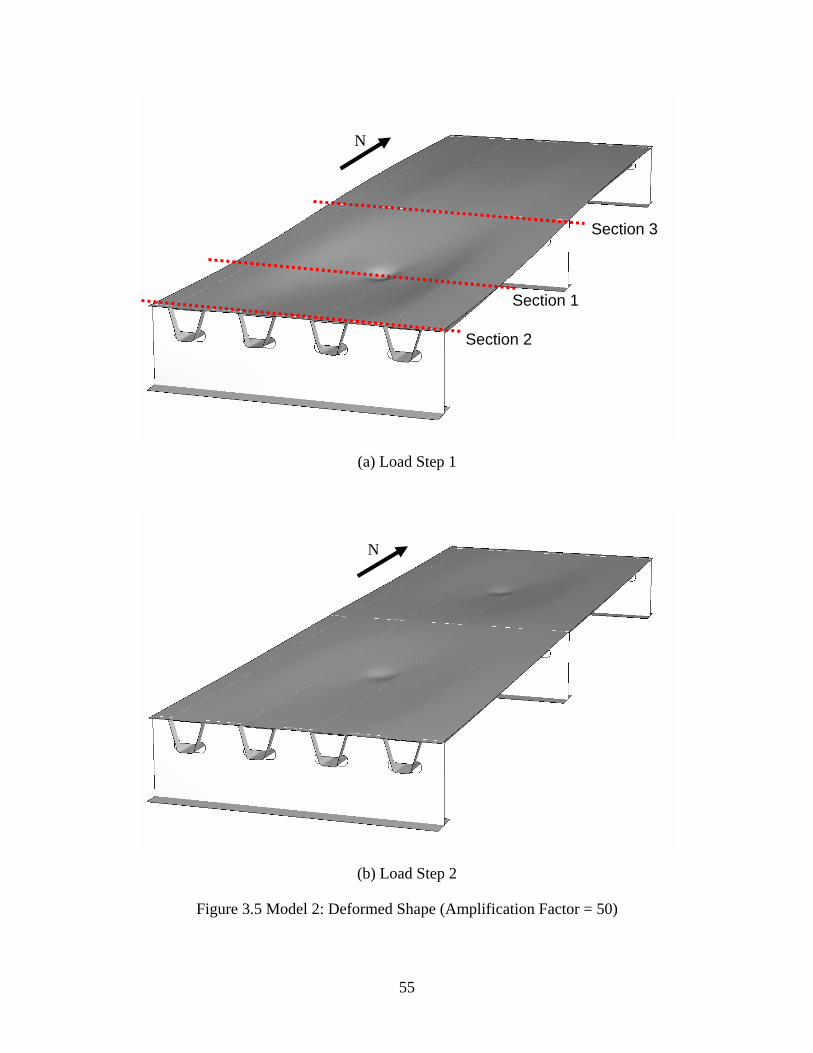
55
(a) Load Step 1
(b) Load Step 2
Figure 3.5 Model 2: Deformed Shape (Amplification Factor = 50)
Section 1
Section 2
Section 3
N
N
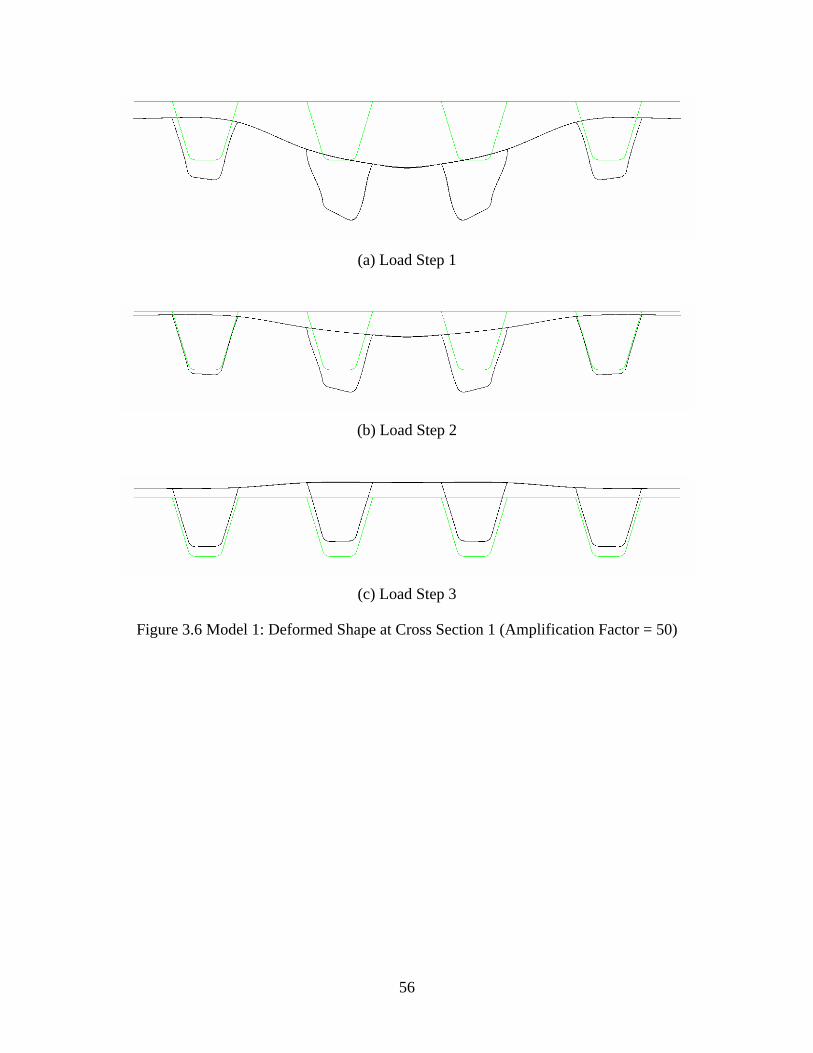
56
(a) Load Step 1
(b) Load Step 2
(c) Load Step 3
Figure 3.6 Model 1: Deformed Shape at Cross Section 1 (Amplification Factor = 50)
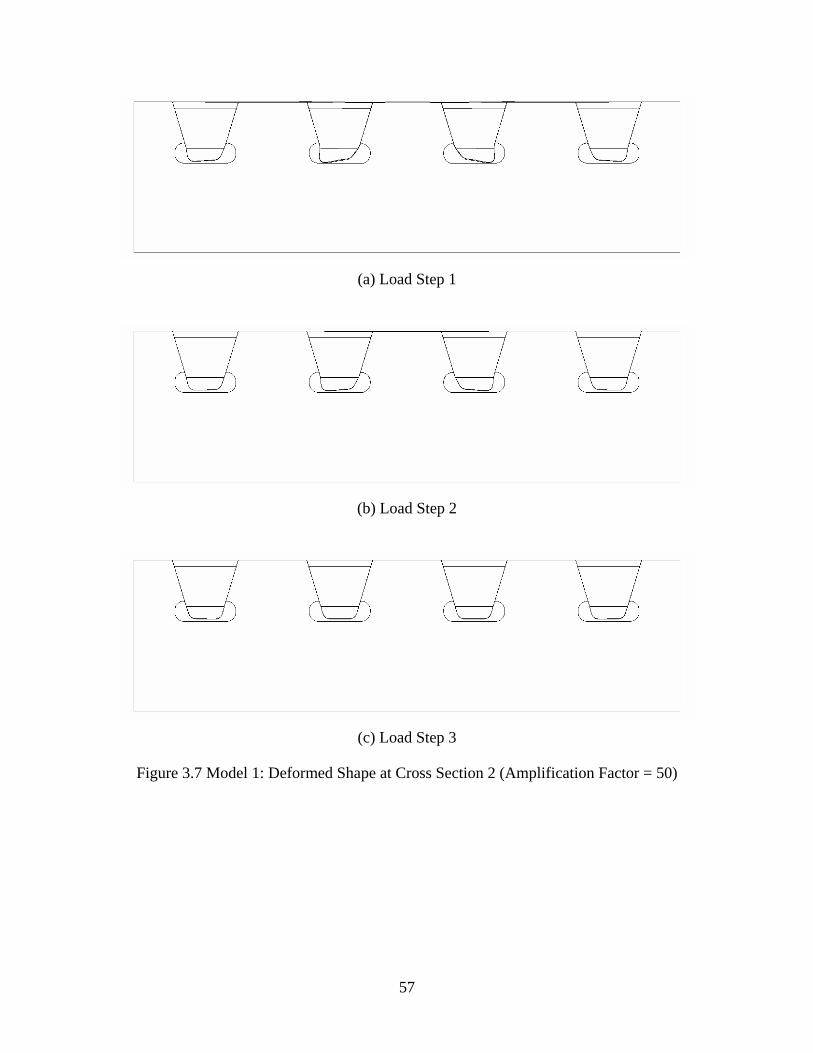
57
(a) Load Step 1
(b) Load Step 2
(c) Load Step 3
Figure 3.7 Model 1: Deformed Shape at Cross Section 2 (Amplification Factor = 50)
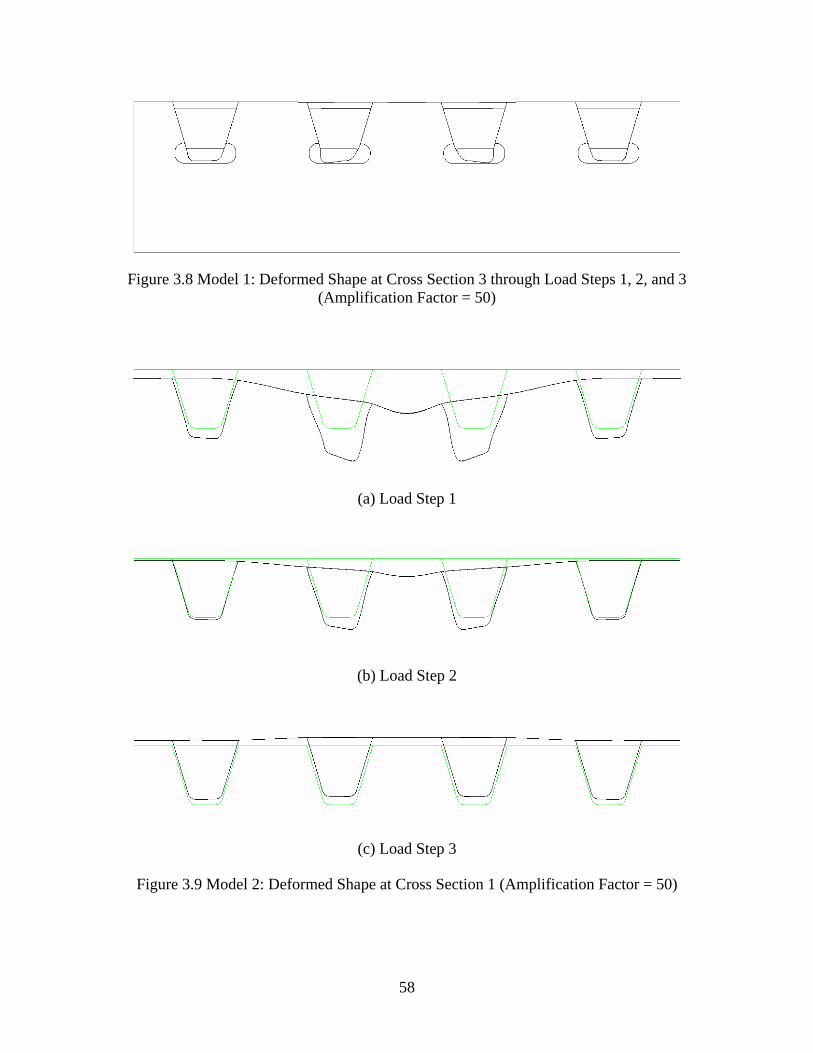
58
Figure 3.8 Model 1: Deformed Shape at Cross Section 3 through Load Steps 1, 2, and 3
(Amplification Factor = 50)
(a) Load Step 1
(b) Load Step 2
(c) Load Step 3
Figure 3.9 Model 2: Deformed Shape at Cross Section 1 (Amplification Factor = 50)
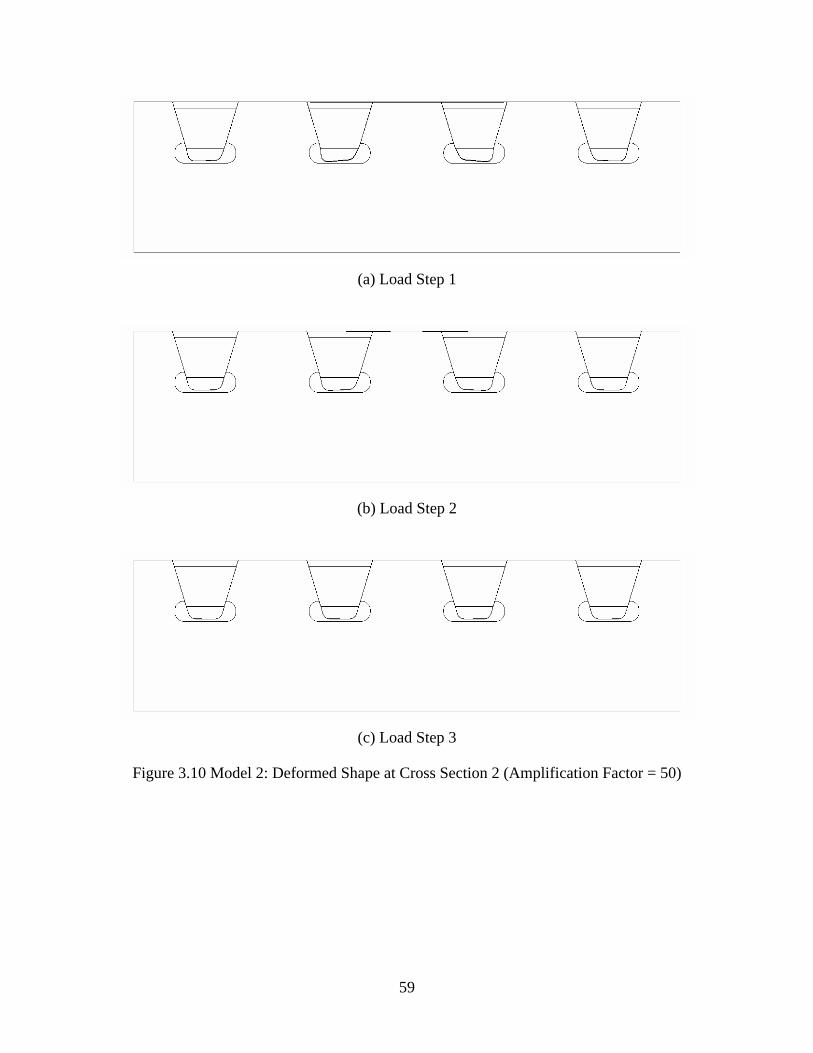
59
(a) Load Step 1
(b) Load Step 2
(c) Load Step 3
Figure 3.10 Model 2: Deformed Shape at Cross Section 2 (Amplification Factor = 50)
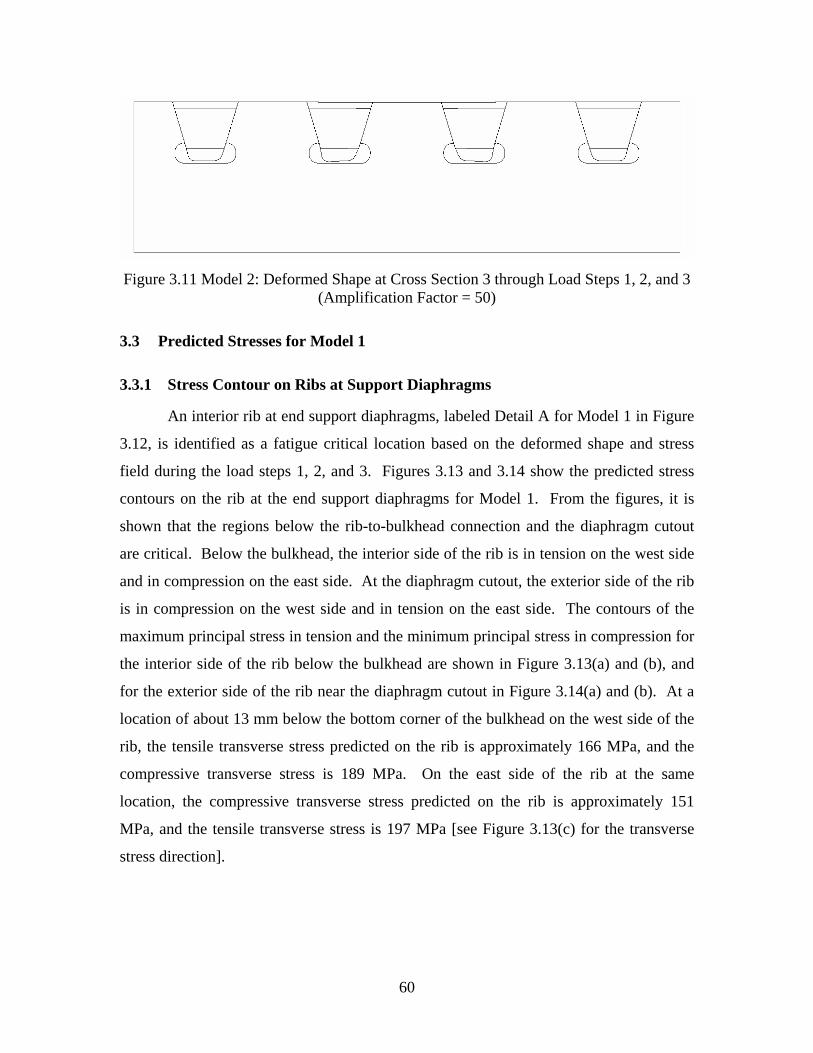
60
Figure 3.11 Model 2: Deformed Shape at Cross Section 3 through Load Steps 1, 2, and 3
(Amplification Factor = 50)
3.3 Predicted Stresses for Model 1
3.3.1 Stress Contour on Ribs at Support Diaphragms
An interior rib at end support diaphragms, labeled Detail A for Model 1 in Figure
3.12, is identified as a fatigue critical location based on the deformed shape and stress
field during the load steps 1, 2, and 3. Figures 3.13 and 3.14 show the predicted stress
contours on the rib at the end support diaphragms for Model 1. From the figures, it is
shown that the regions below the rib-to-bulkhead connection and the diaphragm cutout
are critical. Below the bulkhead, the interior side of the rib is in tension on the west side
and in compression on the east side. At the diaphragm cutout, the exterior side of the rib
is in compression on the west side and in tension on the east side. The contours of the
maximum principal stress in tension and the minimum principal stress in compression for
the interior side of the rib below the bulkhead are shown in Figure 3.13(a) and (b), and
for the exterior side of the rib near the diaphragm cutout in Figure 3.14(a) and (b). At a
location of about 13 mm below the bottom corner of the bulkhead on the west side of the
rib, the tensile transverse stress predicted on the rib is approximately 166 MPa, and the
compressive transverse stress is 189 MPa. On the east side of the rib at the same
location, the compressive transverse stress predicted on the rib is approximately 151
MPa, and the tensile transverse stress is 197 MPa [see Figure 3.13(c) for the transverse
stress direction].
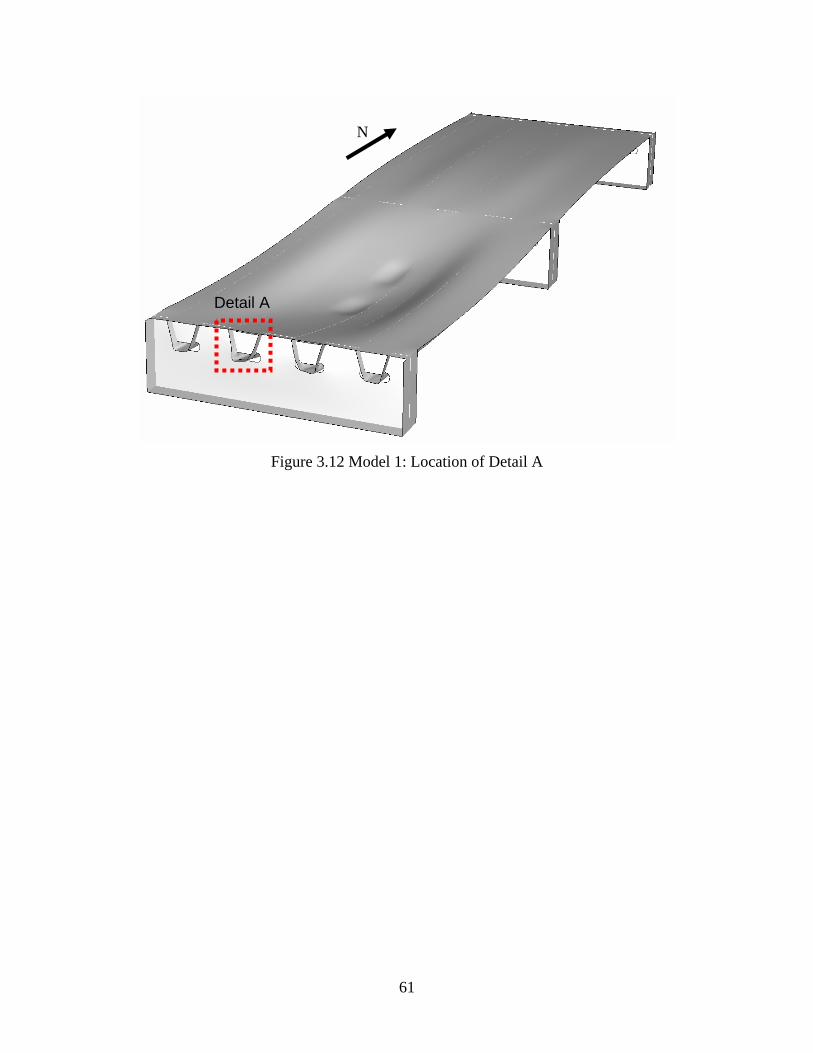
61
Figure 3.12 Model 1: Location of Detail A
Detail A
N
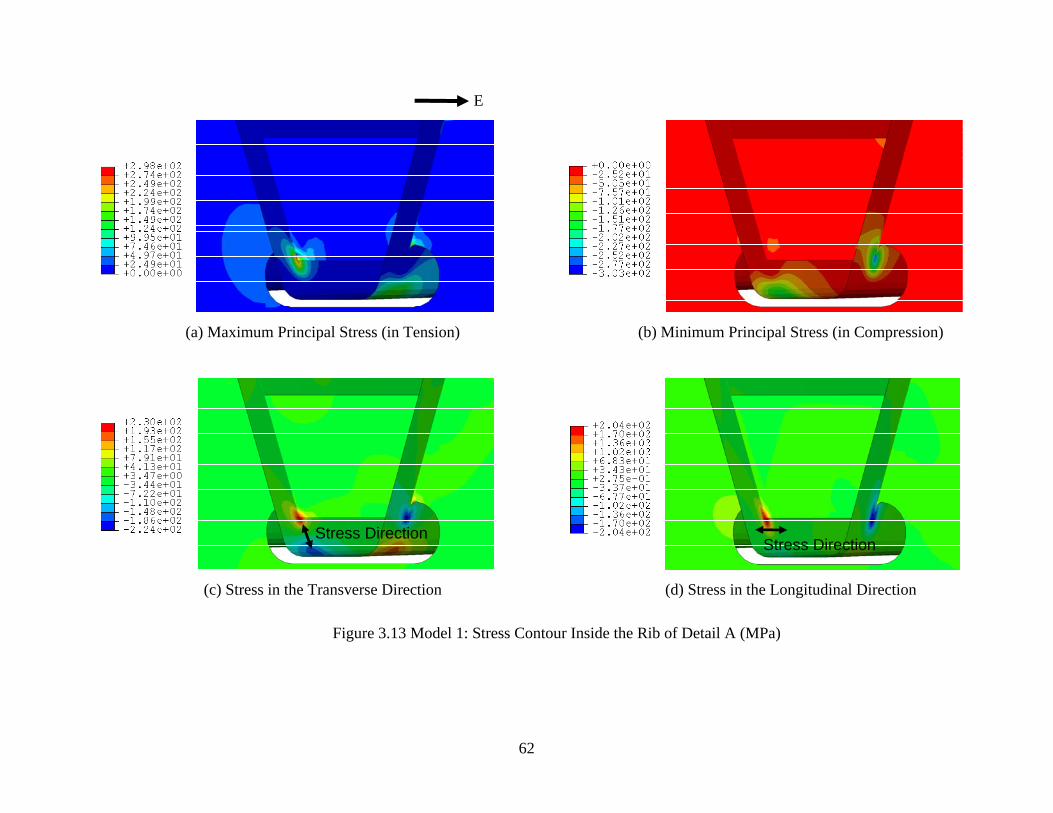
62
(a) Maximum Principal Stress (in Tension)
(b) Minimum Principal Stress (in Compression)
(c) Stress in the Transverse Direction (d) Stress in the Longitudinal Direction
Figure 3.13 Model 1: Stress Contour Inside the Rib of Detail A (MPa)
E
Stress Direction Stress Direction
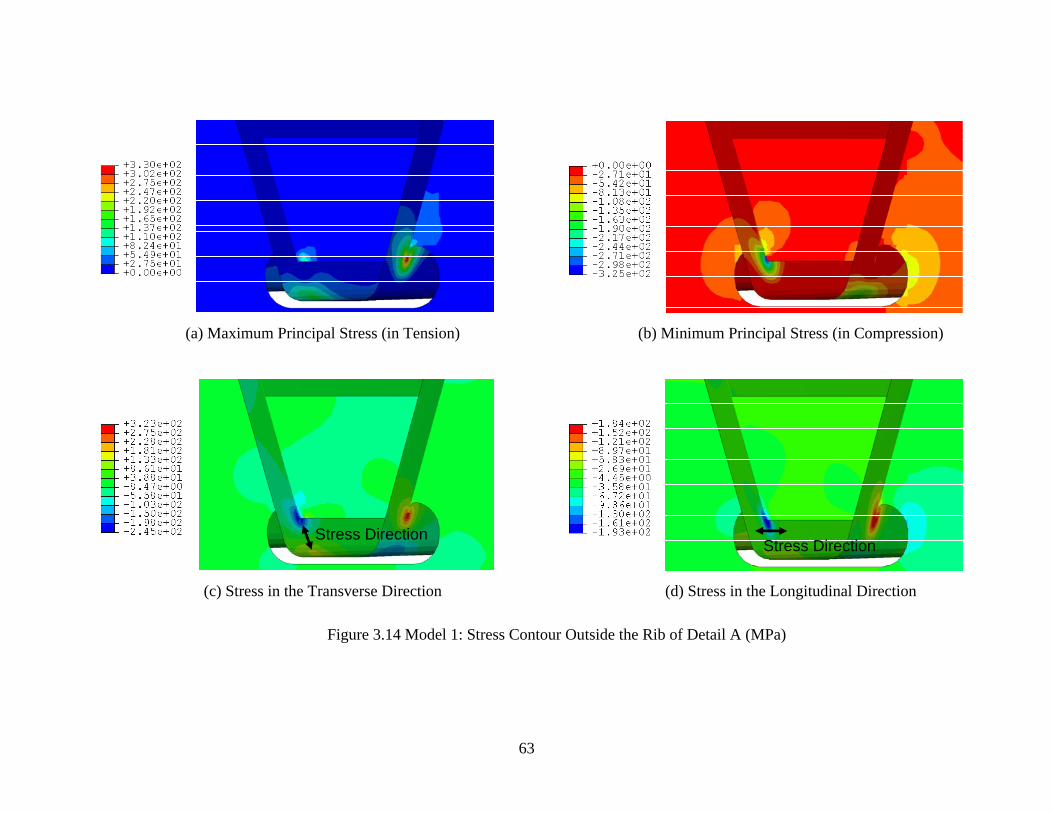
63
(a) Maximum Principal Stress (in Tension)
(b) Minimum Principal Stress (in Compression)
(c) Stress in the Transverse Direction (d) Stress in the Longitudinal Direction
Figure 3.14 Model 1: Stress Contour Outside the Rib of Detail A (MPa)
Stress Direction Stress Direction
64
3.3.2 Principal Stress Distribution on Bulkhead and Diaphragm Plates
Figure 3.15 shows the principal stress contour on both sides (south and north
sides) of the bulkhead and diaphragm plate at Detail A on the end diaphragms (see Figure
3.12 for a compass direction and the location of Detail A). As shown from the principal
stress contour, the bottom corner of the bulkhead and the diaphragm cutout at rib-to-
diaphragm connection are critical. The contour of the maximum principal stress in
tension and the minimum principal stress in compression on both sides of the bulkhead
and the diaphragm plate are shown in Figure 3.15(a) to (d). The principal stress
directions are also shown in Figure 3.15(e) to (h). At a bulkhead location of about 25
mm away from the corners of the bottom and the side of the bulkhead, the predicted
maximum principal stress is 60 MPa in tension on the south-west side of Detail A and 49
MPa on the north-west side. The minimum principal stress on the bulkhead is 49 MPa in
compression on the south-east side and 61 MPa on the north-east side. At a diaphragm
location of about 25 mm away from the top of the free diaphragm cutout and 38 mm
apart from the side corner of the bulkhead, the predicted maximum principal stress is 37
MPa in tension on the south-west side and 36 MPa on the north-east side. The minimum
principal stress on the diaphragm at the same location is 24 MPa in compression on the
south-west side and 61 MPa on the north-east side.
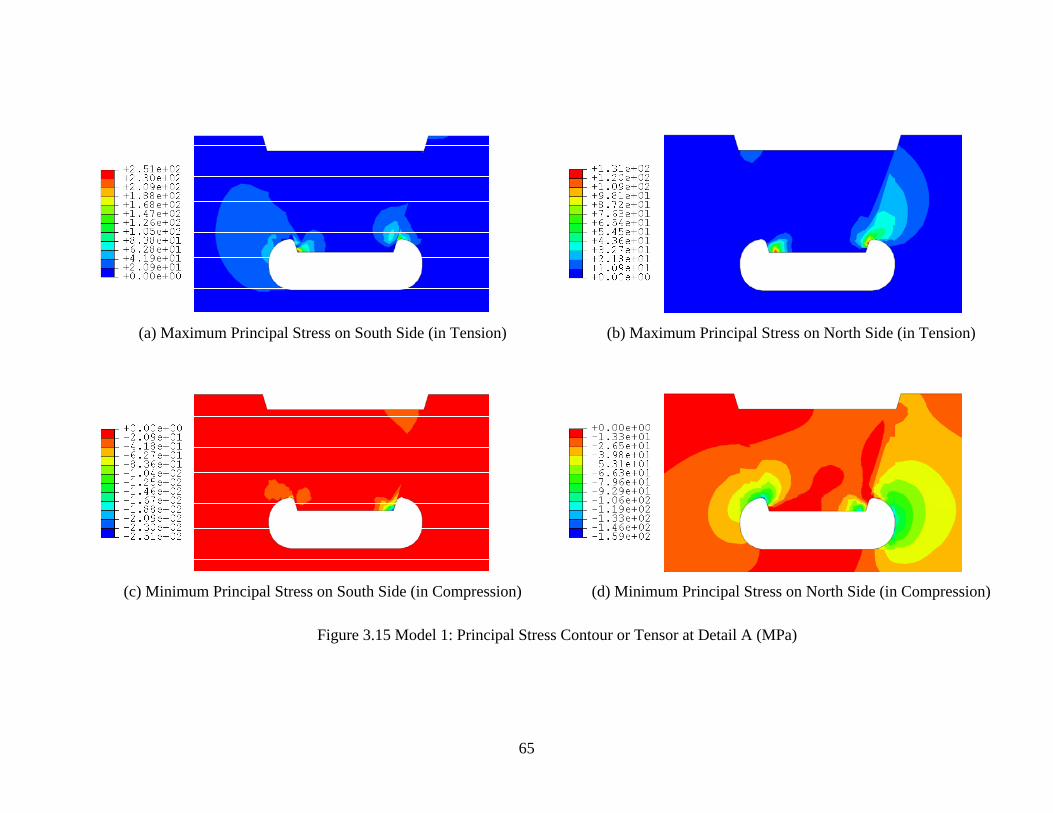
65
(a) Maximum Principal Stress on South Side (in Tension)
(b) Maximum Principal Stress on North Side (in Tension)
(c) Minimum Principal Stress on South Side (in Compression) (d) Minimum Principal Stress on North Side (in Compression)
Figure 3.15 Model 1: Principal Stress Contour or Tensor at Detail A (MPa)
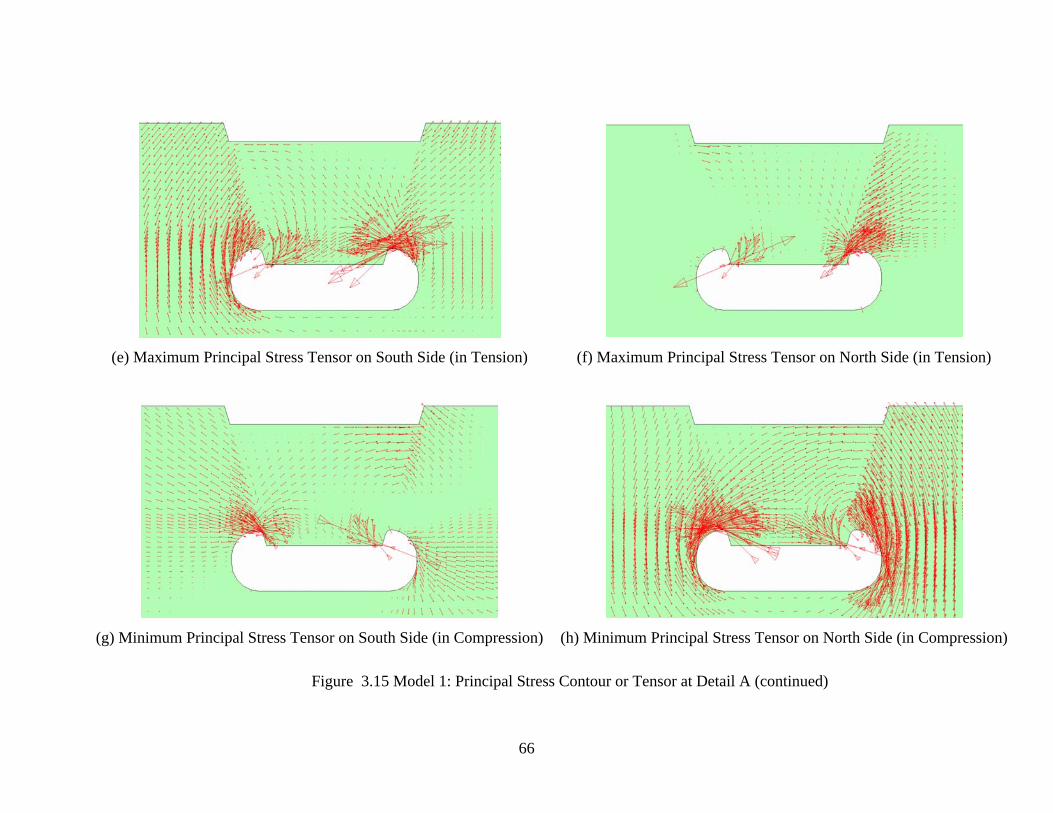
66
(e) Maximum Principal Stress Tensor on South Side (in Tension)
(f) Maximum Principal Stress Tensor on North Side (in Tension)
(g) Minimum Principal Stress Tensor on South Side (in Compression) (h) Minimum Principal Stress Tensor on North Side (in Compression)
Figure 3.15 Model 1: Principal Stress Contour or Tensor at Detail A (continued)
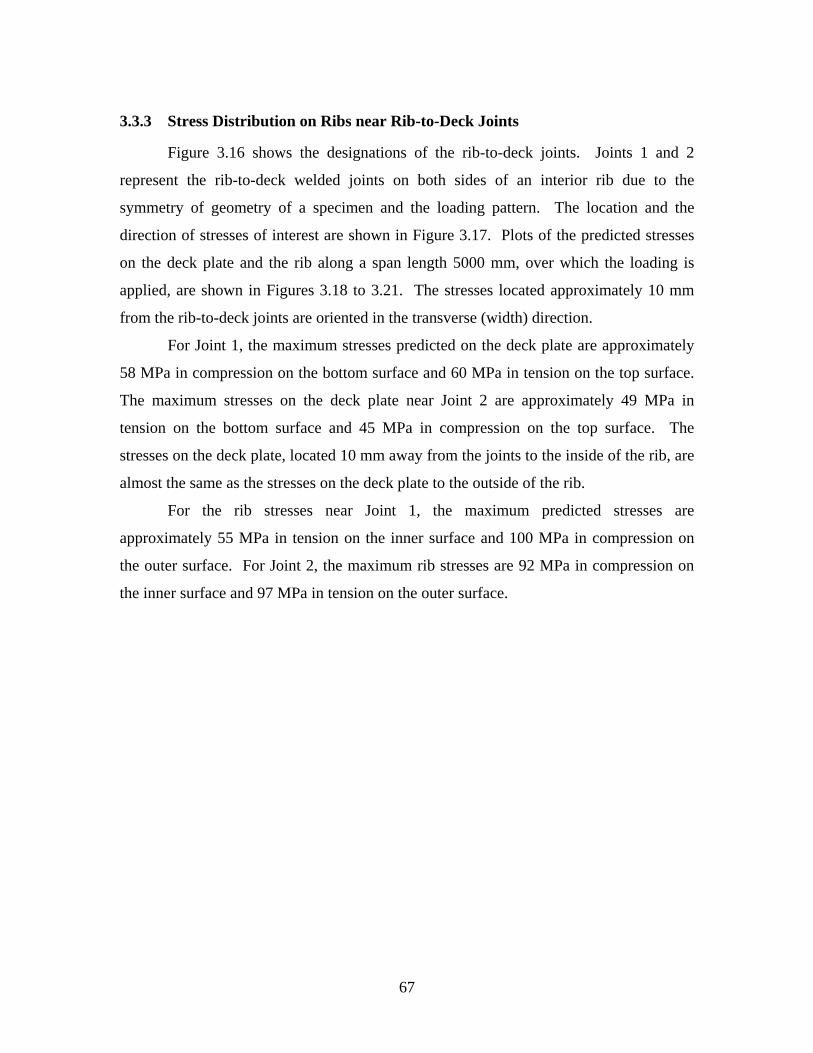
67
3.3.3 Stress Distribution on Ribs near Rib-to-Deck Joints
Figure 3.16 shows the designations of the rib-to-deck joints. Joints 1 and 2
represent the rib-to-deck welded joints on both sides of an interior rib due to the
symmetry of geometry of a specimen and the loading pattern. The location and the
direction of stresses of interest are shown in Figure 3.17. Plots of the predicted stresses
on the deck plate and the rib along a span length 5000 mm, over which the loading is
applied, are shown in Figures 3.18 to 3.21. The stresses located approximately 10 mm
from the rib-to-deck joints are oriented in the transverse (width) direction.
For Joint 1, the maximum stresses predicted on the deck plate are approximately
58 MPa in compression on the bottom surface and 60 MPa in tension on the top surface.
The maximum stresses on the deck plate near Joint 2 are approximately 49 MPa in
tension on the bottom surface and 45 MPa in compression on the top surface. The
stresses on the deck plate, located 10 mm away from the joints to the inside of the rib, are
almost the same as the stresses on the deck plate to the outside of the rib.
For the rib stresses near Joint 1, the maximum predicted stresses are
approximately 55 MPa in tension on the inner surface and 100 MPa in compression on
the outer surface. For Joint 2, the maximum rib stresses are 92 MPa in compression on
the inner surface and 97 MPa in tension on the outer surface.
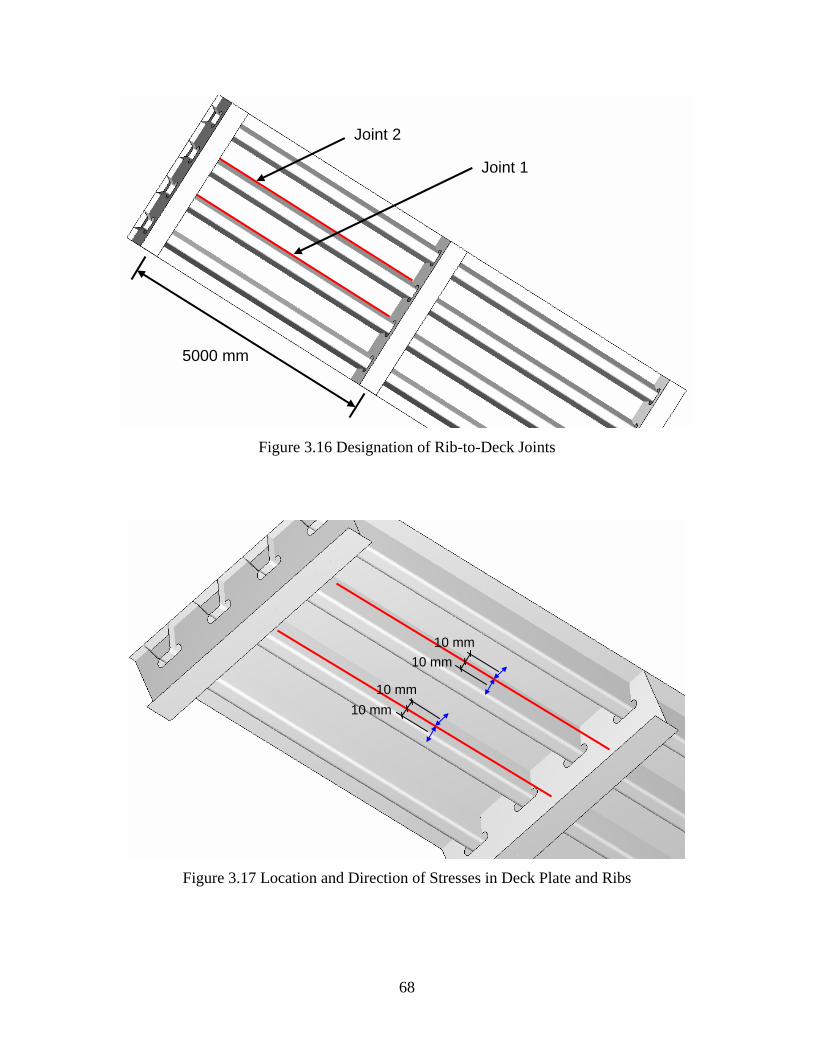
68
Figure 3.16 Designation of Rib-to-Deck Joints
Figure 3.17 Location and Direction of Stresses in Deck Plate and Ribs
10 mm10 mm
10 mm10 mm
Joint 2
Joint 1
5000 mm
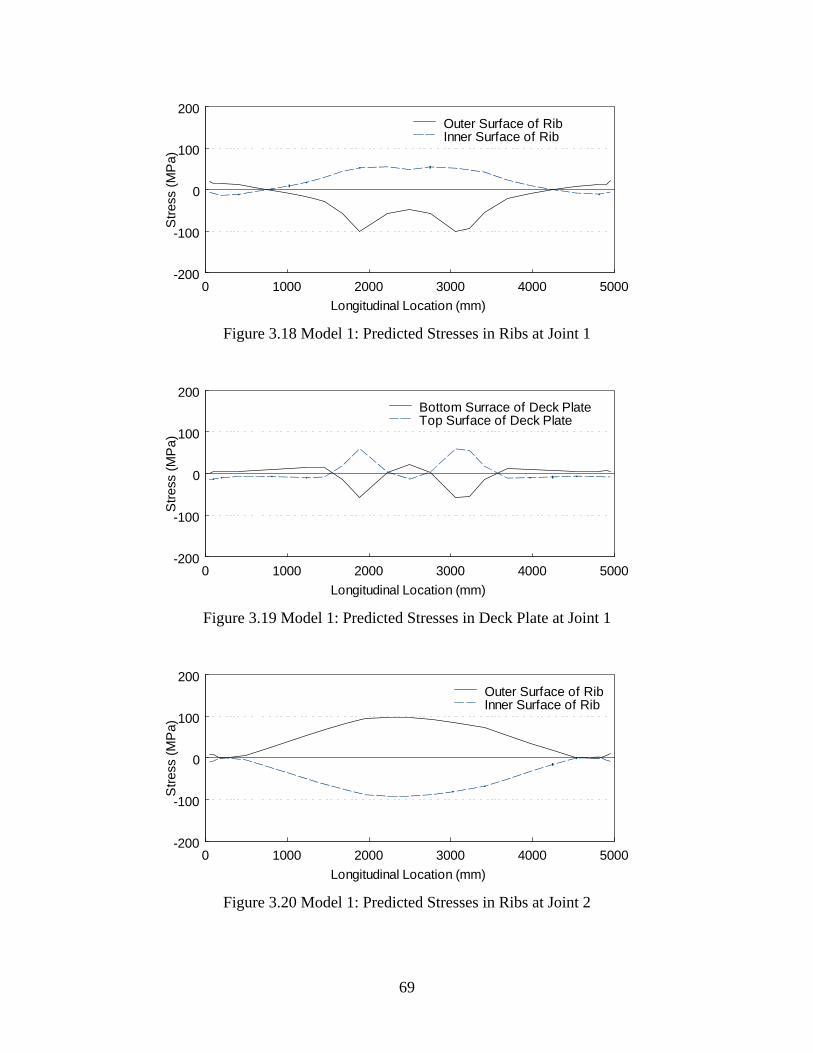
69
0 1000 2000 3000 4000 5000-200
-100
0
100
200
Longitudinal Location (mm)
Stre
ss (M
Pa)
Outer Surface of RibInner Surface of Rib
Figure 3.18 Model 1: Predicted Stresses in Ribs at Joint 1
0 1000 2000 3000 4000 5000-200
-100
0
100
200
Longitudinal Location (mm)
Stre
ss (M
Pa)
Bottom Surrace of Deck PlateTop Surface of Deck Plate
Figure 3.19 Model 1: Predicted Stresses in Deck Plate at Joint 1
0 1000 2000 3000 4000 5000-200
-100
0
100
200
Longitudinal Location (mm)
Stre
ss (M
Pa)
Outer Surface of RibInner Surface of Rib
Figure 3.20 Model 1: Predicted Stresses in Ribs at Joint 2
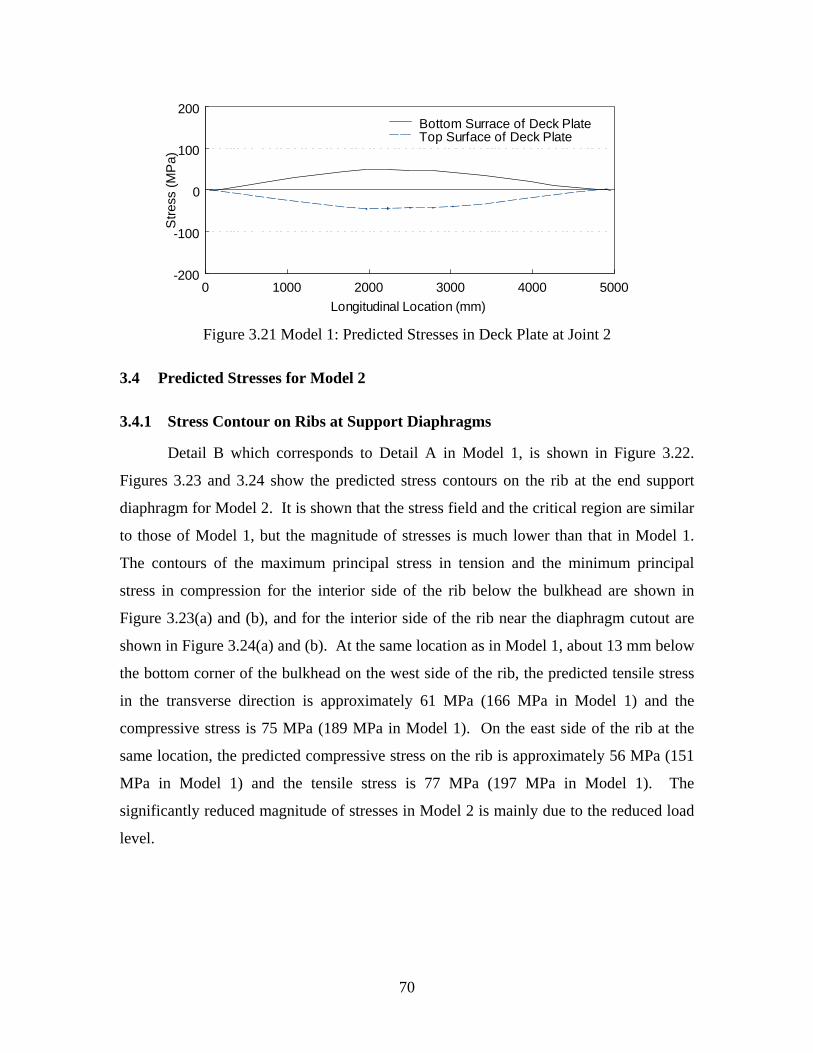
70
0 1000 2000 3000 4000 5000-200
-100
0
100
200
Longitudinal Location (mm)
Stre
ss (M
Pa)
Bottom Surrace of Deck PlateTop Surface of Deck Plate
Figure 3.21 Model 1: Predicted Stresses in Deck Plate at Joint 2
3.4 Predicted Stresses for Model 2
3.4.1 Stress Contour on Ribs at Support Diaphragms
Detail B which corresponds to Detail A in Model 1, is shown in Figure 3.22.
Figures 3.23 and 3.24 show the predicted stress contours on the rib at the end support
diaphragm for Model 2. It is shown that the stress field and the critical region are similar
to those of Model 1, but the magnitude of stresses is much lower than that in Model 1.
The contours of the maximum principal stress in tension and the minimum principal
stress in compression for the interior side of the rib below the bulkhead are shown in
Figure 3.23(a) and (b), and for the interior side of the rib near the diaphragm cutout are
shown in Figure 3.24(a) and (b). At the same location as in Model 1, about 13 mm below
the bottom corner of the bulkhead on the west side of the rib, the predicted tensile stress
in the transverse direction is approximately 61 MPa (166 MPa in Model 1) and the
compressive stress is 75 MPa (189 MPa in Model 1). On the east side of the rib at the
same location, the predicted compressive stress on the rib is approximately 56 MPa (151
MPa in Model 1) and the tensile stress is 77 MPa (197 MPa in Model 1). The
significantly reduced magnitude of stresses in Model 2 is mainly due to the reduced load
level.
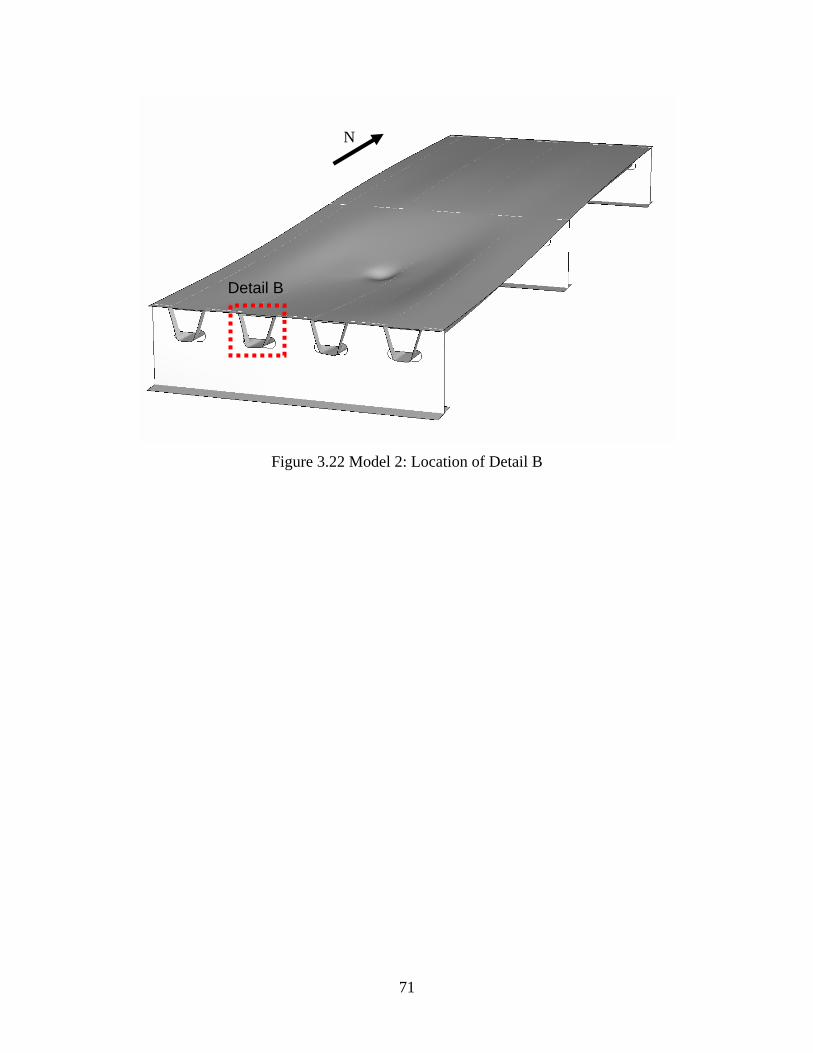
71
Figure 3.22 Model 2: Location of Detail B
Detail B
N
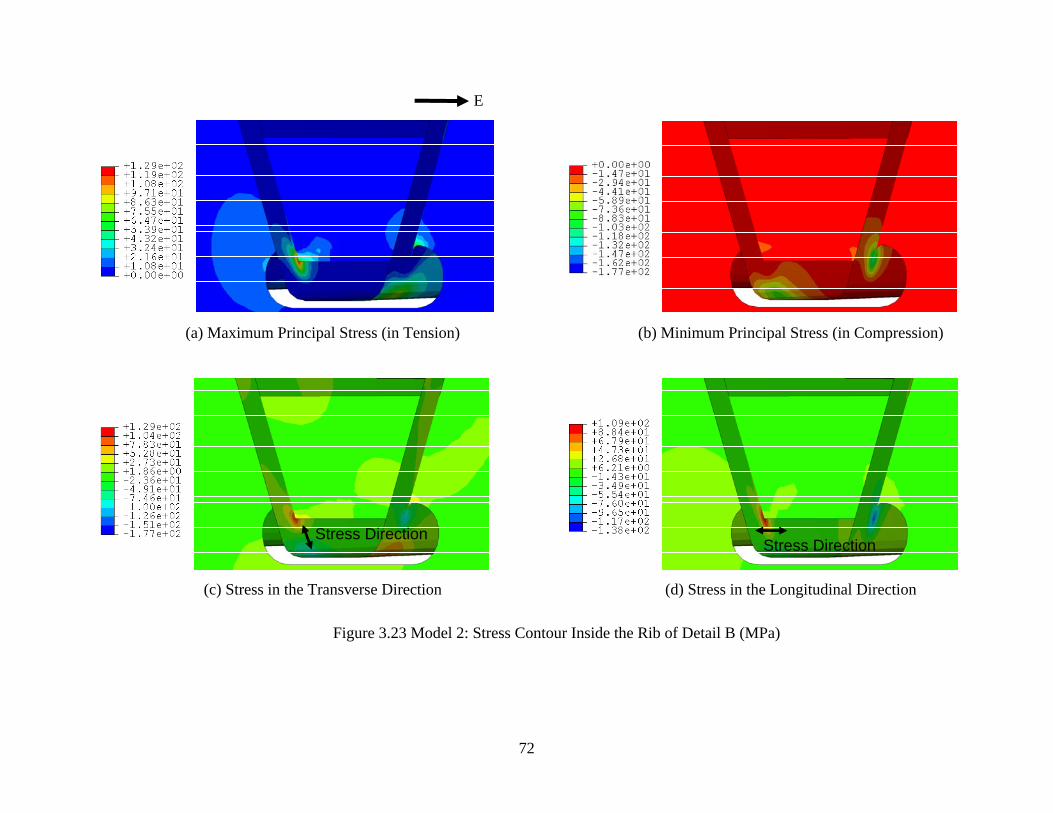
72
(a) Maximum Principal Stress (in Tension)
(b) Minimum Principal Stress (in Compression)
(c) Stress in the Transverse Direction (d) Stress in the Longitudinal Direction
Figure 3.23 Model 2: Stress Contour Inside the Rib of Detail B (MPa)
E
Stress Direction Stress Direction
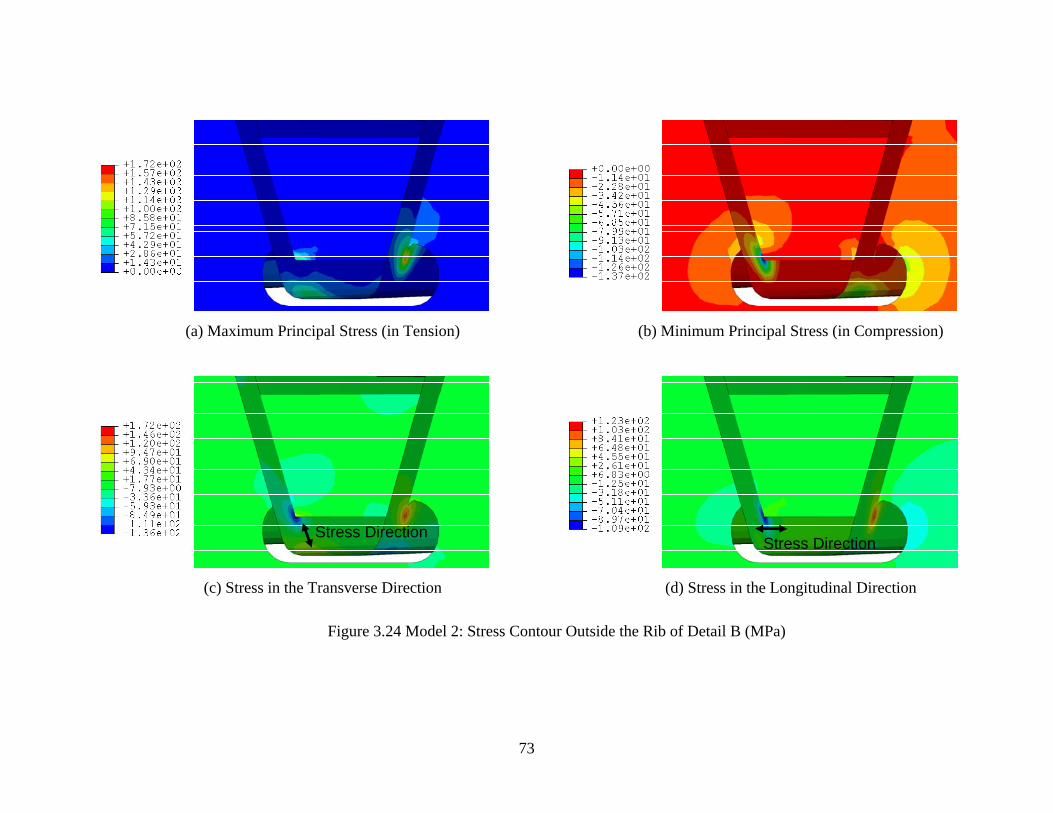
73
(a) Maximum Principal Stress (in Tension)
(b) Minimum Principal Stress (in Compression)
(c) Stress in the Transverse Direction (d) Stress in the Longitudinal Direction
Figure 3.24 Model 2: Stress Contour Outside the Rib of Detail B (MPa)
Stress Direction Stress Direction
74
3.4.2 Principal Stress Distribution on Bulkhead and Diaphragm Plates
Figure 3.25 shows the principal stress contours on both sides (south and north
sides) of the bulkhead and diaphragm plate at Detail B (see Figure 3.22). The stress field
and the critical region are also similar those of Model 1, but the magnitude of stresses is
much lower than that in Model 1. The contours of the maximum principal stress in
tension and the minimum principal stress in compression on both sides of the bulkhead
and the diaphragm plate are shown in Figure 3.25(a) to (d). The principal stress direction
is also shown in Figure 3.25(e) to (h). At the same bulkhead location as in Model 1,
about 25 mm away from the corners of the bottom and the side of the bulkhead, the
predicted maximum principal stress is 18 MPa (60 MPa in Model 1) in tension on the
south-west side and 17 MPa (49 MPa in Model 1) on the north-west side. The minimum
principal stress on the bulkhead is 16 MPa (49 MPa in Model 1) in compression on the
south-east side and 18 MPa (61 MPa in Model 1) on the north-east side. At the same
diaphragm location in Model 1, about 25 mm away from the top of the free diaphragm
cutout and 38 mm away from the side corner of the bulkhead, the predicted maximum
principal stress is 18 MPa (37 MPa in Model 1) in tension on the south-west side and 18
MPa (36 MPa in Model 1) on the north-east side. The minimum principal stress on the
diaphragm at the same location is 12 MPa (24 MPa in Model 1) in compression on the
south-west side and 28 MPa (61 MPa in Model 1) on the north-east side.
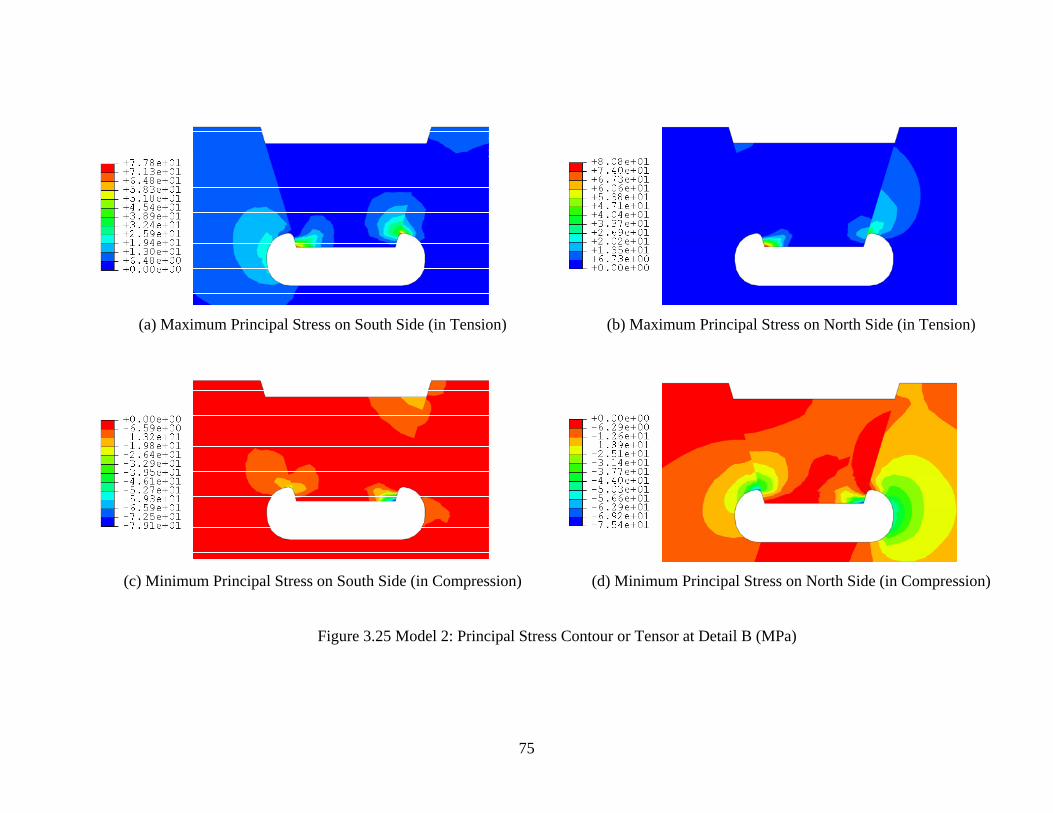
75
(a) Maximum Principal Stress on South Side (in Tension)
(b) Maximum Principal Stress on North Side (in Tension)
(c) Minimum Principal Stress on South Side (in Compression) (d) Minimum Principal Stress on North Side (in Compression)
Figure 3.25 Model 2: Principal Stress Contour or Tensor at Detail B (MPa)
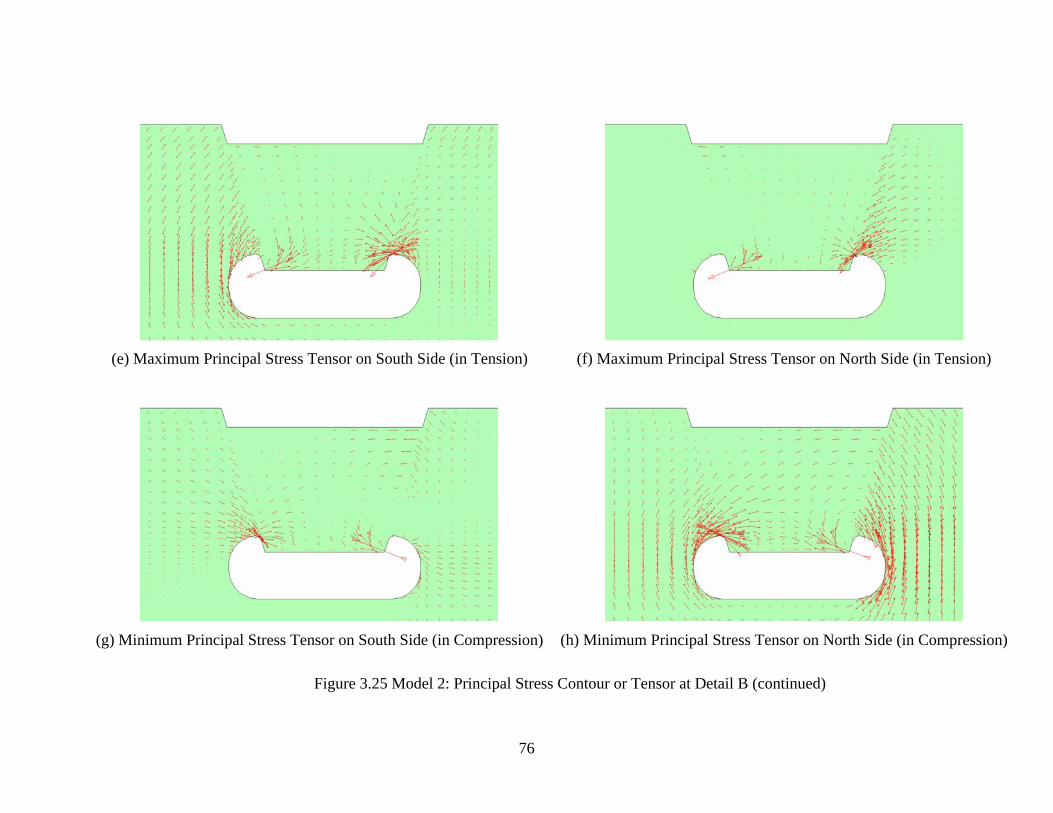
76
(e) Maximum Principal Stress Tensor on South Side (in Tension)
(f) Maximum Principal Stress Tensor on North Side (in Tension)
(g) Minimum Principal Stress Tensor on South Side (in Compression) (h) Minimum Principal Stress Tensor on North Side (in Compression)
Figure 3.25 Model 2: Principal Stress Contour or Tensor at Detail B (continued)
77
3.4.3 Stress Distribution on Ribs near Rib-to-Deck Welded Joints
The same designation for the rib-to-deck joints in Model 1 is used for Model 2
(see Figure 3.16). The location and the direction of stresses of interest are shown in
Figure 3.17. Plots of the predicted stresses on the deck plate and the rib along a span
length 5000 mm, over which the loading is applied, are shown in Figures 3.26 to 3.29.
For Joint 1, the maximum stresses predicted on the deck plate are approximately
132 MPa (58 MPa in Model 1) in compression on the bottom surface and 130 MPa (60
MPa in Model 1) in tension on the top surface. The maximum stresses on the deck plate
near Joint 2 are approximately 30 Mpa (49 MPa in Model 1) in tension on the bottom
surface, and 29 MPa (45 MPa in Model 1) in compression on the top surface. The stress
on the deck plate, located 10 mm away from the joints to the inside of the rib, is almost
the same as the stress on the deck plate outside of the rib.
For the rib stresses near Joint 1, the maximum predicted stresses are
approximately 55 MPa (55 MPa in Model 1) in tension on the inner surface, and 138
MPa (100 MPa in Model 1) in compression on the outer surface. For Joint 2, the
maximum rib stresses are 58 MPa (92 MPa in Model 1) in compression on the inner
surface and 61 MPa (97 MPa in Model 1) in tension on the outer surface.
From the results above, Model 2 for Specimens 2 to 6 produces higher stresses in
both the deck plate and the rib near Joint 1, particularly in the deck plate. However,
lower stresses are predicted in both the deck plate and the rib near Joint 2. Although the
stress field on the bottom of the deck plate near Joint 2 is in tension, the level of stress is
low as shown in Figure 3.28.
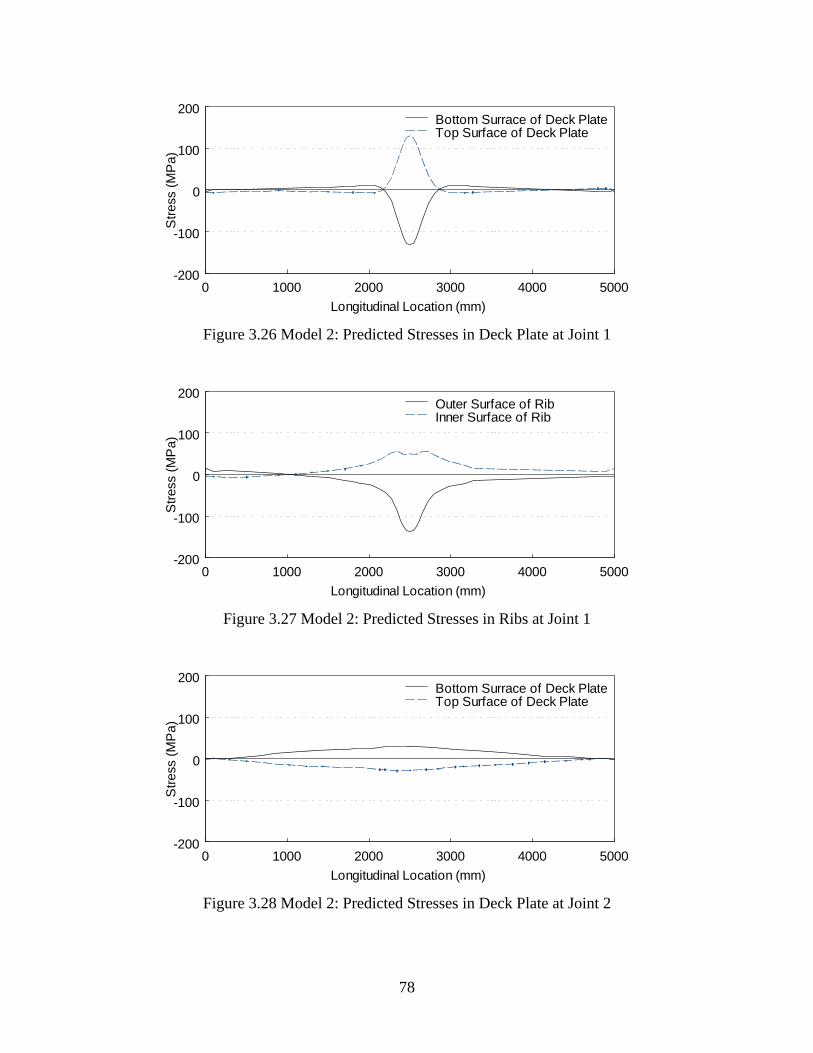
78
0 1000 2000 3000 4000 5000-200
-100
0
100
200
Longitudinal Location (mm)
Stre
ss (M
Pa)
Bottom Surrace of Deck PlateTop Surface of Deck Plate
Figure 3.26 Model 2: Predicted Stresses in Deck Plate at Joint 1
0 1000 2000 3000 4000 5000-200
-100
0
100
200
Longitudinal Location (mm)
Stre
ss (M
Pa)
Outer Surface of RibInner Surface of Rib
Figure 3.27 Model 2: Predicted Stresses in Ribs at Joint 1
0 1000 2000 3000 4000 5000-200
-100
0
100
200
Longitudinal Location (mm)
Stre
ss (M
Pa)
Bottom Surrace of Deck PlateTop Surface of Deck Plate
Figure 3.28 Model 2: Predicted Stresses in Deck Plate at Joint 2
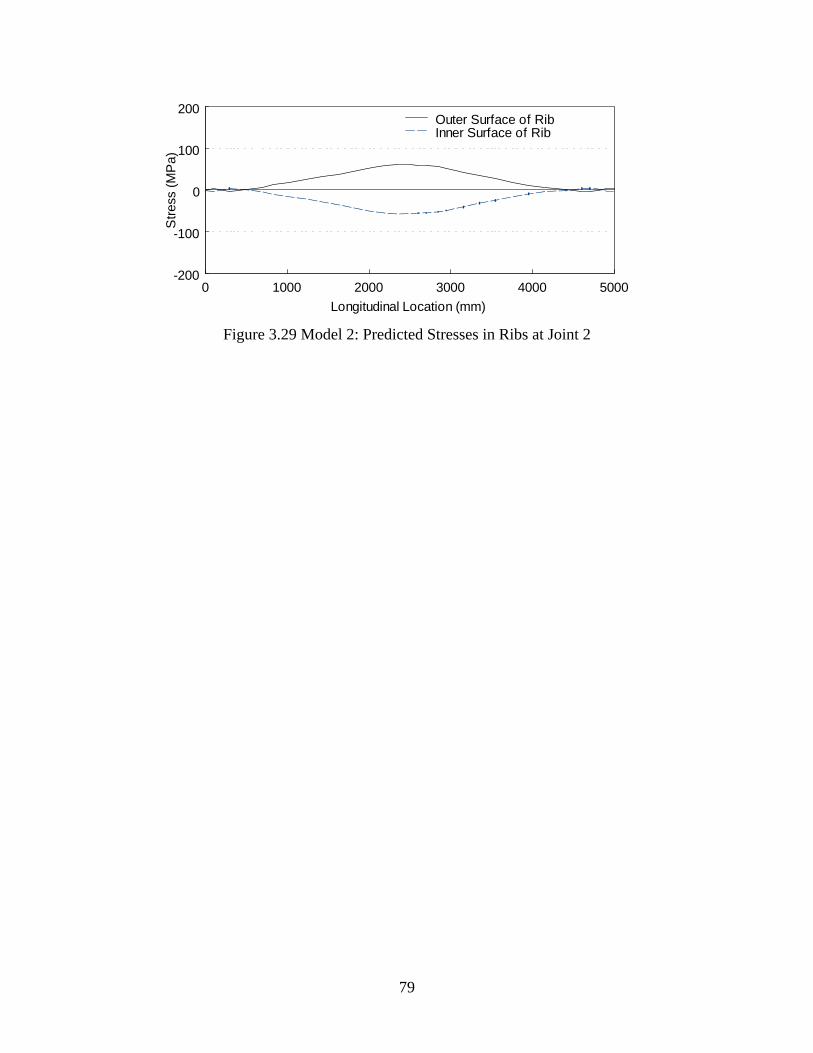
79
0 1000 2000 3000 4000 5000-200
-100
0
100
200
Longitudinal Location (mm)
Stre
ss (M
Pa)
Outer Surface of RibInner Surface of Rib
Figure 3.29 Model 2: Predicted Stresses in Ribs at Joint 2
80
4. SPECIMEN 1 TEST RESULTS
4.1 Testing Program
Specimen 1 was loaded with dual pads (a tandem configuration) centered at
midspan (see Figure 4.1). The test setup is shown in Figure 4.2. The measured
maximum vertical displacement of the deck plate at midspan was 7.1 mm (7.4 mm from
ABAQUS analysis). Prior to fatigue testing, strain measurements were made
approximately at every 1 kip actuator loading during 2 slow loading cycles with a
frequency of 0.025 Hz. Two slow loading cycles were then conducted every 10,000
loading cycles with a loading frequency of approximately 3 Hz throughout the fatigue
testing. Typical applied load and vertical displacement time histories are shown in Figure
4.3.
Large fatigue cracks in the rib walls below the bulkhead and diaphragm plates at
the end supports were observed at 1 million cycles. Most of these fatigue cracks initiated
from the weld toe below the bulkhead and propagated through the rib wall and were
caused by the secondary stresses from the out-of-plane transverse bending of the rib wall
at the cutout. No such cracks were observed at the interior support, which was confirmed
by cutting out and examining small portions of the ribs at this support. This is expected
because the loading scheme was designed to maximize the stress condition on the rib-to-
deck welds. The applied loading scheme would not produce large stress range (see
Figure 3.8 for the predicted deformation).
Full-axle loads were applied to this specimen. Although “pre-mature” cracks
revealed the significant impact that truck overload could have on the orthotropic deck, the
objective of this research to investigate the fatigue resistance of rib-to-deck welds was
not achieved. Based on the observed crack pattern and subsequent finite element analysis
(see Chapter 3), two measures were taken before the remaining five specimens were
tested: (1) The magnitude of loading was reduced by 50% to reflect a half axle load. A
half axle load is reasonable considering the width (3 m) of the test specimens. (2) The
boundary condition at three supports was modified to mitigate the restraining effect
imposed on the test specimen (see Section 4.4).

81
N
R4
R3
R2
R1
D3 D2 D130
00
50005000
Loading Pad
Figure 4.1 Specimen 1: Plan View with Rib and Diaphragm Designations
Figure 4.2 Specimen 1: Test Setup and Diaphragm Locations
D3 D2 D1
N
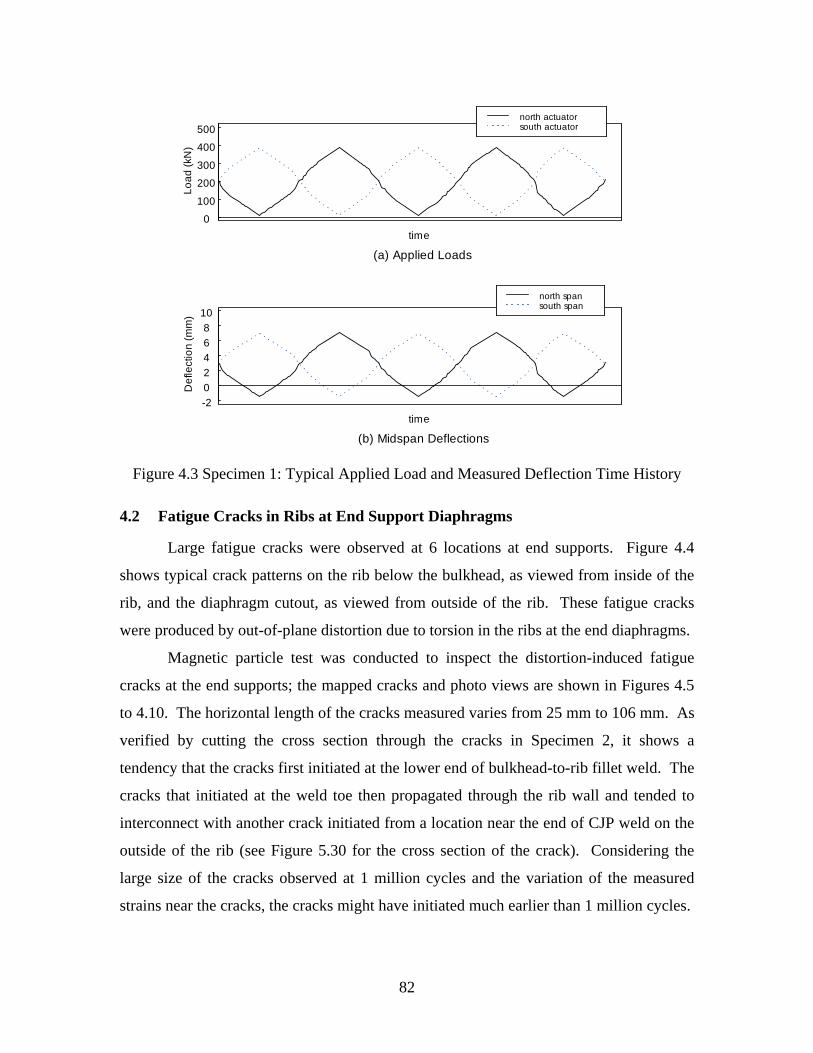
82
time
(a) Applied Loads
Load
(kN
)
0
100
200
300
400
500north actuatorsouth actuator
time
Def
lect
ion
(mm
)
(b) Midspan Deflections
-202468
10north spansouth span
Figure 4.3 Specimen 1: Typical Applied Load and Measured Deflection Time History
4.2 Fatigue Cracks in Ribs at End Support Diaphragms
Large fatigue cracks were observed at 6 locations at end supports. Figure 4.4
shows typical crack patterns on the rib below the bulkhead, as viewed from inside of the
rib, and the diaphragm cutout, as viewed from outside of the rib. These fatigue cracks
were produced by out-of-plane distortion due to torsion in the ribs at the end diaphragms.
Magnetic particle test was conducted to inspect the distortion-induced fatigue
cracks at the end supports; the mapped cracks and photo views are shown in Figures 4.5
to 4.10. The horizontal length of the cracks measured varies from 25 mm to 106 mm. As
verified by cutting the cross section through the cracks in Specimen 2, it shows a
tendency that the cracks first initiated at the lower end of bulkhead-to-rib fillet weld. The
cracks that initiated at the weld toe then propagated through the rib wall and tended to
interconnect with another crack initiated from a location near the end of CJP weld on the
outside of the rib (see Figure 5.30 for the cross section of the crack). Considering the
large size of the cracks observed at 1 million cycles and the variation of the measured
strains near the cracks, the cracks might have initiated much earlier than 1 million cycles.
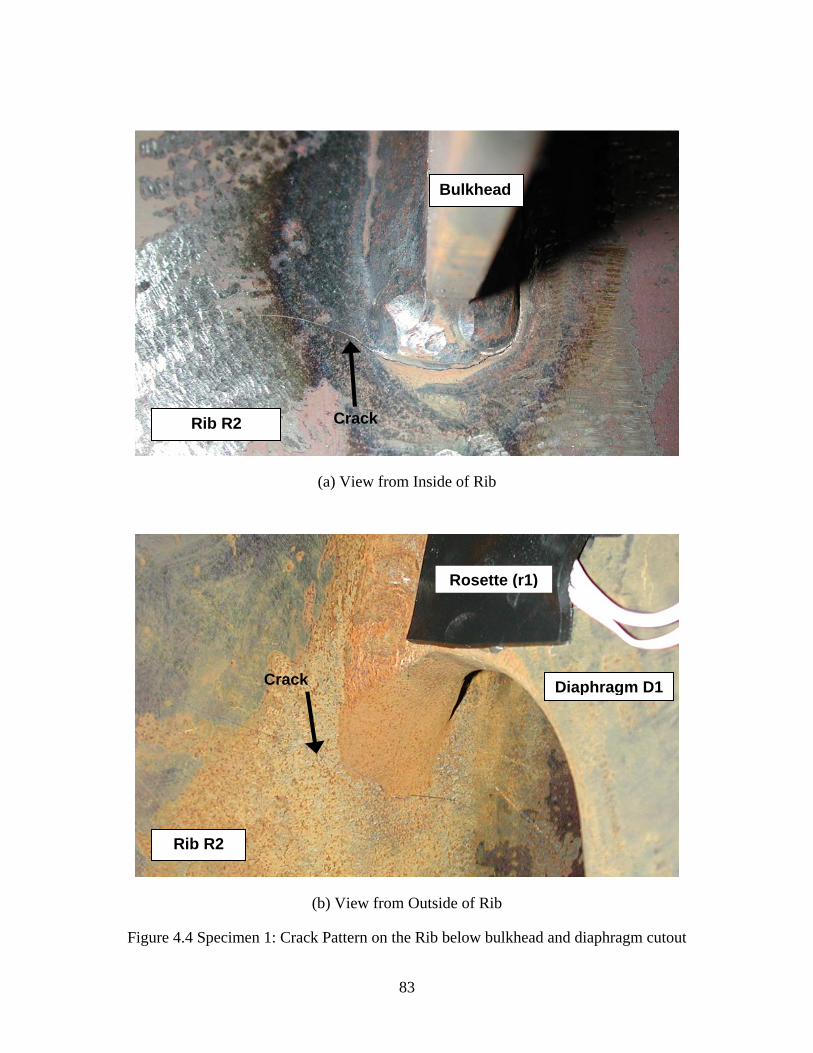
83
(a) View from Inside of Rib
(b) View from Outside of Rib
Figure 4.4 Specimen 1: Crack Pattern on the Rib below bulkhead and diaphragm cutout
Rib R2
Diaphragm D1
Rib R2
Bulkhead
Crack
Crack
Rosette (r1)
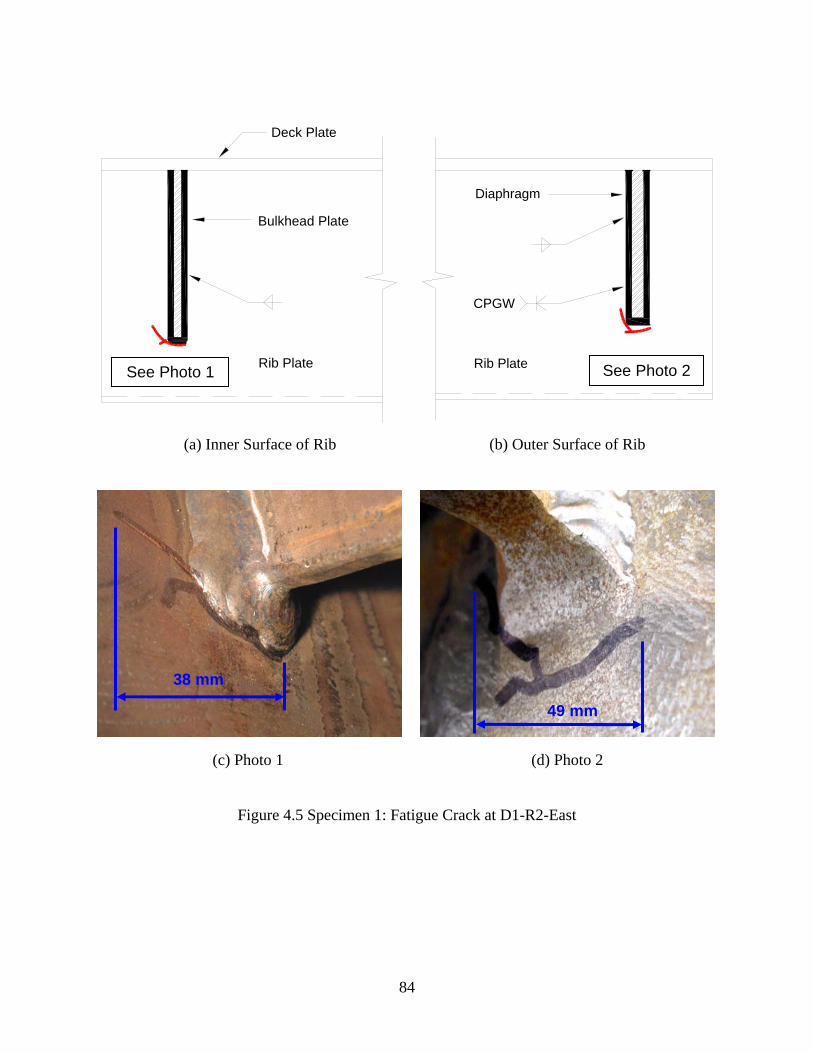
84
Bulkhead Plate
Deck Plate
Rib Plate
CPGW
Diaphragm
Rib Plate
(a) Inner Surface of Rib (b) Outer Surface of Rib
(c) Photo 1 (d) Photo 2
Figure 4.5 Specimen 1: Fatigue Crack at D1-R2-East
38 mm
49 mm
See Photo 1 See Photo 2
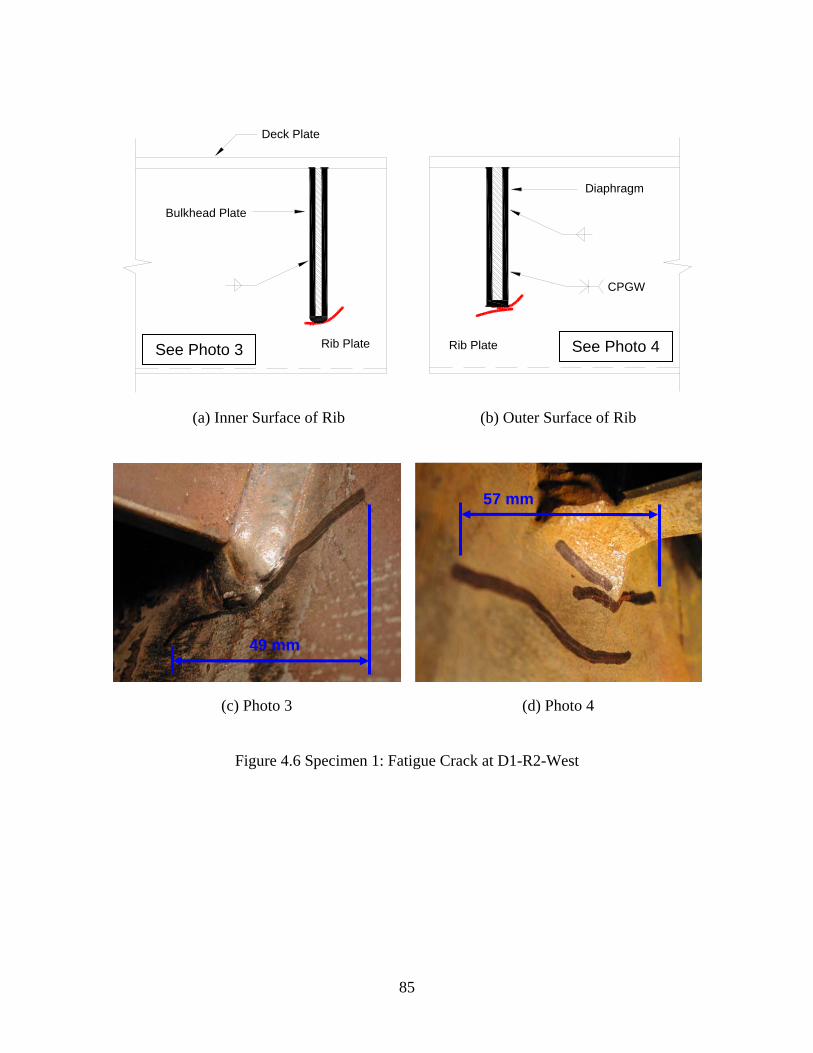
85
Bulkhead Plate
Deck Plate
Rib Plate
CPGW
Diaphragm
Rib Plate
(a) Inner Surface of Rib (b) Outer Surface of Rib
(c) Photo 3 (d) Photo 4
Figure 4.6 Specimen 1: Fatigue Crack at D1-R2-West
49 mm
57 mm
See Photo 3 See Photo 4
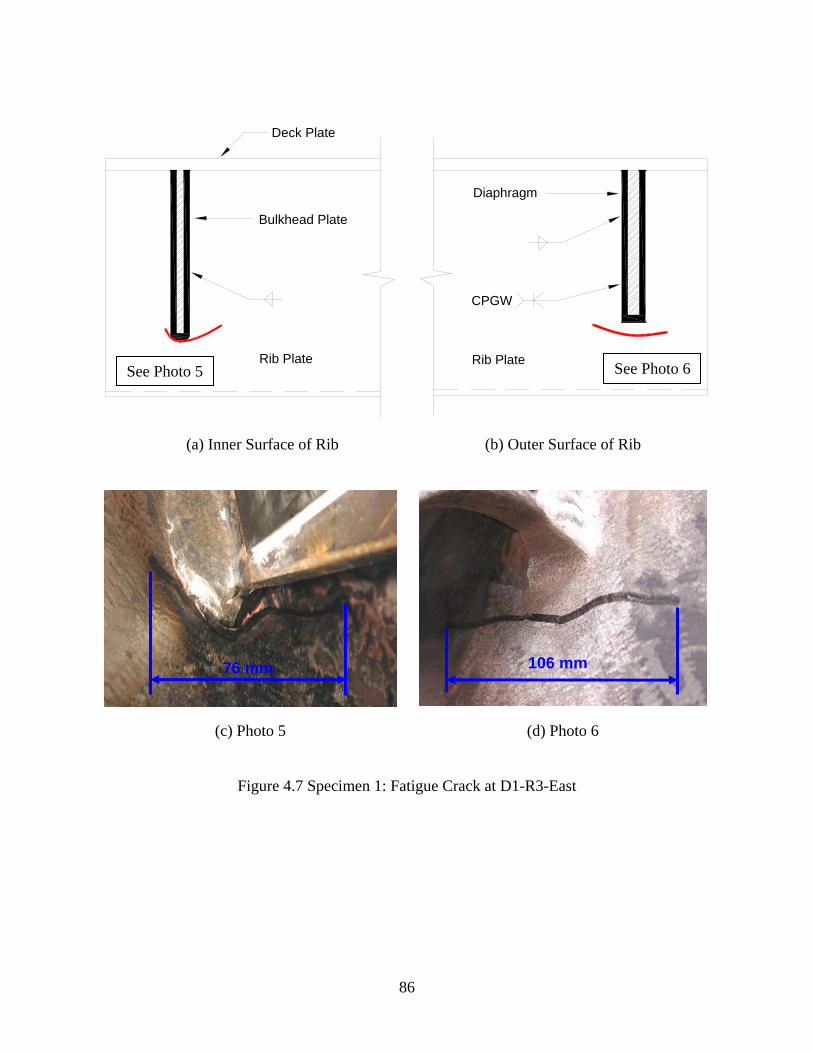
86
Bulkhead Plate
Deck Plate
Rib Plate
CPGW
Diaphragm
Rib Plate
(a) Inner Surface of Rib (b) Outer Surface of Rib
(c) Photo 5 (d) Photo 6
Figure 4.7 Specimen 1: Fatigue Crack at D1-R3-East
76 mm 106 mm
See Photo 5 See Photo 6
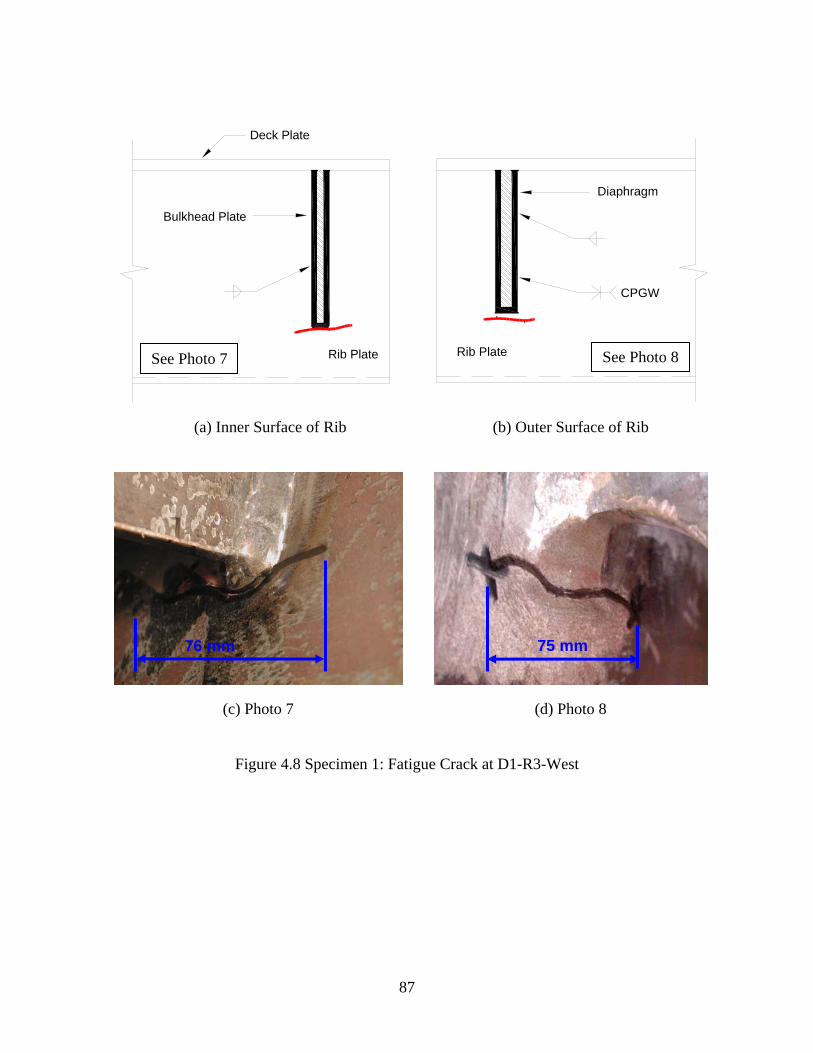
87
Bulkhead Plate
Deck Plate
Rib Plate
CPGW
Diaphragm
Rib Plate
(a) Inner Surface of Rib (b) Outer Surface of Rib
(c) Photo 7 (d) Photo 8
Figure 4.8 Specimen 1: Fatigue Crack at D1-R3-West
76 mm
See Photo 7 See Photo 8
75 mm
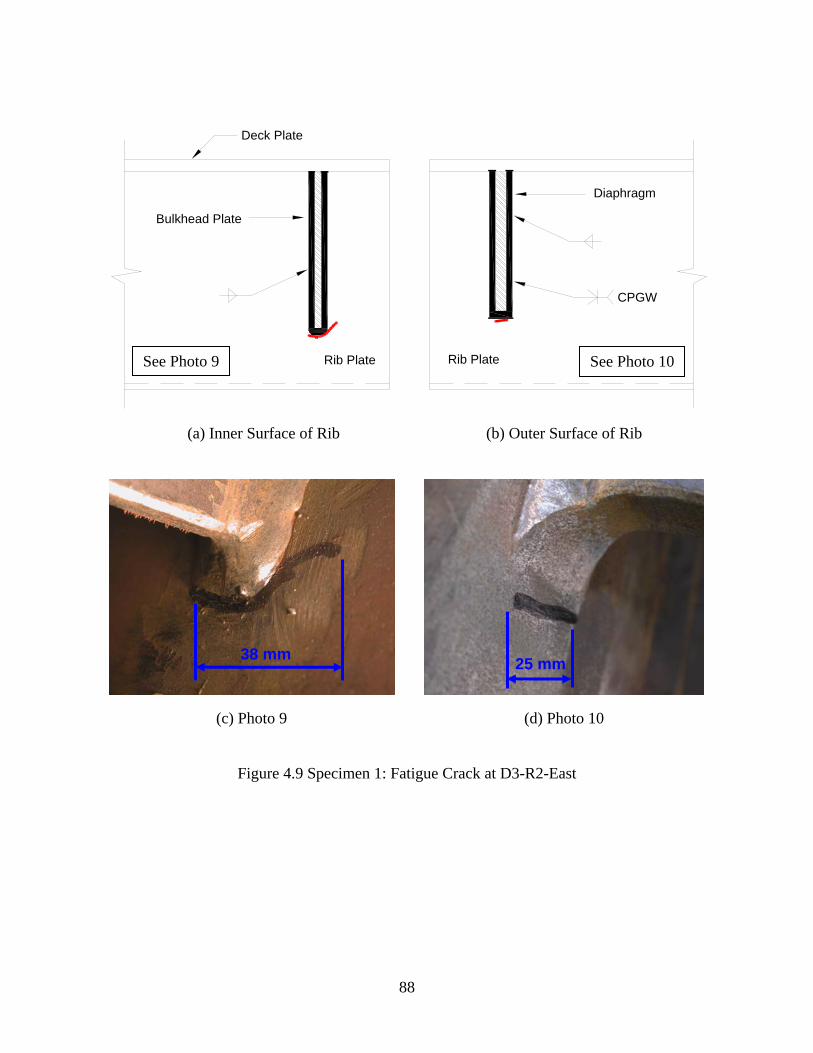
88
Bulkhead Plate
Deck Plate
Rib Plate
CPGW
Diaphragm
Rib Plate
(a) Inner Surface of Rib (b) Outer Surface of Rib
(c) Photo 9 (d) Photo 10
Figure 4.9 Specimen 1: Fatigue Crack at D3-R2-East
38 mm
See Photo 9 See Photo 10
25 mm
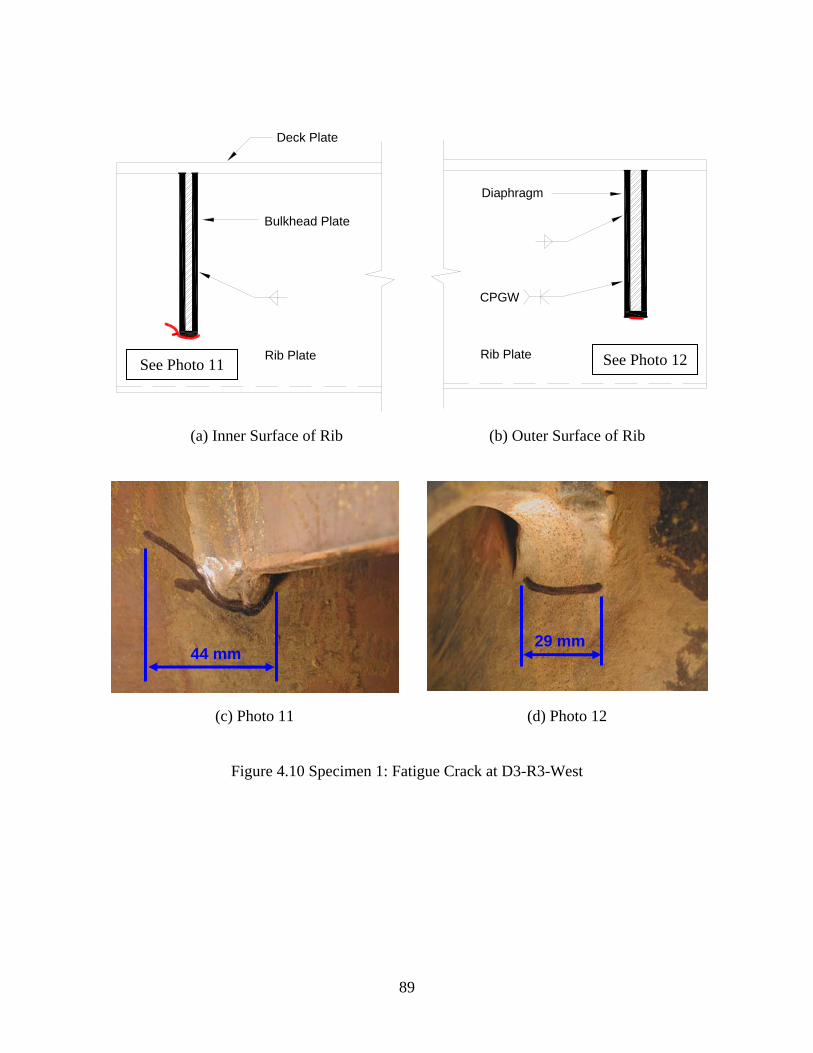
89
Bulkhead Plate
Deck Plate
Rib Plate
CPGW
Diaphragm
Rib Plate
(a) Inner Surface of Rib (b) Outer Surface of Rib
(c) Photo 11 (d) Photo 12
Figure 4.10 Specimen 1: Fatigue Crack at D3-R3-West
44 mm
See Photo 11 See Photo 12
29 mm
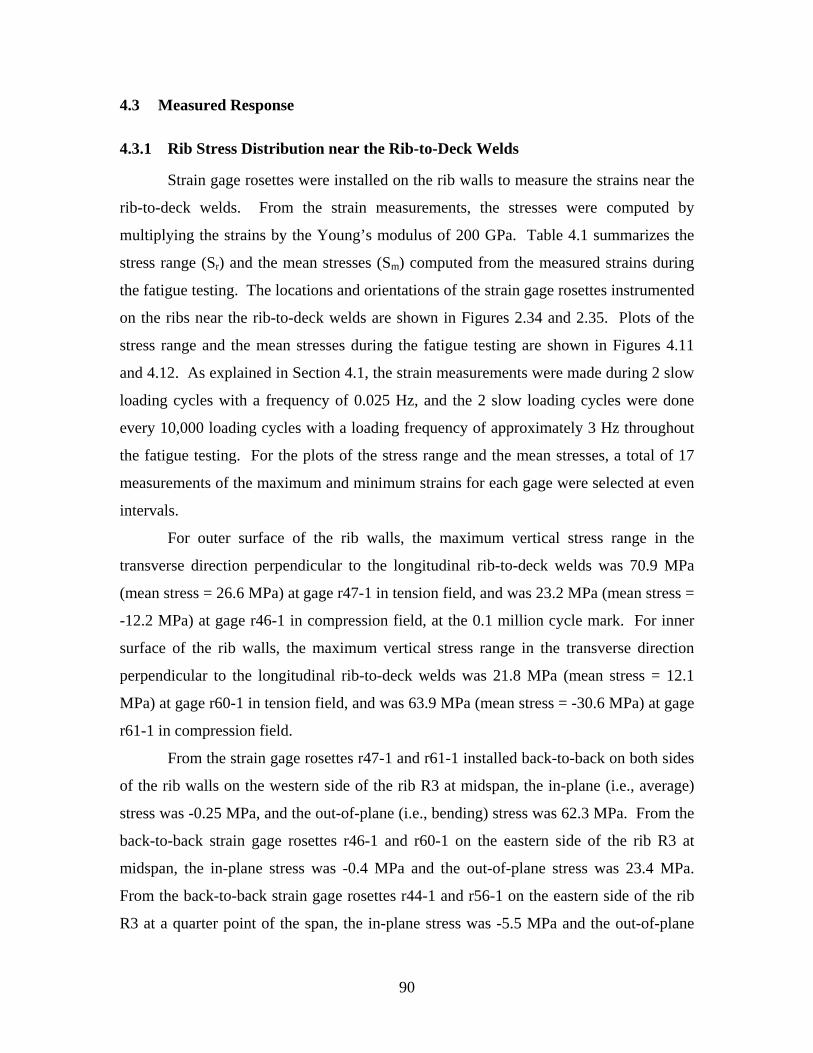
90
4.3 Measured Response
4.3.1 Rib Stress Distribution near the Rib-to-Deck Welds
Strain gage rosettes were installed on the rib walls to measure the strains near the
rib-to-deck welds. From the strain measurements, the stresses were computed by
multiplying the strains by the Young’s modulus of 200 GPa. Table 4.1 summarizes the
stress range (Sr) and the mean stresses (Sm) computed from the measured strains during
the fatigue testing. The locations and orientations of the strain gage rosettes instrumented
on the ribs near the rib-to-deck welds are shown in Figures 2.34 and 2.35. Plots of the
stress range and the mean stresses during the fatigue testing are shown in Figures 4.11
and 4.12. As explained in Section 4.1, the strain measurements were made during 2 slow
loading cycles with a frequency of 0.025 Hz, and the 2 slow loading cycles were done
every 10,000 loading cycles with a loading frequency of approximately 3 Hz throughout
the fatigue testing. For the plots of the stress range and the mean stresses, a total of 17
measurements of the maximum and minimum strains for each gage were selected at even
intervals.
For outer surface of the rib walls, the maximum vertical stress range in the
transverse direction perpendicular to the longitudinal rib-to-deck welds was 70.9 MPa
(mean stress = 26.6 MPa) at gage r47-1 in tension field, and was 23.2 MPa (mean stress =
-12.2 MPa) at gage r46-1 in compression field, at the 0.1 million cycle mark. For inner
surface of the rib walls, the maximum vertical stress range in the transverse direction
perpendicular to the longitudinal rib-to-deck welds was 21.8 MPa (mean stress = 12.1
MPa) at gage r60-1 in tension field, and was 63.9 MPa (mean stress = -30.6 MPa) at gage
r61-1 in compression field.
From the strain gage rosettes r47-1 and r61-1 installed back-to-back on both sides
of the rib walls on the western side of the rib R3 at midspan, the in-plane (i.e., average)
stress was -0.25 MPa, and the out-of-plane (i.e., bending) stress was 62.3 MPa. From the
back-to-back strain gage rosettes r46-1 and r60-1 on the eastern side of the rib R3 at
midspan, the in-plane stress was -0.4 MPa and the out-of-plane stress was 23.4 MPa.
From the back-to-back strain gage rosettes r44-1 and r56-1 on the eastern side of the rib
R3 at a quarter point of the span, the in-plane stress was -5.5 MPa and the out-of-plane
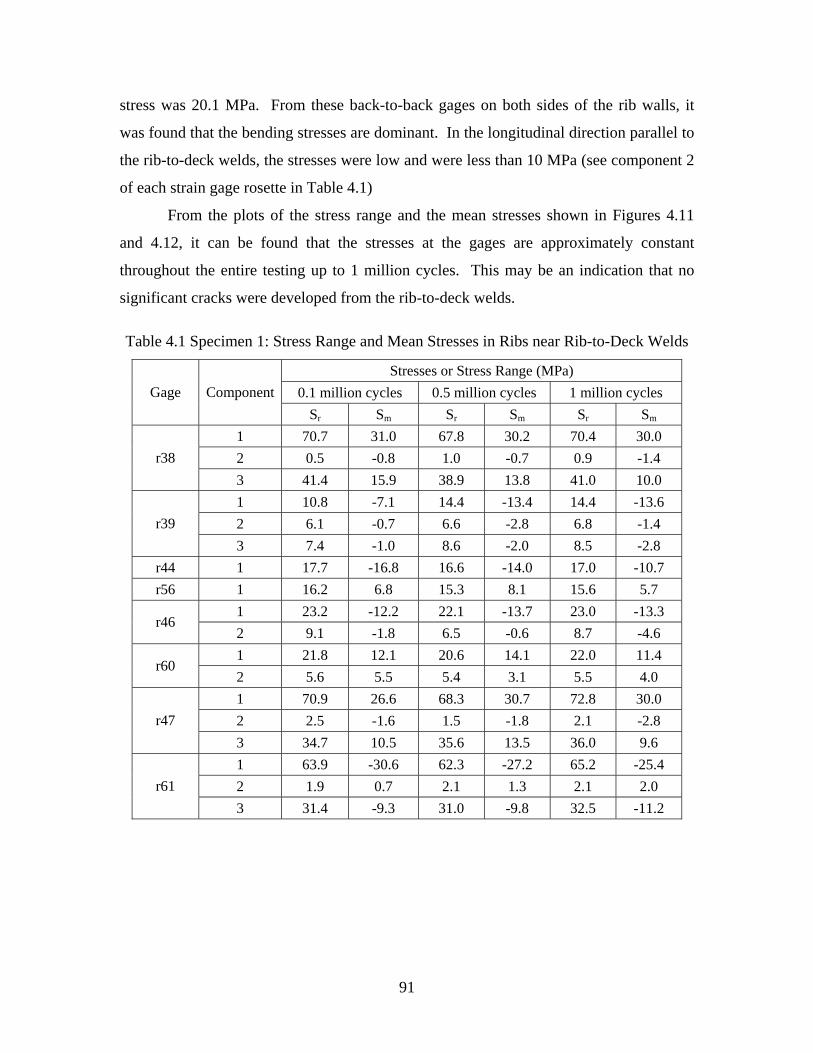
91
stress was 20.1 MPa. From these back-to-back gages on both sides of the rib walls, it
was found that the bending stresses are dominant. In the longitudinal direction parallel to
the rib-to-deck welds, the stresses were low and were less than 10 MPa (see component 2
of each strain gage rosette in Table 4.1)
From the plots of the stress range and the mean stresses shown in Figures 4.11
and 54.12, it can be found that the stresses at the gages are approximately constant
throughout the entire testing up to 1 million cycles. This may be an indication that no
significant cracks were developed from the rib-to-deck welds.
Table 4.1 Specimen 1: Stress Range and Mean Stresses in Ribs near Rib-to-Deck Welds
Stresses or Stress Range (MPa) 0.1 million cycles 0.5 million cycles 1 million cycles Gage Component
Sr Sm Sr Sm Sr Sm 1 70.7 31.0 67.8 30.2 70.4 30.0 2 0.5 -0.8 1.0 -0.7 0.9 -1.4 r38 3 41.4 15.9 38.9 13.8 41.0 10.0 1 10.8 -7.1 14.4 -13.4 14.4 -13.6 2 6.1 -0.7 6.6 -2.8 6.8 -1.4 r39 3 7.4 -1.0 8.6 -2.0 8.5 -2.8
r44 1 17.7 -16.8 16.6 -14.0 17.0 -10.7 r56 1 16.2 6.8 15.3 8.1 15.6 5.7
1 23.2 -12.2 22.1 -13.7 23.0 -13.3 r46
2 9.1 -1.8 6.5 -0.6 8.7 -4.6 1 21.8 12.1 20.6 14.1 22.0 11.4
r60 2 5.6 5.5 5.4 3.1 5.5 4.0 1 70.9 26.6 68.3 30.7 72.8 30.0 2 2.5 -1.6 1.5 -1.8 2.1 -2.8 r47 3 34.7 10.5 35.6 13.5 36.0 9.6 1 63.9 -30.6 62.3 -27.2 65.2 -25.4 2 1.9 0.7 2.1 1.3 2.1 2.0 r61 3 31.4 -9.3 31.0 -9.8 32.5 -11.2
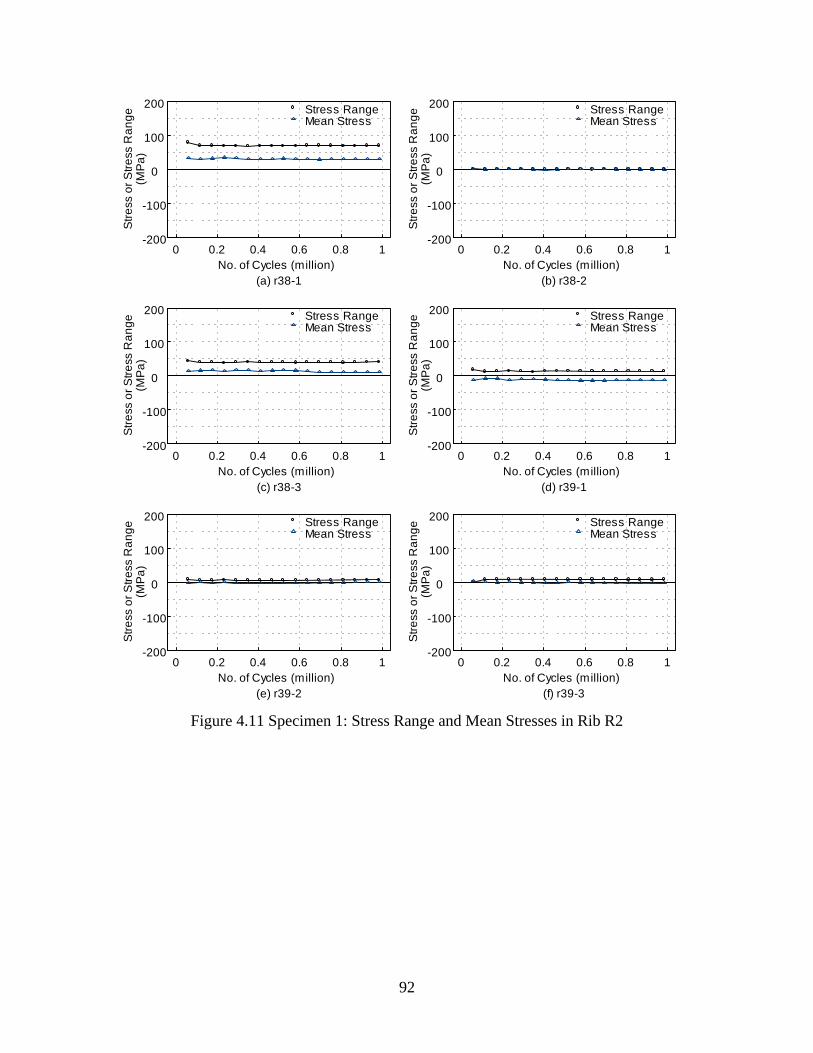
92
No. of Cycles (million)
Stre
ss o
r Stre
ss R
ange
(MPa
)
(a) r38-1
Stress RangeMean Stress
0 0.2 0.4 0.6 0.8 1-200
-100
0
100
200
No. of Cycles (million)
Stre
ss o
r Stre
ss R
ange
(MPa
)
(b) r38-2
Stress RangeMean Stress
0 0.2 0.4 0.6 0.8 1-200
-100
0
100
200
No. of Cycles (million)
Stre
ss o
r Stre
ss R
ange
(MP
a)
(c) r38-3
Stress RangeMean Stress
0 0.2 0.4 0.6 0.8 1-200
-100
0
100
200
No. of Cycles (million)
Stre
ss o
r Stre
ss R
ange
(MP
a)
(d) r39-1
Stress RangeMean Stress
0 0.2 0.4 0.6 0.8 1-200
-100
0
100
200
No. of Cycles (million)
Stre
ss o
r Stre
ss R
ange
(MPa
)
(e) r39-2
Stress RangeMean Stress
0 0.2 0.4 0.6 0.8 1-200
-100
0
100
200
No. of Cycles (million)
Stre
ss o
r Stre
ss R
ange
(MPa
)
(f) r39-3
Stress RangeMean Stress
0 0.2 0.4 0.6 0.8 1-200
-100
0
100
200
Figure 4.11 Specimen 1: Stress Range and Mean Stresses in Rib R2
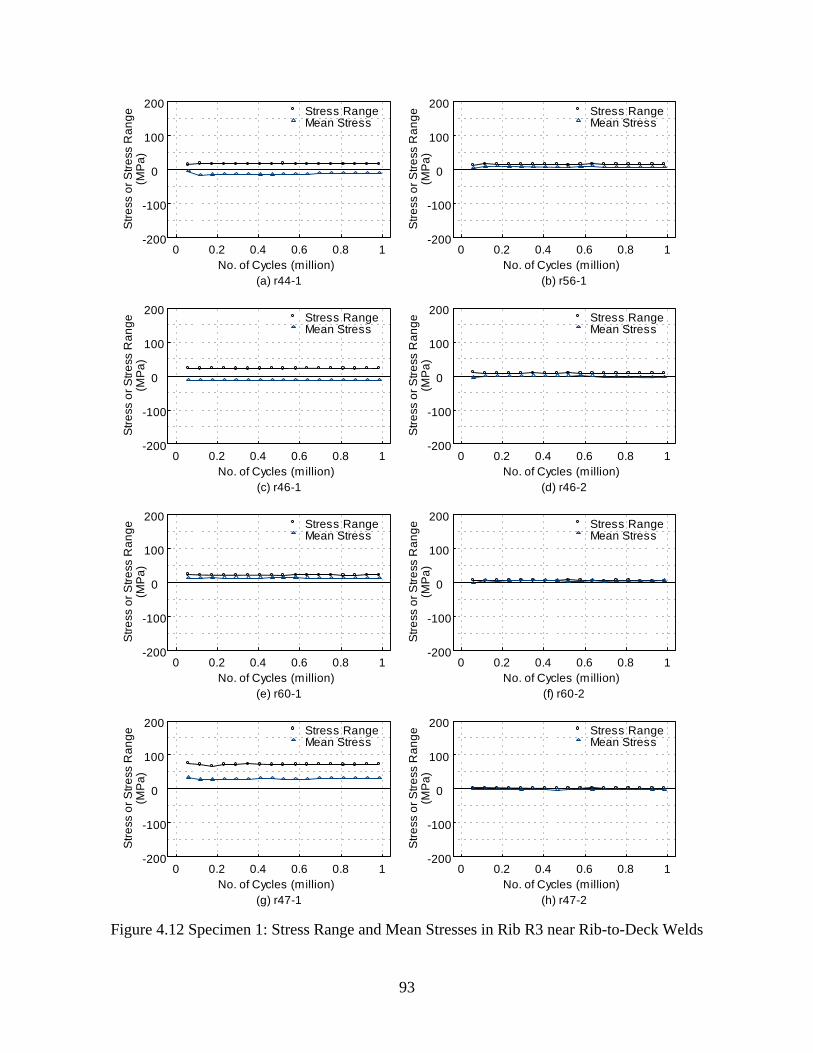
93
No. of Cycles (million)
Stre
ss o
r Stre
ss R
ange
(MP
a)
(a) r44-1
Stress RangeMean Stress
0 0.2 0.4 0.6 0.8 1-200
-100
0
100
200
No. of Cycles (million)
Stre
ss o
r Stre
ss R
ange
(MP
a)
(b) r56-1
Stress RangeMean Stress
0 0.2 0.4 0.6 0.8 1-200
-100
0
100
200
No. of Cycles (million)
Stre
ss o
r Stre
ss R
ange
(MP
a)
(c) r46-1
Stress RangeMean Stress
0 0.2 0.4 0.6 0.8 1-200
-100
0
100
200
No. of Cycles (million)
Stre
ss o
r Stre
ss R
ange
(MP
a)
(d) r46-2
Stress RangeMean Stress
0 0.2 0.4 0.6 0.8 1-200
-100
0
100
200
No. of Cycles (million)
Stre
ss o
r Stre
ss R
ange
(MP
a)
(e) r60-1
Stress RangeMean Stress
0 0.2 0.4 0.6 0.8 1-200
-100
0
100
200
No. of Cycles (million)
Stre
ss o
r Stre
ss R
ange
(MP
a)
(f) r60-2
Stress RangeMean Stress
0 0.2 0.4 0.6 0.8 1-200
-100
0
100
200
No. of Cycles (million)
Stre
ss o
r Stre
ss R
ange
(MP
a)
(g) r47-1
Stress RangeMean Stress
0 0.2 0.4 0.6 0.8 1-200
-100
0
100
200
No. of Cycles (million)
Stre
ss o
r Stre
ss R
ange
(MP
a)
(h) r47-2
Stress RangeMean Stress
0 0.2 0.4 0.6 0.8 1-200
-100
0
100
200
Figure 4.12 Specimen 1: Stress Range and Mean Stresses in Rib R3 near Rib-to-Deck Welds
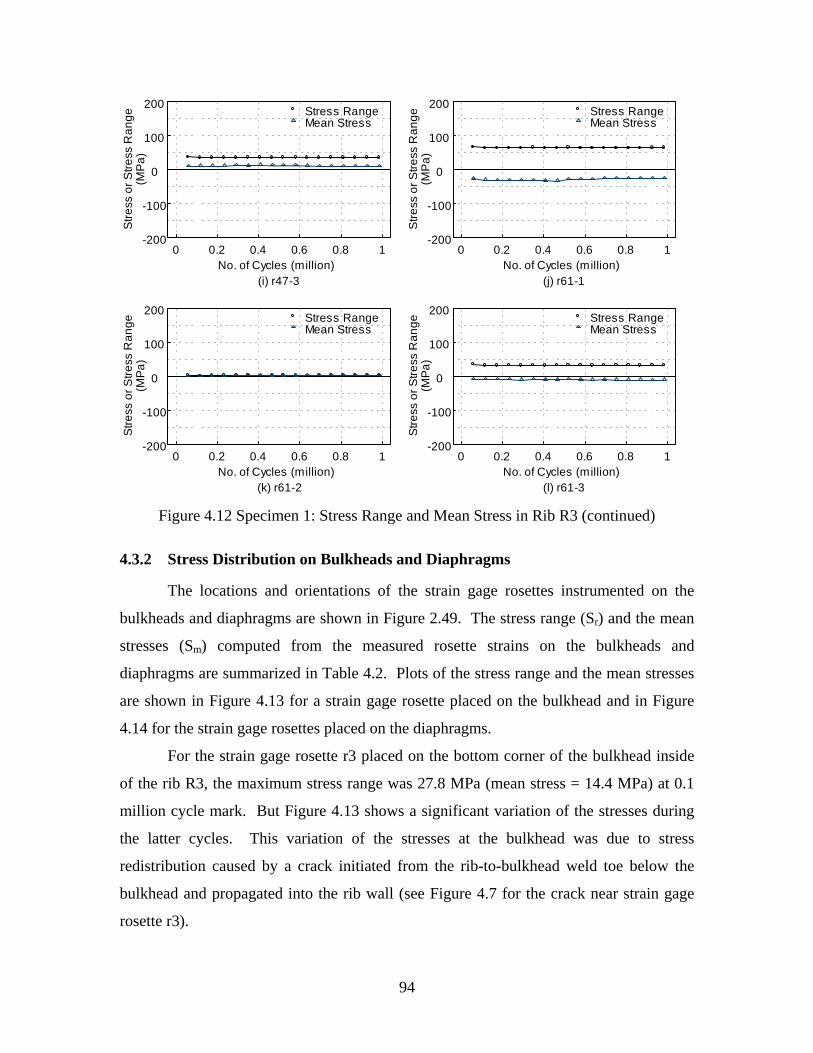
94
No. of Cycles (million)
Stre
ss o
r Stre
ss R
ange
(MP
a)
(i) r47-3
Stress RangeMean Stress
0 0.2 0.4 0.6 0.8 1-200
-100
0
100
200
No. of Cycles (million)
Stre
ss o
r Stre
ss R
ange
(MP
a)
(j) r61-1
Stress RangeMean Stress
0 0.2 0.4 0.6 0.8 1-200
-100
0
100
200
No. of Cycles (million)
Stre
ss o
r Stre
ss R
ange
(MPa
)
(k) r61-2
Stress RangeMean Stress
0 0.2 0.4 0.6 0.8 1-200
-100
0
100
200
No. of Cycles (million)
Stre
ss o
r Stre
ss R
ange
(MPa
)
(l) r61-3
Stress RangeMean Stress
0 0.2 0.4 0.6 0.8 1-200
-100
0
100
200
Figure 4.12 Specimen 1: Stress Range and Mean Stress in Rib R3 (continued)
4.3.2 Stress Distribution on Bulkheads and Diaphragms
The locations and orientations of the strain gage rosettes instrumented on the
bulkheads and diaphragms are shown in Figure 2.49. The stress range (Sr) and the mean
stresses (Sm) computed from the measured rosette strains on the bulkheads and
diaphragms are summarized in Table 4.2. Plots of the stress range and the mean stresses
are shown in Figure 4.13 for a strain gage rosette placed on the bulkhead and in Figure
4.14 for the strain gage rosettes placed on the diaphragms.
For the strain gage rosette r3 placed on the bottom corner of the bulkhead inside
of the rib R3, the maximum stress range was 27.8 MPa (mean stress = 14.4 MPa) at 0.1
million cycle mark. But Figure 4.13 shows a significant variation of the stresses during
the latter cycles. This variation of the stresses at the bulkhead was due to stress
redistribution caused by a crack initiated from the rib-to-bulkhead weld toe below the
bulkhead and propagated into the rib wall (see Figure 4.7 for the crack near strain gage
rosette r3).
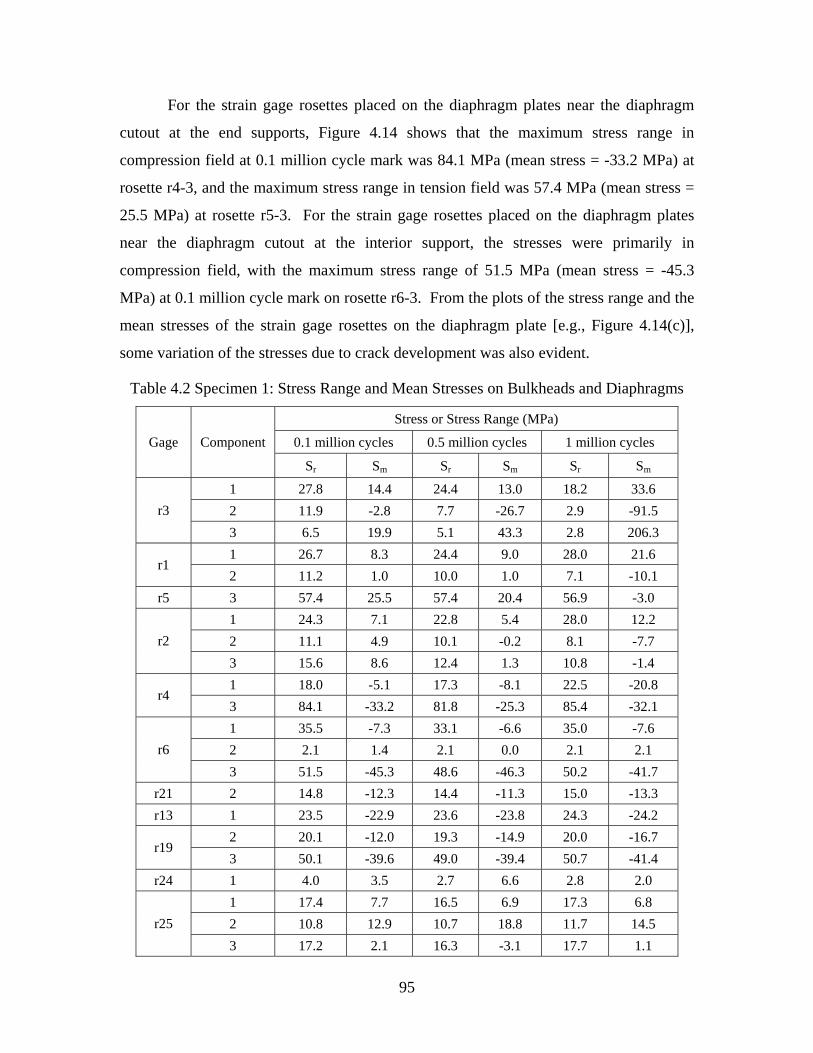
95
For the strain gage rosettes placed on the diaphragm plates near the diaphragm
cutout at the end supports, Figure 4.14 shows that the maximum stress range in
compression field at 0.1 million cycle mark was 84.1 MPa (mean stress = -33.2 MPa) at
rosette r4-3, and the maximum stress range in tension field was 57.4 MPa (mean stress =
25.5 MPa) at rosette r5-3. For the strain gage rosettes placed on the diaphragm plates
near the diaphragm cutout at the interior support, the stresses were primarily in
compression field, with the maximum stress range of 51.5 MPa (mean stress = -45.3
MPa) at 0.1 million cycle mark on rosette r6-3. From the plots of the stress range and the
mean stresses of the strain gage rosettes on the diaphragm plate [e.g., Figure 4.14(c)],
some variation of the stresses due to crack development was also evident.
Table 4.2 Specimen 1: Stress Range and Mean Stresses on Bulkheads and Diaphragms
Stress or Stress Range (MPa)
0.1 million cycles 0.5 million cycles 1 million cycles Gage Component
Sr Sm Sr Sm Sr Sm
1 27.8 14.4 24.4 13.0 18.2 33.6 2 11.9 -2.8 7.7 -26.7 2.9 -91.5 r3 3 6.5 19.9 5.1 43.3 2.8 206.3 1 26.7 8.3 24.4 9.0 28.0 21.6
r1 2 11.2 1.0 10.0 1.0 7.1 -10.1
r5 3 57.4 25.5 57.4 20.4 56.9 -3.0 1 24.3 7.1 22.8 5.4 28.0 12.2 2 11.1 4.9 10.1 -0.2 8.1 -7.7 r2 3 15.6 8.6 12.4 1.3 10.8 -1.4 1 18.0 -5.1 17.3 -8.1 22.5 -20.8
r4 3 84.1 -33.2 81.8 -25.3 85.4 -32.1 1 35.5 -7.3 33.1 -6.6 35.0 -7.6 2 2.1 1.4 2.1 0.0 2.1 2.1 r6 3 51.5 -45.3 48.6 -46.3 50.2 -41.7
r21 2 14.8 -12.3 14.4 -11.3 15.0 -13.3 r13 1 23.5 -22.9 23.6 -23.8 24.3 -24.2
2 20.1 -12.0 19.3 -14.9 20.0 -16.7 r19
3 50.1 -39.6 49.0 -39.4 50.7 -41.4 r24 1 4.0 3.5 2.7 6.6 2.8 2.0
1 17.4 7.7 16.5 6.9 17.3 6.8 2 10.8 12.9 10.7 18.8 11.7 14.5 r25 3 17.2 2.1 16.3 -3.1 17.7 1.1
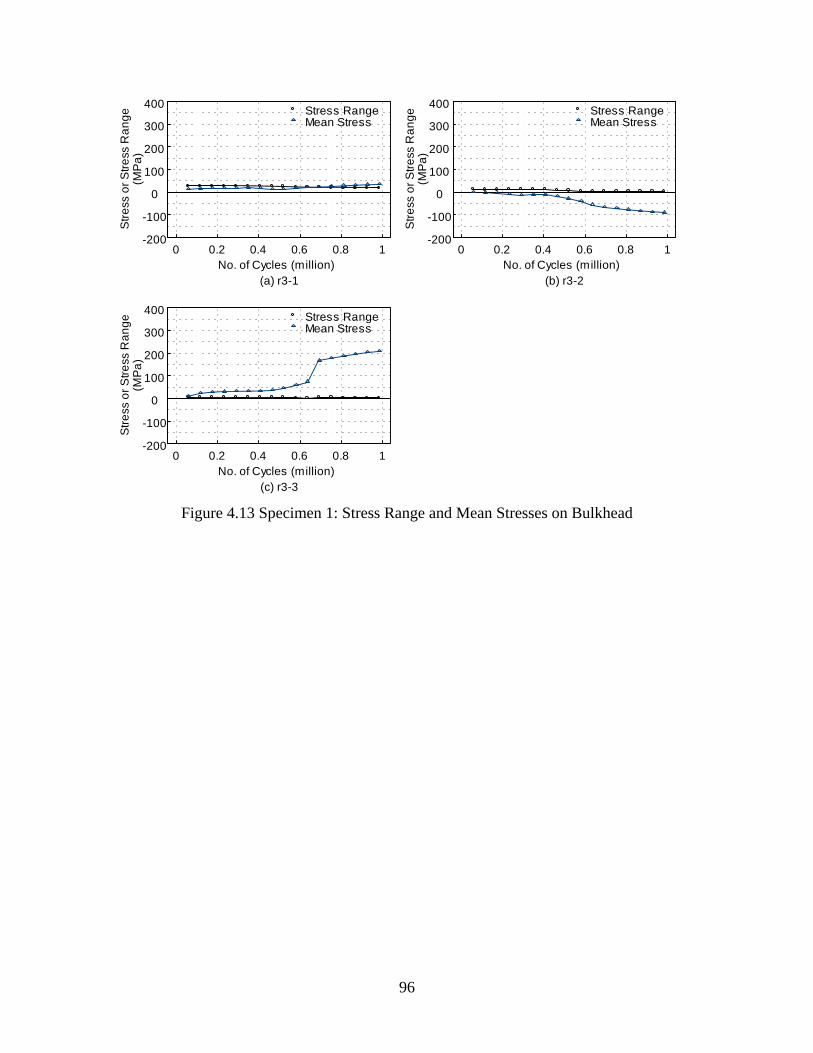
96
No. of Cycles (million)
Stre
ss o
r Stre
ss R
ange
(MP
a)
(a) r3-1
Stress RangeMean Stress
0 0.2 0.4 0.6 0.8 1-200
-100
0
100
200
300
400
No. of Cycles (million)
Stre
ss o
r Stre
ss R
ange
(MP
a)
(b) r3-2
Stress RangeMean Stress
0 0.2 0.4 0.6 0.8 1-200
-100
0
100
200
300
400
No. of Cycles (million)
Stre
ss o
r Stre
ss R
ange
(MPa
)
(c) r3-3
Stress RangeMean Stress
0 0.2 0.4 0.6 0.8 1-200
-100
0
100
200
300
400
Figure 4.13 Specimen 1: Stress Range and Mean Stresses on Bulkhead
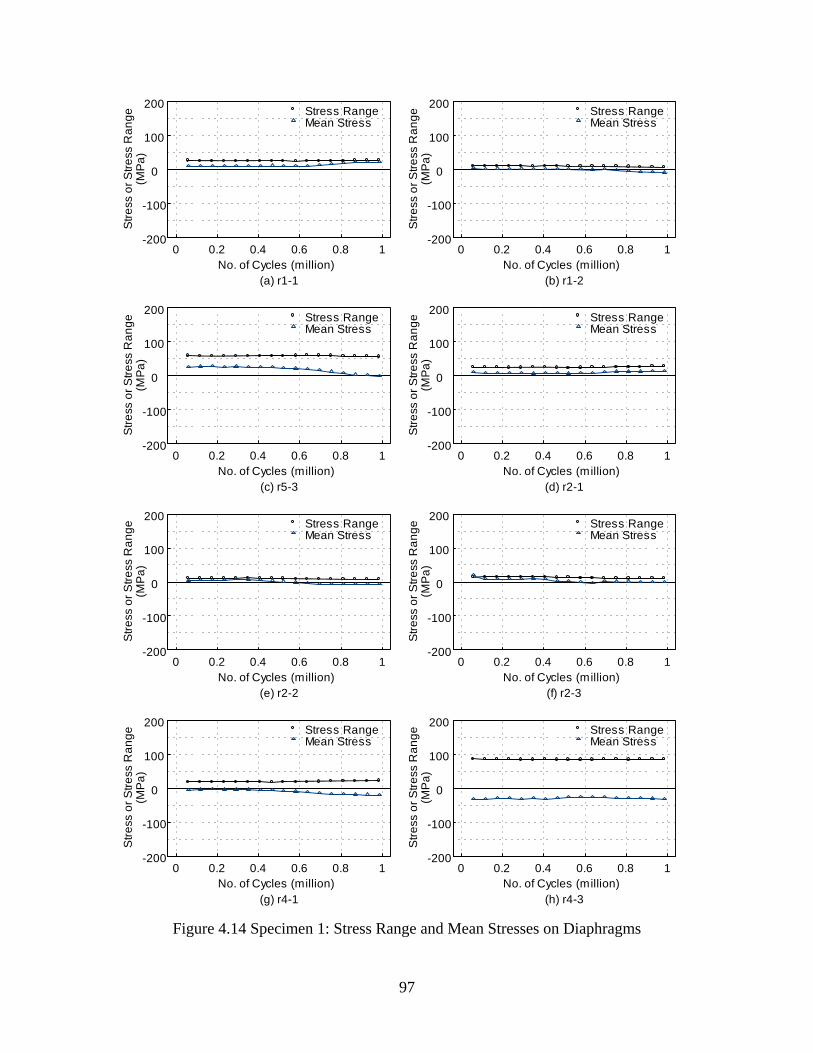
97
No. of Cycles (million)
Stre
ss o
r Stre
ss R
ange
(MPa
)
(a) r1-1
Stress RangeMean Stress
0 0.2 0.4 0.6 0.8 1-200
-100
0
100
200
No. of Cycles (million)
Stre
ss o
r Stre
ss R
ange
(MPa
)
(b) r1-2
Stress RangeMean Stress
0 0.2 0.4 0.6 0.8 1-200
-100
0
100
200
No. of Cycles (million)
Stre
ss o
r Stre
ss R
ange
(MPa
)
(c) r5-3
Stress RangeMean Stress
0 0.2 0.4 0.6 0.8 1-200
-100
0
100
200
No. of Cycles (million)
Stre
ss o
r Stre
ss R
ange
(MPa
)
(d) r2-1
Stress RangeMean Stress
0 0.2 0.4 0.6 0.8 1-200
-100
0
100
200
No. of Cycles (million)
Stre
ss o
r Stre
ss R
ange
(MPa
)
(e) r2-2
Stress RangeMean Stress
0 0.2 0.4 0.6 0.8 1-200
-100
0
100
200
No. of Cycles (million)
Stre
ss o
r Stre
ss R
ange
(MPa
)
(f) r2-3
Stress RangeMean Stress
0 0.2 0.4 0.6 0.8 1-200
-100
0
100
200
No. of Cycles (million)
Stre
ss o
r Stre
ss R
ange
(MP
a)
(g) r4-1
Stress RangeMean Stress
0 0.2 0.4 0.6 0.8 1-200
-100
0
100
200
No. of Cycles (million)
Stre
ss o
r Stre
ss R
ange
(MP
a)
(h) r4-3
Stress RangeMean Stress
0 0.2 0.4 0.6 0.8 1-200
-100
0
100
200
Figure 4.14 Specimen 1: Stress Range and Mean Stresses on Diaphragms
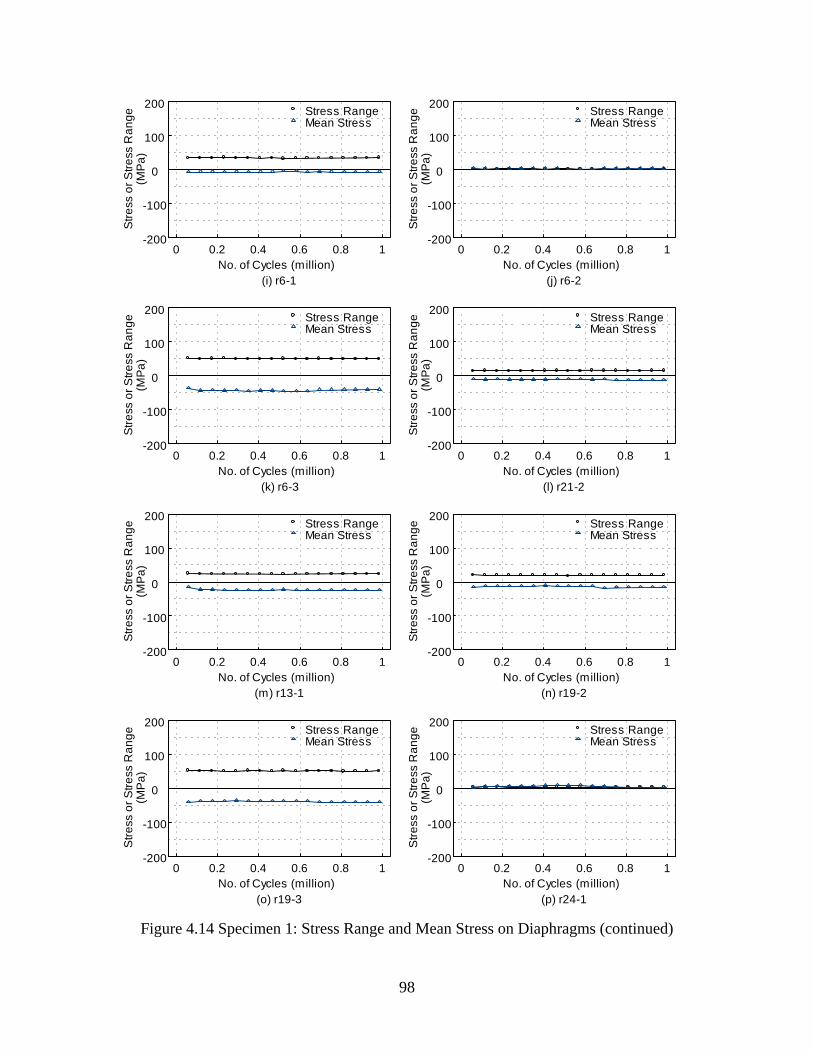
98
No. of Cycles (million)
Stre
ss o
r Stre
ss R
ange
(MPa
)
(i) r6-1
Stress RangeMean Stress
0 0.2 0.4 0.6 0.8 1-200
-100
0
100
200
No. of Cycles (million)
Stre
ss o
r Stre
ss R
ange
(MPa
)
(j) r6-2
Stress RangeMean Stress
0 0.2 0.4 0.6 0.8 1-200
-100
0
100
200
No. of Cycles (million)
Stre
ss o
r Stre
ss R
ange
(MPa
)
(k) r6-3
Stress RangeMean Stress
0 0.2 0.4 0.6 0.8 1-200
-100
0
100
200
No. of Cycles (million)
Stre
ss o
r Stre
ss R
ange
(MPa
)
(l) r21-2
Stress RangeMean Stress
0 0.2 0.4 0.6 0.8 1-200
-100
0
100
200
No. of Cycles (million)
Stre
ss o
r Stre
ss R
ange
(MPa
)
(m) r13-1
Stress RangeMean Stress
0 0.2 0.4 0.6 0.8 1-200
-100
0
100
200
No. of Cycles (million)
Stre
ss o
r Stre
ss R
ange
(MPa
)
(n) r19-2
Stress RangeMean Stress
0 0.2 0.4 0.6 0.8 1-200
-100
0
100
200
No. of Cycles (million)
Stre
ss o
r Stre
ss R
ange
(MP
a)
(o) r19-3
Stress RangeMean Stress
0 0.2 0.4 0.6 0.8 1-200
-100
0
100
200
No. of Cycles (million)
Stre
ss o
r Stre
ss R
ange
(MP
a)
(p) r24-1
Stress RangeMean Stress
0 0.2 0.4 0.6 0.8 1-200
-100
0
100
200
Figure 4.14 Specimen 1: Stress Range and Mean Stress on Diaphragms (continued)
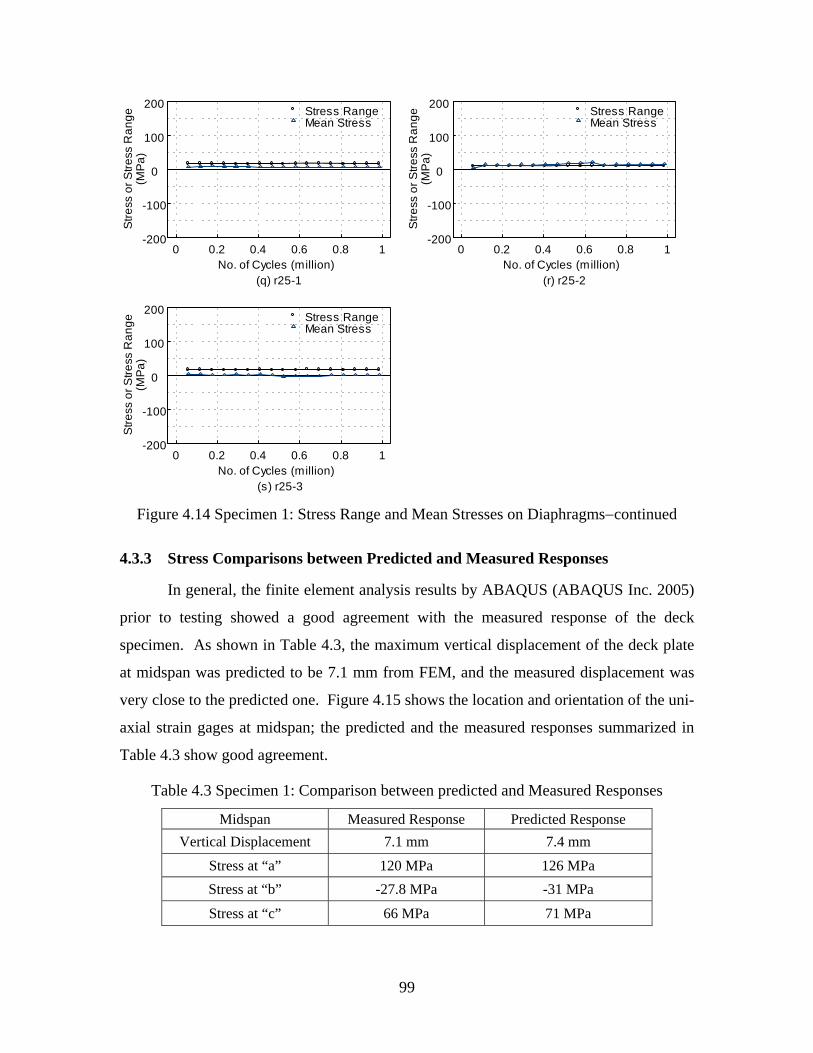
99
No. of Cycles (million)
Stre
ss o
r Stre
ss R
ange
(MPa
)
(q) r25-1
Stress RangeMean Stress
0 0.2 0.4 0.6 0.8 1-200
-100
0
100
200
No. of Cycles (million)
Stre
ss o
r Stre
ss R
ange
(MPa
)
(r) r25-2
Stress RangeMean Stress
0 0.2 0.4 0.6 0.8 1-200
-100
0
100
200
No. of Cycles (million)
Stre
ss o
r Stre
ss R
ange
(MPa
)
(s) r25-3
Stress RangeMean Stress
0 0.2 0.4 0.6 0.8 1-200
-100
0
100
200
Figure 4.14 Specimen 1: Stress Range and Mean Stresses on Diaphragms−continued
4.3.3 Stress Comparisons between Predicted and Measured Responses
In general, the finite element analysis results by ABAQUS (ABAQUS Inc. 2005)
prior to testing showed a good agreement with the measured response of the deck
specimen. As shown in Table 4.3, the maximum vertical displacement of the deck plate
at midspan was predicted to be 7.1 mm from FEM, and the measured displacement was
very close to the predicted one. Figure 4.15 shows the location and orientation of the uni-
axial strain gages at midspan; the predicted and the measured responses summarized in
Table 4.3 show good agreement.
Table 4.3 Specimen 1: Comparison between predicted and Measured Responses
Midspan Measured Response Predicted Response Vertical Displacement 7.1 mm 7.4 mm
Stress at “a” 120 MPa 126 MPa Stress at “b” -27.8 MPa -31 MPa
Stress at “c” 66 MPa 71 MPa
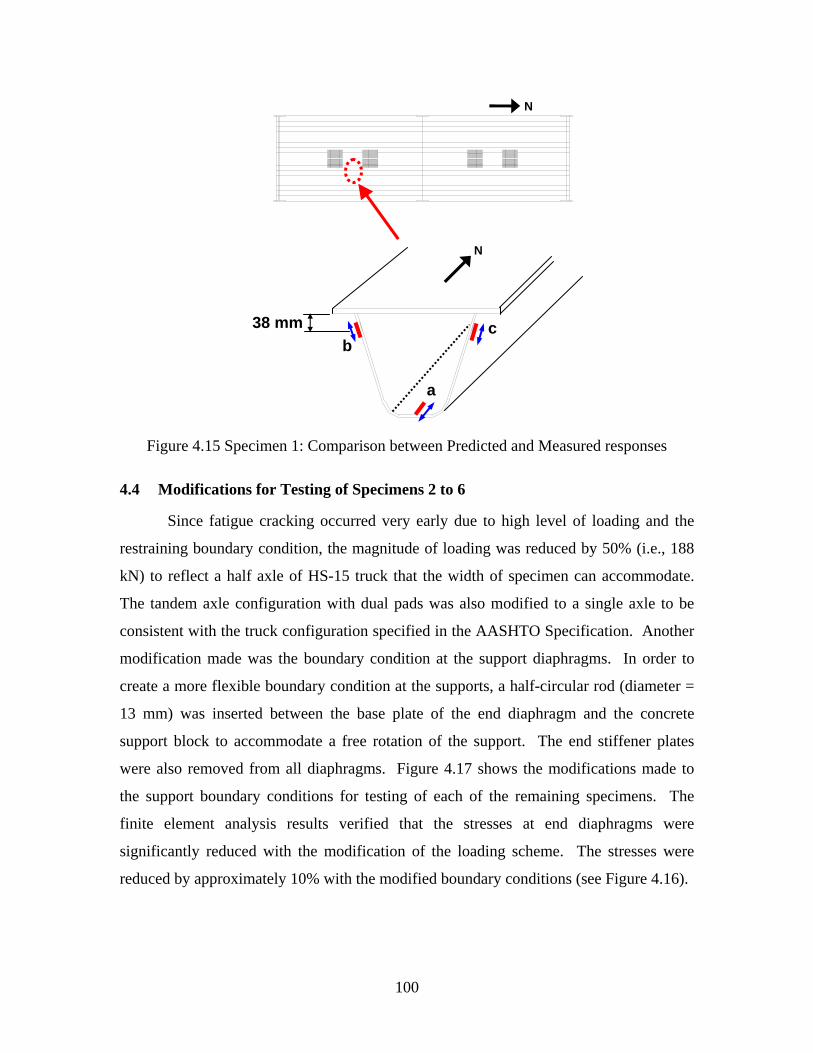
100
Figure 4.15 Specimen 1: Comparison between Predicted and Measured responses
4.4 Modifications for Testing of Specimens 2 to 6
Since fatigue cracking occurred very early due to high level of loading and the
restraining boundary condition, the magnitude of loading was reduced by 50% (i.e., 188
kN) to reflect a half axle of HS-15 truck that the width of specimen can accommodate.
The tandem axle configuration with dual pads was also modified to a single axle to be
consistent with the truck configuration specified in the AASHTO Specification. Another
modification made was the boundary condition at the support diaphragms. In order to
create a more flexible boundary condition at the supports, a half-circular rod (diameter =
13 mm) was inserted between the base plate of the end diaphragm and the concrete
support block to accommodate a free rotation of the support. The end stiffener plates
were also removed from all diaphragms. Figure 4.17 shows the modifications made to
the support boundary conditions for testing of each of the remaining specimens. The
finite element analysis results verified that the stresses at end diaphragms were
significantly reduced with the modification of the loading scheme. The stresses were
reduced by approximately 10% with the modified boundary conditions (see Figure 4.16).
b c
a
38 mm
N
N
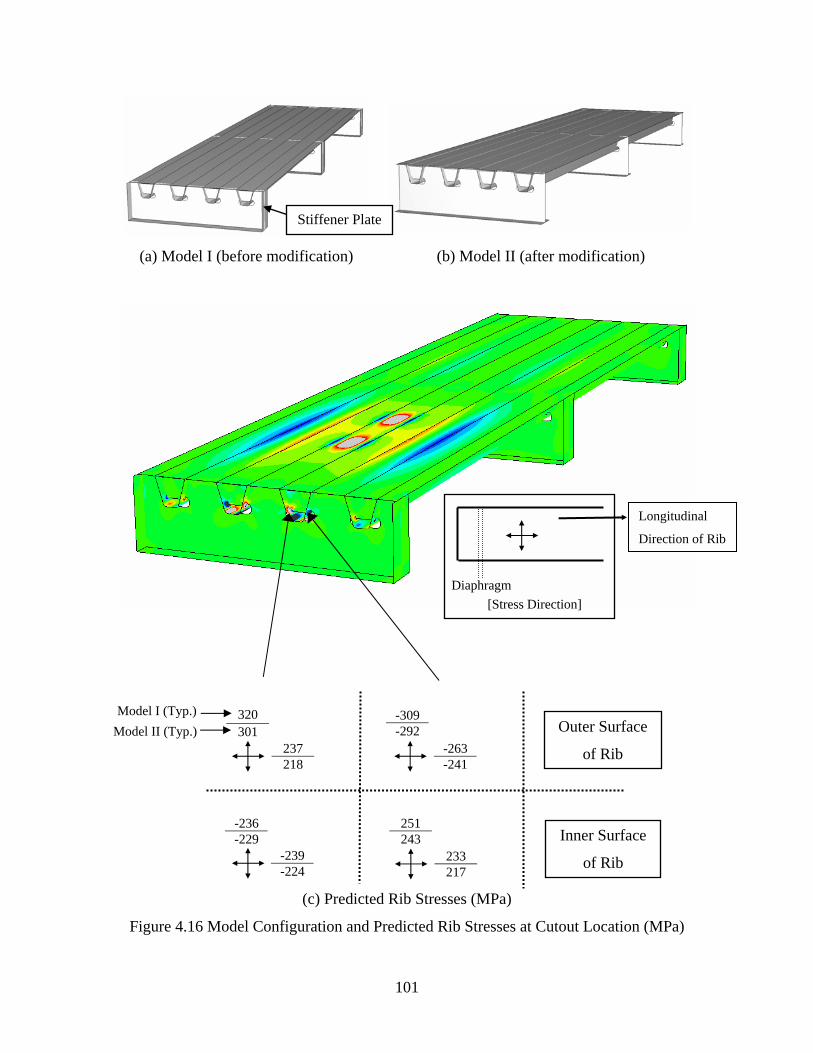
101
(a) Model I (before modification) (b) Model II (after modification)
(c) Predicted Rib Stresses (MPa)
Figure 4.16 Model Configuration and Predicted Rib Stresses at Cutout Location (MPa)
Stiffener Plate
Diaphragm
Longitudinal
Direction of Rib
[Stress Direction]
-263 -241
-309 -292
-239 -224
-236 -229
237 218
320 301
233 217
251 243
Outer Surface
of Rib
Inner Surface
of Rib
Model I (Typ.) Model II (Typ.)
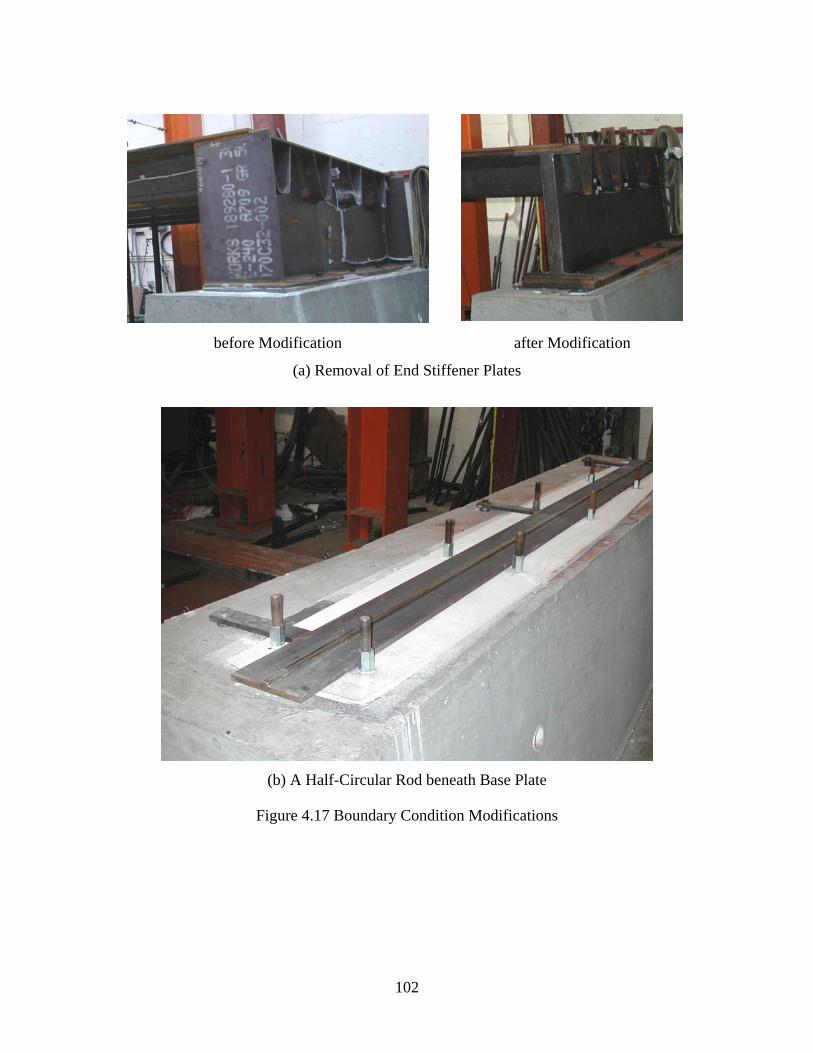
102
before Modification after Modification
(a) Removal of End Stiffener Plates
(b) A Half-Circular Rod beneath Base Plate
Figure 4.17 Boundary Condition Modifications
103
5. SPECIMENS 2 TO 6 TEST RESULTS
5.1 Testing Program
Fatigue testing was conducted for each of the remaining 5 specimens up to 6
million cycles. Each specimen was loaded with a single pad centered at the midspan (see
Figure 5.1 for plan view). The measured maximum vertical displacement of the deck
plate measured at midspan was approximately between 4 mm and 6 mm (4.8 mm from
ABAQUS analysis). See Figure 4.2 for sample load and displacement responses. Strain
measurements were made approximately at every 1 kip actuator loading during 2 slow
loading cycles with an approximate frequency of 0.025 Hz, and then the 2 slow loading
cycles were conducted every 10,000 loading cycles with a frequency ranged between 3.8
Hz and 5.7 Hz throughout the fatigue testing.
Since no significant damage at the rib-to-deck PJP welds was observed, the
magnitude of loading (188 kN) was increased by 50% to 282 kN for the next one million
cycles, and twice of the original load level (376 kN) was used for the last one million
cycles before the test was stopped. The maximum vertical displacement of the deck plate
at midspan increased linearly for each of the increased loading level. Regions of rib-to-
deck welds under the loading pad were cut out for crack inspection after completion of
testing at 8 million cycles. Fatigue cracks at the rib-to-deck welds were observed from 3
specimens (Specimens 2, 3, and 6). Most of the observed cracks at the rib-to-deck welds
showed a pattern that the fatigue crack initiated from the weld toe on the bottom of the
deck plate, and propagated upward into the deck plate. One crack from Specimen 6
initiated from the weld root, which was not visible from outside of the rib, and
propagated into the deck plate. The crack from the weld root started from the region of
transition between 80% PJP with no melt-through and 100% PJP with melt-through.
Ultrasonic test (UT) was conducted by a local inspection company to detect
cracks at the rib-to-deck welds each time the loading level was increased by 50%.
Unfortunately, such effort was no fruitful due to the complicated local geometry at the
rib-to-deck welded joints. Therefore, it was not clear when the cracks at these welds
were initiated.
104
With the modified loading scheme and boundary condition, the development of
the fatigue cracks that initiated from the rib-to-bulkhead weld toe was delayed
significantly. Crack regions at the support diaphragms were cut out for further crack
inspection after completion of testing at 8 million cycles. Like Specimen 1, the
distortion-induced fatigue cracks at the end supports first initiated at lower end of the
bulkhead-to-rib fillet welds. The cracks then propagated into the rib wall, which tended
to interconnect with another crack initiated from a location near the end of CJP weld on
the outside of rib.
3000
50005000
510
250
R4
R3
R2
R1
D3 D2 D1N
Loading Pad
unit = mm
Figure 5.1 Specimens 2 to 6: Plan View with Rib and Diaphragm Designations
105
time
(a) Applied Loads
Load
(kN
)
0
100
200
north actuatorsouth actuator
time
Def
lect
ion
(mm
)
(b) Midspan Deflections
0
2
4
6north spansouth span
Figure 5.2 Specimens 2 to 6: Typical Applied Load and Measured Deflection Time History
5.2 Measured Response near the Rib-to-Deck PJP Welds
5.2.1 Deck Plate Stress Distribution
Strain gages were installed on the deck plate to measure the strains near the rib-to-
deck welds, primarily in the transverse (or width) direction. The stress range (Sr) and the
mean stress (Sm) computed from the measured strains are summarized in Tables 5.1 to
5.3 (gage readings for Specimens 2 and 3 were not reliable and are not presented).
Figures 5.3 to 5.5 show the plots of the stress range and the mean stress during the entire
fatigue testing conducted up to 8 million cycles. For Specimen 5, data beyond 7 million
cycles are not presented due to problems with the data acquisition system. The jump of
strain readings after 6 million and 7 million cycles was due to the increase of load
magnitude.
The location and orientation of the strain gages on the deck plate near the rib-to-
deck welds were shown in Figures 2.31 to 2.33. Strain gages on the bottom side of the
deck plate were placed either 10 mm or 25 mm away from the weld toe of the rib-to-deck
welds. The stresses in the deck plate near the rib-to-deck welds were low during the first
106
6 million cycles. The maximum stress range of 35.9 MPa (mean stress = 12.6 MPa) in
tension field on the bottom of the deck plate, which occurred at 0.1 million cycle, was
computed at gage S49 in Specimen 4. This midspan gage was placed 25 mm away from
the weld toe on the bottom of the deck plate and oriented in the transverse direction. The
maximum stress range of 33.3 MPa (mean stress = -19.5 MPa) in compression field on
the bottom of the deck plate was computed from component 1 (transverse direction) of
rosette r21 in Specimen 4. This strain gage rosette was placed 10 mm away from the
weld toe on the bottom of the deck plate.
In order to compute the in-plane and out-of-plane (bending) stress components
from the strain measurements in the transverse direction, a pair of uni-axial strain gages
were placed on both sides of the deck plate on the eastern side of the rib R2 and on the
western side of the rib R3 in Specimens 5 and 6 (see Figures 2.32 and 2.33). For the S19
and S20 pair in Specimen 5, the in-plane stress was 4.8 MPa and the out-of-plane stress
was 16.5 MPa at 0.1 million cycle. For the S31 and S32 pair in Specimen 6, the in-plane
stress was 3.7 MPa and the out-of-plane stress was 14.7 MPa at 0.1 million cycle.
Table 5.1 Specimen 4: Stress Range and Mean Stress in Deck Plate near the PJP Welds
Stress or Stress Range (MPa) 0.1 M cycles 3 M cycles 5.9 M cycles 6.5 M cycles 7.5 M cycles Gage Component Sr Sm Sr Sm Sr Sm Sr Sm Sr Sm
1 1.0 -0.7 0.4 -1.8 2.0 -2.7 7.3 -6.0 8.8 -7.3 r17
3 24.3 -11.9 30.6 -15.0 32.6 -17.1 53.3 -28.3 69.6 -36.2 1 23.8 -14.7 19.9 -15.3 24.8 -15.5 48.5 -31.8 65.7 -42.1 2 16.0 -6.9 16.0 -7.5 14.1 -4.6 21.0 -7.8 28.7 -10.7 r18 3 23.4 -11.7 20.8 -12.5 22.0 -5.3 40.5 -18.9 56.6 -25.7 1 13.2 -8.2 8.7 -7.5 13.1 -8.1 32.5 -22.1 52.0 -33.0
r19 2 18.8 -7.5 17.0 -5.5 18.3 -6.3 24.6 -9.6 31.3 -11.9
r20 2 24.5 -11.4 24.3 -11.1 24.4 -9.8 37.0 -15.8 49.3 -23.4 1 33.3 -19.5 35.9 -24.1 40.4 -23.6 60.3 -38.2 88.2 -54.0 2 20.3 -8.8 19.0 -8.8 20.3 -7.7 27.6 -11.4 41.4 -20.2 r21 3 36.4 -18.2 35.6 -20.0 40.2 -24.2 57.8 -35.9 87.1 -50.8 1 19.6 -9.3 22.4 -13.1 25.6 -13.4 43.9 -26.7 64.3 -35.7 2 16.5 -6.4 15.9 -5.7 14.6 -4.0 23.0 -8.1 28.8 -10.9 r22 3 15.1 -7.1 19.3 -9.8 19.9 -10.9 28.5 -14.0 45.0 -22.9
r23 2 21.7 -6.3 20.8 -3.2 19.7 -4.9 29.5 -9.8 38.4 -16.9 r24 2 20.0 -8.3 15.7 -4.8 19.9 -7.4 26.6 -8.3 36.9 -10.9

107
Table 5.2 Specimen 5: Stress Range and Mean Stress in Deck Plate near the PJP Welds
Stress or Stress Range (MPa) 0.1 M cycles 3 M cycles 5.9 M cycles 6.1 M cycles 6.9 M cycles Gage Sr Sm Sr Sm Sr Sm Sr Sm Sr Sm
S17 27.7 7.8 29.4 9.7 29.6 8.6 46.4 14.3 44.5 14.0 S18 18.0 -3.8 20.0 -5.3 20.8 -6.0 32.4 -9.6 30.3 -9.1 S19 27.6 7.5 30.2 8.0 30.1 8.6 47.9 14.7 45.5 13.4 S20 18.1 -2.7 20.2 -4.0 21.3 -3.9 33.0 -9.0 30.9 -8.1 S21 29.7 8.6 32.4 8.4 32.2 10.0 50.5 14.1 47.9 13.4 S22 18.9 -3.3 19.8 -6.1 21.0 -4.6 31.1 -10.4 29.9 -10.0 S23 3.2 0.7 1.6 -0.3 0.2 -0.5 2.5 -1.4 4.7 -5.8 S24 9.2 2.7 2.8 -1.9 1.9 -2.6 13.6 1.2 5.7 -10.7 S25 9.6 4.2 7.6 1.7 4.2 2.1 18.1 5.3 4.2 -2.8 S26 2.9 -0.5 3.4 -0.3 5.8 -2.3 8.7 -2.0 4.6 -1.3 S27 11.8 -7.3 16.3 -14.1 21.3 -14.6 29.7 -27.6 21.1 -23.9 S28 1.9 -0.7 8.5 -4.7 12.6 -6.4 13.1 -8.0 8.8 -7.7 S29 28.3 8.0 30.3 8.1 30.8 10.1 46.7 12.6 46.8 14.4 S30 15.9 -2.5 18.5 -4.7 19.7 -5.3 27.6 -7.0 28.4 -9.1 S31 26.3 6.4 29.1 8.3 29.4 8.4 44.2 13.5 44.8 14.6 S32 14.9 -2.1 17.7 -3.0 19.1 -4.0 26.1 -6.6 26.9 -6.8 S33 28.5 7.0 31.1 7.8 31.3 8.1 46.6 12.6 47.2 13.6 S34 17.3 -2.7 19.2 -4.5 19.9 -5.2 28.1 -7.4 28.7 -8.3 S35 32.4 9.5 35.3 8.6 37.1 10.0 52.6 12.3 49.4 11.0 S36 21.0 -5.5 24.9 -8.7 25.3 -7.0 36.7 -10.9 33.6 -10.3 S37 31.0 10.5 34.7 10.9 36.7 12.4 51.8 17.8 47.7 15.2 S38 20.2 -5.3 24.8 -9.0 25.7 -8.3 36.9 -12.7 32.0 -10.9 S39 31.3 10.6 34.7 11.3 36.1 12.0 51.4 17.5 47.8 15.8 S40 20.5 -5.9 24.4 -8.4 25.2 -8.4 36.1 -12.2 31.9 -11.0 S41 5.6 2.7 0.2 -3.1 2.0 -2.1 2.1 -6.0 7.8 -9.6 S42 2.1 -1.7 2.9 -8.4 4.8 -5.4 3.5 -8.6 16.6 -17.3 S43 3.6 -0.2 1.3 -4.2 2.2 -2.8 5.2 -6.8 7.6 -9.6 S47 34.0 12.0 35.3 9.4 36.7 11.6 51.6 12.6 50.7 12.6 S48 24.9 -8.2 26.6 -8.7 26.9 -7.3 37.8 -14.1 37.0 -13.5 S49 35.9 12.6 37.1 10.8 38.8 12.9 54.1 14.8 53.3 15.5 S51 33.9 11.9 35.1 12.0 36.3 12.5 51.4 17.5 50.8 17.3 S52 26.3 -9.8 27.7 -7.3 28.4 -9.8 39.2 -10.2 38.8 -11.6
108
Table 5.3 Specimen 6: Stress Range and Mean Stress in Deck Plate near the PJP Welds
Stress or Stress Range (MPa) 0.1 M cycles 3 M cycles 5.9 M cycles 6.5 M cycles 7.5 M cycles Gage Sr Sm Sr Sm Sr Sm Sr Sm Sr Sm
S18 20.1 -4.5 21.1 -4.2 21.2 -4.5 32.5 -7.9 44.0 -11.8 S19 27.8 8.2 28.7 9.9 28.1 9.9 42.0 14.3 58.9 17.7 S20 20.0 -3.7 21.0 -3.9 21.5 -5.1 32.3 -7.7 43.6 -9.8 S22 21.3 -4.8 21.7 -5.3 22.0 -5.8 33.3 -8.9 43.8 -11.6 S29 15.8 -2.2 15.9 -2.6 16.4 -2.7 25.6 -5.5 37.2 -10.9 S30 28.1 7.2 28.6 7.6 28.4 10.7 44.7 12.7 62.2 15.5 S31 25.8 5.4 26.2 5.7 26.3 6.6 42.3 10.5 59.4 16.4 S32 16.6 -2.7 17.1 -3.2 17.6 -2.9 27.6 -5.8 38.9 -12.4 S33 26.7 5.4 27.1 6.1 27.3 6.4 43.1 10.2 59.3 16.2 S34 18.8 -4.0 19.4 -3.9 19.5 -4.0 30.1 -7.0 40.6 -10.5 S35 29.9 6.1 29.8 7.6 29.4 8.7 46.1 11.5 60.3 14.1 S36 20.6 -5.0 21.2 -4.8 21.0 -5.3 31.1 -8.2 42.5 -11.6 S38 21.1 -5.7 20.6 -4.4 20.7 -4.5 31.0 -6.9 40.3 -8.4 S40 19.9 -10.6 21.6 -5.7 21.7 -5.8 26.7 -11.4 41.6 -16.6 S43 9.4 7.1 4.5 2.5 3.6 -0.3 10.8 6.1 14.2 10.3 S46 13.9 5.3 11.9 6.7 11.2 6.1 17.5 6.4 22.4 10.3 S47 28.0 5.2 29.2 11.6 28.8 10.8 46.8 15.1 60.5 18.3 S48 19.7 -4.3 20.1 -3.7 20.0 -4.1 33.2 -6.7 41.5 -9.2 S49 28.9 7.8 29.5 8.9 29.3 8.8 46.5 13.8 61.0 19.8 S51 30.1 9.7 30.6 10.4 30.9 10.7 47.8 15.3 62.6 18.9 S52 17.7 -7.6 20.2 -4.8 20.6 -5.0 32.8 -8.5 42.4 -12.8
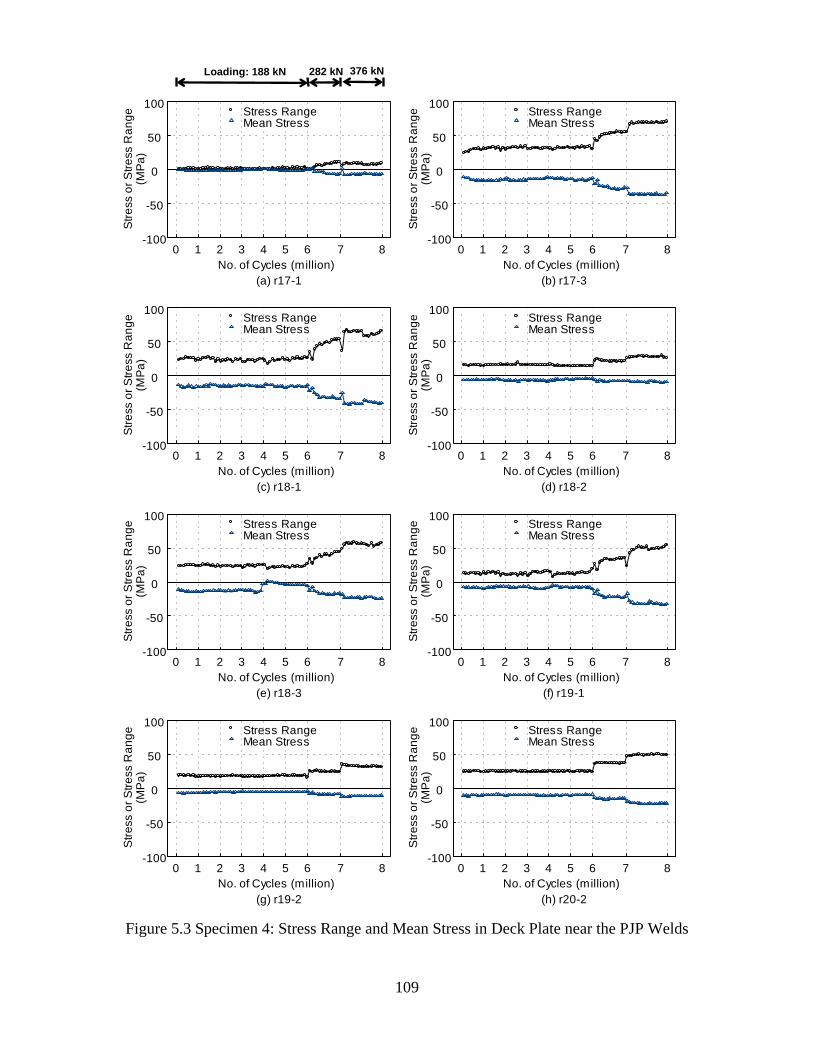
109
No. of Cycles (million)
Stre
ss o
r Stre
ss R
ange
(MPa
)
(a) r17-1
Stress RangeMean Stress
0 1 2 3 4 5 6 7 8-100
-50
0
50
100
No. of Cycles (million)
Stre
ss o
r Stre
ss R
ange
(MPa
)
(b) r17-3
Stress RangeMean Stress
0 1 2 3 4 5 6 7 8-100
-50
0
50
100
No. of Cycles (million)
Stre
ss o
r Stre
ss R
ange
(MPa
)
(c) r18-1
Stress RangeMean Stress
0 1 2 3 4 5 6 7 8-100
-50
0
50
100
No. of Cycles (million)
Stre
ss o
r Stre
ss R
ange
(MPa
)
(d) r18-2
Stress RangeMean Stress
0 1 2 3 4 5 6 7 8-100
-50
0
50
100
No. of Cycles (million)
Stre
ss o
r Stre
ss R
ange
(MPa
)
(e) r18-3
Stress RangeMean Stress
0 1 2 3 4 5 6 7 8-100
-50
0
50
100
No. of Cycles (million)
Stre
ss o
r Stre
ss R
ange
(MPa
)
(f) r19-1
Stress RangeMean Stress
0 1 2 3 4 5 6 7 8-100
-50
0
50
100
No. of Cycles (million)
Stre
ss o
r Stre
ss R
ange
(MP
a)
(g) r19-2
Stress RangeMean Stress
0 1 2 3 4 5 6 7 8-100
-50
0
50
100
No. of Cycles (million)
Stre
ss o
r Stre
ss R
ange
(MP
a)
(h) r20-2
Stress RangeMean Stress
0 1 2 3 4 5 6 7 8-100
-50
0
50
100
Figure 5.3 Specimen 4: Stress Range and Mean Stress in Deck Plate near the PJP Welds
Loading: 188 kN 282 kN 376 kN
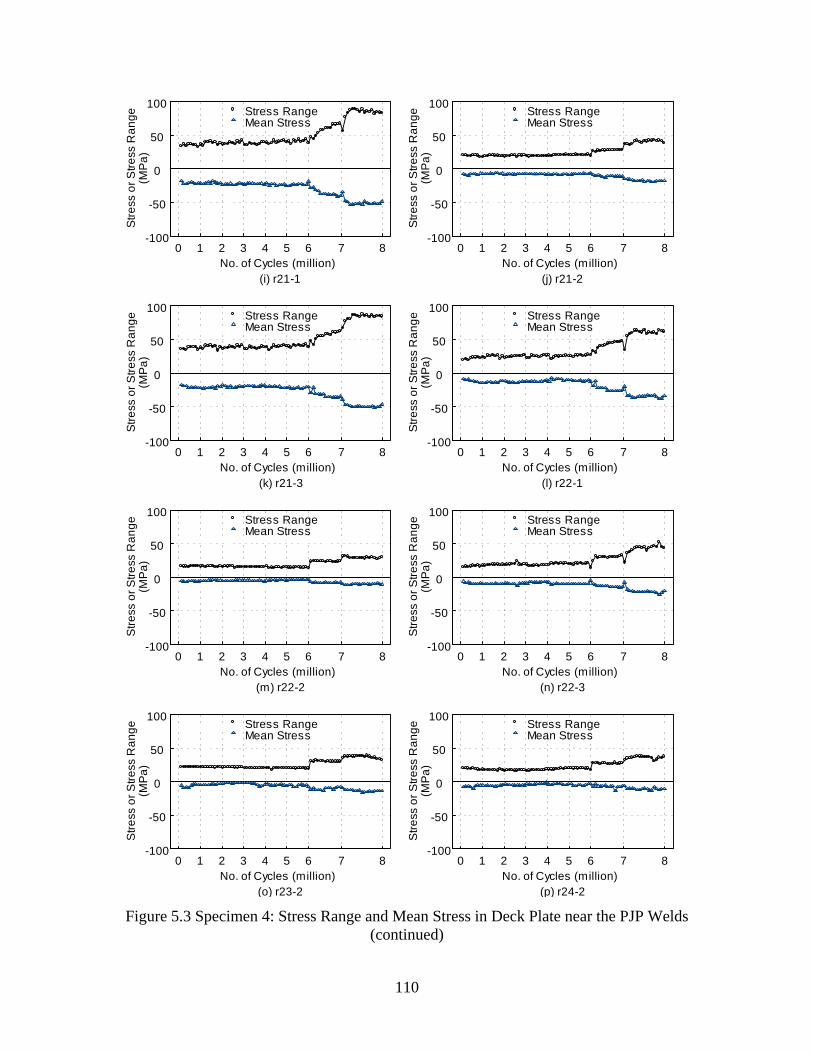
110
No. of Cycles (million)
Stre
ss o
r Stre
ss R
ange
(MPa
)
(i) r21-1
Stress RangeMean Stress
0 1 2 3 4 5 6 7 8-100
-50
0
50
100
No. of Cycles (million)
Stre
ss o
r Stre
ss R
ange
(MPa
)
(j) r21-2
Stress RangeMean Stress
0 1 2 3 4 5 6 7 8-100
-50
0
50
100
No. of Cycles (million)
Stre
ss o
r Stre
ss R
ange
(MPa
)
(k) r21-3
Stress RangeMean Stress
0 1 2 3 4 5 6 7 8-100
-50
0
50
100
No. of Cycles (million)
Stre
ss o
r Stre
ss R
ange
(MPa
)
(l) r22-1
Stress RangeMean Stress
0 1 2 3 4 5 6 7 8-100
-50
0
50
100
No. of Cycles (million)
Stre
ss o
r Stre
ss R
ange
(MPa
)
(m) r22-2
Stress RangeMean Stress
0 1 2 3 4 5 6 7 8-100
-50
0
50
100
No. of Cycles (million)
Stre
ss o
r Stre
ss R
ange
(MPa
)
(n) r22-3
Stress RangeMean Stress
0 1 2 3 4 5 6 7 8-100
-50
0
50
100
No. of Cycles (million)
Stre
ss o
r Stre
ss R
ange
(MPa
)
(o) r23-2
Stress RangeMean Stress
0 1 2 3 4 5 6 7 8-100
-50
0
50
100
No. of Cycles (million)
Stre
ss o
r Stre
ss R
ange
(MPa
)
(p) r24-2
Stress RangeMean Stress
0 1 2 3 4 5 6 7 8-100
-50
0
50
100
Figure 5.3 Specimen 4: Stress Range and Mean Stress in Deck Plate near the PJP Welds
(continued)
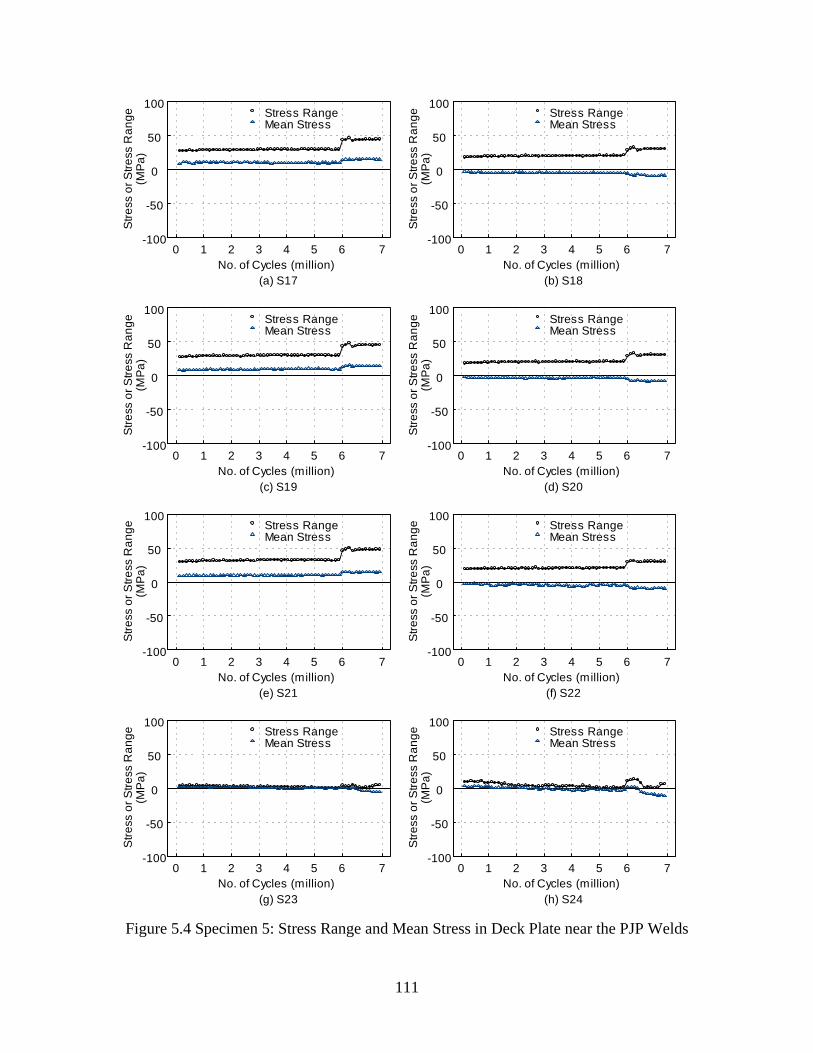
111
No. of Cycles (million)
Stre
ss o
r Stre
ss R
ange
(MPa
)
(a) S17
Stress RangeMean Stress
0 1 2 3 4 5 6 7-100
-50
0
50
100
No. of Cycles (million)
Stre
ss o
r Stre
ss R
ange
(MPa
)
(b) S18
Stress RangeMean Stress
0 1 2 3 4 5 6 7-100
-50
0
50
100
No. of Cycles (million)
Stre
ss o
r Stre
ss R
ange
(MPa
)
(c) S19
Stress RangeMean Stress
0 1 2 3 4 5 6 7-100
-50
0
50
100
No. of Cycles (million)
Stre
ss o
r Stre
ss R
ange
(MPa
)
(d) S20
Stress RangeMean Stress
0 1 2 3 4 5 6 7-100
-50
0
50
100
No. of Cycles (million)
Stre
ss o
r Stre
ss R
ange
(MPa
)
(e) S21
Stress RangeMean Stress
0 1 2 3 4 5 6 7-100
-50
0
50
100
No. of Cycles (million)
Stre
ss o
r Stre
ss R
ange
(MPa
)
(f) S22
Stress RangeMean Stress
0 1 2 3 4 5 6 7-100
-50
0
50
100
No. of Cycles (million)
Stre
ss o
r Stre
ss R
ange
(MP
a)
(g) S23
Stress RangeMean Stress
0 1 2 3 4 5 6 7-100
-50
0
50
100
No. of Cycles (million)
Stre
ss o
r Stre
ss R
ange
(MP
a)
(h) S24
Stress RangeMean Stress
0 1 2 3 4 5 6 7-100
-50
0
50
100
Figure 5.4 Specimen 5: Stress Range and Mean Stress in Deck Plate near the PJP Welds
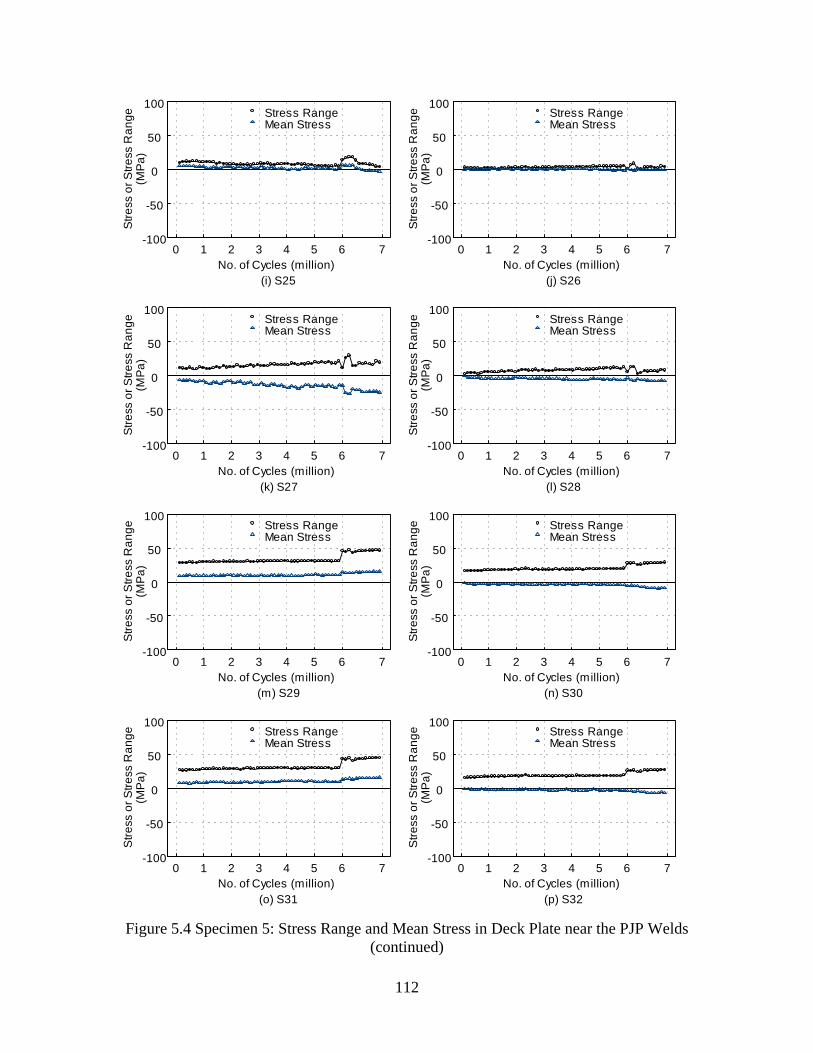
112
No. of Cycles (million)
Stre
ss o
r Stre
ss R
ange
(MPa
)
(i) S25
Stress RangeMean Stress
0 1 2 3 4 5 6 7-100
-50
0
50
100
No. of Cycles (million)
Stre
ss o
r Stre
ss R
ange
(MPa
)
(j) S26
Stress RangeMean Stress
0 1 2 3 4 5 6 7-100
-50
0
50
100
No. of Cycles (million)
Stre
ss o
r Stre
ss R
ange
(MPa
)
(k) S27
Stress RangeMean Stress
0 1 2 3 4 5 6 7-100
-50
0
50
100
No. of Cycles (million)
Stre
ss o
r Stre
ss R
ange
(MPa
)
(l) S28
Stress RangeMean Stress
0 1 2 3 4 5 6 7-100
-50
0
50
100
No. of Cycles (million)
Stre
ss o
r Stre
ss R
ange
(MPa
)
(m) S29
Stress RangeMean Stress
0 1 2 3 4 5 6 7-100
-50
0
50
100
No. of Cycles (million)
Stre
ss o
r Stre
ss R
ange
(MPa
)
(n) S30
Stress RangeMean Stress
0 1 2 3 4 5 6 7-100
-50
0
50
100
No. of Cycles (million)
Stre
ss o
r Stre
ss R
ange
(MP
a)
(o) S31
Stress RangeMean Stress
0 1 2 3 4 5 6 7-100
-50
0
50
100
No. of Cycles (million)
Stre
ss o
r Stre
ss R
ange
(MP
a)
(p) S32
Stress RangeMean Stress
0 1 2 3 4 5 6 7-100
-50
0
50
100
Figure 5.4 Specimen 5: Stress Range and Mean Stress in Deck Plate near the PJP Welds (continued)
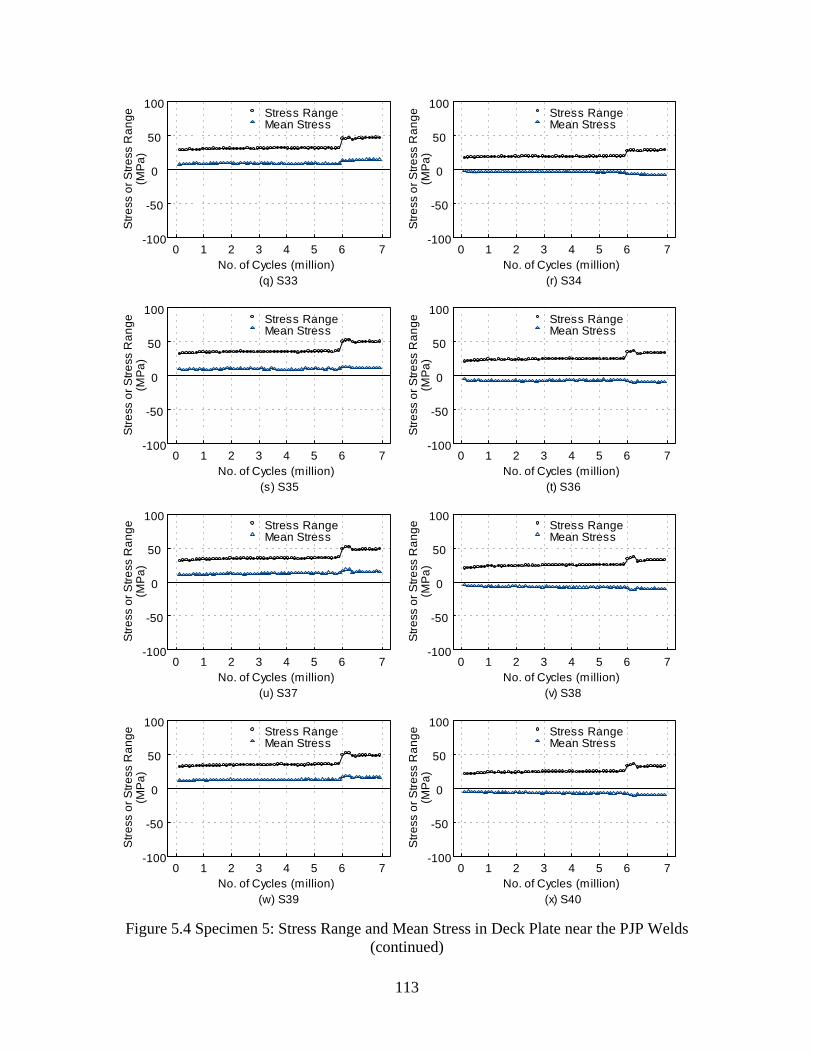
113
No. of Cycles (million)
Stre
ss o
r Stre
ss R
ange
(MPa
)
(q) S33
Stress RangeMean Stress
0 1 2 3 4 5 6 7-100
-50
0
50
100
No. of Cycles (million)
Stre
ss o
r Stre
ss R
ange
(MPa
)
(r) S34
Stress RangeMean Stress
0 1 2 3 4 5 6 7-100
-50
0
50
100
No. of Cycles (million)
Stre
ss o
r Stre
ss R
ange
(MPa
)
(s) S35
Stress RangeMean Stress
0 1 2 3 4 5 6 7-100
-50
0
50
100
No. of Cycles (million)
Stre
ss o
r Stre
ss R
ange
(MPa
)
(t) S36
Stress RangeMean Stress
0 1 2 3 4 5 6 7-100
-50
0
50
100
No. of Cycles (million)
Stre
ss o
r Stre
ss R
ange
(MPa
)
(u) S37
Stress RangeMean Stress
0 1 2 3 4 5 6 7-100
-50
0
50
100
No. of Cycles (million)
Stre
ss o
r Stre
ss R
ange
(MPa
)
(v) S38
Stress RangeMean Stress
0 1 2 3 4 5 6 7-100
-50
0
50
100
No. of Cycles (million)
Stre
ss o
r Stre
ss R
ange
(MP
a)
(w) S39
Stress RangeMean Stress
0 1 2 3 4 5 6 7-100
-50
0
50
100
No. of Cycles (million)
Stre
ss o
r Stre
ss R
ange
(MP
a)
(x) S40
Stress RangeMean Stress
0 1 2 3 4 5 6 7-100
-50
0
50
100
Figure 5.4 Specimen 5: Stress Range and Mean Stress in Deck Plate near the PJP Welds (continued)
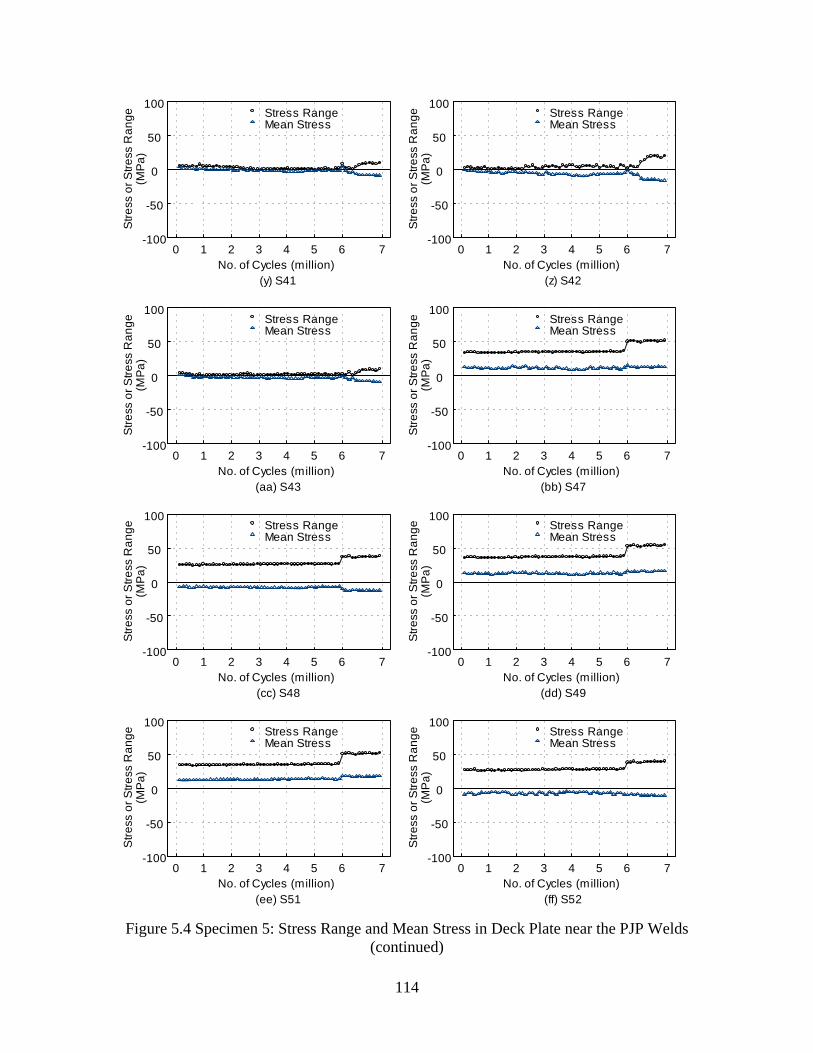
114
No. of Cycles (million)
Stre
ss o
r Stre
ss R
ange
(MPa
)
(y) S41
Stress RangeMean Stress
0 1 2 3 4 5 6 7-100
-50
0
50
100
No. of Cycles (million)
Stre
ss o
r Stre
ss R
ange
(MPa
)
(z) S42
Stress RangeMean Stress
0 1 2 3 4 5 6 7-100
-50
0
50
100
No. of Cycles (million)
Stre
ss o
r Stre
ss R
ange
(MPa
)
(aa) S43
Stress RangeMean Stress
0 1 2 3 4 5 6 7-100
-50
0
50
100
No. of Cycles (million)
Stre
ss o
r Stre
ss R
ange
(MPa
)
(bb) S47
Stress RangeMean Stress
0 1 2 3 4 5 6 7-100
-50
0
50
100
No. of Cycles (million)
Stre
ss o
r Stre
ss R
ange
(MPa
)
(cc) S48
Stress RangeMean Stress
0 1 2 3 4 5 6 7-100
-50
0
50
100
No. of Cycles (million)
Stre
ss o
r Stre
ss R
ange
(MPa
)
(dd) S49
Stress RangeMean Stress
0 1 2 3 4 5 6 7-100
-50
0
50
100
No. of Cycles (million)
Stre
ss o
r Stre
ss R
ange
(MP
a)
(ee) S51
Stress RangeMean Stress
0 1 2 3 4 5 6 7-100
-50
0
50
100
No. of Cycles (million)
Stre
ss o
r Stre
ss R
ange
(MP
a)
(ff) S52
Stress RangeMean Stress
0 1 2 3 4 5 6 7-100
-50
0
50
100
Figure 5.4 Specimen 5: Stress Range and Mean Stress in Deck Plate near the PJP Welds (continued)
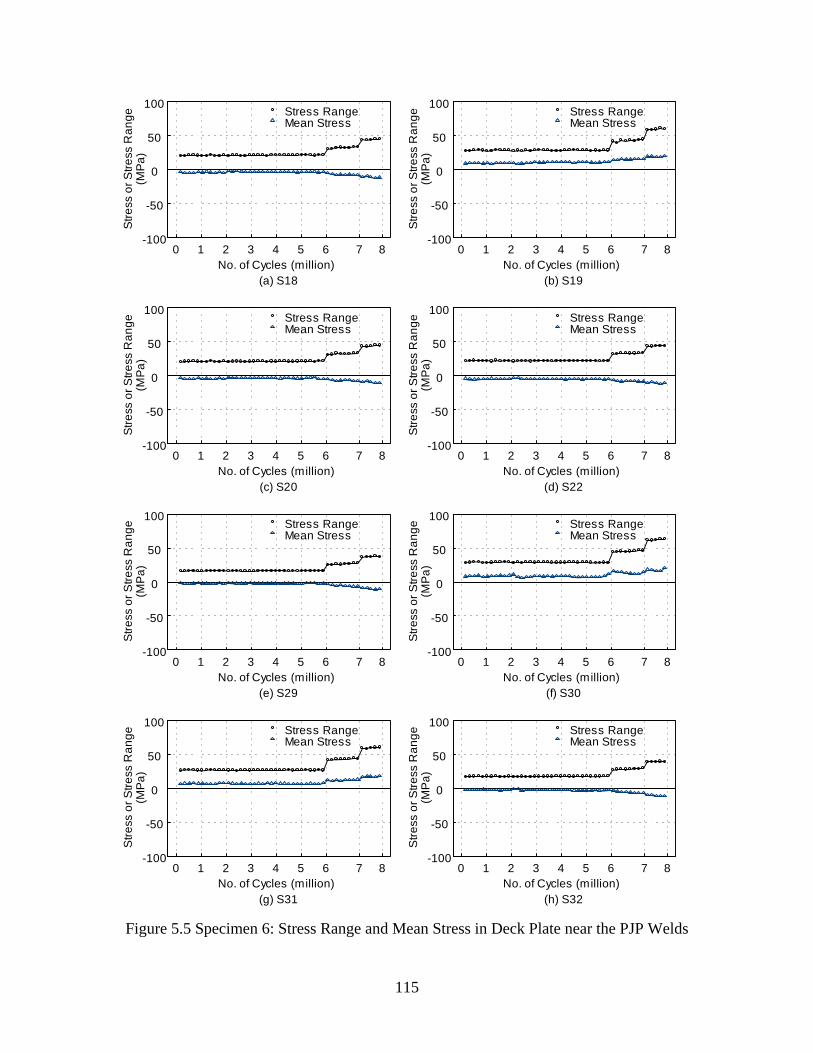
115
No. of Cycles (million)
Stre
ss o
r Stre
ss R
ange
(MPa
)
(a) S18
Stress RangeMean Stress
0 1 2 3 4 5 6 7 8-100
-50
0
50
100
No. of Cycles (million)
Stre
ss o
r Stre
ss R
ange
(MPa
)
(b) S19
Stress RangeMean Stress
0 1 2 3 4 5 6 7 8-100
-50
0
50
100
No. of Cycles (million)
Stre
ss o
r Stre
ss R
ange
(MPa
)
(c) S20
Stress RangeMean Stress
0 1 2 3 4 5 6 7 8-100
-50
0
50
100
No. of Cycles (million)
Stre
ss o
r Stre
ss R
ange
(MPa
)
(d) S22
Stress RangeMean Stress
0 1 2 3 4 5 6 7 8-100
-50
0
50
100
No. of Cycles (million)
Stre
ss o
r Stre
ss R
ange
(MPa
)
(e) S29
Stress RangeMean Stress
0 1 2 3 4 5 6 7 8-100
-50
0
50
100
No. of Cycles (million)
Stre
ss o
r Stre
ss R
ange
(MPa
)
(f) S30
Stress RangeMean Stress
0 1 2 3 4 5 6 7 8-100
-50
0
50
100
No. of Cycles (million)
Stre
ss o
r Stre
ss R
ange
(MP
a)
(g) S31
Stress RangeMean Stress
0 1 2 3 4 5 6 7 8-100
-50
0
50
100
No. of Cycles (million)
Stre
ss o
r Stre
ss R
ange
(MP
a)
(h) S32
Stress RangeMean Stress
0 1 2 3 4 5 6 7 8-100
-50
0
50
100
Figure 5.5 Specimen 6: Stress Range and Mean Stress in Deck Plate near the PJP Welds
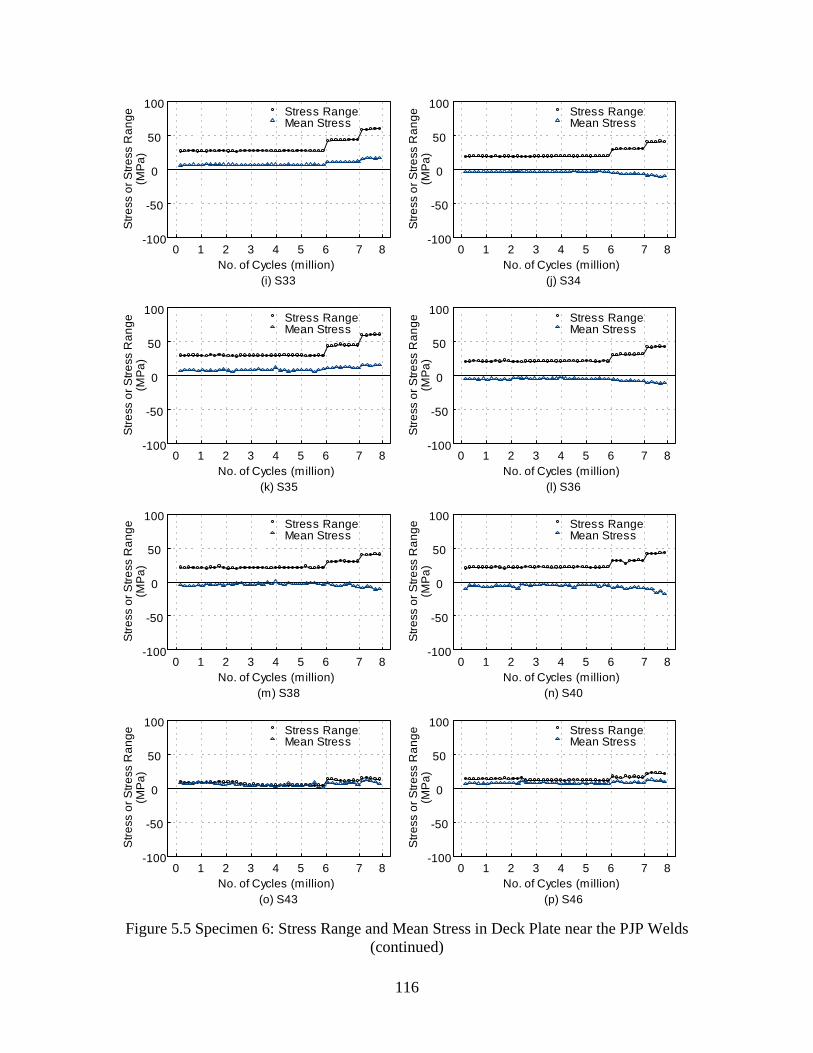
116
No. of Cycles (million)
Stre
ss o
r Stre
ss R
ange
(MPa
)
(i) S33
Stress RangeMean Stress
0 1 2 3 4 5 6 7 8-100
-50
0
50
100
No. of Cycles (million)
Stre
ss o
r Stre
ss R
ange
(MPa
)
(j) S34
Stress RangeMean Stress
0 1 2 3 4 5 6 7 8-100
-50
0
50
100
No. of Cycles (million)
Stre
ss o
r Stre
ss R
ange
(MPa
)
(k) S35
Stress RangeMean Stress
0 1 2 3 4 5 6 7 8-100
-50
0
50
100
No. of Cycles (million)
Stre
ss o
r Stre
ss R
ange
(MPa
)
(l) S36
Stress RangeMean Stress
0 1 2 3 4 5 6 7 8-100
-50
0
50
100
No. of Cycles (million)
Stre
ss o
r Stre
ss R
ange
(MPa
)
(m) S38
Stress RangeMean Stress
0 1 2 3 4 5 6 7 8-100
-50
0
50
100
No. of Cycles (million)
Stre
ss o
r Stre
ss R
ange
(MPa
)
(n) S40
Stress RangeMean Stress
0 1 2 3 4 5 6 7 8-100
-50
0
50
100
No. of Cycles (million)
Stre
ss o
r Stre
ss R
ange
(MP
a)
(o) S43
Stress RangeMean Stress
0 1 2 3 4 5 6 7 8-100
-50
0
50
100
No. of Cycles (million)
Stre
ss o
r Stre
ss R
ange
(MP
a)
(p) S46
Stress RangeMean Stress
0 1 2 3 4 5 6 7 8-100
-50
0
50
100
Figure 5.5 Specimen 6: Stress Range and Mean Stress in Deck Plate near the PJP Welds (continued)
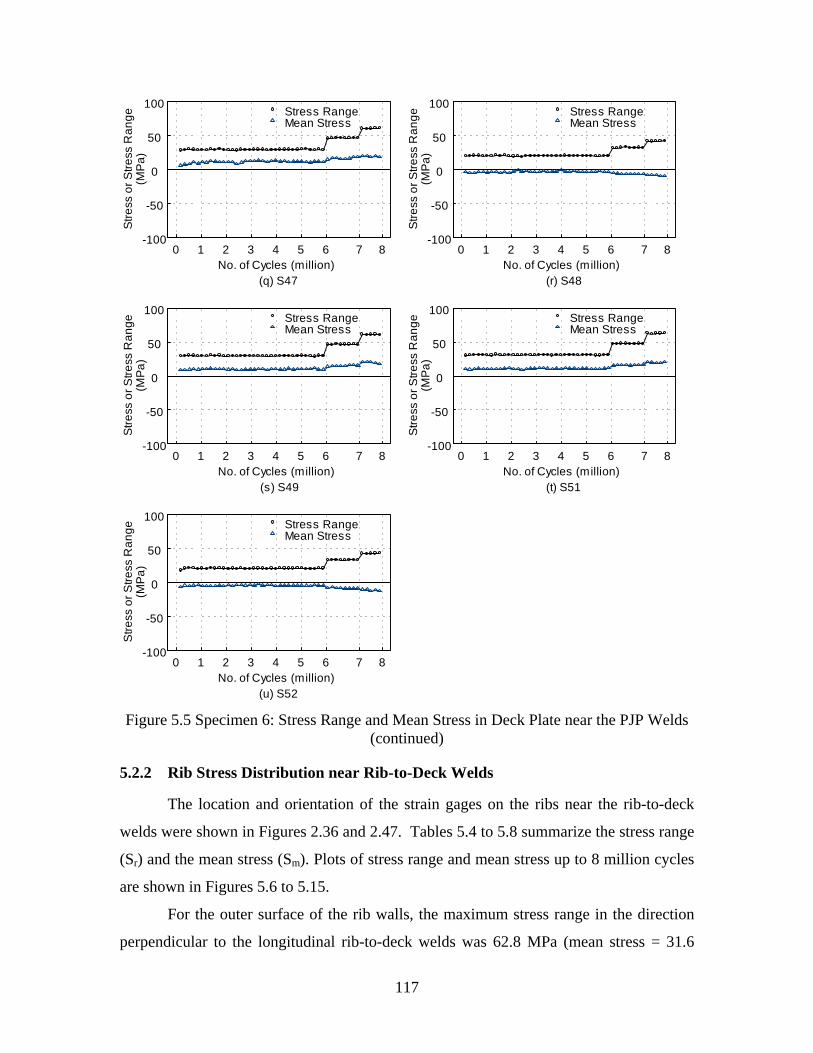
117
No. of Cycles (million)
Stre
ss o
r Stre
ss R
ange
(MP
a)
(q) S47
Stress RangeMean Stress
0 1 2 3 4 5 6 7 8-100
-50
0
50
100
No. of Cycles (million)
Stre
ss o
r Stre
ss R
ange
(MP
a)
(r) S48
Stress RangeMean Stress
0 1 2 3 4 5 6 7 8-100
-50
0
50
100
No. of Cycles (million)
Stre
ss o
r Stre
ss R
ange
(MPa
)
(s) S49
Stress RangeMean Stress
0 1 2 3 4 5 6 7 8-100
-50
0
50
100
No. of Cycles (million)
Stre
ss o
r Stre
ss R
ange
(MPa
)
(t) S51
Stress RangeMean Stress
0 1 2 3 4 5 6 7 8-100
-50
0
50
100
No. of Cycles (million)
Stre
ss o
r Stre
ss R
ange
(MPa
)
(u) S52
Stress RangeMean Stress
0 1 2 3 4 5 6 7 8-100
-50
0
50
100
Figure 5.5 Specimen 6: Stress Range and Mean Stress in Deck Plate near the PJP Welds (continued)
5.2.2 Rib Stress Distribution near Rib-to-Deck Welds
The location and orientation of the strain gages on the ribs near the rib-to-deck
welds were shown in Figures 2.36 and 2.47. Tables 5.4 to 5.8 summarize the stress range
(Sr) and the mean stress (Sm). Plots of stress range and mean stress up to 8 million cycles
are shown in Figures 5.6 to 5.15.
For the outer surface of the rib walls, the maximum stress range in the direction
perpendicular to the longitudinal rib-to-deck welds was 62.8 MPa (mean stress = 31.6
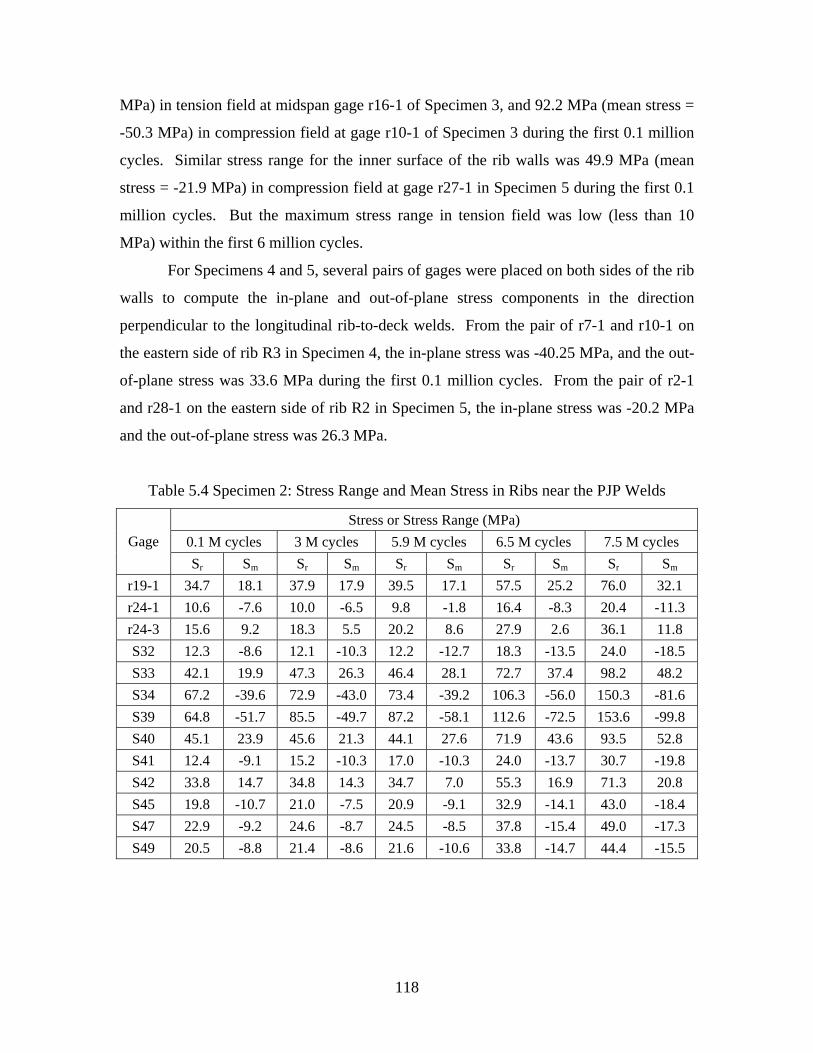
118
MPa) in tension field at midspan gage r16-1 of Specimen 3, and 92.2 MPa (mean stress =
-50.3 MPa) in compression field at gage r10-1 of Specimen 3 during the first 0.1 million
cycles. Similar stress range for the inner surface of the rib walls was 49.9 MPa (mean
stress = -21.9 MPa) in compression field at gage r27-1 in Specimen 5 during the first 0.1
million cycles. But the maximum stress range in tension field was low (less than 10
MPa) within the first 6 million cycles.
For Specimens 4 and 5, several pairs of gages were placed on both sides of the rib
walls to compute the in-plane and out-of-plane stress components in the direction
perpendicular to the longitudinal rib-to-deck welds. From the pair of r7-1 and r10-1 on
the eastern side of rib R3 in Specimen 4, the in-plane stress was -40.25 MPa, and the out-
of-plane stress was 33.6 MPa during the first 0.1 million cycles. From the pair of r2-1
and r28-1 on the eastern side of rib R2 in Specimen 5, the in-plane stress was -20.2 MPa
and the out-of-plane stress was 26.3 MPa.
Table 5.4 Specimen 2: Stress Range and Mean Stress in Ribs near the PJP Welds
Stress or Stress Range (MPa) 0.1 M cycles 3 M cycles 5.9 M cycles 6.5 M cycles 7.5 M cycles Gage Sr Sm Sr Sm Sr Sm Sr Sm Sr Sm
r19-1 34.7 18.1 37.9 17.9 39.5 17.1 57.5 25.2 76.0 32.1 r24-1 10.6 -7.6 10.0 -6.5 9.8 -1.8 16.4 -8.3 20.4 -11.3 r24-3 15.6 9.2 18.3 5.5 20.2 8.6 27.9 2.6 36.1 11.8 S32 12.3 -8.6 12.1 -10.3 12.2 -12.7 18.3 -13.5 24.0 -18.5 S33 42.1 19.9 47.3 26.3 46.4 28.1 72.7 37.4 98.2 48.2 S34 67.2 -39.6 72.9 -43.0 73.4 -39.2 106.3 -56.0 150.3 -81.6 S39 64.8 -51.7 85.5 -49.7 87.2 -58.1 112.6 -72.5 153.6 -99.8 S40 45.1 23.9 45.6 21.3 44.1 27.6 71.9 43.6 93.5 52.8 S41 12.4 -9.1 15.2 -10.3 17.0 -10.3 24.0 -13.7 30.7 -19.8 S42 33.8 14.7 34.8 14.3 34.7 7.0 55.3 16.9 71.3 20.8 S45 19.8 -10.7 21.0 -7.5 20.9 -9.1 32.9 -14.1 43.0 -18.4 S47 22.9 -9.2 24.6 -8.7 24.5 -8.5 37.8 -15.4 49.0 -17.3 S49 20.5 -8.8 21.4 -8.6 21.6 -10.6 33.8 -14.7 44.4 -15.5
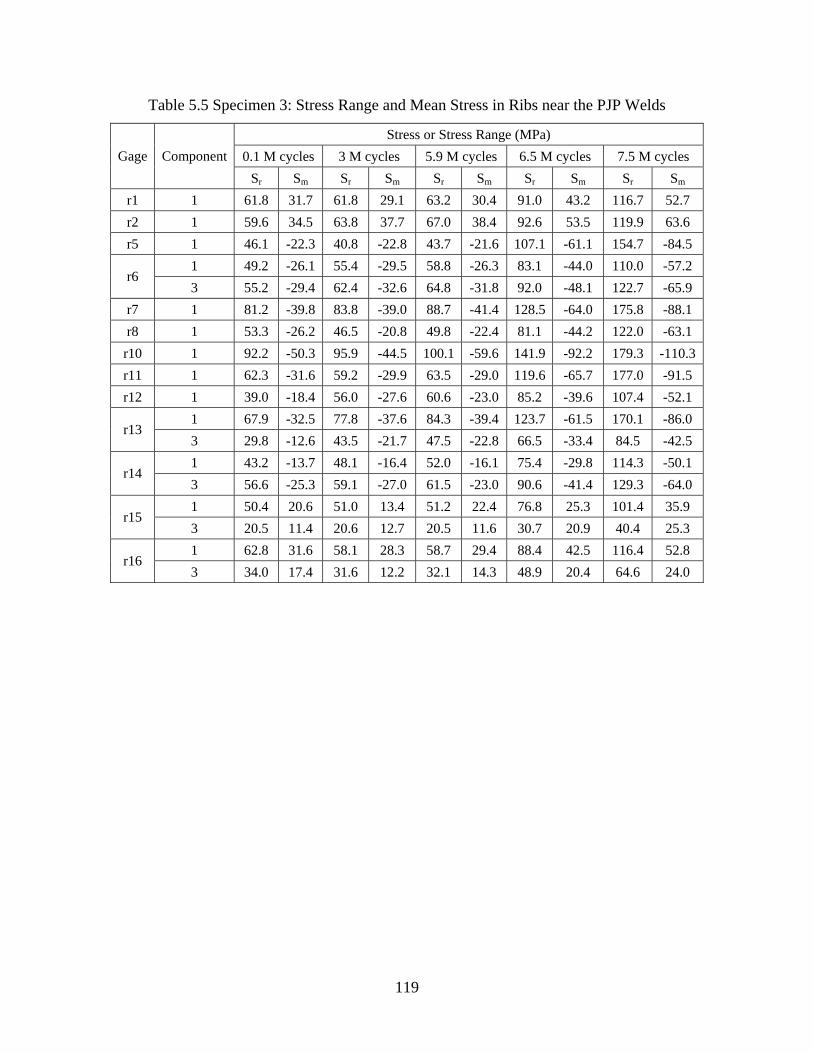
119
Table 5.5 Specimen 3: Stress Range and Mean Stress in Ribs near the PJP Welds
Stress or Stress Range (MPa) 0.1 M cycles 3 M cycles 5.9 M cycles 6.5 M cycles 7.5 M cycles Gage Component
Sr Sm Sr Sm Sr Sm Sr Sm Sr Sm r1 1 61.8 31.7 61.8 29.1 63.2 30.4 91.0 43.2 116.7 52.7 r2 1 59.6 34.5 63.8 37.7 67.0 38.4 92.6 53.5 119.9 63.6 r5 1 46.1 -22.3 40.8 -22.8 43.7 -21.6 107.1 -61.1 154.7 -84.5
1 49.2 -26.1 55.4 -29.5 58.8 -26.3 83.1 -44.0 110.0 -57.2 r6
3 55.2 -29.4 62.4 -32.6 64.8 -31.8 92.0 -48.1 122.7 -65.9 r7 1 81.2 -39.8 83.8 -39.0 88.7 -41.4 128.5 -64.0 175.8 -88.1 r8 1 53.3 -26.2 46.5 -20.8 49.8 -22.4 81.1 -44.2 122.0 -63.1
r10 1 92.2 -50.3 95.9 -44.5 100.1 -59.6 141.9 -92.2 179.3 -110.3 r11 1 62.3 -31.6 59.2 -29.9 63.5 -29.0 119.6 -65.7 177.0 -91.5 r12 1 39.0 -18.4 56.0 -27.6 60.6 -23.0 85.2 -39.6 107.4 -52.1
1 67.9 -32.5 77.8 -37.6 84.3 -39.4 123.7 -61.5 170.1 -86.0 r13
3 29.8 -12.6 43.5 -21.7 47.5 -22.8 66.5 -33.4 84.5 -42.5 1 43.2 -13.7 48.1 -16.4 52.0 -16.1 75.4 -29.8 114.3 -50.1
r14 3 56.6 -25.3 59.1 -27.0 61.5 -23.0 90.6 -41.4 129.3 -64.0 1 50.4 20.6 51.0 13.4 51.2 22.4 76.8 25.3 101.4 35.9
r15 3 20.5 11.4 20.6 12.7 20.5 11.6 30.7 20.9 40.4 25.3 1 62.8 31.6 58.1 28.3 58.7 29.4 88.4 42.5 116.4 52.8
r16 3 34.0 17.4 31.6 12.2 32.1 14.3 48.9 20.4 64.6 24.0
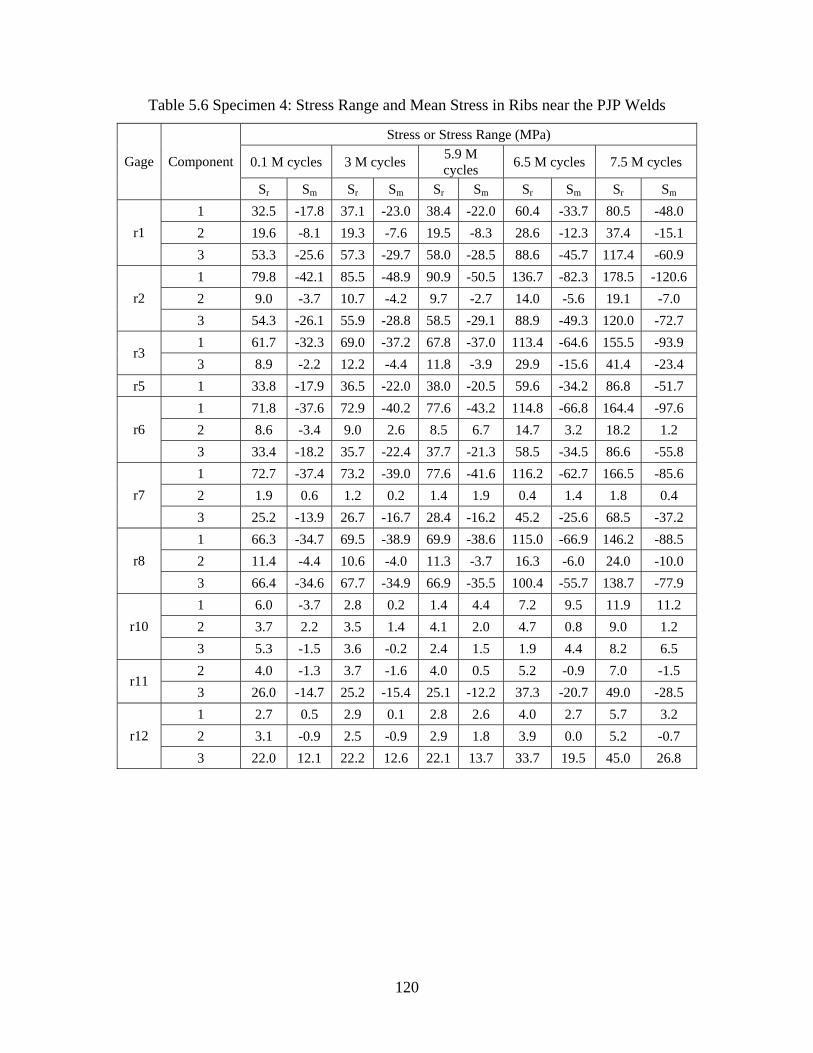
120
Table 5.6 Specimen 4: Stress Range and Mean Stress in Ribs near the PJP Welds
Stress or Stress Range (MPa)
0.1 M cycles 3 M cycles 5.9 M cycles 6.5 M cycles 7.5 M cycles Gage Component
Sr Sm Sr Sm Sr Sm Sr Sm Sr Sm 1 32.5 -17.8 37.1 -23.0 38.4 -22.0 60.4 -33.7 80.5 -48.0 2 19.6 -8.1 19.3 -7.6 19.5 -8.3 28.6 -12.3 37.4 -15.1 r1 3 53.3 -25.6 57.3 -29.7 58.0 -28.5 88.6 -45.7 117.4 -60.9 1 79.8 -42.1 85.5 -48.9 90.9 -50.5 136.7 -82.3 178.5 -120.6 2 9.0 -3.7 10.7 -4.2 9.7 -2.7 14.0 -5.6 19.1 -7.0 r2 3 54.3 -26.1 55.9 -28.8 58.5 -29.1 88.9 -49.3 120.0 -72.7 1 61.7 -32.3 69.0 -37.2 67.8 -37.0 113.4 -64.6 155.5 -93.9
r3 3 8.9 -2.2 12.2 -4.4 11.8 -3.9 29.9 -15.6 41.4 -23.4
r5 1 33.8 -17.9 36.5 -22.0 38.0 -20.5 59.6 -34.2 86.8 -51.7 1 71.8 -37.6 72.9 -40.2 77.6 -43.2 114.8 -66.8 164.4 -97.6 2 8.6 -3.4 9.0 2.6 8.5 6.7 14.7 3.2 18.2 1.2 r6 3 33.4 -18.2 35.7 -22.4 37.7 -21.3 58.5 -34.5 86.6 -55.8 1 72.7 -37.4 73.2 -39.0 77.6 -41.6 116.2 -62.7 166.5 -85.6 2 1.9 0.6 1.2 0.2 1.4 1.9 0.4 1.4 1.8 0.4 r7 3 25.2 -13.9 26.7 -16.7 28.4 -16.2 45.2 -25.6 68.5 -37.2 1 66.3 -34.7 69.5 -38.9 69.9 -38.6 115.0 -66.9 146.2 -88.5 2 11.4 -4.4 10.6 -4.0 11.3 -3.7 16.3 -6.0 24.0 -10.0 r8 3 66.4 -34.6 67.7 -34.9 66.9 -35.5 100.4 -55.7 138.7 -77.9 1 6.0 -3.7 2.8 0.2 1.4 4.4 7.2 9.5 11.9 11.2 2 3.7 2.2 3.5 1.4 4.1 2.0 4.7 0.8 9.0 1.2 r10 3 5.3 -1.5 3.6 -0.2 2.4 1.5 1.9 4.4 8.2 6.5 2 4.0 -1.3 3.7 -1.6 4.0 0.5 5.2 -0.9 7.0 -1.5
r11 3 26.0 -14.7 25.2 -15.4 25.1 -12.2 37.3 -20.7 49.0 -28.5 1 2.7 0.5 2.9 0.1 2.8 2.6 4.0 2.7 5.7 3.2 2 3.1 -0.9 2.5 -0.9 2.9 1.8 3.9 0.0 5.2 -0.7 r12 3 22.0 12.1 22.2 12.6 22.1 13.7 33.7 19.5 45.0 26.8
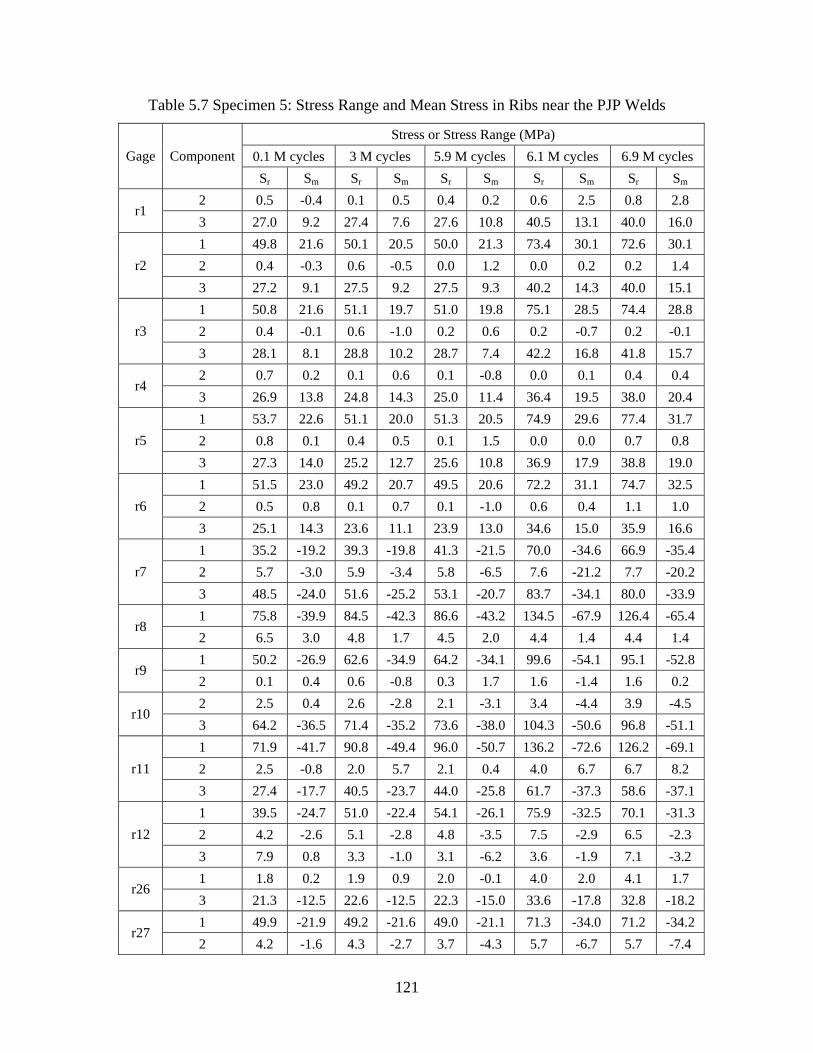
121
Table 5.7 Specimen 5: Stress Range and Mean Stress in Ribs near the PJP Welds
Stress or Stress Range (MPa) 0.1 M cycles 3 M cycles 5.9 M cycles 6.1 M cycles 6.9 M cycles Gage Component Sr Sm Sr Sm Sr Sm Sr Sm Sr Sm
2 0.5 -0.4 0.1 0.5 0.4 0.2 0.6 2.5 0.8 2.8 r1
3 27.0 9.2 27.4 7.6 27.6 10.8 40.5 13.1 40.0 16.0 1 49.8 21.6 50.1 20.5 50.0 21.3 73.4 30.1 72.6 30.1 2 0.4 -0.3 0.6 -0.5 0.0 1.2 0.0 0.2 0.2 1.4 r2 3 27.2 9.1 27.5 9.2 27.5 9.3 40.2 14.3 40.0 15.1 1 50.8 21.6 51.1 19.7 51.0 19.8 75.1 28.5 74.4 28.8 2 0.4 -0.1 0.6 -1.0 0.2 0.6 0.2 -0.7 0.2 -0.1 r3 3 28.1 8.1 28.8 10.2 28.7 7.4 42.2 16.8 41.8 15.7 2 0.7 0.2 0.1 0.6 0.1 -0.8 0.0 0.1 0.4 0.4
r4 3 26.9 13.8 24.8 14.3 25.0 11.4 36.4 19.5 38.0 20.4 1 53.7 22.6 51.1 20.0 51.3 20.5 74.9 29.6 77.4 31.7 2 0.8 0.1 0.4 0.5 0.1 1.5 0.0 0.0 0.7 0.8 r5 3 27.3 14.0 25.2 12.7 25.6 10.8 36.9 17.9 38.8 19.0 1 51.5 23.0 49.2 20.7 49.5 20.6 72.2 31.1 74.7 32.5 2 0.5 0.8 0.1 0.7 0.1 -1.0 0.6 0.4 1.1 1.0 r6 3 25.1 14.3 23.6 11.1 23.9 13.0 34.6 15.0 35.9 16.6 1 35.2 -19.2 39.3 -19.8 41.3 -21.5 70.0 -34.6 66.9 -35.4 2 5.7 -3.0 5.9 -3.4 5.8 -6.5 7.6 -21.2 7.7 -20.2 r7 3 48.5 -24.0 51.6 -25.2 53.1 -20.7 83.7 -34.1 80.0 -33.9 1 75.8 -39.9 84.5 -42.3 86.6 -43.2 134.5 -67.9 126.4 -65.4
r8 2 6.5 3.0 4.8 1.7 4.5 2.0 4.4 1.4 4.4 1.4 1 50.2 -26.9 62.6 -34.9 64.2 -34.1 99.6 -54.1 95.1 -52.8
r9 2 0.1 0.4 0.6 -0.8 0.3 1.7 1.6 -1.4 1.6 0.2 2 2.5 0.4 2.6 -2.8 2.1 -3.1 3.4 -4.4 3.9 -4.5
r10 3 64.2 -36.5 71.4 -35.2 73.6 -38.0 104.3 -50.6 96.8 -51.1 1 71.9 -41.7 90.8 -49.4 96.0 -50.7 136.2 -72.6 126.2 -69.1 2 2.5 -0.8 2.0 5.7 2.1 0.4 4.0 6.7 6.7 8.2 r11 3 27.4 -17.7 40.5 -23.7 44.0 -25.8 61.7 -37.3 58.6 -37.1 1 39.5 -24.7 51.0 -22.4 54.1 -26.1 75.9 -32.5 70.1 -31.3 2 4.2 -2.6 5.1 -2.8 4.8 -3.5 7.5 -2.9 6.5 -2.3 r12 3 7.9 0.8 3.3 -1.0 3.1 -6.2 3.6 -1.9 7.1 -3.2 1 1.8 0.2 1.9 0.9 2.0 -0.1 4.0 2.0 4.1 1.7
r26 3 21.3 -12.5 22.6 -12.5 22.3 -15.0 33.6 -17.8 32.8 -18.2 1 49.9 -21.9 49.2 -21.6 49.0 -21.1 71.3 -34.0 71.2 -34.2
r27 2 4.2 -1.6 4.3 -2.7 3.7 -4.3 5.7 -6.7 5.7 -7.4
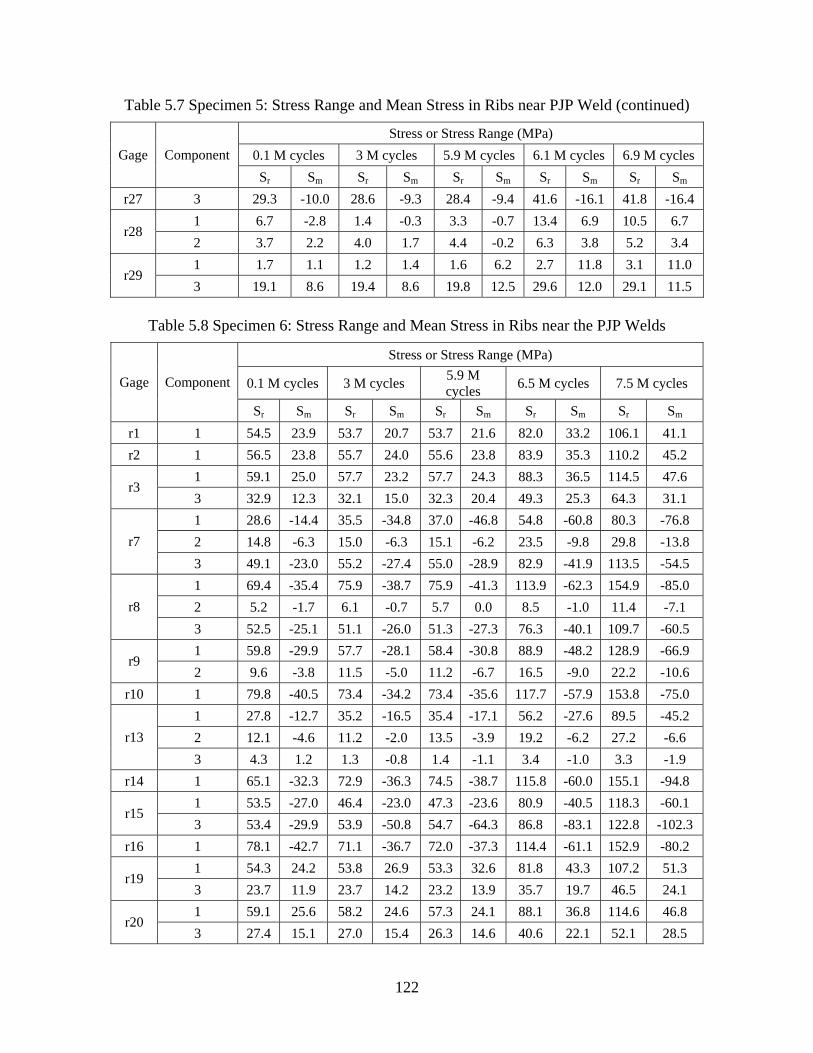
122
Table 5.7 Specimen 5: Stress Range and Mean Stress in Ribs near PJP Weld (continued)
Stress or Stress Range (MPa) 0.1 M cycles 3 M cycles 5.9 M cycles 6.1 M cycles 6.9 M cycles Gage Component Sr Sm Sr Sm Sr Sm Sr Sm Sr Sm
r27 3 29.3 -10.0 28.6 -9.3 28.4 -9.4 41.6 -16.1 41.8 -16.4 1 6.7 -2.8 1.4 -0.3 3.3 -0.7 13.4 6.9 10.5 6.7
r28 2 3.7 2.2 4.0 1.7 4.4 -0.2 6.3 3.8 5.2 3.4 1 1.7 1.1 1.2 1.4 1.6 6.2 2.7 11.8 3.1 11.0
r29 3 19.1 8.6 19.4 8.6 19.8 12.5 29.6 12.0 29.1 11.5
Table 5.8 Specimen 6: Stress Range and Mean Stress in Ribs near the PJP Welds
Stress or Stress Range (MPa)
0.1 M cycles 3 M cycles 5.9 M cycles 6.5 M cycles 7.5 M cycles Gage Component
Sr Sm Sr Sm Sr Sm Sr Sm Sr Sm r1 1 54.5 23.9 53.7 20.7 53.7 21.6 82.0 33.2 106.1 41.1 r2 1 56.5 23.8 55.7 24.0 55.6 23.8 83.9 35.3 110.2 45.2
1 59.1 25.0 57.7 23.2 57.7 24.3 88.3 36.5 114.5 47.6 r3
3 32.9 12.3 32.1 15.0 32.3 20.4 49.3 25.3 64.3 31.1 1 28.6 -14.4 35.5 -34.8 37.0 -46.8 54.8 -60.8 80.3 -76.8 2 14.8 -6.3 15.0 -6.3 15.1 -6.2 23.5 -9.8 29.8 -13.8 r7 3 49.1 -23.0 55.2 -27.4 55.0 -28.9 82.9 -41.9 113.5 -54.5 1 69.4 -35.4 75.9 -38.7 75.9 -41.3 113.9 -62.3 154.9 -85.0 2 5.2 -1.7 6.1 -0.7 5.7 0.0 8.5 -1.0 11.4 -7.1 r8 3 52.5 -25.1 51.1 -26.0 51.3 -27.3 76.3 -40.1 109.7 -60.5 1 59.8 -29.9 57.7 -28.1 58.4 -30.8 88.9 -48.2 128.9 -66.9
r9 2 9.6 -3.8 11.5 -5.0 11.2 -6.7 16.5 -9.0 22.2 -10.6
r10 1 79.8 -40.5 73.4 -34.2 73.4 -35.6 117.7 -57.9 153.8 -75.0 1 27.8 -12.7 35.2 -16.5 35.4 -17.1 56.2 -27.6 89.5 -45.2 2 12.1 -4.6 11.2 -2.0 13.5 -3.9 19.2 -6.2 27.2 -6.6 r13 3 4.3 1.2 1.3 -0.8 1.4 -1.1 3.4 -1.0 3.3 -1.9
r14 1 65.1 -32.3 72.9 -36.3 74.5 -38.7 115.8 -60.0 155.1 -94.8 1 53.5 -27.0 46.4 -23.0 47.3 -23.6 80.9 -40.5 118.3 -60.1
r15 3 53.4 -29.9 53.9 -50.8 54.7 -64.3 86.8 -83.1 122.8 -102.3
r16 1 78.1 -42.7 71.1 -36.7 72.0 -37.3 114.4 -61.1 152.9 -80.2 1 54.3 24.2 53.8 26.9 53.3 32.6 81.8 43.3 107.2 51.3
r19 3 23.7 11.9 23.7 14.2 23.2 13.9 35.7 19.7 46.5 24.1 1 59.1 25.6 58.2 24.6 57.3 24.1 88.1 36.8 114.6 46.8
r20 3 27.4 15.1 27.0 15.4 26.3 14.6 40.6 22.1 52.1 28.5
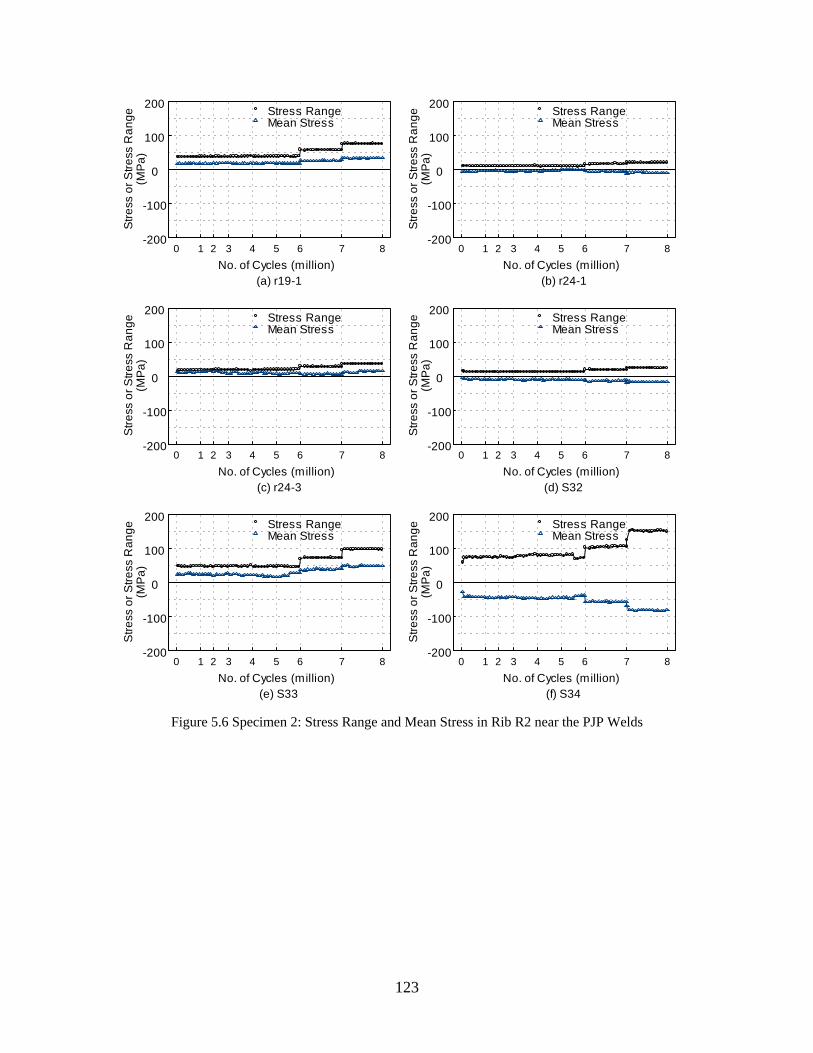
123
No. of Cycles (million)
Stre
ss o
r Stre
ss R
ange
(MPa
)
(a) r19-1
Stress RangeMean Stress
0 1 2 3 4 5 6 7 8-200
-100
0
100
200
No. of Cycles (million)
Stre
ss o
r Stre
ss R
ange
(MPa
)
(b) r24-1
Stress RangeMean Stress
0 1 2 3 4 5 6 7 8-200
-100
0
100
200
No. of Cycles (million)
Stre
ss o
r Stre
ss R
ange
(MPa
)
(c) r24-3
Stress RangeMean Stress
0 1 2 3 4 5 6 7 8-200
-100
0
100
200
No. of Cycles (million)
Stre
ss o
r Stre
ss R
ange
(MPa
)
(d) S32
Stress RangeMean Stress
0 1 2 3 4 5 6 7 8-200
-100
0
100
200
No. of Cycles (million)
Stre
ss o
r Stre
ss R
ange
(MP
a)
(e) S33
Stress RangeMean Stress
0 1 2 3 4 5 6 7 8-200
-100
0
100
200
No. of Cycles (million)
Stre
ss o
r Stre
ss R
ange
(MP
a)
(f) S34
Stress RangeMean Stress
0 1 2 3 4 5 6 7 8-200
-100
0
100
200
Figure 5.6 Specimen 2: Stress Range and Mean Stress in Rib R2 near the PJP Welds
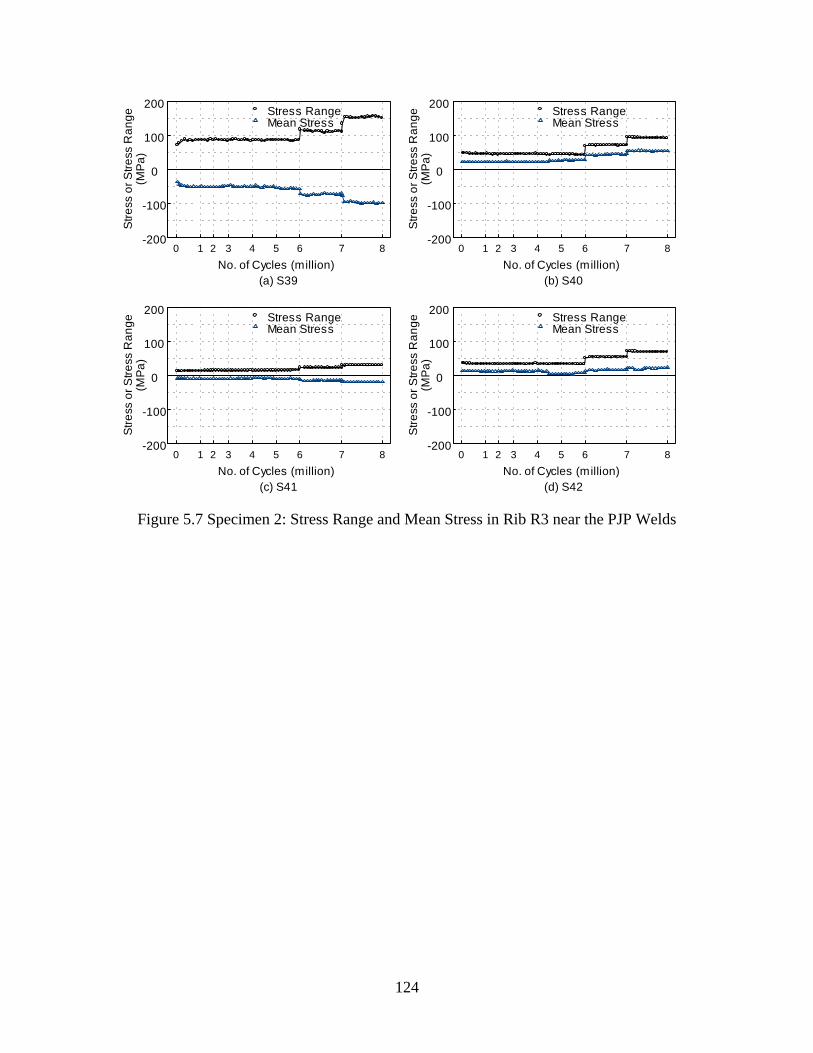
124
No. of Cycles (million)
Stre
ss o
r Stre
ss R
ange
(MPa
)
(a) S39
Stress RangeMean Stress
0 1 2 3 4 5 6 7 8-200
-100
0
100
200
No. of Cycles (million)
Stre
ss o
r Stre
ss R
ange
(MPa
)
(b) S40
Stress RangeMean Stress
0 1 2 3 4 5 6 7 8-200
-100
0
100
200
No. of Cycles (million)
Stre
ss o
r Stre
ss R
ange
(MPa
)
(c) S41
Stress RangeMean Stress
0 1 2 3 4 5 6 7 8-200
-100
0
100
200
No. of Cycles (million)
Stre
ss o
r Stre
ss R
ange
(MPa
)
(d) S42
Stress RangeMean Stress
0 1 2 3 4 5 6 7 8-200
-100
0
100
200
Figure 5.7 Specimen 2: Stress Range and Mean Stress in Rib R3 near the PJP Welds
125
No. of Cycles (million)
Stre
ss o
r Stre
ss R
ange
(MPa
)
(a) S45
Stress RangeMean Stress
0 1 2 3 4 5 6 7 8-200
-100
0
100
200
No. of Cycles (million)
Stre
ss o
r Stre
ss R
ange
(MPa
)
(b) S47
Stress RangeMean Stress
0 1 2 3 4 5 6 7 8-200
-100
0
100
200
No. of Cycles (million)
Stre
ss o
r Stre
ss R
ange
(MPa
)
(c) S49
Stress RangeMean Stress
0 1 2 3 4 5 6 7 8-200
-100
0
100
200
Figure 5.8 Specimen 2: Stress Range and Mean Stress in Rib R4 near the PJP Welds
126
No. of Cycles (million)
Stre
ss o
r Stre
ss R
ange
(MPa
)
(a) r1-1
Stress RangeMean Stress
0 1 2 3 4 5 6 7 8-200
-100
0
100
200
No. of Cycles (million)
Stre
ss o
r Stre
ss R
ange
(MPa
)
(b) r2-1
Stress RangeMean Stress
0 1 2 3 4 5 6 7 8-200
-100
0
100
200
No. of Cycles (million)
Stre
ss o
r Stre
ss R
ange
(MPa
)
(c) r5-1
Stress RangeMean Stress
0 1 2 3 4 5 6 7 8-200
-100
0
100
200
No. of Cycles (million)
Stre
ss o
r Stre
ss R
ange
(MPa
)
(d) r6-1
Stress RangeMean Stress
0 1 2 3 4 5 6 7 8-200
-100
0
100
200
No. of Cycles (million)
Stre
ss o
r Stre
ss R
ange
(MPa
)
(e) r6-3
Stress RangeMean Stress
0 1 2 3 4 5 6 7 8-200
-100
0
100
200
No. of Cycles (million)
Stre
ss o
r Stre
ss R
ange
(MPa
)
(f) r7-1
Stress RangeMean Stress
0 1 2 3 4 5 6 7 8-200
-100
0
100
200
No. of Cycles (million)
Stre
ss o
r Stre
ss R
ange
(MP
a)
(g) r8-1
Stress RangeMean Stress
0 1 2 3 4 5 6 7 8-200
-100
0
100
200
Figure 5.9 Specimen 3: Stress Range and Mean Stress in Rib R2 near the PJP Welds
127
No. of Cycles (million)
Stre
ss o
r Stre
ss R
ange
(MPa
)
(a) r10-1
Stress RangeMean Stress
0 1 2 3 4 5 6 7 8-200
-100
0
100
200
No. of Cycles (million)
Stre
ss o
r Stre
ss R
ange
(MPa
)
(b) r11-1
Stress RangeMean Stress
0 1 2 3 4 5 6 7 8-200
-100
0
100
200
No. of Cycles (million)
Stre
ss o
r Stre
ss R
ange
(MPa
)
(c) r12-1
Stress RangeMean Stress
0 1 2 3 4 5 6 7 8-200
-100
0
100
200
No. of Cycles (million)
Stre
ss o
r Stre
ss R
ange
(MPa
)
(d) r13-1
Stress RangeMean Stress
0 1 2 3 4 5 6 7 8-200
-100
0
100
200
No. of Cycles (million)
Stre
ss o
r Stre
ss R
ange
(MPa
)
(e) r13-3
Stress RangeMean Stress
0 1 2 3 4 5 6 7 8-200
-100
0
100
200
No. of Cycles (million)
Stre
ss o
r Stre
ss R
ange
(MPa
)
(f) r14-1
Stress RangeMean Stress
0 1 2 3 4 5 6 7 8-200
-100
0
100
200
No. of Cycles (million)
Stre
ss o
r Stre
ss R
ange
(MP
a)
(g) r14-3
Stress RangeMean Stress
0 1 2 3 4 5 6 7 8-200
-100
0
100
200
No. of Cycles (million)
Stre
ss o
r Stre
ss R
ange
(MP
a)
(h) r15-1
Stress RangeMean Stress
0 1 2 3 4 5 6 7 8-200
-100
0
100
200
Figure 5.10 Specimen 3: Stress Range and Mean Stress in Rib R3 near the PJP Welds
128
No. of Cycles (million)
Stre
ss o
r Stre
ss R
ange
(MPa
)
(i) r15-3
Stress RangeMean Stress
0 1 2 3 4 5 6 7 8-200
-100
0
100
200
No. of Cycles (million)
Stre
ss o
r Stre
ss R
ange
(MPa
)
(j) r16-1
Stress RangeMean Stress
0 1 2 3 4 5 6 7 8-200
-100
0
100
200
No. of Cycles (million)
Stre
ss o
r Stre
ss R
ange
(MPa
)
(k) r16-3
Stress RangeMean Stress
0 1 2 3 4 5 6 7 8-200
-100
0
100
200
Figure 5.10 Specimen 3: Stress Range and Mean Stress in Rib R3 near the PJP Welds (continued)
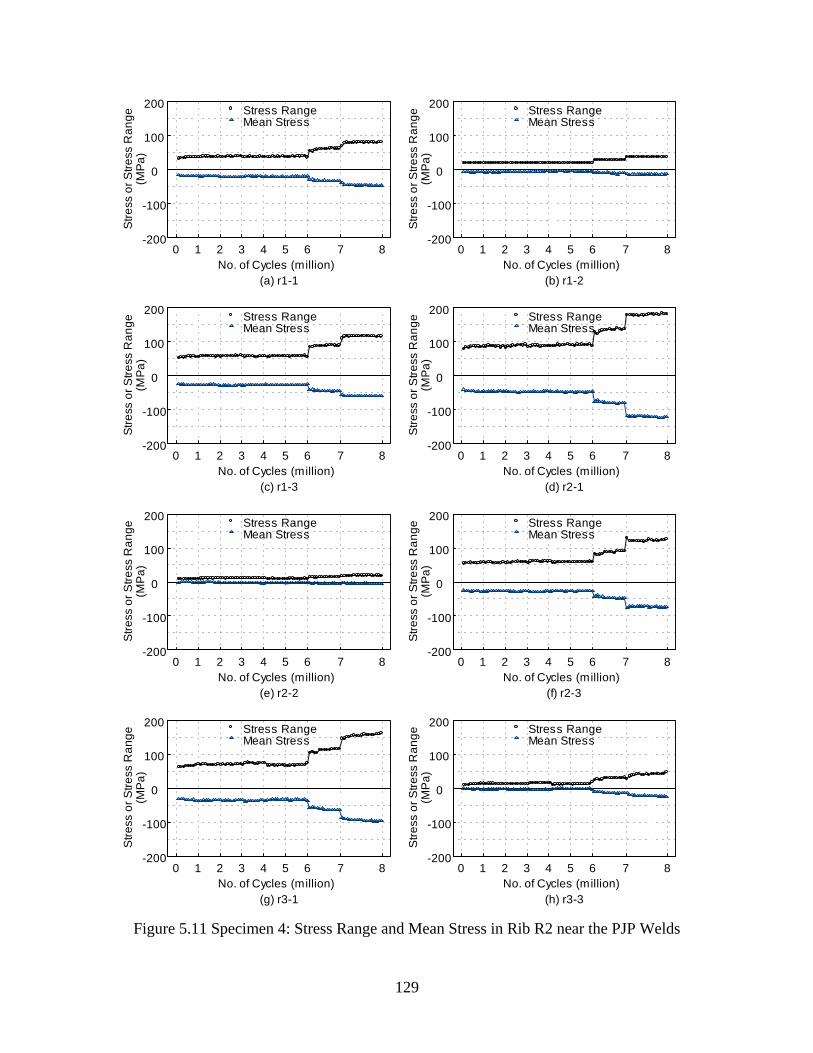
129
No. of Cycles (million)
Stre
ss o
r Stre
ss R
ange
(MPa
)
(a) r1-1
Stress RangeMean Stress
0 1 2 3 4 5 6 7 8-200
-100
0
100
200
No. of Cycles (million)
Stre
ss o
r Stre
ss R
ange
(MPa
)
(b) r1-2
Stress RangeMean Stress
0 1 2 3 4 5 6 7 8-200
-100
0
100
200
No. of Cycles (million)
Stre
ss o
r Stre
ss R
ange
(MPa
)
(c) r1-3
Stress RangeMean Stress
0 1 2 3 4 5 6 7 8-200
-100
0
100
200
No. of Cycles (million)
Stre
ss o
r Stre
ss R
ange
(MPa
)
(d) r2-1
Stress RangeMean Stress
0 1 2 3 4 5 6 7 8-200
-100
0
100
200
No. of Cycles (million)
Stre
ss o
r Stre
ss R
ange
(MPa
)
(e) r2-2
Stress RangeMean Stress
0 1 2 3 4 5 6 7 8-200
-100
0
100
200
No. of Cycles (million)
Stre
ss o
r Stre
ss R
ange
(MPa
)
(f) r2-3
Stress RangeMean Stress
0 1 2 3 4 5 6 7 8-200
-100
0
100
200
No. of Cycles (million)
Stre
ss o
r Stre
ss R
ange
(MP
a)
(g) r3-1
Stress RangeMean Stress
0 1 2 3 4 5 6 7 8-200
-100
0
100
200
No. of Cycles (million)
Stre
ss o
r Stre
ss R
ange
(MP
a)
(h) r3-3
Stress RangeMean Stress
0 1 2 3 4 5 6 7 8-200
-100
0
100
200
Figure 5.11 Specimen 4: Stress Range and Mean Stress in Rib R2 near the PJP Welds
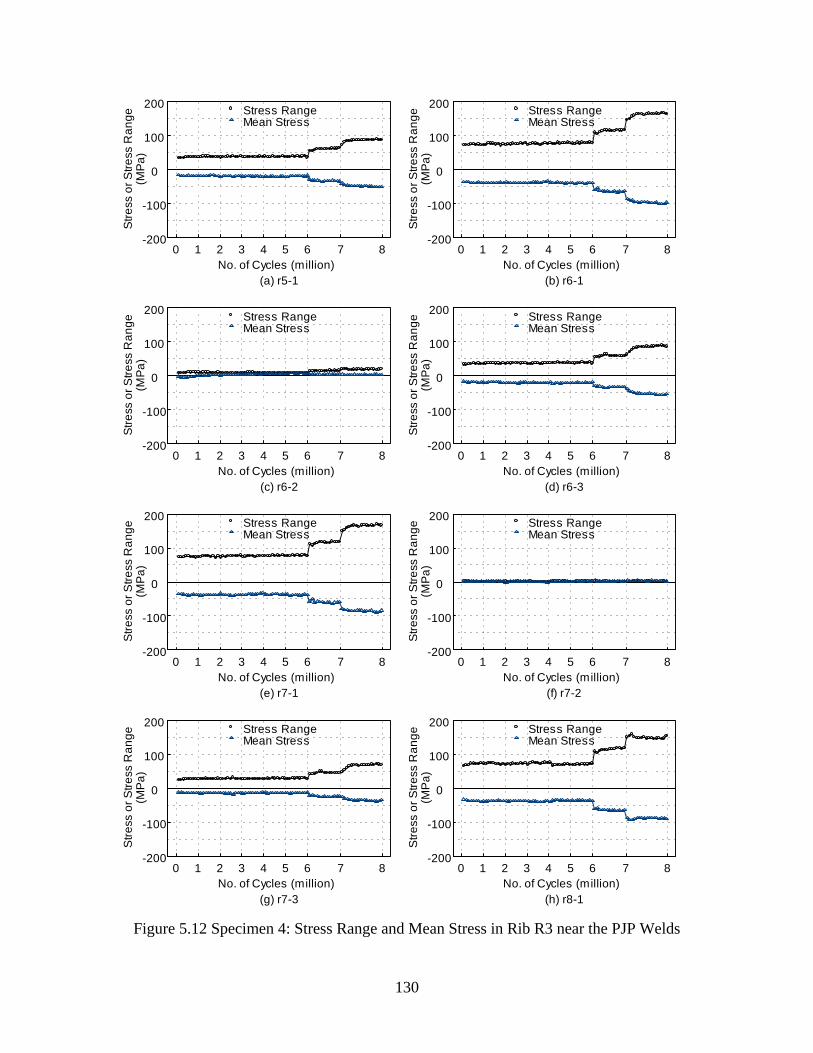
130
No. of Cycles (million)
Stre
ss o
r Stre
ss R
ange
(MPa
)
(a) r5-1
Stress RangeMean Stress
0 1 2 3 4 5 6 7 8-200
-100
0
100
200
No. of Cycles (million)
Stre
ss o
r Stre
ss R
ange
(MPa
)
(b) r6-1
Stress RangeMean Stress
0 1 2 3 4 5 6 7 8-200
-100
0
100
200
No. of Cycles (million)
Stre
ss o
r Stre
ss R
ange
(MPa
)
(c) r6-2
Stress RangeMean Stress
0 1 2 3 4 5 6 7 8-200
-100
0
100
200
No. of Cycles (million)
Stre
ss o
r Stre
ss R
ange
(MPa
)
(d) r6-3
Stress RangeMean Stress
0 1 2 3 4 5 6 7 8-200
-100
0
100
200
No. of Cycles (million)
Stre
ss o
r Stre
ss R
ange
(MPa
)
(e) r7-1
Stress RangeMean Stress
0 1 2 3 4 5 6 7 8-200
-100
0
100
200
No. of Cycles (million)
Stre
ss o
r Stre
ss R
ange
(MPa
)
(f) r7-2
Stress RangeMean Stress
0 1 2 3 4 5 6 7 8-200
-100
0
100
200
No. of Cycles (million)
Stre
ss o
r Stre
ss R
ange
(MP
a)
(g) r7-3
Stress RangeMean Stress
0 1 2 3 4 5 6 7 8-200
-100
0
100
200
No. of Cycles (million)
Stre
ss o
r Stre
ss R
ange
(MP
a)
(h) r8-1
Stress RangeMean Stress
0 1 2 3 4 5 6 7 8-200
-100
0
100
200
Figure 5.12 Specimen 4: Stress Range and Mean Stress in Rib R3 near the PJP Welds
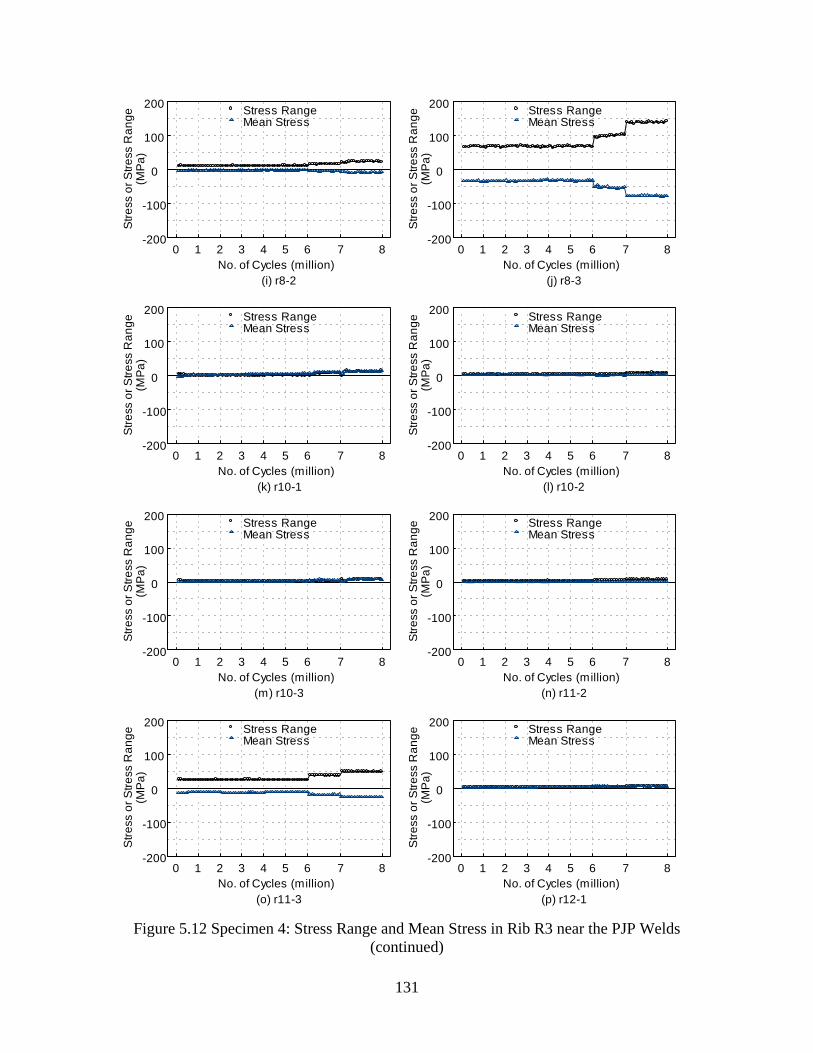
131
No. of Cycles (million)
Stre
ss o
r Stre
ss R
ange
(MPa
)
(i) r8-2
Stress RangeMean Stress
0 1 2 3 4 5 6 7 8-200
-100
0
100
200
No. of Cycles (million)
Stre
ss o
r Stre
ss R
ange
(MPa
)
(j) r8-3
Stress RangeMean Stress
0 1 2 3 4 5 6 7 8-200
-100
0
100
200
No. of Cycles (million)
Stre
ss o
r Stre
ss R
ange
(MPa
)
(k) r10-1
Stress RangeMean Stress
0 1 2 3 4 5 6 7 8-200
-100
0
100
200
No. of Cycles (million)
Stre
ss o
r Stre
ss R
ange
(MPa
)
(l) r10-2
Stress RangeMean Stress
0 1 2 3 4 5 6 7 8-200
-100
0
100
200
No. of Cycles (million)
Stre
ss o
r Stre
ss R
ange
(MPa
)
(m) r10-3
Stress RangeMean Stress
0 1 2 3 4 5 6 7 8-200
-100
0
100
200
No. of Cycles (million)
Stre
ss o
r Stre
ss R
ange
(MPa
)
(n) r11-2
Stress RangeMean Stress
0 1 2 3 4 5 6 7 8-200
-100
0
100
200
No. of Cycles (million)
Stre
ss o
r Stre
ss R
ange
(MP
a)
(o) r11-3
Stress RangeMean Stress
0 1 2 3 4 5 6 7 8-200
-100
0
100
200
No. of Cycles (million)
Stre
ss o
r Stre
ss R
ange
(MP
a)
(p) r12-1
Stress RangeMean Stress
0 1 2 3 4 5 6 7 8-200
-100
0
100
200
Figure 5.12 Specimen 4: Stress Range and Mean Stress in Rib R3 near the PJP Welds (continued)

132
No. of Cycles (million)
Stre
ss o
r Stre
ss R
ange
(MPa
)
(q) r12-2
Stress RangeMean Stress
0 1 2 3 4 5 6 7 8-200
-100
0
100
200
No. of Cycles (million)
Stre
ss o
r Stre
ss R
ange
(MPa
)
(r) r12-3
Stress RangeMean Stress
0 1 2 3 4 5 6 7 8-200
-100
0
100
200
Figure 5.12 Specimen 4: Stress Range and Mean Stress in Rib R3 near the PJP Welds (continued)
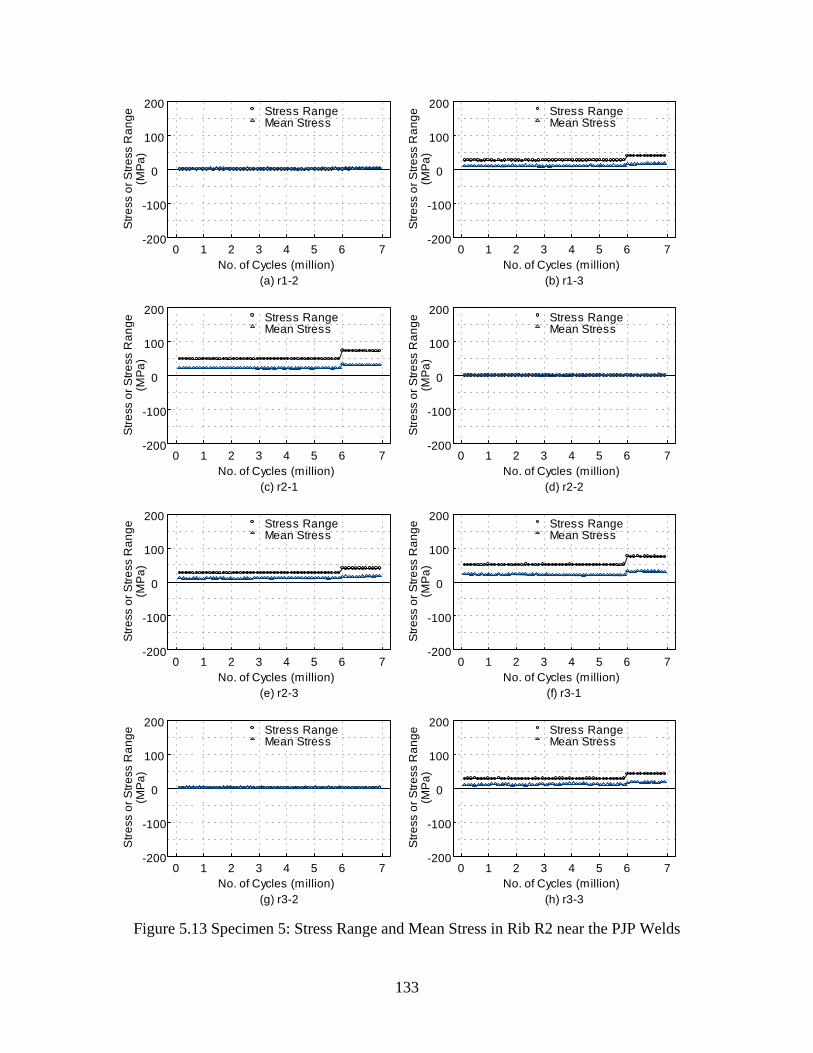
133
No. of Cycles (million)
Stre
ss o
r Stre
ss R
ange
(MPa
)
(a) r1-2
Stress RangeMean Stress
0 1 2 3 4 5 6 7-200
-100
0
100
200
No. of Cycles (million)
Stre
ss o
r Stre
ss R
ange
(MPa
)
(b) r1-3
Stress RangeMean Stress
0 1 2 3 4 5 6 7-200
-100
0
100
200
No. of Cycles (million)
Stre
ss o
r Stre
ss R
ange
(MPa
)
(c) r2-1
Stress RangeMean Stress
0 1 2 3 4 5 6 7-200
-100
0
100
200
No. of Cycles (million)
Stre
ss o
r Stre
ss R
ange
(MPa
)
(d) r2-2
Stress RangeMean Stress
0 1 2 3 4 5 6 7-200
-100
0
100
200
No. of Cycles (million)
Stre
ss o
r Stre
ss R
ange
(MPa
)
(e) r2-3
Stress RangeMean Stress
0 1 2 3 4 5 6 7-200
-100
0
100
200
No. of Cycles (million)
Stre
ss o
r Stre
ss R
ange
(MPa
)
(f) r3-1
Stress RangeMean Stress
0 1 2 3 4 5 6 7-200
-100
0
100
200
No. of Cycles (million)
Stre
ss o
r Stre
ss R
ange
(MP
a)
(g) r3-2
Stress RangeMean Stress
0 1 2 3 4 5 6 7-200
-100
0
100
200
No. of Cycles (million)
Stre
ss o
r Stre
ss R
ange
(MP
a)
(h) r3-3
Stress RangeMean Stress
0 1 2 3 4 5 6 7-200
-100
0
100
200
Figure 5.13 Specimen 5: Stress Range and Mean Stress in Rib R2 near the PJP Welds
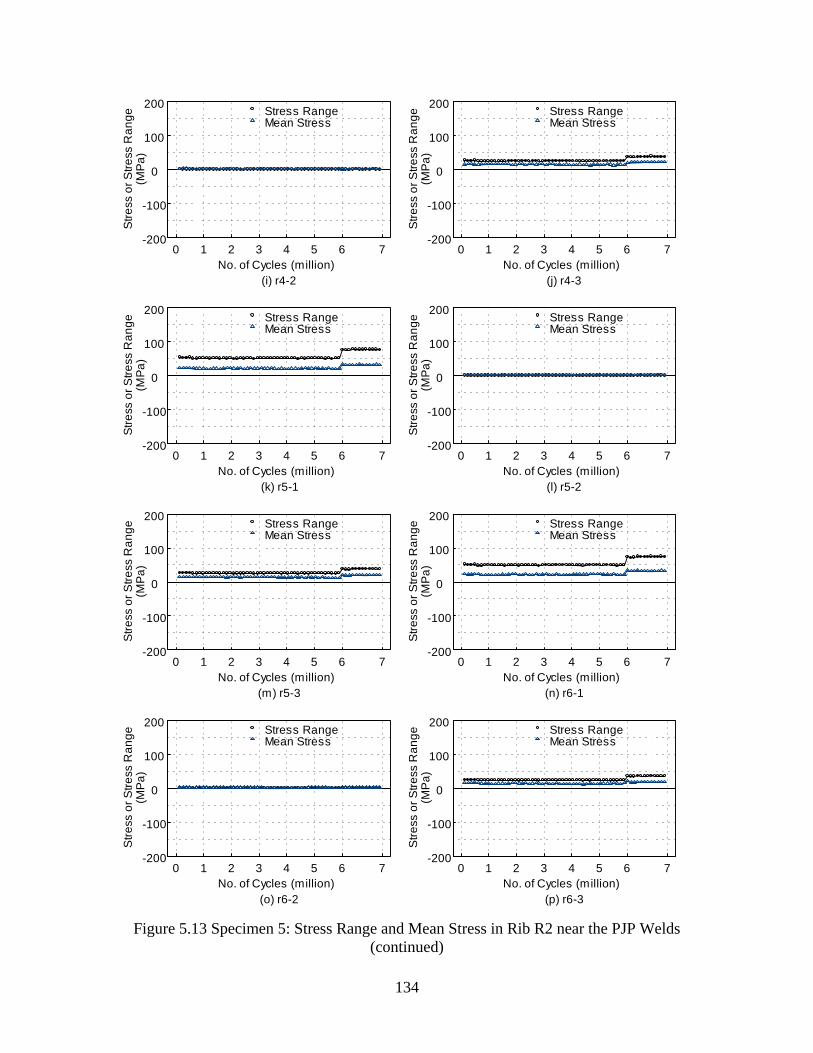
134
No. of Cycles (million)
Stre
ss o
r Stre
ss R
ange
(MPa
)
(i) r4-2
Stress RangeMean Stress
0 1 2 3 4 5 6 7-200
-100
0
100
200
No. of Cycles (million)
Stre
ss o
r Stre
ss R
ange
(MPa
)
(j) r4-3
Stress RangeMean Stress
0 1 2 3 4 5 6 7-200
-100
0
100
200
No. of Cycles (million)
Stre
ss o
r Stre
ss R
ange
(MPa
)
(k) r5-1
Stress RangeMean Stress
0 1 2 3 4 5 6 7-200
-100
0
100
200
No. of Cycles (million)
Stre
ss o
r Stre
ss R
ange
(MPa
)
(l) r5-2
Stress RangeMean Stress
0 1 2 3 4 5 6 7-200
-100
0
100
200
No. of Cycles (million)
Stre
ss o
r Stre
ss R
ange
(MPa
)
(m) r5-3
Stress RangeMean Stress
0 1 2 3 4 5 6 7-200
-100
0
100
200
No. of Cycles (million)
Stre
ss o
r Stre
ss R
ange
(MPa
)
(n) r6-1
Stress RangeMean Stress
0 1 2 3 4 5 6 7-200
-100
0
100
200
No. of Cycles (million)
Stre
ss o
r Stre
ss R
ange
(MP
a)
(o) r6-2
Stress RangeMean Stress
0 1 2 3 4 5 6 7-200
-100
0
100
200
No. of Cycles (million)
Stre
ss o
r Stre
ss R
ange
(MP
a)
(p) r6-3
Stress RangeMean Stress
0 1 2 3 4 5 6 7-200
-100
0
100
200
Figure 5.13 Specimen 5: Stress Range and Mean Stress in Rib R2 near the PJP Welds (continued)
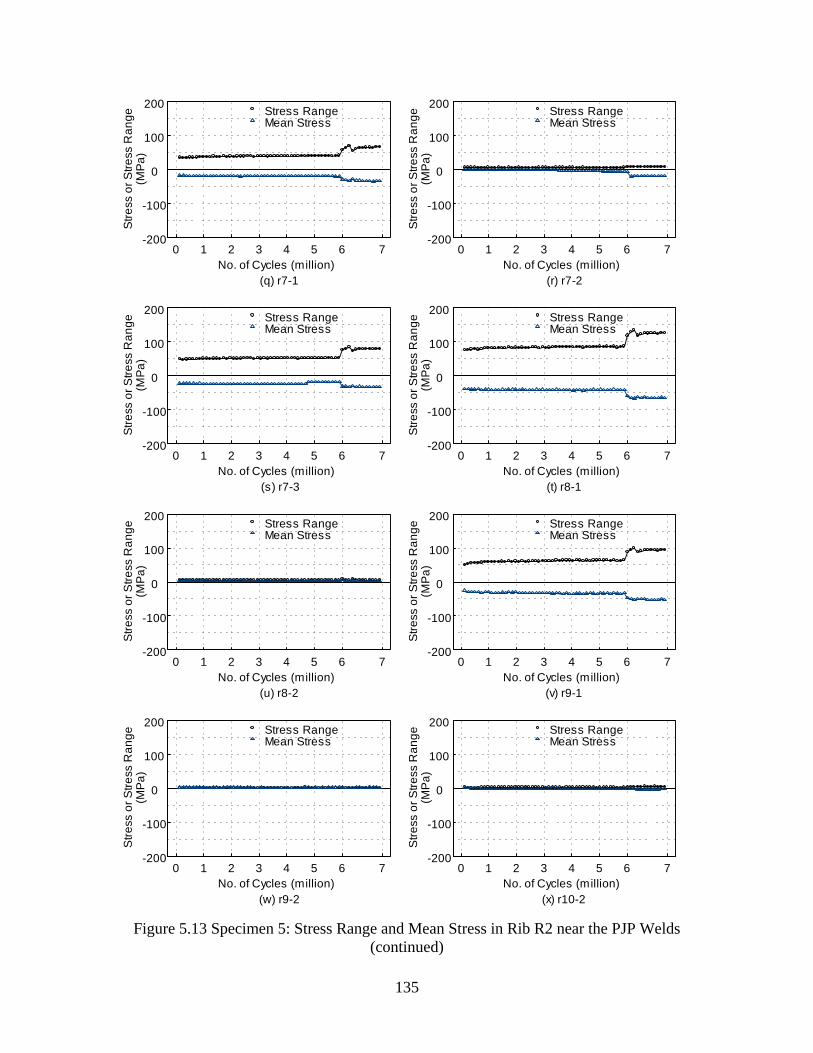
135
No. of Cycles (million)
Stre
ss o
r Stre
ss R
ange
(MPa
)
(q) r7-1
Stress RangeMean Stress
0 1 2 3 4 5 6 7-200
-100
0
100
200
No. of Cycles (million)
Stre
ss o
r Stre
ss R
ange
(MPa
)
(r) r7-2
Stress RangeMean Stress
0 1 2 3 4 5 6 7-200
-100
0
100
200
No. of Cycles (million)
Stre
ss o
r Stre
ss R
ange
(MPa
)
(s) r7-3
Stress RangeMean Stress
0 1 2 3 4 5 6 7-200
-100
0
100
200
No. of Cycles (million)
Stre
ss o
r Stre
ss R
ange
(MPa
)
(t) r8-1
Stress RangeMean Stress
0 1 2 3 4 5 6 7-200
-100
0
100
200
No. of Cycles (million)
Stre
ss o
r Stre
ss R
ange
(MPa
)
(u) r8-2
Stress RangeMean Stress
0 1 2 3 4 5 6 7-200
-100
0
100
200
No. of Cycles (million)
Stre
ss o
r Stre
ss R
ange
(MPa
)
(v) r9-1
Stress RangeMean Stress
0 1 2 3 4 5 6 7-200
-100
0
100
200
No. of Cycles (million)
Stre
ss o
r Stre
ss R
ange
(MP
a)
(w) r9-2
Stress RangeMean Stress
0 1 2 3 4 5 6 7-200
-100
0
100
200
No. of Cycles (million)
Stre
ss o
r Stre
ss R
ange
(MP
a)
(x) r10-2
Stress RangeMean Stress
0 1 2 3 4 5 6 7-200
-100
0
100
200
Figure 5.13 Specimen 5: Stress Range and Mean Stress in Rib R2 near the PJP Welds (continued)
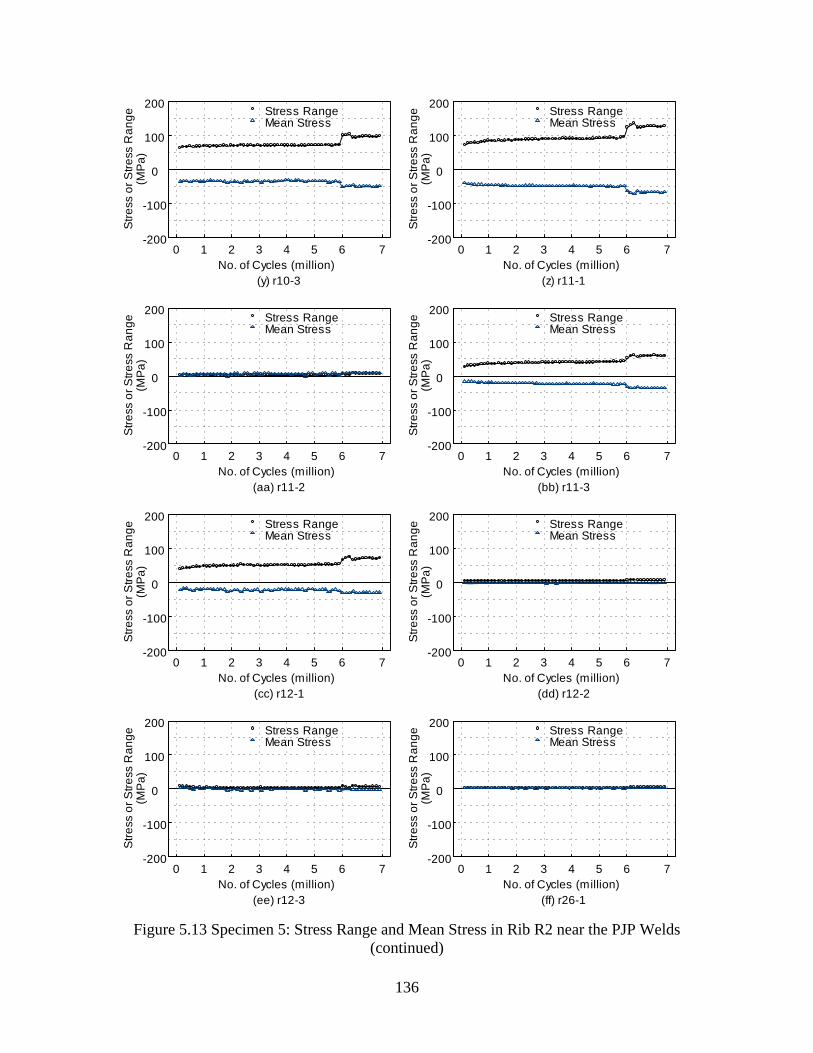
136
No. of Cycles (million)
Stre
ss o
r Stre
ss R
ange
(MP
a)
(y) r10-3
Stress RangeMean Stress
0 1 2 3 4 5 6 7-200
-100
0
100
200
No. of Cycles (million)
Stre
ss o
r Stre
ss R
ange
(MP
a)
(z) r11-1
Stress RangeMean Stress
0 1 2 3 4 5 6 7-200
-100
0
100
200
No. of Cycles (million)
Stre
ss o
r Stre
ss R
ange
(MP
a)
(aa) r11-2
Stress RangeMean Stress
0 1 2 3 4 5 6 7-200
-100
0
100
200
No. of Cycles (million)
Stre
ss o
r Stre
ss R
ange
(MP
a)
(bb) r11-3
Stress RangeMean Stress
0 1 2 3 4 5 6 7-200
-100
0
100
200
No. of Cycles (million)
Stre
ss o
r Stre
ss R
ange
(MP
a)
(cc) r12-1
Stress RangeMean Stress
0 1 2 3 4 5 6 7-200
-100
0
100
200
No. of Cycles (million)
Stre
ss o
r Stre
ss R
ange
(MP
a)
(dd) r12-2
Stress RangeMean Stress
0 1 2 3 4 5 6 7-200
-100
0
100
200
No. of Cycles (million)
Stre
ss o
r Stre
ss R
ange
(MP
a)
(ee) r12-3
Stress RangeMean Stress
0 1 2 3 4 5 6 7-200
-100
0
100
200
No. of Cycles (million)
Stre
ss o
r Stre
ss R
ange
(MP
a)
(ff) r26-1
Stress RangeMean Stress
0 1 2 3 4 5 6 7-200
-100
0
100
200
Figure 5.13 Specimen 5: Stress Range and Mean Stress in Rib R2 near the PJP Welds (continued)
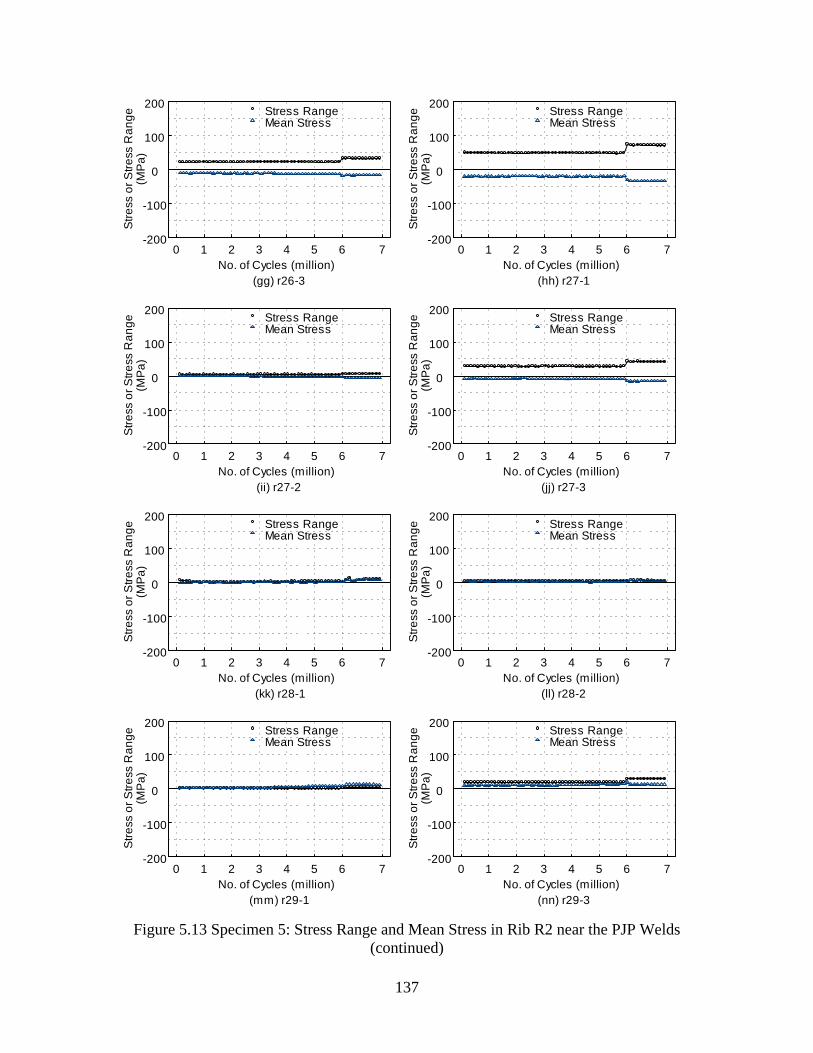
137
No. of Cycles (million)
Stre
ss o
r Stre
ss R
ange
(MP
a)
(gg) r26-3
Stress RangeMean Stress
0 1 2 3 4 5 6 7-200
-100
0
100
200
No. of Cycles (million)
Stre
ss o
r Stre
ss R
ange
(MP
a)
(hh) r27-1
Stress RangeMean Stress
0 1 2 3 4 5 6 7-200
-100
0
100
200
No. of Cycles (million)
Stre
ss o
r Stre
ss R
ange
(MP
a)
(ii) r27-2
Stress RangeMean Stress
0 1 2 3 4 5 6 7-200
-100
0
100
200
No. of Cycles (million)
Stre
ss o
r Stre
ss R
ange
(MP
a)
(jj) r27-3
Stress RangeMean Stress
0 1 2 3 4 5 6 7-200
-100
0
100
200
No. of Cycles (million)
Stre
ss o
r Stre
ss R
ange
(MP
a)
(kk) r28-1
Stress RangeMean Stress
0 1 2 3 4 5 6 7-200
-100
0
100
200
No. of Cycles (million)
Stre
ss o
r Stre
ss R
ange
(MP
a)
(ll) r28-2
Stress RangeMean Stress
0 1 2 3 4 5 6 7-200
-100
0
100
200
No. of Cycles (million)
Stre
ss o
r Stre
ss R
ange
(MP
a)
(mm) r29-1
Stress RangeMean Stress
0 1 2 3 4 5 6 7-200
-100
0
100
200
No. of Cycles (million)
Stre
ss o
r Stre
ss R
ange
(MP
a)
(nn) r29-3
Stress RangeMean Stress
0 1 2 3 4 5 6 7-200
-100
0
100
200
Figure 5.13 Specimen 5: Stress Range and Mean Stress in Rib R2 near the PJP Welds (continued)
138
No. of Cycles (million)
Stre
ss o
r Stre
ss R
ange
(MPa
)
(a) r1-1
Stress RangeMean Stress
0 1 2 3 4 5 6 7 8-200
-100
0
100
200
No. of Cycles (million)
Stre
ss o
r Stre
ss R
ange
(MPa
)
(b) r2-1
Stress RangeMean Stress
0 1 2 3 4 5 6 7 8-200
-100
0
100
200
No. of Cycles (million)
Stre
ss o
r Stre
ss R
ange
(MPa
)
(c) r3-1
Stress RangeMean Stress
0 1 2 3 4 5 6 7 8-200
-100
0
100
200
No. of Cycles (million)
Stre
ss o
r Stre
ss R
ange
(MPa
)
(d) r3-3
Stress RangeMean Stress
0 1 2 3 4 5 6 7 8-200
-100
0
100
200
No. of Cycles (million)
Stre
ss o
r Stre
ss R
ange
(MPa
)
(e) r7-1
Stress RangeMean Stress
0 1 2 3 4 5 6 7 8-200
-100
0
100
200
No. of Cycles (million)
Stre
ss o
r Stre
ss R
ange
(MPa
)
(f) r7-2
Stress RangeMean Stress
0 1 2 3 4 5 6 7 8-200
-100
0
100
200
No. of Cycles (million)
Stre
ss o
r Stre
ss R
ange
(MP
a)
(g) r7-3
Stress RangeMean Stress
0 1 2 3 4 5 6 7 8-200
-100
0
100
200
No. of Cycles (million)
Stre
ss o
r Stre
ss R
ange
(MP
a)
(h) r8-1
Stress RangeMean Stress
0 1 2 3 4 5 6 7 8-200
-100
0
100
200
Figure 5.14 Specimen 6: Stress Range and Mean Stress in Rib R2 near the PJP Welds
139
No. of Cycles (million)
Stre
ss o
r Stre
ss R
ange
(MPa
)
(i) r8-2
Stress RangeMean Stress
0 1 2 3 4 5 6 7 8-200
-100
0
100
200
No. of Cycles (million)
Stre
ss o
r Stre
ss R
ange
(MPa
)
(j) r8-3
Stress RangeMean Stress
0 1 2 3 4 5 6 7 8-200
-100
0
100
200
No. of Cycles (million)
Stre
ss o
r Stre
ss R
ange
(MPa
)
(k) r9-1
Stress RangeMean Stress
0 1 2 3 4 5 6 7 8-200
-100
0
100
200
No. of Cycles (million)
Stre
ss o
r Stre
ss R
ange
(MPa
)
(l) r9-2
Stress RangeMean Stress
0 1 2 3 4 5 6 7 8-200
-100
0
100
200
No. of Cycles (million)
Stre
ss o
r Stre
ss R
ange
(MP
a)
(m) r10-1
Stress RangeMean Stress
0 1 2 3 4 5 6 7 8-200
-100
0
100
200
Figure 5.14 Specimen 6: Stress Range and Mean Stress in Rib R2 near the PJP Welds (continued)
140
No. of Cycles (million)
Stre
ss o
r Stre
ss R
ange
(MPa
)
(a) r13-1
Stress RangeMean Stress
0 1 2 3 4 5 6 7 8-200
-100
0
100
200
No. of Cycles (million)
Stre
ss o
r Stre
ss R
ange
(MPa
)
(b) r13-2
Stress RangeMean Stress
0 1 2 3 4 5 6 7 8-200
-100
0
100
200
No. of Cycles (million)
Stre
ss o
r Stre
ss R
ange
(MPa
)
(c) r13-3
Stress RangeMean Stress
0 1 2 3 4 5 6 7 8-200
-100
0
100
200
No. of Cycles (million)
Stre
ss o
r Stre
ss R
ange
(MPa
)
(d) r14-1
Stress RangeMean Stress
0 1 2 3 4 5 6 7 8-200
-100
0
100
200
No. of Cycles (million)
Stre
ss o
r Stre
ss R
ange
(MPa
)
(e) r15-1
Stress RangeMean Stress
0 1 2 3 4 5 6 7 8-200
-100
0
100
200
No. of Cycles (million)
Stre
ss o
r Stre
ss R
ange
(MPa
)
(f) r15-3
Stress RangeMean Stress
0 1 2 3 4 5 6 7 8-200
-100
0
100
200
No. of Cycles (million)
Stre
ss o
r Stre
ss R
ange
(MP
a)
(g) r16-1
Stress RangeMean Stress
0 1 2 3 4 5 6 7 8-200
-100
0
100
200
No. of Cycles (million)
Stre
ss o
r Stre
ss R
ange
(MP
a)
(h) r19-1
Stress RangeMean Stress
0 1 2 3 4 5 6 7 8-200
-100
0
100
200
Figure 5.15 Specimen 6: Stress Range and Mean Stress in Rib R3 near the PJP Welds
141
No. of Cycles (million)
Stre
ss o
r Stre
ss R
ange
(MPa
)
(i) r19-3
Stress RangeMean Stress
0 1 2 3 4 5 6 7 8-200
-100
0
100
200
No. of Cycles (million)
Stre
ss o
r Stre
ss R
ange
(MPa
)
(j) r20-1
Stress RangeMean Stress
0 1 2 3 4 5 6 7 8-200
-100
0
100
200
No. of Cycles (million)
Stre
ss o
r Stre
ss R
ange
(MPa
)
(k) r20-3
Stress RangeMean Stress
0 1 2 3 4 5 6 7 8-200
-100
0
100
200
Figure 5.15 Specimen 6: Stress Range and Mean Stress in Rib R3 near the PJP Welds (continued)
5.2.3 Fatigue Cracks near Rib-to-Deck Welds
Regions of rib-to-deck welds directly beneath the loading pads were cut out for
further crack inspection after completion of testing at 8 million cycles for each of the
specimens. Figure 5.16 show the cutting locations with their designation (C1 to C4).
Once pieces were removed from the specimen, each piece was sliced in strips as shown in
Figure 5.17. Magnetic particle test (MT) was conducted on the strips to identify cracks at
the rib-to-deck welded joints. MT inspection revealed fatigue cracks in three specimens
(Specimens 2, 3, and 6). No cracks were observed in Specimens 4 and 5. Figure 5.18
shows typical cracks identified by MT. Most of the identified cracks showed a pattern
that initiated from the weld toe on the bottom side of the deck plate, and propagated into
the deck plate. One crack initiated from the weld root, and also propagated into the deck
plate. The crack from the weld root initiated from transition region between 80% PJP
and 100% PJP welds. No deck plate crack penetrated completely through the deck plate,
142
but was observed to arrest after it grew out of the residual tensile stress filed of the partial
penetration weld toe or weld root.
Cracks from the weld toe on the bottom of the deck plate were identified in
Specimen 2 at three locations (C1, C2, and C3). Figure 5.19 shows the crack depth at
location C2 and C3, measured vertically from the bottom side of the deck plate. A cross
section through the crack in C1 of Specimen 2 was cut, and it verified the linear crack
indication as shown in Figure 5.20. One crack was identified at the location of C1 in
Specimen 3, and the plot of the crack depth is shown in Figure 5.21. Cracks were
identified at three locations (C1, C2, and C3) in Specimen 6, among which the cracks
initiated from the weld toe at C1 and C2 and the crack initiated from the weld root at C3.
The plots of the crack depth at these locations are shown in Figure 5.22.
200 mm (Typ.)C2C1
C4C3
N
R4
R3
R2
R1
D1D2D3
3000
mm
5000 mm5000 mm
350 mm (Typ.)
Figure 5.16 Four Cutting Locations with Designations (C1 to C4)
Figure 5.17 Sliced Pieces
N
Deck Plate
Rib
143
(a) Crack from Weld Toe (b) Crack from Weld Root
Figure 5.18 Typical Crack Pattern at Rib-to-Deck PJP Welds
0 50 100 150 20002468
10121416
Cra
ck D
epth
(mm
)
Longitudinal Location (mm)
0 50 100 150 20002468
10121416
Cra
ck D
epth
(mm
)
Longitudinal Location (mm)
(a) Location C2 (b) Location C3
Figure 5.19 Specimen 2: Depth of Crack Initiating from Rib-to-Deck PJP Welds
Top of Deck Plate
Center of Loading
Top of Deck Plate
Center of Loading
deck
pla
te th
ickn
ess
144
Figure 5.20 Specimen 2: Indication of Linear Crack at Rib-to-Deck PJP Weld (Piece Location C1)
0 50 100 150 200 25002468
10121416
Cra
ck D
epth
(mm
)
Longitudinal Location (mm) Figure 5.21 Specimen 3: Crack Depth at Rib-to-Deck PJP Welds (Location C1)
Cutting Line
180 mm
Top of Deck Plate
Center of Loading
No Melt-Through Melt-Through
35 mm 65 mm
deck
pla
te th
ickn
ess
145
0 50 100 150 200 25002468
10121416
Cra
ck D
epth
(mm
)
Longitudinal Location (mm)
0 50 100 150 200 25002468
10121416
Cra
ck D
epth
(mm
)
Longitudinal Location (mm)
(a) Location C1 (b) Location C2
0 50 100 150 200 25002468
10121416
Cra
ck D
epth
(mm
)
Longitudinal Location (mm) (c) Location C3
Figure 5.22 Specimen 6: Crack Depth at Rib-to-Deck PJP Welds
Top of Deck Plate
Center of Loading
No Melt-Through Melt-Through
Top of Deck Plate
Center of Loading
No Melt-Through Melt-Through
Top of Deck Plate
Center of Loading
Melt-Through No Melt-Through
146
5.3 Measured Response at Support Diaphragms
5.3.1 Stress Distribution in Ribs, Diaphragms, and Bulkheads
The stress range (Sr) and the mean stress (Sm) computed from the measured
strains on ribs, bulkheads, and diaphragms at the supports are summarized in Tables 5.9
5.12. Plots of the stress range and the mean stress up to 8 million cycles are shown in
Figures 5.23 to 5.28.
For example, up to the first 100,000 cycles before cracks were initiated, the S15
and S16 pair would give a maximum in-plane stress of -7.5 MPa and a maximum out-of-
plane (or bending) stress of 48.5 MPa. The stress range on the inner surface of the rib
wall was 40.6 MPa (mean stress = 20.7 MPa), and the stress range on the outer surface
was 54.5 MPa (mean stress = -28.8 MPa). These plots show a significant variation of the
stresses during the entire loading cycles. Such variation was caused by a redistribution of
the stresses once the cracks developed.
The stress range in the bulkheads and diaphragms was low in general. During the
first 100,000 cycles, gage r32-3 of Specimen 3 showed a maximum stress range of 32.9
MPa (mean stress = -19.1 MPa) in compression filed, and gage r6-3 of Specimen 2
showed a maximum stress range of 9.2 MPa (mean stress = 8.9 MPa) in tension field.
Based on the strain gage rosettes placed at the bottom corners of the bulkheads of an
exterior support, r28-3 of Specimen 3 gave a maximum stress range of 13.4 MPa (mean
stress = -8.2 MPa) in compression field, and r27-2 of Specimen 2 gave a maximum stress
range of 7.4 MPa (mean stress = 4.0 MPa) in tension field.
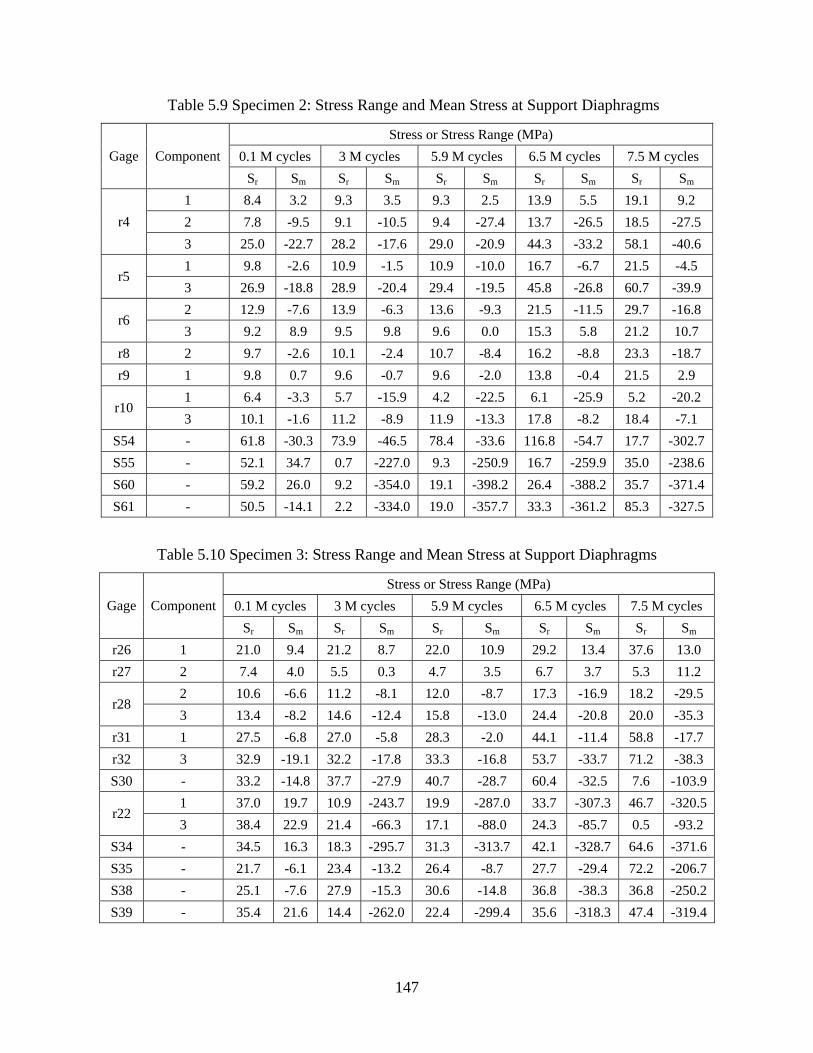
147
Table 5.9 Specimen 2: Stress Range and Mean Stress at Support Diaphragms
Stress or Stress Range (MPa) 0.1 M cycles 3 M cycles 5.9 M cycles 6.5 M cycles 7.5 M cycles Gage Component
Sr Sm Sr Sm Sr Sm Sr Sm Sr Sm 1 8.4 3.2 9.3 3.5 9.3 2.5 13.9 5.5 19.1 9.2 2 7.8 -9.5 9.1 -10.5 9.4 -27.4 13.7 -26.5 18.5 -27.5 r4 3 25.0 -22.7 28.2 -17.6 29.0 -20.9 44.3 -33.2 58.1 -40.6 1 9.8 -2.6 10.9 -1.5 10.9 -10.0 16.7 -6.7 21.5 -4.5
r5 3 26.9 -18.8 28.9 -20.4 29.4 -19.5 45.8 -26.8 60.7 -39.9 2 12.9 -7.6 13.9 -6.3 13.6 -9.3 21.5 -11.5 29.7 -16.8
r6 3 9.2 8.9 9.5 9.8 9.6 0.0 15.3 5.8 21.2 10.7
r8 2 9.7 -2.6 10.1 -2.4 10.7 -8.4 16.2 -8.8 23.3 -18.7 r9 1 9.8 0.7 9.6 -0.7 9.6 -2.0 13.8 -0.4 21.5 2.9
1 6.4 -3.3 5.7 -15.9 4.2 -22.5 6.1 -25.9 5.2 -20.2 r10
3 10.1 -1.6 11.2 -8.9 11.9 -13.3 17.8 -8.2 18.4 -7.1 S54 - 61.8 -30.3 73.9 -46.5 78.4 -33.6 116.8 -54.7 17.7 -302.7 S55 - 52.1 34.7 0.7 -227.0 9.3 -250.9 16.7 -259.9 35.0 -238.6 S60 - 59.2 26.0 9.2 -354.0 19.1 -398.2 26.4 -388.2 35.7 -371.4 S61 - 50.5 -14.1 2.2 -334.0 19.0 -357.7 33.3 -361.2 85.3 -327.5
Table 5.10 Specimen 3: Stress Range and Mean Stress at Support Diaphragms
Stress or Stress Range (MPa) 0.1 M cycles 3 M cycles 5.9 M cycles 6.5 M cycles 7.5 M cycles Gage Component
Sr Sm Sr Sm Sr Sm Sr Sm Sr Sm r26 1 21.0 9.4 21.2 8.7 22.0 10.9 29.2 13.4 37.6 13.0 r27 2 7.4 4.0 5.5 0.3 4.7 3.5 6.7 3.7 5.3 11.2
2 10.6 -6.6 11.2 -8.1 12.0 -8.7 17.3 -16.9 18.2 -29.5 r28
3 13.4 -8.2 14.6 -12.4 15.8 -13.0 24.4 -20.8 20.0 -35.3 r31 1 27.5 -6.8 27.0 -5.8 28.3 -2.0 44.1 -11.4 58.8 -17.7 r32 3 32.9 -19.1 32.2 -17.8 33.3 -16.8 53.7 -33.7 71.2 -38.3 S30 - 33.2 -14.8 37.7 -27.9 40.7 -28.7 60.4 -32.5 7.6 -103.9
1 37.0 19.7 10.9 -243.7 19.9 -287.0 33.7 -307.3 46.7 -320.5 r22
3 38.4 22.9 21.4 -66.3 17.1 -88.0 24.3 -85.7 0.5 -93.2 S34 - 34.5 16.3 18.3 -295.7 31.3 -313.7 42.1 -328.7 64.6 -371.6 S35 - 21.7 -6.1 23.4 -13.2 26.4 -8.7 27.7 -29.4 72.2 -206.7 S38 - 25.1 -7.6 27.9 -15.3 30.6 -14.8 36.8 -38.3 36.8 -250.2 S39 - 35.4 21.6 14.4 -262.0 22.4 -299.4 35.6 -318.3 47.4 -319.4
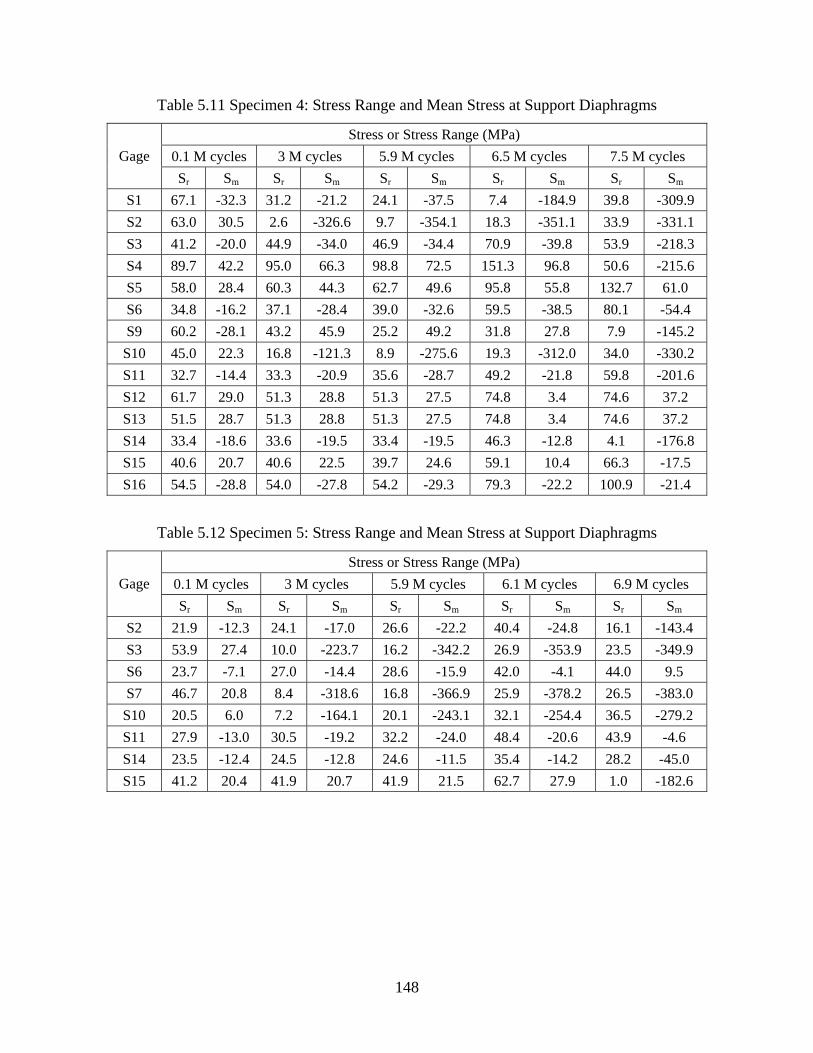
148
Table 5.11 Specimen 4: Stress Range and Mean Stress at Support Diaphragms
Stress or Stress Range (MPa) 0.1 M cycles 3 M cycles 5.9 M cycles 6.5 M cycles 7.5 M cycles Gage Sr Sm Sr Sm Sr Sm Sr Sm Sr Sm
S1 67.1 -32.3 31.2 -21.2 24.1 -37.5 7.4 -184.9 39.8 -309.9 S2 63.0 30.5 2.6 -326.6 9.7 -354.1 18.3 -351.1 33.9 -331.1 S3 41.2 -20.0 44.9 -34.0 46.9 -34.4 70.9 -39.8 53.9 -218.3 S4 89.7 42.2 95.0 66.3 98.8 72.5 151.3 96.8 50.6 -215.6 S5 58.0 28.4 60.3 44.3 62.7 49.6 95.8 55.8 132.7 61.0 S6 34.8 -16.2 37.1 -28.4 39.0 -32.6 59.5 -38.5 80.1 -54.4 S9 60.2 -28.1 43.2 45.9 25.2 49.2 31.8 27.8 7.9 -145.2
S10 45.0 22.3 16.8 -121.3 8.9 -275.6 19.3 -312.0 34.0 -330.2 S11 32.7 -14.4 33.3 -20.9 35.6 -28.7 49.2 -21.8 59.8 -201.6 S12 61.7 29.0 51.3 28.8 51.3 27.5 74.8 3.4 74.6 37.2 S13 51.5 28.7 51.3 28.8 51.3 27.5 74.8 3.4 74.6 37.2 S14 33.4 -18.6 33.6 -19.5 33.4 -19.5 46.3 -12.8 4.1 -176.8 S15 40.6 20.7 40.6 22.5 39.7 24.6 59.1 10.4 66.3 -17.5 S16 54.5 -28.8 54.0 -27.8 54.2 -29.3 79.3 -22.2 100.9 -21.4
Table 5.12 Specimen 5: Stress Range and Mean Stress at Support Diaphragms
Stress or Stress Range (MPa) 0.1 M cycles 3 M cycles 5.9 M cycles 6.1 M cycles 6.9 M cycles Gage Sr Sm Sr Sm Sr Sm Sr Sm Sr Sm
S2 21.9 -12.3 24.1 -17.0 26.6 -22.2 40.4 -24.8 16.1 -143.4 S3 53.9 27.4 10.0 -223.7 16.2 -342.2 26.9 -353.9 23.5 -349.9 S6 23.7 -7.1 27.0 -14.4 28.6 -15.9 42.0 -4.1 44.0 9.5 S7 46.7 20.8 8.4 -318.6 16.8 -366.9 25.9 -378.2 26.5 -383.0
S10 20.5 6.0 7.2 -164.1 20.1 -243.1 32.1 -254.4 36.5 -279.2 S11 27.9 -13.0 30.5 -19.2 32.2 -24.0 48.4 -20.6 43.9 -4.6 S14 23.5 -12.4 24.5 -12.8 24.6 -11.5 35.4 -14.2 28.2 -45.0 S15 41.2 20.4 41.9 20.7 41.9 21.5 62.7 27.9 1.0 -182.6
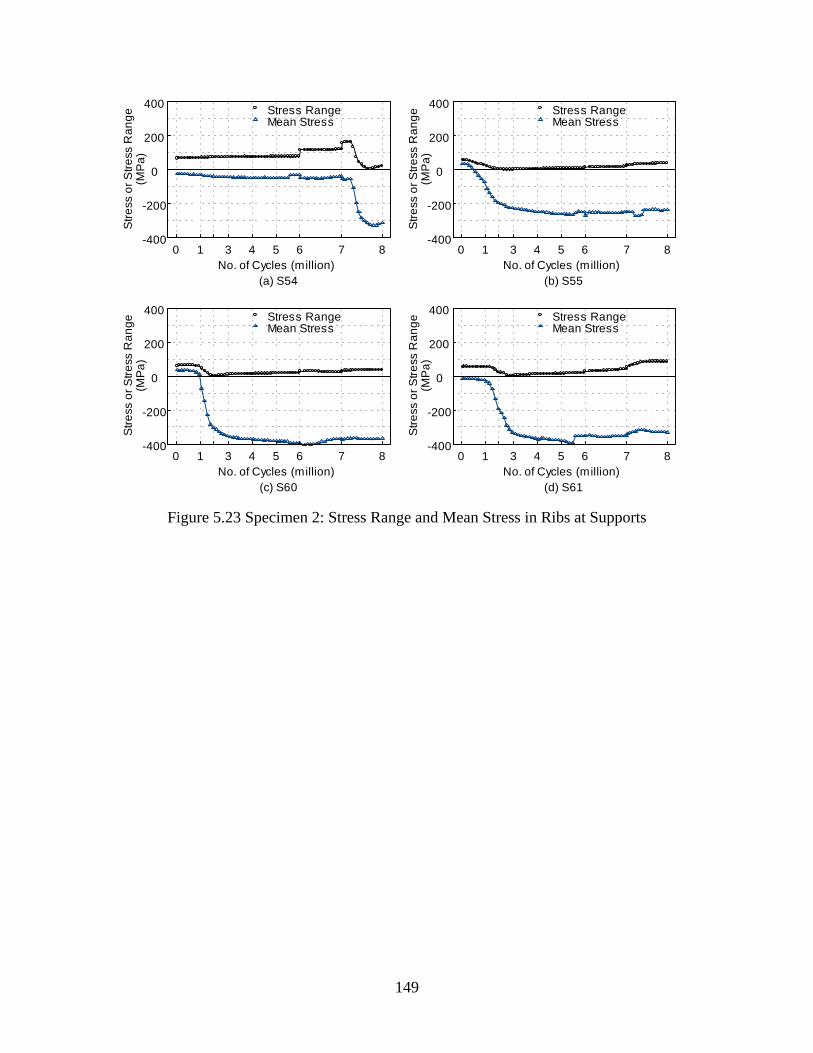
149
No. of Cycles (million)
Stre
ss o
r Stre
ss R
ange
(MP
a)
(a) S54
Stress RangeMean Stress
0 1 3 4 5 6 7 8-400
-200
0
200
400
No. of Cycles (million)
Stre
ss o
r Stre
ss R
ange
(MP
a)
(b) S55
Stress RangeMean Stress
0 1 3 4 5 6 7 8-400
-200
0
200
400
No. of Cycles (million)
Stre
ss o
r Stre
ss R
ange
(MP
a)
(c) S60
Stress RangeMean Stress
0 1 3 4 5 6 7 8-400
-200
0
200
400
No. of Cycles (million)
Stre
ss o
r Stre
ss R
ange
(MP
a)
(d) S61
Stress RangeMean Stress
0 1 3 4 5 6 7 8-400
-200
0
200
400
Figure 5.23 Specimen 2: Stress Range and Mean Stress in Ribs at Supports
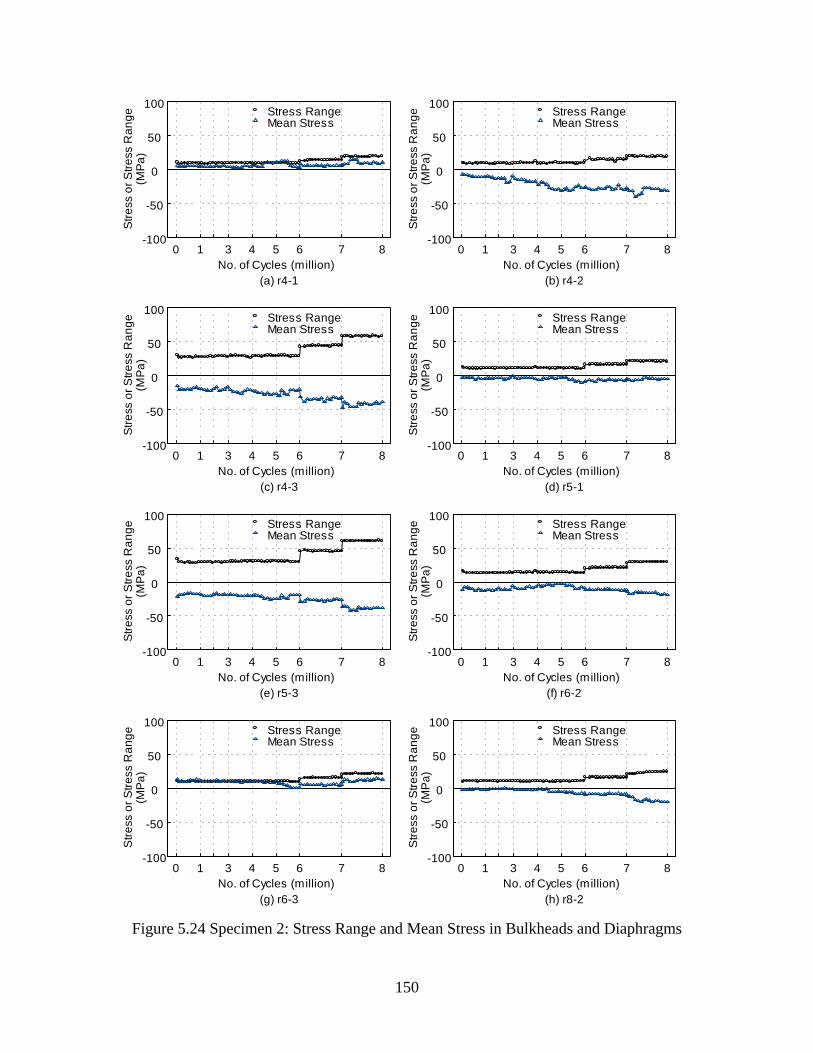
150
No. of Cycles (million)
Stre
ss o
r Stre
ss R
ange
(MPa
)
(a) r4-1
Stress RangeMean Stress
0 1 3 4 5 6 7 8-100
-50
0
50
100
No. of Cycles (million)
Stre
ss o
r Stre
ss R
ange
(MPa
)
(b) r4-2
Stress RangeMean Stress
0 1 3 4 5 6 7 8-100
-50
0
50
100
No. of Cycles (million)
Stre
ss o
r Stre
ss R
ange
(MPa
)
(c) r4-3
Stress RangeMean Stress
0 1 3 4 5 6 7 8-100
-50
0
50
100
No. of Cycles (million)
Stre
ss o
r Stre
ss R
ange
(MPa
)
(d) r5-1
Stress RangeMean Stress
0 1 3 4 5 6 7 8-100
-50
0
50
100
No. of Cycles (million)
Stre
ss o
r Stre
ss R
ange
(MPa
)
(e) r5-3
Stress RangeMean Stress
0 1 3 4 5 6 7 8-100
-50
0
50
100
No. of Cycles (million)
Stre
ss o
r Stre
ss R
ange
(MPa
)
(f) r6-2
Stress RangeMean Stress
0 1 3 4 5 6 7 8-100
-50
0
50
100
No. of Cycles (million)
Stre
ss o
r Stre
ss R
ange
(MP
a)
(g) r6-3
Stress RangeMean Stress
0 1 3 4 5 6 7 8-100
-50
0
50
100
No. of Cycles (million)
Stre
ss o
r Stre
ss R
ange
(MP
a)
(h) r8-2
Stress RangeMean Stress
0 1 3 4 5 6 7 8-100
-50
0
50
100
Figure 5.24 Specimen 2: Stress Range and Mean Stress in Bulkheads and Diaphragms
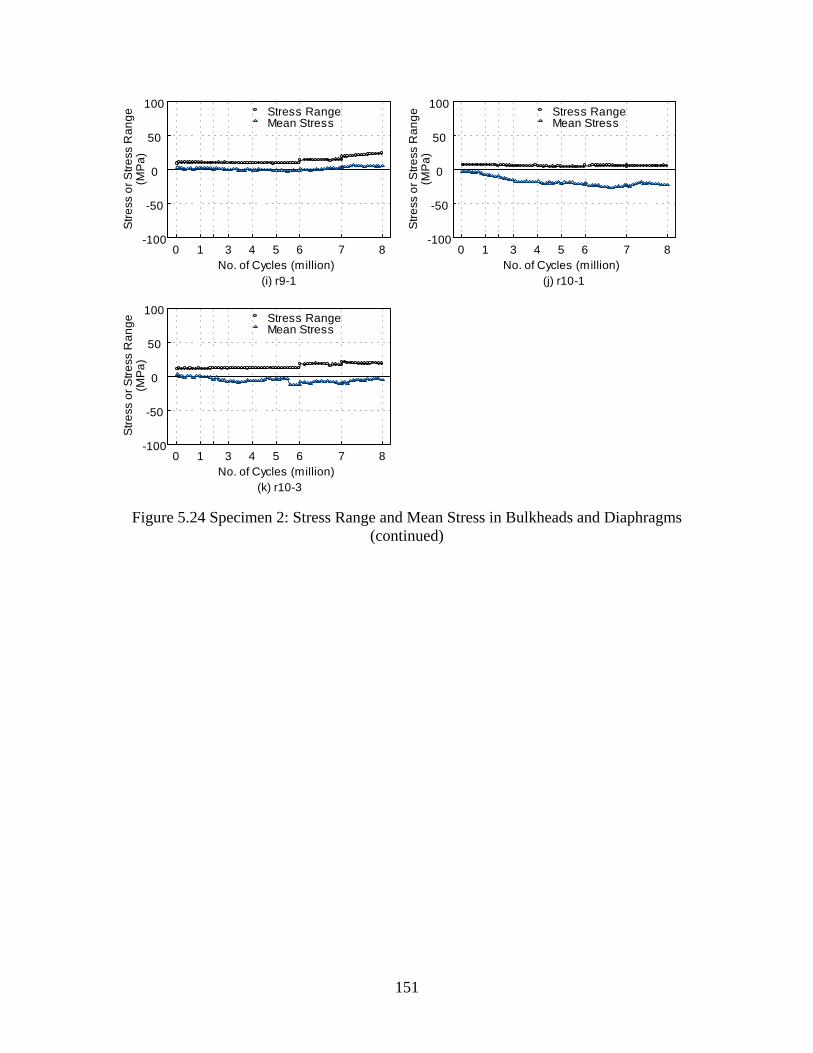
151
No. of Cycles (million)
Stre
ss o
r Stre
ss R
ange
(MP
a)
(i) r9-1
Stress RangeMean Stress
0 1 3 4 5 6 7 8-100
-50
0
50
100
No. of Cycles (million)
Stre
ss o
r Stre
ss R
ange
(MP
a)
(j) r10-1
Stress RangeMean Stress
0 1 3 4 5 6 7 8-100
-50
0
50
100
No. of Cycles (million)
Stre
ss o
r Stre
ss R
ange
(MP
a)
(k) r10-3
Stress RangeMean Stress
0 1 3 4 5 6 7 8-100
-50
0
50
100
Figure 5.24 Specimen 2: Stress Range and Mean Stress in Bulkheads and Diaphragms (continued)
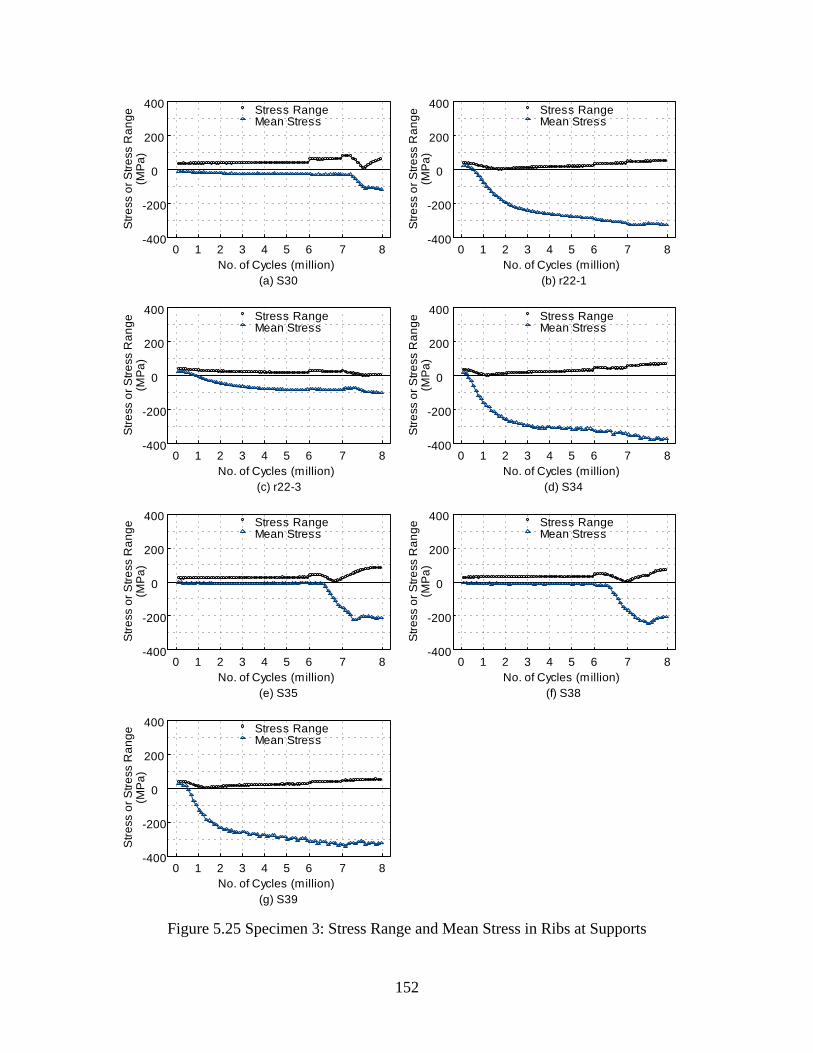
152
No. of Cycles (million)
Stre
ss o
r Stre
ss R
ange
(MPa
)
(a) S30
Stress RangeMean Stress
0 1 2 3 4 5 6 7 8-400
-200
0
200
400
No. of Cycles (million)
Stre
ss o
r Stre
ss R
ange
(MPa
)
(b) r22-1
Stress RangeMean Stress
0 1 2 3 4 5 6 7 8-400
-200
0
200
400
No. of Cycles (million)
Stre
ss o
r Stre
ss R
ange
(MPa
)
(c) r22-3
Stress RangeMean Stress
0 1 2 3 4 5 6 7 8-400
-200
0
200
400
No. of Cycles (million)
Stre
ss o
r Stre
ss R
ange
(MPa
)
(d) S34
Stress RangeMean Stress
0 1 2 3 4 5 6 7 8-400
-200
0
200
400
No. of Cycles (million)
Stre
ss o
r Stre
ss R
ange
(MPa
)
(e) S35
Stress RangeMean Stress
0 1 2 3 4 5 6 7 8-400
-200
0
200
400
No. of Cycles (million)
Stre
ss o
r Stre
ss R
ange
(MPa
)
(f) S38
Stress RangeMean Stress
0 1 2 3 4 5 6 7 8-400
-200
0
200
400
No. of Cycles (million)
Stre
ss o
r Stre
ss R
ange
(MP
a)
(g) S39
Stress RangeMean Stress
0 1 2 3 4 5 6 7 8-400
-200
0
200
400
Figure 5.25 Specimen 3: Stress Range and Mean Stress in Ribs at Supports

153
No. of Cycles (million)
Stre
ss o
r Stre
ss R
ange
(MPa
)
(a) r26-1
Stress RangeMean Stress
0 1 2 3 4 5 6 7 8-100
-50
0
50
100
No. of Cycles (million)
Stre
ss o
r Stre
ss R
ange
(MPa
)
(b) r27-2
Stress RangeMean Stress
0 1 2 3 4 5 6 7 8-100
-50
0
50
100
No. of Cycles (million)
Stre
ss o
r Stre
ss R
ange
(MPa
)
(c) r28-2
Stress RangeMean Stress
0 1 2 3 4 5 6 7 8-100
-50
0
50
100
No. of Cycles (million)
Stre
ss o
r Stre
ss R
ange
(MPa
)
(d) r28-3
Stress RangeMean Stress
0 1 2 3 4 5 6 7 8-100
-50
0
50
100
No. of Cycles (million)
Stre
ss o
r Stre
ss R
ange
(MP
a)
(e) r31-1
Stress RangeMean Stress
0 1 2 3 4 5 6 7 8-100
-50
0
50
100
No. of Cycles (million)
Stre
ss o
r Stre
ss R
ange
(MP
a)
(f) r32-3
Stress RangeMean Stress
0 1 2 3 4 5 6 7 8-100
-50
0
50
100
Figure 5.26 Specimen 3: Stress Range and Mean Stress in Bulkheads and Diaphragms
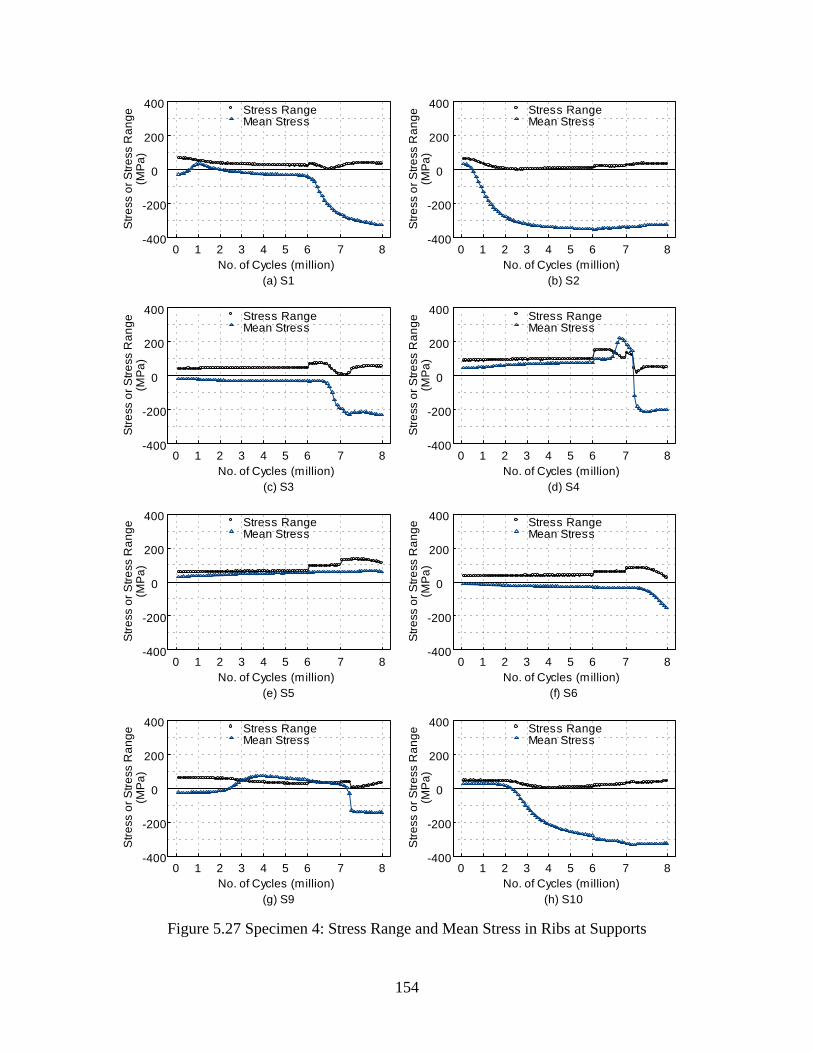
154
No. of Cycles (million)
Stre
ss o
r Stre
ss R
ange
(MPa
)
(a) S1
Stress RangeMean Stress
0 1 2 3 4 5 6 7 8-400
-200
0
200
400
No. of Cycles (million)
Stre
ss o
r Stre
ss R
ange
(MPa
)
(b) S2
Stress RangeMean Stress
0 1 2 3 4 5 6 7 8-400
-200
0
200
400
No. of Cycles (million)
Stre
ss o
r Stre
ss R
ange
(MPa
)
(c) S3
Stress RangeMean Stress
0 1 2 3 4 5 6 7 8-400
-200
0
200
400
No. of Cycles (million)
Stre
ss o
r Stre
ss R
ange
(MPa
)
(d) S4
Stress RangeMean Stress
0 1 2 3 4 5 6 7 8-400
-200
0
200
400
No. of Cycles (million)
Stre
ss o
r Stre
ss R
ange
(MPa
)
(e) S5
Stress RangeMean Stress
0 1 2 3 4 5 6 7 8-400
-200
0
200
400
No. of Cycles (million)
Stre
ss o
r Stre
ss R
ange
(MPa
)
(f) S6
Stress RangeMean Stress
0 1 2 3 4 5 6 7 8-400
-200
0
200
400
No. of Cycles (million)
Stre
ss o
r Stre
ss R
ange
(MP
a)
(g) S9
Stress RangeMean Stress
0 1 2 3 4 5 6 7 8-400
-200
0
200
400
No. of Cycles (million)
Stre
ss o
r Stre
ss R
ange
(MP
a)
(h) S10
Stress RangeMean Stress
0 1 2 3 4 5 6 7 8-400
-200
0
200
400
Figure 5.27 Specimen 4: Stress Range and Mean Stress in Ribs at Supports
155
No. of Cycles (million)
Stre
ss o
r Stre
ss R
ange
(MPa
)
(i) S11
Stress RangeMean Stress
0 1 2 3 4 5 6 7 8-400
-200
0
200
400
No. of Cycles (million)
Stre
ss o
r Stre
ss R
ange
(MPa
)
(j) S12
Stress RangeMean Stress
0 1 2 3 4 5 6 7 8-400
-200
0
200
400
No. of Cycles (million)
Stre
ss o
r Stre
ss R
ange
(MP
a)
(k) S13
Stress RangeMean Stress
0 1 2 3 4 5 6 7 8-400
-200
0
200
400
No. of Cycles (million)
Stre
ss o
r Stre
ss R
ange
(MP
a)
(l) S14
Stress RangeMean Stress
0 1 2 3 4 5 6 7 8-400
-200
0
200
400
No. of Cycles (million)
Stre
ss o
r Stre
ss R
ange
(MPa
)
(m) S15
Stress RangeMean Stress
0 1 2 3 4 5 6 7 8-400
-200
0
200
400
No. of Cycles (million)
Stre
ss o
r Stre
ss R
ange
(MPa
)
(n) S16
Stress RangeMean Stress
0 1 2 3 4 5 6 7 8-400
-200
0
200
400
Figure 5.27 Specimen 4: Stress Range and Mean Stress in Ribs at Supports (continued)
156
No. of Cycles (million)
Stre
ss o
r Stre
ss R
ange
(MPa
)
(a) S2
Stress RangeMean Stress
0 1 2 3 4 5 6 7-400
-200
0
200
400
No. of Cycles (million)
Stre
ss o
r Stre
ss R
ange
(MPa
)
(b) S3
Stress RangeMean Stress
0 1 2 3 4 5 6 7-400
-200
0
200
400
No. of Cycles (million)
Stre
ss o
r Stre
ss R
ange
(MPa
)
(c) S6
Stress RangeMean Stress
0 1 2 3 4 5 6 7-400
-200
0
200
400
No. of Cycles (million)
Stre
ss o
r Stre
ss R
ange
(MPa
)
(d) S7
Stress RangeMean Stress
0 1 2 3 4 5 6 7-400
-200
0
200
400
No. of Cycles (million)
Stre
ss o
r Stre
ss R
ange
(MPa
)
(e) S10
Stress RangeMean Stress
0 1 2 3 4 5 6 7-400
-200
0
200
400
No. of Cycles (million)
Stre
ss o
r Stre
ss R
ange
(MPa
)
(f) S11
Stress RangeMean Stress
0 1 2 3 4 5 6 7-400
-200
0
200
400
No. of Cycles (million)
Stre
ss o
r Stre
ss R
ange
(MP
a)
(g) S14
Stress RangeMean Stress
0 1 2 3 4 5 6 7-400
-200
0
200
400
No. of Cycles (million)
Stre
ss o
r Stre
ss R
ange
(MP
a)
(h) S15
Stress RangeMean Stress
0 1 2 3 4 5 6 7-400
-200
0
200
400
Figure 5.28 Specimen 5: Stress Range and Mean Stress in Ribs at Supports
157
5.3.2 Fatigue Cracks Observed in Ribs below Bulkhead and Diaphragm Cutout
Figure 5.29 shows an observed crack pattern on the rib walls below the bulkhead
and the diaphragm cutout at the end supports. A cross section through the crack is shown
in Figure 5.30. Most of the cracks on the rib walls initiated at the weld toe below the
bulkhead in tension cycles. Cracks that initiated at the weld toe below the bulkhead in
compression cycles did not propagate as quickly as those initiated in tension cycles.
Table 5.13 summarizes the length of the rib wall cracks, measured horizontally in the
longitudinal direction at each million cycles. No cracks were identified at the interior
support.
Table 5.13 Specimen 4: Crack Length Below Rib-to-Bulkhead Connection (mm)
Diaphragm D1 Diaphragm D3
Rib R2 Rib R3 Rib R2 Rib R3 No. of Cycles
(million) East West East West East West East West
1 15, 6 - 11 9, 12 - - - -
2 22, 12 14 15 12, 17 24 5 8 -
3 36 20 17 16, 20 30 9 13 12
4 48 23 18 37 32 25 15 16
5 55 25 19 39 35 27 18 19
6 70 28 27 49 47 33 25 30
158
(a) View from Inside of Rib
(b) View from Outside of Rib
Figure 5.29 Specimen 5: Observed Crack Pattern at End Supports (at 8 M cycles)
Rib Plate
Bulkhead
Rib Plate
Diaphragm
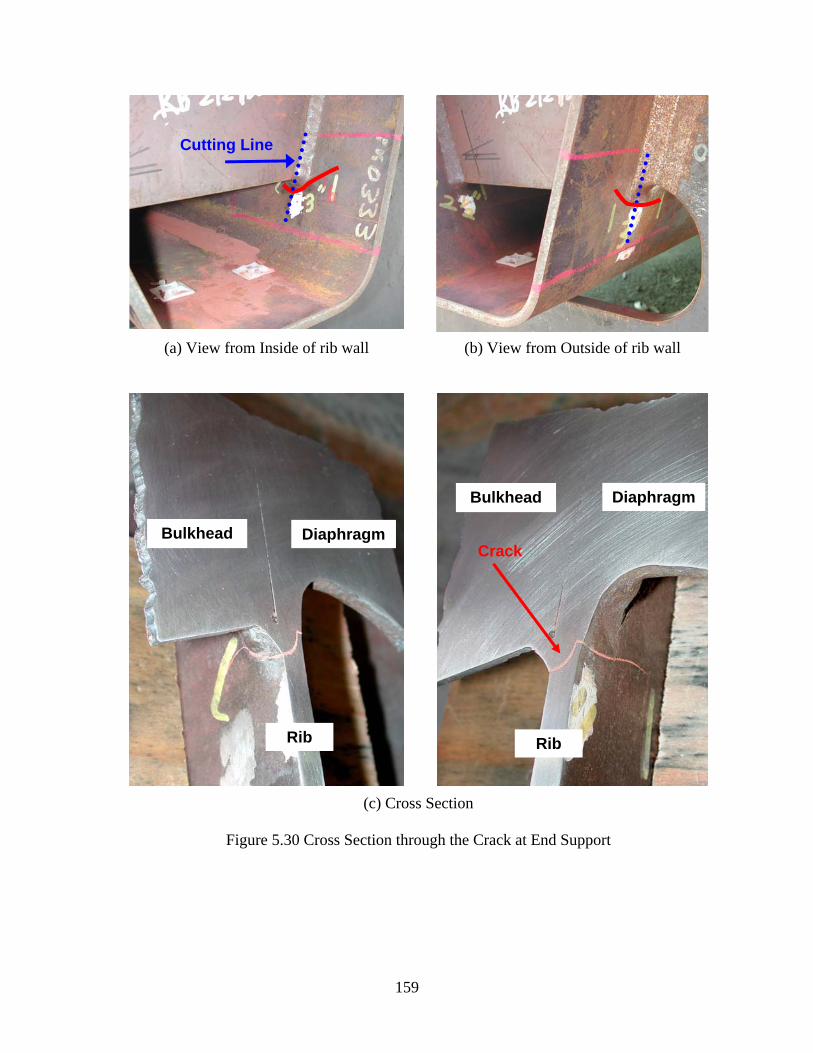
159
(a) View from Inside of rib wall (b) View from Outside of rib wall
(c) Cross Section
Figure 5.30 Cross Section through the Crack at End Support
Rib
Crack Bulkhead Diaphragm
Rib
Diaphragm Bulkhead
Cutting Line
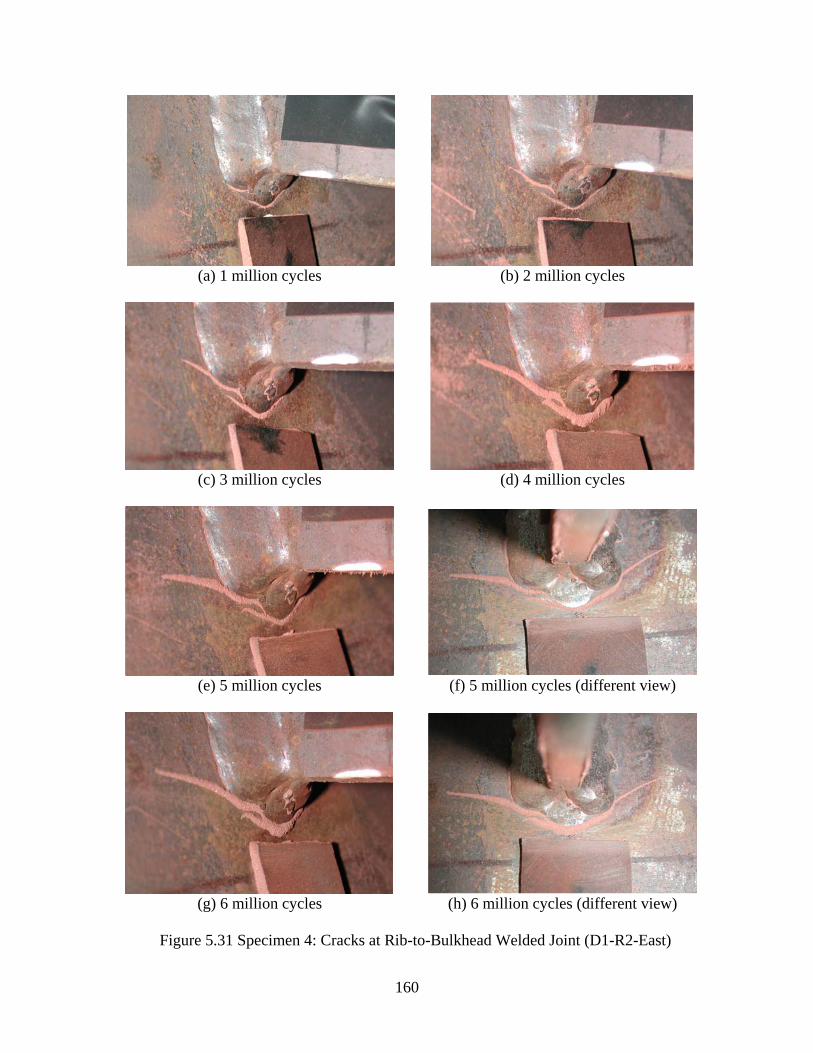
160
(a) 1 million cycles (b) 2 million cycles
(c) 3 million cycles
(d) 4 million cycles
(e) 5 million cycles (f) 5 million cycles (different view)
(g) 6 million cycles (h) 6 million cycles (different view)
Figure 5.31 Specimen 4: Cracks at Rib-to-Bulkhead Welded Joint (D1-R2-East)
161
5.4 Comparison of Test Results
5.4.1 Effect of Heat Straightening on Fatigue Resistance of Rib-to-Deck Welds
As was stated in Section 2.1.3, Specimen 6 was the first one that was pre-
cambered. Since the measured distortion was not that different from its counterpart
(Specimen 3) without pre-cambering, additional shims were used for Specimens 4 and 5,
a measure that was shown from measurement to be effective. As a result, no heating on
the ribs was required.
Table 5.14 shows the number of cracks and crack types at four loading location of
all test specimens. Rib-to-deck weld cracks were identified in three specimens
(Specimens 2, 3, and 6); these specimens required significant heat straightening.
(Specimen 1 also required significant heat straightening. Unfortunately, it was the first
specimen that was tested with a much higher load, although the contact stress was lower.
Furthermore, the test result of this specimen cannot be compared with the others because
the boundary condition was also different and the test was stopped at 1 million cycles.)
On the other hand, the two effectively pre-cambered specimens (Specimens 4 and 5) did
not show any cracks. Based on this limited database, it is prudent to conclude that
effective pre-cambering is beneficial to mitigate the potential for rib-to-deck cracking.
5.4.2 Effect of Weld Melt-Through on Fatigue Resistance of Rib-to-Deck Welds
Of the seven cracks listed in Table 5.14, six cracks were initiated from outside of
the rib at weld toe. Only one location (C3) in Specimen 6 had a crack that initiated from
inside the rib at the weld root. The crack length was the shortest among all seven
identified cracks, but the crack initiated from the transition from 80% PJP to 100% PJP
welds (see Figure 5.22). No such crack was identified in another specimen (Specimen 3)
with similar weld condition. Nor were Specimens 2 and 5 that had continuous weld melt-
through. Since no other specimens showed weld root cracking, this limited database
would suggest that discontinuous weld melt-through is not desirable.
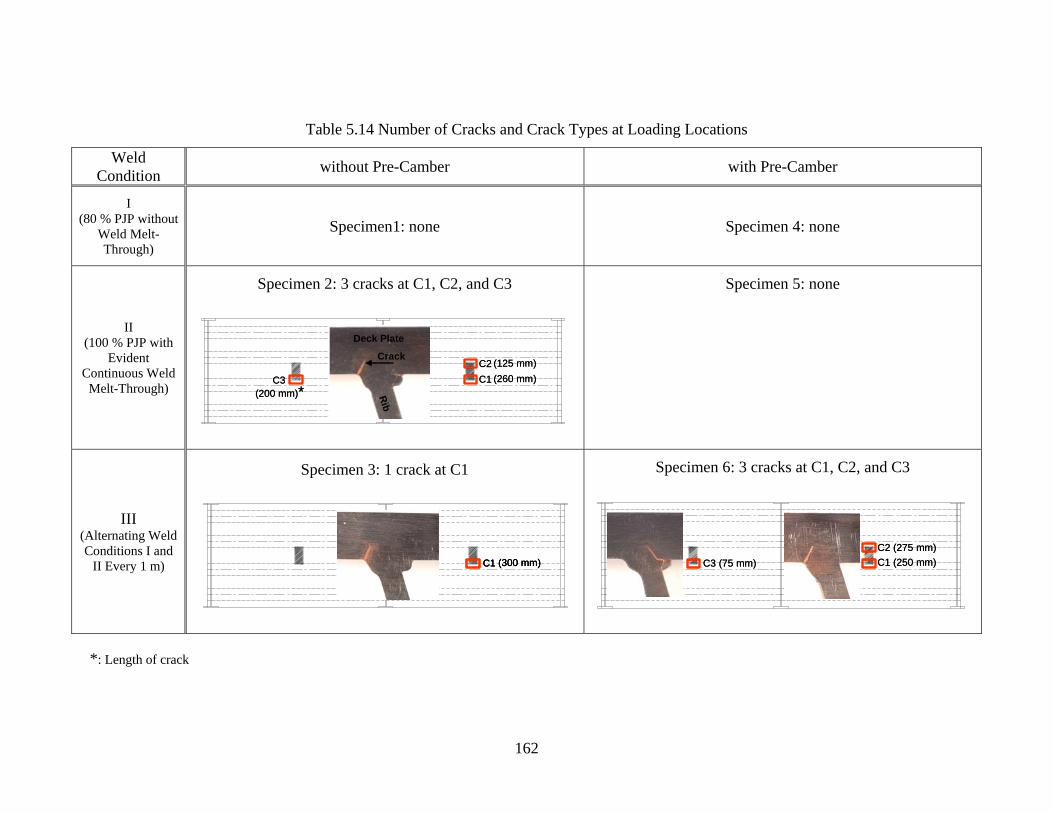
162
Table 5.14 Number of Cracks and Crack Types at Loading Locations
Weld Condition without Pre-Camber with Pre-Camber
I (80 % PJP without
Weld Melt-Through)
Specimen1: none Specimen 4: none
II (100 % PJP with
Evident Continuous Weld
Melt-Through)
Specimen 2: 3 cracks at C1, C2, and C3
C1C2
C3 (260 mm)(125 mm)
(200 mm)*
Deck Plate
Crack
Rib
C1C2
C3 (260 mm)(125 mm)
(200 mm)*
Deck Plate
Crack
Rib
Deck Plate
Crack
Deck Plate
Crack
Rib
Specimen 5: none
III (Alternating Weld Conditions I and
II Every 1 m)
Specimen 3: 1 crack at C1
C1 (300 mm)C1 (300 mm)C1 (300 mm)
Specimen 6: 3 cracks at C1, C2, and C3
C1 (250 mm)C2 (275 mm)
C3 (75 mm) C1 (250 mm)C2 (275 mm)
C3 (75 mm)
*: Length of crack
163
6. SUMMARY AND CONCLUSIONS
6.1 Summary
A common US practice for the fabrication of orthotropic bridge deck with closed
ribs is to use 80% partial-joint-penetration groove welds (PJP) between the deck plate
and the rib. For fatigue considerations, AASHTO Specification limits the thickness of
the rib in order to minimize local out-of-plane flexural stress at the welded joint. To
avoid weld melt-through a tight fit is essential during welding. It is challenging to avoid
weld melt-through along the entire length when welding such thin ribs. When it occurs,
unfortunately, weld melt-through cannot be inspected easily inside the closed rib. It is
not clear how the fatigue resistance of PJP welds will be affected by weld melt-through,
which usually produces a geometric discontinuity or even a notch-like condition near the
weld root.
The second issue for fabrication is related to the straightening procedure after
welding in order to satisfy the flatness requirement of the orthotropic deck. This includes
heating along the PJP weld lines from the top of the deck plate in order to correct the
weld distortion in the transverse direction and heating the ribs at selected locations to
correct the longitudinal distortion. In addition to heat straightening, pre-cambering
before welding is also used from time to time. When pre-cambering is not used,
however, it is not clear whether repetitive heat straightening will affect the fatigue
resistance of PJP welds.
Six full-scale orthotropic steel deck specimens (10 m long by 3 m wide) were
fabricated and tested in order to study the effects of both weld melt-through and
distortion control measures on the fatigue resistance of the deck-to-rib PJP welded joint.
Three of the specimens were only heat straightened, and the other three were pre-
cambered to minimize the need for subsequent heat straightening. For the two distortion
control schemes one of the three weld conditions [80% PJP weld as shown in Figure
1.5(b), 100% PJP weld with evident continuous weld melt-through as shown in Figure
1.5(a)], and alternating the above two weld conditions every 1 m} was used for each
specimen.
164
Each specimen was composed of two spans with diaphragms at three support
locations. Cyclic loading with an amplitude of 188 kN was applied at the mid-length of
each span and was out of phase to simulate the effect of a moving truck. The testing plan
called for 6 million cycles first, followed by an increase of the initial load level of 50% to
282 kN for the next one million cycles, and another 50% increase of the initial load to
376 kN for the last one million cycles, for a total of 8 million cycles. Prior to testing,
finite element analysis was also conducted to predict the response and to provide
information for instrumentation.
A tandem loading pattern was used for testing the first specimen (see Figure
2.26). Testing was stopped after 1 million cycles when significant cracking initiating
from the bottom ends of the welds connecting the ribs to both the diaphragm plate and
bulkheads at the cutouts was observed (see Figure 4.4). Such “premature” cracking,
which was caused by out-of-plane twisting of the cross section (see Figure 3.7), was
associated with two factors: (i) the load level was high considering that the width of the
test specimen would only accommodate one half an axle, and (ii) transverse stiffeners
installed on the diaphragm would not allow the supports to rotate freely. These stiffeners
were then removed (see Figure 4.17) and a half-axle loading scheme was used (see
Figure 2.27) for the remaining specimens.
Such modifications were effective to delay the development of cracks in end
diaphragms, and all the remaining five specimens were tested to 8 million cycles. While
diaphragm cracks were easy to identify, this was not the case for cracks in the rib-to-deck
PJP welds under the loading points, especially when these cracks propagated upward into
the deck plate, even though UT inspection was attempted. For each specimen, pieces
were cut from four locations after testing for further examination. Table 5.14
summarizes the findings.
6.2 Conclusions
Based on the loading scheme applied and the limited database in Table 5.14, the
following conclusions can be made on the fatigue resistance of rib-to-deck PJP welded
joints.
165
(1) Initially, weld melt-through which creates a geometric discontinuity at the weld
root, was one concern that initiated this research. Table 5.14 shows that cracks
were observed in three specimens at seven locations in the deck plate. But only
one crack initiated from weld root inside the closed rib (location C3 of Specimen
6), and all the other six cracks initiated from weld toe outside the closed rib.
Based on the loading pattern applied, it appears that these welds are more
vulnerable to cracks initiating from the weld toe, not weld root. All deck plate
cracks developed where a single axle wheel load of 188 kN was applied. All
cracks appeared to arrest after they had extended out of the residual tensile stress
field from welding.
(2) Of the only one that developed at the weld root in Specimen 6, the crack initiated
from a location transitioning from 80% PJP weld to 100% PJP weld. The
geometric discontinuity that existed in not only transverse but also longitudinal
directions appears detrimental. This type of discontinuity may be representative
of the effect of weld melt-through in actual production of orthotropic steel decks.
(3) Specimen 6 was the first specimen that was pre-cambered. The deck panel was
insufficiently pre-cambered (see Figures 2.18 and 2.19) and the resulting
distortion and heat straightening were the same as required for the un-cambered
specimens. The figure also shows that the other two specimens (Specimens 4 and
5) were effectively pre-cambered by using the revised cambering scheme (see
Figure 2.10 and Table 2.2). Excluding Specimen 1, which was tested up to 1
million cycles only due to “premature” cracking in the end diaphragms resulting
from the extreme full axle load of 188 kN that was applied to simulate two half
axles and unanticipated end restraint, Table 5.14 shows that only these two
effectively pre-cambered specimens did not experience cracking in the PJP welds.
Therefore, effective pre-cambering is beneficial to mitigate the crack potential in
rib-to-deck PJP welds.
166
REFERENCES
(1) AASHTO. (2007). LRFD Bridge Design Specifications, American Association of
State Highway and Transportation Officials, Washington, D.C.
(2) Bocchieri, W. J., Fisher, J. W. (1998). “Williamsburg Bridge Replacement
Orthotropic Deck As-Built Fatigue Test.” ATLSS Report No. 98-04, Advanced
Technology for Large Structural Systems, Lehigh University, Bethlehem, PA
(3) Chen, W. F., Duan, L. (1999), editors. Bridge Engineering, Handbook, CRC
Press, Washington, D.C.
(4) Connor, R. J., Fisher, J. W. (2006a). “Consistent Approach to Calculating Stresses
for Fatigue Design of Welded Rib-to-Web Connections in Steel Orthotropic
Bridge Decks.” Journal of Bridge Engineering, ASCE, Vol. 11, No. 5, pp. 517-
525.
(5) Connor, R. J., Fisher, J. W. (2006b). “Identifying Effective and Ineffective
Retrofits for Distortion Fatigue Cracking in Steel Bridges Using Field
Instrumentation.” Journal of Bridge Engineering, ASCE, Vol. 11, No. 6, pp. 745-
752.
(6) Fisher, J. W., Kulak, G. L., Smith, Ian F. C. (1997). “A Fatigue Primer for
Structural Engineers.” ATLSS Report No. 97-11, Advanced Technology for Large
Structural Systems, Lehigh University, Bethlehem, PA
(7) Fisher, J. W. (2005). Personal Communication.
(8) Gurney, T. (1992). Fatigue of Steel Bridge Decks: State-of-the-Art Review 8,
Transportation Research Laboratory, Department of Transport, HMSO, London

167
(9) Kaczinski, M. R., Stokes, F. E., Lugger, P., Fisher, J. W. (1997). “Williamsburg
Bridge Orthotropic Deck Fatigue Test.” ATLSS Report No. 97-04, Advanced
Technology for Large Structural Systems, Lehigh University, Bethlehem, PA
(10) Machida, F., Miki, C., Hirabayashi, Y., Tokida, H., Shimozato, T. (2003).
“Fatigue of Weld Connections to Trough Stiffeners in Orthotropic Steel Bridge
Decks.” Doc. XIII-1972-03, 2003 Annual Assembly of International Institute of
Welding, , Bucharest
(11) Masahiro, Y., Akihiro, K., Mitsuhiro, Y., Takeshi, N., Shinji, M. (2006).
“Fabrication and Transportation of Orthotropic Box Girder for New Carquinez
Bridge.” IHI Engineering Review, Vol. 39, No. 2.
(12) Miki, C. (2006). “Fatigue Damage in Orthotropic Steel Bridge Decks and Retrofit
Works.” International Journal of Steel Structures, KSSC, Vol. 6, No. 4, pp. 255-
267.
(13) Troitsky, M. S. (1987). Orthotropic Bridges, Theory and Design, 2nd Edition, The
James F. Lincoln Arc Welding Foundation, Cleveland, OH
(14) Tsakopoulos, P. A., Fisher, J. W. (1999). “Williamsburg Bridge Replacement
Orthotropic Deck As-Built Full-Scale Fatigue Test.” ATLSS Report No. 99-02,
Advanced Technology for Large Structural Systems, Lehigh University,
Bethlehem, PA
(15) Tsakopoulos, P. A., Fisher, J. W. (2006). “Full-Scale Fatigue Tests of Steel
Orthotropic Decks for the Williamsburg Bridge.” Journal of Bridge Engineering,
ASCE, Vol. 8, No. 5, pp. 323-333.
(16) Wolchuk, W. (2004). “Orthotropic Deck Bridges.” Roman Wolchuk Consulting
Engineers, ASCE Seminar, Sacramento, CA
168
(17) Xiao, Z. G., Yamada, K., Inoue, J., Yamaguchi, K. (2005). “Fatigue Cracks in
Longitudinal Ribs of Steel Orthotropic Deck.” International Journal of Fatigue,
Vol. 28, pp. 409-416.
(18) Ya, S., Yamada, K., Ojio, T., Biehn, B. (2007). “Fatigue Tests of Welded Joint of
Trough Rib to Orthotropic Steel Deck Plate.” Journal of Structural Engineering,
JSCE, Vol. 53A. (in Japanese)
(19) Yamada, K. (2006). “Some New Approaches to Fatigue Evaluation of Steel
Bridges.” International Journal of Steel Structures, KSSC, Vol. 6, No. 4, pp. 319-
326.