effects of explosions on embankment dams - curve of explosions on embankment dams by george a....
TRANSCRIPT

Effects of explosions on embankment dams
by
George A. Afriyie
A thesis submitted to the Faculty of Graduate and Postdoctoral
Affairs in partial fulfillment of the requirements for the degree
of
Master of Applied Science
In
Civil Engineering
Carleton University
Ottawa, Ontario.
© 2014, George A. Afriyie

i
Abstract
The efficient management and protection of critical infrastructure such as dams is
relevant to safety of the population of every country. A breach of any dam could have
serious ramifications on downstream communities including loss of electricity, flooding,
injury and fatality. The associated economic losses can also be enormous depending on
the size and emergency preparedness of the community. The level of damage caused by
an explosive device on an embankment dam depends on the type and amount of
explosive as well as the placement of the explosive relative to the dam cross-section.
This thesis is a numerical study into the effects of explosion on embankment dams using
the high fidelity physics based finite element package, LS-DYNA. A numerical model
was developed in LS-DYNA and validated using field testing. The numerical results
indicated that the LS-DYNA model was able to predict the crater dimensions on the
embankment dam when compared with the field testing. The investigation on the effects
of charge mass showed that there was an increase in crater diameter and depth as the
charge mass increased. The effect of reservoir water level on crater dimensions was also
investigated; the crater dimensions predicted were highest when the reservoir level was
maximum and lowest when the embankment was dry. The dry embankment showed an
increment in crater depth whereas there was a significant decrease in crater depth for the
embankment with the water reservoir. Effects of negative pore water pressure (suction)
above the phreatic surface was also investigated and the crater dimensions predicted
showed a decrease in crater dimensions when compared to when suction is not
incorporated into the model.

ii
Dedication
I dedicate this thesis to my parents and siblings who have been there for me throughout
my two years of study. Thank you all for the love, support and encouragement.

iii
Acknowledgement
The successful completion of this thesis is due to the combined efforts of particular
individuals worth recognising for their diverse contributions.
I would like to express my deepest gratitude to my supervisors, Dr. Mohammad Rayhani
and Dr. Abass Braimah for their guidance and advice throughout my two year study.
I am also very appreciative of every individual who contributed however little to making
these two years a memorable.
iv
Table of Contents Abstract ........................................................................................................................................... i
Dedication ...................................................................................................................................... ii
Acknowledgement ........................................................................................................................ iii
List of Tables ................................................................................................................................ vi
List of Figures .............................................................................................................................. vii
List of Abbreviation and Symbols ............................................................................................... x
1 Chapter: Introduction ......................................................................................................... 1
1.1 Statement of Research .......................................................................................... 1
1.2 Research Basis ...................................................................................................... 2
1.3 Objectives ............................................................................................................. 2
1.4 Scope and Methodology ....................................................................................... 3
1.5 Thesis Outline ...................................................................................................... 4
2 Chapter: Background ........................................................................................................... 5
2.1 Introduction .......................................................................................................... 5
2.2 Review of Dam Failure by Explosive Devices .................................................... 6
2.2.1 Sorpe Dam .................................................................................................... 6
2.2.2 Peruca Dam ................................................................................................... 7
2.3 Theory of Blast Waves ....................................................................................... 10
2.4 Explosion Effects in Soils .................................................................................. 12
2.4.1 Propagation of Blast Shockwaves in Soil ................................................... 13
2.4.2 Crater Formation Due to Explosives ........................................................... 14
2.5 Attenuation of Shockwave in Soil ...................................................................... 19
2.6 Failure Modes of Dams ...................................................................................... 22
2.5.1 Failure of Dam due to Crater Formation ..................................................... 25
2.5.2 Failure of Dam due to excess Pore water Pressure ..................................... 26
2.5 Previous Works of Relevance ................................................................................. 30
2.5.1 Experimental Research .................................................................................... 30
2.5.2 Numerical Simulation ................................................................................. 37

v
3 Chapter: Numerical Simulation of Blast Load Effects on Embankment Dam .................. 44
3.1 Introduction ........................................................................................................ 44
3.2 LS-DYNA .......................................................................................................... 44
3.2 Numerical Modelling of Embankment Dam Model ....................................... 46
3.2.1 Explosive Model ......................................................................................... 47
3.2.2 Air Model .................................................................................................... 48
3.2.3 Embankment Dam Model ................................................................................ 48
3.3 Contact Modelling .............................................................................................. 55
3.4 Boundary Conditions .............................................................................................. 56
3.5 Model Verification .................................................................................................. 57
3.6 LS-DYNA Model Comparison with ConWep ........................................................ 61
3.7 Summary ................................................................................................................. 62
4.0 Parametric Study of Explosion on Embankment Dams. ................................................. 64
4.1 Introduction ............................................................................................................. 64
4.2 Effects of Explosive Charge Mass ..................................................................... 65
4.3 Effects of Slope Angle on Embankment Dam ................................................... 67
4.4 Effects of Reservoir Level on Crater Dimensions ............................................. 70
4.4.1 Reservoir at Maximum Level ..................................................................... 70
4.4.2 Reservoir Level at 1 m above Ground Level ................................................... 72
4.5 Effect of Density on Crater Dimensions ............................................................ 73
4.6 Effect of Suction on Crater Dimensions ............................................................ 76
5. Chapter 5: Conclusion and Recommendation ................................................................. 79
5.1 Summary ............................................................................................................ 79
5.2 Conclusion .......................................................................................................... 79
5.2.1 Application of Research Work .................................................................... 80
5.2.2 Limitations of LS-DYNA ................................................................................ 81
5.3 Recommendations .............................................................................................. 81
References .................................................................................................................................... 83
Appendix A .................................................................................................................................. 88
Appendix B .................................................................................................................................. 92
vi
List of Tables
Table 2-1: Minimum Freeboard for Dams (Ontario Ministry of Natural Resources, 2011) ....... 26
Table 2-2: Research Summary of Blast Effects on Pore Water Pressure (US Department
of Interior, 1985) .......................................................................................................... 29
Table 2-3: Summary of Material Model for Simulation (Ambrosini et al., 2004)................................. 39
Table 2-4:Summary of Material Model Simulation (Jayasinghe et al., 2013) ...................................... 40
Table 2-5: Summary of Material Model (Defence R &D, 2009).................................................. 41
Table 3-1: Material Model Input for TNT .................................................................................... 47
Table 3-2: EOS inputs for TNT .................................................................................................... 47
Table 3-3: Input Parameters for Air .............................................................................................. 48
Table 3-4: Selected soil material models in LS DYNA (LS DYNA Manual, 2011) .................... 49
Table 3-5: Mesh Sensitivity Analysis for 50 kg Charge ............................................................... 49
Table 3-6: Crater Dimension for Suitable Material Models ......................................................... 53
Table 3-7: Input Parameters for Soil ............................................................................................. 53
Table 4-1: Comparison of Crater Diameters for Dry and Reservoir backed Dam ....................... 71
Table 4-2: Comparison of Effects of Suction on Crater Diameters for 1.65 m and 1 m Reservoir
backed Dams .................................................................................................................. 76

vii
List of Figures
Figure 2-1: Sorpe Dam (http://thedambusters.org.uk/sorpe.html) ....................................7
Figure 2-2: Peruca Dam (http://www1.american.edu/ted/ice/noah.htm)............................8
Figure 2-3a: Attack incidents by year (US Homeland Security, 2012) .............................9
Figure 2-3b: Attack incidents by type (US Homeland Security, 2012) ............................9
Figure 2-4: Pressure-Curve Profile for air Blast (Larcher, 2008) …….............................11
Figure 2-5: Crater formed at Mariot Hotel
(http://news.bbc.co.uk/2/hi/in_pictures/7627729.stm)........……........….…...15
Figure 2-6: Profile of a crater (Ambrosini et al. 2004) ……….………………………....16
Figure 2-7: Crater sizes with given DOB (TM 5-855-1)………………...……………....17
Figure 2-8: DOB and resulting Crater Diamter in Clay, Sandy Clay and Sand (TM -5-
855-1)………………………………………………………………………..18
Figure 2-9: Peak Stress in different Soils based on Scaled Distance (Kumar et al.,
2013)…………………………………………………………………….......22
Figure 2-10: Piping through Embankment……............………………………...…..…...24
Figure 2-11: Overtopping of the Lower San Fernando Dam Crest in 1971 (Dahms,
2004)…………………………………………………………………….......24
Figure 2-12: Cause of Dam Failures (Association of State Dam Safety
Officials,2014)…..........................................................................................24
Figure 2-13: Pore Water Pressure against Distance (US Department of Interior, 1985)
…..................................................................................................................29
Figure 2-14: Finished Embankment (Li et al., 2007) ..………………...….......................32
Figure 2-15: Cross-Section of Dry Embankment (Li et al., 2007)……………......…......33
viii
Figure 2-16: Particle Size Distribution Curve (Braimah et al., 2012) ……..………........34
Figure 2-17: Measurement Technique for Crater Estimation (Li et al., 2007)…………..34
Figure 2-18: Crater Profile for 100 kg ANFO (Li et al., 2007)..…………..…...…..........35
Figure 2-19: Crater Diameter against Explosive Mass (Li et al., 2007) …………...........36
Figure 2-20: Crater Depth against Explosive Mass (Li et al., 2007) ……........................37
Figure 2-21: Model Set-up (Ambrosini et al., 2004) ………………..........…….….........38
Figure 2-22: Numerical Model (Jayasinghe et al., 2013) …………..……….……..........40
Figure 2-23: 3D Model of Embankment Dam (De at al., 2013) ………..…….................42
Figure 2-24: Crater Depth against Explosive Size (De et al., 2013) ………..…...............42
Figure 3-1: Embankment Dam Model ……………………………….………....….........46
Figure 3-2: Mohr-Coulomb Failure Criterion (Pervizpour, 2004) ……....……………....51
Figure 3-3: Failure Criterion Pseudo Tensor (LS-DYNA Material Manual 2011) ..…....51
Figure 3-4: Comparison of Mohr Coulomb and Pseudo Tensor with Experimental
Result………………………………………………….…...……………....54
Figure 3-5: Comparison of Mohr Coulomb and Pseudo Tensor with Experimental
Results…………………………………………………………………….....55
Figure 3-6: Comparison of Mohr Coulomb and Pseudo Tensor with Experimental
Results…………………………………………………………………….....55
Figure 3-7: Propagation of Shockwave through the embankment dam…...………..........57
Figure 3-8: Cross-section of crater in numerical model for 50 kg charge mass ...............59
Figure 3-9: Crater formed for Field Experiment ……………………...……..…..............60
Figure 3-10: Crater formed for numerical modelling ….……………...……...……..…..60
Figure 3-11: Verification of Crater Diameter Parallel to Dam Axis ……..…………......60
Figure 3-12: Verification of Crater Diameter Perpendicular to Dam Axis ……..............61

ix
Figure 3-13: Verification of Crater Depth………………..…. ………...……..……........61
Figure 3-14: Comparison of ConWep and LS-DYNA Crater Diameters. ……................62
Figure 3-15: Comparison of ConWep and LS-DYNA Crater Depths ………………….......63
Figure 4-1: Typical GeoStudio Simulation showing Phreatic Surface……......................64
Figure 4-2: Bulging at Downstream of Embankment …………………….…………..........66
Figure 4-3: Effect of slope angle on crater depth………..........................…………...….67
Figure 4-4: Comparison of Crater Parallel Diameter with Downstream Slope Angles.....68
Figure 4-5: Comparison of Crater Perpendicular Diameter with Downstream Slope
Angles ………..........................………………………………..………...….68
Figure 4-6: Comparison of True Crater Depth for Dry Embankment and Embankment
with Freeboard at 1.65 m and 1m.…………………………….…………........70
Figure 4-7: Effect of density on crater diameter parallel to dam axis....…..........….........73
Figure 4-8: Effect of density on crater diameter perpendicular to dam axis ..……..........73
Figure 4-9: Effects of Density on Crater Depth for Dry Embankment and Embankment with
Freeboard at 1.65 m …………………….….…........................……………....74
Figure 4-10: Effect of suction on crater depth……….………..................………...….....76

x
List of Abbreviation and Symbols
A, B, R1, R2, ω Constants for JWL equation of state for explosive
ALE Arbitrary Langrangian Eulerian mesh
ANFO Ammonimum Nitrate of Oil
C Ground transmission constant
C Cohesion value for soil
CDA Canadian Dam Association
Co, C1, C2, C3, C4, Constant for the polynomial equation of state for air
C5, C6 and μ
D Crater diameter
DOB Depth of Burst
E Energy
FEMA Federal Emergency Management Agency
JWL Jones-Wilkins-Lee equation of state for explosives
LSTC Livermore Software Technology Corporation
m,n Empirical site specific constant for particle velocity
P Pressure
R Distance between explosive and point of interest
TNT Trinitrotoluene

xi
u Pore water pressure
V Relative volume
Vpeak Peak particle velocity
W Quantity of explosive
σ’
Effective stress of soil
σ Total stress of soil
ρ Density
ρo Reference density
σn Normal stress for soil
φ Friction angle of soil
1
1 Chapter: Introduction
1.1 Statement of Research
The efficient management and protection of critical infrastructure such as dams is
relevant to the safety of the population of every country. In Canada, the Canadian Dam
Association (CDA) has reported that there are over 10,000 dams in Canada of which 933
are classified as large dams. Large dams are defined as dams having a height of 5-15 m
with a reservoir exceeding 3 million m3 (Aquastat, 2007). The large dams are mainly
hydroelectric dams or tailings dams and impound millions of gallons of water or mine
tailings. A breach of these dams could have serious ramifications on downstream
communities including loss of electricity, flooding, injury and fatality. The associated
economic losses can also be enormous depending on the size and emergency
preparedness of the community.
With the global increase in terrorism and the likely damaging effects of a dam breach, the
vulnerability of dams to explosion effects is of utmost importance. Although no terrorist
attacks have been successful in breaching dam infrastructure, the literature shows many
successful and unsuccessful attempts to attack dam infrastructure with explosives; for
example Chingaza Dam in Columbia and Bhakra Dam in India. As acts of terror continue
to increase globally, dams appear to be attractive targets due to the capacity to adversely
impact downstream communities and to attract media attention. Dams are primarily
concrete or earthen structures and depending on the mode of lateral load resistance can be
massive. Concrete gravity dams are least likely to be affected by explosives (Braimah et

2
al., 2012). Embankment dams on the other hand are generally earth-fill or rock-fill dams
and are more susceptible to cratering. The size of the crater can lead to overtopping and
erosion of the dam.
1.2 Research Basis
According to the Federal Emergency Management Agency (FEMA 2003), one in every
two acts of terror involves the use of explosives.. The US Homeland Security has
suggested that the direct economic impact of the failure of a large dam is approximately
$4.3 billion. This does not include the likely loss of lives as well as indirect impacts such
as lost in revenue from reduction in tourism due to such flooding (US Homeland
Security, 2011).
The effects of explosion on embankment dams are not very well researched. Most of the
research on cratering effects of explosion were conducted on flat grounds (Braimah et al.,
2012). Only scant information is available on the effects of the sloped embankment dams
on the crater properties. Also the effects of the blast wave on the pore water pressure and
effective stress within the dam have not been adequately studied. Hence this thesis aims
to investigate the effects of explosions on embankment dams with due consideration to
the effect of embankment slope, dam reservoir level, density of fill materials and soil
suction.
1.3 Objectives
The objectives of the research work presented in this thesis are;
Investigation of the effect of explosive charge mass on embankment dams.
3
Studythe impact of pore water pressure on crater dimensions.
1.4 Scope and Methodology
The investigation into the effects of explosions on embankment dams can be done either
through field testing or through numerical simulations. Experimental field testing
involving explosives can be very expensive and also limiting on the amount of explosives
that can be used for the investigation. In addition, field testing is limited in the number of
parameters that can be investigated without further increasing the cost of the testing.
Numerical simulation, on the other hand, is an inexpensive way of investigating the
effects of explosives on structures and affords the room to investigate more parameters at
lower cost. In carrying out the objectives of this thesis, a general purpose high-fidelity
physics based finite element package developed by Livermore Software Technology
Corporation (LSTC), LS-DYNA, was used. LS-DYNA was used to model the
embankment dam and the evolution of the blast wave and its interaction with the dam.
The numerical analysis was modelled after field testing conducted by Li et al. (2007) to
validate the ability of LS-DYNA to correctly predict the crater dimensions resulting from
detonation of an explosive on an embankment dam. The validated work was also
compared to results from ConWep - a collection of conventional weapons effects
calculation based on equations from TM 5-855-1 (PDC, 2007). The validated model was
then used for further parametric study in order to satisfy all outlined objectives in this
thesis.

4
1.5 Thesis Outline
The remaining portions of the thesis deals with the following topics:
Chatper 2: Background
The chapter reviews the literature and presents the theory of blast waves, the
effects of explosions in soil, and factors that affect crater dimensions in soil.
Finally work of relevance undertaken in the area of explosion effects in soil and
embankments are reviewed with consideration to both field testing and numerical
simulations.
Chapter 3: Numerical simulation of blast load effects on embankment dams
This chapter deals with the validation of the numerical model with results from
experimental field testing. The material models available for modelling the
embankment dam, explosive and explosion process are reviewed and discussed
and the best models chosen for the simulations. The results from the numerical
model are also compared to results obtained with ConWep.
Chapter 4: Parametric study of explosive cratering on embankment dams
The chapter presents the parametric analysis to investigate the effect of various
material properties on explosion effects on embankment dams. Specifically
density of fill materials, level of water in reservoir and soil suction are discussed.
Chapter 5: Conclusion and Recommendation
Conclusions from results of the different parametric analyses and
recommendations for future work based on findings in this thesis are presented
here.

5
2 Chapter: Background
2.1 Introduction
Dams are civil engineering structures that are used to impound water or mine tailings.
According to the Canadian Dam Association (CDA), there are over 10,000 dams in
Canada of which 933 are classified as large dams. These dams are classified as critical
infrastructure due to the adverse effect they could have on downstream communities
upon failure. Large dams are defined as dams having a height of 5-15 m with a reservoir
exceeding 3 million m3 (Aquastat Programme, 2007). In the event of a dam failure, the
consequences on lives, property as well as the economy of a country are severe and
damaging. Dam failures have been widely covered in the media and literature, and
highlight the causes as well as the ramifications associated with dam failure (MacDonald
and Langridge-Monopolis., 1984; De Alba et al., 1988; Kennard and Bromhead, 2000;
Muhunthan and Schofield, 2000; Shepherd, 2003; Braimah and Contestabile, 2007;
Graham, 2009). The US Homeland Security suggested that the direct economic impact on
the failure of a large dam is about $4.3 billion, not including the loss of lives as well as
indirect impacts due to dam failure (US Homeland Security, 2011). For these reasons,
dams can be viewed as attractive targets for terrorists as well as extremist groups seeking
to cause damage to property and inflict large human casualties (Braimah and
Contestabile, 2007). In addition to acts of terrorism, explosives are sometimes used as
soil improvement techniques in close proximity to dam sites. Current literature does not
provide adequate knowledge in predicting blast effects on embankment dam structures as
well as pore water pressure within the dam due to proximate explosions. Hence there is a

6
need to investigate and understand the effects of explosives on embankment dams in
order to safeguard dams against such explosions and avert the ramifications
accompanying dam failure.
2.2 Review of Dam Failure by Explosive Devices
There have been various attacks on dams with explosive devices (Braimah et al., 2012).
Most of these attacks occurred during conflicts between nations. A review of literature
indicates that most of the attacks have been against both embankment and concrete dams.
While a localized failure will not necessarily lead to breach of a concrete dam, the
localized failure of an embankment dam has a potential to develop into full dam breach
through overtopping and scour (Braimah and Contestable., 2007; Braimah et al., 2012;
De et al., 2013). The following section reviews embankment dam failure due to
explosions.
2.2.1 Sorpe Dam
The Sorpe Dam is located near Sudern, a small town in the German district of
Hochsauerland. Sorpe Dam is an earth-fill dam with a concrete core. The dam,
constructed between the years of 1922 and 1935, is 700 m long and 60 m high
(Kirschnne, 1949). The dam has the capacity to contain 3,380,000 m3 of water. Figure 2-1
shows an aerial photograph of the dam. As part of the Dambusters Raid by the Royal Air
Force No. 617 Squadron, the Sorpe Dam was attacked with 3600 kg of Research
Department Explosive (RDX) on its crest on May 17, 1943 resulting in a 12-m deep
crater (Braimah and Contestabile, 2007). The dam was subsequently attacked again on

7
October 16, 1944. The second attack used a 5500-kg Tallboy bomb leading to formation
of a 12-m deep and 25-30-m diameter crater (Charles, 2004). Although the dam was not
breached, extensive repair works were needed to repair the cratered dam. The Sorpe Dam
remains in operation to date.
2.2.2 Peruca Dam
The Peruca Dam is located in Dalmatia, Croatia over the Cetina River. The dam is a
zoned rock-fill embankment with a clay central core (Figure 2-2). The dam is 425 m in
length and 60 m in height (Nonveiller et al., 1999) and has a reservoir capacity of
565,000,000 m3. During the conflict in the Balkans, the Serbian forces planted 20 to 30
tonnes of Trinitrotoluene (TNT) on the dam in January 1993. In order to ensure
overtopping of the dam when the explosives were detonated and hence cause severe
damage to the villages downstream and the hydroelectric power station located
downstream in the Cetina River Valley, the water level was raised by closing the
Figure 2-1: Sorpe Dam (http://thedambusters.org.uk/sorpe.html)
8
spillgates and outlets (Nonveiler et al., 1999). In the case of the Peruca dam, the
detonation did not breach the dam. Nonveiller et al. (1999) attributed the inability of the
detonation to breach the dam to three entrances of the inspection gallery of the dam being
open and hence the potential damage that could have been caused by the confined
pressures of the explosives was reduced. Also, the Serbian forces detonated the explosive
when the water level was 5 m below the intended level. The breach of the dam, according
to Vajic (1994), would have led to about 12,000 deaths and about 60,000 of the
downstream population displaced from their homes while leaving the entire population
without electricity. The dam was repaired and brought back into operation in 1996, three
years after the damage caused by the Serbian forces.
Although these two aforementioned attacks occurred more than two decades ago, the
threat to dams still exists to date. Terrorist groups have planned attacks on different dams
in different country around the world in attempts to cause damage to downstream
communities. Countries where such attacks have taken place include Indonesia, Nepal,
India, Columbia, Iraq, Burma, United States of America amongst others. Figure 2-3a
Figure 2-2: Peruca Dam (http://www1.american.edu/ted/ice/noah.htm)

9
shows the number of attacks that have taken place from 2001 to 2011 while Figure 2-3b
indicates the mode by which the attacks were carried out on dams worldwide. These
recent attacks show that dams are still attractive targets for extremist groups and there is
the need for a good understanding of soil interactions with blast loads in order to evaluate
the effects of the various explosive devices on the stability of the embankments. Different
reports in the media suggest plans were made by Al-Qaeda to attack dams in the United
States of America (The Telegraph, 2002; The World Post, 2013).
Figure 2-3a: Attack incidents by year (US Homeland Security, 2012)
Figure 2-3b: Attack incidents by type (US Homeland Security, 2012)

10
2.3 Theory of Blast Waves
When an explosive device is denoted in a medium (air, soil, water), an expanding volume
of hot gases is formed, preceded by a high pressure shock front. The leading shock front
carries the pressure associated with the explosive detonation. When the shock front
reaches a point at atmospheric conditions, a sudden increase in pressure to the incident
blast pressure occurs. The blast pressure, then, attenuates over time to the atmospheric
pressure. The incident blast pressure is dependent on the distance from ground zero (point
of detonation) and the size of the explosive charge. A typical blast pressure-time history
is shown in Figure 2-4 for an air blast. The curve indicates a sharp increase in ambient
pressure when the shock front arrives at a point remote from the centre of detonation
followed by an exponential decay to ambient pressure, and then a negative phase of the
profile where pressure is less than ambient pressures. pmax is the peak overpressure, which
refers to the maximum pressure above ambient at a point remote from the centre of
detonation. pmin and po are the minimum under-pressure and ambient pressures
respectively. ta, td and tn refer to the arrival time of the shock front at the point of interest,
the duration of blast in the positive phase, and the duration of the blast in the negative
phase respectively.
11
Ambrosini et al. (2002) indicated that the most widely used method for calculating blast
wave scaling is based on Hopkinson’s law which shows that self-similar waves are
produced at identical scaled distances when two different charges of a given explosive
with the same geometry are detonated under the same atmospheric conditions. The use of
this law which is expressed mathematically by Equation 2-1 allows for efficient
representation of blast wave characteristics for a wide range of situations.
⁄ [2-1]
In this equation, R is the distance measured from the point of detonation to point of
interest expressed in metres and W is TNT-eqivalent mass of explosive expressed in
kilograms. For explosives other than TNT there is a need for mass of the explosive to be
converted into TNT equivalent mass.
Depending on the location of an explosive charge prior to detonation, the blast can be
classified as spherical, hemispherical or buried. Spherical blast occurs when explosive is
Figure 2-4: Pressure-Curve Profile for air Blast (Larcher, 2008)
12
detonated above ground in the air whereas hemispherical blast occurs when the charge is
in contact with the ground. When the explosive is buried in soil, we get buried
explosions.
2.4 Explosion Effects in Soils
Soil is an assembly of individual particles with varying sizes and degree of saturation.
The rapid release of energy from an explosive causes shockwave to be propagated
through the soil medium (An et al., 2011). When an explosive device is detonated near
the ground surface, a crater is created. The dimensions of the crater depend on the centre
of detonation relative to the ground surface. The crater size increases with a decrease in
the height of burst (HOB) when the explosive is detonated in air and increases with the
depth of burial (DOB) up to an optimum depth beyond which the crater dimensions
decrease. Also, crater size depends on the engineering properties of soil. The engineering
properties of soil that may affect the crater dimensions include moisture content, density,
permeability, shear strength and volume change behaviour which differ from soil to soil.
The detonation of explosives in soil, like any other medium, leads to the propagation of
blast waves through the soil and results in ground shock in the soil. The shockwaves are
dynamic in nature and tend to induce strain rates in the magnitude of 10-1
to 103
mm/sec.
The increased strain rate exerts short sequence of dynamic loading on the soil mass
leading to soil over strength and increased stiffness as compared to the effects of static
forces (Ambrossini et al., 2004).

13
2.4.1 Propagation of Blast Shockwaves in Soil
Ground shock occurs due to the detonation of an explosive device on or buried in soil
mass. The shockwave propagation in soil is accompanied by straining of the soil mass
and can potentially cause damage to proximate buried or aboveground structures due to
blast induced vibrations (Leong et al., 2006). Underground explosions, according to
Roman (1986), result in two mechanical responses of the soil to the blast waves from the
explosive device. These two responses are the soil losing its shear strength and the soil
reacting hydro-dynamically (i.e. as a fluid), in the immediate vicinity of the underground
explosion where stresses in the soil are extremely high. The shockwave propagation in
soil may lead to the formation of crater or a camouflet depending on the Depth of Burst
(DOB).
TM 5-855-1 (1986) describes ground shockwave as a complex function of the dynamic
constitutive soil properties, detonation products and explosive geometry. Soil properties
affecting ground shockwave include:
Degree of Saturation
Relative Density
Air-void volume
Dry unit weight
The degree of saturation has a significant effect on the propagation of ground shockwave
in cohesive soils; especially soils with degree of saturation greater than or equal to 95%.
The bound-water to solid skeletons contributes to the stiffness and strength of cohesive
14
soils. For wet clays, clay shales, and sandy clays with degree of saturation approaching
100%, very high peak stresses and accelerations are observed (TM5-855-1, 1986).
For granular soils, the relative density affects the ground shock propagation. Soils with
high relative density are not affected by water saturation as compared to the case in
cohesive soils. In granular soils the stiffness is provided by the grain to grain contact and
little contribution from water. Low relative density soils, on the other hand, are affected
by the presence of water and a similar occurrence in cohesive soils is observed. For
examples saturated sands with low relative density would lose their grain to grain contact
resulting in high pore pressure and eventual liquefaction of the sands in the event of a
ground shock occurrence.
The rate of attenuation of ground shock in soil is a function of the air void volume,
especially in cohesive soils. Soils with high air void volume tend to attenuate ground
shockwave faster than those with low air void volume. Generally for granular soils, the
rate of attenuation of the ground shock is determined by the dry unit weight of the soil. A
soil with high dry unit weight would reduce ground shock slowly and vice versa.
2.4.2 Crater Formation Due to Explosives
A crater is a hole formed in the ground after an explosions occurs. Luccioni et al (2009)
defined a crater as a cavity formed when confined explosion takes place in a mass of soil.
The cavity formation is a complex interaction taking place between gravity effects, soil
strength and transient load. A crater maybe used to study blast phenomena. The crater
properties give information about the energy yield of explosives and where detonation
15
occurred (Ground Zero). Figure 2-5 shows a crater formed after a fuel tank exploded at
the Marriott Hotel in Islamabad (BBC, 2008).
The hole which is visible after an explosion is the apparent crater. The true crater formed
is often masked by fallback (dirt or debris that falls back into crater) after the explosion.
The rupture zone refers to the region immediately surrounding the true crater in which the
soil has been severely disturbed. Beyond the rupture zone is the plastic zone, where there
is less disturbance to the soil material as compared to the rupture zone. Figure 2-6 gives a
diagrammatic representation of a crater with a given DOB. The ejecta covers the upthrust
caused by the rupture and plastic zones. Material thrown out of the soil of a sufficient size
(missiles) can be harmful to human life or structures in the vicinity of the centre of
detonation.
Figure 2-5: Crater formed at Marriott Hotel
(http://news.bbc.co.uk/2/hi/in_pictures/7627729.stm)
16
2.4.2.1 Factors Affecting Crater Formation
The nature and characteristics of a crater are dependent on factors such as: (a) DOB, (b)
Soil Type and (c) Type of Explosives. The DOB determines the shape and size of a crater
for a given type of explosive. The crater size tends to increase as the DOB increases until
an optimum DOB is reached where the highest crater volume is observed. The highest
apparent crater depth tends to occur at a depth less than the optimum DOB whereas the
highest apparent diameter occurs at a slightly greater depth than the optimum DOB.
Beyond the optimum DOB, the overburden begins to suppress the effect of the explosives
and hence not much ejecta is thrown out leading to a decrease in the apparent crater
diameter. At a DOB known as the containment depth, the crater disappears on the
surface, leaving a visible mound. At DOB greater than containment depth, a subsurface
cavity (camouflet) is formed with little or no surface disturbance. The corresponding
depth of camouflet formation is the camouflet depth. Figure 2-7 shows various depths of
Figure 2-6: Profile of a crater (Ambrosini et al. 2004)
17
burst with variation in crater size and shape for a given explosive indicating the crater
dimensions that are expected depending on the position of the explosive device. Figure 2-
7d and 2-7f illustrate the optimum DOB, the DOB where the apparent crater diameter is
maximum, and the camouflet DOB respectively.
The determination of optimum DOB is beneficial for mining or in subsurface exploration
where explosives are required as a means of excavation as this would enable the efficient
use of the explosive to achieve optimum and desirable results.
The craters formed as a result of explosions in the soil differ for different soil types.
Craters formed in sandy soil are smaller than those in clay. Explosions in saturated soils
also produce larger craters than in dry soils. From Figure 2-8, it can be seen that the depth
and diameter of apparent crater from an explosion is greatest in clay compared to sandy
clay while the depth and diameter is the least in sand (TM 5-855 1986).
Figure 2-7: Crater sizes with given DOB (TM 5-855-1)

18
The type of explosive used in cratering affects the crater properties. The energy density of
explosives and the volume of gas produced in the explosion reaction vary from one
explosive to another. To this end TNT is used as normalised reference explosive to which
all other explosives are compared. The mass of a given explosive is converted to TNT-
equivalent mass by multiplying by a TNT-equivalence factor. TM 5-855-1 (1986) points
out that most crater prediction curves are based on test data for bare explosives in TNT-
equivalent explosive weight and centrally detonated.
The shape of a charge also determines the manner in which the shock front propagates
through the explosive and hence the size and shape of the crater. For example a
cylindrical charge in a homogenous medium would produce a shock front that propagates
cylindrically and that of a spherical charge in a homogenous medium propagates radially
outward from the center of explosion (Wiss, 1981).
Figure 2-8: DOB and resulting Crater Diameter in Clay, Sandy Clay and Sand (TM
-5-855-1)

19
2.5 Attenuation of Shockwave in Soil
Attenuation of blast waves is the decay of the blast pressure after the peak pressure has
been reached. In soil the attenuation maybe due to factors such as the distance from the
centre of detonation, the air void volume and dry unit weight. The air void volume within
soil greatly affects the attenuation of the blast pressure. As the air voids within the soil
increase, the attenuation occurs more rapidly and vice versa. The effect of air void
volume on pressure attenuation is greater in cohesive soils. This is because of the
discontinuity in the soil mass, due to the presence of air voids, which increases the
velocity of the shockfront in the soil medium.
In granular soils, on the hand, the factor which greatly affects attenuation is the dry unit
weight. The propagation of the shockwaves reduces in granular soils with a lower dry
unit weight and vice versa. The dry unit weight refers to the weight of the soil when all
void spaces in the soil are filled with air, hence there is reduced surface to surface contact
of the soil particles and therefore a high dry unit weight would easily allow the
shockwave to travel through a given soil medium quickly as opposed to a lower dry unit
weight
Literature gives various equations that maybe used in estimating the peak particle
velocity at varying distances from the explosive charge. The general form of the widely
used equation for estimating the peak particle velocity, Vpeak is given by Equation [2-2]
((US Department of Interior, 1985).
(
)
[2-2]

20
Where C is the ground transmission constant which is dependent on the charge
confinement and the local geology of soil. R refers to the distance between the centre of
explosion and the point of interest (m). W refers to the quantity of explosive measured in
kg and m and n are empirical site specific constants. In a more specific sense different
researchers have expressed this particle velocity differently, allocating the constants
based on three different categories; scaling laws, charge confinement, and soil saturation.
Scaling Laws
The Scaling Law is based on Hopkinson’s law which shows that similar waves are
produced at identical scaled distances when two different charges of a given explosive
with the same geometry are detonated under the same atmospheric conditions (Ambrosini
et al., 2002). Based on the scaling laws, the square-root or cube-root scaling laws use m
values equal 1/2 and 1/3 respectively. The square-root scaling is suitable for line charges
and near surface charges whereas the cube-root scaling suits for deeply buried charges.
(US Department of Interior, 1985). Equations [2-3] and [2-4] present the peak velocity
for the square-root and cube-root scaling laws respectively.
(
⁄ )
[2-3]
(
⁄ )
[2-4]
Charge Confinement
Considering charge confinement, the peak particle velocity in soil can be expressed as
normal or heavy confinement as predicted by Dupont (1980) and presented by Equations
21
[2-5] and [2-6] respectively for square-root and cube-root scaling laws. The ground
transmission constant, C, is given as 1.1 and 5.7 for normal and heavy confinements
respectively whereas n is expressed as 1.6;
(
⁄ )
[2-5]
(
⁄ )
[2-6]
Deep Saturated Soil
Drake and Ingram (1981) proposed equations based on row (line) and point charges as
presented by Equations [2-7] and [2-8];
(
⁄ )
[2-7]
(
⁄ )
[2-8]
C ranges from 1.1 to 3.6. Long et al. (1981) also predicted the particle velocity in
saturated sands by Equation [2-9];
(
⁄ )
[2-9]
Figure 2-9 shows the peak stress attenuation in various soil types as a function of scaled
distance. It can be observed that attenuation is higher in sands compared to clays. Also
for dry conditions in a given soil, the peak stress from the blast load decreases
significantly as the scaled distance increases but the increase is minimal in saturated
conditions.

22
2.6 Failure Modes of Dams
The importance of safe design as well as construction of a dam cannot be over-
emphasized. According to the United States Society on Dams (USSD, 2011) the basic
requirements for the satisfactory performance of constructed dams include;
The ability of the embankment, foundation and abutments to withstand slumping
(movement of loosely compacted soil material down the embankment), sliding
and sloughing (downstream slope instability caused by wet conditions present at
Figure 2-9: Peak Stress in different Soils based on Scaled Distance
(Kumar et al., 2013)

23
the portion below the exit point for seepage through the dam) during construction
and all conditions of reservoir operation. These parts of the dam are also expected
to be stable during and after unusual events such as earthquakes, floods and blast
loads.
The control and collection of seepage water through the embankment, foundation
and abutments to prevent excessive uplift pressures, piping, sloughing and erosion
of materials into cracks, joints and cavities.
Providing adequate freeboard to prevent overtopping by wave action.
Preventing upstream and downstream slope erosion by wave action, rainfall,
reservoir level fluctuation and string winds by using adequate outer face
protection.
Constructing the dam using the appropriate quality control and assurance
procedures.
An embankment dam may fail if any of the above criteria is not met during construction
or operational cycle of the dam.
Generally an embankment dam may fail due to piping or overtopping. Piping is internal
erosion of the embankment or foundation due to seepage. Piping is dependent on the
plasticity of the soil, the soil gradation as well as the degree of compaction of fill
materials. Figure 2-10 shows piping failure of an embankment dam. Internal erosion if
allowed to persist would cause eventual failure of the dam.
Overtopping is a precursor to dam failure due to erosion and scour of the embankment
dam by the flowing water. Overtopping can be caused by breaching of the freeboard of

24
the dam. Figure 2-11 shows overtopping failure of the Lower San Fernando dam after the
1971 San Fernando earthquake. Overtopping is the major cause of dam failures. Dam
failure data collated from the US between 1975 and 2001 shows that almost 70% of all
dam failures are attributed to overtopping (Figure 2-12).
Thus, detonation of explosive charge on an embankment dam could lead to dam failure if
the crater is large enough to precipitate overtopping of the crest. Additionally, the shock
wave propagation through the body of the dam may lead to increased excess pore water
pressure and reduction in effective stress.
Figure 2- 10: Piping through Embankment of Dam
Figure 2-11: Overtopping of the Lower San Fernando Dam Crest in 1971
(Dahms, 2004)

25
2.5.1 Failure of Dam due to Crater Formation
Most of the research work on explosive cratering has been conducted on flat undisturbed
ground. However, effects of explosive cratering on the crest of an embankment will also
depend on the available freeboard - the vertical distance between the crest of the dam and
the maximum water level of the dam. If the dimensions of a crater are similar to the
available freeboard, the dam crest can be overtopped and eroded. The freeboard is thus an
essential design parameter for an embankment dam; especially when the explosion effect
Figure 2-12: Cause of Dam Failures (Association of State Dam Safety
Officials, 2014)

26
is of consideration. The design freeboard for an embankment dam is dependent on wind
effects, landslide effects and earthquake effects (Ontario Ministry of Natural Resources,
2011). Table 2-1 presents the proposed freeboard heights for dams in Canada based on
their heights and the climatic and environmental conditions (annual rainfall, wind speeds,
earthquake) of the site.
With the current state of global terrorism and environmental activism, another factor that
should be considered in designing the freeboard is explosion effects. Thus, the freeboard
must be adequate to prevent overtopping under the effects of detonation of design basis
explosive charge mass.
Table 2-1: Minimum Freeboard for Dams (Ontario Ministry of Natural Resources, 2011)
Reservoir Fetch (Length) Freeboard
Under 200 m 300 mm
Up to 400 m 450 mm
Up to 800 m 600 mm
Over 800 m Comprehensive assessment required.
2.5.2 Failure of Dam due to excess Pore water Pressure
Pore water pressure in soil arises due to the presence of water in the pore of soil or rocks.
Pore water pressure has an effect on the mechanical properties of soil. Mechanical
properties of soil such as shear strength, permeability and volume change are directly or
indirectly affected by pore water pressure. Pore water pressure maybe positive or
negative (Fredlund, 1987; Vanapalli et al., 2003; Fredlund and Rahardjo, 1993).
Researchers (Vanapalli, 2010; Zhang et al., 2010; Fredlund 1987) indicate that negative
pore water pressures also known as matric suction or suction contributes to the shear
27
strength of soil. Although this unsaturated zone contributes to shear strength, the strength
increase is often neglected in design of embankment dams. The shear strength in
embankment dams is defined by the single stress state variable proposed by Terzaghi:
[2-10]
where σ is the effective stress, σ is the total stress and u is the pore water pressure.
In large embankment dams, substantially higher pore water pressures may be observed
within the core of the dams (St-Arnaud, 1995). This implies that dams need constant
observation throughout its operational period to make sure fill materials as well as
foundation material do not lose their strength. When steady-state seepage is achieved,
depending on the reservoir level, the phreatic line is defined within the embankment dam.
Initial pore water pressure levels are defined within the embankment dam when steady
state seepage within the embankment dam is reached. The pore water pressure may
fluctuate depending on the reservoir level and hence the phreatic surface. However excess
pore water pressure (Δu) is generated when there is a change in stress applied to the dam
such that there is no time for dissipation of this excess pore water pressure. This results in
further decrease in shear strength. The continual increase of excess pore water pressure
could lead to shear stress exceeding the designed shear strength and result in piping.
Piping occurs when effective stress is less than or equal to zero and soil behaves as a
liquid.
Explosion on a soil medium generates high shock stresses within the soil. The shock
stresses introduce strain rates in the magnitude of 10-1
to 103
leading to soil over-strength
and increased stiffness compared to soil under normal static forces (Ambrosini et al.,

28
2004). The short duration shock stresses result in instantaneous increase in excess pore
water pressure which persists over a comparatively longer period of time (Braimah and
Rayhani, 2012). According to Wang et al. (2011), Terzaghi attributed the failure of the
SWIR III Dam in Russia, which occurred in 1935, to blasting operations in close
proximity, liquefaction of the embankment, and eventual failure of the dam.
To understand pore water pressure effects induced by explosion effects, three significant
stages of interest are relevant; the transient response of the soil due to the propagation of
the shockwave, the residual response of the soil after the passage of the shockwave and
the dissipation of the pore water pressure (US Department of Interior, 1985). Residual
pore water pressure generation is important for the safety of a dam. In saturated soils,
there is an increase in excess pore water pressure when the fluid responds elastically and
the soil response to the shockwave is plastic. In the case when both soil and water behave
elastically, no excess pore water pressure increase is observed (Dobry et al. 1982).
A review of the unclassified literature has shown a dearth of information on explosion
effects on pore water pressure in embankment dams. Table 2-2 shows a summary of blast
related research in soil with concentration on the effects of pore water pressure. The
research which ranges from different countries show that most of the research was
conducted on sands. Figure 2-13, on the other hand, shows results from a test conducted
on an embankment dam for a 2 kg charge mass. The results show readings of residual
pore water pressure at different depths within the dam. More significantly the plot shows
that residual pore water pressures decreases with distance from point zero.

29
Table 2-2: Research Summary of Blast Effects on Pore Water Pressure (US Department of
Interior, 1985)
Research Origin Observations
Russia
Liquefaction does not occur in saturated sands with dry densities higher
than 1.60 g/cm3.
Liquefaction does not occur in soil subjected to peak particle velocities
lesser than 7 cm/s.
The possible depth of liquefaction for explosives detonated below
groundwater table was measured as 1.5 times the depth of detonation.
India
Residual pore water pressure increases out to a radial distance of
approximately 15 m in loose saturated sand for a 10 kg charge at a
depth of 16 m with a ground acceleration of 0.1g.
Residual pore water increases in loose saturated sand to a radial
distance of 20 m for a 2kg charge with a depth of burst of 6 m.
Japan
A 1 kg charge at a 6 m depth of burst yielded residual pore water
pressure increase of 10 per cent of the initial effective stress under a
ground acceleration of 2g.
North America
Residual pore water pressure occurred for peak particle velocity
exceeding 5 cm/s.
Peak partcile velocity should be limited to 2.5cm/s below a frequency
of 40 Hz and 5 cm/s above 40 Hz for planned blasting near dams.
Figure 2-13 Pore Water Pressure against Distance (US Department
of Interior, 1985)

30
2.5 Previous Works of Relevance
Crater investigations can be done either by experimental tests or computer programmes.
Many researchers have conducted experimental research to investigate the effect of
explosion on soil properties (TM 5-855-1; Charlie et al., 2001; Ambrosini et al., 2002;
Ambrosini et al., 2004; Luccioni et al., 2008; Luccioni et al., 2009; Li et al., 2007).
With advancement in computer technology, many researchers are choosing to use
computer modelling to simulate explosions on soil mass. Computer modelling provides a
less expensive alternative to the expensive field testing as well as eliminates the
limitations on the amount of explosives used in testing. Computer programs capable of
modelling the explosion process and the propagation of shock wave through the soil mass
include Autodyn (Autodyn user manual, 2009), Abaqus (Abaqus user manual, 2012), LS-
DYNA (LS-DYNA user manual, 2007) and FLAC (FLAC user guide, 2002).
2.5.1 Experimental Research
Extensive experimental research programmes have been conducted to investigate crater
formation on the flat ground as well as embankments. These experiments have mainly
investigated crater dimension for differing explosive charge masses and location on
embankment. Ambrosini et al. (2002) conducted an experiment to investigate the
diameter and depth of craters formed by varying the height of burst and depth of burial of
the explosive. The experiments were grouped into three categories; near-ground blast
(spherical charge), hemispherical (charge on ground surface) and underground (buried)
explosions. The mass of the explosive charges used ranged from 1 kg to 10 kg. The
31
experiment was conducted on flat ground and the effect of the slopes on embankments
was not investigated. The soil at the test site was mainly inorganic clays. The results from
the three setups indicated that;
Air blast have the least effects on crater diameter and depth since the explosive is
not coupled with the ground and thus most of the explosive energy is transmitted
through the air medium whereas the greatest crater dimensions were observed for
buried charge masses. As the depth of burial decreases and as the height of burst
increases the crater size reduces.
The experimental tests were modelled with the Kinney and Graham (1985)
equation for predicting crater diameter (Equation [2-11]) and showed very good
correlation.
⁄ [2-11]
Ambrosini et al. (2002) also proposed an equation for predicting the diameter of
the crater for above ground explosions (spherical) as shown in Equation [2-12].
The equation can also be employed to predict the weight of explosive from
diameter of the crater.
( ⁄
| |) (
⁄
| |) [2-12]
Li et al. (2007) conducted an experiment on the effect of explosives on an embankment
dam. The main aim of this investigation was to study the variation of crater dimensions
on an embankment and compare with crater dimensions on the flat ground. The

32
embankment was carved from the native soil at the test grounds. The sides of the
embankment were dug out with a backhoe. The native soil at the test site was mainly
made up of sand and gravel. Figures 2-14 and 2-15 show the finished embankment and
the cross section of the finished embankment showing the position of the explosive
charge respectively. Figure 2-16 shows the particle size distribution curve confirming the
soil type at different depths at the test site respectively. The moisture content of the soil
varied between 4% and 8.2% while the bulk density varied between 1200 kg/m3 and 1440
kg/m3. The bulk density of soil in the crater after the explosion was reported to be slightly
higher at 1440 kg/m3 (Braimah et al. 2012).
Figure 2-14: Finished Embankment (Li et al., 2007)
33
Ammonium Nitrate of Oil (ANFO) of 25 kg, 50 kg and 100 kg charge masses were used
for the test programme. The crater dimensions were measured across four diameters at
45 and at four locations equidistant from the centre of the crater, two on either side as per
Figure 2-17. Axis 1-1 was aligned to the axis of the embankment dam and 3-3
perpendicular to its axis.
Li et al. (2007) compared the experimental results to that from ConWep. Figure 2-18
shows results of crater formed for the 100 kg charge for the both flat ground and
embankment as compared to ConWeP results for a dry sand and concrete. The Figure
emphasizes the assertion that embankment dams which are made of soil are more
vulnerable to explosive attacks due to the higher crater dimesions as compared to
concrete.
Figure 2-15: Cross-Section of Dry Embankment (Li et al., 2007)

34
Figure 2-16: Particle Size Distribution Curve (Braimah et al., 2012)
Figure 2-17: Measurement Technique for Crater Estimation (Li et al.,
2007)
35
The following observations were made by Braimah et al., (2012) by studying Figures 2-
19 and 2-20 which are made of the experimental results as well as results from CoNWeP;
The apparent crater dimensions (apparent diameter and apparent depth) increase with
increase in charge mass.
The crater dimensions in the case of the embankment was comparable to that of the
flat ground for the 25 kg ANFO but for the 50 kg and 100 kg charge masses the
embankment crater dimensions were found to be larger than that for the flat ground.
The diameter of the embankment increased in the lateral direction.
The slopes of the embankment contributed to large volume of ejecta thrown out
towards the upstream and downstream faces of the embankment.
The shape of the crater in the case of the embankment was elliptical with the long
axis across the dam crest and the short axis along the axis of the embankment. In the
Figure 2-18: Crater Profile for 100 kg ANFO (Li et al., 2007)
36
perpendicular direction to the embankment, the apparent diameter was 50 % larger
than the average apparent diameter for the flat ground explosion.
CoNWeP over estimates the crater dimensions for a given charge mass.
Figure 2-19: Crater Diameter against Explosive Mass (Li et al., 2007)

37
2.5.2 Numerical Simulation
As compared to field testing, numerical modeling is less expensive and gives the
flexibility for varying scenarios to be tested. However before a numerical model can be
used in any parametric analysis, it has to be validated against an experimental test. Just as
in the case of the experimental programme, the unclassified literature does not contain a
wide range of knowledge on numerical simulation of explosion effects on embankment
dams. The numerical models governing the explosion phenomena are based on various
differential equations relating to conservation of mass, energy and volume changes.
These parameters are related through an Equation of State. An Equation of State (EOS)
Figure 2-20: Crater Depth against Explosive Mass (Li et al., 2007)

38
simply defines pressure as a function of specific volume and internal energy and is
widely used in modelling fluids and gases. Material models or constitutive model are key
in achieving solutions for numerical modelling, and the equations supporting these
material models are based on experimental work relating stress to deformations (strains).
These complex equations and their interdependence during every cycle of analysis make
it tedious for computation to be done by hand hence need computer program.
Ambrosini et al. (2004) simulated explosion effects on flat ground using TNT explosive
ranging from 50 kg to 500 kg. The simulation was done using AUTODYN. Figure 2-21
shows the model set up used for the simulation showing the meshes. The summary of the
model properties associated with the various components of the model are shown in
Table 2-3.
Figure 2-21: Model Set-up (Ambrosini et al., 2004)

39
Table 2-3: Summary of Material Model for Simulation (Ambrosini et al., 2004)
The aim of this research was to investigate the effects of soil properties on crater
formation on a flat ground. The summary of the findings made by simulations undertaken
by Ambrosini et al (2004) indicated;
The elastic properties of the soil taking into consideration the shear modulus and
density do not affect the diameter of the crater. A variation of 5% was observed in
the crater dimensions for these property variations. The density was varied from
1250 kg/m3 and 1950 kg/m
3 whereas the shear modulus was varied from 30 MPa
to 1000 MPa which refers to materials ranging from soft soil and sound rock.
Altering the failure limit of the soil as well as the yield functions between
reasonable limits did not change the crater diameter.
Jayasinghe et al. (2013) modelled the response of a pile in saturated soil to blast. The
numerical simulation was done using LS-DYNA. The aim was to check the displacement
that occurs in the pile to the passage of blast shockwaves through the soil. Figure 2-22
shows the model set for the numerical simulation. The summary of the constitutive
models used for the modelling are shown in Table 2-4;
Model Component Consitiutive Model EOS
Air Ideal gas material Ideal gas
Explosive High Explosives JWL
Soil Mohr Coulomb Mie-Gruneisen

40
Table 2-4: Summary of Material Model Simulation (Jayasinghe et al., 2013)
A comparative investigation into the material models available for granular soil material
in LS-DYNA was conducted by Defence R & D Canada (2009). The analysis was
conducted by comparing *MAT_FOAM_AND_SOIL as well as
*MAT_PSEUDO_TENSOR. The simulation was performed to investigate the ability of
these material models to effectively predict crater dimensions. The summary of the
constitutive models used for the simulation for these two material models are shown in
Tables 2-5. The report concluded that LS-DYNA predicted the crater depths within
acceptable ranges however there were significant differences in the experimental crater
diameters and that predicted by the two material models.
Model Component Consitiutive Model EOS
Air *MAT_NULL Polynomial
Explosive *MAT_HIGH_EXPLOSIVE_BURN JWL
Soil *MAT_FHWA_SOIL n/a
Figure 2-22: Numerical Model (Jayasinghe et al., 2013)
41
Table 2-5: Summary of Material Model (Defence R &D, 2009)
Model Component Constitutive Model EOS
Air *MAT_NULL *EOS_POLYNIMIAL
Explosive *MAT_HIGH_EXPLOSIVE *EOS_JWL
Soil 1 *MAT_SOIL_AND_FOAM n/a
Soil 2 *MAT_PSEUDO_TENSOR *EOS_TBAULATED_COMPACTION
Considering embankment dams, a numerical simulation was undertaken by De et al.
(2013). De et al., (2013) produced a 3D numerical model using Ansys Autodyn to
simulate explosion on an embankment dam with a height of 5.39 m, a base of 31 m and a
length of 32 m. To validate the model used in the simulation, experimental results from a
centrifuge experiment conducted by Sausville (2005) was used. A series of tests was
conducted under this investigation and De et al., (2013) modelled these tests and
compared the numerical and experimental data. The first series were conducted varying
TNT explosives between 31.6 and 240.5 kg with no reservoir at the upstream side of the
embankment. The second series conducted had the TNT explosives being varied 129.3
and 1326.9 kg with a reservoir on the side as shown in Figure 2-23. The model in
Autodyn was concluded to have values comparable to that of the experimental data. The
result of the numerical set up is shown in Figure 2-24 and indicated the model showed a
good agreement for the depth of crater formed by the experimental setup.
Although this test is the closest numerical model of soil interaction in the case of an
embankment dam, it still has limitations with regards to field conditions. De et al (2013)
did not consider the effects of soil conditions such as the soil type, shear strength as well
as moisture content.

42
Figure 2-23: 3D Model of Embankment Dam (De at al., 2013)
Figure 2-24: Crater Depth against Explosive Size (De et al., 2013)

43
2.6 Summary
The information available in the unclassified literature showed that the crater dimensions
are influenced by amount and type of explosives. The crater formation in soil is affected
by properties such as dry unit weight, degree of saturation, relative density and air void
volume. Most of the information available on explosions in soil has considered the
explosion on flat ground, and information on the explosion effects on embankments is
limited. Crater diameters formed on embankment dams in the perpendicular direction
without adjacent confining soil are 50% larger than that on a flat ground. Numerical and
analytical tools such as AUTODYN and LS-DYNA have been used in predicting crater
dimensions in soil. In unclassified literature, previous numerical modelling done on an
embankment dam was done using AUTODYN. For LS-DYNA, a review of numerical
simulations undertaken with LS-DYNA showed that not all material models required an
EOS in order to predict a blast simulation. Research that have been conducted both
numerically and using field testing on blast effects on embankment dams have not
considered the effect of slopes on crater dimensions, the effects of pore water pressure
and the effects of the explosive location.
The lack of information in literature informed the objectives of this thesis which is once
again listed below;
The investigation of the effects of blast loads on embankment dams
The investigation of crater size and its effect on dam failure
The study of the impact of pore water pressure on the performance of dams under
explosion
44
3 Chapter: Numerical Simulation of Blast Load Effects on Embankment
Dam
3.1 Introduction
In investigating the effects of explosion on embankment dams, LS-DYNA was used for
the numerical study. LS-DYNA was selected among other computer software due to its
rich source of materials to model the soil and also the ease with which pore water
pressure can be modelled. A 3D numerical model was developed to model the effects of
blast loads on embankment dams. The numerical modelling and analysis was done by
using LS-DYNA. The numerical model comprises of air, explosive and soil (embankment
material.). The numerical model was validated against field testing carried out by Li et al.
(2007) on a dry embankment. Further verification was carried out by comparing the LS-
DYNA model with ConWEp which is a collection of conventional weapons effects
calculation based on equations from TM 5-855-1. This equations are the plots shown in
Figure 2-8.
3.2 LS-DYNA
LS-DYNA developed by Livermore Software Technology Corporation (LSTC). LS-
DYNA is extensively used in various fields of engineering such as mechanical, aerospace
as well as civil engineering and has undergone several modifications from when the code
was limited to analysing stresses of impact loaded structures (Hallquist, 2006).
LS-DYNA has more than 250 material models and has a table for various materials under
various service conditions. The LS-DYNA material model manual (LSTC, 2011)

45
indicates there are possibly 8 material models that maybe used in modelling the
embankment dams and a single material model each for modelling the explosive and air.
The evolution of LS-DYNA has led to the development of various material models
covering materials such as soil, plastics, concrete, and metals. LS-DYNA has 2D and 3D
capabilities in solving numerical problems and the finite element types available are solid
elements, shells, beams and smoothed-particle hydrodynamics (SPH).
The numerical simulation in this thesis was conducted using the solid elements. Solid
elements in LS-DYNA are elements that model solid bodies and structures without any
priori geometric simplification (LS-DYNA Forum, 2011). Solid elements can be
formulated as constant stress solid elements (Lagrangian), Eulerian and Arbitrary
Lagrangian-Eulerian (ALE). In 3D simulation, the solid elements are modelled as 8-
noded solid hexahedron elements having twenty-four degree of freedoms. As compared
to the shell and beam elements, applied boundary conditions are treated more realistically
with the solid elements. The use of the solid elements also makes the model look like the
physical system being modelled. The disadvantages, however, associated with using solid
elements include; more effort in mesh preparation, and higher CPU time required for
convergence of the results (LS DYNA Forum 2011). There are various types of element
formulation available for this finite element type. Amongst these, the constant stress solid
element is the most appropriate option for solid element due to its ability to model severe
deformations and requires lesser CPU time for convergence (LS-DYNA Forum 2011).

46
In modelling blast loads, LS-DYNA has various ways of applying the blast pressures.
There are load keywords that apply the blast loads to the segments of the numerical
model and also the *MAT_HIGH_EXPLOSIVE_BURN which simulates a realistic way
of applying the blast loads. The *MAT_HIGH_EXPLOSIVE_BURN allows for a point
of detonation to be selected and also for a time of detonation to be specified.
3.2 Numerical Modelling of Embankment Dam Model
LS-DYNA was used to investigate the effects of explosion on embankment dams in this
thesis. The LS-DYNA model was validated with results from Li et al. (2007)
experimental research works. Li et al. (2007) shaped an embankment dam out of native
sandy soils of the test site, while the crest (top) of the embankment was left undisturbed.
The model dam, which represents a one-fifth scale of a 10-m (2m) high embankment dam
with 3:1 upstream slope and 2.5: 1 downstream slope, was 33 m long and 2 m wide at the
crest and 13 m wide at the base as shown in Figure 2-16. Figure 3-1 shows a 3D model of
the dam from Li et al. (2007) with the explosive in LS-DYNA. The 3D model of the
embankment in LS-DYNA used solid Lagrangian elements.
Figure 3-1: Embankment Dam Model

47
3.2.1 Explosive Model
The explosive was modelled as solid elements with ALE formulation. In modelling the
explosive, the keyword that is used was the *HIGH_EXPLOSIVE_BURN with the Jone-
Wilkins-Lee Equation of State (EOS). The explosive charge masses used in the
experiments were 25 kg, 50 kg and 100 kg of Ammonium Nitrate Fuel Oil (ANFO).
However, for the numerical simulation, TNT was used by applying the TNT-equivalence
of ANFO of 0.83 to give TNT mass for the numerical simulation. The material properties
of the explosive used in the model as required by the *HIGH_EXPLOSIVE_BURN
keyword card are presented in Table 3-1;
Table 3-1: Material Model Input for TNT
Density Detonation Velocity Chapman-Jouget pressure
kg/m3 m/s Pa
1630 6930 2.1 e+010
The JWL EOS relates the pressure to the relative volume and initial energy per volume of
the detonation products as shown in Equation [3-1]. The parameters for the JWL EOS are
defined in LS DYNA and their inputs for TNT are shown in Table 3-2;
(
) (
)
[3-1]
Where p is the pressure, V is the relative volume with A, B, R1, R2 and ω are constants
pertaining to a given explosive.
Table 3-2: EOS inputs for TNT
A B R1 R2 Ω Eo Vo
3.712 e+011 3.231 e+009 4.15 0.95 0.35 6 e+009 1
48
3.2.2 Air Model
Air was modelled with ALE formulation to engulf the model embankment dam and the
space above the dam to allow for blast wave propagation. The keyword used to achieve
this was *MAT_NULL_MATERIAL with *EOS_LINEAR_POLYNOMIAL equation of
state. The *EOS_LINEAR_POLYNIMIAL is expressed mathematically in Equation [3-
2].
( ) [3-2]
Where P is the pressure, E is the energy, Co, C1, C2, C3, C4, C5, C6 and μ are constants.
The constant μ is expressed as
, where ρ is the current density of the air material
and ρo is the reference density of the air material which is listed as part of input materials
for the air material model. The input parameters for air are shown in Table 3-3;
Table 3-3: Input Parameters for Air
Density
Kg/m3
C0 C1 C2 C3 C4 C5 C6 E0 V0
1.29 0 0 0 0 0.4 0.4 0 2.5 E+5 1
3.2.3 Embankment Dam Model
The material for the embankment was modelled with six different material models and
the results compared with the experimental results to select the most suitable material
model. Table 3-4 shows the material models investigated and their capabilities from the
material models manual (LSTC, 2011).

49
Table 3-4: Selected soil material models in LS DYNA (LS DYNA Manual, 2011)
In selecting a suitable mesh size for the embankment dam, the method of trial and error
was used to refine the mesh in order to achieve results within reasonable limits of the
experimental test results. Other criteria for selecting the appropriate mesh size included
runtime as well as the storage space. The analysis was done using the Mohr Coulomb
material model. Three mesh sizes were investigated for the 50 kg ANFO charge mass as
was used in the field testing. The mesh sizes were 120 mm, 110 mm and 90 mm. Table 3-
5 shows the crater dimensions, run time as well as disk storage requirements for the
selected mesh sizes;
Table 3-5: Mesh Sensitivity Analysis for 50 kg Charge
LS DYNA Material Model Capabilities
*MAT_SOIL_AND_FOAM Used when soil is confined within a structure or there
are geometric boundaries present.
*MAT_PSEUDO_TENSOR Used for soils however the user manual points out it
have been previously been used for buried reinforced
concrete structures subjected to impulsive loadings.
*MAT_FHWA_SOIL It is an isotropic material used generally for soil.
*MAT_MOHR_COULOMB It is used generally for soil.
*MAT_SOIL_BRICK It is used for over-consolidated clay.
*MAT_DRUCKER_PRAGER It is used generally for soil.
Mesh Sizes
Numerical Crater Dimension (mm)
Experimental Crater Dimension (mm)
Run time
Hard disk Storage
(mm) 1_1 3_3 Depth 1_1 3_3 Depth (hrs) (kb)
120 1939 2616 200
2260 3390 370
32 8.05 e+6
110 2370 2940 360 50 9.44 e+6
90 2303 3050 370 100 31.00 e+6

50
From Table 3-5 the element size that predicted the crater dimensions most accurately,
from the three that were tested, was the 90 mm size while the 120 mm size least predicted
the crater dimensions. Hence the 90 mm and 110 mm were the two mesh sizes suitable
for predicting the crater dimensions. The values for the 90 mm mesh size was more
accurate comparing to the experimental crater dimensions, however the run time as well
as the CPU storage were two-times and three-times, respectively, of that required for the
110 mm. Thus, the efficient mesh size considering the run time and CPU storage for the
embankment dam was 110 mm and this was used for the other charge masses of 25 kg
and 100 kg of ANFO. The selected mesh size was then used to investigate the possible
material models from Table 3-4, the 50 kg ANFO was used for the investigation.
The embankment was modelled as Lagrangian solid elements. Table 3-6 show a summary
of the analysis results of four of the six material models investigated for 50 kg ANFO
explosion. Only two of the material models: *MAT_PSEUDO_TENSOR and
*MAT_COULOMB, were able to simulate explosive craters on the embankment. These
two materials were further investigated for the 25 kg and 100 kg charge masses.
*MAT_MOHR_COULOMB has a Mohr Coulomb yield surface which is given by
Equation [3-3];
[3-3]
where τmax is the maximum shear on a given failure plane, σn is normal stress on the
plane, C is the cohesion and φ is the friction angle. The failure criterion is represented in
Figure 3-2, which can also be expressed in terms of effective parameters. The Mohr
failure envelope is a curved line approximated to a linear relationship (Pervizpour, 2004).
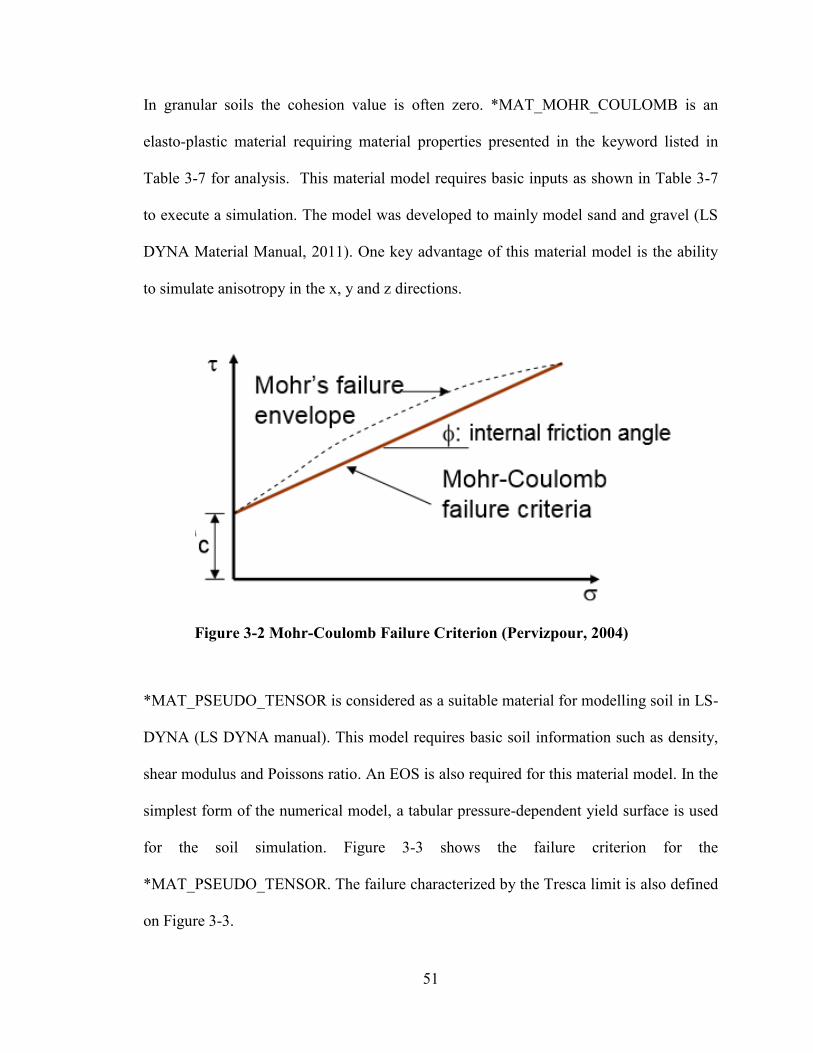
51
In granular soils the cohesion value is often zero. *MAT_MOHR_COULOMB is an
elasto-plastic material requiring material properties presented in the keyword listed in
Table 3-7 for analysis. This material model requires basic inputs as shown in Table 3-7
to execute a simulation. The model was developed to mainly model sand and gravel (LS
DYNA Material Manual, 2011). One key advantage of this material model is the ability
to simulate anisotropy in the x, y and z directions.
*MAT_PSEUDO_TENSOR is considered as a suitable material for modelling soil in LS-
DYNA (LS DYNA manual). This model requires basic soil information such as density,
shear modulus and Poissons ratio. An EOS is also required for this material model. In the
simplest form of the numerical model, a tabular pressure-dependent yield surface is used
for the soil simulation. Figure 3-3 shows the failure criterion for the
*MAT_PSEUDO_TENSOR. The failure characterized by the Tresca limit is also defined
on Figure 3-3.
Figure 3-2 Mohr-Coulomb Failure Criterion (Pervizpour, 2004)

52
The Pseudo Tensor model has also been used with EOS type 9 in LS-DYNA to model
ground shocks and soil structures up to 10 GPa (LS-DYNAMaterial Manual, 2011).
Details on input parameters of the material model as well as EOS are shown in the
Appendix.
Figures 3-4, 3-5 and 3-6 show the comparison of the Pseudo Tensor and Mohr Coulomb
for the parallel, and perpendicular diameters and depth respectively. Between the two
materials, *MAT_MOHR_COULOMB provided better prediction of the crater
dimensions in the experimental test. Hence Mohr Coulomb was selected as the material
model for the embankment.
Figure 3-3 Failure Criterion Pseudo Tensor (LS-DYNA Material Manual 2011)

53
Table 3-6: Crater Dimension for Suitable Material Models
Table 3-7: Input Parameters for Soil
Material Model Crater Dimensions (mm)
Parallel
Diameter
Perpendicular
Diameter Depth
*MAT_PSEUDO_TENSOR 1330 2150 90
*MAT_DRUCKER_PRAGER n/a n/a n/a
*MAT_FHWA_SOIL n/a n/a n/a
*MAT_MOHR_COULOMB 2370 2940 360
Experimental Results 2260 3390 370
MID Density
kg/m3
Shear Modulus
Pa
Poisson’s Ratio Friction Angle
rad
Cohesion
Pa
1 1440 2.18e+5 0.35 0.5236 0
0
0.5
1
1.5
2
2.5
3
3.5
4
0 20 40 60 80 100 120
Cra
ter
Dia
me
ter
Explosive Size (kg)
Parallel to Dam Axis (1-1)
Experimental
Mohr Coulomb
Pseudo Tensor
Figure 3-4 Comparison of Mohr Coulomb and Pseudo Tensor with
Experimental Results

54
0
0.5
1
1.5
2
2.5
3
3.5
4
0 20 40 60 80 100 120
Cra
ter
Dia
me
ter
(m)
Explosive Size (kg)
Perpendicular to Dam Axis (3-3)
Experimental
Mohr Coulomb
Pseudo Tensor
Figure 3-5 Comparison of Mohr Coulomb and Pseudo Tensor with Experimental Results
0
0.05
0.1
0.15
0.2
0.25
0.3
0.35
0.4
0.45
0.5
0 20 40 60 80 100 120
Cra
ter
De
pth
(m
)
Explosive Size (kg)
Crater Depth against Explosive Size
Experimental
Mohr Coulomb
Pseudo Tensor
Figure 3-6 Comparison of Mohr Coulomb and Pseudo Tensor with Experimental
Results
55
3.3 Contact Modelling
In modelling contact surfaces in LS DYNA, there are over 50 listed contact choices
available for use. Contact modelling is an integral part of finite element analysis as it
defines how stresses or deformations are transferred from one body to the other. The
contact list in LS-DYNA shows there are some which are applicable to specific scenarios
(eg. Airbag analysis) and some for general use.
For this numerical investigation, the contact was defined for the explosive to
embankment dam surfaces and explosive to air surfaces. To select the most appropriate
contact type, three of these contacts were investigated including:
*CONTACT_AUTOMATIC_NODES_TO_SURFACE,
*CONTACT_CONTSRAINT_SURFACE _TO_SURFACE and
*CONTACT_NODES_TO_SURFACE.
Among these three contacts used,
*CONTACT_CONSTRAINT_NODES_TO_SUTFACE was selected and used for the
numerical modelling. This was because this contact formulation was the only one among
the three that showed the propagation of the blast waves from the explosive into the air
and soil. Hence the use of the *CONTACT_CONSTRAINT_NODES_TO_SUTFACE
produced a crater, and the other two did not show any visible crater. Figure 3-7 shows the
propagation of the shockwave through the embankment dam after detonation of the
charge mass with the *CONTACT_CONSTRAINT_NODES_TO_SURFACE
formulation.

56
3.4 Boundary Conditions
To simulate the experimental work, appropriate boundary conditions were selected to
represent the field condition. The selection of the boundary condition is imperative to
ensure that the results for the numerical simulation are accurate. The boundary of the air
and embankment models were restrained in the X, Y and Z directions. This is because in
the field test site the embankment was made up of infinite continuous soil which prevents
the constructed embankment from undergoing translational movement, hence this was the
rationale behind fixing the outer boundaries of the numerical model.
Blast waves reflect on surfaces and the resulting reflected pressure reduces the
transmitted pressure that is applied to the soil. To curb this phenomenon, non-reflecting
boundary conditions were applied to the external faces of the embankment dam and the
Figure 3-7: Propagation of Shockwave through the embankment dam

57
air models to prevent the reflection of the blast waves at the outer boundaries of the
numerical model.
3.5 Model Verification
To verify the model, a comparison was made with experimental program from Li et al.
(2007) for the 25 kg, 50 kg and 100 kg ANFO charges. The propagation of the
shockwave through the embankment leads to the formation of a crater. The dimension of
the crater is measured by taking a cross-section through the dam at the crater location
depending on the diameter required (perpendicular or parallel to the axis of the dam).
Figure 3-8 shows a cross-section taken perpendicular to the axis of the dam to determine
the crater dimensions.
Figures 3-9 and 3-10 present comparison of crater diameters in the parallel and
perpendicular directions to the axis of the embankment dam respectively. The numerical
modelling accurately determined the diameter of the crater for the three explosive charge
masses considered; especially in the parallel direction where a difference of about 12%
was observed at the higher charge masses. In the perpendicular direction the crater size
was underestimated by the numerical model. The maximum difference in the crater
diameter between the experimental and numerical was about 13%. The numerical model
also predicted the crater depth accurately. All the charge masses investigated showed a
difference between the experimental and numerical of less than 10%, with the exception
of the 25 kg charge mass. The 25-kg charge mass showed a 24% difference between the
experimental and the numerical. The difference in the prediction of the crater dimensions
from the numerical model and those measured from the experimental can be attributed to

58
the uncompacted nature of the soil used for the field testing which was just the native soil
located at the test site.
Figures 3-11 and 3-12 indicate that the crater diameter increased as the detonation charge
mass increased. This is consistent with previous findings reported by Ambrosini et al.,
(2004); Braimah et al., (2012); and De et al., (2013). Figure 3-13 shows that the crater
depths from the numerical model also increased with increasing charge mass. This
confirms the capability of LS-DYNA in simulating the behaviour of embankments
subjected to explosion effects.
Figure 3-8: Cross-section of crater in numerical model for 50 kg charge mass

59
0
0.5
1
1.5
2
2.5
3
0 20 40 60 80 100 120
Cra
ter
Dia
me
ter
Explosive Size (kg)
Parallel to Dam Axis (1-1)
Experimental
Numerical Model
Figure 3-11: Verification of Crater Diameter Parallel to Dam Axis
Figure 3-10: Crater formed for numerical modelling
Figure 3-9: Crater formed for Field Experiment (Li et al., 2007)

60
0
0.5
1
1.5
2
2.5
3
3.5
4
0 20 40 60 80 100 120
Cra
ter
Dia
me
ter
(m)
Explosive Size (kg)
Perpendicular to Dam Axis (3-3)
Experimental
Numerical Model
0
0.05
0.1
0.15
0.2
0.25
0.3
0.35
0.4
0.45
0.5
0 20 40 60 80 100 120
Cra
ter
De
pth
(m
)
Explosive Size (kg)
Crater Depth against Explosive Size
Experimental
Numerical Model
Figure 3-12: Verification of Crater Diameter Perpendicular to Dam Axis
Figure 3-13: Verification of Crater Depth
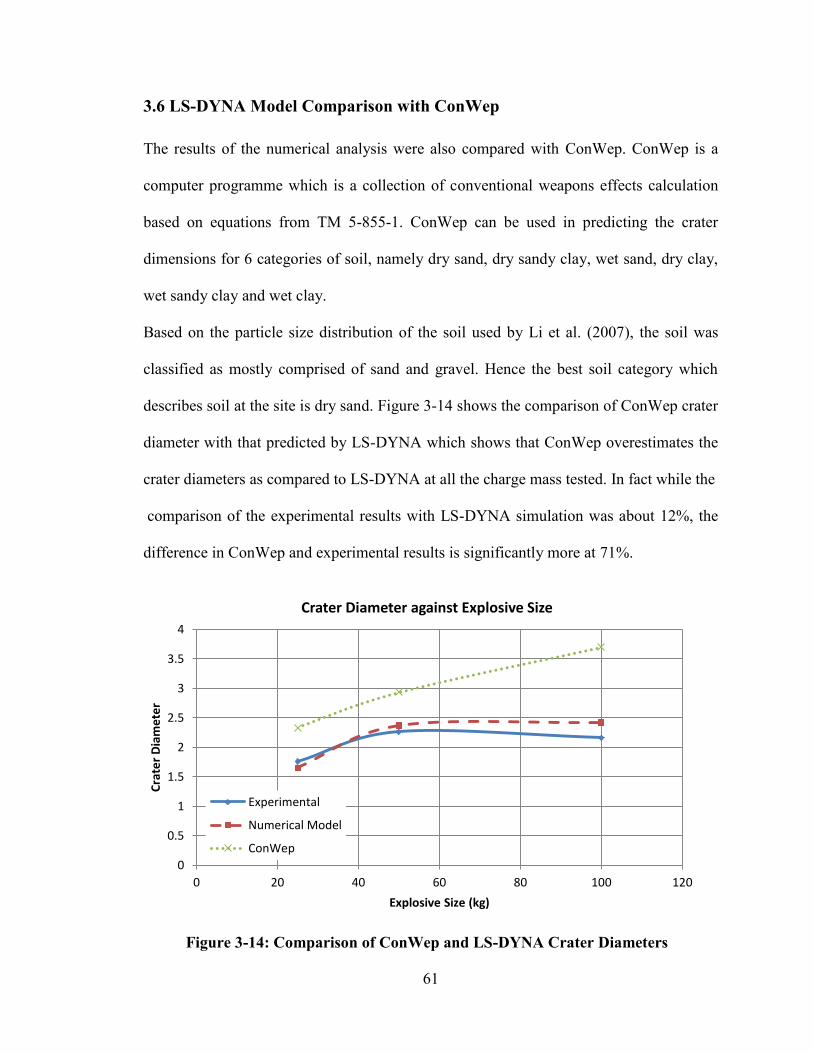
61
3.6 LS-DYNA Model Comparison with ConWep
The results of the numerical analysis were also compared with ConWep. ConWep is a
computer programme which is a collection of conventional weapons effects calculation
based on equations from TM 5-855-1. ConWep can be used in predicting the crater
dimensions for 6 categories of soil, namely dry sand, dry sandy clay, wet sand, dry clay,
wet sandy clay and wet clay.
Based on the particle size distribution of the soil used by Li et al. (2007), the soil was
classified as mostly comprised of sand and gravel. Hence the best soil category which
describes soil at the site is dry sand. Figure 3-14 shows the comparison of ConWep crater
diameter with that predicted by LS-DYNA which shows that ConWep overestimates the
crater diameters as compared to LS-DYNA at all the charge mass tested. In fact while the
comparison of the experimental results with LS-DYNA simulation was about 12%, the
difference in ConWep and experimental results is significantly more at 71%.
0
0.5
1
1.5
2
2.5
3
3.5
4
0 20 40 60 80 100 120
Cra
ter
Dia
me
ter
Explosive Size (kg)
Crater Diameter against Explosive Size
Experimental
Numerical Model
ConWep
Figure 3-14: Comparison of ConWep and LS-DYNA Crater Diameters
62
Figure 3-15 compares the crater depth of ConWep and LS-DYNA and also shows that the
crater depth is overestimated by ConWep. The depth predicted by ConWep is almost
twice the depth measured in the experimental programme. Although ConWep serves as a
quick tool for assessing crater dimensions for various explosive types, it cannot be used
in predicting crater sizes for comprehensive engineering works like design of dams.
3.7 Summary
The numerical model that was used for the simulation of embankment dam consisted of
the embankment material, explosive and air. All these material models were modelled
using information from field testing. LS-DYNA was able to predict the crater dimensions
accurately when compared with the field testing. The model accurately predicted the
crater diameter to be larger in the direction perpendicular to the dam axis where there was
less soil confinement as compared to the parallel direction. The numerical results together
0
0.2
0.4
0.6
0.8
1
1.2
0 20 40 60 80 100 120
Cra
ter
De
pth
(m
)
Explosive Size (kg)
Crater Depth against Explosive Size
Experimental
Numerical Model
ConWep
Figure 3-15: Comparison of ConWep and LS-DYNA Crater Depths

63
with field tests results were compared with ConWep. This showed that ConWep
overestimates the crater dimensions. For the crater depth, ConWep predicted values that
were twice as much as those predicted by the LS-DYNA model and the field test results.

64
4.0 Parametric Study of Explosion on Embankment Dams.
4.1 Introduction
The numerical model was validated and serves as a tool to effectively predict the
performance of embankments under explosive loading. The limitation of the experimental
investigation is the fact that, there was no reservoir behind the dam and hence the dam
structure was not under steady seepage conditions. The parametric study was therefore
conducted to investigate the effects of the reservoir on the explosive crater dimensions on
the embankment dam.
The steady seepage condition in the embankment dam was modelled by defining the
water table (phreatic surface) and partitioning the soil mass into two parts. The part under
water was modelled with saturated soil properties while the part above the phreatic
surface was modelled with unsaturated soil properties. To incorporate the effects of
steady seepage conditions within the embankment in LS-DYNA, the water within the
embankment was applied as a boundary condition. In defining the pore water pressure
distribution within the embankment, nodes within the embankment dam were selected to
separate the saturated region from the unsaturated region after analysis with SEEP/W
which is a component of GeoStudio. Figure 4-1 shows a typical GeoStudio simulation to
show the position of the phreatic surface on the 2 m high dam at full reservoir level. This
informed the selection of nodes for the phreatic surface for the LS-DYNA model. The
analysis type for pore water pressure calculations was considered as undrained analysis.
The reservoir upstream as well as water at the toe of the dam were not modelled in order
to reduce the simulation time, however, the pressure by virtue of height of water was
applied to the surfaces of the embankment in the upstream and downstream. The output

65
data that can be retrieved from pore water analysis in LS-DYNA include total pore water
pressure head, excess pore water pressure head, hydraulic pore water pressure head and
volume change. The pore water pressure analysis in LS-DYNA is independent of the
material model. The output that was required for the pore water pressure was specified as
excess pore water pressure for the output of the simulation with pore water. In calculating
the excess pore water pressure, LS-DYNA estimates the excess pore water pressure by
taking into account the volume change that takes place at each node. The parametric
study conducted considered the effect of a reservoir height, charge mass, slope angle,
density of embankment material and suction (negative positive pressure).
4.2 Effects of Explosive Charge Mass
The explosive in the dry embankment from Figures 3-9 and 3-10 showed that the crater
diameter increased with increase in explosive size. These results were expected because
the energy released from the explosive increases for the 25-kg, 50-kg and 100-kg ANFO
Figure 4-1: Typical GeoStudio Simulation showing Phreatic Surface
66
explosives. However, at 60-kg for the parallel case and about 70-kg for the perpendicular
case the graphs have a constant crater diameter. This observation can be attributed to the
fact that for the 100-kg charge, most of the blast pressures are reflected and goes into the
air after detonation, hence the amount of pressure transmitted into the soil does not differ
much from these charge masses, hence the crater diameter staying constant in both
directions at 60-kg for the parallel direction and 70-kg for the perpendicular direction.
Figure 3-10 showed the verification of the crater depth. The graph also shows a trend that
an increase in explosive size resulted in continual increase in the crater depth as opposed
to the observation made for the diameter. The observation made is due to the initial
amount of energy that is released when the explosive is detonated, this initial energy
determines the amount of ejecta to be thrown out from the crater. At different charge
masses, different energy is released, hence the crater depth increasing with increasing
explosive mass.
The effect of explosive charge mass on the crater dimensions on an embankment with
saturated embankment material was also investigated. With the embankment dam under
steady state seepage, the observation made for the dry embankment in terms of crater
dimensions was the same; an increase in explosive charge mass increased the crater
dimensions. The observation that was made with LS-DYNA for the pore water pressure
analysis was the bulging out of the elements downstream. This phenomenon that could
not be explained is shown on the right (downstream) of Figure 4-2.

67
4.3 Effects of Slope Angle on Embankment Dam
Dams have varying slopes for both the upstream and downstream. A series of analyses
was conducted to examine the effects of altering the slopes on crater dimensions. In the
first scenario, the slope angles for both the upstream and downstream faces were kept as
3H:1V, while in the second scenario the dam had a downstream slope of 2H:1V. Figure
4-3 shows the variation of the crater depth with slope angle.
For the crater depth, when the slope of 3H:1V was considered there was a decrease of up
to about 7% from the original slopes of 3H:1V on the upstream and 2.5H:1V on the
downstream side. This observation can be attributed to the soil confinement provided by
the gentle slope of 3H:1V on the downstream slope hence the amount of ejecta thrown
out as compared to the 2.5H:1V is reduced. Considering a downstream slope of 2H:1V,
there was an increase in crater depth of about 31% from the original downstream slope of
2.5H:1V. The significant change in crater depth is due to the steeper slope of 2H:1V at
the downstream slope, hence there is less confinement provided by the downstream slope
and hence more ejecta is thrown from the crater downstream.
Figure 4-2: Bulging at Downstream of Embankment

68
Figures 4-4 and 4-5 show the variation of the crater diameter with slope angle for the
parallel and perpendicular directions respectively. The variation of crater diameter with
downstream slope angle showed a reduction of 3.1% and 3.8% in the perpendicular and
parallel directions diameter respectively when the downstream slope angle changed from
3H:2.5V to 3H:1V. This reduction is due to the presence of a gentle slope which provides
more confinement and hence a decrease in crater diameter. For the downstream slope
angle of 2H:1V there was an increase in crater diameter of 0.42% and 2.04 % in the
parallel and perpendicular directions. This observation from the initial slope angle of
2.5H:1V is also due to the presence of less confinement provided by 2H:1V slope angle.
0
0.1
0.2
0.3
0.4
0.5
0.6
0 20 40 60 80 100 120
Cra
ter
De
pth
(m
)
Explosive Size (kg)
Crater Depth against Explosive Size
3H:1V and 3H:1V
3H:1V and 2.5H:1V
3H:1V and 2H:1V
Figure 4-3 Effect of slope angle on crater depth
69
0
0.5
1
1.5
2
2.5
3
0 20 40 60 80 100 120
Cra
ter
Dia
me
ter
(m)
Explosive Size (kg)
Parallel Crater Diameter
3H:1V and 3H:1V
3H:1V and 2.5H:1V
3H:1V and 2H:1V
Figure 4-4 Comparison of Crater Diameter with Downstream Slope Angles
0
0.5
1
1.5
2
2.5
3
3.5
0 20 40 60 80 100 120
Cra
ter
Dia
me
ter
(m)
Explosive Size (kg)
Perpendicular Crater Diameter
3H:1V and 3H:1V
3H:1V and 2.5H:1V
3H:1V and 2H:1V
Figure 4-5 Comparison of Crater Diameter with Downstream Slope Angles
70
4.4 Effects of Reservoir Level on Crater Dimensions
To simulate the effects of the reservoir on the embankment dam, two different scenarios
were considered. In one scenario the dam was at a full reservoir level and in the second
scenario the water level was at mid height of the embankment. The crater dimensions for
these two scenarios were compared with the dry embankment crater dimensions from the
validation of the numerical model.
4.4.1 Reservoir at Maximum Level
The maximum reservoir level was considered at 1.65 m above ground level, with a
freeboard of 0.35 m. A TNT charge was then detonated at the centre of the crest of the
dam. Table 4-1 shows the comparison of the crater sizes for the dry embankment and
embankment having pore water incorporated in the model. The simulation of the pore
water within the embankment dam leads to the formation of larger crater dimensions as
compared to that of the dry embankment. For example, for a 100 kg ANFO (82 kg of
TNT), the diameters measured in the direction perpendicular to the axis of the dam were
0.55 m and 2.47 m for the dry embankment and embankment with the reservoir level at
1.65 m respectively. In the direction parallel to the axis of the dam, the dry embankment
recorded a crater diameter of 0.44 m whilst the embankment with the reservoir level at
1.65 m had a diameter of 2.29 m. This represents a significant difference in crater
diameters for these two aforementioned embankment dam conditions.
The depth of the crater for the dry and embankment with reservoir level at a height of
1.65 m were also compared in the simulation. The comparison of the depths for these two

71
scenarios showed a depth variation of about 36% with the dry embankment having the
lower depth. Figure 4-6 shows the variation of the crater depth with charge mass.
Table 4-1 Comparison of Crater Diameters for Dry and Reservoir backed Dam
Charge
Mass
(kg)
Dry Embankment Embankment Reservoir
Level at 1.65 m
Embankment Reservoir
Level at 1 m
Parallel
Diameter
(mm)
Perpendicular
Diameter
(mm)
Parallel
Diameter
(mm)
Perpendicular
Diameter
(mm)
Parallel
Diameter
(mm)
Perpendicular
Diameter
(mm)
25 120 238 652 1068 516 928
50 340 450 1867 2002 1456 1711
100 440 550 2390 2470 1816 2099
Figure 4-6: Comparison of True Crater Depth for Dry Embankment and Freeboards at
1.65 m and 1 m
0
0.1
0.2
0.3
0.4
0.5
0.6
0 20 40 60 80 100 120
Cra
ter
De
pth
(m
)
Explosive Size (kg)
Crater Depth against Explosive Size
Water Reservoir at 1.65 m
Dry Embankment
Water Reservoir at 1 m
72
The increase in crater dimensions when the water reservoir is at 1.65 m can be attributed
to the pore water pressure within the embankment. Positive pore water pressure tends to
decrease soil strength and hence reduce the ability of the soil particles to withstand the
high pressures from the shockwave, and hence more ejecta thrown out, leading to the
deeper crater depth and larger diameters. In addition, the presence of the water reduces
the air void within the soil as compared to that of the dry embankment, hence, the
shockwave takes a longer time to attenuate within the embankment leading the soil
particles experiencing a longer duration of loading of the blast load as compared to soil
particles in the dry embankment (TM 5-855-1, 1986)
4.4.2 Reservoir Level at 1 m above Ground Level
The reservoir level was reduced to 1.0 m freeboard to consider the effect of reducing the
water level on the crater dimensions. In reducing the water height, the observation made
was similar to that of the freeboard at 0.35 m. Table 4-1 shows that the craters formed for
the 1 m reservoir level which are smaller than those for the reservoir level with a 0.35 m
freeboard but larger than that of the dry embankment. The crater diameter measured in
the critical direction (axis 3-3) had about 15% decrease in diameter from the case with the
0.35 m freeboard. Considering the crater diameter in the 1-1 axis, up to a 24% reduction
in crater size was predicted when compared to when the reservoir level is at 1.65 m.
Similar to the previous analysis, the three different charge masses and their effects on
crater depth was investigated. Figure 4-4 shows that crater depth variation considering the
reservoir level at 1.65 m, 1 m and the dry embankment.

73
The depth variation for the water level at 1.65 m and 1 m decreased up to 19% whereas
that of the 1 m water level and dry embankment was up to 5% from the dry embankment.
This observation for the reservoir level at 1 m can be attributed to a deeper phreatic
surface implying a larger zone of unsaturation as compared to a reservoir level at 1.65 m.
There is no effect of positive pore water pressure on most part of the embankment below
the explosive due to the deep phreatic surface. Hence this is the reason the depth variation
is closely related to that of the dry embankment.
4.5 Effect of Density on Crater Dimensions
Fill materials required for construction of embankment dams maybe compacted to
various densities. The density to which fill material is compacted is important as this
determines the amount of water that can seep through the embankment dam. It also
increases the overall weight of the dam and hence the stability. The effect of soil density
on crater dimensions was also investigated in the numerical study. Ambrosini et al.
(2004) investigated the effects density by increasing the initial density of 500 kg/m3 and
concluded that there is no significant effect on the crater diameter with or without the
presence of a reservoir. Figures 4-7 and 4-8 show the variation of the crater diameter with
explosive for density at 1440 and 1920 kg/m3.
Results show that the density of the soil material has an effect on the depth of the crater.
This simulation was conducted on a dry embankment and the embankment having a
reservoir level of 1.65 m. The dry embankment showed a crater depth increase of 8%
with the increase in the density to 1920 kg/m3. The same investigation was conducted on

74
the embankment with the reservoir level at 1.65 m. The density increase showed a
reduction in the crater depth up to about 7%. Figure 4-9 shows the crater depth variation
for the aforementioned scenarios.
For the dry embankment, the observation of the increase in crater depth is due to the fact
that granular soils with high density tend to attenuate the shockwave very slowly hence
the effect of the shockwave on the crater dimensions is more pronounced, inducing
deeper crater (TM 5-855-1). For the embankment with the reservoir level at 1.65 m the
observation made on the crater depth can be attributed to the degree of saturation. The
presence of water within soil leads to high peak stresses and acceleration within the soil.
Thus granular soil with low density experience higher peak stresses and easily loses the
grain to grain contact of the soil particles as compared to soil having high density (TM 5-
855-1). Therefore the LS-DYNA numerical model is consistent with reduction in crater
depth when part of the embankment is saturated below the phreatic surface
0
500
1000
1500
2000
2500
3000
0 20 40 60 80 100 120
Cra
ter
De
pth
(m
)
Explosive Size (kg)
Parallel Crater Diameter against Explosive Size
Water reservoir at 1.65 m (Density @ 1440 kg/m3)
Water reservoir at 1.65 m (Density @ 1920 kg/m3)
Figure 4-7 Effect of density on crater diameter parallel to dam axis
75
0
500
1000
1500
2000
2500
3000
0 20 40 60 80 100 120
Cra
ter
De
pth
(m
)
Explosive Size (kg)
Perpendicular Crater Diameter against Explosive Size
Water reservoir at 1.65 m (Density @ 1440 kg/m3)
Water reservoir at 1.65 m (Density @ 1920 kg/m3)
Figure 4-8 Effect of density on crater diameter perpendicular to dam axis
0
0.1
0.2
0.3
0.4
0.5
0.6
0 20 40 60 80 100 120
Cra
ter
De
pth
(m
)
Explosive Size (kg)
Crater Depth against Explosive Size
Dry Embankment (Density @ 1440 kg/m3)
Dry Embankment (Density @ 1920 kg/m3)
Water reservoir at 1.65 m (Density @ 1440 kg/m3)
Water reservoir at 1.65 m (Density @ 1920 kg/m3)
Figure 4-9: Effects of Density on Crater Depth for Dry Embankment and
Embankment with Freeboard at 0.35 m
with Reservoir Level at 1.65 m

76
4.6 Effect of Suction on Crater Dimensions
The pore water pressure analysis in LS-DYNA can consider the effects of suction on soil.
The presence of suction contributes to the shear strength of the soil (Vanapalli, 2010;
Zhang et al., 2010; Fredlund 1987). This was also investigated by setting the suction to a
very large value within the embankment dam with the reservoir level at 1.65 m for the
portion of the embankment above the phreatic surface. Table 4-2 compares the crater
diameter of the embankment dam with and without suction. The crater diameter tends to
reduce up to 35% from when there is no suction considered. Figure 4-10 illustrates the
comparison of crater depth of the embankment dam with and without suction. This figure
shows that the crater depth tends to decrease up to about 34% when suction is considered.
This observation can be attributed to the negative pore water pressures due to suction,
which tend to pull soil particles together and hence provide extra strength to the soil.
Table 4-2 Comparison of Effects of Suction on Crater Diameters for 1.65 m and 1 m
Reservoir backed Dams
Charge
Mass (kg)
Embankment with 1.65 m
Reservoir Level
Embankment with 1.65 m
Reservoir Level with suction
Parallel
Diameter
(mm)
Perpendicular
Diameter (mm)
Parallel
Diameter
(mm)
Perpendicular
Diameter
(mm)
25 652 1068 453 705
50 1867 2002 1255 1301
100 2390 2470 1270 1606
77
4.7 Summary
The numerical model that was developed in LS-DYNA can predict the performance of
embankment dams under blast loads. The investigation on the charge mass showed that
there was an increase in crater diameter and depth as the charge mass increased. The
effects of slope angle on crater dimensions were investigated and it was realised that the
steeper the slope the larger crater dimensions. The effects of the changes in reservoir
level were investigated considering a 0.35 m freeboard, 1 m freeboard and when there is
no freeboard (dry embankment). The crater dimensions predicted were highest when the
reservoir level was maximum with a 0.35 m freeboard and lowest when the embankment
is dry. Considering the effect of density of fill materials on the embankment, the
0
0.1
0.2
0.3
0.4
0.5
0.6
0 20 40 60 80 100 120
Cra
ter
De
pth
(m
)
Explosive Size (kg)
Crater Depth against Explosive Size
Embankment Dam without Suction
Embankment Dam with Suction
Figure 4-10 Effect of suction on crater depth

78
investigation was conducted on the dry embankment as well as the embankment with a
reservoir level at maximum with a 0.35 freeboard. The dry embankment showed an
increment in crater dimensions whereas there was a significant decrease in crater
dimensions for the embankment with the water reservoir when the soil density increased
from 1440 to 1920 kg/m3. Effects of negative pore water pressure (suction) above the
phreatic surface was also investigated and the crater dimensions predicted showed a
decrease in crater dimensions when compared to when suction is not incorporated into the
model.
79
5. Chapter 5: Conclusion and Recommendation
5.1 Summary
The effects of explosive on embankment dams were investigated. The unclassified
literature shows that there is limited information on the effects of blast loads on
embankment dams. Many researchers who have investigated the blast load effects on soil
have mainly conducted the research on a flat ground. The few available researchers who
investigated work on embankment dams either through field testing or numerical
simulations failed to consider the effects of pore water within the embankment on crater
dimensions. The investigation of crater dimensions that was investigated in this thesis
considered the effects of pore water pressure within the embankment on crater
dimensions. The numerical study used the high fidelity physics based finite element
package, LS-DYNA. The validation of the numerical model was done using field testing
conducted by Li et al. (2007). The LS-DYNA numerical model that was developed
agreed well with the field testing results. Results from the numerical model was also
compared with ConWep. Further parametric study was conducted on the LS-DYNA
model.
5.2 Conclusion
The conclusions that were drawn from the numerical analysis presented in this work are
as follows:

80
LS-DYNA as a numerical and analytical tool can adequately predict crater
dimensions in soil.
The level of reservoir of embankment dam affects the crater dimensions. The
higher the reservoir level, the higher the pore water pressure distribution within
the dam and hence the higher the crater dimensions.
The density of fill materials has an effect on crater dimensions. When part of the
dam is saturated, an increase in the density reduces the crater dimensions on the
dam.
The incorporation of suction in the numerical model led to a decrease in crater
dimensions.
Explosive detonated at a height of burst does not lead to significant crater
dimensions.
ConWep overestimates crater dimensions as compared to LS-DYNA.
Based on current practices in Ontario, the minimum freeboard required for dams
are not adequate to prevent overtopping for the 50 kg and 100 kg.
5.2.1 Application of Research Work
The findings of this thesis are beneficial in practice for dam owners and stakeholders as
well as the mining industry. Table 2-1 shows the current practice for minimum freeboard
that is provided for the various fetch length of dams. Copariason of the research results
with these freeboard requirements show that the current freeboards used in the dam
design would not be enough to withstand an explosive attack. Hence based on this
research there is a need for these minimum freeboard allowances to be increased for
future dam constructions. For existing dams whose minimum freeboard requirements are

81
not satisfactory, it is important that dam owners and stakeholders always adjust water
levels to ensure that the freeboard that is available can withstand a dam attack using
explosive devices.
The research outcome can also be used in mining industry. As it was discussed earlier,
the crater diameter has not increased significantly as the mass charge increased from
60kg to 100 kg. In mining, where explosives are used in excavation for their mining
process, the use of these findings aids in selecting the most economical charge masses in
order to achieve desirable crater sizes.
5.2.2 Limitations of LS-DYNA
The LS-DYNA model had limitations associated with it. These limitations included;
The restriction of the element formulation of the Mohr Coulomb material model
as only solid elements. This prevents the comparison of the performance of the
material model with other techniques such as the SPH.
The introduction of pore water pressure into the embankment dam resulted in
bulging of the elements.
5.3 Recommendations
Listed below are recommendations for future work:
There is a need for field testing to be undertaken with the presence of a water
reservoir to further verify the behaviour of the embankment dam under explosion.

82
This research concentrated its findings on the behaviour of homogenous
embankment dam. Further investigations should be considered on the effect of
zoned embankment dams on crater dimensions.
In undertaking the parametric study, an infinite suction value was defined. Further
studies should be considered in selecting suction values representative of the soil
forming the embankment fill materials.
83
References
Abaqus User Manual 6.12. 2012. Dassault Systems Simulia Corp.
http://www.maths.cam.ac.uk/computing/software/abaqus_docs/docs/v6.12/pdf_books/CAE.pdf
Ambrosini R.D, Luccioni B. M., Danesi R.F., Reira J.D. and Rocha M.M. 2002. “Size of craters
produced by explosive charges on or above the ground surface.” Springer-Verlag, Shock Waves
12: 69-78.
Ambrosini D, Luccioni B, Danesi R. 2004. “Craters produced by explosions on the soil surface.”
Computer Mechanics 22 : 678–92.
An J., Tuan C. Y., Cheeseman B. A. and Gazonas G. A. 2011. “Simulation of Soil Behavior
under Blast Loading.” Int. J. Geomechanics, 11: 323-334.
Aquastat Programme. 2007. “Dams and Agriculture in Africa.” FAO Aquastat Dams in Africa
070524. http://www.fao.org/nr/water/aquastat/damsafrica/aquastat_dams_africa_070524.pdf
14/25/04
Association of State Dam Safety Officials. “Dam Failures and Incidents.”
http://www.damsafety.org/news/?p=412f29c8-3fd8-4529-b5c9-8d47364c1f3e 14/25/04
ANSYS AUTODYN User Manual 12.0. 2009. ANSYS Inc.
http://orange.engr.ucdavis.edu/Documentation12.0/120/AUTODYN/cusrm120.pdf
Braimah A., Contestabile E., (2007). “Bombings of Dams – A Historical Review.” Canadian
Dam Association 2007 Annual Conference, Canada.
Braimah A., Rosen von B., Li Y., Rayhani M. 2012. “Explosive Cratering on Embankment
Dams.” Canadian Dam Association 2012 Annual Conference, Canada.
Braimah, A. and Rayhani, M. 2012. “How Explosives Affect Embankment Dams”
http://www.hydroworld.com/articles/print/volume-20/issue-2/articles/dam-safety/how-
explosives-affect.html 14/07/22
Bretz T.E. 1990. “Soil liquefaction resulting from blast-induced spherical stress waves.” PhD
Thesis, Colorado State University..
British Broadcasting Corporation (BBC). 2008. In Pictures: Islamabad aftermath.
http://news.bbc.co.uk/2/hi/in_pictures/7627729.stm, 13/11/12, 14:22.
84
Canadian Dam Association (CDA), 2003. Dams in Canada, Canadian Dam Association,
Edmonton, Alberta.
Charlie, W. A., Lewis, W. A., and Doehring, D.O. 2001. “Explosive Induced Pore Pressure in a
Sandfill Dam.” Geotechnical Testing Journal. 24:4 pp. 391–400.
Charles, J. A. 2004. “Internal erosion in European embankment dams.” Progress Report, ICOLD
European Club [online]. Available from
http://cnpgb.inag.pt/IcoldClub/documents/Internal_erosionProgressRep.pdf
Dahms S.H. 2004. “Damage Caused to Earth Embankment Dams by Earthquakes in United
States.” http://academic.emporia.edu/aberjame/student/dahms3/web1.htm 14/16/04
Darina Fiserova, 2006.” Numerical Analysis of Buried Mine Explosions with Emphasis on
Effect of Soil Properties on Loading.” PhD Thesis, Cranfield University, United Kingdom.
De Alba P.A., Seed B., Retamal E. and Seed R.B. 1988. “Analyses of Dam Failures in 1985
Chilean Earthquake.” J. Geotech. Eng. 1988.114:1414-1434.
De A., Butler S., Zimmie T.F., (2013). “Effects of Surface Explosions on top of Earth
Embankment Dams.” Geo-congress 2013; ASCE 2013.
Defence R&D Canada. 2009. “Numerical Study of Soil Modelling Approaches using LS-DYNA:
Part 2.” Defence R&D Contract Report DRDC Valcartier CR 2009-164.
Dobry, R., Ladd, R.S., Yokel, F.Y., Chung, R.M. and Powell, D. 1982. “Prediction of Pore-
water Pressure Buildup and Liquefaction of Sands during Earthquakes by Cycle Strain Method.”
National Bureau of Standards Building Science Series 138, 150 pp.
Drake, J. L., and Ingram L. F. 1981. “Predictions of the Airblast and Ground Motions Resulting
from Explosive Removal of Bird's Point -New Madrid Fuze Plug Lever.” Misc. Paper SL-81-30,
U.S. Army Engineer WES, Vicksburg, MS, 1981
Dupont, Blasters Handbook, 16th edition. 1980 E. I. Dupont de Nemours and Company.
Explosive Products Division, Wilmington, DE.
Fan Y., Chen Z., Liang X., Zhang X., Huang X. 2012. “Geotechnical Centrifuge Model Test for
Explosion Cratering and Propagation Laws of Blast Waves in Sand”. Applied phys & Eng,
13(5):335-343.
FEMA. (2003). Risk Management Series: Reference Manual to Mitigate Potential Terrorist Attack
Against Buildings. Federal Emergency Management Agency.
Fast Lagrangian Analysis of Continua (FLAC) Version 5. 2002. Itasca Consulting Group.
http://www.civil.utah.edu/~bartlett/CVEEN6920/FLAC%20manual.pdf

85
Foundation, Concrete and Earthquake Engineering. Failure of Dam. http://civil-engg-
world.blogspot.ca/2009/03/failure-of-dam.html 14/25/03
Fredlund, D. G. (1987). Slope stability analysis incorporating the effect of soil suction. John and
Wiley and Sons Ltd.
http://www.soilvision.com/subdomains/unsaturatedsoil.com/Docs/Research%20Papers/1987/Co
nference%20Papers/Slope%20stability%20analysis%20incorporating%20the%20effect%20of%2
0soil%20suction.pdf 14/03/23
Fredlund, D.G. & Rahardjo H. 1993. “Soil Mechanics for Unsaturated Soils.” New York: A
Wiley-Interscience Publication. ISBN: 978-0-471-85008-3
Graham W.J. 2009. “Major U.S. Dam Failures: Their Cause, Resultant Losses, and Impact on
Dam Safety Programs and Engineering Practice.” World Environmental and Water Resources
Congress : Great Rivers History Great Rivers History. ASCE.
Johnson W.F. 1889. History of the Johnstown flood first edition. Edgewood Publications
ISBN 10-1125954558.
Hydroworld. 2012. “How Explosives Affect Embankment Dams.”
http://www.hydroworld.com/articles/print/volume-20/issue-2/articles/dam-safety/how-
explosives-affect.html 14/25/06 18:00
Jayasinghe, L.B., Thambiratnam, D.P., Perera, N., Jayasooriya, J.H.A.R. 2013. “Computer
Simulation of Underground Blast Response of Pile in Saturated Soil.” Computers and Structures,
120, pp. 86-95. http://eprints.qut.edu.au/59919/
Kennard M.F. and Bromhead E.N. 2000. “Carsington Dam-The Near-Miss which became a
Bulls-Eye.” Forensic Engineering. ASCE.
Kinney GF, Graham K.J. 1985. Explosive shocks in air. 2nd
Edition, Springer Verlag, Berlin.
Kirschner, O. 1949., “Destruction and Protection of Dams and Levees.” Military Hydrology,
Research and Development Branch, U.S. Corps of Engineers, Department of the Army,
Washington District. From Schweizerische Bauzeitung, March 14, 1949. Translated by H.E.
Schwarz, Washington, D.C.
Leong E.C., Anand S., Cheong H.K. and Lim C.H. 2007. “Re-examination of peak stress and
scaled distance due to ground shock.” International Journal of Impact Engineering,
ScienceDirect ,34 :1487–1499.

86
Li, Y., Contestabile, E., Braimah, A. and Wilson, D., 2007. “Preliminary Vulnerability of an
Embankment Dam due to Explosions.” CERL Report 2007-01 (CF).
Long, J. H., E. R. Ries, and Michalopoulos A. P. 1981. “Potential for Liquefaction Due to
Construction Blasting.” Proceedings lnternational Conference on Recent Advances in
Geotechnical Engineering and Soil Dynamics University of Missouri-Rolla, St. Louis, MO.
Luccioni, B.M. and Ambrosini D. 2008. “Evaluating the effect of underground explosions on
structures.” Mecánica Computacional, 27, 1999-2019.
Luccioni B., Ambrosini D., Nurick G, Snyman I. 2009. “Craters produced by underground
explosions.” Computers and Structures, ScienceDirect, 87:1366-1373.
LS-DYNA Forum. 2011. “Review of Solid Elements Formulation in LS-DYNA”.
http://www.dynamore.de/de/download/papers/forum11/entwicklerforum-2011/erhart.pdf
MacDonald C.T. and Langridge-Monopolis J. 1984. “Breaching Characteristics of Dam
Failures.” J. Hydraul. Eng. 1984.110:567-586.
Muhunthan B. and Schofield A.N. 2000. “Liquefaction and dam Failures.” Slope Stability.
ASCE.
Nonveiller, E., Rupcic, J., and Sever, Z., 1999. “War damages and reconstruction of Peruca
Dam.” J. of Geotechnical and Geoenvironmental Eng.,125 (4): 280 -288.
Ontario Ministry of Natural Resources, 2011. Spillways and Flood Control Structures Technical
Bulletin. http://www.creditvalleyca.ca/wp-content/uploads/2011/02/stdprod_069405.pdf
14/02/22
Roman DH. 1986. “Study of physical and chemical aspects of blast densification.” PhD thesis,
Northwestern University.
Sausville, M. J. 2005. “Explosive cratering using a geotechnical centrifuge on dry,
saturated, and partially saturated earth embankments and dams.” MS thesis, Rensselaer
Polytechnic Institute.
Shepherd R. 2003. “The St. Francis Dam Failure. Forensic Engineering.” ASCE, Virginia, USA.
St-Arnaud, G. 1995. “The high pore pressures within embankment dams; an unsaturated soil
approach.” Canadian Geotechnical. Journal 32: 892-898
TM 5-855-1. 1986. “Fundamentals of protective design for conventional weapons.” Department
of the army, Washington, DC, USA.

87
United States Bureau of Reclamation (USBR), 1998. “Earth Manual.” Earth Sciences and
Research Laboratory, Denver, Colorado.
United States Society on Dams (USSD). 2011. “Materials for embankment dams.”
http://ussdams.org/materials.PDF
United States Homeland Security, 2011. “Estimating the Economic Consequences for Dam
Failure Scenarios.
“http://www.damsafety.org/media/documents/owner%20documents/Dam%20Security/Dams%2
0Sector%20-%20Consequence%20Estimation%20-%20Economic%20Consequences.pdf
United States Homeland Security, 2012. A Worldwide Attacks against Dams.
http://www.cowarn.org/uploads/news/Worldwide%20Attacks%20against%20Dams%20-
%202012.pdf
United States Department of Interior. 1985. “Review of Present Practices Used in Predicting the
Effects of Blasting on Pore Pressure.” Bureau of Reclamation, Division of Research and
Laboratory Services, Geotechnical Branch, GR-85-9.
Vajic, N., 1994. “Protection of Dams in Armed Conflicts: The Peruca Case.” Journal of
Chemists and Chemical Engineers, 43 (3), 108-114.
Vanpalli S.K. 2010. “Shear strength of unsaturated soils and its application in geotechnical
engineering practice.” Taylor and Francis Group, London.
Wang Z., Lu Y. and Bai C. 2011. “Numerical simulation of explosive-induced soil liquefaction
and its effects on surface structures.” Finite Elements in Analysis and Design 47: 1079-1090,
Elsevier.
Wiss J.F. 1981. “Construction vibration: state of the art.” J Constr Div, 100(GT2):167–82.
Zhang Z., Cui, W. and Guo, R. 2010. “Effect of Environmental Conditions on Stanility of an
Unsaturated Soil Slope.” Experimental and Applied Modelling of Unsaturated Soil, ASCE.

88
Appendix A
SEEP/W Analysis
Report generated using GeoStudio 2007, version 7.10. Copyright © 1991-2008 GEO-SLOPE
International Ltd.
File Information
Revision Number: 5
Date: 09/08/2014
Time: 8:24:44 PM
File Name: seep.gsz
Directory: C:\Users\George\Desktop\
Last Solved Date: 09/08/2014
Last Solved Time: 8:24:52 PM
Project Settings
Length(L) Units: meters
Time(t) Units: Seconds
Force(F) Units: kN
Pressure(p) Units: kPa
Mass(M) Units: g

89
Mass Flux Units: g/sec
Unit Weight of Water: 9.807 kN/m³
View: 2D
Analysis Settings
SEEP/W Analysis
Kind: SEEP/W
Method: Steady-State
Settings
Include Air Flow: No
Control
Apply Runoff: Yes
Convergence
Maximum Number of Iterations: 50
Tolerance: 0.1
Maximum Change in K: 1
Rate of Change in K: 1.1
Minimum Change in K: 0.0001
Equation Solver: Direct
Potential Seepage Max # of Reviews: 10
Time
Starting Time: 0 sec
Duration: 0 sec
Ending Time: 0 sec
Materials

90
sand
Model: Saturated Only
Hydraulic
K-Sat: 0.001 m/sec
Volumetric Water Content: 1 m³/m³
Mv: 0 /kPa
K-Ratio: 1
K-Direction: 0 °
Boundary Conditions
Zero Pressure
Type: Pressure Head = 0
Potential Seepage Face
Review: true
Type: Total Flux (Q) 0
Reservoir Level
Type: Head (H) 1.6491
Flux Sections
Flux Section 1
Coordinates
Coordinate: (7, 0) m
Coordinate: (7, 3) m
Regions
Material Points Area (m²)
Region 1 sand 1,8,7,3,4,2 15

91
Lines
Start Point End Point Hydraulic Boundary
Line 1 1 2
Line 2 3 4
Line 3 4 2 Potential Seepage Face
Line 4 5 6
Line 5 7 3
Line 6 1 8 reservoir level
Line 7 8 7
Points
X (m) Y (m) Hydraulic Boundary
Point 1 0 0
Point 2 13 0 Zero Pressure
Point 3 6 2
Point 4 8 2
Point 5 0 1.6491
Point 6 4.9487 1.6491
Point 7 5 1.6666667
Point 8 4.9733333 1.6577778

92
Appendix B
Units: mass (kg), distance (m), time (s)
PARTS OF MODEL
*Parts
TITLE
Air
PID SECID MID EOSID HGID GRAV ADOPT TMID
3 1 3 2 0 0 0 0
TITLE
Embankment Dam
PID SECID MID EOSID HGID GRAV ADOPT TMID
1 2 2 0 0 0 0 0
TITLE
TNT Explosive
PID SECID MID EOSID HGID GRAV ADOPT TMID
2 1 1 1 0 0 0 0
SECTIONS
*SECTION_SOLID
TITLE
TNT Explosive, Air
SECID ELFORM AET
1 11 0
TITLE
TNT Explosive, Air
SECID ELFORM AET
2 1 0

93
Material Constitutive Model
*MAT_HIGH_EXPLOSIVE_BURN
TITLE
TNT Explosive
MID RO D PCJ BETA K G SIGY
1 1630 6930 2.1e+10 0 0 0 0
*MAT_NULL
TITLE
Air
MID RO MU TEROD CEROD YM `PR
3 1 3 2 0 0 0
*MAT_MOHR_COULOMB
TITLE
Soil
MID RO GMOD RNU PHI CVAL `PSI
2 1440 2.18e+8 0.35 0.5236 0 0
- NPLANES - LCCPDR LCCPT LCCJDR LCJT LCSFAC
0 1 0 0 0 0 0 0
GMODDP GMODGR LCGMEP LCPHIEP LCPSIEP LCGMST LCGMST ANISO
0 0 0 0 0 0 0 1
DIP DIPANG CPLANE FRPLANE TPLANE SHRMAX LOCAL
0 0 0 0 0 1e+20 0
*MAT_PSEUDO_TENSOR
TITLE
Soil
MID RO G PR
2 1440 2.18E+08 0.35
X1 X2 X3 X4 X5 X6 X7 X8
0 4444 5277 5872 1.25 e+4 1.333e+4 1.639e+4 1.689 e+4
X9 X10 X11 X12 X13 X14 X15 X16
1.721e+4 1.722e+4 1.744e+4 1.757e+4 1.759e+4 1.778e+4 1.781e+4 1.788e+4
Y1 Y2 Y3 Y4 Y5 Y6 Y7 Y8
0 5333 6333 7047 1.5e+4 1.6e+4 1.967e+4 2.027e+4
Y9 Y10 Y11 Y12 Y13 Y14 Y15 Y16
2.065e+4 2.067e+4 2.093e+4 2.108e+4 2.11e+4 2.133e+4 2.134e+4 2.146e+4

94
*EOS_TABULATED_COMPACTION FOR *MAT_PSEUDO_TENSOR
TITLE
Soil
EOSID GAMA E0 V0
2 0 0 1
EV1 EV2 EV3 EV4 EV5 EV6 EV7 EV8 EV9 EV10
0 -2.5e-5 -5.0e-5 -0.0033 -0.0029 -0.0042 -0.0043 -0.0044 -0.005 -0054
C1 C2 C3 C4 C5 C6 C7 C8 C9 C10
0 4444 1.33e+4 1.64e+4 1.69e+4 1.72e+4 1.73e+4 1.74e+4 1.76e+4 1.79e+4
K1 K2 K3 K4 K5 K6 K7 K8 K9 K10
5.0e+7 5.0e+7 5.0e+7 5.0e+7 5.0e+7 5.0e+7 5.0e+7 5.0e+7 5.0e+7 5.0e+7
BOUNDARY CONDITIONS
*BOUNDARY_NON_REFLECTING
SSID AD AS
1 0 0
*Boundary_Pore_Fluid_Part
PID WTABLE PF RHO ATYPE PF BULK ACURVE WTCUR SUCLIM
1 1.65 1000 0 2.2e+9 0 0 0
*BOUNDARY_PWP_SET
SID LC CMULT LCDR TBIRTH TDEATH
2 0 1.65 0 0 1e+20
IPHRE ITOTEX IDRFLAG TABLE
0 4 0 0
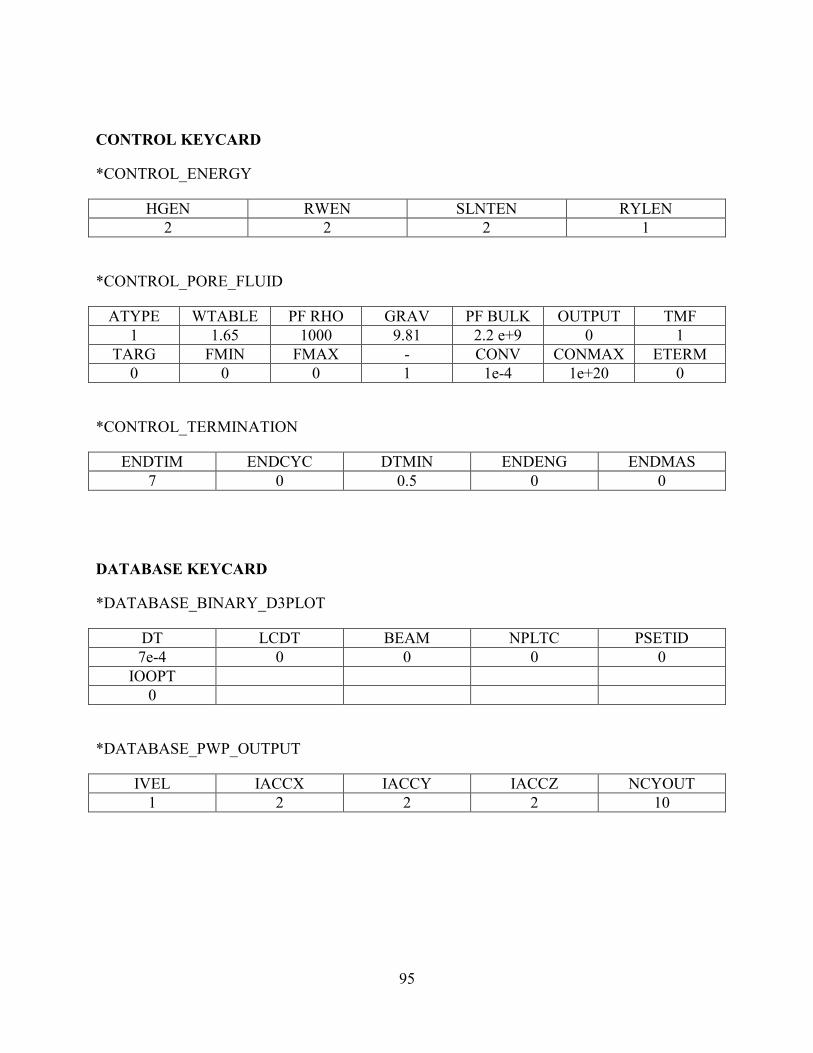
95
CONTROL KEYCARD
*CONTROL_ENERGY
HGEN RWEN SLNTEN RYLEN
2 2 2 1
*CONTROL_PORE_FLUID
ATYPE WTABLE PF RHO GRAV PF BULK OUTPUT TMF
1 1.65 1000 9.81 2.2 e+9 0 1
TARG FMIN FMAX - CONV CONMAX ETERM
0 0 0 1 1e-4 1e+20 0
*CONTROL_TERMINATION
ENDTIM ENDCYC DTMIN ENDENG ENDMAS
7 0 0.5 0 0
DATABASE KEYCARD
*DATABASE_BINARY_D3PLOT
DT LCDT BEAM NPLTC PSETID
7e-4 0 0 0 0
IOOPT
0
*DATABASE_PWP_OUTPUT
IVEL IACCX IACCY IACCZ NCYOUT
1 2 2 2 10

96
DEFINE KEYWORD
*DEFINE_CURVE
TITLE
Water Pressure Upstream
LCID SIDR SFA SFO OFFA OFFO DATTYP -
1 0 1 1 0 0 0 0
A1 O1
1 0 16177
2 3.45e-2 15833
3 6.9e-002 15489
4 0.1047 15144
5 0.1398 14800
6 0.1749 14456
7 0.21 14111
8 0.2451 13767
9 0.2802 13423
10 0.3153 13078
11 0.3504 12734
12 0.3855 12390
13 0.4206 12045
14 0.4557 11701
NB: These are sample values for applying hydrostatic pressure upstream and downstream
LOAD KEYWORD
*SEGMENT_SET
ID Heading
1 Load for upstream hydrostatic pressure
SSID LCID SF AT DT
12 2 1 0 0
ALE KEYWORD
*ALE_MULTI-MATERIAL_GROUP
SID IDTYPE GPNAME
2 1 -