effects of energy efficient transport vehicles in alberta · 2015-12-15 · final report - - - -...
TRANSCRIPT
FINAL REPORT
Economic Efficiency of Long Combination
Transport Vehicles in Alberta
John WoodrooffePrincipal, Woodrooffe & Associates
Lloyd AshGeneral Manager, Trimac Logistics
March 2001
Woodrooffe & Associates

Final Report
- - - - Woodrooffe & Associates
1
TABLE OF CONTENTS
1. EXECUTIVE SUMMARY....................................................................................... 2
2. INTRODUCTION..................................................................................................... 4
3. PROJECT SCOPE.................................................................................................... 63.1. METHODOLOGY........................................................................................................ 73.2. STUDY LOCATION..................................................................................................... 8
4. SCOPE OF VEHICLE OPERATIONS .................................................................. 94.1. PROVINCIAL VEHICLE REGISTRATIONS..................................................................... 94.2. ANALYSIS OF TRUCK TRAFFIC ACTIVITY................................................................ 134.3. QUANTIFYING SAMPLE LONG COMBINATION VEHICLE MOVEMENTS ..................... 134.4. QUANTIFYING EQUIVALENT NON LONG COMBINATION VEHICLE MOVEMENTS ..... 17
5. ECONOMIC EFFICIENCY OF LONG COMBINATION VEHICLES .......... 195.1. TECHNICAL AND ALLOCATIVE EFFICIENCY ............................................................ 195.2. EVALUATION OF MOVEMENT COSTS AS LONG COMBINATION VEHICLES ............... 205.3. EVALUATION OF MOVEMENT COSTS AS NON-LONG COMBINATION VEHICLES ....... 225.4. LCVS AND NON-LCVS COMPARISONS SUMMARIZED ............................................ 24
5.4.1. Annual Cost Comparison .............................................................................. 245.4.2. Fuel Efficiency............................................................................................... 245.4.3. Wear on Road Pavement Surfaces ................................................................ 25
5.5. LONG COMBINATION VEHICLE SAFETY EFFICIENCY............................................... 26
6. CONCLUSIONS ..................................................................................................... 276.1. LITERATURE REVIEW OF RELATED WORK.............................................................. 276.2. ALBERTA LONG COMBINATION VEHICLE EFFICIENCY FINDINGS ............................ 27
7. APPENDIX A: DETAILED TRAFFIC ESTIMATES BY STUDY AREAHIGHWAY SECTION ..................................................................................................... I
Final Report
- - - - Woodrooffe & Associates
2
1. EXECUTIVE SUMMARY
Alberta Infrastructure commissioned Woodrooffe and Associates to review the safety andthe economic efficiency of Energy Efficient Motor Vehicles (LCV’s) in the province ofAlberta, as well as to consider the relative efficiency and viability (competitiveness) ofthe competing railway mode.
Results
The use of LCV’s rather than semi-trailer configurations was found to be significantlymore efficient from an economic standpoint. If semi-trailer configuration trucks wereused instead of LCV’s, there would be an 80% increase in numbers of truckingmovements and truck kilometers traveled when compared to current activity (the current58.6 million truck kilometers of activity would translate, as smaller, semi-trailer loads offreight, into 105.3 million truck kilometers).
Costs for undertaking LCV movements as standard semi trailer loads would increasefrom $104.3 million annually to $146.4 million, a 40% increase in cost for shippers (from9.2 cents / tonne-km to 13 cents / tonne-km). Viewed differently, on freight carriedwithin the province of Alberta, the use of LCV’s represents an annual freight saving of$42.1 million for the provincial economy.
Similar savings in fuel consumption (and greenhouse gas emissions) are also beingrealized through use of LCV’s. The annual diesel fuel needed to move freight usingLCV’s is reduced by 32%, in comparison to what would be required by the industry ifsemi trailers were used. This is an annual savings of approximately 15 million liters peryear of fuel.
In relation to pavement wear, the use of LCV’s was found to represent a reduction from327.5 million ESAL-km to 195.5 million ESAL-km, a reduction of approximately 40%.(1 ESAL-km = 1 Equivalent Single Axle Load* traveling 1 km on the highway system)For this reason, the pavement wear (resurfacing cost) associated with the use of LCV’s isestimated to be reduced by approximately 40% over what would otherwise be the case.

Final Report
- - - - Woodrooffe & Associates
3
Conclusions
From an economic efficiency and societal benefit point of view, the use of the larger LCVtruck configurations in Alberta represents a significant reduction in the number ofmovements taking place on the highways, a significant transportation cost efficiency forusers of truck transportation services, a major reduction in fuel use and greenhouse gasemissions and a large reduction in pavement wear.
_____Note:
*ESAL, the Equivalent Single Axle Load, is a measure, devised by the AmericanAssociation of State Highways and Transportation Officials – and accepted byhighway design engineers – of the “fatigue loading” on a road surface that isassociated with a vehicle traveling over it. In this methodology, every vehicle isexpressed as it’s decimal equivalent of ESAL “passes”. A small passenger auto, forexample, is a fractional equivalent of an axle pass. Commercial trucks each representusually a mixed number, such as 1.5 to 3.5 axle passes per unit. The ESALequivalency of vehicle units is determined by highway engineers from experimentalmeasurements.

Final Report
- - - - Woodrooffe & Associates
4
2. INTRODUCTION
Long Combination Vehicles (LCVS)i are truck and trailer combinations, consisting of atractor with two or three trailers, or semi-trailers, in which the number of trailers and/orthe combined length of the combination exceeds the regular limits of 25 meters. Thesevehicles have been operating on Alberta highways since 1969 with the introduction ofTriple Trailers. Currently in Alberta, the maximum gross vehicle weight applicable toLCVs is 62,500 kilograms – soon to be 63,500 kg – while the maximum configurationlength is 37 metres (121.4 feet).
LCVs are further defined according to size, with three length classifications:
• Rocky Mountain Double. A combination vehicle consisting of a tractor, a 40 to 53foot semitrailer, and a shorter 24-28-foot semi-trailer. The total length does notexceed 31 metres (102 feet). These vehicles arte typically used when cargoconsiderations are governed by weight rather than the cubic capacity of the trailer.
• Turnpike Double. A Turnpike Double is a tractor plus double trailers. Each trailer isbetween 12.2 m (40 feet) and 16.2 m (53 feet) long. The Turnpike Double is typicallyused for carrying cargo that benefits from the additional cubic capacity of the trailerarrangement.
• Triple Trailer. A Triple Trailer Combination consists of a tractor with three trailers ofapproximately the same length. The typical trailer length is between approximately7.3 and 8.5 metres (24-28 feet). The Triple Trailer is also used for carrying cargo thatbenefits from the additional cubic capacity of the trailer arrangement.
All LCV equipment and their drivers operate in Alberta under permits with strict safetyrequirements and are generally restricted to traveling on 4-lane highways subject to driverand vehicle operational restrictions.
Figure 1 illustrates common LCV configurations in comparison to standardconfigurations of trucks used on roadways.
i Also known as Energy Efficient Motor Vehicles (EEMV’s).

Final Report
- - - - Woodrooffe & Associates
5
Figure 1: Illustration of Common LCV Configurationsand Standard Configurations
(also referred to in the literature as EEMVs, Energy Efficient Motor Vehicles) ** Source: Road Management and Engineering Journal
Figure 2: Example of a Turnpike Double Combination
(Photo Copyright Lloyd Ash: Used With Permission)

Final Report
- - - - Woodrooffe & Associates
6
Figure 3: Example of a Rocky Mountain Double Configuration
(Photo Copyright Lloyd Ash: Used With Permission)
3. PROJECT SCOPE
Alberta Infrastructure’s Transportation Policy and Economic Analysis Branchcommissioned Woodrooffe and Associates to undertake an in-depth review of economicefficiency of Long Combination Vehicles (LCVs) in Alberta:
Applying an accepted activity based truck operations modeling and costing system, twocomparative truck activity estimates (freight hauled in LCV’s and freight hauled in semi-trailers) were evaluated in terms of these important efficiency measures:
• User costs for truck transportation,• Fuel consumed for truck transportation (a direct corollary for estimating
greenhouse gas emissions),• Equivalent single axle passes (i.e. a corollary for the rate of wear of pavements),• Safety efficiency.

Final Report
- - - - Woodrooffe & Associates
7
3.1. Methodology
In order to assess the economic efficiency of LCV’s, average annual LCV movementswere first quantified from available truck traffic statistics.
To accomplish this, the commercial vehicle mix was first estimated using place specificsurvey statistics gathered at weigh scales within the province in 1999, as part of theNational Roadside Survey undertaken by Alberta Infrastructure under the auspices of theCCMTA (Canadian Council of Motor Transport Administrators).
The proportions of various types of LCV, from the CCMTA “classification survey” werethen applied to the provincially published AADTT and ASDTT (average annual dailytruck traffic and average summer daily truck traffic) records, to estimate segment specificmovements of LCV’s, on an annual basis, for the time period 1994-95 through 1998-99.
Based on the cubic carrying capacity of the three most common LCV configurations(Rocky Mountain Doubles, Turnpike Doubles and Triples), an estimate was developed ofthe expected equivalent numbers of movements required to move the same cargo, ifstandard semi-trailer configuration trucks were used instead to move the cargo over thesame route segments.
Applying an accepted activity based truck operations modeling and costing system(*), thecomparative truck – km of travel for the two activity estimates (freight hauled in LCV’sand freight hauled in semi-trailers) were evaluated in terms of three important efficiencymeasures:
• User costs for truck transportation• Fuel consumed for truck transportation (a direct corollary for estimating
greenhouse gas emissions), and• Equivalent single axle passes (i.e. a corollary for the rate of wear of pavements)
_____Note:* The Trimac Motor Carrier Fleet Operations and Costing Model is an acceptedmethodology used in the preparation of the annual report for Transport Canada, entitled,“Operating Costs of Trucks in Canada” and published / distributed by that agency on theinternet at http://www.tc.gc.ca. It is also the method used by Trimac TransportationServices Ltd., Canada’s largest for-hire trucking fleet and North America’s second largestbulk trucking company, to price compensatory transportation services. Trimac Logisticshas also applied this methodology for numerous cost efficiency “benchmarking”assignments for fleets such as Canada Post Corporation, Shell Canada Products Ltd. andnumerous others.
Final Report
- - - - Woodrooffe & Associates
8
3.2. Study Location
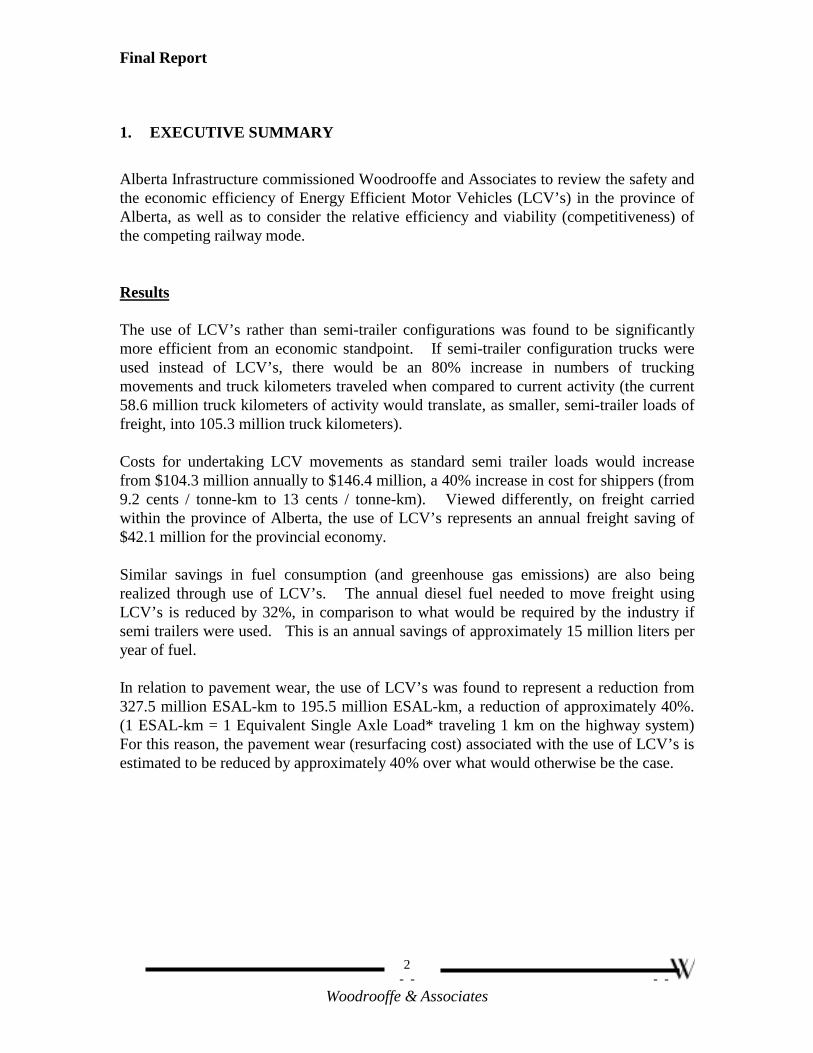
The operation of LCV’s in Alberta is restricted to specific routes (the sub network) withinthe entire provincial road and highway system. This is in recognition that LCV ‘s lengthnormally exceeds the allowable overall length of 25 metres for truck-trailer combinations.To facilitate safe passing, Turnpike Double and Triple Trailer combinations are allowedto operate only on four lane highways. Rocky Mountain Doubles can operate on all fourlane highways and selected two lane highways in the province.
Of the total provincial network of 13,776 km, this study focuses on the sub network of2,937 km in which LCVs are permitted to operate. All routes over which the largest LCVconfigurations (Turnpike Doubles and Triple Trailers), are permitted to operate, areincluded. That is, all four-lane divided highways in the province of Alberta plus those 2-lane highways where Rocky Mountain Doubles operate. The heavy red line in Figure 4illustrates the sub network segments for which traffic volume information and collisiondata was evaluated in this study by the consulting team.
Figure 4: LCV Highway Segments in Alberta (red links)

Final Report
- - - - Woodrooffe & Associates
9
The specific links evaluated in this project included the following:
Area Highway Description # of LanesArea 1 Hwy 4 Coutts to Lethbridge 4Area 2 Hwy 3 Crowsnest Pass to Jct Hwy 2 2Area 3 Hwy 3 Jct Hwy 2 to Lethbridge 4
Hwy 2 Jct Hwy 3 to Calgary 4Hwy 1 Banff Park Gates to Calgary 4
Area 4 Hwy 1 Calgary to Alberta/Saskatchewanborder
4
Area 5 Hwy 2 Calgary to Red Deer 4Area 6 Hwy 2 Red Deer to Edmonton 4Area 7 Hwy 16 Jasper Park Gates to Edmonton 4 (mostly)Area 8 Hwy 16 Edmonton to Alberta/Saskatchewan
border4
Area 9 Hwy 43 Alberta/BC border to Jct Hwy 16 2 + 4Area 10 Hwy 49 Jct Hwy 43 to Jct Hwy 2 2
Hwy 2 Jct Hwy 49 to Jct Hwy 35 2Hwy 35 Jct Hwy 2 to Alberta/NWT border 2
4. SCOPE OF VEHICLE OPERATIONS
4.1. Provincial Vehicle Registrations
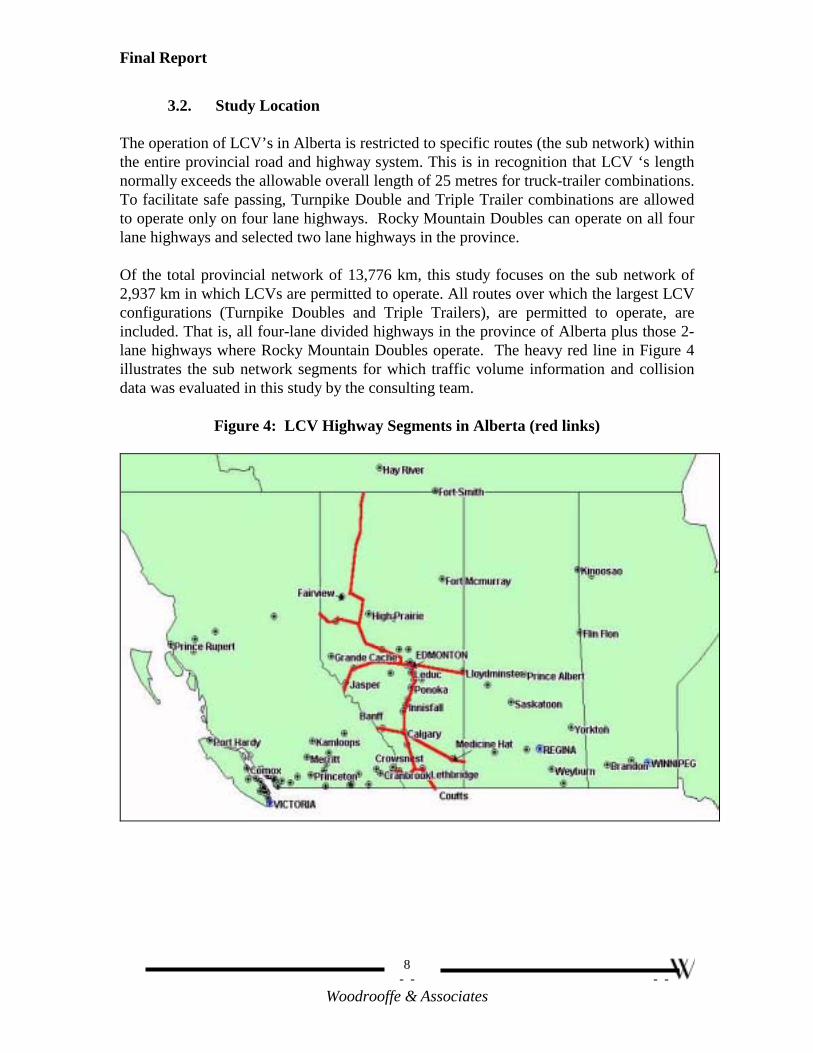
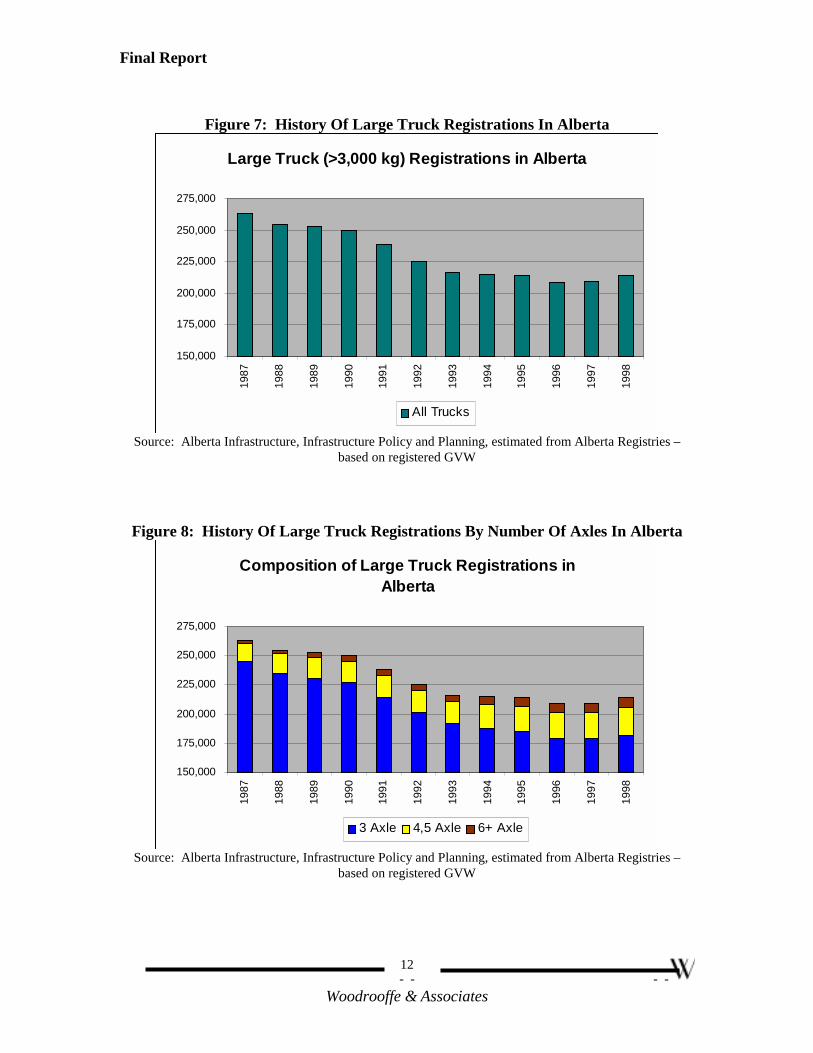
When Alberta vehicle registrations are reviewed in Table 1, and Figures 5 to 8, it isobserved that the total number of non-trucks has increased approximately 23% during theperiod 1987 to 1998. This reflects the period in which higher gross vehicle weights wereintroduced. During the same time the total number of all truck configurations declined by18.6%.
Within the “truck” category, a significant decline has occurred in the number of three axle(small straight) trucks, while significant growth has taken place in the larger truckcategories. The major change in the composition of trucks occurred in the 3 axle and 6+axle configurations. There was a 26% decline in 3 axle and an increase of 221% in 6+axle vehicles. The decline in the number of three axle trucks represents a significant shiftin truck size and productivity in Alberta.

Final Report
- - - - Woodrooffe & Associates
10
Table 1: Vehicle Registrations in Alberta 1987 to 1998
Trucks (> 3,000 kg)Year TotalVehicles 3 Axle 4,5 Axle 6+ Axle Total
Non TrucksTotal
1987 1,741,899 245,058 15,447 2,547 263,052 1,478,8471988 1,757,361 235,012 16,502 3,189 254,703 1,502,6581989 1,788,739 230,834 17,751 3,926 252,511 1,536,2281990 1,839,815 226,824 18,287 4,719 249,830 1,589,9851991 1,857,699 214,489 18,720 5,103 238,312 1,619,3871992 1,875,212 201,291 18,890 5,045 225,226 1,649,9861993 1,878,707 191,692 18,988 5,446 216,126 1,662,5811994 1,910,612 187,995 20,165 6,584 214,744 1,695,8681995 1,935,076 185,114 21,646 7,551 214,311 1,720,7651996 1,934,863 178,913 22,029 7,751 208,693 1,726,1701997 1,962,789 178,730 22,324 7,923 208,977 1,753,8121998 2,038,687 181,734 24,216 8,174 214,124 1,824,563
Source: Alberta Infrastructure, Infrastructure Policy and Planning, estimated from AlbertaRegistries – Motor Vehicles, based on registered GVW.
Fewer commercial vehicles in total demonstrate that LCVs reduce the number of trucksrequired to haul freight even though the Alberta economy has grown by over 10% overthe past five years. The reason that fewer trucks are able to do more work is that potentialLCV payloads represent an increase in cargo carrying capacity. Thus, fewer trucks arerequired to move the same amount of cargo. It is important to note that the carryingcapacity of the trucking fleet reflects the growth of the population and the economy.
Alberta vehicle registration information is graphically restated in the following Figures 5through 8.

Final Report
- - - - Woodrooffe & Associates
11
.Figure 5: History Of All Vehicle Registrations In Alberta
Motorized Vehicle Registrations in Alberta
1,500,000
1,750,000
2,000,000
2,250,000
1987
1988
1989
1990
1991
1992
1993
1994
1995
1996
1997
1998
All Highway Use Motorized Vehicles
Source: Alberta Infrastructure, Infrastructure Policy and Planning
Figure 6: History Of Personal Vehicle Registrations In Alberta
Personal Vehicle (<3,000 kg) Registrations in Alberta
1,000,000
1,250,000
1,500,000
1,750,000
2,000,000
1987
1988
1989
1990
1991
1992
1993
1994
1995
1996
1997
1998
Personal Vehicles
Source: Alberta Infrastructure, Infrastructure Policy and Planning, estimated from Alberta Registries –based on registered GVW
Final Report
- - - - Woodrooffe & Associates
12
Figure 7: History Of Large Truck Registrations In Alberta
Large Truck (>3,000 kg) Registrations in Alberta
150,000
175,000
200,000
225,000
250,000
275,000
1987
1988
1989
1990
1991
1992
1993
1994
1995
1996
1997
1998
All Trucks
Source: Alberta Infrastructure, Infrastructure Policy and Planning, estimated from Alberta Registries –based on registered GVW
Figure 8: History Of Large Truck Registrations By Number Of Axles In Alberta
Composition of Large Truck Registrations in Alberta
150,000
175,000
200,000
225,000
250,000
275,000
1987
1988
1989
1990
1991
1992
1993
1994
1995
1996
1997
1998
3 Axle 4,5 Axle 6+ Axle
Source: Alberta Infrastructure, Infrastructure Policy and Planning, estimated from Alberta Registries –based on registered GVW

Final Report
- - - - Woodrooffe & Associates
13
4.2. Analysis of Truck Traffic Activity
The Trimac Logistics Motor Carrier Fleet Model was used to undertake a comparison ofthe economic efficiency of Long Combination Vehicles versus non-Long CombinationVehicles.i
The Trimac model relates the total trucking costs, comprised of both fixed and variable,to the “time and distance’ factors associated with each truck trip. As such, this modelreflects the methodology used by a prudent motor carrier for purposes of competitively“pricing” their trucking services. Trucking activity costs are related to the number oftrips undertaken in a given period, the distance driven, the number of hours in service,layover and rest time, and the driving speeds appropriate for the defined routes. Forpurposes of undertaking the cost comparisons the unit cost factors in Appendix B wereused.
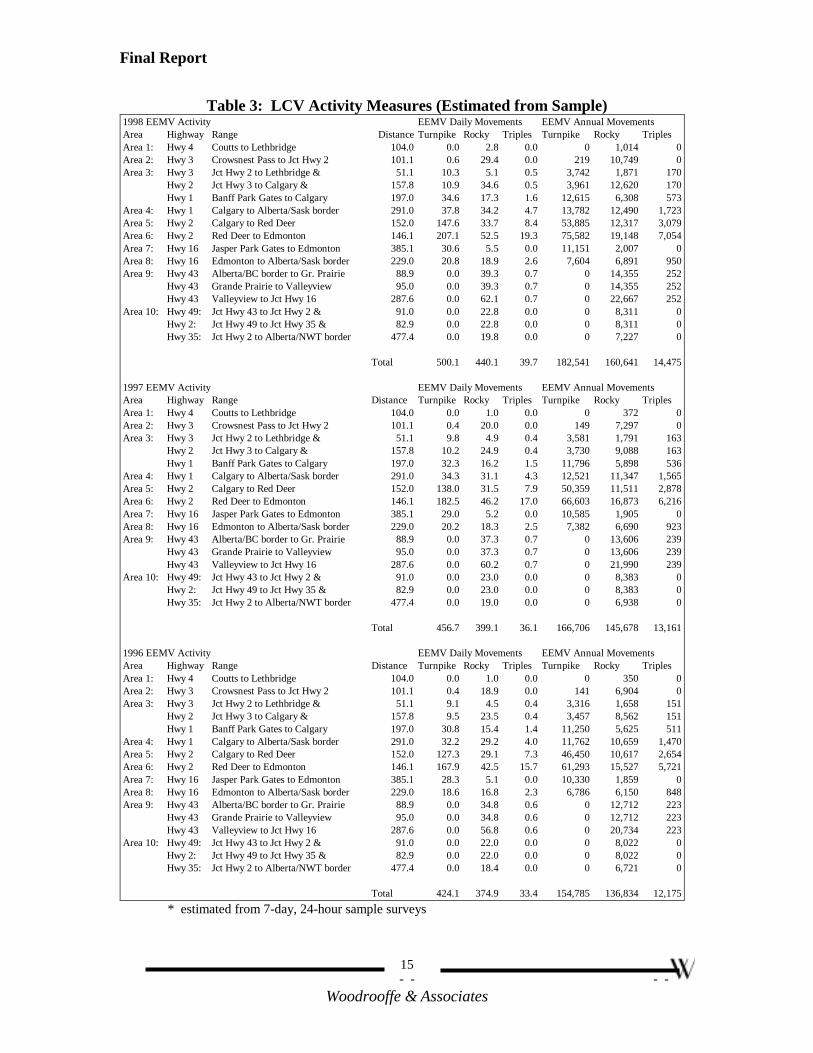
4.3. Quantifying Sample Long Combination Vehicle Movements
In order to assess the economic efficiency of LCVs, average annual LCV movementswere quantified. Alberta Infrastructure provided the consultant with the Annual AverageDaily Traffic (AADT) statistics of vehicle traffic, by highway segment, for all highwaysin the province, for the years 1995 through 1998. These statistics provide the counts forall vehicles travelling in both directions on each of the route segments.
The estimate of vehicle mix for each of the route segments was based on the 1999Canadian Council of Motor Transport Administrators (CCMTA) National Road Survey.This survey was conduced at each of the vehicle weigh scale locations indicated in Figure9. The CCMTA Survey conducted hourly traffic counts, on a continuous basis, duringthe week of July 13-19th, 1999. Estimates of the fleet composition/vehicle type, withinthe sub network, were determined from the AADT traffic estimates based on theclassification percentages determined from the CCMTA Survey. The results arepresented in Table 2. Detailed traffic estimates by highway link are provided in Table 3.These figures are the estimated number of LCV movements on the sub network linkseach year.
Detailed traffic estimates by highway link are provided in Table 3 and are the estimatedLCV movements on links by year.
i For a detailed discussion of the Trimac Motor Carrier Cost Model methodology,interested readers are referred to “Operating Costs of Trucks In Canada”, as published byTransport Canada on the Internet at http://www.tc.gc.ca

Final Report
- - - - Woodrooffe & Associates
14
Figure 9: Weigh Scale Locations(Vehicle Classification Percentages)
Table 2: Weekly Vehicle Classification Counts – By Survey LocationNational Roadside Survey/Effects of Longer Combination Vehicles in Alberta
Location Direction Total NRS Bus Single Tractor Truck Legal Length EEMVVehicles Vehicles Truck Only 1 Trailer Tractor Tractor Turnpike Rocky Tractor
1 Trailer 2 Trailers Doubles Doubles TriplesGrimshaw N&S 12,637 1,232 16 154 222 115 238 362 0 125 0Beaverlodge N&S 19610 2,619 52 835 58 183 1090 289 0 111 1Hinton E 17958 2,085 105 129 8 83 1072 581 90 17 0Leduc S 83223 7,928 72 776 195 860 3796 1379 628 162 60Balzac N 176306 10,466 332 2077 302 404 4772 1770 624 142 43Jumping Pound E 74885 5,249 81 814 57 137 2937 966 167 86 4Strathmore E 51414 5,429 97 886 135 106 3219 656 163 147 20Burmis E 15974 2,533 40 355 40 256 1082 681 1 78 0Coutts N&S 38881 3,971 41 118 49 65 3292 386 0 20 0Grimshaw % of All Traffic: 0.13% 1.22% 1.76% 0.91% 1.88% 2.86% 0.00% 0.99% 0.00%Beaverlodge % of All Traffic: 0.27% 4.26% 0.30% 0.93% 5.56% 1.47% 0.00% 0.57% 0.01%Hinton % of All Traffic: 0.58% 0.72% 0.04% 0.46% 5.97% 3.24% 0.50% 0.09% 0.00%Leduc % of All Traffic: 0.09% 0.93% 0.23% 1.03% 4.56% 1.66% 0.75% 0.19% 0.07%Balzac % of All Traffic: 0.19% 1.18% 0.17% 0.23% 2.71% 1.00% 0.35% 0.08% 0.02%Jumping Pound % of All Traffic: 0.11% 1.09% 0.08% 0.18% 3.92% 1.29% 0.22% 0.11% 0.01%Strathmore % of All Traffic: 0.19% 1.72% 0.26% 0.21% 6.26% 1.28% 0.32% 0.29% 0.04%Burmis % of All Traffic: 0.25% 2.22% 0.25% 1.60% 6.77% 4.26% 0.01% 0.49% 0.00%Coutts % of All Traffic: 0.11% 0.30% 0.13% 0.17% 8.47% 0.99% 0.00% 0.05% 0.00%
Source : Alberta Infrastructure
Final Report
- - - - Woodrooffe & Associates
15
Table 3: LCV Activity Measures (Estimated from Sample)1998 EEMV Activity EEMV Daily Movements EEMV Annual MovementsArea Highway Range Distance Turnpike Rocky Triples Turnpike Rocky TriplesArea 1: Hwy 4 Coutts to Lethbridge 104.0 0.0 2.8 0.0 0 1,014 0Area 2: Hwy 3 Crowsnest Pass to Jct Hwy 2 101.1 0.6 29.4 0.0 219 10,749 0Area 3: Hwy 3 Jct Hwy 2 to Lethbridge & 51.1 10.3 5.1 0.5 3,742 1,871 170
Hwy 2 Jct Hwy 3 to Calgary & 157.8 10.9 34.6 0.5 3,961 12,620 170Hwy 1 Banff Park Gates to Calgary 197.0 34.6 17.3 1.6 12,615 6,308 573
Area 4: Hwy 1 Calgary to Alberta/Sask border 291.0 37.8 34.2 4.7 13,782 12,490 1,723Area 5: Hwy 2 Calgary to Red Deer 152.0 147.6 33.7 8.4 53,885 12,317 3,079Area 6: Hwy 2 Red Deer to Edmonton 146.1 207.1 52.5 19.3 75,582 19,148 7,054Area 7: Hwy 16 Jasper Park Gates to Edmonton 385.1 30.6 5.5 0.0 11,151 2,007 0Area 8: Hwy 16 Edmonton to Alberta/Sask border 229.0 20.8 18.9 2.6 7,604 6,891 950Area 9: Hwy 43 Alberta/BC border to Gr. Prairie 88.9 0.0 39.3 0.7 0 14,355 252
Hwy 43 Grande Prairie to Valleyview 95.0 0.0 39.3 0.7 0 14,355 252Hwy 43 Valleyview to Jct Hwy 16 287.6 0.0 62.1 0.7 0 22,667 252
Area 10: Hwy 49: Jct Hwy 43 to Jct Hwy 2 & 91.0 0.0 22.8 0.0 0 8,311 0Hwy 2: Jct Hwy 49 to Jct Hwy 35 & 82.9 0.0 22.8 0.0 0 8,311 0Hwy 35: Jct Hwy 2 to Alberta/NWT border 477.4 0.0 19.8 0.0 0 7,227 0
Total 500.1 440.1 39.7 182,541 160,641 14,475
1997 EEMV Activity EEMV Daily Movements EEMV Annual MovementsArea Highway Range Distance Turnpike Rocky Triples Turnpike Rocky TriplesArea 1: Hwy 4 Coutts to Lethbridge 104.0 0.0 1.0 0.0 0 372 0Area 2: Hwy 3 Crowsnest Pass to Jct Hwy 2 101.1 0.4 20.0 0.0 149 7,297 0Area 3: Hwy 3 Jct Hwy 2 to Lethbridge & 51.1 9.8 4.9 0.4 3,581 1,791 163
Hwy 2 Jct Hwy 3 to Calgary & 157.8 10.2 24.9 0.4 3,730 9,088 163Hwy 1 Banff Park Gates to Calgary 197.0 32.3 16.2 1.5 11,796 5,898 536
Area 4: Hwy 1 Calgary to Alberta/Sask border 291.0 34.3 31.1 4.3 12,521 11,347 1,565Area 5: Hwy 2 Calgary to Red Deer 152.0 138.0 31.5 7.9 50,359 11,511 2,878Area 6: Hwy 2 Red Deer to Edmonton 146.1 182.5 46.2 17.0 66,603 16,873 6,216Area 7: Hwy 16 Jasper Park Gates to Edmonton 385.1 29.0 5.2 0.0 10,585 1,905 0Area 8: Hwy 16 Edmonton to Alberta/Sask border 229.0 20.2 18.3 2.5 7,382 6,690 923Area 9: Hwy 43 Alberta/BC border to Gr. Prairie 88.9 0.0 37.3 0.7 0 13,606 239
Hwy 43 Grande Prairie to Valleyview 95.0 0.0 37.3 0.7 0 13,606 239Hwy 43 Valleyview to Jct Hwy 16 287.6 0.0 60.2 0.7 0 21,990 239
Area 10: Hwy 49: Jct Hwy 43 to Jct Hwy 2 & 91.0 0.0 23.0 0.0 0 8,383 0Hwy 2: Jct Hwy 49 to Jct Hwy 35 & 82.9 0.0 23.0 0.0 0 8,383 0Hwy 35: Jct Hwy 2 to Alberta/NWT border 477.4 0.0 19.0 0.0 0 6,938 0
Total 456.7 399.1 36.1 166,706 145,678 13,161
1996 EEMV Activity EEMV Daily Movements EEMV Annual MovementsArea Highway Range Distance Turnpike Rocky Triples Turnpike Rocky TriplesArea 1: Hwy 4 Coutts to Lethbridge 104.0 0.0 1.0 0.0 0 350 0Area 2: Hwy 3 Crowsnest Pass to Jct Hwy 2 101.1 0.4 18.9 0.0 141 6,904 0Area 3: Hwy 3 Jct Hwy 2 to Lethbridge & 51.1 9.1 4.5 0.4 3,316 1,658 151
Hwy 2 Jct Hwy 3 to Calgary & 157.8 9.5 23.5 0.4 3,457 8,562 151Hwy 1 Banff Park Gates to Calgary 197.0 30.8 15.4 1.4 11,250 5,625 511
Area 4: Hwy 1 Calgary to Alberta/Sask border 291.0 32.2 29.2 4.0 11,762 10,659 1,470Area 5: Hwy 2 Calgary to Red Deer 152.0 127.3 29.1 7.3 46,450 10,617 2,654Area 6: Hwy 2 Red Deer to Edmonton 146.1 167.9 42.5 15.7 61,293 15,527 5,721Area 7: Hwy 16 Jasper Park Gates to Edmonton 385.1 28.3 5.1 0.0 10,330 1,859 0Area 8: Hwy 16 Edmonton to Alberta/Sask border 229.0 18.6 16.8 2.3 6,786 6,150 848Area 9: Hwy 43 Alberta/BC border to Gr. Prairie 88.9 0.0 34.8 0.6 0 12,712 223
Hwy 43 Grande Prairie to Valleyview 95.0 0.0 34.8 0.6 0 12,712 223Hwy 43 Valleyview to Jct Hwy 16 287.6 0.0 56.8 0.6 0 20,734 223
Area 10: Hwy 49: Jct Hwy 43 to Jct Hwy 2 & 91.0 0.0 22.0 0.0 0 8,022 0Hwy 2: Jct Hwy 49 to Jct Hwy 35 & 82.9 0.0 22.0 0.0 0 8,022 0Hwy 35: Jct Hwy 2 to Alberta/NWT border 477.4 0.0 18.4 0.0 0 6,721 0
Total 424.1 374.9 33.4 154,785 136,834 12,175* estimated from 7-day, 24-hour sample surveys

Final Report
- - - - Woodrooffe & Associates
16
Table 3, Continued: LCV Activity Measures (Estimated)1995 EEMV Activity EEMV Daily Movements EEMV Annual MovementsArea Highway Range Distance Turnpike Rocky Triples Turnpike Rocky TriplesArea 1: Hwy 4 Coutts to Lethbridge 104.0 0.0 0.9 0.0 0 325 0Area 2: Hwy 3 Crowsnest Pass to Jct Hwy 2 101.1 0.4 18.3 0.0 137 6,689 0Area 3: Hwy 3 Jct Hwy 2 to Lethbridge & 51.1 9.2 4.6 0.4 3,340 1,670 152
Hwy 2 Jct Hwy 3 to Calgary & 157.8 9.5 22.9 0.4 3,477 8,359 152Hwy 1 Banff Park Gates to Calgary 197.0 32.8 16.4 1.5 11,957 5,978 543
Area 4: Hwy 1 Calgary to Alberta/Sask border 291.0 32.3 29.3 4.0 11,797 10,691 1,475Area 5: Hwy 2 Calgary to Red Deer 152.0 125.7 28.7 7.2 45,875 10,486 2,621Area 6: Hwy 2 Red Deer to Edmonton 146.1 168.2 42.6 15.7 61,402 15,555 5,731Area 7: Hwy 16 Jasper Park Gates to Edmonton 385.1 29.5 5.3 0.0 10,768 1,938 0Area 8: Hwy 16 Edmonton to Alberta/Sask border 229.0 18.5 16.8 2.3 6,763 6,129 845Area 9: Hwy 43 Alberta/BC border to Gr. Prairie 88.9 0.0 34.2 0.6 0 12,483 219
Hwy 43 Grande Prairie to Valleyview 95.0 0.0 34.2 0.6 0 12,483 219Hwy 43 Valleyview to Jct Hwy 16 287.6 0.0 57.3 0.6 0 20,902 219
Area 10: Hwy 49: Jct Hwy 43 to Jct Hwy 2 & 91.0 0.0 23.1 0.0 0 8,419 0Hwy 2: Jct Hwy 49 to Jct Hwy 35 & 82.9 0.0 23.1 0.0 0 8,419 0Hwy 35: Jct Hwy 2 to Alberta/NWT border 477.4 0.0 18.0 0.0 0 6,577 0
Total 426.1 375.6 33.4 155,516 137,103 12,176
Annual Average 1995-98 EEMV Activity EEMV Daily Movements EEMV Annual MovementsArea Highway Range Distance Turnpike Rocky Triples Turnpike Rocky TriplesArea 1: Hwy 4 Coutts to Lethbridge 104.0 0.0 1.4 0.0 0 515 0Area 2: Hwy 3 Crowsnest Pass to Jct Hwy 2 101.1 0.4 21.7 0.0 161 7,910 0Area 3: Hwy 3 Jct Hwy 2 to Lethbridge & 51.1 9.6 4.8 0.4 3,495 1,748 159
Hwy 2 Jct Hwy 3 to Calgary & 157.8 10.0 26.5 0.4 3,656 9,657 159Hwy 1 Banff Park Gates to Calgary 197.0 32.6 16.3 1.5 11,904 5,952 541
Area 4: Hwy 1 Calgary to Alberta/Sask border 291.0 34.2 31.0 4.3 12,465 11,297 1,558Area 5: Hwy 2 Calgary to Red Deer 152.0 134.6 30.8 7.7 49,142 11,233 2,808Area 6: Hwy 2 Red Deer to Edmonton 146.1 181.4 46.0 16.9 66,220 16,776 6,181Area 7: Hwy 16 Jasper Park Gates to Edmonton 385.1 29.3 5.3 0.0 10,708 1,927 0Area 8: Hwy 16 Edmonton to Alberta/Sask border 229.0 19.5 17.7 2.4 7,134 6,465 892Area 9: Hwy 43 Alberta/BC border to Gr. Prairie 88.9 0.0 36.4 0.6 0 13,289 233
Hwy 43 Grande Prairie to Valleyview 95.0 0.0 36.4 0.6 0 13,289 233Hwy 43 Valleyview to Jct Hwy 16 287.6 0.0 59.1 0.6 0 21,573 233
Area 10: Hwy 49: Jct Hwy 43 to Jct Hwy 2 & 91.0 0.0 22.7 0.0 0 8,284 0Hwy 2: Jct Hwy 49 to Jct Hwy 35 & 82.9 0.0 22.7 0.0 0 8,284 0Hwy 35: Jct Hwy 2 to Alberta/NWT border 477.4 0.0 18.8 0.0 0 6,866 0
Total 451.7 397.4 35.6 164,885 145,065 12,997* estimated from 7-day, 24-hour sample surveys
Final Report
- - - - Woodrooffe & Associates
17
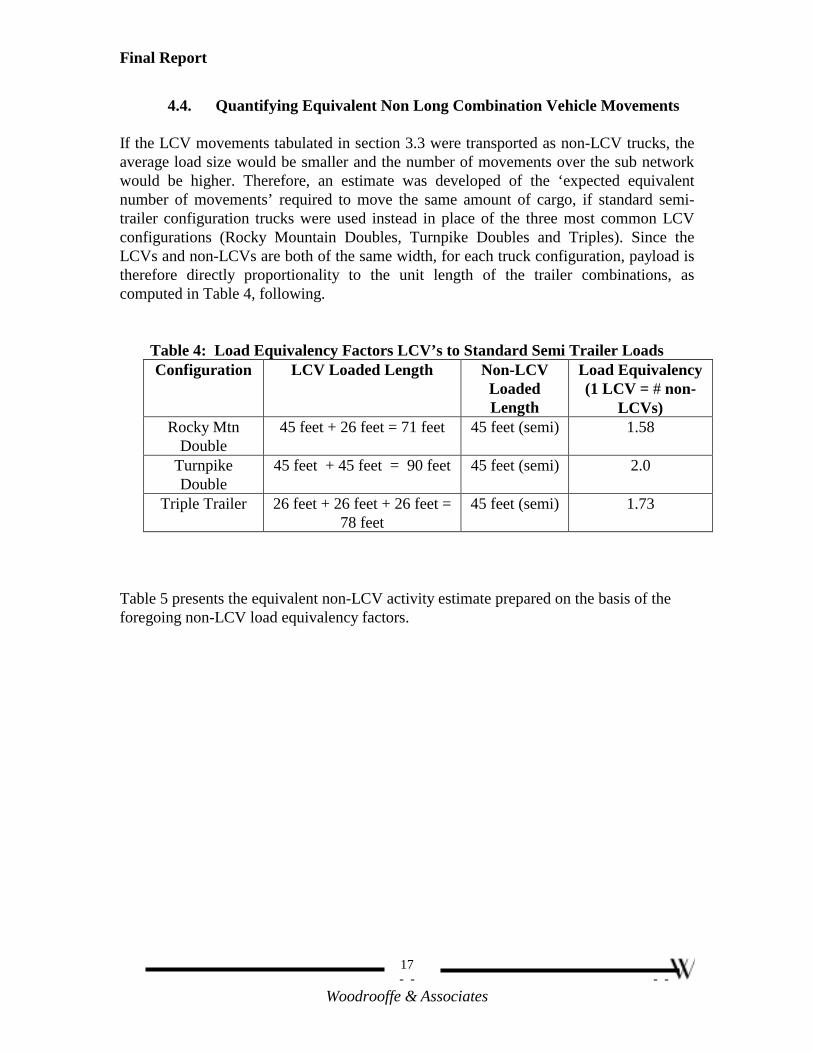
4.4. Quantifying Equivalent Non Long Combination Vehicle Movements
If the LCV movements tabulated in section 3.3 were transported as non-LCV trucks, theaverage load size would be smaller and the number of movements over the sub networkwould be higher. Therefore, an estimate was developed of the ‘expected equivalentnumber of movements’ required to move the same amount of cargo, if standard semi-trailer configuration trucks were used instead in place of the three most common LCVconfigurations (Rocky Mountain Doubles, Turnpike Doubles and Triples). Since theLCVs and non-LCVs are both of the same width, for each truck configuration, payload istherefore directly proportionality to the unit length of the trailer combinations, ascomputed in Table 4, following.
Table 4: Load Equivalency Factors LCV’s to Standard Semi Trailer LoadsConfiguration LCV Loaded Length Non-LCV
LoadedLength
Load Equivalency(1 LCV = # non-
LCVs)Rocky Mtn
Double45 feet + 26 feet = 71 feet 45 feet (semi) 1.58
TurnpikeDouble
45 feet + 45 feet = 90 feet 45 feet (semi) 2.0
Triple Trailer 26 feet + 26 feet + 26 feet =78 feet
45 feet (semi) 1.73
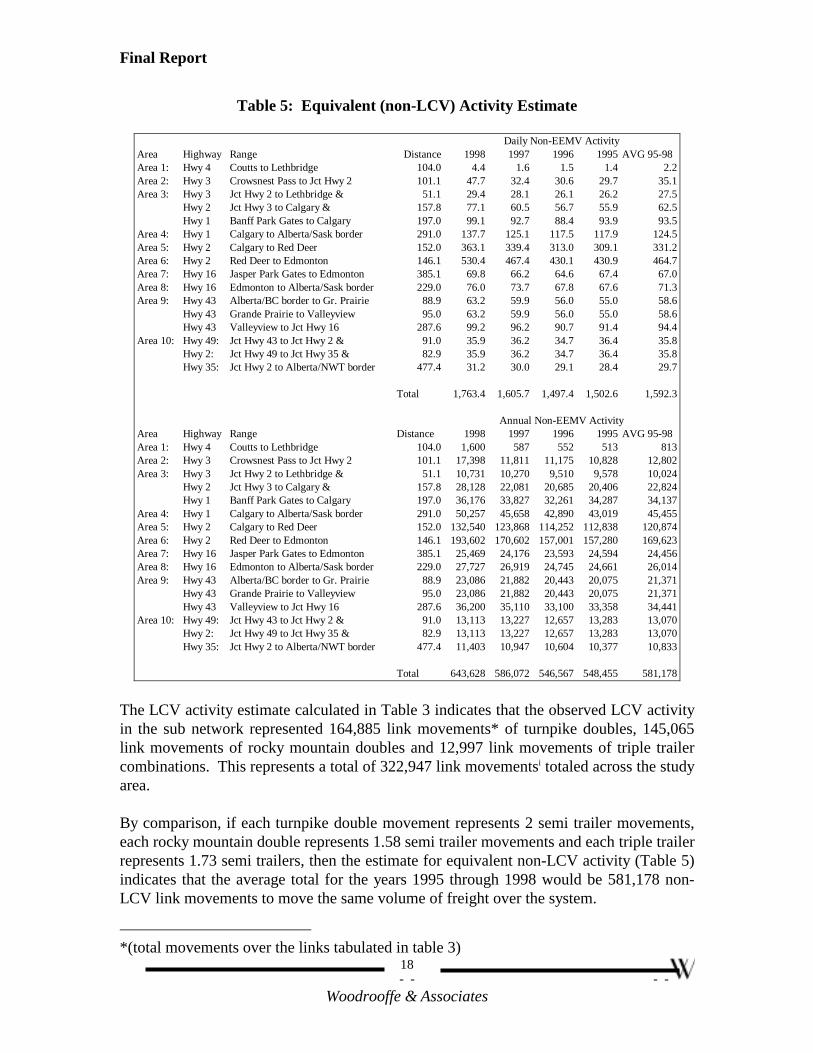
Table 5 presents the equivalent non-LCV activity estimate prepared on the basis of theforegoing non-LCV load equivalency factors.
Final Report
- - - - Woodrooffe & Associates
18
Table 5: Equivalent (non-LCV) Activity Estimate
Daily Non-EEMV ActivityArea Highway Range Distance 1998 1997 1996 1995 AVG 95-98Area 1: Hwy 4 Coutts to Lethbridge 104.0 4.4 1.6 1.5 1.4 2.2Area 2: Hwy 3 Crowsnest Pass to Jct Hwy 2 101.1 47.7 32.4 30.6 29.7 35.1Area 3: Hwy 3 Jct Hwy 2 to Lethbridge & 51.1 29.4 28.1 26.1 26.2 27.5
Hwy 2 Jct Hwy 3 to Calgary & 157.8 77.1 60.5 56.7 55.9 62.5Hwy 1 Banff Park Gates to Calgary 197.0 99.1 92.7 88.4 93.9 93.5
Area 4: Hwy 1 Calgary to Alberta/Sask border 291.0 137.7 125.1 117.5 117.9 124.5Area 5: Hwy 2 Calgary to Red Deer 152.0 363.1 339.4 313.0 309.1 331.2Area 6: Hwy 2 Red Deer to Edmonton 146.1 530.4 467.4 430.1 430.9 464.7Area 7: Hwy 16 Jasper Park Gates to Edmonton 385.1 69.8 66.2 64.6 67.4 67.0Area 8: Hwy 16 Edmonton to Alberta/Sask border 229.0 76.0 73.7 67.8 67.6 71.3Area 9: Hwy 43 Alberta/BC border to Gr. Prairie 88.9 63.2 59.9 56.0 55.0 58.6
Hwy 43 Grande Prairie to Valleyview 95.0 63.2 59.9 56.0 55.0 58.6Hwy 43 Valleyview to Jct Hwy 16 287.6 99.2 96.2 90.7 91.4 94.4
Area 10: Hwy 49: Jct Hwy 43 to Jct Hwy 2 & 91.0 35.9 36.2 34.7 36.4 35.8Hwy 2: Jct Hwy 49 to Jct Hwy 35 & 82.9 35.9 36.2 34.7 36.4 35.8Hwy 35: Jct Hwy 2 to Alberta/NWT border 477.4 31.2 30.0 29.1 28.4 29.7
Total 1,763.4 1,605.7 1,497.4 1,502.6 1,592.3
Annual Non-EEMV ActivityArea Highway Range Distance 1998 1997 1996 1995 AVG 95-98Area 1: Hwy 4 Coutts to Lethbridge 104.0 1,600 587 552 513 813Area 2: Hwy 3 Crowsnest Pass to Jct Hwy 2 101.1 17,398 11,811 11,175 10,828 12,802Area 3: Hwy 3 Jct Hwy 2 to Lethbridge & 51.1 10,731 10,270 9,510 9,578 10,024
Hwy 2 Jct Hwy 3 to Calgary & 157.8 28,128 22,081 20,685 20,406 22,824Hwy 1 Banff Park Gates to Calgary 197.0 36,176 33,827 32,261 34,287 34,137
Area 4: Hwy 1 Calgary to Alberta/Sask border 291.0 50,257 45,658 42,890 43,019 45,455Area 5: Hwy 2 Calgary to Red Deer 152.0 132,540 123,868 114,252 112,838 120,874Area 6: Hwy 2 Red Deer to Edmonton 146.1 193,602 170,602 157,001 157,280 169,623Area 7: Hwy 16 Jasper Park Gates to Edmonton 385.1 25,469 24,176 23,593 24,594 24,456Area 8: Hwy 16 Edmonton to Alberta/Sask border 229.0 27,727 26,919 24,745 24,661 26,014Area 9: Hwy 43 Alberta/BC border to Gr. Prairie 88.9 23,086 21,882 20,443 20,075 21,371
Hwy 43 Grande Prairie to Valleyview 95.0 23,086 21,882 20,443 20,075 21,371Hwy 43 Valleyview to Jct Hwy 16 287.6 36,200 35,110 33,100 33,358 34,441
Area 10: Hwy 49: Jct Hwy 43 to Jct Hwy 2 & 91.0 13,113 13,227 12,657 13,283 13,070Hwy 2: Jct Hwy 49 to Jct Hwy 35 & 82.9 13,113 13,227 12,657 13,283 13,070Hwy 35: Jct Hwy 2 to Alberta/NWT border 477.4 11,403 10,947 10,604 10,377 10,833
Total 643,628 586,072 546,567 548,455 581,178
The LCV activity estimate calculated in Table 3 indicates that the observed LCV activityin the sub network represented 164,885 link movements* of turnpike doubles, 145,065link movements of rocky mountain doubles and 12,997 link movements of triple trailercombinations. This represents a total of 322,947 link movementsi totaled across the studyarea.
By comparison, if each turnpike double movement represents 2 semi trailer movements,each rocky mountain double represents 1.58 semi trailer movements and each triple trailerrepresents 1.73 semi trailers, then the estimate for equivalent non-LCV activity (Table 5)indicates that the average total for the years 1995 through 1998 would be 581,178 non-LCV link movements to move the same volume of freight over the system.
*(total movements over the links tabulated in table 3)
Final Report
- - - - Woodrooffe & Associates
19
Thus, to move the same freight as that carried by LCVs (during an average year between1995 and 1998) the replacement non-LCV truck traffic would increase by 80%, or anincrease in the number of trucking movements of 1.8 over the base estimate (581,178/322,947). This figure represents a blended average of the link movements tabulated forrocky mountain doubles, turnpike doubles and triple trailers in Table 3, compared withthe movements estimated in Table 5 based on “useable floor length” ratios of therespective vehicle combinations.
5. ECONOMIC EFFICIENCY OF LONG COMBINATION VEHICLES
Shippers require access to efficient and low cost transportation services for moving theirproducts to market or receiving inputs for production in what has become a verycompetitive and integrated world economy. Surface transportation of goods (by truck andrail) tends to be more expensive than water shipments and hence, for a land lockedjurisdiction such as Alberta, exporting industries and consumers of goods require thetruck and rail carriers to provide efficient service. Without this, access to markets willshrink and job losses will occur. Furthermore, in the absence of efficiency, costs forconsumer goods would rise.
To clarify the foregoing issues, we need to consider issues related to efficiency.Economists sometimes discuss “efficiency” in the context of two important types:technical efficiency and allocative efficiency.
5.1. Technical and Allocative Efficiency
Technological efficiency means getting the most output from a given set of inputs(productivity). This is largely a micro economic concept that relates output to productivityof input factors of labour, capital and total factor productivity of the particular process orfirm. In the case of LCV’s this report calculates the various technical efficiencyimprovements that have been achieved and which benefit shippers of goods andconsumers in the form of lower transportation costs. Further “non user” technicalefficiencies are identified in the form of lesser axle loads to move the same volume offreight and reduced fuel use and green house gas emissions are also tracked for the mode.
.

Final Report
- - - - Woodrooffe & Associates
20
The concept of “allocative” efficiency is more of a macro economic viewpoint that takesaccount of the over-all economy – not just the individual truck or rail firm. In thisframework, allocative efficiency is said to be achieved when each sector of the economyis producing the best combination of outputs, using the lowest-cost combination ofinputs. From a transportation sector perspective, both competition and modalcomplementarily contribute to allocative efficiency. This is particularly true for LCV’swhere the benefits compared on a cost per tonne-km basis are likely to be exceeded interms of the impact of “shipment cube” – as the LCV configurations tend to “cube out”rather than “weight out” in terms of the shipments being carried.
Beyond the simple “trucking cost efficiency” aspect of the supply chain, the use of LCV’sis sometimes related to elimination of “rehandle”, or “cross docking” of shipments in thesituation where the shorter pups are moved in linehaul formation on the highway – thenused locally, for individual pick up and delivery work – as often occurs with triple trailercombinations, for example. Within the LCV configurations, the choice of using a RockyMountain Double, a Triple or a Turnpike Double configuration can relate to specificdistribution / demand patterns for the business – with the ability to split up the train fordifferent customer locations, or it may reflect the allowable size of unit (eg. the two lanehighway segments were the only permitted LCV configuration is the Rocky MountainDouble) or annual dedicated traffic and desired schedule frequency for service.
Thus, when the trucking mode functions efficiently, within itself, customers have accessto a set of competitive “best choices” or complementary (eg. intermodal) services orsystems. This leads to maximization of production and efficiency of the economy, overall. In a related study, for example, in the province of Saskatchewan, it was shown thatthe availability of economical trucking services can benefit shippers who are not evenusing truck – by creating a competitive alternative that the railway companies need tomatch, in terms of pricing their services.
For Western Canadian and US shippers, LCV trucks have different yet complementarycharacteristics, to serve their users’ transportation needs. Combined properly and withother modes of transport, LCVs can maximize overall efficiency with seamless servicesbenefiting all transportation users. Truck freight involves high-value goods, perishables(e.g., frozen meats, fruit and vegetables), or time sensitive delivery (e.g., "just-in-time" or"quick response" inventories).
5.2. Evaluation of Movement Costs as Long Combination Vehicles
LCV movements costs were calculated using the estimate of 1) total annual vehicleactivity within the sub network; 2) the traffic survey information (AADT) factoredaccording to the trucking survey classification counts; and 3) the Trimac Costing Model.The “average year” vehicle movement results are summarized in Table 6 below.

Final Report
- - - - Woodrooffe & Associates
21
Table 6 reveals that the LCV movements in the Alberta sub network annually total58,557,062 kilometers of truck travel by the various LCV configurations. The total costs(fixed and variable) of this activity is estimated to be $104.3 million dollars annually.This represents a total cost of $1.78 per kilometer driven, (blended across LCVconfigurations) with an hourly operating cost of $74.45 for the LCV truck configuration.
Table 6: Over-All Costs of LCV Movements in the Study AreaCASE: AVG 1995-1998 All Trucking (Using EEMV's) No. Item $/Dist $/hr % Rev $Total
1 Power: Driver $0.58 $24.29 32.60% $34,031,928 --Overtime (Subtotal) $0.04 $1.70 2.30% $2,381,829 --Burden (Subtotal) $0.12 $4.86 6.50% $6,806,252
2 Power: Fuel $0.27 $11.14 15.00% $15,601,2043 Power: Repairs $0.06 $2.56 3.40% $3,583,3354 Power: Cleaning $0.00 $0.19 0.20% $259,4585 Power: Transport $0.01 $0.37 0.50% $518,9176 Power: Tires $0.02 $0.99 1.30% $1,387,5347 Power: Permits/Tolls8 POWER TOTAL VARIABLE: $0.95 $39.53 53.10% $55,382,3779 Power: Depreciation/Leasing $0.17 $7.26 9.80% $10,172,043
10 Power: Licenses $0.03 $1.12 1.50% $1,566,09111 Power: Interest $0.05 $1.99 2.70% $2,784,53712 POWER TOTAL FIXED: $0.25 $10.37 13.90% $14,522,67213 POWER TOTAL COST: $1.19 $49.89 67.00% $69,905,04914 Trailer: Repairs $0.06 $2.55 3.40% $3,566,15115 Trailer: Cleaning $0.01 $0.37 0.50% $523,88116 Trailer: Transport $0.01 $0.38 0.50% $531,32717 Trailer: Tires $0.03 $1.23 1.60% $1,719,08318 Trailer: Permits/Tolls19 TRAILER TOTAL VARIABLE: $0.11 $4.53 6.10% $6,340,44320 Trailer: Depreciation/Leasing $0.09 $3.67 4.90% $5,138,57721 Trailer: Licenses $0.01 $20,75722 Trailer: Interest $0.04 $1.45 2.00% $2,037,93023 TRAILER TOTAL FIXED: $0.12 $5.14 6.90% $7,197,26424 TRAILER TOTAL COST: $0.23 $9.66 13.00% $13,537,70725 Insurance Cost (Variable) $0.06 $2.61 3.50% $3,650,62126 Other Costs (Variable)27 Other Costs (Fixed)28 TOTAL VARIABLE $1.12 $46.66 62.70% $65,373,44029 TOTAL FIXED $0.37 $15.50 20.80% $21,719,93630 TOTAL DIRECT COST $1.49 $62.16 83.50% $87,093,37731 Administration $0.21 $8.56 11.50% $11,994,89632 P R O F I T $0.09 $3.72 5.00% $5,215,17233 G R A N D T O T A L $1.78 $74.45 100.00% $104,303,44534 Origin A L L 35 Destination A L L 36 Product A L L 37 Quantity 322,94738 Payload 139 Driven Distance/Trip 181.340 Round Trip Hours 4.341 No. of Trips 322,94742 Total Distance 58,557,062
Following Table 7, provides a breakdown of the aggregate LCV activity, shown in Table6, for each of the individual LCV configuration types investigated in the traffic mix.
Final Report
- - - - Woodrooffe & Associates
22
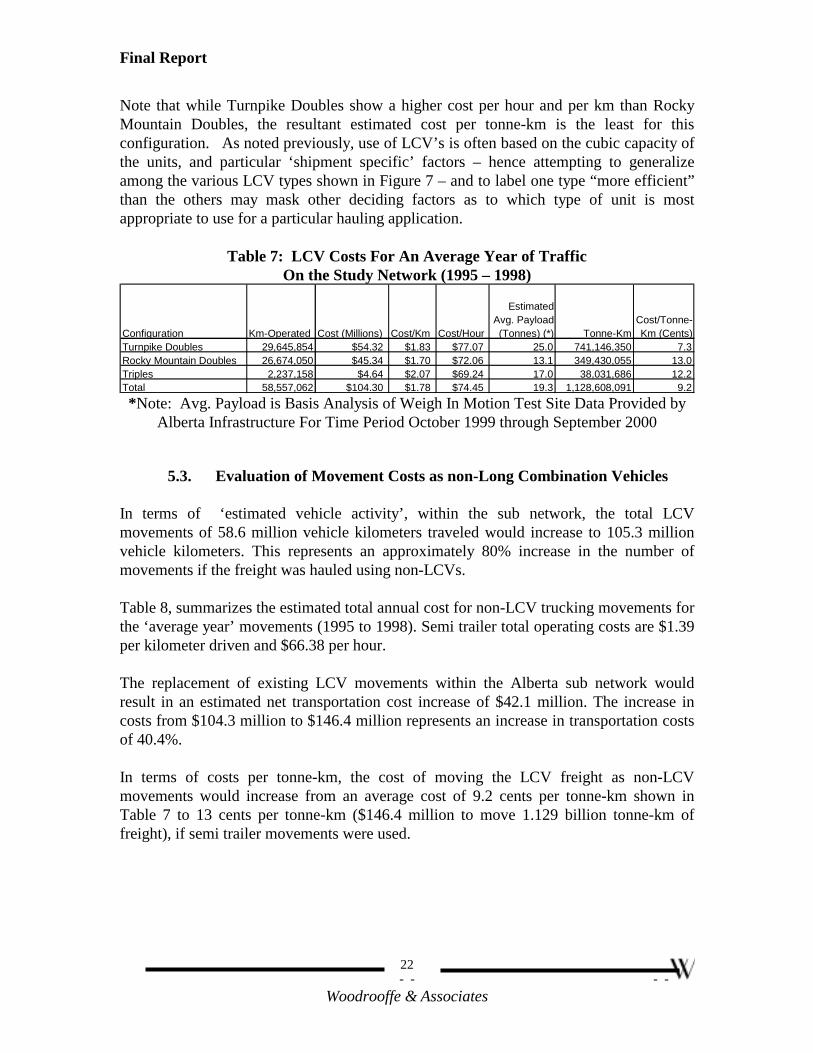
Note that while Turnpike Doubles show a higher cost per hour and per km than RockyMountain Doubles, the resultant estimated cost per tonne-km is the least for thisconfiguration. As noted previously, use of LCV’s is often based on the cubic capacity ofthe units, and particular ‘shipment specific’ factors – hence attempting to generalizeamong the various LCV types shown in Figure 7 – and to label one type “more efficient”than the others may mask other deciding factors as to which type of unit is mostappropriate to use for a particular hauling application.
Table 7: LCV Costs For An Average Year of TrafficOn the Study Network (1995 – 1998)
*Note: Avg. Payload is Basis Analysis of Weigh In Motion Test Site Data Provided byAlberta Infrastructure For Time Period October 1999 through September 2000
5.3. Evaluation of Movement Costs as non-Long Combination Vehicles
In terms of ‘estimated vehicle activity’, within the sub network, the total LCVmovements of 58.6 million vehicle kilometers traveled would increase to 105.3 millionvehicle kilometers. This represents an approximately 80% increase in the number ofmovements if the freight was hauled using non-LCVs.
Table 8, summarizes the estimated total annual cost for non-LCV trucking movements forthe ‘average year’ movements (1995 to 1998). Semi trailer total operating costs are $1.39per kilometer driven and $66.38 per hour.
The replacement of existing LCV movements within the Alberta sub network wouldresult in an estimated net transportation cost increase of $42.1 million. The increase incosts from $104.3 million to $146.4 million represents an increase in transportation costsof 40.4%.
In terms of costs per tonne-km, the cost of moving the LCV freight as non-LCVmovements would increase from an average cost of 9.2 cents per tonne-km shown inTable 7 to 13 cents per tonne-km ($146.4 million to move 1.129 billion tonne-km offreight), if semi trailer movements were used.
Configuration Km-Operated Cost (Millions) Cost/Km Cost/Hour
Estimated Avg. Payload (Tonnes) (*) Tonne-Km
Cost/Tonne-Km (Cents)
Turnpike Doubles 29,645,854 $54.32 $1.83 $77.07 25.0 741,146,350 7.3Rocky Mountain Doubles 26,674,050 $45.34 $1.70 $72.06 13.1 349,430,055 13.0Triples 2,237,158 $4.64 $2.07 $69.24 17.0 38,031,686 12.2Total 58,557,062 $104.30 $1.78 $74.45 19.3 1,128,608,091 9.2

Final Report
- - - - Woodrooffe & Associates
23
Table 8: Costs of non-LCV Movements on Study NetworkCASE: AVG 1995-1998 All Trucking (Using Semi's) No. Item $/Dist $/hr % Rev $Total
1 Power: Driver $0.49 $23.24 35.00% $51,245,546 --Overtime (Subtotal) $0.04 $1.70 2.60% $3,749,327 --Burden (Subtotal) $0.10 $4.65 7.00% $10,248,974
2 Power: Fuel $0.22 $10.43 15.70% $23,004,8233 Power: Repairs $0.06 $2.74 4.10% $6,051,9134 Power: Cleaning $0.00 $0.19 0.30% $408,4235 Power: Transport $0.00 $0.19 0.30% $408,4236 Power: Tires $0.02 $0.89 1.30% $1,973,6057 Power: Permits/Tolls8 POWER TOTAL VARIABLE: $0.79 $37.68 56.80% $83,092,7349 Power: Depreciation/Leasing $0.14 $6.52 9.80% $14,376,505
10 Power: Licenses $0.01 $0.61 0.90% $1,347,79711 Power: Interest $0.04 $1.78 2.70% $3,935,48312 POWER TOTAL FIXED: $0.19 $8.91 13.40% $19,659,78513 POWER TOTAL COST: $0.98 $46.59 70.20% $102,752,51914 Trailer: Repairs $0.06 $2.63 4.00% $5,790,61315 Trailer: Cleaning $0.00 $0.19 0.30% $408,42316 Trailer: Transport $0.00 $0.19 0.30% $408,42317 Trailer: Tires $0.02 $0.92 1.40% $2,039,99618 Trailer: Permits/Tolls19 TRAILER TOTAL VARIABLE: $0.08 $3.92 5.90% $8,647,45620 Trailer: Depreciation/Leasing $0.04 $1.85 2.80% $4,084,23421 Trailer: Licenses $0.01 $16,33722 Trailer: Interest $0.02 $0.73 1.10% $1,619,78423 TRAILER TOTAL FIXED: $0.05 $2.59 3.90% $5,720,35624 TRAILER TOTAL COST: $0.14 $6.51 9.80% $14,367,81125 Insurance Cost (Variable) $0.05 $2.32 3.50% $5,124,01426 Other Costs (Variable)27 Other Costs (Fixed)28 TOTAL VARIABLE $0.92 $43.92 66.20% $96,864,20429 TOTAL FIXED $0.24 $11.51 17.30% $25,380,14130 TOTAL DIRECT COST $1.16 $55.43 83.50% $122,244,34531 Administration $0.16 $7.63 11.50% $16,836,04732 P R O F I T $0.07 $3.32 5.00% $7,320,02133 G R A N D T O T A L $1.39 $66.38 100.00% $146,400,41334 Origin A L L 35 Destination A L L 36 Product A L L 37 Quantity 581,17938 Payload 139 Driven Distance/Trip 181.140 Round Trip Hours 3.841 No. of Trips 581,17942 Total Distance 105,255,125

Final Report
- - - - Woodrooffe & Associates
24
5.4. LCVs and Non-LCVs Comparisons Summarized
5.4.1. Annual Cost Comparison
The estimated annual total cost of hauling freight using LCVs compared to non-LCVs,with the sub network, is provided in Table 9. The table also includes an estimate of the‘average year’ vehicle activity for the period 1995 to 1998.
Table 9: Comparison of Hauling Using LCVs and non-LCVsby Individual Year on the Study Network
Year
Total EEMV Cost (Million
$)
Annual Kilometers as
EEMV's (Millions)
Total non-EEMV Cost (Million $)
Annual Kilometers as non-EEMV's
(Millions)
Annual Transportation Savings Due to
EEMV's (Million $)
Percent Cost Savings Over non-EEMV's
Truck-Km Saved
(Millions)
Percent Reduction in Truck-Km
AVG 1995-1998 104.3$ 58.6 146.4$ 105.3 42.1$ 28.8% 46.7 44.3%1998 114.8$ 64.3 161.1$ 115.6 46.3$ 28.7% 51.3 44.4%1997 105.1$ 59 147.6$ 106.1 42.5$ 28.8% 47.1 44.4%1996 98.4$ 55.3 138.1$ 99.4 39.7$ 28.7% 44.1 44.4%1995 98.9$ 55.6 138.8$ 99.9 39.9$ 28.7% 44.3 44.3%
Table 9 illustrates that the use of LCVs, for all of the individual years of traffic data,results in a similar level of economic efficiency gain. At current traffic levels, the annualsavings to shippers from use of these vehicles appears to total approximately $40 million.The cost saving to shippers is in the order of 29% -- representing a reduction in averagecost per tonne-km from 13 cents to approximately 9.2 cents.
Within the sub network, LCV traffic represented a 44% reduction over traffic levels if thevehicle movements occurred in non-LCVs trucks.
5.4.2. Fuel Efficiency
Table 10: Fuel Use and Greenhouse Gas Emission Comparisons on Study Location
Year
Fuel Expenditure for EEMV Operations
Litres of Fuel Used For EEMV Operations
Fuel Expenditure (non-EEMV)
Litres of Fuel (non-EEMV Operations)
Reduction in Fuel Use (Litres)
% Energy (and Greenhouse Gas
Emissions Reduction)
Average 1995-1998 15,601,204$ 31,202,408 23,004,823$ 46,009,646 14,807,238 32.2%1998 17,137,384$ 34,274,768 25,273,171$ 50,546,342 16,271,574 32.2%1997 15,723,739$ 31,447,478 23,187,324$ 46,374,648 14,927,170 32.2%1996 14,732,082$ 29,464,164 21,719,142$ 43,438,284 13,974,120 32.2%1995 14,812,052$ 29,624,104 21,840,704$ 43,681,408 14,057,304 32.2%
The Trimac Motor Carrier Cost Model computes, as one element of operating costs fortrucks, the fuel utilized in undertaking hauls. As noted in Table 13, the use of LCVs issignificantly reducing the fuel used for truck transportation and the greenhouse gasemissions associated with this activity by approximately 15 million liters of diesel fuelannually, a reduction of 32% for the movements currently undertaken on the studynetwork location.

Final Report
- - - - Woodrooffe & Associates
25
5.4.3. Wear on Road Pavement Surfaces
A significant agent in the wear on road surfaces is the impact of motor vehicle traffic andthe repetitive loading of road pavements by the passage of heavier vehicles such as trucksand buses. This is in addition the impact of weather (principally frost action as road subbases expand and contract).
The repetitive effect of “wheel passes” from heavier vehicles, contributes to whatengineers refer to as a “fatigue failure” of the pavement structure from these loads. Thefailure often takes the form of:
• Rutting. This is where the road surface deteriorates through repetitive compressing ofthe road materials in the “wheel paths” followed by the various vehicles in the lane.
• Cracking. This is where the road surface suffers cracks that are longitudinal to theroadway – often along the ruts.
Both of the foregoing factors work to accelerate the “weathering” process, because theruts frequently become collectors of meltwater and rainwater and the cracks become ameans for moisture to enter the roadway structure – thereby accelerating further roaddamage through erosion and frost action (expansion and contraction of the watercontained in the roadway).
As with the fatigue failure in other structures, engineers relate the fatigue damage topavements to the magnitude of wheel loads as well as the number of load repetitions overthe life of the pavement. To reflect the “mix” of passenger cars, small trucks, largertrucks of various sizes and buses, the effect of all motor vehicles is reflected in themeasure of each vehicle’s impact expressed as a number of standardized ESALs(Equivalent Single Axle Loads). In this approach, every vehicle has an ESALequivalency, and the total ESALs from all vehicles are “summed” for purposes ofestimating road fatigue damage. Hence, the measure / estimation of ESAL passesdirectly reflects the anticipated “wear” on the road structure from the vehicles passingover it.
While the foregoing measure is appropriate for considering the expected damage on aparticular section of roadway, when doing “system comparisons” for all the study locationhighway links mapped in Figure 4, the appropriate comparison to make is in terms of the“ESAL-km” of activity generated – that is the equivalent number of single axlesmultiplied times the distance traveled by these equivalent axles over the study locationroadways.
Final Report
- - - - Woodrooffe & Associates
26
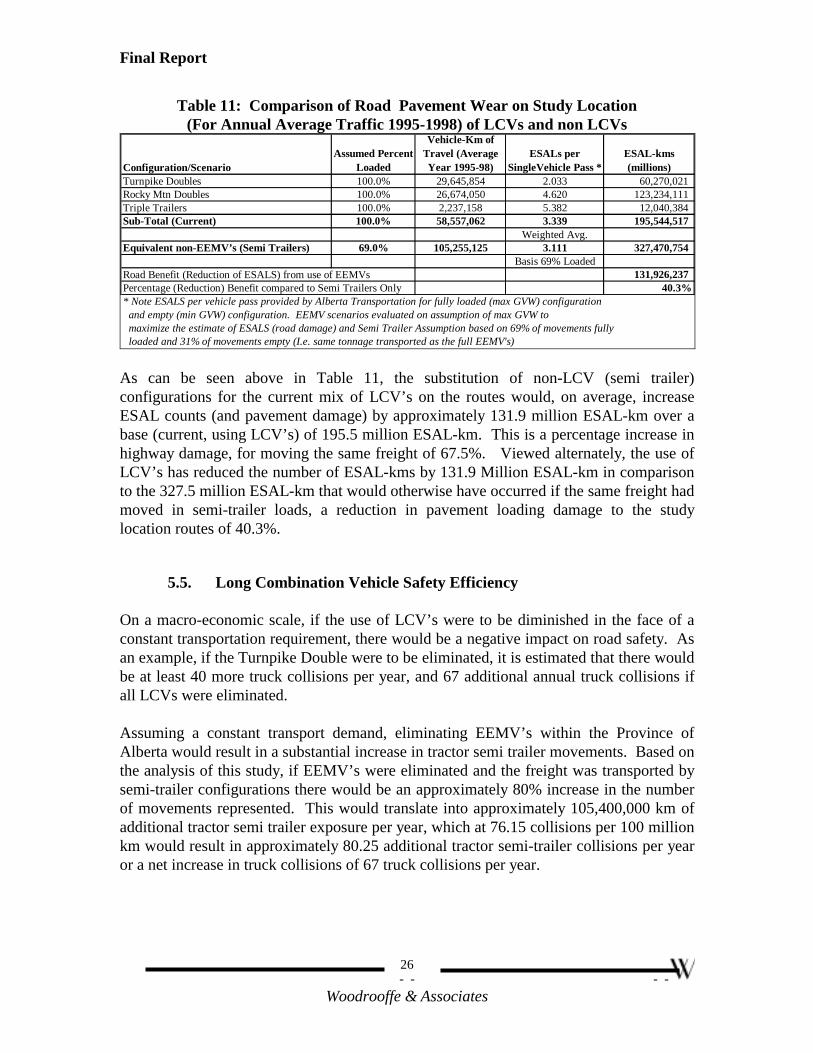
Table 11: Comparison of Road Pavement Wear on Study Location(For Annual Average Traffic 1995-1998) of LCVs and non LCVs
Configuration/ScenarioAssumed Percent
Loaded
Vehicle-Km of Travel (Average Year 1995-98)
ESALs per SingleVehicle Pass *
ESAL-kms (millions)
Turnpike Doubles 100.0% 29,645,854 2.033 60,270,021 Rocky Mtn Doubles 100.0% 26,674,050 4.620 123,234,111 Triple Trailers 100.0% 2,237,158 5.382 12,040,384 Sub-Total (Current) 100.0% 58,557,062 3.339 195,544,517
Weighted Avg.Equivalent non-EEMV’s (Semi Trailers) 69.0% 105,255,125 3.111 327,470,754
Basis 69% LoadedRoad Benefit (Reduction of ESALS) from use of EEMVs 131,926,237 Percentage (Reduction) Benefit compared to Semi Trailers Only 40.3%* Note ESALS per vehicle pass provided by Alberta Transportation for fully loaded (max GVW) configuration and empty (min GVW) configuration. EEMV scenarios evaluated on assumption of max GVW to maximize the estimate of ESALS (road damage) and Semi Trailer Assumption based on 69% of movements fully loaded and 31% of movements empty (I.e. same tonnage transported as the full EEMV's)
As can be seen above in Table 11, the substitution of non-LCV (semi trailer)configurations for the current mix of LCV’s on the routes would, on average, increaseESAL counts (and pavement damage) by approximately 131.9 million ESAL-km over abase (current, using LCV’s) of 195.5 million ESAL-km. This is a percentage increase inhighway damage, for moving the same freight of 67.5%. Viewed alternately, the use ofLCV’s has reduced the number of ESAL-kms by 131.9 Million ESAL-km in comparisonto the 327.5 million ESAL-km that would otherwise have occurred if the same freight hadmoved in semi-trailer loads, a reduction in pavement loading damage to the studylocation routes of 40.3%.
5.5. Long Combination Vehicle Safety Efficiency
On a macro-economic scale, if the use of LCV’s were to be diminished in the face of aconstant transportation requirement, there would be a negative impact on road safety. Asan example, if the Turnpike Double were to be eliminated, it is estimated that there wouldbe at least 40 more truck collisions per year, and 67 additional annual truck collisions ifall LCVs were eliminated.
Assuming a constant transport demand, eliminating EEMV’s within the Province ofAlberta would result in a substantial increase in tractor semi trailer movements. Based onthe analysis of this study, if EEMV’s were eliminated and the freight was transported bysemi-trailer configurations there would be an approximately 80% increase in the numberof movements represented. This would translate into approximately 105,400,000 km ofadditional tractor semi trailer exposure per year, which at 76.15 collisions per 100 millionkm would result in approximately 80.25 additional tractor semi-trailer collisions per yearor a net increase in truck collisions of 67 truck collisions per year.
Final Report
- - - - Woodrooffe & Associates
27
On a micro-economic scale, the LCV configurations enable the transport carriers toamortize the costs associated with complying with the LCV permit process and operatingrequirements over a larger vehicle payload and thus reduces the cost.
6. CONCLUSIONS
6.1. Literature Review of Related Work
Before presenting results of the consultant’s investigation of truck transportation costsavings from using LCVs, it is useful to review what the published literature has to sayabout the subject.
A recent study by Martin Marietta Energy Systems Inc., for the U.S. Department ofEnergy and the Federal Highway Administration of the U.S. Department ofTransportation is on the Internet at http://www.bts.gov/ntl/DOCS/pets.html. It is entitled,“The Productivity Effects of Truck Size and Weight Policies”. In this report, theprincipal findings, of relevance to the current undertaking, are as follows:
“A major finding of the study is that, in most cases, use of LCVs wouldhave a significant favorable impact on the annual total logistics cost oftruckload shippers. Savings in annual total logistics cost as high as• 59 percent for turnpike doubles and• 52 percent for Rocky Mountain doubles were observed.”
6.2. Alberta Long Combination Vehicle Efficiency Findings
The ability to efficiently use LCVs in the truck sector has been demonstrated to enhancethe direct economic cost by 29% and the fuel efficiency by 32% for the trucking mode. Itwas further demonstrated to minimize greenhouse gas emissions and result in a 40%reduction in pavement wear on highways infrastructure from trucking movements ofgoods, in comparison to smaller, standard legal semi-trailer truck hauling of the samevolume of goods.

Final Report
- - - - Woodrooffe & Associates
28
In addition to the impact on highway infrastructure, this concern was echoed by theCanadian Transportation Climate Change Table. In the Delcan Report, prepared withassistance of KPMG and A.K. Socio-Technical Consultants, October 1999, entitled,“Assessment of Modal Integration and Modal Shift Opportunities”, it was stated,concerning LCVs:
“The introduction of longer combination vehicles (LCVs) was alsoconsidered to have the potential to reduce GHG emissions. However, itmust be demonstrated that rail traffic would not shift to truck in sufficientvolume which would offset any gains in GHG emission reductions as aresult of this opportunity.”.
In these investigations, the consultant has compared the efficiency of moving theestimated annual quantity of freight, as currently moved in LCV configurations, tostandard legal semi trailer movements, for a study area (see Section 2.1, Figure 6) inAlberta. The efficiency comparisons reflect measured traffic samples from AADTsurvey statistics for the years 1995 through 1998 inclusive, classified on the basis of theCCMTA July 1999 commercial vehicle survey, to estimate the current numbers of LCVmovements.
� Increased Fuel Efficiency, Reduced Greenhouse Gas Emissions andDecreased Truck Traffic for LCV’s
For the study area, in an average year (1995-1998), the reduction in diesel fuelconsumption through use of Energy Efficient Motor Vehicles (LCV’s) is estimated at14.8 million liters of fuel annually in comparison to the computed requirements formoving the same freight in non-LCV semi trailer units. This is a 32.2% reduction, from46 million to 31.2 million liters of diesel fuel consumed annually in the study location.
Expressed in terms of greenhouse gas emissions, there is a proportional corresponding(32.2%) of emissions, from using LCVs rather than a non-LCV truck.

Final Report
- - - - Woodrooffe & Associates
29
The use of smaller, standard semi trailer configurations is estimated to increase the studyarea trucking movement numbers by approximately 80 percent, from 58.6 million truckkilometers to 105.3 million kilometers annually, for an average year in this time period.For each individual year in this timeframe, the annual traffic comparisons are ofcomparable magnitude. For the study area in question, the sampled numbers of LCVmovements are seen to represent substantial efficiency gains as compared to use ofsmaller, standard configuration vehicles, namely:
� Lower Economic Costs for Shippers and Consumers as a result of LCV Use.
In terms of economic costs of trucking borne by freight shippers, over the study area, foran average year, the annual cost increase is estimated to be $42.1 million to move thesame freight as non-LCV semi trailer units. This increased cost represents a 40 %increase for Alberta transportation users, from $104.3 million annually to $146.4 millionfor freight movements in the study location. On a per tonne-km basis, the freightmovement cost would increase from 9.2 cents per tonne-km to 13 cents.
Interestingly, this estimate is somewhat lower than the estimates published by U.S.researchers (see Section 3.1, Martin Marietta Energy Systems, for the U.S. DOT.),projecting savings of between 52 and 59 percent to be gained from implementation ofRocky Mountain Doubles, or Turnpike Doubles applications.
Although not as high as the U.S. researcher’s estimated savings, the freight transportationsavings developed herein represent a substantial efficiency gain from use of LCV’s.
� Reduced Roadway Infrastructure Costs and Pavement DeteriorationThrough the Use of LCVs.
Expected fatigue wear from truck axle loadings is estimated, by pavement designers, onthe basis of the number of ESAL’s (Equivalent Single Axle Loads) passing over a givenstretch of roadway in a given period of time.
For the study area outlined in Section 2.1 (see Figure 6), if the current freight movementsin LCV’s are fully loaded (scenario for most damage to roadways from LCV’s), thisrepresents a pavement loading scenario of 195.5 million average annual ESAL-kilometerson the system. When the same tonnage of freight is moved in smaller, non-LCV semitrailer loadings, (shown in section 2.3 to represent an 80% increase in the number of truckmovements) the ESAL-kilometers of pavement loading increase to 327.5 million ESAL-kilometers annually for the study area. This represents an increase in the expected ESALloadings of 40.3% and is expected to result in an acceleration of pavement wear(reduction in pavement life due to truck traffic) of 40.3%.

Final Report
- - - - Woodrooffe & Associates
I
7. APPENDIX A: DETAILED TRAFFIC ESTIMATES BY STUDY AREAHIGHWAY SECTION
The Data Collection Form for Truck Counts (1999 CCMTA Survey)
Source: Alberta Infrastructure