effects of different irrigation methods and plant density...
TRANSCRIPT

159
http://journals.tubitak.gov.tr/agriculture/
Turkish Journal of Agriculture and Forestry Turk J Agric For(2014) 38: 159-168© TÜBİTAKdoi:10.3906/tar-1302-36
Effects of different irrigation methods and plant density on silageyield and yield components of PR 31Y43 hybrid corn cultivar
Muhammet KARAŞAHİN*Department of Plant and Animal Production, Karabük University Eskipazar Vocational School, Karabük, Turkey
* Correspondence: [email protected]
1. IntroductionNutrition is the most important need of humans. The nutrition problem increases day by day, in parallel with the increase in world population. Although there is no shortage of food in Turkey, a nutritional imbalance exists based on grains. Animal-based food is of high importance for sufficient and balanced human nutrition. Turkey has high potential in livestock, but the desired animal production has not yet been reached (Tükel and Hatipoğlu, 1997). Corn is the most important silage plant that is capable of satisfying the demand for both concentrate feed and fodder. Concentrate feed requirements decrease by 33%–50% in animals that are fed with corn silage (Sade and Soylu, 2008). Corn is the most important plant grown for silage production both in Turkey and worldwide (Turgut, 2002).
The number of plants grown in each unit field is high in soils containing a sufficient amount of useful nutrients. An increase in the amount of nitrogen delivered with fertilizer allows more plants in each unit field and higher yield (Sencar, 1988). Most research detected that distances of the rows affected yield, and high and low plant densities
limit corn yield. As climate and soil properties are different from region to region, determining factors such as selection of a suitable variety, nitrogen dose, and planting density are very important for growing corn. A suitable plant density must be provided in order to obtain a high yield in corn production. Determining the optimum plant density in a manner that enables the plants to benefit from the available water, nutrients in the soil, and light energy is highly important for decreasing production costs (Kırtok, 1998). The yield and the quality of corn silage is related to the genotype, as well as factors such as climate and soil conditions, altitude, planting time, plant density, irrigation, and harvesting time (Cusicanqui and Lauer, 1999).
Today, there are no further opportunities to expand agricultural fields; thus, increasing the yield per unit field is the only way to increase agricultural production. It is possible to increase production 5-fold with irrigation; however, the decrease in water resources and the distortion of water quality due to rapid development limits irrigation in agriculture. The use of irrigation methods that conserve water, selection of drought resistant cultivars, and protection of water resources are important strategies for
Abstract: This study was conducted to determine the effects of different irrigation methods (drip I1, subsoil drip I2, and subsoil capillary I3) and different plant densities (102,040 plants ha–1, D1; 119,040 plants ha–1, D2; and 142,850 plants ha–1, D3) on the silage yield and yield components of PR 31Y43 hybrid corn cultivar (Zea mays L. indentata S.) in the years 2011 and 2012 under the ecological conditions of Eskipazar-Karabük. In both research years, the plant densities were statistically significant for stem diameter, fresh ear ratio, fresh plant weight, silage, and dry matter yield. The highest stem diameter, fresh ear ratio, and fresh plant weight values were obtained from D1 and D2 plant densities, and the highest silage and dry matter yields were obtained from D3 and D2 plant densities. Irrigation methods were statistically significant for fresh and dry plant weight in the second research year, and the highest values were obtained from drip irrigation. The I × D interactions were statistically significant for plant height in both research years, while they were statistically significant for number of leaves, stem diameter, fresh leaf ratio, fresh ear ratio, fresh plant weight, and silage yield in the second research year. The highest silage yield was obtained from I3 × D3 interaction. D3 and D2 plant densities in all 3 irrigation methods could be recommended for corn silage farmers. However, when water conservation is taken into consideration (I2, 7%; I3, 11%), subsoil irrigation becomes more important.
Key words: Drip irrigation, subsoil drip irrigation, subsoil capillary irrigation, Zea mays L., population density, forage yield
Received: 11.02.2013 Accepted: 04.09.2013 Published Online: 27.01.2014 Printed: 24.02.2014
Research Article

160
KARAŞAHİN / Turk J Agric For
supplying the food demand of an increasing population. Seventy-two percent of the water resources in Turkey are used in agriculture, 18% are used domestically, and 10% are used in the industrial sector. Turkey does not have a shortage of water, but it is one of the countries with limited water consumption. In order to supply the growing food needs of developed countries between the years 2000 and 2030, agricultural production must be increased by 67% and water consumption in agriculture must be decreased to 14% (TMMOB, 2009). Today, irrigation methods and systems that mitigate drainage and salinity problems in soil by decreasing irrigation water usage through more economic applications have become important (Aras, 2006). Arranging precise irrigation programs and using more effective irrigation methods are the best ways to increase yield while decreasing the amount of irrigation water used in agriculture. These problems have been partially solved with subsoil drip irrigation. However, in this method the emitters are plugged by the plant roots, and thus the use of chemical weed controllers becomes a necessity to prevent this problem. As a result, plant roots are damaged. A system called subsoil capillary irrigation was developed to prevent all these undesirable circumstances. This new irrigation system was used as a third irrigation method in our research. The aim of this study was to
determine the effects of different irrigation methods and plant densities on silage yield and yield components of the PR 31Y43 hybrid corn cultivar.
2. Materials and methods2.1. Experimental siteThe research was conducted in the research fields of Eskipazar Vocational High School in the years 2011 and 2012 under the ecological conditions of the district of Eskipazar in the province of Karabük, Turkey. The quality of the irrigation water that was used in the research was good (EC = 0.65 dS m–1, pH = 7.2). The Eskipazar district has a transition climate between the Black Sea and continental climates. Some of the climate data recorded in the Eskipazar district during the corn growing periods of the study years (2011–2012) and the long-term means (1985–2006) of these data are given in Table 1. It can be seen in Table 1 that the total rain and temperature means in 2011 and 2012 were slightly lower and slightly higher than the long-term means, respectively. Soil samples were taken from depths of 0–30 and 30–60 cm and analyzed to determine the physical and chemical properties of the research soils (Table 2). As seen in Table 2, the soils are clay-loam textured and the organic matter content is low (1.49%).
Table 1. Climatic data of the research location in the years 2011 and 2012 with long-term means (1985–2006) at Eskipazar, Turkey.
MonthsPrecipitation (mm) Mean temperature (°C) Relative humidity (%)
2011 2012 Long-term 2011 2012 Long-term 2011 2012 Long-term
May 68.4 68.2 57.1 13.4 15.4 14.3 73.9 66.7 60.2
Jun 54.8 21.8 54.8 16.9 20.2 17.9 72.3 58.7 60.8
Jul 8.2 51.4 24.8 21.6 22.6 20.9 63.1 57.7 55.4
Aug 17.0 48.0 22.9 19.9 19.9 21.1 62.0 59.9 53.9
Sep 4.4 6.0 21.6 17.1 18.7 16.3 57.4 54.7 57.5
Total/mean 152.8 195.4 181.2 17.8 19.4 18.1 65.7 59.5 57.6
Table 2. Physical and chemical soil properties of the research location, Eskipazar, Turkey.
Properties Depth (0–30 cm) Depth (30–60 cm) Properties Depth (0–30 cm) Depth (30–60 cm)
Sand (%) 38.0 36.0 pH 7.60 7.68
Silt (%) 20.0 21.0 Salt (%) 0.04 0.04
Clay (%) 42.0 43.0 Lime (%) 37.59 35.51
Texture class Clay-loam Clay-loam Field capacity (%), (v v–1) 32.37 30.97
Total N (kg ha–1) 0.34 0.32 Wilting point (%), (v v–1) 19.98 19.96
P2O5 (kg ha–1) 23.60 20.4 Bulk density (g cm–³) 1.23 1.22
K2O (kg ha–1) 170.10 120.5 Organic matter (%) 1.49 1.54

161
KARAŞAHİN / Turk J Agric For
2.2. Experimental method The hybrid corn cultivar PR 31Y43 (Zea mays L. indentata S.) was used in this study. Three different irrigation methods [drip (I1), subsoil drip (I2), and subsoil capillary (I3)] and 3 different plant densities [102,040 plants ha–1
(D1), 119,040 plants ha–1 (D2), and 142,850 plants ha–1 (D3)] were investigated. The experimental design was a randomized complete block in a split plot arrangement with 3 replications. The irrigation methods (I1, I2, and I3) to be placed on the main plots and the plant densities (D1, D2, and D3) to be placed in split plots were selected randomly. The split plot size was 2.8 × 5 m with 4 rows per plot. 2.3. Irrigation system design and applicationsThe Hydro PCND drip lines of the John Deere Company with 50 cm emitter spacing, 16 mm diameter, and a flow rate of 2.35 L h–1 for each emitter were used in the drip, subsoil drip, and subsoil capillary irrigation methods. When plants were 4–5-leafed, 3 different irrigation methods were applied to the plots. The drip lines were placed 1.4 m apart, and each drip line was centered between 2 corn rows spaced at 70 cm in the 3 irrigation methods. The drip lines were buried with an installation depth of 20 cm for the subsoil drip irrigation method. Capillary drip lines were buried as in the subsoil drip irrigation method. In the subsoil capillary irrigation system, drip lines were coated with dispersion material to allow uniform irrigation. This dispersion material consists of microfibers such as polypropylene, and its water holding and transmission capacity is very high compared to soil (Figure 1). Flowing water from drip line emitters contacts the dispersion material, and water is distributed uniformly via coated polyethylene film. Water transfer is provided from the surface of 2 united ends of this dispersion material to the soil by the principle of capillarity (Figure 2). Thus, uniform irrigation can be provided without using herbicides to prevent the clogging of emitters by plant roots. A time
domain reflectometry (TDR) device was used to measure soil moisture to determine the irrigation program during the research. This method is based on measuring the travel time between 2 points of the electromagnetic waves sent from a voltage source through metal bars buried in soil that are parallel to each other. To determine the relationship between volumetric soil moisture and TDR readings, a 40 × 70 × 25 cm plastic case was placed, and an undisturbed soil sample was taken from the research field and completely saturated with water. Later, undisturbed soil samples were taken periodically, and gravimetrical moisture estimates were made using an oven; these estimates were transformed into volumetric values and the related TDR readings were recorded (Figure 3). The irrigation began when consumption of 30% (25%–35%) of the readily available soil moisture versus TDR reading of 42 (39–45) was obtained. Water was supplied by the system by calculating the water amount in a manner designed to bring a 25-cm soil profile to field capacity before the stem elongation period and a 50-cm soil profile to field capacity after the stem elongation period. A TDR value of 55 was read against the field capacity (32.37%, v v–1), 42 (39–45) against 30% (25%–35%) consumption of readily available soil water (28.65% v v–1), and 25 against the permanent wilting point (19.98%,
Figure 1. Dispersion-material–coated drip lines.
Figure 2. Uniform water transfer in the subsoil capillary irrigation method.
40
40TDR values
y = 0.463x + 8.33R2 = 0.98
50 60
30
30
20
20Volu
met
ric so
il m
oistu
reco
nten
t (%
)
10
Figure 3. Relationship between volumetric soil moisture and TDR values.

162
KARAŞAHİN / Turk J Agric For
v v–1). TDR readings were made from a distance of 10 and 20 cm from the center of irrigation laterals and soil depths of 20 and 40 cm in all irrigation methods and plant density applications. The accuracy of the irrigation amount was controlled by TDR readings made 24 h after
irrigation. The irrigation amounts measured with water counters were recorded, and the total amounts used at the end of the season were defined. Although the number of irrigation sessions was equal, the amount of irrigation was different in all irrigation methods (Table 3).
Table 3. The dates and amounts of irrigation in 2011 and 2012 (mm).
2011 2012Dates I1 I2 I3 Dates I1 I2 I3
D1 D2 D3 D1 D2 D3 D1 D2 D3 D1 D2 D3 D1 D2 D3 D1 D2 D325.6 7.7 8.4 9.5 7.1 7.8 8.8 6.9 7.4 8.4 14.6 7.9 8.5 9.7 7.4 7.9 9.1 7.1 7.6 8.71.7 7.1 7.4 8.5 6.3 6.9 8.0 6.1 6.6 7.5 18.6 7.5 8.1 9.4 7.0 7.5 8.6 6.7 7.2 8.23.7 7.0 7.6 8.7 6.5 7.1 8.1 6.3 6.8 7.7 20.6 7.7 8.3 9.5 7.2 7.7 8.8 6.9 7.4 8.58.7 7.2 7.8 8.9 6.7 7.3 8.3 6.5 7.0 7.9 22.6 7.9 8.5 9.5 7.4 7.9 9.0 7.1 7.6 8.711.7 7.0 7.6 8.7 6.5 7.1 8.1 6.3 6.8 7.7 25.6 7.9 8.5 9.7 7.4 7.9 9.1 7.1 7.6 8.713.7 7.5 8.1 9.3 6.9 7.5 8.6 6.7 7.2 8.2 27.6 8.1 8.8 10.0 7.6 8.1 9.3 7.3 7.8 8.915.7 7.2 7.9 9.0 6.7 7.3 8.3 6.5 7.0 8.0 29.6 8.3 8.8 10.2 7.8 8.3 9.4 7.5 7.8 9.018.7 7.7 8.4 9.5 7.1 7.8 8.8 6.9 7.4 8.4 2.7 8.5 9.1 10.4 7.9 8.5 9.7 7.6 8.1 9.320.7 7.5 8.3 9.5 7.1 7.8 8.6 6.9 7.4 8.4 4.7 8.3 9.1 10.2 7.7 8.2 9.7 7.4 8.1 9.322.7 7.5 8.1 9.3 6.9 7.5 8.6 6.7 7.2 8.2 6.7 8.6 9.2 10.5 8.0 8.6 9.8 7.7 8.2 9.425.7 14.5 15.7 18.0 13.4 14.6 16.6 13.0 14.0 15.9 11.7 17.1 18.5 21.0 15.9 17.1 19.5 15.3 16.4 18.727.7 14.7 15.8 18.2 13.6 14.8 16.9 13.2 14.2 16.1 13.7 16.9 18.2 20.8 15.8 16.9 19.4 15.2 16.2 18.629.7 14.8 16.1 18.4 13.8 15.0 17.0 13.3 14.3 16.3 16.7 16.7 18.0 20.6 15.6 16.7 19.2 15.0 16.0 18.41.8 15.4 16.7 19.1 14.3 15.5 17.7 13.8 14.9 16.9 18.7 16.8 18.1 20.7 15.7 16.8 19.3 15.1 16.1 18.53.8 15.7 17.1 19.5 14.4 15.7 17.8 13.9 15.0 17.0 20.7 16.8 18.2 20.7 15.7 16.8 19.3 15.1 16.2 18.55.8 15.8 17.2 19.6 14.7 16.0 18.2 14.2 15.3 17.4 23.7 17.1 18.4 21.0 15.9 17.0 19.5 15.3 16.4 18.78.8 15.7 17.1 19.5 14.6 15.9 18.0 14.1 15.2 17.3 25.7 17.4 18.7 21.4 16.2 17.4 19.9 15.6 16.7 19.110.8 15.4 16.9 19.1 14.5 15.7 17.9 14.0 15.1 17.1 27.7 17.7 19.1 21.7 16.5 17.7 20.3 15.9 17.0 19.512.8 15.4 16.7 19.1 14.3 15.5 17.8 13.8 14.9 16.9 30.7 17.5 18.9 21.5 16.3 17.5 20.0 15.7 16.8 19.215.8 15.2 16.6 18.9 14.2 15.4 17.5 13.7 14.8 16.8 1.8 17.3 18.6 21.2 16.1 17.2 19.8 15.5 16.6 19.017.8 15.3 16.8 19.1 14.4 15.6 17.6 13.9 15.0 17.0 3.8 17.1 18.4 21.0 15.9 17.0 19.6 15.3 16.4 18.819.8 15.2 16.6 18.9 14.2 15.4 17.5 13.7 14.8 16.8 6.8 16.9 18.3 20.8 15.8 16.9 19.4 15.2 16.3 18.622.8 15.1 16.5 18.8 14.1 15.3 17.4 13.6 14.6 16.6 8.8 16.8 18.1 20.7 15.7 16.8 19.3 15.1 16.1 18.525.8 15.1 16.2 18.6 13.9 15.1 17.2 13.4 14.4 16.4 10.8 17.2 18.5 21.1 15.8 17.1 19.6 15.4 16.5 18.827.8 15.1 16.5 18.8 14.1 15.3 17.4 13.6 14.6 16.6 13.8 16.9 18.3 20.8 15.8 16.9 19.4 15.2 16.3 18.630.8 14.9 16.2 18.5 13.8 15.1 17.2 13.4 14.4 16.4 15.8 16.7 18.0 20.6 15.6 16.7 19.2 15.0 16.0 18.42.9 14.8 15.9 18.4 13.5 15.0 17.1 13.1 14.1 16.1 17.8 16.4 17.7 20.2 15.5 16.4 18.8 14.7 15.7 18.05.9 14.4 15.7 18.0 13.4 14.6 16.6 13.0 14.0 15.9 20.8 16.3 17.5 20.0 15.2 16.2 18.6 14.6 15.6 17.97.9 14.5 15.9 18.1 13.5 14.7 16.8 13.1 14.1 16.0 22.8 16.4 17.7 20.1 15.3 16.4 18.9 14.7 15.7 18.09.9 14.6 15.8 17.9 13.3 14.5 16.7 13.1 14.1 15.8 24.8 16.6 17.9 20.4 15.5 16.6 19.0 14.9 15.9 18.212.9 14.6 16.0 18.3 13.6 14.9 16.9 13.2 14.2 16.2 27.8 16.4 17.5 20.0 15.1 16.2 18.6 14.6 15.6 17.915.9 14.7 16.1 18.4 13.7 15.0 17.0 13.3 14.3 16.3 29.8 16.2 17.4 19.9 15.0 16.1 18.5 14.5 15.5 17.817.9 14.3 15.5 17.9 13.4 14.6 16.4 12.8 13.8 15.9 31.8 15.7 17.0 19.4 14.7 15.7 18.0 14.1 15.1 17.321.9 14.4 15.8 18.0 13.5 14.7 16.6 13.0 14.1 15.9 3.9 15.9 17.2 19.6 14.8 15.9 18.3 14.3 15.3 17.6
7.9 15.8 17.1 19.5 14.7 15.8 18.1 14.2 15.2 17.410.9 15.7 16.8 19.2 14.5 15.6 18.0 14.1 15.0 17.3
Total 433 471 538 402 438 498 389 419 476 515 555 633 480 514 590 462 494 566I mean 481 446 428 567 528 507D mean 408 443 504 486 521 596Overall mean 452 534

163
KARAŞAHİN / Turk J Agric For
2.4. Agricultural applicationsThe planting was done by hand on 25 May in the first year of the research and on 10 May in the second year. Two seeds were sown in each plant density and thinned by hand after emergence. After the plants emerged and the rows became clear, the first hoeing was completed. Composite fertilizer 13.24.12.10.1.1 (13% N, 24% P2O5, 12% K2O, 10% SO3, 1% Zn, 1% Fe) was applied as the base-fertilizer and ammonium nitrate (33% N) was used as a top-dressing fertilizer. When the plants grew to a height of about 40 cm, secondary hoeing was completed. In all plant densities, fertilization was conducted by calculating the dose as follows: 3 g plant–1, N; 1.4 g plant–1, P2O5; and 0.7 g plant–1, K2O. A part of the nitrogen and the entire phosphorus and potassium measurements were applied with the base fertilizer (0.75 g plant–1, N; 1.4 g plant–1, P2O5; and 0.7 g plant–1, K2O). The rest of the nitrogen (2.25 g plant–1) was applied with each irrigation session in the form of ammonium nitrate (33% N).2.5. Evaluation and statistical analysisAfter removing border effects, 2 center rows of each split plot were harvested. Harvesting was made at the milk-line, which was between 50% and 75%. The plant-based measurements were made on 5 randomly selected plants from 2 center rows of each split plot. The plant height (cm), plant leaf number (plant–1), leaf area (cm2), stem diameter (mm), fresh ears, stem and leaf ratios (%), green and dry plant weight (g), dry matter (%), and silage and dry matter yield (t ha–1) were examined (TÜGEM, 2010). All data were analyzed using an analysis of variance according to a randomized complete block in a split plot experimental design. The least significant difference (LSD) procedure was used to separate mean values when the F-test was significant (MSTAT-C, 1980).
3. Results 3.1. Irrigation water amountsThe amounts of irrigation water used are presented in Table 3. Overall mean irrigation water amounts and numbers in the 2012 growing season were higher than in 2011. This may be attributed to differences in the climatic conditions in the growing seasons. The average temperatures in 2012 were higher than in 2011 (Table 1). Under the mean I1, I2, and I3 irrigation treatments, the amounts of irrigation water used were 481, 446, and 428 mm in 2011 and 567, 528, and 507 mm in 2012, respectively. The first and second study year records showed that the I2 and I3 irrigation methods led to 7% and 11% water savings, respectively, compared to the I1 irrigation method. Under the mean D1, D2, and D3 density treatments, the amounts of irrigation water used were 408, 443, and 504 mm in 2011 and 486, 521, and 596 mm in 2012, respectively (Table 3). The results obtained during the 2 study years show that the D3 and D2 plant
densities used more water than the D1 treatment (23% and 8%, respectively). The applied irrigation water amounts in all irrigation and plant density treatments were recorded separately. There were 34 irrigation applications during the first study year, and 433 mm (I1 × D1), 471 mm (I1 × D2), 538 mm (I1 × D3), 402 mm (I2 × D1), 438 mm (I2 × D2), 498 mm (I2 × D3), 389 mm (I3 × D1), 419 mm (I3 × D2), and 476 mm (I3 × D3) of irrigation water were applied in total. In the second study year, irrigation was conducted 36 times, and 515 mm (I1 × D1), 555 mm (I1 × D2), 633 mm (I1 × D3), 480 mm (I2 × D1), 514 mm (I2 × D2), 590 mm (I2 × D3), 462 mm (I3 × D1), 494 mm (I3 × D2), and 566 mm (I3 × D3) of irrigation water were applied in total (Table 3). 3.2. Dry matter and silage yields In both research years, the dry matter yields (P < 0.05) among plant densities were statistically significant. In the first year, the highest dry matter yield values (24.9 and 23.6, respectively) were obtained from the D3 and D2 plant densities, and in the second year the highest dry matter yield (22.4) was obtained from the D3 plant density and occurred in the first group (a) (Table 4). In both research years, the silage yields (P < 0.01) among plant densities were statistically significant. In the first year, the highest silage yield values (88.4 and 82.2, respectively) were obtained from the D3 and D2 plant densities, and in the second year, the highest silage yield (85.9) was obtained from the D3 plant density and occurred in the first group (a) (Table 4). In the second research year, the silage yields (P < 0.05) among I × D interactions were statistically significant, and the highest silage yield (90.0) was obtained from I3 × D1 interaction and took place in the first group (a) (Table 4). 3.3. Dry and fresh plant weight In the first research year, dry plant weight values among irrigation methods and plant densities were not significant (Table 4). In the second research year, the dry plant weight values (P < 0.01) among plant densities were statistically significant. The highest dry plant weight (211.9) was obtained from the D1 plant density and occurred in the first group (a) (Table 4). In the second research year, the dry plant weight values among irrigation methods (P < 0.05) were statistically significant. The highest dry plant weight (206.0) was obtained from drip irrigation and occurred in the first group (a) (Table 4). In the first and second research years, the fresh plant weight values among plant densities (P < 0.05 and P < 0.01, respectively) were statistically significant. In the first year, the highest fresh plant weight (749.8) was obtained from the D2 plant density applications, and in the second year the highest fresh plant weight value (778.8) was obtained from the D1 plant density application and occurred in the first group (a) (Table 4). In the second research year, the fresh plant weight values (P < 0.05) among irrigation methods were

164
KARAŞAHİN / Turk J Agric For
statistically significant. The highest fresh plant weight (761.2) was obtained from drip irrigation and occurred in the first group (a) (Table 4). In the second research year, the fresh plant weight values (P < 0.05) among I × D interactions were statistically significant, and the highest fresh plant weight (867.0) was obtained from I1 × D1 interaction and occurred in the first group (a) (Table 4). 3.4. Fresh leaf, ear, and stem ratios In the first study year, the fresh leaf ratio values (P < 0.01) among plant densities were statistically significant. The highest green leaf ratio (19.2) was obtained from the D3 plant density and occurred in the first group (a) (Table 5). In the second research year, the fresh leaf ratio values (P < 0.05) among I × D interactions were statistically significant, and the highest fresh leaf ratio values (21.2 and 20.6, respectively) were obtained from the I3 × D3
and I1 × D2 interactions and occurred in the first group (a) (Table 5). In the first and second research years, the ear ratio values (P < 0.05 and P < 0.01, respectively) among plant densities were statistically significant. In the first year, the highest fresh ear ratio (42.5) was obtained from the D1 plant density and occurred in the first group (a). In the second year the highest fresh ear ratio values (40.4 and 40.3, respectively) were obtained from the D1 and D2 plant densities and occurred in the first group (a) (Table 5). In the second research year, the fresh ear ratio values (P < 0.01) among I × D interactions were statistically significant, and the highest fresh ear ratio values (41.7 and 41.6, respectively) were obtained from the I3 × D2 and I1 × D2 interactions and occurred in the first group (a) (Table 5). In both research years, the fresh stem ratio values among irrigation methods and plant densities were not significant (Table 5).
Table 4. Effects of irrigation and plant density on dry matter and silage yields (t ha–1) and dry and fresh plant weights (g).
Irrigation (I)
Plant density(plant ha–1) (D)
Dry matter yield (t ha–1) Silage yield (t ha–1) Dry plant weight (g) Fresh plant weight (g)
2011 2012 2011 2012 2011 2012 2011 2012
D1 17.9 21.4 66.2 76.6 cd 195.1 243.2 724.0 867.0 a
I1 D2 25.4 22.0 85.4 81.4 bc 226.3 217.6 760.3 805.3 ab
D3 25.2 20.5 85.4 80.5 bc 206.9 157.2 702.7 613.3 d
D1 21.3 19.6 70.1 74.5 cd 223.8 183.8 736.7 697.7 bcd
I2 D2 21.5 18.2 83.2 74.2 cd 183.2 148.5 707.0 601.3 d
D3 23.2 23.5 88.5 87.1 ab 170.8 174.8 650.3 647.0 d
D1 21.7 19.9 71.3 73.5 cd 199.2 208.6 653.7 771.7 abc
I3 D2 23.9 18.3 77.9 71.9 d 240.3 169.9 782.0 663.0 cd
D3 26.3 23.2 91.2 90.0 a 191.5 170.7 663.3 662.0 cd
I I1 22.8 21.3 79.0 79.5 209.4 206.0 a 729.0 761.9 a
Average I2 22.0 20.4 80.6 78.6 192.6 169.0 b 698.0 648.7 b
I3 24.0 20.5 80.1 78.5 210.3 183.1 b 699.7 698.9 b
LSD ns ns ns ns ns 21.11* ns 62.71*
EMS - - - - - 260.1 - 2295.3
D D1 20.3 b 20.3 ab 69.2 b 74.9 b 206.0 211.9 a 704.8 ab 778.8 a
Average D2 23.6 a 19.5 b 82.2 a 75.8 b 216.6 178.7 ab 749.8 a 689.9 ab
D3 24.9 a 22.4 a 88.4 a 85.9 a 189.7 167.6 b 672.1 b 640.8 b
LSD 2.98* 2.10* 7.41** 6.68** ns 35.44** 59.33* 92.48**
EMS 8.47 4.2 26.52 21.53 - 605.79 3336.8 4124.9
I × D int. LSD ns ns ns 8.25* ns ns ns 114.3*
EMS - - - 21.53 - - - 4124.9
*, **: significant at 0.05 and 0.01 probability levels, respectively; ns: not significant; EMS: error mean square. Values followed by the same letters are not significantly different.
165
KARAŞAHİN / Turk J Agric For
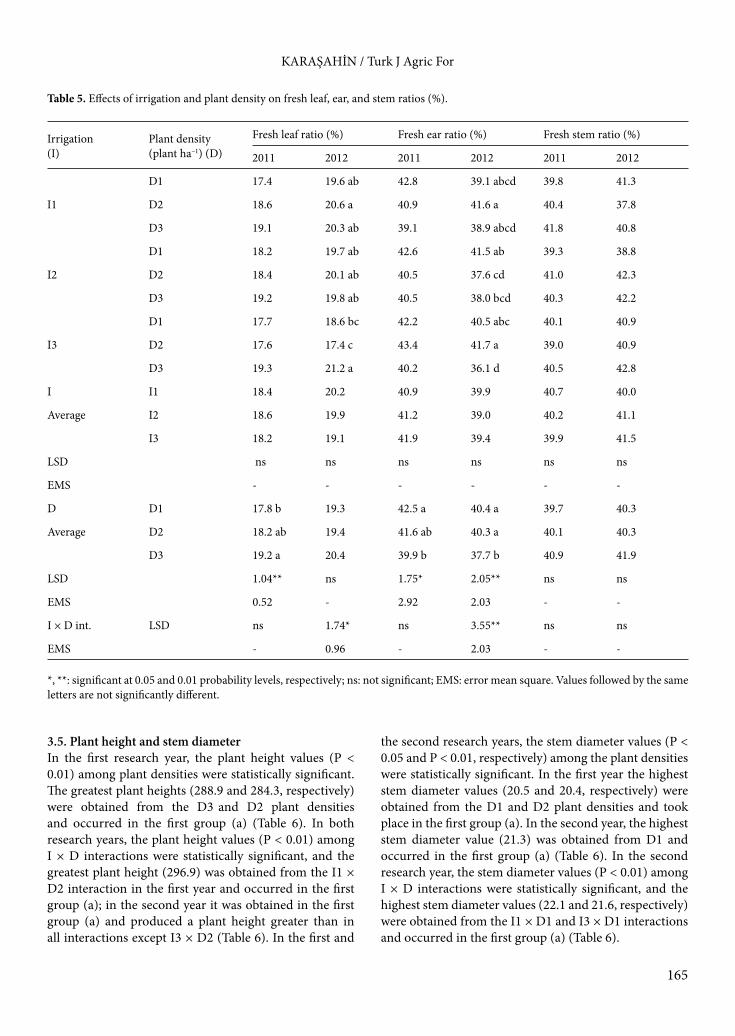
3.5. Plant height and stem diameterIn the first research year, the plant height values (P < 0.01) among plant densities were statistically significant. The greatest plant heights (288.9 and 284.3, respectively) were obtained from the D3 and D2 plant densities and occurred in the first group (a) (Table 6). In both research years, the plant height values (P < 0.01) among I × D interactions were statistically significant, and the greatest plant height (296.9) was obtained from the I1 × D2 interaction in the first year and occurred in the first group (a); in the second year it was obtained in the first group (a) and produced a plant height greater than in all interactions except I3 × D2 (Table 6). In the first and
the second research years, the stem diameter values (P < 0.05 and P < 0.01, respectively) among the plant densities were statistically significant. In the first year the highest stem diameter values (20.5 and 20.4, respectively) were obtained from the D1 and D2 plant densities and took place in the first group (a). In the second year, the highest stem diameter value (21.3) was obtained from D1 and occurred in the first group (a) (Table 6). In the second research year, the stem diameter values (P < 0.01) among I × D interactions were statistically significant, and the highest stem diameter values (22.1 and 21.6, respectively) were obtained from the I1 × D1 and I3 × D1 interactions and occurred in the first group (a) (Table 6).
Table 5. Effects of irrigation and plant density on fresh leaf, ear, and stem ratios (%).
Irrigation (I)
Plant density(plant ha–1) (D)
Fresh leaf ratio (%) Fresh ear ratio (%) Fresh stem ratio (%)
2011 2012 2011 2012 2011 2012
D1 17.4 19.6 ab 42.8 39.1 abcd 39.8 41.3
I1 D2 18.6 20.6 a 40.9 41.6 a 40.4 37.8
D3 19.1 20.3 ab 39.1 38.9 abcd 41.8 40.8
D1 18.2 19.7 ab 42.6 41.5 ab 39.3 38.8
I2 D2 18.4 20.1 ab 40.5 37.6 cd 41.0 42.3
D3 19.2 19.8 ab 40.5 38.0 bcd 40.3 42.2
D1 17.7 18.6 bc 42.2 40.5 abc 40.1 40.9
I3 D2 17.6 17.4 c 43.4 41.7 a 39.0 40.9
D3 19.3 21.2 a 40.2 36.1 d 40.5 42.8
I I1 18.4 20.2 40.9 39.9 40.7 40.0
Average I2 18.6 19.9 41.2 39.0 40.2 41.1
I3 18.2 19.1 41.9 39.4 39.9 41.5
LSD ns ns ns ns ns ns
EMS - - - - - -
D D1 17.8 b 19.3 42.5 a 40.4 a 39.7 40.3
Average D2 18.2 ab 19.4 41.6 ab 40.3 a 40.1 40.3
D3 19.2 a 20.4 39.9 b 37.7 b 40.9 41.9
LSD 1.04** ns 1.75* 2.05** ns ns
EMS 0.52 - 2.92 2.03 - -
I × D int. LSD ns 1.74* ns 3.55** ns ns
EMS - 0.96 - 2.03 - -
*, **: significant at 0.05 and 0.01 probability levels, respectively; ns: not significant; EMS: error mean square. Values followed by the same letters are not significantly different.

166
KARAŞAHİN / Turk J Agric For
3.6. Leaf number and leaf area In the second research year, the number of leaves (P < 0.05) among plant densities was statistically significant, and the highest number of leaves (13.0) was obtained from the D2 plant density and occurred in the first group (a) (Table 6). In the second research year, the number of leaves (P < 0.01) among I × D interactions was statistically significant, and the highest number of leaves (13.3 and 13.2, respectively) was obtained from the I3 × D3 and I1 × D1 interactions and occurred in the first group (a) (Table 6). In the second research year, the leaf area values among plant densities (P < 0.01) were statistically significant, and the largest leaf areas (557.3 and 522.3, respectively) were obtained from the D1 and D3 plant densities and occurred in the first group (a) (Table 6).
4. DiscussionIrrigation methods had a statistically significant impact on the fresh and dry plant weights in the second research year, and the highest values were obtained from drip irrigation. I × D interactions were statistically significant for the silage yield, plant weight and height, number of leaves, stem diameter, and fresh leaf and ear ratio in both research years. In the second research year, the highest silage yield was obtained from the I3 × D3 interaction (Tables 4–6). Applying the correct amount of water is particularly critical for crops that are sensitive to water stress. Although the total amount of water applied to plants during the entire growing period was important, the timing of the applied irrigation was more critical. There was no significant yield difference for well-watered irrigation treatments (Howell
Table 6. Effects of irrigation and plant density on plant height (cm), stem diameter (mm), leaf number (plant–1), and leaf area (cm2).
Irrigation (I)
Plant density(plant ha–1) (D)
Plant height (cm) Stem diameter (mm) Leaf number (plant–1) Leaf area (cm2)
2011 2012 2011 2012 2011 2012 2011 2012
D1 265.3 e 282.3 a 21.0 22.1 a 15.6 13.2 a 495.8 576.4
I1 D2 296.9 a 286.0 a 20.3 20.5 b 16.1 13.1 ab 538.7 509.0
D3 287.6 abc 279.0 a 18.9 18.6 d 16.1 12.0 c 536.8 520.7
D1 275.5 cde 279.0 a 21.1 20.1 bc 16.1 12.6 abc 543.4 533.5
I2 D2 283.7 bcd 282.7 a 20.6 18.6 d 15.4 13.1 ab 509.4 451.4
D3 290.1 ab 282.3 a 19.0 19.8 bc 16.0 12.3 bc 505.9 526.3
D1 274.7 cde 275.0 ab 19.3 21.6 a 15.8 12.3 bc 493.0 562.1
I3 D2 272.4 de 261.3 b 20.3 20.3 b 14.9 12.9 ab 550.4 424.5
D3 289.0 ab 283.5 a 19.2 19.2 cd 16.1 13.3 a 497.7 520.0
I I1 283.3 282.4 20.1 20.4 15.9 12.8 523.8 535.4
Average I2 283.1 281.3 20.2 19.5 15.8 12.7 519.6 503.7
I3 278.7 273.3 19.6 20.4 15.6 12.8 513.7 502.2
LSD ns ns ns ns ns ns ns ns
EMS - - - - - - - -
D D1 271.8 b 278.8 20.5 a 21.3 a 15.8 12.7 ab 510.7 557.3 a
Average D2 284.3 a 276.7 20.4 a 19.8 b 15.5 13.0 a 532.8 461.6 b
D3 288.9 a 281.6 19.0 b 19.2 c 16.1 12.5 b 513.5 522.3 a
LSD 7.48** ns 0.99* 0.53** ns 0.35* ns 40.91**
EMS 26.98 - 0.94 0.14 - 0.11 - 807.33
I × D int. LSD 12.95** 14.46** ns 0.93** ns 0.86** ns ns
EMS 26.98 - - 0.14 - 0.11 - -
*, **: significant at 0.05 and 0.01 probability levels, respectively; ns: not significant; EMS: error mean square. Values followed by the same letters are not significantly different.
167
KARAŞAHİN / Turk J Agric For
et al., 1997; Evett et al., 2000; Trejo et al., 2006; Kirnak et al., 2010). This study indicates that up to 7% and 11% of seasonally applied water might be saved by using subsoil drip and subsoil capillary irrigation, respectively. Subsoil irrigation treatments have the potential to save irrigation water by reducing soil surface wetting, thus reducing evaporation (Evett et al., 2000). A major advantage of a buried line or tape is that the soil surface remains almost completely moisture-free, greatly reducing evaporation and ensuring that more water is available to the plant (Trejo et al., 2006). Subsoil irrigation maintains the soil surface structure more effectively and makes it easier to allow for rainfall events (Harris, 2005). Using a subsurface irrigation method may save irrigation water. Savings will be obtained through reduction of nonbeneficial water balance components such as soil evaporation, runoff, and deep percolation and better usage of precipitation (Kheira, 2009). Subsoil capillary irrigation produces a wider lateral wetting pattern and greater uniformity between drippers, while reducing drainage beneath the root zone (Charlesworth, 2003). The findings obtained in our research were similar to most of the previous research into determining the effects of different irrigation methods on silage yield and yield components in corn cultivars (Camp et al., 1989; Adamsen, 1992; Howell et al., 1997; Evett et al., 2000; Trejo et al., 2006; Hassanli et al., 2009; Hammad et al., 2012), but the findings were also different from those of other studies (Humphreys et al., 2005; Ramirez et al., 2006; Kheira, 2009). Differences among the results of studies regarding the effects of irrigation methods on silage yield and yield components may be due to differences in ecological conditions of study locations as well as cultural conditions such as fertilizing, soil structure, and the genetics of the cultivars used in these studies.
In both research years, the plant densities had a statistically significant impact on the silage and dry matter yield, fresh plant weight, stem diameter, and fresh ear ratio. The highest stem diameter, fresh ear ratio, and fresh plant weight values were obtained from the D1 plant densities, and the highest silage and dry matter yields were obtained from the D3 and D2 plant densities. Silage and dry matter yields increased as plant density increased. There were also negative relationships between plant densities and stem
diameter or ear ratio. The highest stem diameter and ear ratio values were obtained at the lowest plant densities (İptaş and Acar, 2006; Yılmaz et al., 2007; Öztürk et al., 2008; Budaklı Çarpıcı et al., 2010). Corn yield is influenced by numerous interactions including environment (temperature, photoperiod, and light intensity), agronomic management (plant density, sowing date, fertilizer, and harvest stage), and genetic factors (İptaş and Acar, 2006). While single-plant yield decreases with increasing plant densities, total light interception by the canopy increases (Yılmaz et al., 2007). In the first research year, plant densities had a statistically significant impact on plant height and fresh leaf ratio, while in the second research year they had a significant impact on the number of leaves, leaf area, and dry plant weight (Tables 4–6). In this study, plants did not encounter water stress in the growing seasons due to optimum irrigation management, which created the appropriate conditions to grow more plants per unit area. The results obtained from many studies conducted on the effects of plant densities on silage yield and yield components in corn (Zea mays L.) support the findings of this study (Cusicanqui and Lauer, 1999; Cox and Cherney, 2001; Patricio Soto et al., 2002; Saruhan and Şireli, 2005; Hashemi et al., 2005; Turgut et al., 2005; Stanton et al., 2007), while some studies provided different results (Cox et al., 1997; Shapiro and Wortmann, 2006; Jeschke and Curran, 2008). The differences regarding the effects of plant densities on silage yield and yield components in corn may be due to ecological conditions and differences in the genetics of the cultivars used in these studies.
The results showed that higher density treatments tend to use more water. In both study years, D3 and D2 plant densities used more water than the D1 treatments (23% and 8%, respectively). This may be due to a higher density of roots, which enabled the plants to extract large amounts of water. The high number of plants competing for soil moisture and a more balanced plant growth pattern may have been the reason for the rather high water use values recorded (Sani et al., 2008). The D3 and D2 plant densities in all 3 irrigation methods could be recommend for corn silage farmers. However, when water conservation is taken into consideration (I2, 7%; I3, 11%), subsoil irrigation becomes more important.
References
Adamsen FJ (1992). Irrigation method and water quality effects on corn yield in the mid-Atlantic coastal plain. Agron J 84: 837–843.
Aras İ (2006). Drip irrigation. J Field Crops CRI 15: 49–60 (in Turkish).
Budaklı Çarpıcı E, Çelik N, Bayram G (2010). Yield and quality of forage maize as influenced by plant density and nitrogen rate. Turk J Field Crops 15: 128–132.
Camp CR, Sadler EJ, Busscher WJ (1989). Subsurface and alternate-middle micro irrigation for the southeastern coastal plain. ASAE Publ 32: 451–456.

168
KARAŞAHİN / Turk J Agric For
Charlesworth PB (2003). Investigation of the efficiency and long term performance of various sub-surface irrigation configurations under field conditions. PhD, School of Agriculture, Charles Sturt University, New South Wales, Australia.
Cox B, Cherney J, Atkins P (1997). Corn silage hybrids and plant populations. What’s cropping up? 20: 12–13.
Cox WJ, Cherney DJR (2001). Row spacing, plant density and nitrogen effects on corn silage. Agron J 93: 597–602.
Cusicanqui JA, Lauer JG (1999). Plant density and hybrids influence on corn forage yield and quality. Agron J 91: 911–915.
Evett SR, Howell AT, Schneider AD (2000). Energy and water balances for surface and subsurface drip irrigated corn. International Water and Irrigation 20: 18–22.
Hammad HM, Ahmad A, Abbas F, Farhad W (2012). Optimizing water and nitrogen use for maize production under semiarid conditions. Turk J Agric For 36: 519–532.
Harris G (2005). Sub-surface drip irrigation: advantages and limitations. The State of Queensland Department of Primary Industries and Fisheries 17650: 1–6.
Hashemi AM, Herbert SJ, Putnam DH (2005). Yield response of corn to crowding stress. Agron J 97: 839–846.
Hassanli AM, Ebrahimizadeh MA, Beecham S (2009). The effects of irrigation methods with effluent and irrigation scheduling on water use efficiency and corn yields in an arid region. Agr Water Manage 96: 93–99.
Howell AT, Scheneider DA, Evet RS (1997). Subsurface and surface microirrigation of corn—southern high plains. ASAE Publ 40: 635–641.
Humphreys L, Fawcett B, O’Neill Chris, Muirhead W (2005). Maize under sprinkler, drip and furrow irrigation. IREC Farmers’ Newsletter 170: 35–38.
İptaş S, Acar A (2006). Effects of hybrid and row spacing on maize forage yield and quality. Plant Soil Environ 52: 515–522.
Jeschke M, Curran B (2008). Plant population effects on corn silage yield and quality. Pioneer Agronomy Science 18: 1–4.
Kheira AAA (2009). Comparison among different irrigation systems for deficit-irrigated corn in the Nile valley. Agricultural Engineering International CIGR J 11: 1–25.
Kırnak H, Doğan E, Türkoğlu H (2010). Effect of drip irrigation intensity on soybean seed yield and quality in the semi-arid Harran plain, Turkey. Span J Agric Res 8: 1208–1217.
Kırtok Y (1998). Mısır Üretimi ve Kullanımı. Adana, Turkey: Kocaoluk Basımevi (in Turkish).
MSTAT-C (1980). MSTAT User’s Guide, Statistics (Version 5 ed.). East Lansing, MI, USA: Michigan State University.
Öztürk A, Bulut S, Boran E (2008). Effect of plant density on yield and some agronomic characteristics of silage maize. Atatürk University J Fac Agric 39: 217–224 (in Turkish).
Patricio Soto O, Ernesto Jahn B, Susana Arredondo S (2002). Planting density and nitrogen fertilization of hybrid corn for silage in the irrigated central valley. Agr Tec 62: 255–265.
Ramirez OJ, Trejo JAM, Sanchez SRB, Hernandez MF, Nuncio RAA, Cerda ER (2006). Agronomic characteristic and forage quality corn width subsurface drip irrigation. Tec Pecu Mex 44: 351–357.
Sade B, Soylu S (2008). Dünya’da ve Türkiye’de Mısır Tarımı. Ülkesel Tahıl Sempozyumu, Konya, pp. 101–108 (in Turkish).
Sani BM, Oluwasemire KO, Mohammed HI (2008). Effect of irrigation and plant density on the growth, yield and water use efficiency of early maize in the Nigerian savanna. ARPN J Agric and Bio Sci 3: 33–40.
Saruhan V, Şireli HD (2005). An investigation on the effect of plant densities and nitrogen doses on ear, stem and leaf yields of maize (Zea mays L.). J Agric Fac HR U 9: 45–53 (in Turkish).
Sencar Ö (1988). Mısır Yetiştiriciliğinde Ekim Sıklığı ve Azotun Etkileri. Tokat, Turkey: Cumhuriyet Üniversitesi Ziraat Fakültesi Yayınları No: 6 (in Turkish).
Shapiro AC, Wortmann SC (2006). Corn response to nitrogen rate, row spacing and plant density in eastern Nebraska. Agron J 98: 529–535.
Stanton D, Grombacher AW, Pinnisch R, Mason H, Spaner D (2007). Hybrid and population density affect yield and quality of silage maize in central Alberta. Can J Plant Sci 87: 867–871.
TMMOB (2009). Türk Mühendis ve Mimar Odaları Birliği. Su Raporu. Ankara, Turkey: TMMOB (in Turkish).
Trejo JAM, Monsivais GOA, Ramirez OJ, Gonzalez ZA, Cerda RE, Hernandez FM, Sosa SE, Nuncio AR (2006). Effect of three driptape installation depths on water use efficiency and yield parameters in forage maize (Zea mays L.) cultivation. Tec Pecu Mex 44: 359–364.
TÜGEM (2010). Tarımsal Üretim ve Geliştirme Genel Müdürlüğü. Tarımsal değerleri ölçme denemeleri teknik talimatı. Mısır (Zea mays L.). Ankara, Turkey: TÜGEM (in Turkish).
Tükel T, Hatipoğlu R (1997). Çayır Mera Amenajmanı. Adana, Turkey: Çukurova Üniversitesi Ziraat Fakültesi Yayınları No: 191 (in Turkish).
Turgut İ (2002). Silajlık mısır yetiştiriciliği. In: Açıkgöz E, Turgut İ, Filya İ, editors. Silaj Bitkileri Yetiştirme ve Silaj Yapımı. İstanbul: Hasad Yayıncılık, pp. 11–33 (in Turkish).
Turgut İ, Duman A, Bilgili U, Açikgöz E (2005). Alternate row spacing and plant density effects on forage and dry matter yield of corn hybrids (Zea mays L.). J Agron Crop Sci 191: 146–151.
Yılmaz S, Gözübenli H, Konuşkan O, Atış I (2007). Genotype and plant density effects on corn (Zea mays L.) forage yield. Asian J Plant Sci 6: 538–541.