effects of death anxiety on learning performance
TRANSCRIPT

University of Central Florida University of Central Florida
STARS STARS
Honors Undergraduate Theses UCF Theses and Dissertations
2020
Effects of Death Anxiety on Learning Performance Effects of Death Anxiety on Learning Performance
Umaima Haseeb University of Central Florida
Part of the Psychology Commons
Find similar works at: https://stars.library.ucf.edu/honorstheses
University of Central Florida Libraries http://library.ucf.edu
This Open Access is brought to you for free and open access by the UCF Theses and Dissertations at STARS. It has
been accepted for inclusion in Honors Undergraduate Theses by an authorized administrator of STARS. For more
information, please contact [email protected].
Recommended Citation Recommended Citation Haseeb, Umaima, "Effects of Death Anxiety on Learning Performance" (2020). Honors Undergraduate Theses. 854. https://stars.library.ucf.edu/honorstheses/854

EFFECTS OF DEATH ANXIETY ON LEARNING PERFORMANCE
by
UMAIMA HASEEB
A thesis submitted in partial fulfillments of the requirements for the Honors in the Major in Psychology
in the College of Sciences and in the Burnett Honors College at the University of Central Florida
Orlando, Florida
Fall Term 2020
Thesis Chair: Dr. Corey Bohil (Ph.D.)

ii
ABSTRACT
The present study examines whether or not a person’s anxiety level might be linked to
their learning performance. Many studies in the past have examined math and test anxiety, but
the present study will examine the effects of death anxiety on learning performance. Individual’s
anxiety will attempt to be induced through fear of death. Participants were presented a set of four
symptoms, similar to Gluck and Bower’s 1988 category learning study. The participants were
asked whether or not they think the symptoms of the patient are positive for COVID-19 or
positive for the flu. The hypothesis was that there would be a negative correlation between death
anxiety and learning performance (i.e. participants who score high in death anxiety will score
with lower accuracy in the learning task). The signal detection model was used to analyze the
data for accuracy levels, the ability to discriminate between categories (d’), and the response bias
towards COVID-19 (b).
The present study found results to support the hypothesis that high death anxiety caused
lower performance levels. Results found that death anxiety is a predictor of classification of bias
towards a more serious disease in classification. This bias seems to be unrelated to state anxiety,
or STAI scores. The signal detection model indicates a predicted effect on discriminability index,
which negatively correlated to pre-experiment death anxiety levels. Additionally, although the
predicted response bias showed up in the data, it was not correlated with death anxiety levels.
There was also no relation to political affiliation, which was thought to bias beliefs about
COVID-19.
iii
TABLE OF CONTENTS
ABSTRACT ............................................................................................................................ ii
LIST OF FIGURES ............................................................................................................... iv
LIST OF TABLES .................................................................................................................. v
INTRODUCTION .................................................................................................................. 1
How have the effects of anxiety on learning performance been previously studied? .................. 2
What are the reasons for some individuals to do better or worse under pressure? .................... 6
How does threat-induced anxiety affect the processing of threat-related stimuli? ..................... 7
How is death anxiety different from standard anxiety? ............................................................... 9
What is the signal detection theory? ......................................................................................... 11
METHOD ............................................................................................................................. 13
Participants ............................................................................................................................... 13
Materials .................................................................................................................................... 13 State-Trait Anxiety Inventory. ........................................................................................................................... 13 Death Anxiety Questionnaire. ........................................................................................................................... 14 Stimuli. .............................................................................................................................................................. 14 Demographic Information ................................................................................................................................. 16
Procedure .................................................................................................................................. 16
RESULTS ............................................................................................................................. 18
Accuracy Analysis ..................................................................................................................... 18 Discriminability Index (d’) between blocks ....................................................................................................... 19 b levels between blocks ..................................................................................................................................... 20
Scale Scores ............................................................................................................................... 21
Relationship between Scale Scores and Performance Measures .............................................. 22
Block 4 Performance and Political Affiliation .......................................................................... 25
DISCUSSION ....................................................................................................................... 26
APPENDIX A: STATE-TRAIT INVENTORY TEST ............................................................ 30
APPENDIX B: DEATH ANXIETY QUESTIONNAIRE ....................................................... 32
APPENDIX C: DEMOGRAPHIC INFORMATION QUESTIONNAIRE ............................. 34
REFERENCES ..................................................................................................................... 36

iv
LIST OF FIGURES
Figure 1: How symptoms of COVID-19 compare to those of the flu and cold ............................ 15
Figure 2: Screenshot of how the symptoms will be presented to participants .............................. 16
Figure 3: Average accuracy over blocks. Error bars show standard error. ................................... 19
Figure 4: Average d’ over blocks. Error bars show standard error. .............................................. 20
Figure 5: Average of b over blocks. Error bars show standard error. ........................................... 21
Figure 6: Accuracy and pre DAQ scores ....................................................................................... 24
Figure 7: Response bias and pre DAQ scores ............................................................................... 24
Figure 8: Discriminability index and pre DAQ scores. ................................................................. 25

v
LIST OF TABLES
Table 1 ......................................................................................................................................... 18

1
EFFECTS OF DEATH ANXIETY ON LEARNING PERFORMANCE
INTRODUCTION
Anxiety is defined by the American Psychiatric Association (2000) as apprehensive
anticipation of future danger or misfortune accompanied by a feeling of dysphoria or somatic
symptoms of tension. Trait anxiety is defined as the stable tendency to attend to, experience, and
report negative emotions such as fears, worries, and anxiety across many situations (Gellman &
Turner, 2013). Individuals high in trait anxiety are also found to experience state anxiety. State
and trait anxiety can be measured using Spielberger's State-Trait Anxiety Inventory (1983).
Quite a few studies examine the qualities exhibited by high trait anxious individuals.
Calvo and Cano-Vindel (1997) examined trait anxiety's nature using self-report and objective
measures of biological, behavioral, and cognitive characteristics. The cognitive depiction of trait
anxiety is described by Calvo and Cano-Vindel (1997) as predispositions to focus on possibly
threatening information and to construe vague information as threatening. Their study of
cognitive vulnerability analysis supports the notion that trait anxiety is linked to perceived rather
than actual poor biological health and perceived elevated response to stress (Calvo et al., 1997).
Results also indicated the involvement of hypervigilance to threat-related external and internal
information (Calvo et al., 1997)
Eysenck’s cognitive theory of personality states that "high anxious individuals should
have an interpretive bias for their behavior in social situations, while repressors should have an
opposite interpretive bias for their behavior" (Derakshan & Eysenck, 1997). According to
Eysenck (1997), individuals with high trait anxiety acquire cognitive biases by handling their
physiological activity, behavior, and cognition. These biases lead to an amplified feeling of

2
threat in response to internal stimuli. On the other hand, individuals high in anxiety report having
more mindfulness of any negative or painful feelings, so they are more likely to observe their
stress levels (Derakshan et al., 1997). The theory was supported by the results of their study,
which found that high-anxious participants demonstrated a bias for their behavioral anxiety level
compared to other participants' ratings (Derakshan et al., 1997).
The present study will examine the relationship between anxiety level and learning
performance through the use of threat-related stimuli and death anxiety.
In order to effectively explore the effects of anxiety on categorization and learning
performance, the literature will be presented surrounding the following questions:
1. How have the effects of anxiety on learning performance been previously studied?
2. What are the reasons for some individuals to do better or worse under pressure?
3. How does threat-induced anxiety affect the processing of threat-related stimuli?
4. How is death anxiety different from standard anxiety?
5. What is the signal detection theory?
How have the effects of anxiety on learning performance been previously studied?
The effects of anxiety on learning performance have been widely studied, especially
concerning test anxiety and working memory capacity. One such study conducted by Ashcraft &
Kirk (2001) tested the relationships between math anxiety, performance, and working memory
by testing the hypothesis that math anxiety interrupts working memory. The results of the study
found supported their hypothesis. High math anxiety participants showed working memory
deficiency in the performance of an arithmetic task (Ashcraft et al., 2001). Ashcraft & Kirk
(2001) suggest that the lower working memory capacity may be responsible for lower

3
performance levels in high math anxiety individuals since it interferes with information
processing used in arithmetic tests. Their study also examined the relationship between working
memory and performance on a task that did not involve math (Ashcraft et al., 2001). They found
that if there is a challenging task that requires extensive use of working memory, the
performance of high math anxiety individuals will suffer (Ashcraft et al., 2001).
Ashcraft & Kirk examined a possible mechanism that would explain the relationship
between working memory, test anxiety, and performance. They suggest two distinct mechanisms
that may affect high math anxiety individuals' performance. First, it is possible that math anxiety
would affect an individual to achieve fundamental skills in arithmetic (Ashcraft et al., 2001).
Math anxiety at high levels is related to a "temporary, functional reduction in processing
capacity," which is correlated to lower working memory capacity (Ashcraft et al., 2001). Second,
math anxiety possibly has the same effect in classrooms when math is being learned, thus
causing lowering working memory capacity that is required for initially studying arithmetic
(Ashcraft et al., 2001).
Another study conducted by Dutke and Stöber (2001) tested the relationship between test
anxiety, working memory, and cognitive performance. Their purpose was to investigate memory
performance with high coordinative complexity tasks using low and high sequential demands
(Dutke et al., 2001). They performed two studies that used the three-target version of the
counting task developed by Dutke (1997). Both of their studies found that constant demands had
beneficial effects on test-anxious individuals' cognitive performance (Dutke et al., 2001). Better
performance of high text anxious individuals might be because, in high sequential demand tasks,
participants must "update their working memory contents" more than with low sequential

4
demand tasks (Dutke et al., 2001). Consequentially, high sequential demand tasks might ease test
anxious individuals from using their working memory to the same extent (Dutke et al., 2001).
M. Eysenck developed one of the most influential theories explaining the relationship
between working memory, anxiety, and performance (Dutke et al., 2001). Eysenck explains that
working memory capacity limitations are responsible for decreasing the performance of high-test
anxious individuals (Dutke et al., 2001). The lack of performance is because these individuals
face "task-irrelevant thoughts," such as doubts and fears about failure, which somewhat occupy
working memory capacity (Dutke et al., 2001).
The processing efficiency theory and attentional control theory formulated by M.
Eysenck aim further to explain the relationship between anxiety and cognitive performance. The
processing efficiency theory focuses on effectiveness and efficiency. Effectiveness is defined as
the accuracy of responses in a given task, and efficiency is defined as the relationship between
the effectiveness of performance and the effort spent during the task (Eysenck, Derakshan,
Santos, & Calvo, 2007). Processing efficiency theory assumes that task-irrelevant thoughts such
as worry play a significant role in the impairment of cognitive performance (Eysenck et al.,
2007). Attentional control theory was developed in addition to processing efficiency theory to
study further the relationship between anxiety, working memory, and cognitive performance
(Eysenck et al., 2007).
Working memory has been shown to have effects owing to anxiety. There are three main
components of the working memory system: central executive, the phonological loop, and
visuospatial sketchpad (Derakshan & Eysenck, 2009). The central executive is responsible for
attention and is involved in numerous functions such as planning, strategy selection, and
attentional control (Derakshan et al., 2009). The phonological loop is responsible for the

5
rehearsal of verbal information, and the visuospatial sketchpad is responsible for the processing
and storing of visual and spatial information (Derakshan et al., 2009). Processing efficiency
theory assumes that task-irrelevant processing mainly affects the central executive with a slight
effect on the phonological loop (Derakshan et al., 2009). Therefore, high anxious individuals
ought to display reduced cognitive performance when demands are high on the central executive
(Derakshan et al., 2009).
Since anxiety is assumed to affect the central executive, it is predicted that anxiety
affects performance through its effects on attentional control (Derakshan et al., 2009).
Attentional control is said to use top-down, and bottom-down processing; top-down is induced
by goals, expectations, and knowledge and bottom-down processing induced by stimuli
(Derakshan et al., 2009). The goal and stimulus-driven systems are understood to be balanced
and interrelate (Derakshan et al., 2009). Attentional control theory assumes that anxiety
interferes with the stability between the two processing systems by increasing the effect of the
bottom-up stimulus-driven process (Derakshan et al., 2009). Past studies involving both
behavioral and neuroimaging work have provided evidence that anxiety is linked to adverse
effects on cognitive performance, particularly on tasks demanding attentional focus (Derakshan
et al., 2009). Overall, Derakshan and Eysenck (2009) assume that anxiety enhances the attention
to task-irrelevant stimuli, especially threat-related, which suggests that anxiety usually lowers
attention towards simultaneous task demands.
Anxiety induced by threat-related stimuli has been found to disrupt the accuracy of
spatial working memory performance selectively, but not verbal (Shackman, Sarinopoulos,
Maxwell, Pizzagalli, Lavric & Davidson, 2006). Shackman et al. (2006) studied the effects of
anxiety caused by a threat on visuospatial working memory performance using the Behavioral

6
Inhibition System (BIS); high scores on the BIS scale are inclined to react with more negative
effects in response to threatening cues. Their results indicated that high-BIS participants
experienced higher anxiety and worse performance on the spatial working memory task using the
threat of shock procedures (Shackman et al., 2006). Hence, they suggest that spatial attention
might be a significant element of anxiety (Shackman et al., 2006).
What are the reasons for some individuals to do better or worse under pressure?
Markman, Maddox, and Worthy (2006) examined choking under pressure, which is
thought to be caused by interference with the ability to use explicit strategies. They tested the
distraction hypothesis, which predicts that pressure leads to a decrease in available working
memory resources, which negatively influences cognitive performance (Markman, Maddox, &
Worthy, 2006). They predicted that subjects in the high-pressure condition should have a more
difficult time learning the rule-based categories but an easier time learning the information-
integration categories (Markman et al., 2006). The results found that pressure decreased
performance on the rule-based task but increased performance on the information-integration
task (Markman et al., 2006). Markman et al. (2006) suggest that the increased performance on
the information-integration tasks by the high-pressure participants takes place because "people
with reduced working memory capacity are less likely to use and maintain a suboptimal rule-
based hypothesis-testing strategy for learning the category distinction." The high-pressure
subjects instead rely on an implicit similarity-based process (Markman et al., 2006).
A few years later, Worthy, Markman, and Maddox revisited choking under pressure
studying the relationship between pressure level, task type, and reward structure (Worthy,
Markman & Maddox, 2009). In contrast with the previous study testing the distraction

7
hypothesis, they found that pressure on its own did not reduce working memory capacity
(Worthy et al., 2009). Alternatively, pressure stimulated a "situational prevention focus" with the
reward structure to affect the participants' regulatory fit (Worthy et al., 2009). Regulatory fit
causes an increase of confidence in performance and consequently causes an increase in
"executive-attention resources" (Worthy et al., 2009). Thus, the study results suggest that when
test-takers complete a task involving explicit cognitive processing, they will perform better under
pressure if they view the task as avoiding giving incorrect answers because they will be in a
regulatory fit (Worthy et al., 2006). On the other hand, when test-takers complete a task
involving implicit cognitive processing, they will perform better under pressure if they view the
task as increasing the number of correct answers because they will be in a regulatory mismatch
(Worthy et al., 2009).
How does threat-induced anxiety affect the processing of threat-related stimuli?
As seen by Shackman et al.'s (2006) study examining threat-induced anxiety and its
effects on visuospatial working memory, previous studies have explicitly documented how
threat-related stimuli were processed. One such study conducted by Mogg, Mathews, Bird, and
Macgregor-Morris (1990) examined the effects of stress and anxiety on the processing of threat
stimuli. They used color-naming and attention deployment tasks in two separate experiments to
evaluate the effects of a stress manipulation procedure on attentional responses in high and low
trait anxious subjects (Mogg, Mathews, Bird & Macgregor-Morris, 1990). Both experiments'
results implied that high stress was associated with an attentional bias toward the threat,
regardless of whether participants were high or low in trait anxiety (Mogg et al., 1990). Mogg et
al. (1990) suggest that acute stress is linked with attentional bias to threat, which is not controlled

8
by either trait or state anxiety. However, responses with prolonged stress are possibly influenced
by individual differences weaknesses to anxiety (Mogg et al., 1990).
One study conducted by Macleod and Hagan (1992) observed the differences in
individuals in their selective processing of threatening information and emotional responses to a
stressful life event. Their study offered heuristic support for the hypothesis that patterns of
unconscious processing selectivity may moderate individuals’ emotional responses to stressful
life events (Macleod & Hagan, 1992). They screened thirty-one women awaiting colposcopy
investigation and then fifteen women who later received a cervical pathology diagnosis (Macleod
et al., 1992). The women were measured on their emotional vulnerability and a modified version
of the emotional Stroop task (Macleod et al., 1992). The later fifteen women were asked to report
the level to which their diagnosis compromised their degree of emotional functioning (Macleod
et al., 1992). Results indicated that trait anxiety was linked with an automatic tendency to
selectively process threat-related distractor information (Macleod et al., 1992).
Byrne and Eysenck (1995) directly tested Eysenck's 1992 theory that a primary function
of anxiety is facilitating the rapid detection of threats. Their subjects were selected based upon
their scores on Spielberger’s State-Trait Anxiety Inventory (STAI) and divided into high trait-
anxious and low trait-anxious group (Byrne & Eysenck, 1995). The subjects were required to
identify either an angry or a happy target face out of 12 photographs while listening to two music
pieces to stimulate an anxious or non-anxious mood (Byrne et al., 1995). Byrne and Eysenck
(1995) found that high trait-anxious subjects were considerably faster than low trait-anxious
subjects to detect an angry face presented along with neutral distractor faces, although the two
groups did not differ in detection speed of a happy face presented with neutral faces. Their
results showed that high trait-anxious subjects were significantly slower than the low trait-

9
anxious subjects to detect happy targets with angry distractors, but the two groups did not differ
with neutral distractors (Byrne et al., 1995). These results offer evidence that high anxiety
individuals present ease when detecting threat-related stimuli (Byrne et al., 1995).
The present study will use threat-related stimuli consisting of a set of symptoms.
Participants will be presented with a set consisting of four symptoms of an imaginary patient.
They will be asked to identify whether they think the symptoms of this patient are COVID19
positive or flu positive.
How is death anxiety different from standard anxiety?
Death anxiety is defined as the "fear of and anxiety related to the anticipation, and
awareness of dying, death and nonexistence" (Gellman et al., 2013). However, death anxiety and
standard anxiety are not interchangeable as death anxiety has been known to produce numerous
specific effects.
Although most people fear death, the terror management theory (TMT) explains how
death anxiety can affect behaviors outside of conscious awareness (Burke, Martens & Faucher,
2010). According to TMT, individuals engage in distal death defenses that maintain their
worldviews and self-esteem (Burke et al., 2010). The distal death defenses affect individuals'
prejudice, intergroup conflict, and political attitudes (Burke et al., 2010). Additionally, anxiety
stemmed from death is due to the fear that "my life has not had an impact," which leads to self-
preservation or defensiveness of personal life choices to assure that their life has had meaning
(Burke et al., 2010). According to Burke et al. (2010), the "cultural anxiety buffer" is composed
of two components: (1) belief in the validity of cultural worldview and the standards and values
associated with that view and (2) belief that one is meeting or exceeding those standards and
10
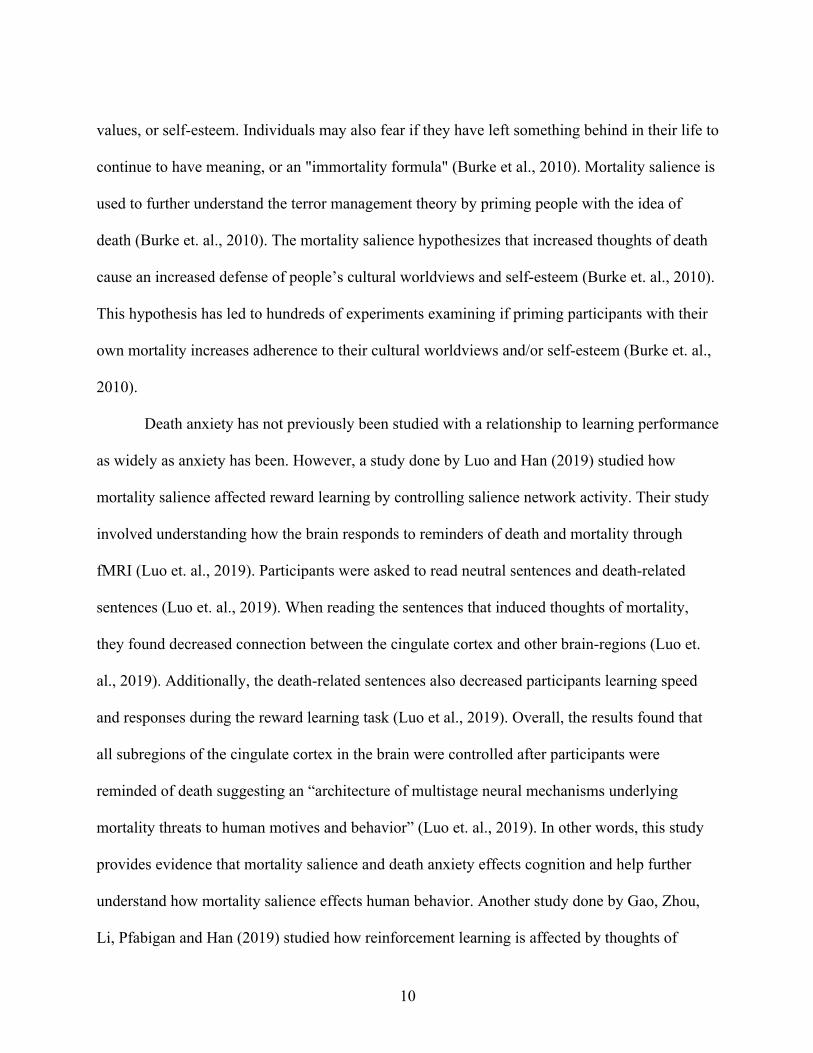
values, or self-esteem. Individuals may also fear if they have left something behind in their life to
continue to have meaning, or an "immortality formula" (Burke et al., 2010). Mortality salience is
used to further understand the terror management theory by priming people with the idea of
death (Burke et. al., 2010). The mortality salience hypothesizes that increased thoughts of death
cause an increased defense of people’s cultural worldviews and self-esteem (Burke et. al., 2010).
This hypothesis has led to hundreds of experiments examining if priming participants with their
own mortality increases adherence to their cultural worldviews and/or self-esteem (Burke et. al.,
2010).
Death anxiety has not previously been studied with a relationship to learning performance
as widely as anxiety has been. However, a study done by Luo and Han (2019) studied how
mortality salience affected reward learning by controlling salience network activity. Their study
involved understanding how the brain responds to reminders of death and mortality through
fMRI (Luo et. al., 2019). Participants were asked to read neutral sentences and death-related
sentences (Luo et. al., 2019). When reading the sentences that induced thoughts of mortality,
they found decreased connection between the cingulate cortex and other brain-regions (Luo et.
al., 2019). Additionally, the death-related sentences also decreased participants learning speed
and responses during the reward learning task (Luo et al., 2019). Overall, the results found that
all subregions of the cingulate cortex in the brain were controlled after participants were
reminded of death suggesting an “architecture of multistage neural mechanisms underlying
mortality threats to human motives and behavior” (Luo et. al., 2019). In other words, this study
provides evidence that mortality salience and death anxiety effects cognition and help further
understand how mortality salience effects human behavior. Another study done by Gao, Zhou,
Li, Pfabigan and Han (2019) studied how reinforcement learning is affected by thoughts of

11
mortality. Participants in the study took part in a learning task that asked them to choose between
two visual patterns in which they would receive monetary reward for different answers and
received corrective feedback (Gao et. al., 2019). Their study found that mortality salience
increases attentional processing but decreases both the cognitive assessment of the learning
stimuli and the neural sensitivity to feedback signaling in the absence of a monetary reward (Gao
et al., 2019).
The present study will examine death anxiety with behavioral measures and learning
performance. The current COVID-19 pandemic will be manipulated as it has intensified
reminders of all human's impending death. Therefore, the present study's primary purpose is to
identify whether or not there is a relationship between death anxiety and learning performance.
The following hypothesis was formed:
Hypothesis 1: There will be a negative correlation between death anxiety and learning
performance; i.e., participants who score high in death anxiety will score with lower
accuracy in the learning task
What is the signal detection theory?
Signal detection theory provides a clear-cut semantic and detailed system for
investigating decision making in the presence of ambiguity. It offers a way to analyze many
different kinds of decision problems (Heeger 2003-2007).
There are four possible outcomes to a decision: when an individual who has the condition
will be correctly identified to have it (true positive, or hit); when an individual who does not
have the condition will be mistakenly identified to have it (false positive decision, or false
alarm); when an individual who truly has the condition in question but will mistakenly be

12
identified not to have it (miss); when an individual who does not have the condition and will be
correctly identified not to have it (correct rejections) (Swets, 2000).
Heeger (2003) and Swets (2000) examine the use of the Receiver Operating
Characteristic (ROC) and what different results mean when analyzing decision making. The
ROC curve is used to evaluate the overall precision of the projection criterion. The curves are
plotted as a percentage of true positives (hits) against the percentage of false positives (false
alarms). The true negatives and false negatives are ignored when constructing a ROC curve. A
more significant number of true positives cause false alarms, so the threshold needs to be set at
reasonable conditions. For such a criterion, the hit rate is always more substantial than the false
alarm rate, so the ROC curve is bowed upward.
The present study will use the signal detection model to analyze the differences in
classification learning for the participants. They will have to make a decision about the set of
stimuli presented, and thus, a ROC curve will be able to depict this process. b, the response bias
towards choosing COVID19, and d’, the discriminability index, which determines how well
participants will be able to discriminate between positive or negative COVID19, will be
analyzed.
13
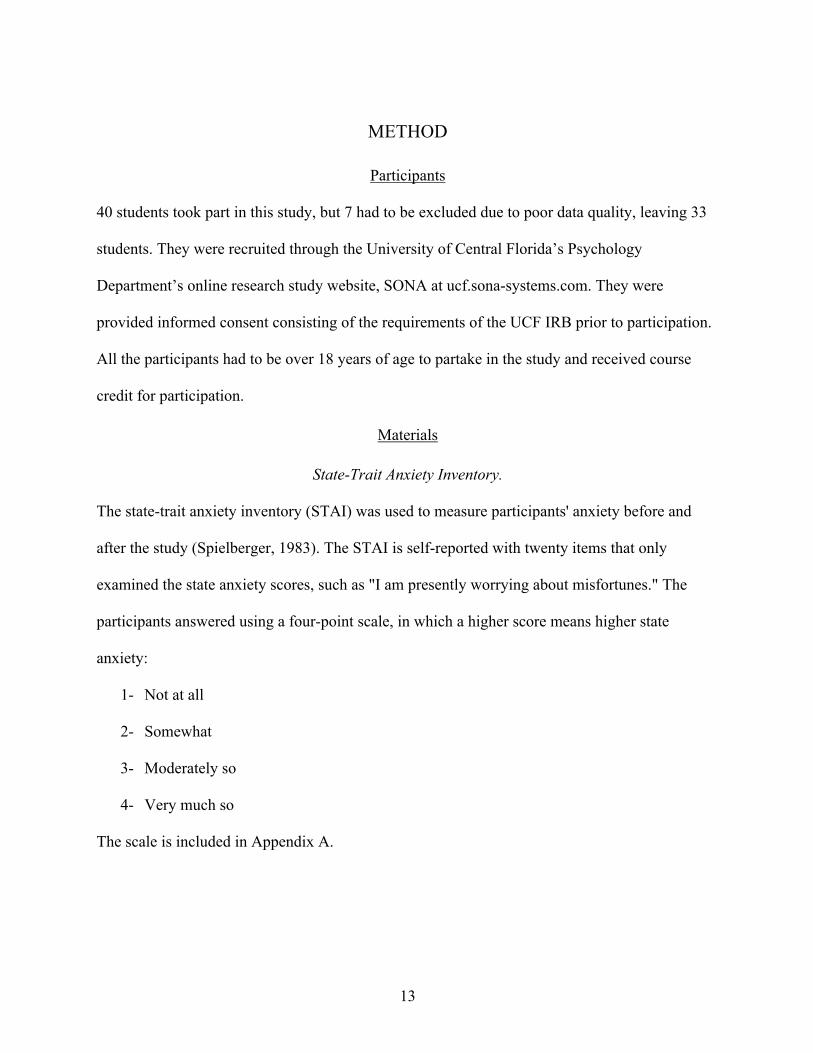
METHOD
Participants
40 students took part in this study, but 7 had to be excluded due to poor data quality, leaving 33
students. They were recruited through the University of Central Florida’s Psychology
Department’s online research study website, SONA at ucf.sona-systems.com. They were
provided informed consent consisting of the requirements of the UCF IRB prior to participation.
All the participants had to be over 18 years of age to partake in the study and received course
credit for participation.
Materials
State-Trait Anxiety Inventory.
The state-trait anxiety inventory (STAI) was used to measure participants' anxiety before and
after the study (Spielberger, 1983). The STAI is self-reported with twenty items that only
examined the state anxiety scores, such as "I am presently worrying about misfortunes." The
participants answered using a four-point scale, in which a higher score means higher state
anxiety:
1- Not at all
2- Somewhat
3- Moderately so
4- Very much so
The scale is included in Appendix A.

14
Death Anxiety Questionnaire.
The death anxiety questionnaire (DAQ) was used to measure participants' death anxiety before
and after the study (Conte et al., 1982). The DAQ is self-reported with fifteen items, such as "Do
you worry about dying?" The participants answered using a four-point scale, in which a higher
score means higher death anxiety:
1- Not at all
2- Somewhat
3- Moderately so
4- Very much so
The scale is included in Appendix B.
Stimuli.
Fifty sets of stimuli were formulated to include an array of symptoms, which were identified as
either positive for COVID-19 or positive for the flu. There were four possible symptoms
presented:
1- Dry cough
2- Fever
3- Body aches
4- Exhaustion
The symptoms positive for COVID-19 were presented with four different frequencies:
5- Frequent (80%)
6- Sometimes (60%)
7- Occasionally (40%)
8- Rare (20%)

15
These frequencies were devised using the World Health Organization chart in Figure 1. Figure 2
illustrates a screenshot of how stimuli were presented to participants.
Figure 1: How symptoms of COVID-19 compare to those of the flu and cold
Source: Times of India. https://timesofindia.indiatimes.com/india/what-are-the-symptoms-of-novel-coronavirus-covid-19/articleshow/74668635.cms

16
Figure 2: Screenshot of how the symptoms will be presented to participants
Demographic Information
The participants were asked demographic information at the end of the experiment, which
collected the participants' age, gender, level of education, and political affiliation. The
questionnaire is included in Appendix C.
Procedure
The experiment was completed from home using an internet browser and was available
online only. Participants were informed that they are participating in a study relating to COVID-
19, classification and anxiety. They were made aware of the general purpose of the study and
asked to indicate consent by clicking “agree.” Prior to the study, all participants’ state anxiety
was measured using STAI. Participants’ death anxiety was also be measured using the DAQ.
The procedure followed similar methods to the one presented in Gluck and Bower (1988).
Subjects were told to imagine they are a physician, and there is a patient on each trial presenting
with the following four symptoms for 50 trials: 1- dry cough, 2- fever, 2- body aches, and 3-
exhaustion. The list of symptoms ranged from one to four symptoms per trial. They then had to
classify the patient as either positive or negative for COVID-19. If negative, the symptoms were

17
classified as the flu. The symptoms were presented as text on their screen. Each trial followed
with feedback on if they answered correctly, which said “correct – that was COVID-19” or
“incorrect – that was the flu.
Following the experiment, subjects were asked to complete the STAI and DAQ again and
asked to fill out the demographic questionnaire. Lastly, they were granted credit for completing
the study.

18
RESULTS
Accuracy Analysis
We examined changes in accuracy to find any evidence of learning over blocks by
analyzing averages of percentage correct. We also examined if the accuracy results have been
accounted for by the ability to discriminate between categories, d’ and analyze any evidence of
response bias, b. The average accuracy, d’ and b can be referred to in Table 1.
Table 1
Average Measures Over Blocks Block Proportion
Correct d’ b
1 0.60 (0.08) 0.51 (0.44) 0.95 (0.10)
2 0.39 (0.06) 0.31 (0.42) 1.11 (0.19)
3 0.59(0.06) 0.45 (0.35) 0.91 (0.12)
4 0.64 (0.08) 0.76 (0.46) 0.90 (0.20)
The data suggests that the average accuracy levels were higher at block 4, compared to
blocks 1, 2 and 3, as seen in Figure 3. A repeated measures ANOVA showed that accuracy levels
significantly differed between blocks F(3, 93) = 99.62, p<.001, w2 = 0.64. Post hoc testing using
the Bonferroni correction revealed that there was evidence of learning over blocks. After block 2,
the accuracy levels increased between block 2 and block 3, (mean difference = -0.20, p<.001)
and between block 3 and 4, (mean difference = -0.05, p = .02). Specifically, there was an
increase in accuracy from block 1 to block 4, t(31) = 2.36, p = .05, Cohen’s d = 0.42.

19
Figure 3: Average accuracy over blocks. Error bars show standard error.
Discriminability Index (d’) between blocks
The data suggests that d’ was higher at block 4 compared to blocks 1, 2 and 3, as seen in
Figure 4. A repeated measures ANOVA showed that d’ significantly differed between blocks,
F(3, 93) = 8.44, p<.001, w2 = 0.12. Post hoc testing using the Bonferroni correction revealed that
there was evidence of an increase of d’ from block 1 to block 4. After block 2, d’ increased
between block 2 and block 3 (mean difference = -0.14, p = .73) and between block 3 and block 4
(mean difference = -0.30, p = 0.01). Particularly, there was an increase of d’ from start to end of
the trials and was nearly significant in block 4 compared to block 1, t(31) = 2.66, p = .06.

20
Figure 4: Average d’ over blocks. Error bars show standard error.
b levels between blocks
The data suggest that there was an increase in b at block 2, compared to blocks 1, 3 and
4, as seen in Figure 5. A repeated measures ANOVA showed that b differed between blocks,
F(3, 93) = 12.63, p<.001, w2 = 0.21). Post hoc testing using the Bonferroni correction revealed
that there was an evidence of decrease in beta from block 1 to block 4 but it was not significant
(mean difference = 0.06, p = .94).

21
Figure 5: Average of b over blocks. Error bars show standard error.
Scale Scores
We examined the STAI and DAQ scores of participants prior to and after the trials. We
then compared pre experiment STAI and DAQ scores and post experiment STAI and DAQ
scores, in order to test any observation of an increase or decrease in state anxiety and death
anxiety levels after the trials were completed.
On average, participants STAI scores increased by 0.72 points (SE: 1.11 points)
following the experiment. The average STAI score of participants pre-experiment was 40.72
points, while the average STAI score of participants post-experiment was 41.44 points. A paired
samples t-test showed this increase to be nonsignificant, t(31) = -0.65, p = .52, Cohen’s d = -
0.12.

22
The mean difference between participants pre DAQ scores and post DAQ was 0.00 points
(SE: 0.72 points). The average DAQ score of participants both pre-experiment and post-
experiment was 35.34 points. A paired t-test showed this to be nonsignificant, t(31) = 0.00, p =
1.00, Cohen’s d = 0.00.
Pearson’s correlation showed a small, but nonsignificant relationship between pre-STAI
scores and pre-DAQ scores (r = 0.24, p = .18). Pearson’s correlation showed a small, but
nonsignificant, relationship between post-STAI and post-DAQ scores (r = 0.25, p = 0.17).
Relationship between Scale Scores and Performance Measures
We used one-tail tests for the following correlations. Pre-experiment STAI and DAQ
scores with average accuracy levels in block four were examined, to find any significant
correlation between higher STAI and DAQ scores and accuracy levels. We did not use post-
experiment STAI and DAQ scores since there were no significant differences found between
pre-experiment and post-experiment scores. We also examined the scale scores in comparison to
d’ and b. Additionally, we used independent ANOVA to observe any significance between
political affiliation and accuracy, d’ and b.
Pearson’s correlation showed a small, but nonsignificant, relationship between pre-STAI
scores and block 4 accuracy (r = 0.22, p = .89). Pearson’s correlation showed a trivial,
nonsignificant relationship between pre STAI scores and block 4 b (r = -0.06, p = .38). Pearson’s
correlation showed a small, but nonsignificant relationship between pre STAI scores and block 4
d’ (r = 0.2, p = .86).
Pearson’s correlation showed a significant correlation between block 4 accuracy and pre
DAQ scores (r = -0.31, p = .04). It indicates a negative relationship between accuracy levels and

23
pre DAQ scores. In other words, higher pre-experiment DAQ scores (death anxiety) correlates
with lower accuracy levels, as seen in Figure 6. Pearson’s correlation showed a trivial,
nonsignificant relationship between block 4 b and pre DAQ scores (r = 0.02, p = .54). Figure 7
illustrates that response bias stayed about the same throughout the distribution of pre DAQ
scores. Pearson’s correlation showed a significant negative correlation between block 4 d’ and
pre DAQ scores (r = -0.31, p = .04). It indicates an inverse relationship between d’ and pre DAQ
scores, as seen in Figure 8. A higher pre DAQ score correlates with lower ability to discriminate
between categories, which accounts for the negative correlation between pre-DAQ scores and
accuracy. The correlation scores between pre-DAQ scores and accuracy correspond with the
correlation between pre-DAQ scores and d’ because accuracy levels and d’ were nearly perfectly
correlated. Pearson’s correlation showed a significant correlation between block 4 accuracy and
d’ (r = 0.99, p<.001), in which accuracy accounts for 98.8% of the variance in d’.
We also tested the average pre-experiment STAI scores against the midpoint and highest
possible value of the STAI scale using a one sample t-test. There was no significant difference
found between pre-experiment STAI scores and the midpoint of the STAI scale, t(33) = 0.34, p =
.74. However, a one sample t-test showed a significant difference between the pre-experiment
STAI scores compared to the highest possible value on the STAI scale, t(33) = -18.64, p<.001.

24
Figure 6: Accuracy and pre DAQ scores
Figure 7: Response bias and pre DAQ scores

25
Figure 8: Discriminability index and pre DAQ scores.
Block 4 Performance and Political Affiliation
Participants were given four levels of responses to answer about their political affiliation: 1-
democrat, 2- republican, 3- independent, and 4- other. Independent one-way ANOVA showed no
significant effect on block 4 accuracy and political affiliation, F(3, 28) = 1.11, p = .36, w2 =
0.002. Independent one-way ANOVA showed no significant effect on block 4 d’ and political
affiliation, F(3, 28) = 0.805, p = .501, w2 = 0.00. Independent one-way ANOVA showed no
significant effect on block 4 b and political affiliation, F(3, 28) = 0.867, p = .470, w2 = 0.00.

26
DISCUSSION
The present study examined the effects of death anxiety on learning performance.
Participants were instructed to classify if a set of symptoms was positive for COVID19 or
positive for the flu. The symptoms were presented in a similarly to similar to Gluck and Bower’s
1988 category learning study. The hypothesis was that there would be a negative correlation
between death anxiety and learning performance (i.e. participants who score high in death
anxiety will score with lower accuracy in the learning task). The signal detection model was also
used to analyze the participants’ ability to discriminate between categories (d’), and the response
bias (b). The results found evidence to support the hypothesis that death anxiety and task
performance are negatively correlated.
The analysis of accuracy levels showed that accuracy increased from block 1 to block 4
of the trials. This indicates that there was learning of the categories through the experiment.
Additionally, d’ increased from block 1 to block 4, indicating that participants learned the
categories over the course of the experiment. However, d’ was not very large, which was
expected, as average accuracy levels in block 4 was only at about 64% correct. This low
accuracy can be linked with the response bias, b. b stayed about the same throughout the trials.
In three out of the four blocks, b was less than 1, indicating a steady response bias towards
picking COVID-19 as the answer. In other words, when participants are unsure of the answer,
they had a bias to pick COVID-19 instead of the flu. It is important to note that there was an
absence of any task related incentives to be biased towards picking COVID-19 as the answer;
there were equal numbers of COVID-19 stimuli and flu stimuli. Therefore, the response bias

27
towards COVID-19, was naturally occurring, implying that it was taken more seriously than the
flu.
The signal detection model breaks down performance level by measuring the
discriminability (d’) and the response bias (b). Combined, d’ and b lead to the overall accuracy
level. Our hypothesis was that higher death anxiety levels would correlate with lower accuracy
levels. However, we were unsure if the lower accuracy levels would be due to the inability to
discriminate between categories, or a response bias. Results found that there was a response bias,
but it was surprisingly unrelated to pre-DAQ scores. However, results found that d’ was
correlated with pre-experiment death anxiety levels, so it accounts for the correlation between
accuracy and pre-DAQ scores. It is not clear why higher death anxiety levels cause lower levels
of discriminability.
Scale scores were analyzed to understand if there was any relationship between STAI and
DAQ scores. There was a slight increase in average STAI scores from pre-experiment to post-
experiment, but the analysis found this to be a nonsignificant increase. There was no change in
average death anxiety scores from pre-experiment to post-experiment. Additionally, there was no
significant relationship found between pre-experiment STAI and DAQ scores. There was also no
significant relationship found between post-experiment STAI and DAQ scores. There is no
present literature that suggests that state anxiety and death anxiety have any specific relationship.
The finding that there was no significant relationship was found between pre-experiment
and post-experiment scale scores indicates that the task did not induce anxiety or death anxiety
using COVID-19 as a threat-related stimulus. Therefore, only the pre-experiment scale scores
were used to analyze the relationship between scale scores and performance measures in the
tasks.

28
The analysis showed no significant correlation between pre-experiment STAI scores and
accuracy, response bias (b) or discriminability index (d’). This finding is unlike Eysenck’s
theory that explains the relationship between working memory, anxiety, and performance (Dutke
et al., 2001). His theory indicates that task-irrelevant thoughts that occupy working memory
capacity cause a decrease in performance in individuals with high test anxiety (Dutke et al.,
2001). The lack of any relationship between pre-STAI scores and performance measures
indicates that state anxiety levels did not affect performance.
In contrast, results found that pre-experiment DAQ scores had an inverse relationship
with accuracy levels. Higher pre-DAQ scores correlated with lower accuracy levels, while lower
pre-DAQ scores correlated with higher accuracy levels. Additionally, results also indicated an
inverse relationship between d’ and pre-experiment DAQ scores. Higher pre-DAQ scores
correlated with a lessened ability to discriminate between categories. On the other hand, there
was no significant relationship between pre-experiment DAQ scores and b levels, indicating that
there was no relationship between death anxiety and response bias. These findings supported the
original hypothesis of a negative correlation between death anxiety and learning performance. It
also supports the idea that there was an overall response bias towards picking COVID-19 over
the flu.
The present study did not induce death anxiety or state anxiety, as there was no
significant change between pre-experiment scale scores and post-experiment scale scores. This
might be due to a ceiling effect, as the threat-related stimuli manipulated the current COVID-19
pandemic, and participants might be already in a state of death anxiety. Future studies can reduce
a possible ceiling effect by repeating the study post-pandemic and with threat-related stimuli
unrelated to COVID-19.

29
To conclude, the present study found that death anxiety is a predictor of classification of
bias towards a more serious disease in classification. This bias seems to be unrelated to state
anxiety, or STAI scores. The signal detection model indicates a predicted effect on
discriminability index, which correlated to pre-experiment death anxiety levels. Additionally,
although the predicted response bias showed up in the data, it was not correlated with death
anxiety levels. There was also no relation to political affiliation, which was thought to bias
beliefs about COVID-19.

30
APPENDIX A: STATE-TRAIT INVENTORY TEST

31
1. I feel calm
2. I feel secure
3. I am tense
4. I am regretful
5. I feel at ease
6. I feel upset
7. I am presently worrying about possible misfortunes
8. I feel rested
9. I feel anxious
10. I feel comfortable
11. I feel self-confident
12. I feel nervous
13. I am jittery
14. I feel “high strung”
15. I am relaxed
16. I feel content
17. I am worried
18. I feel over-excited and rattled
19. I feel joyful
20. I feel pleasant

32
APPENDIX B: DEATH ANXIETY QUESTIONNAIRE

33
1. Do you worry about dying?
2. Does it bother you that you may die before you have done everything you wanted to?
3. Do you worry that you may be very ill for a long time before you die?
4. Does it upset you to think that others may see you suffering when you die?
5. Do you worry that dying may be very painful?
6. Do you worry that the persons most close to you won’t be with you when you are dying?
7. Do you worry that you may be alone when you are dying?
8. Does the thought bother you that you might lose control of your mind before death?
9. Do you worry that expenses connected with your death will be a burden for other people?
10. Does it worry you that your instructions or will about your belongings may not be carried
out after you die?
11. Are you afraid that you may be buried before you are really dead?
12. Does the thought of leaving loved ones behind when you die disturb you?
13. Do you worry that those you care about may not remember you after your death?
14. Does the thought worry you that with death you may be gone forever?
15. Are you worried about not knowing what to expect after death?

34
APPENDIX C: DEMOGRAPHIC INFORMATION QUESTIONNAIRE

35
1. Age:
_______
2. Gender:
a. Male
b. Female
c. Other
3. Year in School:
a. Freshman
b. Sophomore
c. Junior
d. Senior
e. Graduate student
4. Political Affiliation:
a. Democrat
b. Republican
c. Independent
d. Other

36
REFERENCES
American Psychiatric Association. (2013). Diagnostic and Statistical Manual of Mental
Disorders, Fifth Edition (DSM-5(TM)) (5th ed.). American Psychiatric Publishing.
Ashcraft, M. H., & Kirk, E. P. (2001). The relationships among working memory, math anxiety,
and performance. Journal of Experimental Psychology: General, 130(2), 224–237.
Bishop, S., Dunan, J., Brett, M., & Lawrence, A. (2004). Prefrontal cortical function and
anxiety: controlling attention to threat-related stimuli.
Burke, B. L., Martens, A., & Faucher, E. H. (2010). Two Decades of Terror Management
Theory: A Meta-Analysis of Mortality Salience Research. Personality and Social
Psychology Review, 14(2), 155–195.
Byrne, A., & Eysenck, M. W. (1995). Trait anxiety, anxious mood, and threat
detection. Cognition & Emotion, 9(6), 549–562.
Calvo, M. G., & Cano-Vindel, A. (1997). The Nature of Trait Anxiety. European
Psychologist, 2(4), 301–312.
Derakshan, N., & Eysenck, M. W. (1997). Interpretive biases for one’s own behavior and
physiology in high-trait-anxious individuals and repressors. Journal of Personality and
Social Psychology, 73(4), 816–825.
Derakshan, N., & Eysenck, M. W. (2009). Anxiety, Processing Efficiency, and Cognitive
Performance. European Psychologist, 14(2), 168–176.
Dutke, S., & Stöber, J. (2001). Test anxiety, working memory, and cognitive performance:
Supportive effects of sequential demands. Cognition and Emotion, 15(3), 381–389.
Eysenck, M. W. (1997). Anxiety and cognition: a unified theory. Psychology Press.

37
Eysenck, M. W., Derakshan, N., Santos, R., & Calvo, M. G. (2007). Anxiety and cognitive
performance: Attentional control theory. Emotion, 7(2), 336–353.
Gao, T., Zhou, Y., Li, W., Pfabigan, D. M., & Han, S. (2019). Neural mechanisms of
reinforcement learning under mortality threat. Social Neuroscience, 15(2), 170–185.
https://doi.org/10.1080/17470919.2019.1668846
Gellman, M., & Turner, J. R. (2013). Encyclopedia of Behavioral Medicine. Springer Publishing.
Gluck, M. A., & Bower, G. H. (1988). From conditioning to category learning: An adaptive
network model. Journal of Experimental Psychology: General, 117(3), 227–247.
https://doi.org/10.1037/0096-3445.117.3.227
Heeger, D. (2003–2007). Signal Detection Theory. Department of Psychology, New York
University. https://www.cns.nyu.edu/%7Edavid/handouts/sdt/sdt.html
MacLeod, C., & Hagan, R. (1992). Individual differences in the selective processing of
threatening information, and emotional responses to a stressful life event. Behaviour
Research and Therapy, 30(2), 151–161.
Markman, A. B., Maddox, W. T., & Worthy, D. A. (2006). Choking and Excelling Under
Pressure. Psychological Science, 17(11), 944–948.
Mogg, K., Mathews, A., Bird, C., & Macgregor-Morris, R. (1990). Effects of stress and anxiety
on the processing of threat stimuli. Journal of Personality and Social Psychology, 59(6),
1230–1237.
Luo, S., Wu, B., Fan, X., Zhu, Y., Wu, X., & Han, S. (2019). Thoughts of death affect reward
learning by modulating salience network activity. NeuroImage, 202, 116068.
https://doi.org/10.1016/j.neuroimage.2019.116068
Shackman, A. J., Sarinopoulos, I., Maxwell, J. S., Pizzagalli, D. A., Lavric, A., & Davidson, R.

38
J. (2006). Anxiety selectively disrupts visuospatial working memory. Emotion, 6(1), 40–
61.
Spielberger, C. D. (1983). State-Trait Anxiety Inventory for Adults. PsycTESTS Dataset.
Swets, J. A., Dawes, R. M., & Monahan, J. (2000). Better Decisions through Science. Scientific
American, 283(4), 82–87.
TIMESOFINDIA.COM. (2020, March 20). What are the symptoms of COVID-19. The Times of
India. https://timesofindia.indiatimes.com/india/what-are-the-symptoms-of-novel-
coronavirus-covid-19/articleshow/74668635.cms