effects of cross-border listing on firm’s financial
TRANSCRIPT

AN ASSESSMENT OF THE EFFECTS OF CROSS-BORDER LISTING ON FIRM’S
FINANCIAL PERFORMANCE. THE CASE OF KENYAN LISTED COMPANIES
MUGO ROBERT KARUNGU
A Research Project Submitted To the Graduate School in Partial Fulfillment for the
Requirements of the Award of the Degree of Master of Business Administration of Egerton
University
EGERTON UNIVERSITY
SEPTEMBER 2010

ii
DECLARATION AND APPROVAL
Declaration
This is my original work and has not been submitted to any other institution of higher learning.
MUGO ROBERT KARUNGU DATE
CM11/0302/07
Recommendation
This Research Project has been submitted with our approval as University Supervisors.
DR. GEORGE OWUOR, PhD DATE
Senior Lecturer, Egerton University
DR. SAMUEL ONYUMA, PhD DATE
Lecturer, Egerton University

iii
DEDICATION
This Research Project is dedicated to my Parents Mr. & Mrs. Charles Karungu. Thank you
for the way you raised me-encouraging me to work hard. You showed and taught me good virtues. I
appreciate for the much needed financial and emotional support that you have always given me. May
God make you live long to see the fruits of your son‟s hard work. You always stood by me when I
was giving me hope in all I undertook.
I would also like to dedicate this work to my brother Edward Njogu and my niece Evelyn
Njeri; I wish it would serve to inspire, challenge and direct you to originality, competency and self-
actualization.

iv
ACKNOWLEDGEMENT
Many people have contributed immensely to the preparation of this project. I am indeed
grateful to the many who has made me reach this far. I feel greatly indebted to my supervisors Dr.
Owuor and Dr. Onyuma whose constructive criticisms and much valued ideas really assisted me in
the project work. Your dedication as finance lecturers made me have a great passion of the Finance
field. Thank you for your professional guidance in my project and during my course work. I
appreciate for the articles that Dr. Onyuma availed to me during my research; these really broadened
my knowledge in the stock markets field. I would also like to acknowledge my colleagues Grace
Kakiya and Mary Bosire whom we closely worked with during the entire course work and in the
project; without your assistance and moral encouragement I would not have come this far. I would
like to express my gratitude to the staff of libraries of Egerton University and University of Nairobi
for the much assistance they provided me when I was doing my reviews. Most of all, I express my
gratitude to Lord God Almighty. Without you Jehovah, I would not be where I am. I am where I am
because of you Lord. May your name Jehovah be Glorified.

v
ABSTRACT
The aim of the study was to identify the effects of cross-border listing on firm‟s financial
performance of listed Kenyan-based companies on the East African Bourse. However, there is
scanty empirical evidence on the effects of cross-border listing on a firm‟s financial performance
since this is an emerging trend in developing economies. Every company requires funds to meet its
financial obligations. The most common source of funds remains equity, which is raised through
financial markets. As firms forge cross-border in investment lack of information on the factors that
are worth addressing and the effects of expanding across the borders becomes a major constraint in
strategic planning and predictable success of the firms. Thus, a need to identify constraints and
effects of cross listing become instrumental in the global financial economy. Following on the above
dilemma, this study had the main objective of determining the effects of cross listing on firm‟s
financial performance by listed Kenyan companies. The study focused on cross-listed firms and a
similar number of non cross-listed in similar sub-sectors. The non cross-listed were selected using
purposive sampling method. The study covered the pre and post-listing financial performance of the
firms two years before and after cross listing. Two of the cross-listed firms were excluded in the
study because their duration was less than two years. Secondary data was collected and analyzed
from published financial reports, which were obtained from Capital Markets Authority (CMA). Karl
Pearson‟s correlation co-efficient and t test (one and two tailed) were used to test for relationships of
the financial ratios computed. Most of the results were not statistically significant. Liquidity
improved for most of the firms apart from the results of one; most had a t value greater than 3 and a
p value less than 0.03. profitability of most firms also increased after they cross-listed. When firms
raise capital through cross listing, their EPS reduces due to the dilution effect. From data analyzed,
it was found that all firms in similar sub-sectors were highly interlinked since all had a correlation
greater than 0.6. In all the cross-listed firms, the majority shareholders owned more than 25% but
less than 49% of shares thus implying being associates. When firms cross-list, their P/E ratio
increase; this could translate to goodwill that investors place on the firm thus having patience to wait
for their returns. The findings of the study will be expected to help the investing public and decision
makers to be more enlightened on cross listing issues. The study will also be expected to add
knowledge on existing literature since much has not been done in this area.

vi
TABLE OF CONTENTS
DECLARATION AND APPROVAL ................................................................................................ ii
DEDICATION.................................................................................................................................... iii
ACKNOWLEDGEMENT ................................................................................................................. iv
ABSTRACT ......................................................................................................................................... v
TABLE OF CONTENTS .................................................................................................................. vi
LIST OF TABLES .............................................................................................................................. x
LIST OF FIGURES .......................................................................................................................... xii
LIST OF APPENDICES ................................................................................................................. xiii
ABBREVIATIONS .......................................................................................................................... xiv
CHAPTER ONE: ................................................................................................................................ 1
INTRODUCTION............................................................................................................................... 1
1.1 Background of the Problem ............................................................................................................ 1
1.2 Problem Statement .......................................................................................................................... 3
1.3 Objectives of the Study ................................................................................................................... 4
1.4 Research Hypothesis .................................................................................................................. 4
1.5 Justification of the Study ................................................................................................................ 5
1.6 Scope and Organization of the Study.............................................................................................. 5
1.7 Limitations and Delimitations of the Study .................................................................................... 6
1.7.1 Limitations of the Study............................................................................................................... 6
1.7.2 Delimitations of the Study ........................................................................................................... 6

vii
1.8 Operational Definition of Terms ..................................................................................................... 7
CHAPTER TWO: ............................................................................................................................. 10
LITERATURE REVIEW ................................................................................................................ 10
2.1 Market Segmentation Theory ....................................................................................................... 10
2.2 Trends in Cross listing .................................................................................................................. 11
2.2.1 Cross listing in the World .......................................................................................................... 11
2.2.2 Cross listing in Africa ................................................................................................................ 12
2.2.3 Cross listing in East African Bourse .......................................................................................... 14
2.3 Empirical Literature ...................................................................................................................... 15
2.4 Critique of the Literature Review ................................................................................................. 22
2.5 Arguments in Favour and against Cross listing ............................................................................ 23
2.5.1 Arguments in Favour of Cross listing ........................................................................................ 23
2.5.2 Arguments against Cross listing ................................................................................................ 25
2.6 Conceptual Framework ................................................................................................................. 26
CHAPTER THREE: ......................................................................................................................... 29
RESEARCH METHODOLOGY .................................................................................................... 29
3.1 Research Design............................................................................................................................ 29
3.2 Target Population .......................................................................................................................... 29
3.3 Data Collection ............................................................................................................................. 30
3.4 Data Analysis ................................................................................................................................ 30

viii
CHAPTER FOUR: ........................................................................................................................... 33
RESULTS AND DISCUSSIONS ..................................................................................................... 33
4.1 Attributes of cross-listed companies ............................................................................................. 33
4.1.1 Jubilee Holdings Ltd. ................................................................................................................. 33
4.1.2 Kenya Airways........................................................................................................................... 36
4.1.3 East African Breweries .............................................................................................................. 39
Source: www.eabl.co.ke, 2009 ........................................................................................................... 41
4.2 Pre and Post Performance of Listed Companies ........................................................................... 41
4.2.1.1 Performance of EABL Two Years Before and After It Cross-Listed ..................................... 41
4.2.1.2 Two Tailed T Test Results on EABL‟s Performance Two Years Before and After It Cross-
Listed................................................................................................................................................... 43
4.2.2.1 Financial Performance for Kenya Airways Two Years Before and After It Cross-Listed ..... 44
4.2.2.2 Two Tailed T Test on Financial Performance for Kenya Airways Two Years Before and
After It Cross-Listed ........................................................................................................................... 46
4.2.3.1 Financial performance of Jubilee Holdings Ltd. holdings two years before and after it cross-
listed .................................................................................................................................................... 48
4.2.3.2 Two Tailed T Test Results on Financial Performance of Jubilee Holdings Ltd. Holdings Two
Years Before and After It Cross-Listed .............................................................................................. 50
4.3. Financial Performance of Cross and Non-Cross-listed Firms Two Years after Cross listing of the
Cross-Listed Firms .............................................................................................................................. 51
4.3.1.1 Comparison of NMG and KQ Two Years after KQ Cross-Listed.......................................... 51
4.3.1.2 One Tailed T Test Results on the Comparison of NMG and KQ Two Years after KQ Cross-
Listed................................................................................................................................................... 53

ix
4.3.2.1 Comparison of EABL and ARM Two Years after Cross listing of EABL ............................ 54
4.3.2.2 One Tailed T Test Results on the Comparison of EABL and ARM 2 Years after Cross listing
of EABL .............................................................................................................................................. 56
4.3.3.1 Comparison of the Performance of Jubilee Holdings and Kenya-Re Insurance, Two Years
after Jubilee Cross-Listed ................................................................................................................... 57
4.3.3.1 One Tailed T Test Results on Comparison of the Current Performance of Jubilee Holdings
and Kenya-Re Insurance ..................................................................................................................... 60
4.4 Current Financial Performance of Cross and Non-Cross-listed Firm ........................................... 61
4.4.1.1Comparison of the Current Performance of EABL and ARM ................................................ 61
4.4.2.1 One Tailed T Test on Comparison of the Current Performance of EABL and ARM ............ 64
4.4.1.2 Comparison of the current performance of KQ and NMG ..................................................... 65
4.4.2.2 One Tailed T Test Results on Comparison of the Current Performance of KQ and NMG .... 67
CHAPTER FIVE: ............................................................................................................................. 69
SUMMARY, CONCLUSIONS AND RECOMMENDATIONS .................................................. 69
5.1 Summary of the Results ................................................................................................................ 69
5.2 Conclusions ................................................................................................................................... 71
5.3 Recommendations for Further Study ............................................................................................ 72
REFERENCES .................................................................................................................................. 74
Appendix 1: DATA COLLECTION SHEET ................................................................................. 78
Appendix 2: COMPANIES LISTED AT THE NSE ...................................................................... 79

x
LIST OF TABLES
Table 1; Dates When Kenyan-Based Firms Cross-Listed On the East African Bourse 15
Table 2: Distribution of Shareholders of Jubilee Holdings ltd as At 31 December 2008 36
Table 3: List of 10 Largest Shareholders of Jubilee Holdings Ltd. Holdings as at
31 December 2008: 37
Table 4: List Of Kenya Airways Top Shareholders 40
Table 5: East African Breweries Top Ten Shareholders 42
Table 6a: EABL‟s Performance Two Years Before And After It Cross-Listed 44
Table 6b: EABL‟s Performance Two Years Before And After It Cross-Listed 45
Table 7a; Financial Performance for Kenya Airways Two Years Before and After
It Cross-Listed 47
Table 7b; Financial Performance for Kenya Airways Two Years Before and After
It Cross-Listed 48
Table 8a: Financial Performance of Jubilee Holdings Ltd. Holdings Two Years
Before and After It Cross-Listed 50
Table 8b: Financial Performance of Jubilee Holdings Ltd. Holdings Two Years
Before and After It Cross-Listed 51
Table 9a: Comparison of NMG and KQ Two Years after KQ Cross-Listed 53
Table 9b: Comparison of NMG and KQ two years after KQ cross-listed 55
Table 10a: Comparison of EABL and ARM 2 Years after Cross listing of EABL 56
Table 10b: Comparison of EABL and ARM 2 Years after Cross listing of EABL 58

xi
Table 11a: Comparison of the Current Performance of Jubilee Holdings
and Kenya-Re Insurance 60
Table 11b: Comparison of the Current Performance of Jubilee Holdings
and Kenya-Re Insurance 62
Table 12a: Comparison of the Current Performance of EABL and ARM 64
Table 12b: Comparison of the Current Performance of EABL and ARM 65
Table 13a; Comparison of the Current Performance of KQ and NMG 67
Table 13b; One Tailed T Test on the Comparison of the Current
Performance of KQ and NMG 69

xii
LIST OF FIGURES
Figure 1: Conceptual Framework 28

xiii
LIST OF APPENDICES
Details Page
Appendix 1: Data Collection Sheet. 78
Appendix 2: Companies Listed at the NSE 79

xiv
ABBREVIATIONS
AIMS Alternative Investment Market Sector
ASEA African Stock Exchanges
CDSC Central Depository Securities Corporation
CEO Chief Executive Officer
CMA Capital Markets Authority
DPS Dividends per Share
DSE Dar-es Salam Stock Exchange
DY Dividends Yield
EABL East African Breweries Ltd
EASRA East African Security Regulatory Authorities
EBIT Earnings before Interest and Tax
EPS Earnings Per Share
EY Earnings Yield
GDP Gross Domestic Product
GP Gross Profit
IPO Initial Public Offer
KCB Kenya Commercial Bank
KQ Kenya Airways
MIMS Main Investment Market Sector
MOU Memorandum of Understanding

xv
NASDAQ National Association of Securities and Dealers Automated Quotations
NASI Nairobi All Share Index
NMG Nation Media Group
NSE Nairobi Stock Exchange
NYSE New York Stock Exchange
P/E Price Earnings Ratio
ROCE Return on Capital Employed
ROE Return on Equity
RSE Rwandese Stock Exchange
USE Ugandan Stock Exchange

1
CHAPTER ONE;
INTRODUCTION
1.1 Background of the Problem
Businesses require resources to enable them serve the needs of their customers
effectively. This implies that their owners have to go an extra mile to source the funds necessary
to sustain their customers. The most common types of long-term financing in Kenya include
long-term debt, common stock, preferred stock and retained earnings. Thus, firms may borrow or
use their available savings. However, as they continue to expand they resort to borrowing. Equity
or debts are the only options at their disposal but most prefer to use equity because it forms a
permanent source of funding that cannot be easily redeemed. When firms raise equity they may
raise it within their own boundaries, or go beyond their national boundaries. The former is
referred to as listing, while the latter is known as cross listing. Listing is the admission of a
company into a stock market after meeting certain regulatory requirements set by the regulatory
authority of that particular country. For a company to be listed it has to be a public company.
The stock market in Kenya is known as the Nairobi Stock Exchange (NSE). Constituting
a voluntary association of stockbrokers, the NSE was formed in 1954. It has had a remarkable
development to become amongst the most vibrant stock markets in Africa. According to NSE
website, its market capitalization saw tremendous improvement hitting Ksh. 1.3 Trillion after
listing of Safaricom Ltd. Over the last 5 years, turnover at the NSE has grown phenomenally
from Sh2.9 billion in 2002 to Sh95 billion in 2006 while the number of CDSC accounts that have
been opened have in the last 2 years increased from 80,000 in 2005 to over 1,000,000 investors
to date (www.nse.co.ke). Currently, there are 55 stocks listed in the NSE, out of which 51 are
actively traded. In the Commercial & Services sector, the stocks of Uchumi Supermarkets Ltd
and Hutchings Biemer were suspended from trading. In the AIMS (Alternative Investments
Markets Segment) Kenya Orchards and A Baumann & Co. Ltd have been suspended. NSE has
continued to play an important role in economic development, especially concerning its role in
financial intermediation. Securities traded at NSE are bonds and shares that constitute the
markets two broad segments. The stock market is referred to as Floating Interest Rates market,
which is divided into two segments; the Main Investments Market Segment (MIMS) &

2
Alternative Investments Market Segment (AIMS). MIMS has four segments namely
Agricultural, Commercial and Services, Finance & Investment, and Industrial & Allied sector.
Characterized by its liquidity, market capitalization and turnover, the NSE may be classified as
both emerging market and frontier market (Muhanji, 2000). NSE is a model emerging market in
view of its high returns, vibrancy and well developed market structure (Ogum et al, 2000). It is
among the most vibrant African Bourse, and is the most developed security market in Eastern
Africa. In the year 2009, the bourse introduced a market indicator named as the NSE All Share
Index (NASI). Thus, it raises interest and sets a precedent for comparison with other emerging
markets in Africa and the world at large (Nyambura, 2005).
CMA strives to ensure that companies disclose to investors all they need to know before
admitting them to the bourse and on a continuous basis after listing. According to the CMA Act
Cap 12(2) (d), a securities exchange shall within four months after end of a financial year make
available to the authority and to the investors, a summary of information on companies listed at
the securities exchange (Chebii, 2006). A stock exchange will be required by the regulatory
authority to furnish information regarding a firm‟s Earning Per Share (EPS), Dividend Per Share
(DPS), shareholding structure (institutional, retail and foreign investors), major shareholders and
total number of shareholders. The integration and associated globalization of capital markets has
opened up a vast array of new sources and forms of project financing. Today‟s corporate
treasures can access foreign capital markets as easily as those at home (Levi, 1996). Cross-border
listing is listing of securities in a local exchange by a foreign-based company. Shares ought to be
issued in the country in which the best price can be achieved, net of issuing costs. Where issuing
costs are the same the company should list in a country where expected equity rate of return is
lowest. If all markets were fully integrated, the expected cost of equity capital will be the same
every country. When capital markets are segmented, as it is the case today, expected returns on
the same security are different in different markets (Levi, 1996). It is due to capital-market
segmentation, companies find it more advantageous to issue shares simultaneously in two or
more countries‟ equity markets.
There have been limitations in the stock markets such as; static demand and supply of
stocks over long periods of time, capital constraints which have delayed their growth potential

3
and legal impediments that confine companies to their home country boundaries as far as raising
funds is concerned. Most emerging stock markets, like in Kenya, are highly concentrated. This
makes them undeveloped, small and illiquid, thus exhibiting pricing volatility and error. When a
firm is unable to raise extra capital outside its boundaries, and it has exhausted available local
resources, its growth potential grows dim. Low growth potential reduces profitability, and as a
result, unemployment is likely to increase. This is not good for any economy.
When firms decide to cross-list (Stulz, 1999), there are certain things they need to have
ready. First, there must be a presence of an independent board of directors. This ensures that in
the global markets, investors will have confidence that management will properly utilize the
resources injected into the firm. Secondly, the firm must receive certification from the capital
markets. Securing highly reputed investment banks will help the firm secure the lowest issue
costs. Thirdly, there has to be a legal protection of the minority shareholders. The firm must
ensure that the rights of the minority shareholders are not over stepped. Lastly, the firm must
abide by the stringent disclosure requirements. Cross listing on a market with strict rules is one
way of making companies more committed and have more disclosure. From historical records, it
can be established that Kenyan based companies that have undertaken cross-border listing have
strong financial base. This is in respect to profitability, branch networking, and good growth
potential. However, it has not been established empirically what the real effects of cross-border
listing on a firm‟s financial performance are.
1.2 Problem Statement
There are only five companies listed in the Kenyan Bourse that have undertaken cross-
border listing out of fifty one actively trading listed firms have undertaken this form of listing.
Three of these firms are in the Finance and Investment sub-sector, one in the Industrial and
Allied, and the other in the Commercial and Services sub-sector of the MIMS. In the Ugandan,
Rwandese and Tanzanian Bourse, no company has cross-listed. Issuing cost is high hence, an
impediment to raising additional capital; this reduces the net amount that a listed company
raised. Insufficient information on the effects of expanding across the borders is also a major
constraint in strategic planning and predictable success of the firms. Thus, a need to identify
constrains and effects of cross listing become instrumental in the financial performance. Much is

4
spent in paying the transaction advisers, underwriters and marketing the offer. If all the markets
in the world were integrated, situations as to where to raise extra capital would not arise because
as the cost would be the same everywhere. Firms, when there is integration, would raise as much
capital as they desire and profits would consequently go up Ceteris Peribas. This is however not
the case, the world markets are segmented making companies to carefully evaluate where they
will raise their much needed funds. It is not clear why only few listed companies in Kenya cross
list. The question is, “What constraints the firms from listing across the borders?”
1.3 Objectives of the Study
The general objective of the study was to evaluate the effects of cross listing on financial
performance in the East African Bourse on Kenyan-Based listed firms. The study thus aimed to
bringing a clear picture of what effects are felt or brought by the few companies that have
embraced this trend.
Specific objectives of the study were:
1. To characterize the attributes of cross-listed firms
2. To determine the relationship between cross listing and financial performance
3. To compare the financial performance of cross-listed and non-cross listed firms
4. To examine the current financial performance of cross-listed firms and non cross-listed firms
1.4 Research Hypothesis
H0; there is no special attribute in cross-listed firms
H0; there is no relationship between cross listing and financial performance
H0; there are no changes in the post cross listing financial performance of cross-listed firms in
comparison with financial performance of non cross-listed firms at the same duration
H0; there are no differences in the current financial performance of cross-listed and non cross-
listed firms
5
1.5 Justification of the Study
This is an emerging finance issue and being a developing economy, this trend is being
embraced in Kenya. Companies in developed countries have found it necessary and easier to
raise capital through this avenue. This may be due to minimal chances of foreign risk. This is
especially in International Finance where hostile domestic countries may confiscate the assets of
Multi-National Corporations (MNCs), which are from „unfriendly‟ countries. Because cross
listing is a relatively new term in Kenya, this study will bridge the knowledge gap on the effects
of cross listing on a firm‟s financial performance of Kenyan based companies cross-listed on the
East African Bourse. Specifically, it will shed light on the effects of cross listing on
diversification of risks, increase capital base, dilution of EPS and growth potential of firms that
conduct it. It was necessary to obtain this knowledge and use it to enlighten Kenyan public,
company CEO‟s and scholars to embrace it. The results of the study will assist Kenyan investing
public, company CEOs, and scholars. Scholars will have a deep understanding by knowing this
emerging global trend. This will also add value to the academic field since little research has
been done locally on cross listing. They will use the knowledge from the study to act as catalysts
in their various fields of specialization. They will dispose knowledge to the entire country and it
will have a multiplier effect on the Kenyan economy. Thus, the study provided empirical
evidence on the effects of cross-border listing on a firm‟s financial performance.
1.6 Scope and Organization of the Study
All cross-listed firms which were more than two years old since they first cross-listed
were included in the study. Due to the short duration of KCB and Equity Bank after they had
undertaken cross listing, their financial statements were not analyzed because they may have
lacked concrete information about the effects on financial performance. Three other firms in the
same sub-sectors of the economy were included in the study. In the cross-listed firms, their
financial performance was obtained two years before and after they had cross-listed. For those
firms that had not cross-listed, a similar period-two years post financial performance-was
compared with that of the cross-listed firms in the same sub-sector of the economy. From these
results, financial ratios were computed and tested using both one and two tailed t tests to assess
their significance at a 95% confidence level. A Karl parsons‟ correlation co-efficient was also
run on the financial ratios to assess the magnitude and direction of the relationship.

6
1.7 Limitations and Delimitations of the Study
1.7.1 Limitations of the Study
Only five firms have undertaken cross listing. This is quite a small sample and the results
may not be generalized to firms that will cross-list in the future. Three firms were used to
analyze the effects of cross listing on financial performance.
It was not possible to study firms at the same time because they did not cross-list
concurrently. Also in respect to cross listing, firms studied did not list their securities at the same
time in the East African stock markets and not all have listed in all the exchanges.
Lack of reliability on the data collected. Financial statements may sometimes be made
with collusion between the management and the auditors and the public thus believes them as the
whole truth. This has happened especially in large corporations such as Enron which after
sometime came crumbling down.
1.7.2 Delimitations of the Study
In respect to the limitation as to the number of firms cross-listed, this was overcomed by
the fact that the firms were distributed in all sub-sectors of the economy except the agricultural
sector. For instance, Jubilee Holdings Ltd. is in the Finance & Investments, EABL is in the
Industrial & Allied, and Kenya Airways is in the Commercial & Services subsector.
The limitation that the firms did not cross-list at the same time was be treated in the
respective periods that they cross-listed. The time in which the firms cross-listed for the first time
was be the one applied in the study. Subsequent cross listing was not applied in the data analysis.
The study put reliability on the financial data obtained because it is believed that
professional integrity rules on the part of the auditors and thus they always give an objective
opinion regarding the financial statements.

7
1.8 Operational Definition of Terms
Associate; this is a company where more than 25% but less than 49% of its share capital is
owned by one party. This party could be an individual, a firm or a consortium of
investors.
Capital employed; this is also called net assets. It is computed as: (Current Assets - Current
Liabilities + Net Fixed Assets), or (Total Shareholders‟ Funds + Non Current Liabilities).
Net assets indicates what the business has that can sustain it in its long-term operations.
The key point is that it excludes the current obligations.
Cross listing, this is the admission of a locally incorporated firm in an exchange outside its
domestic market. This means that foreigners can have a share of the firm at their own
country‟s boundaries. Here firms allow domestic investors to trade in foreign firms
stocks. A good example is the trading of Kenya Airways on the Ugandan Bourse.
Demutualization of stock markets; this is changing of stock markets to public for profit
corporations where the stock markets are owned by shareholders and not members
(Onyuma, 2006)
Dilution effects; this is the reduction of earnings attributable to common stockholders. This
is normally due to the increased number of shares as contrasted with the increase in
earnings of a firm. Thus, the dividend per share will relatively reduce.
Diversification; this is a business strategy undertaken by firms to facilitate their survival
and continuity in the business world (Mwangi, 2003).It can involve sale of completely a
new product, entering new market (possibly using new version of existing products), or
imitating products of other firms (subject to patent restrictions).
Dividend payout; this is the amount of earnings that the management decides to pay to share
holders. It is normally calculated as: earnings after tax and preference dividends subtract
the profits retained. Most of the firms set this as a predetermined ratio to allow the
shareholders budget on what they are supposed to take home.

8
Earnings attributable to ordinary shareholders; this is profits after payment of corporation tax
and preference dividends. It is normally used in the calculation of the Earnings Per Share
(EPS)
Euro-Equity shares; these are shares that belong to a company whose mother country is
foreign, but they trade in the bourse of the country in which the firm is a residence.
Financial performance; this is an indicator of how a firm has generated over a duration of time.
It is measuring the results of a firm‟s policies and operations in monetary terms. The
results are reflected using ratios such as Profitability, Gearing, Equity-Related and
Liquidity ratios.
Foreign risk; these are risks a firm will face that it would otherwise not have incurred if it
remained within its mother country boundaries. These may include possibility of
takeover by the host country, attitudes of consumers of the host country and
blockage of fund transfers.
Integrated Stock Market: This is a market, where without restrictions; investors in one country
can buy and sell equities that are issued in another (Onyuma, 2006). Here stocks are
issued and traded at the same price across markets after adjustment for foreign exchange
rates.
Interest Rate Parities; This theory states that forward premium equals interest rate
differential that is the interest rate differential must equal the differential between the
forward and spot exchange rates. A difference in interest rates must be offset by a
difference between spot and forward exchange rates.
Liquidity; this is how much an investor demands and lays his/her attention to a specific stock.
Stocks are said to be liquid when the rate at which they change hands is relatively high.
Listing; this is the admission of a locally incorporated company in a local stock exchange. For
instance, granting permission to trade of KENGEN‟s shares in the NSE and Super Sport
in the South African Bourse.

9
Market capitalization; this is the value of a company on a specific day of trading. It is computed
by multiplying the outstanding equity shares by the ruling market price on a particular
day. The market price is normally the one at the close of the trading. Thus as prices
fluctuate, so does the market capitalization of a company. Market capitalization is
positively correlated with market price of a security. Thus, increase in price means larger
market capitalization. Vice versa stands true.
Market segmentation; these are disparities in terms of different tax regimes, information
asymmetry, and foreign ownership. Market segmentation serves as a barrier to integration
of financial markets. In essence, it follows the theory of „divide-and-rule‟ tactics.
Seasoned Equity offering; this is a new equity issue of securities by a company that has
previously issued securities to the public before.
Securities; these are the sources of long-term finance to a firm. They are categorized into fixed
interest and floating interest securities. Fixed interest securities are those that have a
constant rate of return. For instance, debentures, preference shares and long-term debt are
fixed interest securities. Floating interest securities are those that do not have a fixed rate
of return. They are the ordinary shares, which are entitled to a residual claim on the
company‟s profits. Holders of these securities get the largest share when excess profits
are made, and suffer most when losses are made.

10
CHAPTER TWO;
LITERATURE REVIEW
2.1 Market Segmentation Theory
This theory was developed by Culbertson (1957), Walker (1954), and Modigliani &
Sutch (1966). The theory argues that the market is segmented and different institutional investors
have different maturity needs that lead them to confine their security selection to specific
maturity segments. The investors focus on short, medium and long term securities and will not
change from their particular market segments even if there are forecasts of likely future interest
rate changes. Therefore, the shape of the yield curve ultimately is a function of the investment
policies of major financial institutions. Major financial institutions tend to structure their
investment policies in line with factors like tax liability, types of maturity structure of their
liabilities and the level of earnings demanded by their depositors. The theory therefore asserts
that business environment; along with legal and regulatory limitations tend to direct each type of
institution to allocate its resources to particular types of securities with specific maturity
characteristics. The theory holds that the maturity preferences of investors and borrowers are so
strong that investors never purchase securities outside their preferred maturity range to take
advantage of yield differentials. As a result, short and long maturity portions of security markets
are effectively segmented, and yields for a segment depend on the supply and demand within that
particular maturity segment.
Market segmentation theory also asserts that debt markets are segmented according to
various maturities of debt instruments available for investment. By this theory, each maturity
represents a separate distinct market (Corrado and Bradford, 2002). Segmentation in respect to
debt simply states that interest rates corresponding to each maturity are determined separately by
supply and demand conditions in each market segment. This same scenario applies to firms when
they are raising capital from offshore markets. Zvi et al. (1998), notes that firms considering
issuing securities in one country might be attracted to issuing securities in another country by the
prospect of issuing at the lowest cost. They argue that securities are issued in essentially distinct
or segmented markets, each of which finds its own equilibrium independently. The study draws
its roots from the market segmentation theory. This theory advocates that firms consider markets

11
where the costs of operations are cheapest. The costs may be different due to tax rate
differentials, interest rate parities, inflation, reporting standards, exchange rate differentials and
regulatory requirements. Firms will undertake cross listing in countries where the cost of equity
is least. The main aim of firms going beyond their boundaries is to have low costs and
consequently improve their profitability prospects.
2.2 Trends in Cross listing
2.2.1 Cross listing in the World
Also referred to as Euro-Equity shares, cross listing started during the last two decades in
the United States (US). In the US, EURO-equity, issues have become popular because of the
anonymity enjoyed with bearer shares (US shares sold in Euro markets are bearer shares. This
means they do not carry the names of the owner.) It has grown rapidly in absolute size and
proportion of shares sold in other countries being substantial. In May 1988 Occidental Petroleum
Company floated $212 million of Euro equities, this being 18% of the company‟s total share
issue (Levi, 1996). In May 1987, US Air floated $90 million of Euro equities, 20% of its total
issue, and in September 1986, Home Shopping Network sold $56.1 million worth of shares in the
foreign market, 50% of its share offering. During the past two decades, the pace of globalization
in capital markets has accelerated and broadened in scope to make easier ownership and trading
in securities from around the world.
A point to note is that the pace of international cross listing around the world has
decelerated dramatically during the last few years. Cross listing on developed countries has been
on the declining trend while in the emerging economies it has grown rapidly over the years. This
is due to combination of global macro-economic, political and regulatory factors. According to
the US Treasury International capital data in 2006, gross purchases and sales totaled over $3.5
Trillion, which was about one-third of US GDP. The gross flows hovered around less than 1% of
the GDP in the 1970s and did not even reach 10% until the mid 1990s. Transactions in the US
and foreign securities have grown to become a significant factor of the gross flows to almost
20% by 1999 while averaging no higher than 10% in the mid 1990s. These equities have
however retreated to 10% level over 2000-2003. In 2003, the number of foreign listings in US
exceeded 2000 more than double that in 1990. The listings are classified into several varieties;

12
Level 2 and 3 exchange listings on the NYSE and NASDAQ have grown from under 200 in
1990 to over 500 listings in 2003. In 2006, the stock exchanges with the highest number of
foreign listings were NYSE (459), London (351) and NASDAQ (341). Cross listings as a
fraction of their own total listing the order from the highest is; Mexico (53%), Swiss Exchange
(31%), and Euronett (25.1%). Thus world cross listing reached peak in 1999, and since then have
remained steady. Since March 2007, foreign companies have been allowed to deregister with the
US Securities and Exchange Commission if less than five percent of global stock trading in their
shares takes place on US stock exchanges (Dobbs and Geodhart, 2008).
Conchrane et al. (1996) as reported by Kuria, (2008) notes that in US, market price
reactions around Foreign listings, the growth in the demand for equity financing has spurred
increased cross-border listings as individuals and institutions invest their funds in foreign
equities to diversify their portfolios and to earn higher risk adjusted yields. Cross listings of
stocks in the US have increased dramatically over the past twenty years. At the end of 2003 there
were over 2000 foreign firms listed in the US, more than twice the amount listed in 1990
(Karolyi, 2004). According to a European Finance Review (1996), the total value of trading
across world markets reached its peak in 1999, and since then has remained steady across all
major stock exchanges of the world through 2004. The fraction trading comprised of foreign
listings also leveled off at a median of 5.80% in 2004, though this was double the figure noted in
1995. London has maintained the largest absolute amount ($2.2 billion) in trading foreign listing.
It is the second largest in terms of the fraction of dollar trading (53%) after the Swiss Exchange
(93.53%). The Swiss Exchange benefitted greatly from Virt-X, a facility for trading European
blue-chip stocks initiated in 2001. Other notably large markets in dollar terms are NYSE and
NASDAQ.
2.2.2 Cross listing in Africa
Most African stock exchanges are constrained by outdated trading systems and rules. In
1993, African Stock Exchanges Association (ASEA) was formed with the primary objective of
encouraging the development of stock markets in Africa, and ultimately integrating them through
technology. Currently there are 22 stock exchanges existing in Africa. In year 2000, there was a
three-day conference organized by ASEA that brought together 21 countries from the continent.

13
The conference discussed about common listing requirements, which covered disclosure
standards that are applicable to advanced capital markets. However, the conference noted some
hitches in that there were some political laws that could not be changed. This is in respect to
South Africa where there are still exchange control laws. The conference was a part of ASEA
programme to nurture Africa‟s fledgling stock markets in the process of capital formation in the
continent. One objective was to make stock markets dynamic institutions of financial
intermediation.
With encouragement from ASEA, African stock exchanges have started forming
numerous Memorandums of Understanding (MoU) to promote exchange cooperation through
cross-border listing and act as future exchange platforms (Onyuma 2006). They are already
developing linkages with one another through MoU to facilitate cross listing of their securities.
At the end, there was an MOU to facilitate cross-border listing in Africa. NSE signed a MoU
with Nigerian Stock Market and another one separately with the Ghanaian Stock Market.
Nigerian Stock Exchange had previously signed a similar agreement with Ghana Stock Exchange
and the JSE. Under the agreement between Nigerian Stock Exchange and the JSE, shares of M-
net, and its sister company Super Sport, were listed on the Nigerian market in November 1999.
The above are building blocks with the intention of establishing of a pan-African Stock
Exchange. ASEA was formed 17 years ago with a prime objective of encouraging the
development of stock exchanges in all African countries and finally integrate the whole of
Africa. In 1994, Ashanti Goldfields Company, leading Ghanaian Gold Producer simultaneously
listed in Ghana Stock Exchange and the London Stock Exchange. The company was
subsequently listed on the exchanges in USA (NYSE), Canada, Australia and Zimbabwe. In
Nigeria, the stock exchange in association with Nigerian Central Bank have developed a cost
free system for foreign investors to access the Nigerian Stock Market, and repatriate their returns
without hassle. African stock markets are now rated as having the highest returns in the world in
dollar terms. Stock markets have begun to open up, notably the Nigerian, which has so far raised
$3 Billion worth of new issues. African stock markets are now contemplating forming a
universal African capital market where upon trading, listing and other financial market operation
would be conducted without hitches.

14
2.2.3 Cross listing in East African Bourse
A study titled, „Comparison of Financial and non-financial performance of companies
before and after going public‟; was done by Kiilu in 2006. The researcher has quoted Pagana et
al. (1998). They argue that company size and especially the industry‟s market-to-book ratio
increase the likelihood of a company going public or cross listing. Larger firms may be able to
take the advantage of economies of scale in the offering process. Firms that are older and have a
longer operating history should be easier to value; hence, old firms are more likely to go public.
East African Stock markets have a plan to merge, and form one stock exchange.
It is now easier to cross-list in the East African Bourse due to the following incentives:
First, there are no requirements of Reporting Accountants Report. Second, only a summarized
information memorandum is required. The third incentive is that an abridged financial statement
for the last five years is acceptable. Fourth, provision of the latest annual or interim accounts
submitted to the home exchange would be accepted as the latest financial statements. Finally,
standard initial cross listing fees of US$5000 (Ksh.360000) against previous US$21126 (Ksh.1.5
Million) to cross-list their equities across Kenya and Uganda (Kuria, 2008). It should be noted
however, that only companies in the Main Investment Market Segment in their home country are
allowed to cross-list their securities in the East African Bourse. This noble act, if successful, will
provide employment opportunities for the residents of the region.
Cross listing plans in Kenya started in 1997 when an agreement was reached among the
capital authorities of Kenya, Tanzania and Uganda. This agreement was under the East African
Security Regulatory Authorities (EASRA). Article 80 of the 1999 treaty of East African
Cooperation recognizes EASRA and provides for harmonization of exchange policies and
regulatory frameworks; promotion of cooperation through cross-border listing and trading among
the four exchanges; and developing a regional rating system for listed firms (Onyuma 2006). The
researcher notes that a Joint Stock Exchange Task Force on cross-border listing was formed in
2000 to consider critical legal, regulatory, procedural and disclosure issues needed to create a
conducive environment for cross-border listing of securities within East African Community
(EAC). The Chief Executives of USE, DSE and NSE signed the joint task force report that
recommended that the then 3 exchanges obtain an approval from their respective regulators for

15
its implementation; Tanzania to the liberalization its capital market; and the cross listing of
already listed firms would not attract additional listing fees (Onyuma 2006).
Table 1; Dates In Which Cross listing Was Undertaken By Kenyan Listed Firms on the East
African Bourse;
Date Company Bourse where listed
1. 27th
March 2001 EABL USE
2. 28th
March 2002 Kenya Airways USE
3. 1st
October 2004 Kenya Airways DSE
4. 29th
June 2005 EABL DSE
5. 14th
February 2006 Jubilee Holdings Ltd. Holdings USE
6. 27th
June 2006 Jubilee Holdings Ltd. Holdings DSE
7. 29th
Nov 2008 KCB USE
8. 8th
June 2009 KCB RSE
9. 18th
June 2009 Equity Bank Ltd USE
Source; Data analysis, 2009
2.3 Empirical Literature
Inder et al. (2004) conducted a research on whether cross listing leads to a higher firm
growth. A sample of 215 firms from 22 countries that had cross-listed in the US, was used. It
found out that there was externally financed firm growth following cross listing. Cross listed
firm‟s exhibit greater growth when they are externally financed in comparison to a matched
sample of non cross-listed firms. The assumption was that cross listing eases firm‟s constraints.
The study examined whether firms are able to realize higher firm growth following cross listing
in the US. The objectives were to examine the relation between cross listing and firm‟s growth
contributed by external financing, and to investigate whether the benefits of cross listing. There

16
was a believe that the benefits of cross listing are more pronounced as a function of the level of
financial market development of the cross-listed firm‟s country of origin. Empirical research
showed that firms from civil countries that are likely to be capital constrained substantially
enhance their access to capital markets after cross listing. Another assumption was that a firm
cross-lists in a financially developed market such as US to ease financial constraints. To test this
assumption, the study identified a sample of 215 firms from 22 countries that have cross-listed in
the US exchanges for the first time during 1994-2002 and then examined externally financed
growth after cross listing. The study found that both its samples of cross-listed firms and the
matched sample of non cross-listed firms do not exhibit a systematic difference in externally
financed growth rates prior to cross listing in the US. After cross listing, however, the sample of
cross-listed firms experience higher externally financed growth rates than the matched sample of
non cross-listed firms. This study disproved previous studies, which noted that access to external
financing through cross listing is most enhanced for firms that originate in the countries with
weak legal institutions and less developed financial markets. Instead their results indicated that
this increased access to capital at and after their cross listing in the US does not manifest itself in
more externally financed growth for firms that originate in countries with weak legal institutions
and less developed financial markets.
Data analysis was through regression model, t-statistics, and Pearson‟s correlation. The
findings of the study were that; there is a higher level of externally financed firm growth after
following cross listing. The study also found that externally financed growth after cross listing
does not vary as a function of the extent of financial development of the country from which the
cross-listed firm originates. Finally, it found cross-listed firms from more developed financial
markets to exhibit greater externally financed firm growth in comparison to a matched sample of
non cross-listed firms.
However, the study noted that the above findings hold after controlling for factors posited
to influence externally financed growth. The univariate results were supportive of the predicted
external financing growth and cross listing relation but they do not control for systematic
differences in the firm and country characteristics that may also affect externally financed
growth. In data analysis, it was found that the co-efficient on EBIT/Total Assets were negative

17
and statistically significant at the 0.1 level, suggesting that less profitable firms are more likely to
grow at rates that require them to obtain external financing. In contrast, the co-efficient on Total
Capital Expenditures/Total Assets is positive and statistically significant at 0.10 level suggesting
that firm‟s with greater investment opportunities are positively associated with excess growth
rates. The co-efficient on size was positive and statistically significant at the 0.01 level,
indicating that larger firms are more likely to grow at higher rates that could be financed with
external financing. Thus, the research findings were consistent with the notion that cross listing
affects firm growth by providing access to lower cost external financing. In the conclusion, the
study viewed cross listing to improve firm‟s ability to invest in potentially profitable projects.
The theory anticipates cross listing to positively influence firm‟s growth.
Inder et al. (2006) did on a topic on cross listing and firm‟s growth. In their study, they
hypothesized that cross listing improves; firms to access lo lower cost of external financing. The
study included a sample of firms from 37 countries that had cross-listed in the US. The study
found positive correlation between cross listing and subsequently externally financed firm
growth rates. The research found cross listing as a mechanism through which firms can improve
their access to lower cost of external financing and consequently use the funds to invest in viable
projects. The study area of their research was the relation between cross listing in the US and
subsequently externally financed firm‟s growth rates. It examined whether the above relation
varied with a cross-listed firms country characteristics. To test the hypothesis, the study
identified a sample of 476 firms from 37 countries who cross-listed in the US for the first time
during the years 1995-2004, and have financial data available on a global vantage base. To test
the relation between externally financed growth and cross listing, the researchers used the
financial planning model to estimate the maximum rate of growth that can be financed internally.
They specifically computed firm‟s constrained growth that can be achieved by relying on either
internal cash flows or short-term borrowing, or on internal cash flows, short-term borrowing, and
long-term debt. For each firm the researchers computed the difference between the realized rate
of growth and the two measures of constrained growth. The differences reflected the level of
growth realized through external financing. They noted that a firm‟s external financing need
depends on both the availability of internal funds as well as investment opportunities. In the
conclusion, it is noted that cross listing improves a firm‟s access to lower cost of external

18
financing. This is because cross listing in the US enables more investor recognition, enhances
liquidity, mitigates the costs due to market segmentation, and affirms a strong commitment to
stringent rules backed by stringent enforcement.
Burns and Bill (2006) researched on Cross listing and Legal Bonding. The study
examined whether cross listing in the US leads to complete legal bonding or whether reputational
bonding and the protection of minority interests in the acquirer‟s country are still important
factors in US investors decision to hold shares in cross-listed firms. The study appreciates that
cross listing has advanced in the developed economies. It helped focus on differential reaction of
US target shareholders, who are accustomed to some of the highest investor protections, to
acquisitions by cross-listed firms based on their home country characteristics. The findings of the
study noted that compared to US firms, cross-listed firms are less likely to use equity in
takeovers of US targets. The study further noted that cross-listed firms from countries with
poorer legal protections are less likely to finance with equity and pay higher premiums than
cross-listed firms from countries with better legal protections. Evidence from the study suggests
that while cross listing reduces barriers to investment, there are limits to its ability to completely
ignore both legal environment and the importance of monitoring of financial intermediaries.
Conclusion was that cross listing in the US does not provide complete bonding.
Onyuma (2006) did a topic on regional integration of stock markets in Africa. The study
acknowledges that stock markets worldwide are undergoing tremendous reforms brought about
advances in technology and globalization. Onyuma notes that in markets where there exists
several stock exchanges, competition is making them rethink their management and marketing
strategies to expand and maintain their markets. In this study, implications of globalization to
stock markets and the various forms of stock market integration are discussed. On globalization,
capital markets have been experiencing creation of new stock exchanges as the need for capital
by firms increase; cooperation among exchanges and demutualization of stock markets. Onyuma
notes that African markets cannot fail to embrace the current trend of demutualization of stock
exchanges, and integration of stock exchanges domestically and/or across the borders.
Onyuma (2006) notes that an integrated market is one where investors in one country can
buy and sell securities that are issued in another; they are traded and issued at the same price

19
across markets after adjustment of foreign exchange rates. Integration can occur through cross-
border merger or joint venture where parties to a merger are located in different countries and
leads to the same trading system; and domestic merger or reconstruction where exchanges in a
country vertically or horizontally merge their internal activities such as trading to enjoy
economies of scale and scope. Deutsche, Amsterdam, Brussels, Singapore, and Helsinki
Exchanges have conducted this research. The researcher notes that an integrated stock market
can be an integral part of economic integration in Africa, offer the investors a wide array of
investment opportunities to choose from and enable firms to raise capital on a regional scale
where they had been constrained in the domestic level. A move to speed the integration was
marked by the formation of ASEA and regional cooperation through MoUs and cross-border
listings. Onyuma, (2006) notes that the trade blocks in Africa can facilitate development of stock
market blocks. These emerging blocks may include, Southern Africa Regional Exchange,
Western Africa Regional Stock Exchange and Eastern Africa Regional Stock Exchange. The
impediments to this move according to the researcher are due to political differences; poor
integration of economies; social factors such as history, language and culture; overlapping
membership where some countries belong to several trading blocs; economic factors; differences
among countries and differences among exchanges. Difference among exchanges can be in terms
of the level of capital markets development, turnover, market capitalization and different
accounting systems. Lack of political good will makes governments to oppose the idea of
relinquishing the symbol of national sovereignty that a national exchange represents.
Governments should be more willing to relax their grip they yield on regulating stock markets if
integration is to become a reality. The researcher however notes that there are still hopes in
having a regional stock market, the Pan African Stock Exchange. Crucial things in developing
stock markets are harmonization of listing, trading and settlement systems and rules, and
development of a single currency that unites a region. This will eventually be achieved if there
are ways of enhancing economic integration; political and legal reforms and inside-out
integration. Inside-out, will be achieved by demutualization of stock exchanges; automating
trading systems; commonality among exchanges; domestic integration; cooperation through
cross listing; forming regional alliances and developing prowess in investment finance. The
researcher concludes that creating a single African stock market is a complex undertaking, and

20
thus domestic exchanges should consider forming closer cooperation through cross-border
listing, and information and technology sharing. If African exchanges are to survive, they must
prepare for integration and brutal pruning since securities markets are becoming increasingly
homogeneous and competitive. Onyuma however notes that while listing rules are being
harmonized to be in line with global standards in some regions, some slight differences between
exchanges‟ listing rules should remain to take care of national variances in economic, law and
technical development levels.
Kuria (2008), discussed on Short term and Long term effects off cross-border listing
announcements on companies listed at the NSE and their post listing performance. In
methodology, Kuria used t-test statistic. The researcher selected cross-listed firms and came up
with control firms. Market price/ Book value of these firms were compared in the study. Post-
listing liquidity was examined using turnover ratios. Kuria split the period into long term and
short term post announcement effects. In the short term, Kuria selected seven days while in the
long term, he selected 61 days. The researcher concluded that cross listing announcements have
statistically significant negative effects on stock returns. Kuria noted that cross-listed firm‟s
returns outperform those of non cross-listed firms with the same market price/ book values in
both post listing short-term (7 days) and long-term (61days) periods, but the control firms have a
higher turnover ratio over the same period. In the background, the researcher notes that cross
listing was mainly brought about by globalization, which led to increase of MNC‟s. This led to
the movement of capital across a country‟s geographic boundaries. The study has outlined that
most research in this field concerns the market behaviour around cross-border listings, and
managers who are concerned with the effects of their decisions to obtain foreign listings on
shareholders wealth use the share price effect as the main gauge.
Kuria (2008), notes that for the above notion to hold, the market in which the study is
conducted has to be assumed to be informationally efficient. A number of researchers have
suggested that information flow plays an important role in a listing decision. They suggest that
valuation changes around cross listings for firms and valuation differences between firms that
choose to cross-list in overseas markets and those that do not has less to do with barriers to
investment and more to do with changes or differences in information flows. Kuria further uses

21
the works of Fama et al. (1969) which produced evidence on how stock prices respond to
information. In this study, focus on stock prices adjustment to information announcements is
short-lived. Instead, the study examines returns over a longer period horizon with the aim of
getting a full view of market efficiency. The study of Kuria therefore concentrates on
announcement returns and post-listing performance. He notes that an informationally efficient
market is the one in which information is rapidly disseminated and reflected in prices. When a
market is efficient, resource allocation will be efficient because capital is channeled into the best
uses, and securities prices can serve as a guide for evaluation of corporate policies and decisions.
Kuria expounds works of Fama where there are three forms of efficiency based on how much of
the available public and private information market prices are expected to reflect. The three
forms according to Fama are the Weak Form Efficient Market Hypotheses, Semi Strong Form
Efficient Market Hypotheses, and Strong Form Efficient Market Hypotheses. Kuria explains
these forms of market efficiency in the Literature Review. Works done by Switzer, (1987) as
noted by Kuria, (2008) discusses market reactions to cross-border listing announcements for
Canadian listings on the US markets (Miller, 1996) for a small sample of non-US firms on the
US markets and those by Lau et al. (1994) discuss about US firms listings in other stock
exchanges. About post-listing performance, studies have been done in numerous countries.
Canadian listings on US markets (Switzer, 1986), Non-US listings on the US markets (Miller,
1986), Japanese listings on US markets (Ko et al. 1997) and US listings in other stock exchanges
(Rothman, 1995).
However, Kuria rejects the first null hypothesis which stated, “The average abnormal
returns surrounding cross-border listing announcements have no impact on stock returns” in the
long-run 61 day period. The researcher therefore concludes that cross listing announcements did
in fact have an impact on stock returns. The announcements were found to have a statistically
significant negative abnormal return. The short run event window was found to have an
insignificant negative abnormal return in the first week of trading with information at 95%
confidence level. Thus, the null hypothesis was accepted in the short-run event window. Related
to the second objective, his second null hypothesis stated, “The post-listing performance of
cross-listed firms does not exceed that of non cross-listed firms”. This was rejected in both the
long run and short-run event windows. In the short-run, the researcher found that cross-listed

22
firms had a statistically significant positive abnormal return at the 95% confidence level. In the
full 61-day observation period, it found that cross-listed firms had a significant positive abnormal
return. Kuria notes that this is consistent with the previous studies who had carried out studies of
US listings overseas and all reported either slightly positive or neutral reactions. The control
firms, on the other hand, had a negative abnormal return over the same observation period at the
same confidence level. This led Kuria to a conclusion that the cross-listed firm‟s performance
does not exceed that of non cross-listed firms of the same market price/book value s in the post
listing period. From the third objective which stated, “To examine post-listing liquidity in the
domestic market trading of cross-listed firms”, it was found that the control firms had higher
daily turnover ratios than cross-listed firms. Higher turnover is an indicator of increased activity
hence liquidity. The results of the study did not support increased liquidity hypothesis. Kuria
thus concluded that transaction costs for trading in the control firm‟s stocks were lower than
those of cross-listed firms especially for foreign investors wishing to acquire stocks at the NSE
in the local currency for trading at their foreign markets.
2.4 Critique of the Literature Review
Most of the studies that have been on the Kenyan Stock Markets have not captured cross
listing except the one conducted by Kuria, (2008). The researcher addressed on short term and
long term effects of cross-border listing announcements. Kuria used the Efficient Market
Hypothesis as the theory supporting the research work. In the study, Kuria elaborated on the
weak form, semi-strong form, and the strong form markets. Kuria concentrated on the efficiency
in pricing the securities of firms that have cross-listed. This study used Market Segmentation
Theory as the Finance Theory to base its roots. It aimed in finding the effects that cross listing
has on the cost of capital. Kuria‟s study employs t-statistics to analyze data. This study goes to
the extent of using Karl parson‟s correlation in addition to t test. Kuria used an event study; this
study however used a comparative study where pre and post-listing financial performance for
two years were used.
Onyuma, (2006) covered on regional integration of stock markets. The study highlighted
cross-border listing as one of the ways of ensuring the regional integration but did not cover the
financial aspects of the cross-listed firms. It did not also consider the non-cross listed firms in

23
similar subsectors of the economy. Other researchers in Kenya have covered on dividends
(Muchendu, 2003), Diversification of Investments (Mwangi, 2003), working capital practices
(Kotut, 2003), privatization on company‟s performance (Waweru, 2005), Day-of-the-week and
month-of-the-year effect on Kenyan stock market returns (Onyuma, 2009)Effects of stock splits
(Karuitha, 2006), Determinants of bond prices (Shibira, 2006), Relationship between capital
structure and dividend payout, and post right issue effects (Chebii, 2006). The study conducted
by (Chebii, 2006) concentrated on equity raised within the firm‟s parent country boundaries. It
did not address dividend policies of a firm that has raised its capital beyond its boundaries. Thus,
as has been evidenced by the reviews, area of cross listing still needs much research.
2.5 Arguments in Favour and against Cross listing
2.5.1 Arguments in Favour of Cross listing
According to Michael et al. (2004), firms choose to cross-list their shares because it
represents an opportunity to improve a firm‟s corporate governance. Cross listing is a vehicle
through which a firm‟s management can „bond‟ themselves to a legal system with more
protections against management self-dealing or excessive consumption of private benefits of
control, Burns and Bill, (2006). Cross listing, helps improve on corporate governance. This is
true for firms that originate from relatively less-developed country with weaker institutions. For
instance firms from Africa which cross-list on the American market have to maintain the
standards of the American system. This in essence will improve their governance practices. The
higher standards lead to more disclosure and better information, which give the shareholders
greater influence and protect minority shareholders more fully-thus improving the ability to
create value for shareholders.
The company conducting the issue will have more source of funding, and the funds will
be relatively cheap. When companies cannot easily attract large amounts of new equity in their
home markets, it makes sense to issue new equity in foreign ones through cross listing. The
shares of the company will become more liquid because there will be a wider market in which to
trade from. Increased liquidity will improve a company‟s market capitalization. This is in
accordance with European Finance Review, (2006). According to a study done earlier of
corporate managers that have initiated cross listings for their firms often, cite liquidity as a main

24
motivator. This was confirmed the hypothesis set by Karolyi in 1998. Information based traders
seek to camouflage their information by timing their trading when the markets are “thick” with
other liquidity traders. This means that since all are similarly motivated, they are strategic in
selecting their trading location in the “thickest” of the competing markets. This explains the
predictions about clustering of trading volume around market open and closes, about clustering
of trading volumes in some markets.
Cross- listing of stocks are positively viewed by investors because the action taken by the
management circumvent many of the regulatory restrictions, costs, and information problems
that represents barriers to cross-border equity investing. Cross listing further allows foreign
investors to trade shares in their own currency, notes Alexander et al. (1987). This enables them
to save any transaction costs associated with dealing in a foreign currency and dealing with
foreign exchange regulations. For instance, Ugandans and Tanzanians will not have to worry
about the exchange rate differentials when they decide to buy a share of the EABL that is listed
in their respective bourse.
A cross-listed firm will not only have access to a broader investors' base but may also
benefit from tax holidays such as no withholding tax on dividends paid to foreign investors.
Media interest in the hosting country will additionally lead to visibility and familiarization of the
firm in that country.
Cross listing reduces barriers to investment. Firms that undertake cross listing achieve
their objective of raising extra funds, while at the same time protecting their minority
shareholders from the risks of takeovers (Burns and Bill, 2006). This means that a firm can retain
its shareholders, but at the same time raise capital offshore. Dobbs and Geodhart, (2008)
acknowledges that companies which have cross-listed get better or more analyst coverage and
potential investors therefore get more information.
Cross listing improves firm‟s access to lower cost of external financing. Cross listing is a
mechanism through which firms can improve their access to lower-cost external financing and
consequently can invest in potentially profitable projects (Inder et al. 2006). They note that cross
listing contributes to firm‟s value as it limits the ability of controlling shareholders to extract

25
private benefits of control. Companies will as a result have better ability to raise capital at a
lower cost and pursue potential profitable projects. It implies therefore that cross listing will
improve a firm‟s growth potential.
Cross listing may serve to counter the effects of market segmentation (Stulz, 1999).
These barriers serve to segment domestic capital markets. The upshot here is that domestic
investors in segmented domestic capital markets require a risk premium for bearing all the risk of
the economic activities of that country (Inder et al. 2006). When firms from these segmented
markets cross-list, theory anticipates the stock prices for these firms to rise and consequently
their cost of capital to decline “as an additional built-in risk premium compensating for these
barriers dissipates” (Foerster and Karolyi, 1996).
2.5.2 Arguments against Cross listing
Cross listing is followed by a substantial divestment by the controlling shareholders or
surrender of control to outsiders (Mikkelson et al. 1997). Firms, which have cross-listed, are no
longer owned by citizens of one country. This loss of control may lead to firms deviating from
the sole intentions of incorporating them that were in the minds of their founders.
Cross-listed firms become subject to scrutiny of various regulatory authorities. This may
pose a problem to the firm in that it may find it corporate policies conflicting between different
countries. This will be a problem in that strong corporate culture cannot be established.
If the lower cost of capital from eliminating investment barriers, were the main incentive,
all firms for which capital would fall sufficiently to justify the costs of overseas listing would
embrace this trend (Dobbs and Geodhart, 2008). They further note that costs actually increase as
the executives of those firms spend time monitoring disclosure and compliance in the foreign
markets.
Abnormal returns from cross listings are observed for firms from countries that are
substantially integrated in the world markets. For instance, Canadian firms experience a dramatic
long-run capital market reaction to US cross listings as European and Asian firms, given the
long-standing evidence of North American equity integration.

26
Market segmentation hypothesis cannot explain the time series pattern of listings. Since
listings have continued to grow, it is expected that with greater integration of markets overtime,
the overall benefits should diminish since the cost of capital for companies is increasingly
determined globally.
Segmented markets cannot explain why share price reactions are largest for exchange-
listed firms (Miller, 1999). In the same notion (Foerster and Karolyi, 1996), segmented markets
cannot explain why listing share-price declines are smaller for listings associated with capital
raising activity.
Some members of a company may enjoy private benefits. These are known as control
benefits (Michael et al. 2004). They accrue to managers or shareholders who have control but not
to minority shareholders. They can be non-pecuniary, such as the ability to direct company‟s
resources, or use of a position for the enhancement of one‟s human capital. This is the situation
we find managers, out of their own ambitions, build their own empires causing an agency
conflict with the shareholders.
2.6 Conceptual Framework
The financial statements of firms are normally evaluated in terms of profitability ratios,
liquidity ratios, Equity-related and Gearing Ratios. Every firm must be keen on how these ratios
can be improved. A firm may decide to cross-list to improve these ratios. Other factors may
include; High transaction costs, imperfect information in the domestic markets, need to improve
the firm‟s current market share, & static demand and supply of the firm‟s securities are among
hardships faced by firms. They also need more capital, which may not be readily available in
their home country. These necessitate the firms to go off shore and raise extra capital with the
aim of eliminating these constraints.
Consequently, as a result of cross listing, firms may have both outcomes, which are
desirable and those that are not good. Positive outcomes include improved corporate governance,
higher liquidity of its stock-thus improved market capitalization, no barriers to making
investments by individuals, and integration of markets. Negative outcomes may include loss of
control to foreigners. This is because off loading shares to foreign investors reduces the

27
percentage of ownership by local investors. Another negative outcome could be the creation of
empires-Top managers may have ambitions of expanding company without putting into
consideration the needs of the shareholders. This may lead to an agency-principal conflict. Firms
that have overseas listings are very susceptible to world financial events because they tend to be
very integrated with the global events.
In the framework, the integration of markets is the outcome that is mainly discussed in
the study. This is explained further by the market segmentation theory where it is presumed that
cross listings will do away with segmentation of markets in the world. Onyuma, (2006) notes
that integration may lead to regional stock market, a consortium of stock exchanges within
geographic proximate nations and one with no specific location. It is easier for issuers, through
integrated markets, to raise capital in a region on a scale not possible in their domestic markets,
thereby strengthening the issuer‟s name recognition and enhancing the image of its products.

28
Inputs. Process. Outcomes.
Positive outcomes
Negative outcomes
Figure 1: Conceptual Framework
Source: Data analysis, 2009
High transaction
costs of operations
Imperfect
Information
Need to improve
Firm‟s market
share
CROSS-
BORDER
LISTING
Improved Corporate
Governance
More Liquidity of
Firm‟s stock.
Static demand
and supply of
shares
No barriers to
investments
Integration of
markets
Loss of control to
foreigners
Creation of
empires
Being prone to global
financial crises
Improved
Financial
Performance
Need for
more capital
Liquidity ratios
Gearing ratios
Profitability ratios
Equity-related
Ratios

29
CHAPTER THREE;
RESEARCH METHODOLOGY
3.1 Research Design
Descriptive research design was used in the study. This is because the study was about
fairly knowledgeable aspects of the phenomenon, but little knowledge was available regarding
their characteristics, nature or details. Descriptive research aimed at generating knowledge that
may be useful to describe or develop a profile of the study. The research was a complete census.
This was relevant in the research as it involved collection of data from several study units. A
complete census was used as the population of the study was small, and involved companies in
Finance & Investment sector, Industrial & Allied sector, and Commercial & Services sector of
the economy. Under the survey study data were analyzed in statistical form by the use of Karl
Pearson‟s correlation coefficient, and both one and two tailed t test at a 95% degree of
confidence level.
3.2 Target Population
The population of interest for this study comprised corporations that have been listed in
Kenyan Bourse, and have undertaken cross listing within the East African Stock Markets, and
those that are in similar sub-sectors of the economy that are listed in the NSE but have not
undertaken cross listing. Six companies were included in the study. It targeted all Kenyan based
companies that have engaged in cross-border listing of securities. These include Kenya Airways,
EABL and Jubilee Holdings Ltd. Holdings. The study also targeted other non-listed companies
in similar sub-sectors of the economy. These include NMG, Kenya Re-Corporation, & Athi
River Mining.
Due to small size of the Kenyan-based listed firms cross-listed firms on the East African
Bourse, a census study was carried out covering all the cross-listed companies, and purposive
sampling was used to select those that have not currently cross-listed.

30
3.3 Data Collection
The study mainly dwelt on secondary data. Published financial statements were available
at the CMA in respect to financial performance and NSE information vendors who availed the
market capitalization values and the ruling share prices. Firm‟s financial statements were used
for comparison of performance before and after cross listing for cross-listed firms. A similar
period of post cross-listing financial performance of two years for non cross-listed firms was
obtained. It was collected using checklists from the NSE or CMA. The data collection sheets
were used to gather all the information in respect to the financial performance of the firms. This
included profits before tax, current assets, current liabilities, fixed assets, market capitalization
turnover, debt level and equity shares outstanding.
3.4 Data Analysis
In objectives 2, 3 and 4, financial ratios such as current ratio, gearing ratio, Return On
Capital Employed (ROCE), Gross Profit (GP) margin, Return On Investment (ROI), Quick ratio,
Earnings Yield (EY), Dividend Yield (DY) Price Earnings (P/E) and Equity ratio were used.
Correlation co-efficient was performed on the results obtained from these ratios where it was
established whether the findings indicated a strong or negative correlation. Any value that is
greater than 0.75, regardless of the sign, indicated a strong correlation while any value that is
lesser than 0.25 indicated a weak correlation. Data was analyzed using t tests at 95% degree of
confidence. t test was is normally used where the population in the study is less than 30; thus it
was very suitable for this study. Period was the key determinant whether the t test would be one
tailed or two tailed. If the information analyzed was covering different periods, a two tailed t test
was performed. One tailed t test was conducted if the information discussed belonged to the
same financial period.
According to Mason 1999, t test is computed as follows; (×-µ) ÷ (s/√ń)
where: ×=population mean
µ=this is called t critical; it is normally got on the table at a certain degree of
confidence
s=sample mean

31
ń= sample size
Ratios computed were as follows;
1. Profitability Measures
a) Return On Capital Employed; this denotes return on capital employed. Capital Employed
means net capital or long-term capital. It is computed as (EBIT/Capital Employed)*100
b) Gross Profit margin; this is the profit before expenses divided by the net sales. It is
computed as (Gross Profit/Net Sales)*100
c) Return on investment. This measures the return on the proprietor‟s investment in the
company, being the total share capital plus the reserves that they indirectly own (Saleemi,
1995). It is computed as (Earnings After Tax/Total Share Capital Reserves)*100
2. Liquidity
a) Current ratio; this ratio measures the current assets against the current liabilities. It is
computed as (Current Assets/Current Liabilities). Pandey, (2006) notes that under normal
situations current ratio should not be less than 2 times; when it is less, it means that the
firm cannot be able to meet its current obligations as they arise. A current ratio that is
greater than two times indicates that the firm has not utilized its funds well thus tying it in
cash.
b) Quick ratio; this ratio was developed to cover some aspects were not addressed by the
current ratio (Pandey, 2006). It argues that for the purposes of raising quick cash, stock
should be disregarded. Generally, the ratio should not be less than 1:1. It is computed as;
(Current Assets-Stock)/Current Liabilities. When the quick ratio is less than 1 times, it
implies that should an emergency occur the firm could not meet that obligation. It thus
checks how the firm can sustain its current obligations on a daily basis.

32
3. Capital Structure/Gearing Measures; these ratios measure the contribution o financing by
owners compared by financing by the firms creditors.
a) Debt-equity Ratio; it shows the relationship between owners funds and the borrowed funds.
According to Pandey (2006), the larger the portion of owners equity, the lesser the risk faced
by creditors. It is computed as (Total Debt/Total Owner‟s Equity)
b) Equity Ratio; it represents the relationship between owner‟s equity and total assets or total
capital employed. This in essence compares what the firm really owns compared to the total
equity. It is computed as;
(Total Capital Employed/Equity Capital)
4. Equity-Related Ratios; these measures shareholders returns and value. These include;
a) Divided Yield: this measures the percentage in which the dividends paid are relative to
the company‟s stock market value. It is obtained by: Dividend Yield= (Dividend per
Share/ Market Price per Share)*100
b) Earnings Yield: this measures the ratio of earnings attributable to shareholders to the
current market price per share. It is obtained by: Earnings Yield= (Earnings attributable
to shareholders/ Market Price Per Share)* 100
c) P/E Ratio; this ratio measures the number of times the earnings are covered by the market
price. It also indicates the duration that will be incurred to recover the investments. It is
the reverse of earnings yield. A point to note is that P/E ratios might be interpreted in two
ways. According to Pandey (2006), when the ratio is high, it may imply that shareholders
have more confidence in the firm thus waiting for long years to recoup their earnings or
when it is low, it may imply that the investments made by the management are so good
such that they take fewer years to recoup the initial capital outlay. It is thus computed as:
P/E ratio= (MPS/EPS)
d) EPS: this denotes Earnings Per Share. It measures the amount that shareholders would get
if all the profits were distributed to them. It is computed as: EPS= (Earnings attributable
to ordinary shareholders/Number of ordinary shares outstanding)

33
CHAPTER FOUR;
RESULTS AND DISCUSSIONS
4.1 Attributes of cross-listed companies
4.1.1 Jubilee Holdings Ltd.
According to Jubilee‟s website, the company is over 70 years old since it was established.
The company was incorporated in 1937 as a composite insurer and a provider of mortgage
finance. It is a market leader in medical insurance. It has head offices in Nairobi, Kampala and
Dar-es Salaam, with eight branches spread in the east African region. In 1984, Jubilee was listed
on the Nairobi Stock Exchange. On 14 February 2006, Jubilee Holdings Ltd. Holdings issued
shares on the USE, and later, 27 June 2006 on the DSE; thus, the company was the only firm in
Kenya to cross-list in two stock exchanges at the same year. Having been in operation in Uganda
and Tanzania, Jubilee Holdings ltd. did not find it hard attracting the investors in these countries.
The decision to list on the Ugandan and Tanzanian bourse was arose due to the fact that the
company‟s businesses are spread all over the region and thus to reward its clients it gave them a
chance to participate in the ownership. The company has been holding its Annual General
Meeting in Nairobi.
Today, Jubilee Insurance, a wholly owned subsidiary of Jubilee Holdings Limited, has an
issued share capital of Ksh 225 million and the highest shareholders‟ funds in the Kenyan
insurance industry. Before cross listing, the firm had 32.2 Million shares outstanding and
currently the number has risen to 45 Million shares. It has over 6,300 shareholders. Its current
Market Capitalization stands at Ksh. 6.12 Billion with a share price of Ksh.136. The operations
of the Jubilee Holdings Ltd. Company of Uganda Limited were revived in 1992, following a
period of stability and economic growth in the country. Its main shareholders include the Aga
Khan Fund for Economic Development and the Development Finance Company of Uganda
Limited. Today, Jubilee Uganda is considered one of the leading insurance companies in the
country. Again, in cooperation with local shareholders, the Jubilee Holdings Ltd. Company of
Tanzania Limited was formed and in June 1998 earned the distinction of being the first private

34
sector insurance company to be licensed following liberalization of the insurance market in
Tanzania.
Jubilee Holdings Ltd. Holdings is divided into investments and Financial Services
divisions. The insurance company has made several investments, as is the nature of insurance
companies, notably in Bank of Baroda and TPS East Africa. A board of directors (BOD) runs the
firm. The board comprises of eight non-executive members of whom five are independent. The
independence concept here ensures that the shareholders interests are kept protected. This
information was obtained from the company‟s website.
The firm faces some few challenges when operating in different countries. There are
restrictions as to the number of shares that can be owned by foreigners. This is especially in
Tanzania; however, the firm has tackled this by abiding to the rules that have been set. The firm
appreciates the move to creation of East African Corporation (EAC), which has brought largely
the harmonization of East African stock Markets. In respect to reporting the financial
statements, the firm has been using the International Reporting Standards of consolidated
statements. The economies of the East African Countries are relatively interlinked due to similar
nature of businesses in the region; this means that there is little parity in interest rates. However,
in the year 2008, the cost of living in Kenya was very high due to the post-election chaos that
disrupted Kenyan businesses. This made the Kenyan shilling depreciate against other currencies
hence causing a challenge to the company, which operated in the region.
There are 45 Million shares outstanding as at 31 December 2008 and 6317 shareholders.
This is outlined in table 2 below; those who own less than 500 shares constitute about 0.6%,
while those who own more than 1 million shares constitute about 44% of ownership. It was
noted that those who own less than 10000shares constitute less than 25%, while those who own
more than 10000 shares constitute more than 75%.

35
Table 2: Distribution of Shareholders of Jubilee Holdings Ltd. Holdings as At 31 December
2008:
Number of shares Number of shareholders Number of shares held % shareholding
Less than 500 1,425 287,815 0.640
501 – 5,000 3,960 7,014,960 15.589
5,001 – 10,000 527 3,723,432 8.274
10,001 – 100,000 388 9,457,091 21.016
100,001 – 1,000,000 15 4,692,339 10.427
Over 1,000,000 2 19,824,363 44.054
Total 6,317 45,000,000 100.00
Source: www.jubilee.co.ke 2009
Table 3 below outlines that the largest shareholder in Jubilee Holdings is the Aga Khan
Fund for Economic Development with about 17 million shares; these constitute about 38%; this
implies that this shareholder have influence in decision making in the insurance company. They
may influence the voting of directors, making dividend decisions or even making capital
decisions. The top 10 shareholders own more than 51% of outstanding share capital of the
company; this adds up to about 23.6 million shares.

36
Table 3: List of 10 Largest Shareholders of Jubilee Holdings Ltd. Holdings as At 31 December
2008:
Name Number of shares held %Share holding
Aga Khan Fund for Economic Development - 17,093,182 37.98
Ameerali K. Somji &/or Gulzar Ameerali K Somji - 2,731,181 6.07
Craysell Investments Limited - 897,793 2.00
United Housing Estates Limited - 816,480 1.81
Adam‟s Brown and Co Ltd - 803,990 1.79
Ameerali N Esmail - 600,070 1.33
Noorali Rashid Sayani and Gulshan Noorali Sayani - 225,090 0.50
Mahendra Krishnalal Adalja - 175,000 0.39
Mulchand Narshi Shah - 150,261 0.33
Gulzar Shamshudeen Somji - 147,600 0.33
Total shares outstanding 23,640,647 2.5
Source: www.jubilee.co.ke 2009
4.1.2 Kenya Airways
This is the lead carrier airline in Eastern Africa which was established in 1977 after the
collapse of East African Community (EAC). The vision of the airline is to consistently be a Safe
& Profitable Airline that Guarantees World Class Service. Its mission is to maximize shareholder
value by consistently providing the highest of customer satisfaction, Upholding the Highest level
of Safety and Security, and maximizing employee satisfaction while being committed to the
Corporate and Social Responsibility.
According to KQ‟s website, the airline was first privatized in March 1996 to what was
the largest IPO at that time. In 1997, Kenya Airways Msafiri frequent flier programme merged
with KLM's Flying Dutchman frequent flier programme. As a result of being privatized, the firm

37
was able to obtain new modern Boeing aircrafts. The year 2005 was very good for the company
as it was voted as Africa‟s most respected company. Its profitability rose to 3.9 Billion, citing a
198% increase. It is also in this year that the national carrier really expanded its air routes. The
year 2007 was marked by the event of KQ joining the famous Sky Team as an associate airline.
Several factors motivated KQ to cross-list. These include the nature of business; KQ operates all
over the region. The Kenyan market cannot sustain the operations of the airline; exhaustion of
domestic market made the regional carrier to see it wise to include all its customers in the East
African region to feel part of the company.
The current market capitalization of the company is at 25.2 Billion with 461,615,484
equity shares outstanding. The profitability of the company heavily relies on factors such as
crude oil prices, foreign exchange rates, and global financial stability. Since it uses the dollar as
the currency for its transactions, a weak dollar adversely affects its profitability. Because of the
nature of operating in different countries, KQ found it wise to enter into strategic alliances with
various carriers to enable it to operate smoothly. KLM is a strategic ally, global route network
and airline partner since 1996, holding 26% of the stakes. The joint venture runs regular services
between Nairobi and Amsterdam, and code-shared services within the Kenya Airways-KLM
network and potential services throughout the North American and European markets from
Nairobi. It has also a code-shared services agreement with Air France where they operate in
similar routes in Europe from Nairobi. In the airline industry, performance is so integrated that
an airline firm has to enter into alliances and partnerships to ensure its continued survival.
KQ normally holds physical AGM‟s in Nairobi Kenya where the company is based. They
held the last AGM at Kasarani Sports Gymnasium. During the AGMs, the chairman and top
management reads their speeches, the auditors express their opinion on the financial statements,
shareholders are given a chance to raise issues and voting takes place. The financial statements
are based on the International Financial Reporting Standards.
Being a lead regional carrier, the firm operates in places where there are economic and
social disparities; however, it has ensured that the cultures of the communities in the East
African Region are marketed. Kenya Airways acts as an ambassador of East African heritage to
other nations. For instance, it markets the clothing and belts of the Maasai Community who are

38
residents in Kenya and Tanzania. The company also supports sporting events such as rugby. This
makes shareholders feel proud to be associated with the regional carrier. Economic wise, the
company has been facing challenges especially the fluctuations of the crude oil prices that have
not been stable in the last one and half years
There are challenges that the firm faces in its operations notably the Interest rate parities
and regulatory requirements. According to an internal source Interest Rate Parity is the greatest
challenge that is faced by the carrier. The company flies to destinations all over the world and
costs have been affecting its levels of income. Since the company uses the dollar as the standard
currency, the weakening of the dollar relative to other currencies means little revenue to the firm;
strengthening of the dollar relative to East African currencies means high costs of inputs such as
crude oil or purchase of the aircrafts. The other major challenge is disparities in the stock
exchanges of the region; the Kenyan stock market is highly advanced in comparison to other
East African Stock Markets. This challenge is however going to be resolved with the plans of
regional integration of East African Economies in the pipeline.
Table 4 below shows the list of top 10 shareholders of the national carrier. These together
own more than 62% of shares with about 287 million shares .the largest shareholder being KLM,
who owns slightly over 120 million shares comprising 26% of the share capital. This means that
KLM is very influential in decision making of the lead regional carrier. The least in the top 10
list is Shah Mahendra Kumar Khetshi with almost 1% of shares adding up to about 4.2 million
shares.

39
Table 4: List of Kenya Airways Top 10 Shareholders
No. Name of Shareholder No. of Shares Holding
1 KLM - Konink Lijke Luchuaart Maatschappj 120,020,025 26.00 %
2 Permanent Secretary To the Treasury 106,171,561 23.00 %
3 Paul Wanderi Ndungu 15,325,634 3.32 %
4 Barclays (Kenya) Nominees Limited A/C 9057 11,540,387 2.50 %
5 Mansukhlal Khetshi Shah 9,370,794 2.03 %
6 Mahendra Kumar Khetshi Shah 5,816,355 1.26 %
7 Khetshi Dharamshi & Co Ltd 5,216,255 1.13 %
8 Rameshchandra khetshi Shah 4,662,316 1.01 %
9 Apollo Insurance Co Ltd 4,339,186 0.94 %
10 Shah Mahendra Kumar Khetshi 4,246,862 0.92 %
Total Holding 286,709,375 62.11%
Source: www.kenyaairways.co.ke 2009
4.1.3 East African Breweries
This is the leading branded brewery firm in East Africa. It was established in 1922, with
its plant located at Ruaraka, Nairobi-Kenya. The company was formerly known as Kenya
Breweries Ltd. and changed its name to East African Breweries Limited in 1936. It has an
outstanding collection of beers and spirits. East African Breweries Limited, through its
subsidiaries, engages in the marketing, brewing, manufacturing, and selling drinks, glass
containers, malt, and barley in Kenya, Uganda, and Tanzania. EABL has a total brewing capacity
of 2.5 million hectolitres per year. It has an annual turnover of Ksh. 30 Billion and has the
largest market share in the region. EABL employs over 1000 employees. Currently the giant

40
brewer has a market capitalization of 120.9 Billion. Before cross listing the firm had 93,602,252
and after currently the company has 790,774,356 shares outstanding. A point to note is that this
increase in shares was not only attributed to cross listing only but also due to stock splits that
have been conducted by the firm. In a survey conducted by PricewaterhouseCoopers and Nation
Media Group, EABL scooped the accolade of the East Africa‟s most respected company for five
years running i.e. from years 2000 to 2004. The values that have made the firm what it is
include; being proud in what they do, being the best, being passionate about their consumers,
valuing each other and giving one another freedom to succeed. The company produces beer
under Tusker, Pilsner, White Cap, Senator, Guinness, AllSopps, Smirnoff Ice, Bell Lager brand
names. It also produces Malta Guinness, a non-alcoholic energy drink, Alvaro soft drink and
Waragi branded spirits. Tusker is the flagship brand and a Kenyan icon.
According to table 5 below, the largest shareholder in EABL is Diageo Kenya Limited.
The top shareholder owns about 43% of the outstanding share capital constituting around 282
million shares; this implies that the company is an associate. The list of top 10 shareholders in
the giant brewer company adds up to around 66% with shares adding up to about 432 million
shares. A point to note is that institutional shareholders dominate this firm. The least among the
top 10 shareholders owns slightly above 1%, which translates, to about 7 million shares.

41
Table 5: East African Breweries Top Ten Shareholders
No. Name of Shareholder No. of Shares holding
1 Diageo Kenya Limited 282,174,649 42.82 %
2 Board of Trustees N.S.S.F 31,762,769 4.82 %
3 Diageo Holdings Netherlands B v 30,313,016 4.60 %
4 Barclays (Kenya) Nominees limited A/C 9011 20,164,746 3.06 %
5 Guinness Overseas Limited 17,199,342 2.61 %
6 kanaksinh Karsandas babla & Sandip Kanaksinh Babla 13,179,572 2.00 %
7 Barclays (Kenya) Nominees limited (Non Resident)A/C
9057 10,543,658 1.60 %
8 Barclays (Kenya) Nominees Limited A/C 9326 10,477,760 1.59 %
9 Kenya Reinsurance Corporation limited 9,093,905 1.38 %
10 Kanaksinh Karsandas Babla & Kusum Kanaksinh Babla 7,116,969 1.08 %
Total Holding 432,026,386 65.56
Source: www.eabl.co.ke, 2009
4.2 Pre and Post Performance of Listed Companies
4.2.1.1 Performance of EABL Two Years Before and After It Cross-Listed
According to table 6a, it is evident that the liquidity ratios of EABL increased after it first
cross-listed in year 2001. The current ratio changed from 0.9806 to 2.4499 times while the quick
ratio changed from 0.31308 to 1.43291times. The ratios after cross listing met the stipulated
threshold of at least 2 and 1 times for current and quick ratios respectively. The profitability
ratios also increased as indicated by the table below. ROCE changed from about 17% to about
26%, the ROI changed from about 14% to about 16%, while the GP margin changed from about

42
30% to about 35%. The implications of the increase in profitability ratios are that funds availed
might be used in a more economic manner thus generating a higher return.
However, it can also be noted that the Gearing ratios declined; these ratios measure the
relative return on shareholders. The Debt-Equity Ratio changed from 0.5036 to 0.3738, while
Equity Ratio changed from 1.14134 to 1.1002. The results shown on table 6a, shows that EY
decreased from about 15% to about 8% , DY also decreased from about 10% to about 8% while
the P/E ratio increase from 6.61445 to 13.1541 times. The financial implications for the decline
in EY and DY might mean a dilution effect. This may means that the increase in the returns that
the firm generated was not at the same rate as the number of shares outstanding. The decline in
DY might imply two things: first, it might be that the shares outstanding were more that the
earnings attributable to ordinary shareholders and second, it might be that the firms retained
more of its earnings thus having a low dividend payout.

43
Table 6a: EABL’s Performance Two Years Before and After It Cross-Listed
Details Two years before Cross listing Two years after Cross
listing
Liquidity Ratios
Current Ratio 0.9806 2.4499
Quick Ratio 0.31308 1.43291
Profitability Ratios
Return on Capital Employed 0.166 0.26282
Return on Investments 0.14178 0.156
GP Margin 0.30162 0.34653
Gearing Ratios
Debt-Equity Ratio 0.5036 0.3738
Equity Ratio 1.14134 1.1002
Equity Related Ratios
EY 0.15118 0.07602
DY 0.10395 0.082873
P/E 6.61445 13.1541
Source: Data analysis, 2009
4.2.1.2 Two Tailed T Test Results on EABL’s Performance Two Years Before and After It
Cross-Listed
In respect to liquidity, the computed t value was -2.12836 being less than t critical of
4.302653 indicating that the difference in liquidity ratios is not statistically significant. This is
confirmed by the p value of 0.167103 being greater than the 0.05. The mean difference was
1.2941; this could be due to chance or error. This implies that despite the increase in liquidity of
the firm, it is not statistically significant. For profitability, the computed t value was -0.7001
being less than t critical of 2.7764 indicating that the difference in profitability ratios are not

44
statistically significant. This is confirmed by the p value of 0.5225 being greater than the 0.05.
The mean difference was 0.2291; this could be due to chance or error. The results concerning
gearing ratios showed that the computed t value was 0.1768 being less than t critical of 4.3027
indicating that the difference in gearing ratios is not statistically significant. This was confirmed
by the p value of 0.8759 being greater than the 0.05. The mean difference was 0.7797; this could
be due to chance or error. In equity related ratios, the computed t value was -0.4415 being less
than t critical of 0.688757 indicating that the difference in gearing ratios is not statistically
significant. This is confirmed by the p value of 0.688757 being greater than the stipulated 0.05.
The mean difference was 3.3638; this could be due to chance or error.
Table 6b: EABL’s Performance Two Years Before and After It Cross-Listed
Two tailed T-test
95% confidence level
Measure t-stat df t-critical mean 1 mean 2 mean difference p-value
Liquidity ratio -2.1284 2 4.3027 0.6468 1.9414 1.2941 0.1671
Profitability ratio -0.7001 4 2.7764 0.2031 0.2551 0.2291 0.5225
Gearing ratio 0.1768 2 4.3027 0.8225 0.7370 0.7797 0.8759
Equity-related -0.4415 3 3.1824 2.2899 4.4377 3.3638 0.6888
Source: Data analysis, 2009
4.2.2.1 Financial Performance for Kenya Airways Two Years Before and After It Cross-
Listed
From table 7a, the liquidity of Kenya Airways declined after it first cross-listed in year
2002. This is in respect to current ratio and quick ratio; they both went below the stipulated
standard of 2 and 1 times respectively. Current ratio declined from about 1.6 times to about 0.8
times whereas the quick ratio declined from about 1.5 times to about 0.7 times. This might be
attributed to the fact that KQ made very heavy investments in modern large carrier planes to
increase its regional market share. On Profitability ratios, ROCE changed from about 19% to
about 10%, while ROI changed from about 40% to about 16%, and GP margin slightly changed
from about 29% to 30%. The implication of increasing in the GP margin, but a drop in the ROCE

45
and ROI may be due to increase of capital employed thus increasing the denominator of the
equation.
The gearing ratios of the firm increased after it cross-listed. The debt-equity ratio
changed from 1.1017 to 2.64008 while the debt ratio changed from 2.1017 to 2.6745. In respect
to Equity related ratios, the EY changed from about 80% to about 29%, while the DY changed
from about 10% to about 8%, and the P/E ratio changed from 1.248 times to 3.4574 times. The
decline in EY may imply that the firm‟s profitability was not commensurate with the increase in
shares outstanding. DY could have decreased as a direct result of the decline in EY or the firm
may have decided to retain more of its profits to facilitate its investment projects. The increase in
the P/E ratio might have been due to investments in assets (aircrafts) that took time to recoup
their initial capital outlay.

46
Table 7a; Financial Performance for Kenya Airways Two Years Before and After It Cross-Listed
Details Two years before Cross listing Two years after Cross listing
Liquidity Ratios
Current Ratio 1.5975 0.83184
Quick Ratio 1.488805 0.72191
Profitability Ratios
Return on Capital
Employed
0.18687 0.096092
Return on Investments 0.40225 0.16126
GP Margin 0.28906 0.29529
Gearing Ratios
Debt-Equity Ratio 1.1017 2.64008
Equity Ratio 2.1017 2.6745
Equity Related Ratios
EY 0.8013 0.2892
DY 0.095 0.0769
P/E 1.248 3.4574
Source: Data analysis, 2009
4.2.2.2 Two Tailed T Test on Financial Performance for Kenya Airways Two Years Before
and After It Cross-Listed
In liquidity, the computed t value was 9.913438 being greater than t critical of 4.302653
indicating that the difference in gearing ratios is statistically significant. This is confirmed by the

47
p value of 0.010023 being smaller than the 0.05. This large drop in liquidity may imply that the
national carrier airline was facing some liquidity challenges because of its heavy investments.
The mean difference was 1.16, which was statistically significant. In respect to profitability, the
computed t value was 1.269397 being less than t critical of 2.776445 indicating that the
difference in gearing ratios is not statistically significant. This is confirmed by the p value of
0.273129 being greater than the 0.05. The mean difference was 0.2385; this could be due to
chance or error. Despite the large double drop in the ROCE and ROI ratios, they were not
statistically significant.
The computed t value in gearing ratios was -2.10993 being less than t critical of 12.7062
indicating that the difference in gearing ratios is not statistically significant. This is confirmed by
the p value of 0.281762 being greater than the 0.05. The mean difference was 2.1295; this could
be due to chance or error. These gearing ratios could have increased due to massive investments
undertaken by the national carrier resulting to increased borrowing. However, there could also be
almost equal increase in the debt levels thus making the results not statistically significant. In
Equity related ratios, the computed t value was -0.4895 being less than t critical of 4.3027
indicating that the difference in gearing ratios is not statistically significant. This is confirmed by
the p value of 0.6729 being greater than the 0.05. The mean difference was 0.9946; this could be
due to chance or error. Due to high investments in fixed assets, the rate at which they would
recoup the initial capital increased and thus the increase in the P/E ratio.
Table 7b; financial performance for Kenya Airways two years before and after it cross-listed
Two tailed T-test
95% confidence level
Measure t-stat df t-critical mean 1 mean 2 mean difference p-value
Liquidity ratio 9.9134 2 4.3027 1.5432 0.7769 1.1600 0.0100
Profitability ratio 1.2694 4 2.7764 0.2927 0.1842 0.2385 0.2731
Gearing ratio -2.1099 1 12.7062 1.6017 2.6573 2.1295 0.2818
Equity-related -0.4895 2 4.3027 0.7148 1.2745 0.9946 0.6729
Source: Data analysis, 2009

48
4.2.3.1 Financial performance of Jubilee Holdings Ltd. holdings two years before and after
it cross-listed
There was a great increment on the liquidity of Jubilee Holdings Ltd. after it cross-listed.
According to the results in table 8a, current ratio changed from 1.1795 to 2.0293 while quick
ratio changed from 1.1796 to 2.0293. A point to note is that Jubilee Holdings Ltd. had no
inventory, as it is a service based firm and thus the reason why current and quick ratios were the
same. After it cross-listed the current assets increased substantially compared to the current
liabilities. They were below the stipulated standard of 2 times before it cross-listed, but reached
the standard after issuing stock across the borders. By meeting the stipulated standard, it may
imply that Jubilee Holdings Ltd. was in a position to comfortably fulfill its current obligations.
In Profitability ratios, ROCE changed from about 4%0 to about 6%, while ROI changed from
about 14% to about 22%, and GP margin slightly changed from about 75% to about 77%. This
increase may have been attributed to more profitable ventures due to economies of scale. The
results of gearing ratios as shown in table were; Debt-Equity Ratio that changed from 0.9271 to
0.8414 and Equity Ratio, which changed from 3.955 to 4.6671. In Equity-related ratios the EY
changed very slightly from 10.95% to 10.88%, while the DY changed from about 4.2% to about
0.025, and the P/E ratio changed from 8.982 to 9.1938 times. The decline in DY might be
attributed to the firm retaining its profits more and thus lower dividend payout. The increase in
P/E ratio may imply investment projects that have long-term returns; which may create
confidence in shareholders as to the going concern of the firm.

49
Table 8a: Financial Performance of Jubilee Holdings Ltd. Holdings Two Years Before and After
It Cross-Listed
Details Two years before Cross listing Two years after Cross
listing
Liquidity Ratios
Current Ratio 1.1795 2.0293
Quick Ratio 1.1796 2.0293
Profitability Ratios
GP Margin 0.74544 0.7721
Return on Capital Employed 0.044678 0.06022
Return on Investments 0.1362 0.22257
Gearing Ratios
Debt-Equity Ratio 0.9271 0.8414
Equity Ratio 3.955 4.6671
Equity Related Ratios
EY 0.1095 0.1088
DY 0.00417 0.025
P/E 8.982 9.1938
Source: Data analysis, 2009

50
4.2.3.2 Two Tailed T Test Results on Financial Performance of Jubilee Holdings Ltd.
Holdings Two Years Before and After It Cross-Listed
In liquidity, the computed t value was -16995 being greater than t critical of 12.7062
indicating that the difference in liquidity ratios are statistically significant. This is confirmed by
the p value of 0.0000375 being smaller than the 0.05. The mean difference was 1.604 which was
significant. The computed t value in profitability ratios was -0.13922 being less than t critical of
2.776445 indicating that the difference in gearing ratios is not statistically significant. This is
confirmed by the p value of 0.896003 being greater than the 0.05. The mean difference was
0.330. This slight change might be due to the firm investing in long term projects that had not
generated the returns thus making the ratios remain relatively unchanged.
In respect to gearing ratios, the computed t value was -0.12839 being less than t critical of
4.302653 indicating that the difference in gearing ratios is not statistically significant. This is
confirmed by the p value of 0.909588 being greater than the 0.05. The mean difference was
2.598; this could be due to chance or error. The slight increase in gearing might denote that the
company increasing its debt levels at a relatively higher rate than the way it increased its equity.
The computed t value in equity related ratios was -0.01817 being less than t critical of 2.776445
indicating that the difference in gearing ratios is not statistically significant. This is confirmed by
the p value of 0.986375 being greater than the 0.05. The mean difference was 3.071.
Table 8b: Financial Performance of Jubilee Holdings Ltd. Holdings Two Years Before and After
It Cross-Listed
Two tailed T-test
95% confidence level
Measure t-stat df t-critical mean 1 mean 2 mean difference p-value
Liquidity ratio -16995 1 12.706 1.180 2.029 1.604 0.000
Profitability ratio -0.1392 4 2.776 0.309 0.352 0.330 0.896
Gearing ratio -0.1284 2 4.303 2.441 2.754 2.598 0.910
Equity-related -0.0182 4 2.776 3.032 3.109 3.071 0.986
Source: Data analysis, 2009

51
4.3. Financial Performance of Cross and Non-Cross-listed Firms Two Years after Cross
listing of the Cross-Listed Firms
4.3.1.1 Comparison of NMG and KQ Two Years after KQ Cross-Listed
According to the results in table 9a, current ratio of KQ and NMG was 0.83184 and
1.71157 respectively, whereas the quick ratio for the two firms was 0.72191 and 1.36593
respectively. A point to note is that the current ratio of the two firms was below the standard of 2
times. This may imply that they were not in a very good state as far as their liquidity was
concerned. The interpretation of the quick ratio is that the position of KQ was below the
stipulated standard of at least 1 time, but that of NMG was in a recommendable state. The reason
why the current ratio of NMG was below the standard but quick ratio met the threshold might be
due to the nature of business of the company. This company is a service base d and thus its stock
values are relatively very small compared to the other current assets.
The results of Profitability ratios were as; ROCE of KQ and NMG was about 10% and
about 31% respectively, while ROI was about 16% and about 21% for KQ and NMG
respectively, and GP margin was about 30% and 76% respectively for the two firms. From the
results of the data analyzed the profitability of NMG was higher than that of KQ. This could be
attributed to the nature of business carried out by the two firms. For KQ to carry out its normal
business, it requires aircrafts which are very expensive while NMG requires cameras and a
media house which is relatively less expensive compared to aircrafts.
The Gearing ratios as shown were; Debt-Equity Ratio which was 2.64008 and 0.4174 for
KQ and NMG respectively while Equity Ratio was 2.6745 and 1.08915 for KQ and NMG
respectively. The equity related ratios were; EY which was about 29% and 6% for KQ and NMG
respectively, while the DY which was about 8% and about 2.5% for KQ and NMG respectively,
and the P/E ratio which was 3.4574 and 18.0794 times for KQ and NMG respectively. Despite
having increased the volume of its outstanding shares, the Equity related ratios for KQ were in a
better situation than those of NMG. P/E ratio which measures the years a firms will take to
recoup its investments showed a larger value in respect to NMG compared to KQ. The Karl
parson‟s correlation between the returns of the two firms was 0.6594; this means that the returns

52
of the two firms were moving strongly on the same direction. Thus an increase in return on KQ
by 1% would cause an increase of about 0.66% in the returns of NMG.
Table 9a: Comparison of NMG and KQ Two Years after KQ Cross-Listed
Details KQ-Two years after Cross
listing
NMG; Two years after Cross
listing of KQ
Liquidity Ratios
Current Ratio 0.83184 1.71157
Quick Ratio 0.72191 1.36593
Profitability Ratios
Return on Capital
Employed
0.096092 0.312025
Return on Investments 0.16126 0.20708
GP Margin 0.29529 0.75665
Gearing ratio
Debt-Equity Ratio 2.64008 0.4174
Equity Ratio 2.6745 1.08915
Equity Related Ratios
EY 0.2892 0.055311
DY 0.0769 0.025
P/E 3.4574 18.0794
Source; Data analysis, 2009

53
4.3.1.2 One Tailed T Test Results on the Comparison of NMG and KQ Two Years after KQ
Cross-Listed
The computed t value in liquidity ratios was 0.0744 being lesser than t critical of
6.313752. A point to note is that these differences in liquidity ratios are statistically significant.
This is confirmed by the p value of 0.074384 being less than 0.1. The mean difference was
1.1578 which was significant. NMG was more liquid than KQ, two years after KQ had first
cross-listed. This might be attributed to either; KQ has fewer amounts of current assets or KQ
utilized its funds immediately after it raised capital through cross listing.
In respect to profitability ratios, the computed t value was 0.1546 being less than t critical
of 0.184214 indicating that the difference in gearing ratios is not statistically significant. This is
confirmed by the p value of 0.154564 being greater than the 0.05. The mean difference was
0.3047; this could be due to chance or error. A point worth noting is that NMG has a higher
profitability margin than KQ which has a very high turnover.
The computed t value in gearing ratios was 5.661393 being less than t critical of
6.313752; the difference in gearing ratios is statistically significant. This is confirmed by the p
value of 0.055651 being less than 0.1 greater than the 0.05. The mean difference was 1.7053; this
was statistically significant. Though not significant the difference in gearing of the two firms is
very large.
In respect to equity related ratios, the computed t value was 0.2581 being less than t
critical of 2.919986 indicating that the difference in gearing ratios is not statistically significant.
This is confirmed by the p value of 0.25807 being greater than the 0.05. The mean difference
was 3.66387.

54
Table 9b: Comparison of NMG and KQ Two Years after KQ Cross-Listed
One tailed T-test
95% confidence level
Measure t-stat df t-critical mean 1 mean 2 mean difference p-value
Liquidity ratio 0.0744 1 6.313752 0.776875 1.53875 1.1578 0.074384
Profitability ratio 0.1546 2 0.184214 0.184214 0.425252 0.3047 0.154564
Gearing ratio 5.6613 1 6.313752 2.65729 0.753275 1.7053 0.055651
Equity-related 0.2581 2 2.919986 1.2745 6.053237 3.66387 0.25807
Source; Data analysis, 2009
4.3.2.1 Comparison of EABL and ARM Two Years after Cross listing of EABL
In respect to liquidity, as shown in table 10a, the returns of EABL were higher than those
of ARM two years after EABL had cross-listed. The current ratio of ARM, two years after
EABL, cross-listed was below 2 times. According to the results in table, current ratio of EABL
and ARM was 2.4499 and 1.6458 respectively, whereas the quick ratio for the two firms was
1.43291 and 1.45322 respectively. Thus the quick ratio for both firms had surpassed the
threshold of at least1 times. From the table it is portrayed that EABL holds more stock that ARM
and thus why the quick ratio is slightly lower than that of ARM.
On profitability, ROCE of EABL and ARM was about 26% and about 10% respectively,
while ROI was about 16% and 11% for EABL and ARM respectively, and GP margin was about
35%0 and 30% respectively for the two firms. From the results of the data analyzed the
profitability of EABL was higher than that of ARM. The ROCE uses the profits before interest
and tax while the ROI normally uses profits after tax as its input. Using the outcome of these
profitability ratios, EABL has a higher volume of expenses than ARM.
The gearing ratios showed a different direction compared to the profitability and liquidity
ratios. The results as shown in table 10a were; Debt-Equity Ratio which was 0.3738 and 0.6761
for EABL and ARM respectively while Equity Ratio was 1.1002 and 1.39458 for EABL and
ARM respectively. This affirms that after a firm cross-list, there is less gearing when compared
to others firms that have not cross-listed.

55
In respect to Equity-Related ratios, EABL had lower yields that ARM. The P/E ratio
which measures the number of years it takes to recoup the initial investments was higher than
that of ARM; thus it would take EABL a longer duration to recoup the funds it had tied to its
investments. This could imply of the patience the investors have in the firm to allow their funds
to stay in the firm. The equity related ratios as shown in table 10a were; EY which was about 8%
and 10% for EABL and ARM respectively, while the DY which was about 8% and 9% for
EABL and ARM respectively, and the P/E ratio which was 13.1541 and 10.4808 times for EABL
and ARM respectively. The overall correlation between the two stocks is 0.99697. This means
that the returns for the two firms were moving strongly on the same direction. An increase in the
returns on EABL by 1% could imply an almost similar increase in the returns of ARM.
Table 10a: Comparison of EABL and ARM 2 Years after Cross listing of EABL
Details EABL; Two years
after Cross listing
ARM; Two years after
Cross listing of EABL
Liquidity Ratios
Current Ratio 2.4499 1.6458
Quick Ratio 1.43291 1.45322
Profitability Ratios
Return on Capital Employed 0.26282 0.103
Return on Investments 0.103 0.1074
GP Margin 0.34653 0.300494
Gearing Ratios
Debt-Equity Ratio 0.3738 0.6761
Equity Ratio 1.1002 1.39458
Equity Related Ratios
EY 0.07602 0.0954
DY 0.082873 0.0091743
P/E 13.1541 10.4808
Source: Data analysis 2009

56
4.3.2.2 One Tailed T Test Results on the Comparison of EABL and ARM 2 Years after
Cross listing of EABL
In liquidity ratios, the computed t value was 0.7572 being lesser than t critical of 6.3138
indicating that the differences in liquidity ratios are not statistically significant. This is confirmed
by the p value of 0.2937 being greater than the 0.05. The mean difference was 1.7455 which was
not significant.
The computed t value in profitability ratios was 0.9941 being less than t critical of 2.1318
indicating that the difference in gearing ratios is not statistically significant. This is confirmed by
the p value of 0.1882 being greater than the 0.05. The mean difference was 0.2127; this could be
due to chance or error.
In gearing ratios, the computed t value was -0.5840 being less than t critical of 2.9200
indicating that the difference in gearing ratios is not statistically significant. This is confirmed by
the p value of 0.3092 being greater than the 0.05. The mean difference was 0.8862; this could be
due to chance or error. The difference in the ratios could be attributed to the fact that EABL had
raised more funds using share capital and thus reducing its level of debt.
The computed t value in equity related ratios was 0.1631 being less than t critical of
2.1318 indicating that the difference in gearing ratios is not statistically significant. This is
confirmed by the p value of 0.4392 being greater than the 0.05. The mean difference was 3.9831;
this could be due to chance or error.

57
Table 10b: Comparison of EABL and ARM 2 Years after Cross listing of EABL
One tailed T-test
95% confidence level
Measure t-stat df t-critical mean 1 mean 2 mean difference p-value
Liquidity ratio 0.7572 1 6.3138 1.9414 1.5495 1.7455 0.2937
Profitability ratio 0.9941 4 2.1318 0.2551 0.1703 0.2127 0.1882
Gearing ratio -0.5840 2 2.9200 0.7370 1.0353 0.8862 0.3092
Equity-related 0.1631 4 2.1318 4.4377 3.5285 3.9831 0.4392
Source: Data analysis 2009
4.3.3.1 Comparison of the Performance of Jubilee Holdings and Kenya-Re Insurance, Two
Years after Jubilee Cross-Listed
According to the analysis on table 10a below, the liquidity of Kenya Re was higher than
that of Jubilee Holdings Ltd. These ratios though are still within the recommended range of 2
and 1 for Current and Quick Ratio respectively. Current ratio of Jubilee Holdings Ltd. and Kenya
Re Insurance was 2.0293 and 2.6882 respectively, whereas the quick ratio for the two firms was
2.0293 and 2.0468 respectively.
The profitability ratios were as; ROCE of Jubilee Holdings Ltd. and Kenya Re Insurance
was about 6% and about 27% respectively, while ROI was about 22% and about 10% for Jubilee
Holdings Ltd. and Kenya Re Insurance respectively, and GP margin was about 77% and about
38% respectively for the two firms. From the results of the data analyzed the profitability of
Jubilee Holdings Ltd. was higher than that of Kenya Re Insurance.
The table also shows the gearing results for Jubilee Holdings Ltd. and Kenya Re
Insurance. These are as follows; Debt-Equity Ratio which was 0.8414 and 0.7171 for Jubilee
Holdings Ltd. and Kenya Re Insurance respectively while Equity Ratio was 4.6671 and 1.31117
times for Jubilee Holdings Ltd. and Kenya Re Insurance respectively. The equity related ratios as
shown in table were; EY which was about 11% and about 9% for Jubilee Holdings Ltd. and
Kenya Re Insurance respectively, while the DY which was about 2.5% and about 2% for Jubilee
Holdings Ltd. and Kenya Re Insurance respectively, and the P/E ratio which was 9.1938 and

58
10.7438 times for Jubilee Holdings Ltd. and Kenya Re Insurance respectively. The correlation
co-efficient between the two stocks is 0.92392. This means that the returns of the two firms were
strongly moving on the same direction. A reduction in the returns of Jubilee Holdings by 1%
could mean a decrease in returns of Kenya Re by about 0.92%

59
Table 11a: Comparison of the Performance of Jubilee Holdings and Kenya-Re Insurance, Two
Years after Jubilee Holdings Cross-Listed
Details Current Financial
Performance-Jubilee
Current Financial
Performance, Kenya Re
Liquidity Ratios
Current Ratio 2.0293 2.6882
Quick Ratio 2.0293 2.0468
Profitability Ratios
Return on Capital
Employed
0.06022 0.27423
Return on Investments 0.22257 0.1006
GP Margin 0.7721 0.37594
Gearing Ratios
Debt-Equity Ratio 0.8414 0.7171
Equity Ratio 4.6671 1.31117
Equity-Related Ratios
EY 0.1088 0.0931
DY 0.025 0.0192
P/E 9.1938 10.7438
Source: Data analysis, 2009

60
4.3.3.1 One Tailed T Test Results on Comparison of the Current Performance of Jubilee
Holdings and Kenya-Re Insurance
In liquidity ratios, the computed t value was -1.0546 being lesser than t critical of 6.3138
indicating that the differences in liquidity ratios are not statistically significant. This is confirmed
by the p value of 0.2415 being greater than the 0.05. The mean difference was 2.1984 which was
not significant.
The computed t value on profitability ratios was 0.4409 being less than t critical of
2.3534 indicating that the difference in gearing ratios is not statistically significant. This is
confirmed by the p value of 0.3446 being greater than the 0.05. The mean difference was 0.3009;
this could be due to chance or error.
According to the gearing ratios, the computed t value was 1.0000 being greater than t
critical of 0.2669 indicating that the difference in gearing ratios is statistically significant. This is
however not confirmed by the p value of 0.8989 which is greater than the 0.05. The mean
difference was 0.8862; which is statistically significant.
The computed t value in equity related ratios was 4.0000 being greater than t critical of
0.4593 indicating that the difference in gearing ratios is statistically significant. This is indeed
confirmed by the p value of -0.1088 being greater than the 0.05. The mean difference was 3.9831
which were statistically significant at 95% degree of confidence.

61
Table 11b: Comparison of the Current Performance of Jubilee Holdings and Kenya-Re
Insurance
One tailed T-test
95% confidence level
Measure t-stat df t-critical mean 1 mean 2 mean difference p-value
Liquidity ratio -1.0546 1 6.3138 2.0293 2.3675 2.1984 0.2415
Profitability ratio 0.4409 3 2.3534 0.3516 0.2503 0.3009 0.3446
Gearing ratio 1.0000 0 0.2669
2.75425
1-014135 1.8842 0.8989
Equity-related 4.0000 0 0.4593
3.1092
3.6187 3.36095 -0.1088
Source: Data analysis, 2009
4.4 Current Financial Performance of Cross and Non-Cross-listed Firm
4.4.1.1Comparison of the Current Performance of EABL and ARM
According to the results in table 12a, the current performance of EABL in terms of
liquidity is indicating a higher value than that of ARM. The current ratio of EABL was below 2
times while the quick ratio of ARM was below 1. Current ratio of EABL and ARM was 1.9773
and 1.0169 times respectively, whereas the quick ratio for the two firms was 1.3081 and 0.71401
respectively.
In respect to profitability, ROCE of EABL and ARM was about 51% and about 16%
respectively, while ROI was about 38% and 24% for EABL and ARM respectively, and GP
margin was about 53% and about 36% respectively for the two firms. From the results of the data
analyzed the profitability of EABL was higher than that of ARM.
On gearing ratios, the results as shown in table 12a were; Debt-Equity Ratio which was
0.102614 and 1.9985 for EABL and ARM respectively while Equity Ratio was 1.1026 and
2.1196 for EABL and ARM respectively.

62
The equity related ratios as shown in table were; EY which was about 6% and about
5.3% for EABL and ARM respectively, while the DY which was about 3.8% and 13% for
EABL and ARM respectively, and the P/E ratio which was 15.7068 and 18.898 times for the two
firms respectively. The correlation co-efficient between the two stocks was 0.9878. This is an
indicator that their financial returns are strongly moving on the same direction.

63
Table 12a: Comparison of the Current Performance of EABL and ARM
Details EABL Current Financial
Performance
ARM Current Financial
Performance
Liquidity Ratios
Current Ratio 1.9773 1.0169
Quick Ratio 1.3081 0.71401
Profitability Ratios
Return on Capital
Employed
0.5051 0.156344
Return on Investments 0.37662 0.23664
GP Margin 0.53482 0.3605
Gearing ratios
Debt-Equity Ratio 0.102614 1.9985
Equity Ratio 1.1026 2.1196
Equity Related Ratios
EY 0.0637 0.529
DY 0.0377 0.13201
P/E 15.7068 18.898
Source: Data analysis, 2009

64
4.4.2.1 One Tailed T Test on Comparison of the Current Performance of EABL and ARM
The computed t value was 2.116234 being lesser than t critical of 6.313752 indicating
that the differences in liquidity ratios are not statistically significant. This is confirmed by the p
value of 0.140514 being greater than the 0.05. The mean difference was 1.2541which was not
significant; this could be attributed to chance or error.
The computed t value was 2.881681 being greater than t critical of 2.131847 indicating
that the difference in profitability ratios is statistically significant. This is confirmed by the p
value of 0.022469 being less than the 0.05. The mean difference was 0.022469; which is
statistically significant.
The computed t value was -2.8918 being less than t critical of 6.313752 indicating that
the difference in gearing ratios is not statistically significant. This is confirmed by the p value of
0.105976 being greater than the 0.05. The mean difference was 1.3308; this could be due to
chance or error. This could be attributed to the increase in share capital after cross listing.
The computed t value was -0.15442 being less than t critical of 2.131847 indicating that
the difference in gearing ratios is not statistically significant. This is confirmed by the p value of
0.442378 being greater than the 0.05. The mean difference was 5.8945; this could be due to
chance or error.
Table 12b: comparison of the current performance of EABL and ARM
One tailed T-test
95% confidence level
Measure t-stat df t-critical mean 1 mean 2 mean difference p-value
Liquidity ratio 2.1162 1 6.3138 1.6427 0.8655 1.2541 0.1405
Profitability ratio 2.8817 4 2.1318 0.4722 0.2512 0.3617 0.0225
Gearing ratio -2.8918 1 6.3138 0.6026 2.0591 1.3308 0.1060
Equity-related -0.1544 4 2.1318 5.2694 6.5197 5.8945 0.4424
Source: Data analysis, 2009

65
4.4.1.2 Comparison of the current performance of KQ and NMG
According to the results in table 13a, current ratio of KQ and NMG was 1.5165 and
1.85365 respectively, whereas the quick ratio for the two firms was 1.4275 and 1.7234
respectively. A point to note is that in both firms, the current ratios did not meet the stipulated
standard of at least two times.
In respect to profitability, ROCE of KQ and NMG was about 9% and about 4.3%
respectively, while ROI was about 15% and about 30% for KQ and NMG respectively, and GP
margin was about 27% and about 80% respectively for the two firms. From the results of the data
analyzed the profitability of KQ was higher than that of NMG. This is despite the fact that the
GP margin showed a major difference in the performance, and also the other ratios portrayed the
performance of NMG as being greater than that of KQ.
In respect to gearing ratios, the results as shown in table below were; Debt-Equity Ratio
which was 1.96757 and 0.5328 for KQ and NMG respectively while Equity Ratio was 2.4221
and 1.0274 for KQ and NMG respectively.
KQ has higher Equity-related ratios. These were; EY which was about 35% and about
6.3% for KQ and NMG respectively, while the DY which was about 7.3% and 3.9% for KQ and
NMG respectively, and the P/E ratio which was 2.8674 and 15.9504 times for KQ and NMG
respectively. The Karl-Pearson‟s correlation between the two stocks is 0.63895. This is a strong
indicator that the financial performance of the two firms is moving in the same direction

66
Table 13a; Comparison of the Current Performance of KQ and NMG
Details KQ Current Financial
Performance
NMG Current Financial
Performance
Liquidity Ratios
Current Ratio 1.5165 1.85365
Quick Ratio 1.4275 1.7234
Profitability Ratios
Return on Capital
Employed
0.088 0.4296
Return on Investments 0.14954 0.29944
GP Margin 0.2734 0.79888
Gearing ratios
Debt-Equity Ratio 1.96757 0.5328
Equity Ratio 2.4221 1.0274
Equity Related Ratios
EY 0.34875 0.0627
DY 0.07292 0.0382
P/E 2.8674 15.9504
Source: Data analysis, 2009

67
4.4.2.2 One Tailed T Test Results on Comparison of the Current Performance of KQ and
NMG
On liquidity, The computed t value was -4.01291 being greater than t critical of 2.919986
indicating that the differences in liquidity ratios is statistically significant. This is confirmed by
the p value of 0.028427 being less than the 0.05. The mean difference was 1.6303 which is
significant. NMG is more liquid than KQ.
The computed t value on gearing was -2.12924 being less than t critical of 2.353363; the
difference in profitability ratios is statistically significant. This is confirmed by the p value of
0.06155 which is less than 0.1 but is greater than the 0.05. The mean difference between the
returns of the two firms was 0.3398 which is statistically significant.
On gearing ratios, the computed t value was 4.2122 being greater than t critical of 2.9200
indicating that the difference in gearing ratios is statistically significant. This is confirmed by the
p value of 0.0260 being less than the 0.05. The mean difference was 1.4875; these results are
statistically significant and could mean that the firm‟s investment in very heavy Boeing
Airplanes was still felt as it had not recovered from the debts it owed.
The computed t value on equity related ratios was 0.0260 being less than t critical of
2.9200 indicating that the difference in gearing ratios is not statistically significant. This is
confirmed by the p value of 0.2558 being greater than the 0.05. The mean difference was 3.2234;
this could be due to chance or error.
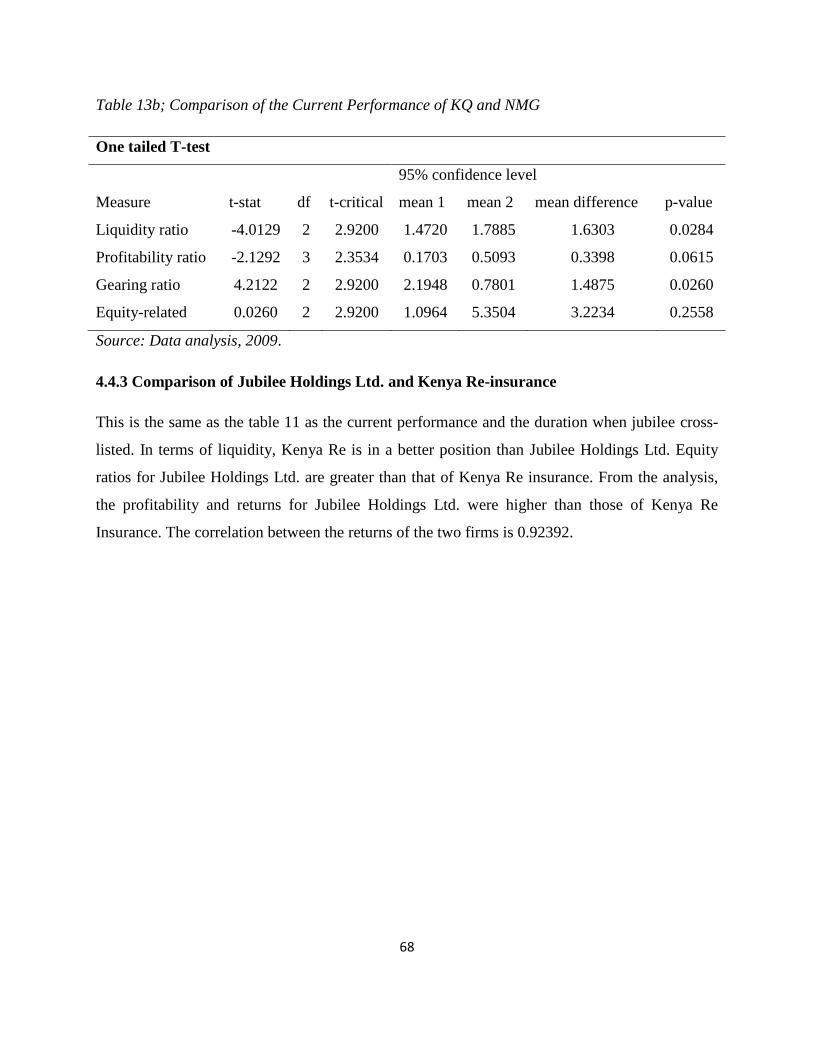
68
Table 13b; Comparison of the Current Performance of KQ and NMG
One tailed T-test
95% confidence level
Measure t-stat df t-critical mean 1 mean 2 mean difference p-value
Liquidity ratio -4.0129 2 2.9200 1.4720 1.7885 1.6303 0.0284
Profitability ratio -2.1292 3 2.3534 0.1703 0.5093 0.3398 0.0615
Gearing ratio 4.2122 2 2.9200 2.1948 0.7801 1.4875 0.0260
Equity-related 0.0260 2 2.9200 1.0964 5.3504 3.2234 0.2558
Source: Data analysis, 2009.
4.4.3 Comparison of Jubilee Holdings Ltd. and Kenya Re-insurance
This is the same as the table 11 as the current performance and the duration when jubilee cross-
listed. In terms of liquidity, Kenya Re is in a better position than Jubilee Holdings Ltd. Equity
ratios for Jubilee Holdings Ltd. are greater than that of Kenya Re insurance. From the analysis,
the profitability and returns for Jubilee Holdings Ltd. were higher than those of Kenya Re
Insurance. The correlation between the returns of the two firms is 0.92392.

69
CHAPTER FIVE;
SUMMARY, CONCLUSIONS AND RECOMMENDATIONS
5.1 Summary of the Results
In respect to shareholding, it was evident that the firms in the study are associates; there
are investors who hold between 25%-49% of their outstanding equity stock. Kenya Airways has
KLM (Konink Lijke Luchuaart Maatschappj) as a major investor, who holds 120,020,025 shares.
This constitutes 26% of its share capital. EABL‟s largest investor is Diageo Kenya Ltd, who
holds 42.82% of its share capital constituting 282,174,649 shares, and in Jubilee Holdings Ltd.
the major shareholder is Aga Khan Fund for Economic Development who owns 17,093,182
shares which comprise 37.98% of its outstanding share capital.
From the data collected and analyzed, eight t tests on the financial results were
conducted. Five of these tests were one tailed while three were two tailed and they totaled 32
individual tests. Out of these tests, only nine showed results that were statistically significant.
Liquidity for the firms after cross listing improved; this is shown by EABL and Jubilee Holdings
with the exception of Kenya Airways. There was such a big drop in the liquidity of KQ that the
results were statistically significant at 95% confidence level. There was also great improvement
in the liquidity of Jubilee Holdings two years after it had cross-listed. In EABL, the current and
quick ratios outperformed the recommended 2 and 1 times parameter. The return ratios also
improved when the firms cross-listed except the case of Kenya Airways; in Kenya Airways, it is
only the GP Margin that increased. Firms could get more ways to utilize their investment
opportunities, as there could be enough money to undertake viable projects with greater returns.
With exception of Kenya Airways, Gearing ratios decreased when most of the firms
decided to raise capital across the border. The debt-equity ratios and equity ratios for most firms
reduced drastically. The Equity-related ratios of all firms reduced significantly after they cross-
listed. This is in respect to the Earnings Yield, EPS and Dividend Yield. The GP margin for all
firms increased showing that the issue of new shares indeed improved their profitability. This is
might be due to the utilization of the funds in ventures which were profitable.

70
The comparative study of cross-listed and non-cross-listed firms, two years after the
cross-listed first raised capital beyond the national boundaries, revealed several results: in
liquidity ratios, both EABL showed better current ratio results than ARM while the Quick ratio
of ARM was slightly higher than that of EABL. KQ and Jubilee Holdings Ltd. ratios which were
all lower than that of NMG and Kenya Re Corporation respectively. In profitability ratios, the
performance of EABL and Jubilee Holdings was higher than those of the non-listed firms. This
was however not the case in respect to KQ which had lower profitability ratios than NMG.
Gearing ratios were greater for cross-listed firms for Jubilee and KQ than those of the non-cross-
listed firms. EABL however showed a different outcome when compared to ARM two years
after EABL had cross-listed; its gearing was lower than that of ARM. This could be attributed to
the fact that increase in its equity reduced its gearing. The Equity-related ratios for Jubilee
Holdings and KQ were more favourable than those of Kenya Re and NMG respectively. The
situation was however different in the case of EABL; here, the reward to shareholders was
smaller and it would take more time for them to recoup their capital investments. The Karl
Pearson‟s correlation co-efficient for the financial performance of the firms were; between KQ
and NMG it was 0.659385, between Jubilee Holdings and Kenya Re it was 0.99697, and
between EABL and ARM it was 0.92392.
In the comparison of the current financial performance of cross-listed and non-cross-
listed companies, it was found that the liquidity ratios for KQ and Jubilee Holdings were smaller
than that of their non cross-listed counterparts. This was however different in respect to EABL
compared to ARM. The profitability ratios portrayed a stronger position for EABL compared to
ARM, but a weaker position for KQ vis a vis NMG. On gearing ratios, it is only EABL which
showed a lower ratio than ARM. KQ and Jubilee showed a higher ratio compared to NMG and
Kenya Re respectively. The current profitability of all cross-listed companies was better than that
of non-cross-listed companies. The Equity related ratios of KQ and Jubilee were higher than
those of NMG and Kenya Re respectively, while that of EABL was lower than the one for ARM.
The correlation between the financial performance of the firms was: EABL and ARM, 0.9878;
NMG and KQ, 0.63895; Jubilee Holdings and Kenya Re, 0.92392.

71
5.2 Conclusions
When comparing the firm‟s financial performance two years before they cross-listed, and
two years after cross listing, liquidity improved. This might be due to the increased cash brought
in by the issue of new shares. When firms offer their shares for sale, money is injected if the
shares are fully subscribed. From the results, it was evident that in optimal situations, increased
availability of funds leads to more profitability of a firm. Cross listing reduces the gearing ratio
of firms. This is because there is increase in the level of equity thus relieving the firm from the
threat of takeovers by the creditors. This will ensure that there is no excess control in decision
making by third parties. The increase in profitability after going across the border was not
commensurate with the increase in the number of shares outstanding. There was increase in the
number of shares at a higher rate than the increase in the profitability of the firm. This is what is
known as the dilution effect. A point to lay much emphasis is that all financial results two years
before and after cross listing expect liquidity of Jubilee Holdings and KQ were not statistically
significant at 95% confidence level. This may be due to very high investments undertaken by
KQ, its liquidity reduced drastically whereas the liquidity of Jubilee Holdings may have
increased due to easier availability of funds.
It can be noted two years after cross listing, the liquidity of firms increases compared to
those firms that have not undertaken cross listing. This was affirmed by the analysis of KQ and
EABL when compared with NMG and ARM respectively. However, when a t test was conducted
on these results at 95% confidence level it was found that they were not statistically significant.
It was confirmed that firms when they cross-list generate a better return that firms which have
not cross-listed. This was true in the case of EABL and Jubilee Holdings. The case of Jubilee
Holdings compared to Kenya Re was statistically significant at 95% confidence level. It can also
be stated that when firms cross-list, their liquidity increases. This is may be due to the heavy
cash inflows brought about by the sale of huge chunks of shares across the borders. After firms‟
cross-list, their debt ratios reduce as shown in the case of EABL. There was however an
exception in the situation of KQ which may have been attributed to the fact that the firm invested
heavily in the year 2005 on modern state-of-the-art Boeing aircrafts and aggressively increased
its coverage routes. In this year, the firm bought two new modern aircrafts and massively
increased the routes it covered. The results for KQ further differ from the notion because it spent

72
cash and borrowed heavily in year 2005 to aggressively finance its growth strategies. For the
firm to sustain its heavy investment needs, it had to raise debt to compliment the equity it had
raised through cross listing in the year 2004. There is a strong correlation of the returns of firms
in similar sub-sectors of the economy. This was explained by positive correlation results of
above positive 0.5. Correlation between firms was greater than 0.5 for both current performance
and two years after the cross-listed firms had first gone across the borders.
When comparing the current financial performance for cross-listed and non-cross-listed
companies, a point to note is that ROCE for Jubilee Holdings is lower than that of Kenya Re,
while the ROI for Jubilee is higher than that of Kenya Re. This could be attributed to the fact that
current profitability margin for Jubilee is higher than that of Kenya Re. The price earnings ratio
for all firms that had cross-listed was smaller than that of similar firms that had not cross-listed
in the same subsectors of the economy. From the research the current Financial Performance of
Kenya Airways has been dwindling. This may be attributed to the Post Election Violence which
took place in early 2008. This led to decline of tourists arrivals in the country which meant loss
of business to the national carrier. The menace left by the post election violence was further
aggravated by the rising oil prices and the global financial crises. The oil price rises increased its
costs of operation while the global financial crises made it lose revenue as tourists cut their
travelling. The t test that was conducted at 95% degree of confidence portrayed that the liquidity
and gearing of the current performance of KQ in comparison with NMG was statistically
significant; this indeed affirms of the dwindling performance of the national carrier.
From the results of the study, it can be generally concluded that cross listing generally
improves firms‟ financial performance. This is because funds are availed, great investment ideas
are financed and this translates to more profitability.
5.3 Recommendations for Further Study
Further research should be done after duration of two years to assess the effects on their
performance. This is because the study did not cover all the cross-listed firms, as their duration
was not significant to show the effects of cross listing on their financial performance. These
include Equity Bank and Kenya Commercial Bank which cross-listed for the first time in June
2009 and November 2008 respectively in the Ugandan Bourse. It is also expected that with the

73
likely trend in cross listing, more firms will have cross-listed by then and thus present a more
comprehensive view. More firms in Kenya have indicated their intention to cross list by the year
2012. Future Researches should also try to study the specific cross listings undertaken by firms
and treat them individually to see the effects on the firm. For instance, they should treat cross
listing of EABL on USE and on DSE differently. This will establish the effect of raising capital
off shore on a specific firm.
A study specifically on Jubilee Holdings should be conducted. The firm showed different
results in respect to its financial ratios. It was different in that it was performing different from
the firms in other sectors that had cross-listed. A study on comparison of Jubilee Holdings Ltd.
with non-cross-listed insurance companies may reveal why Jubilee Holdings Ltd. is completely
different from other cross-listed firms.
Future researches should concentrate on qualitative factors that could influence the
financial performance of cross-listed firms. These may include stability of the country and
customer‟s perception. These studies should also research on why the firms in the Agricultural
sector have not undertaken cross listing; is it because of the perennial droughts that are faced in
the country?

74
REFERENCES
Alexander, G., Eun, C., and Janakiramanan, S. (1987). Asset Pricing and Dual Listing On
Capital Market, a Note. Journal of Finance
Athi River Mining ltd. www.armkenya.com
Baker, H., Nofsinger, J., and Daniel, G. (2002). International Cross listing And Visibility: The
Journal of Financial and Quantitative Analysis, Vol. 37, No. 3 495-521. University of
Washington School, Available at; www.jstor/org
Benos, E., and Westbachb, S. M. (2004). Private Benefits and Cross listings In the United States,
Available at; http//www.business.uicledu/weisbach
Bodie, Z., Alex. K., and Marcus, A. (1998). Essentials of Investments, 3rd
Edition, McGraw-Hill
Education, New York
Burns, N. and Bill, F. (2006). Cross listing and Legal Bonding: Evidence from mergers and
acquisitions, University of Georgia. New York. Available at;
http://www.ceistorvergay.it/conferenzconvergin/banking&finance
Capital Markets Authority Act.
Chebii, E. K. (2006). Relationship between firms capital structure and dividend payout; The case
of companies quoted in Nairobi Stock Exchange. Unpublished MBA thesis, Egerton
University.
Corrado, J., and Jordan, B. (2002). Fundamentals of Investments Valuation and Management; 2nd
Edition, McGraw-Hill Education, New York.
Dobbs, R. and Marc, H. (2008). Why cross listing shares doesn‟t create value. Mc Kinsev &
company
European Finance Review, (2006). The world of cross listings and cross listings of the world:
challenging conventional wisdom. Published by European Finance Review, Available at
http//goliath.encnext.com
East Africa Breweries Ltd. www.eabl.com
Fraenkel, J. R., Norman E. W. (2000). How to Design and Evaluate Research in
Education, 4th
Edition, McGraw Hill. New York.

75
Forester, S. and Karolyi, G. (1996). The Effects of Market Segmentation And Liquidity On Asset
Prices, Evidence from Foreign Stocks Listing In the US, Ohio State University Working
Paper
I. M. Pandey. (2006). Financial Management-9th
Edition; Vikas Publishing House, New Delhi
Inder, K., Xiumin, M. and Raynolde, P. (2006). Cross listing And Firms‟ Growth, University of
Missouri, Columbia, Available at; www.2wu-wien.ac.af
Inder, K., Raynolde, P. and Xiu, X. (2004). Does cross listing lead to a higher firm growth?
University of Missouri; Columbia, Available at; http//www.fma.org/Chicago/papers-
cross listing jan
Jubilee Holdings Insurance ltd. www.jubilee.co.ke
Karolyi, G. A. (1998). Why Do Companies List Shares Abroad? A Survey of the Evidence and
Its Managerial Implications in Financial Markets, Institutions and Instruments, Blackwell
Publishers
Karuitha, J. K. (2006). The effects of stock splits on ownership structure, stock traded volumes
and capitalization of firms in Kenya; the case study of East African Breweries Limited
and Kenya Oil Company. Unpublished MBA thesis, Egerton University.
Kiilu, D. (2006). Comparison of Financial and Non Financial Performance of Companies Before
and After Going Public, Unpublished MBA Project, Egerton University.
King, M. and Segal, D. (2006). The Long-Term Effects Of Cross listing, Investor
Recognition And Ownership Structure On Valuation. Available at;
http//web.uvic.calecon/king.pdf
Kenya Airways Ltd. www.kenyaairways.co.ke
Kenya Re Insurance ltd. www.kenyare.co.ke
Kuria, H. M. (2008). Short-term and Long-term effects of cross-border listing announcements on
companies listed at the NSE and their post listing performance, Unpublished MBA
Thesis. University of Nairobi
Kothari, C. R. (1990). Research Methodology: Methods and Techniques, 2nd
Edition, New Age
International Publishers. New Delhi.

76
Kotut, P. K. (2003). Working Capital Management Practices by Kenyan firms; a case study of
firms listed in the Nairobi Stock Exchange. Unpublished MBA Thesis. Egerton
University.
Lau, S., Diltz, D., and ApilandoV. (1994). Valuation of International Stock Exchange Listing,
Journal of Banking and Finance
Madura, J. (2003). International Financial Management, 7th Edition, Florida Atlantic University,
Thomson South Western
Maurice, D. L. (1996). International Finance 3rd
Edition; The Markets and Management of
Multi-National Business, Mc Graw Hill. New York.
Miller, D. (1996). Why do firms list in the US? An empirical analysis of the depository receipt
market. University of California at Irvine Working paper
Muchendu, P. N. (2003). The Determinants of Dividends; an Empirical Investigation of Publicly
Quoted Companies in Kenya. Unpublished MBA Project, Egerton University.
Mwangi, J. M. (2003). Factors Influencing Diversification of Investments by Firms in Kenya; “A
Survey of Quoted And Unquoted Firms”. Unpublished MBA Thesis, Egerton University.
Njeru, P. N. (2003). The effects of capital structure on company valuation; a case of companies
quoted on the Nairobi Stock Exchange. Unpublished MBA Thesis, Egerton University.
Onyuma, S. O. (2009). Day-of-the-week and month-of-the-year effect of the Kenyan stock market
returns: eastern Africa social science research review. Volume XXV no. 2, pg 53-74
Onyuma, S. O. (2006). Regional Integration of Stock Markets in Africa: African Review of
Money and Banking, supplementary issue of savings and development quantity. Milan,
Italy. Pg 97-122
Robert, D., Lind, D., and William, G. (1999). Statistical Techniques in Business and Economics:
10th Edition. McGraw Hill, New York.
Saleemi, N. A. (1995). Financial Accounting Simplified, volume 1. N.A. Saleemi
Publishers, Nairobi

77
Shibira, K. G. (2006). Determinants of bond prices; A case of Nairobi Stock Exchange.
Unpublished MBA Project, Egerton University.
Waweru, G. (2005). Impact of privatization on company‟s performance; a study of privatized
companies quoted on the Nairobi Stock Exchange. An unpublished MBA Thesis, Egerton
University.

78
Appendix 1: DATA COLLECTION SHEET
NAME OF THE COMPANY
Details Two years before cross listing Two years after cross listing
Shares Outstanding
Market Capitalization
Profits Before Tax
Owners Equity
Current Assets
Current Liabilities
Debt Level

79
Appendix 2: COMPANIES LISTED AT THE NSE
Company Registered Name Par value
Main Investments Market
Agricultural Sector
Kakuzi ord 5
Rea Vipingo Plantations ord 5
Sasini Tea & Coffee ord 1
Commercial and Services
Access Kenya Group ord 1
Car & General (K) ord 5
CMC Holdings ord 5
Hutchings Biemer ord 5
Kenya Airways ord 5
Marshalls (E.A) ord 5
Nation Media Group ord 2.5
Safaricom Ltd ord 0.05
ScanGroup ord 1
Standard Group ord 5
TPS EA (Serena) ord 1
Uchumi Supermarket ord 5
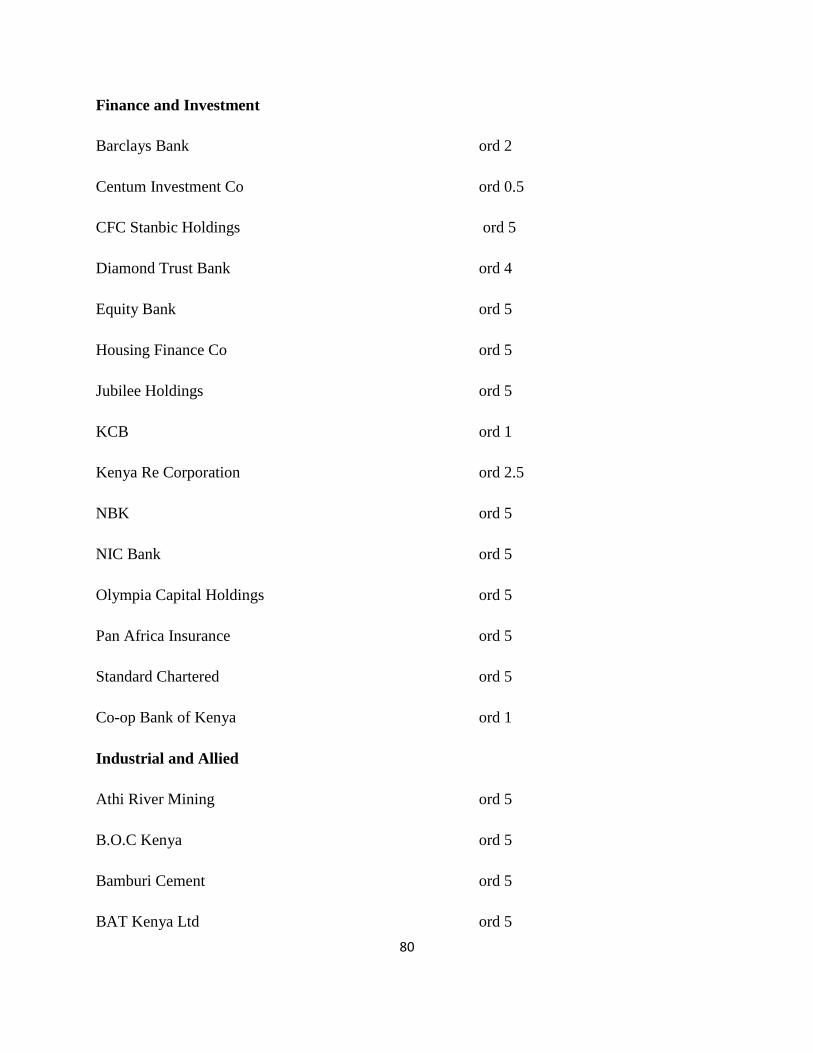
80
Finance and Investment
Barclays Bank ord 2
Centum Investment Co ord 0.5
CFC Stanbic Holdings ord 5
Diamond Trust Bank ord 4
Equity Bank ord 5
Housing Finance Co ord 5
Jubilee Holdings ord 5
KCB ord 1
Kenya Re Corporation ord 2.5
NBK ord 5
NIC Bank ord 5
Olympia Capital Holdings ord 5
Pan Africa Insurance ord 5
Standard Chartered ord 5
Co-op Bank of Kenya ord 1
Industrial and Allied
Athi River Mining ord 5
B.O.C Kenya ord 5
Bamburi Cement ord 5
BAT Kenya Ltd ord 5

81
Carbacid Investments ord 5
Crown Berger ord 5
E.A Cables ord 0.5
E.A Portland Cement ord 5
East African Breweries ord 2
Eveready EA ord 1
Kenya Oil Co ord 0.5
KPL&C ord 20
KenGen ord 2.5
Mumias Sugar Co. ord 2
Sameer Africa ord 5
Total Kenya ord 5
Unga Group ord 5
Alternative Investment Market Segment
A.Baumann & Co. ord 5
City Trust ord 5
Eaagads ord 1.25
Express ord 5
Williamson Kenya Tea ord 5
Kapchorua Tea Co. ord 5
Kenya Orchards ord 5

82
Limuru Tea Co. ord 20
Those companies that have been italicized do not engage in active trading because they are
currently suspended. Unilever Tea was delisted in the year 2008.
Source; www.nse.co.ke