effects of community factors on infant and child mortality ... · references and bibliography 33...
TRANSCRIPT

NUMBER 56 JULY 1984
AHMED AL-KABIR
Effects of Community Factors on Infant and Child Mortality in Rural Bangladesh
INTERNATIONAL STATISTICAL INSTITUTE Permanent Office. Director: E. Lunenberg 428 Prinses Beatrixlaan. PO Box 950 2270 AZ Voorburg Netherlands
WORLD FERTILITY SURVEY Project Director: Halvor Gille 35-37 Grosvenor Gardens London SWIW OBS United Kingdom

The World Fertility Survey is an international research programme whose purpose is to assess the current state of human fertility throughout the world. This is being done principally through promoting and supporting nationally representative, internationally comparable, and scientifically designed and conducted sample surveys of fertility behaviour in as many countries as possible. The WFS is being undertaken, with the collaboration of the United Nations, by the International Statistical Institute in cooperation with the International Union for the Scientific Study of Population. Financial support is provided principally by the United Nations Fund for Population Activities and the United States Agency for International Development. This publication is part of the WFS Publications Programme which includes the WFS Basic Documentation, Occasional Papers and auxiliary publications. For further information on the WFS, write to the Information Office, International Statistical Institute, 428 Prinses Beatrixlaan, Voorburg, The Hague, Netherlands.
L'Enquete Mondiale sur la Fecondite (EMF) est un programme international de recherche dont le but est d'evaluer l'etat actuel de la fecondite humaine dans le monde. Afin d'atteindre cet objectif, des enquetes par sondage sur la recondite sont mises en oeuvre et financees dans le plus grand nombre de pays possible, Ces etudes, elaborees et realisees de fai;on scientifique, fournissent des donnees representatives au niveau national et comparables au niveau international. L'lnstitut International de Statistique avec l'appui des Nations Unies, a ete charge de la realisation de ce projet en collaboration avec l'Union Internationale pour l'Etude Scientifique de la Population. Le financement est principalement assure par le Fonds des Nations Unies pour Jes Activites en matiere de Population et l'Agence pour le Developpement International des Etats-Unis. Cette publication fait partie du programme de publications de !'EMF, qui comprend la Documentation de base, Jes Documents Non-Periodiques et des publications auxiliaires. Pour tout renseignement complementaire, s'adresser au Bureau d'Information, lnstitut International de Statistique, 428 Prinses Beatrixlaan, Voorburg, La Haye, Pays-Bas.
La Encuesta Mundial de Fecundidad (EMF) es un programa internacional de investigaci6n cuyo prop6sito es determinar el estado actual de la fecundidad humana en el mundo. Para lograr este objetivo, se est{m promoviendo y financiando encuestas de fecundidad por muestreo en el mayor numero posible de paises. Estas encuestas son disefiadas y realizadas cientificamente, nacionalmente representativas y comparables a nivel internacional. El proyecto esta a cargo de! Instituto Internacional de Estadistica en cooperaci6n con la Union Internacional para el Estudio Cientifico de la Poblaci6n y con la colaboraci6n de las Naciones Unidas. Es financiado principalmente por el Fondo de las Naciones Unidas para Actividades de Poblaci6n y por la Agenda para el Desarrollo Internacional de los Estados Unidos. Esta publicaci6n ha sido editada por el Programa de Publicaciones de la EMF, el que incluye Documentaci6n Basica, Publicaciones Ocasionales y publicaciones auxiliares. Puede obtenerse mayor informaci6n sobre la EMF escribiendo a la Oficina de Informaci6n, Instituto Internacional de Estadistica, 428 Prinses Beatrixlaan, Voorburg-La Haya, Paises Bajos.

Effects of Community Factors on Infant and Child Mortality in Rural Bangladesh
AHMED AL-KABIR

The recommended citation for this publication is:
Ai-Kabir, Ahmed (1984). Effects of Community Factors on Infant and Child Mortality in Rural Bangladesh. WFS Scientific Reports no 56. Voorburg, Netherlands: International Statistical Institute.

Contents
PREFACE
ACKNOWLEDGEMENTS
INTRODUCTION
2 SOURCE AND QUALITY OF DATA
2.1 Infant and child mortality rates 2.2 The BFS community survey data
3 UNIV ARIA TE ANALYSIS
3 .1 Characteristics of the individual survey re-
5
6
7
8
8 11
14
spondents 14 3 .2 Differentials by demographic characteristics 14 3 .3 Differentials by region and by socio-economic
characteristics 14 3 .4 Differentials by community characteristics 17
4 MULTIVARIATE ANALYSIS 23
4.1 The statistical model 23 4.2 Selection of variables for the multivariate
analysis 23 4.3 The socio-demographic variables 24 4.4 Community variables 24 4.5 Interaction effects 26
S CONCLUDING REMARKS 32
REFERENCES AND BIBLIOGRAPHY 33
TABLES
Infant and child mortality rates, 1951-74, by age of mother at birth of child 7
2 Sex ratio at birth by completed years since birth 9
3 Infant and child mortality rates by sex of child 10
4 Mean difference in miles between the main community survey and PES of some selected variables (N = 54 villages) 12
5 Mortality rates by demographic characteristics of the child and mother 15
6 Mortality rates by socio-demographic charac-teristics of the mother 18
7 Distribution of respondents by number of days meat or fish eaten in previous week, by selected socio-economic variables 19
8 Distribution of exposures by community charac-teristics I 9
9 Infant and child mortality rates by community characteristics: rural women 22
10 P-values of chi-squared statistics for selected variables in models of infant and child mortality 24
11 Unadjusted and adjusted mortality rates by socio-demographic characteristics 25
12 P-values of chi-squared statistics for community variables in models of infant and child mor-tality 25
13 Exponentiated parameter estimates: community variables 26
14 Adjusted infant and child mortality rates by community characteristics 27
15 P-values of chi-squared statistics for interactions of socio-demographic variables with community variables 28
16 Mortality rates: interactions between religion and community characteristics 29
17 Mortality rates: interactions between education and community characteristics 29
18 Mortality rates: interactions between region and community characteristics 30
19 Mortality rates: interactions between birth order and community characteristics 30
20 Mortality rates: interactions between length of the previous birth interval and community characteristics 31
FIGURES
Mortality trends 1960-74 10
2 Distribution of month at death for infants dying within the first two years of life 11
3 Mortality rates by birth order of child 16
4 Mortality rates by the length of the interval since the previous birth 17
5 Mortality rates by characteristics of the sample villages 21
Preface
As part of several national fertility surveys conducted under the aegis of the World Fertility Survey, information about local amenities and conditions was collected through questions contained in a community questionnaire or survey module filled in by the field supervisors on the basis of answers given by knowledgeable local people. Although analyses using these data had been done for a few countries, the WFS felt that it was necessary to promote a more widespread utilization of the community data both to prove their value and to develop appropriate techniques for their use.
As a result of the success of earlier analysis and evaluation workshops, where participants were brought together in one location for several months to conduct separate investigations on a common theme and that provided for the interchange of ideas among themselves and the WFS permanent staff, it was decided to follow again this approach in organizing a workshop on the effects of community variables on infant and child mortality. This topic was chosen as the common theme since it was felt that the effects would be important ones.
Thus researchers from six countries were invited to participate in the workshop held from March to June 1983. Taking part were Ahmed Al-Kabir of Bangladesh, RoseAlice Njeck of Cameroon, Eduardo Borja of Ecuador, Ismail Eid of Egypt and Lucienne Tiapani of the Ivory Coast. Participating WFS permanent staff were Shea Rutstein, workshops co-ordinator, John Casterline, the workshop leader, Edmonde Naulleau and Andrew Westlake.
The present document by Ahmed Al-Kabir reports on the findings of the research he undertook while participating in the workshop.
HALVOR GILLE Project Director
5
Acknowledgements
The author would like to thank Dr J.B. Casterline of the WFS London staff for suggestions and guidance on the substantive aspects of this study, Drs Shea Oscar Rutstein and Andrew Westlake for assistance in computing, and Prof W. Brass of the Centre for Population Studies for valuable suggestions and criticisms of an earlier draft of the paper. I am also grateful to the Government of Bangladesh for permitting me to use the Bangladesh Fertility Survey data. My thanks go to the WFS for providing computer facilities and other essential resources. I would also like to thank Mr John Simon of the Centre for Population Studies for introducing me to the WFS, which made it possible to work in this area.
6
1 Introduction
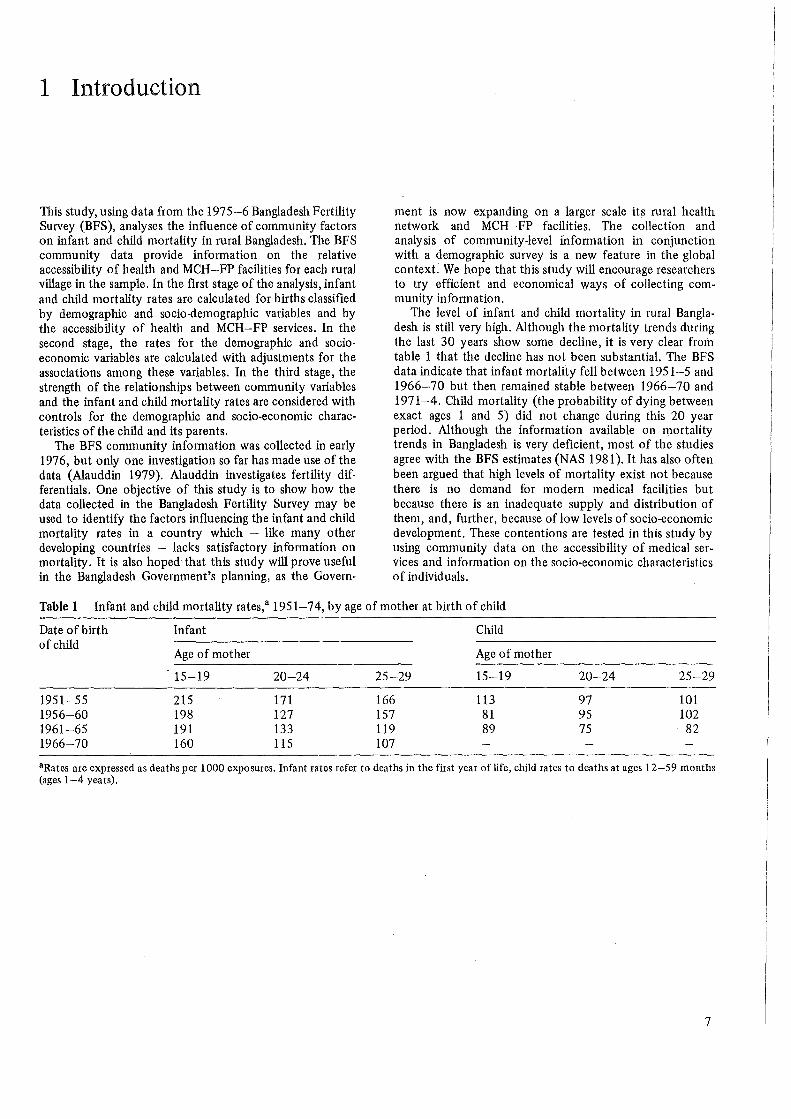
This study, using data from the 1975-6 Bangladesh Fertility Survey (BFS), analyses the influence of community factors on infant and child mortality in rural Bangladesh. The BFS community data provide information on the relative accessibility of health and MCH-FP facilities for each rural village in the sample. In the first stage of the analysis, infant and child mortality rates are calculated for births classified by demographic and socio-demographic variables and by the accessibility of health and MCH-FP services. In the second stage, the rates for the demographic and socioeconomic variables are calculated with adjustments for the associations among these variables. In the third stage, the strength of the relationships between community variables and the infant and child mortality rates are considered with controls for the demographic and socio-economic characteristics of the child and its parents.
The BFS community information was collected in early 1976, but only one investigation so far has made use of the data (Alauddin 1979). Alauddin investigates fertility differentials. One objective of this study is to show how the data collected in the Bangladesh Fertility Survey may be used to identify the factors influencing the infant and child mortality rates in a country which - like many other developing countries - lacks satisfactory information on mortality. It is also hoped that this study will prove useful in the Bangladesh Government's planning, as the Govern-
ment is now expanding on a larger scale its rural health network and MCH-FP facilities. The collection and analysis of community-level information in conjunction with a demographic survey is a new feature in the global context. We hope that this study will encourage researchers to try efficient and economical ways of collecting community information.
The level of infant and child mortality in rural Bangladesh is still very high. Although the mortality trends during the last 30 years show some decline, it is very clear from table 1 that the decline has not been substantial. The BFS data indicate that infant mortality fell between 1951-5 and 1966-70 but then remained stable between 1966-70 and 1971-4. Child mortality (the probability of dying between exact ages 1 and 5) did not change during this 20 year period. Although the information available on mortality trends in Bangladesh is very deficient, most of the studies agree with the BFS estimates (NAS 1981). It has also often been argued that high levels of mortality exist not because there is no demand for modern medical facilities but because there is an inadequate supply and distribution of them, and, further, because oflow levels of socio-economic development. These contentions are tested in this study by using community data on the accessibility of medical services and infonnation on the socio-economic characteristics of individuals.
Table 1 Infant and child mortality rates,a 1951-7 4, by age of mother at birth of child
Date of birth Infant Child of child
Age of mother Age of mother
15-19 20-24 25-29 15-19 20-24 25-29
1951-55 215 171 166 113 97 101 1956-60 198 127 157 81 95 102 1961-65 191 133 119 89 75 82 1966-70 160 115 107
a Rates are expressed as deaths per 1000 exposures. Infant rates refer to deaths in the first year of life, child rates to deaths at ages 12-59 months (ages 1-4 years).
7
2 Source and Quality of Data
The data used in this research were obtained in the Bangladesh Fertility Survey'(BFS) of 1975-6. For the Bangladesh Fertility Survey, the Population Control and Family Planning Division of the M,inistry of Health and Population Control assumed responsibility over all activities, including planning, supervision, co-ordination and execution of the fieldwork. The coding, editing (both manual and machine) and tabulations were done at the Data Processing unit of the Bangladesh Bureau of Statistics, Dhaka. The data analysis for the first report was done in London at the World Fertility Survey Office. The fieldwork was carried out by 11 interviewing teams, each consisting of 1 male supervisor, 1 female supervisor, 5 interviewers and a cook during the period from 18 December 1975 to 31 March 1976. The First Country Report was published in January 1979. The reader is referred to this report for a description of the main findings from the BFS.
A three-stage sample design was administered with oversampling of the urban sector. Three questionnaires were developed and all were administered in the field in Bengali. The household survey collected information on the age, marital status, sex, education and residence of the rriale and female population of 5855 households. The detailed individual questionnaire, administered to 6513 ever-married women of less than 50 years of age who slept in the household the night preceding the interview, obtained information on the marriage history, reproductive history, experience with fertility regulation, economic characteristics and abortion attitudes, in 11 sub-sections. The total number of children ever born to these women was 25 836. The total number of deaths reported (under 10 years) was 6238, out of which 3916 occurred during the first year of life and the remaining 23 22 occurred between exact ages 1 and 10 years. The household survey and the individual survey achieved response rates of 95 .3 and 97 .6 respectively. The third questionnaire collected community level information for each sample point about the accessibility of various facilities (including health, MCH-FP and sanitation facilities), the cropping pattern, and other environmental characteristics. Soon after the main fieldwork, re-interviews were conducted with 424 households, containing 390 eligible respondents, to obtain measures of reliability of the data. The BFS also included a unique study of 220 tape-recorded individual interviews, which provides an insight into the actual process of interviewing.
2.1 INFANT AND CHILD MORTALITY RATES
The infant and child mortality rates used in this report are calculated from data on births and deaths of children of the individual survey respondents. Respondents were asked the calendar month and year (either English or Bengali calendar) of termination of each of their pregnancies, that is
8
each live birth, each still birth, each miscarriage and each abortion. If a woman was unable to give a specific date, interviewers were instructed to ask how many 'years ago' the event occurred. Calendar dates are not well known in Bangladesh: the timing of about 16 per cent of the births were reported in calendar years and the remaining 84 per cent were reported in terms of 'years ago.' Although the timing of the vast majority of births was reported as 'years ago', this would not pose a serious problem for the estimation of fertility and mortality rates if information were available on the respondent's perception of 'years ago', in particular whether they reported 'years ago' rounded to the nearest years, to completed years, or to certain preferred digits (Chidambaram and Pullum 1981). The analysis of the tape-recorded interviews (Thompson, Nawab Ali and Casterline 1982) reveals that, when asked, respondents were able to supply a calendar year of termination of roughly one-third of the pregnancies, a calendar month for roughly one-half, and a 'years ago' (or current age of the child) in virtually all cases, with assistance from interviewers. The current survival status of each live birth was also recorded in the birth history. Fdr those children no longer alive, the age at death in months and years was collected, as well as the sex of the dead child. In this part of the birth history, interviewers were to have asked 'Did the baby show any sign oflife (cried etc) after its birth?' The detailed nature of the BFS questioning on surviving and non-surviving births increases the probability of reporting of high quality. The limitation of the sample to women under age 50 excludes women likely to show the most extreme recall bias.
Measures of mortality used in this analysis
Mortality may be measured in different ways using the BFS data. In our analysis, the following sets of rates are examined:
(i) The neo-natal mortality rate, or the probability of dying during the first month of life.
(ii) The post-neonatal mortality rate, or the probability of dying during 2-11 months of life.
(iii) The infant mortality rate, or the probability of dying before exact age 12 months (ie 1 q0 in life-table terminology).
(iv) The child mortality rate, here defined as the probability of dying between exact ages 1 and 5 years (ie 4 q1 in life-table terminology).
These rates are calculated for birth cohorts. For the infant mortality rates, births occurring in the period 12-71 months before the survey date are used. For the child mortality rates, births occurring in the period 60-119 months before the survey date are considered. However, because only women up to 49 years of age at the survey
were interviewed, for the latter reference period the maximum age at birth we can observe is 44 years. We have estimated that the unobserved births to women more than 44 years old comprise less than 5 per cent of all births which occurred in this period.
Three major considerations have influenced the choice of these mortality rates for analysis. First, the effects of community characteristics are of special interest, and these are measured only for the date of the survey. This motivates use of a reference period for the rates as near to the survey date as possible. Secondly, infant and child deaths are relatively rare events and hence stable estimates require a large number of births. This consideration motivates use of a relatively broad reference period. Clearly these first two considerations conflict. Thirdly, not all children have had complete exposure to the risk of infant and child mortality (ie the cases are censored by the interview). In the case of infant mortality these are births occurring within a year of the survey, and in the case of child mortality births occurring within five years of the survey. This consideration leads to use of a standard life-table approach or selection of non-censored cases.
As a compromise resolution of the first two considerations, five-year reference periods near the survey date have been chosen. The censoring problem is handled by selecting births with full exposure before the survey date to death during infancy or before age five years. The rates are calculated simply as the quotient of the deaths to 'exposure' provided by births occurring during the reference periods. In the case of infant and neo-natal rates, the exposures are simply the births during the reference period. In the case of the post-neonatal rate, the exposures are children surviving through the neo-natal period. In the case of the child rate, the exposures are children surviving through infancy.
Errors in the infant and child mortality data
There are various types of errors, both sampling and nonsampling, which can distort the demographic measures provided by the BFS.
As the estimates are based on sample survey data, the estimates are affected by sampling error. The statistical analysis in chapter 4 of the report will take this error into account, under the assumption of a simple random sample. In fact the BFS used a clustered sample design, but the departure of the true sampling errors from the assumed is likely to be small.
The BFS data contain non-sampling errors of the type common to demographic surveys in developing countries. There is no direct means of determining the extent of such
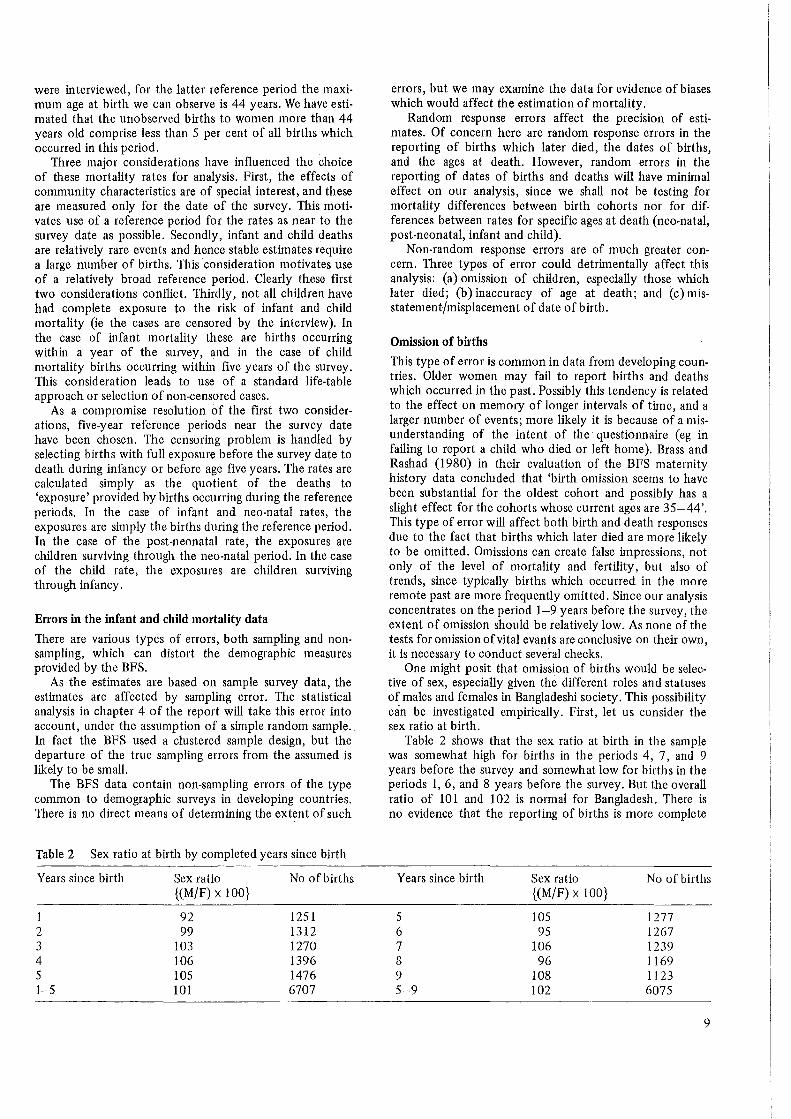
Table 2 Sex ratio at birth by completed years since birth
Years since birth Sex ratio No of births {(M/F) x 100}
1 92 1251 2 99 1312 3 103 1270 4 106 1396 5 105 1476 1-5 101 6707
errors, but we may examine the data for evidence of biases which would affect the estimation of mortality.
Random response errors affect the precision of estimates. Of concern here are random response errors in the reporting of births which later died, the dates of births, and the ages at death. However, random errors in the reporting of dates of births and deaths will have minimal effect on our analysis, since we shall not be testing for mortality differences between birth cohorts nor for differences between rates for specific ages at death (neo-natal, post-neonatal, infant and child).
Non-random response errors are of much greater concern. Three types of error could detrimentally affect this analysis: (a) omission of children, especially those which later died; (b) inaccuracy of age at death; and (c) misstatement/misplacement of date of birth.
Omission of births
This type of error is common in data from developing countries. Older women may fail to report births and deaths which occurred in the past. Possibly this tendency is related to the effect on memory of longer intervals of time, and a larger number of events; more likely it is because of a misunderstanding of the intent of the questionnaire (eg in failing to report a child who died or left home). Brass and Rashad (1980) in their evaluation of the BFS maternity history data concluded that 'birth omission seems to have been substantial for the oldest cohort and possibly has a slight effect for the cohorts whose current ages are 35-44'. This type of error will affect both birth and death responses due to the fact that births which later died are more likely to be omitted. Omissions can create false impressions, not only of the level of mortality and fertility, but also of trends, since typically births which occurred in the more remote past are more frequently omitted. Since our analysis concentrates on the period 1-9 years before the survey, the extent of omission should be relatively low. As none of the tests for omission of vital evants are conclusive on their own, it is necessary to conduct several checks.
One might posit that omission of births would be selective of sex, especially given the different roles and statuses of males and females in Bangladeshi society. This possibility can be investigated empirically. First, let us consider the sex ratio at birth.
Table 2 shows that the sex ratio at birth in the sample was somewhat high for births in the periods 4, 7, and 9 years before the survey and somewhat low for births in the periods 1, 6, and 8 years before the survey. But the overall ratio of 101 and 102 is normal for Bangladesh. There is no evidence that the reporting of births is more complete
Years since birth Sex ratio No of births {(M/F) x 100}
5 105 1277 6 95 1267 7 106 1239 8 96 1169 9 108 1123 5-9 102 6075
9
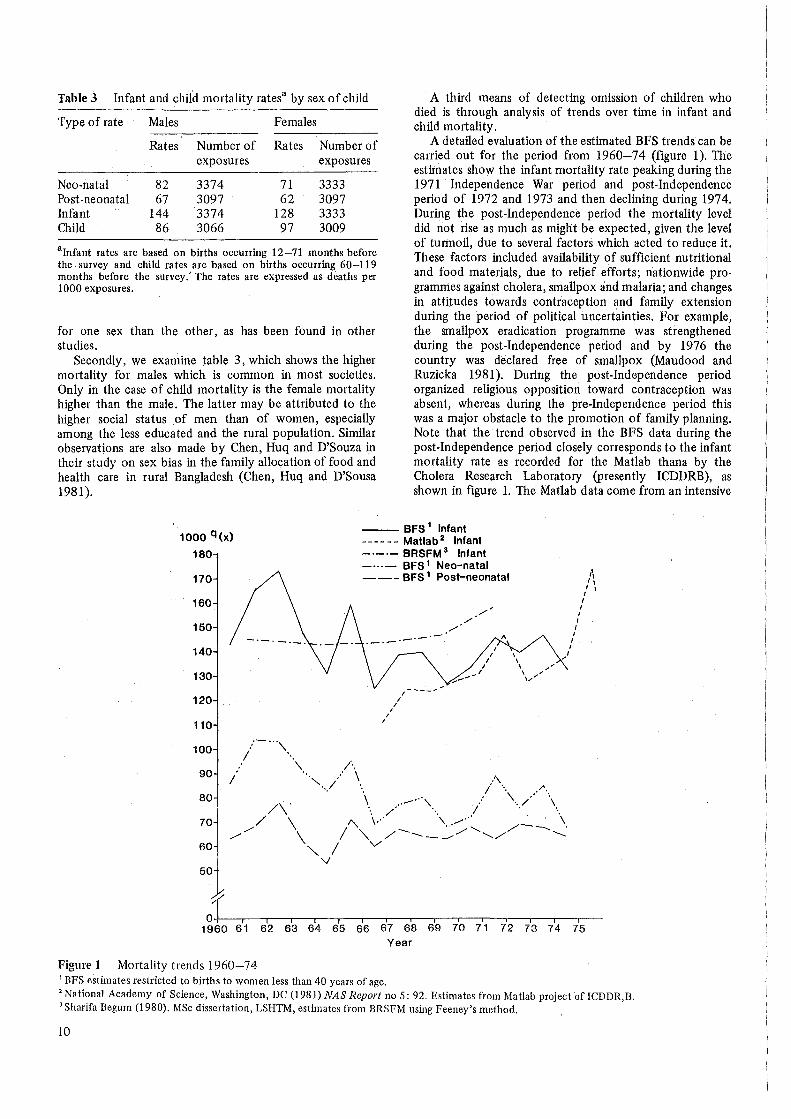
Table 3 Infant and child mortality ratesa by sex of child
Type of rate Males Females
Rates Number of Rates Number of exposures exposures
Neo-natal 82 3374 71 3333 Post-neonatal 67 3097 62 3097 Infant 144 3374 128 3333 Child 86 3066 97 3009
alnfant rates are based on births occurring 12-71 months before the survey and child rates are based on births occurring 60-119 months before the survey.' The rates are expressed as deaths per 1000 exposures.
for one sex than the other, as has been found in other studies.
Secondly, we examine table 3, which shows the higher mortality for males which is common in most societies. Only in the case of child mortality is the female mortality higher than the male. The latter may be attributed to the higher social status of men than of women, especially among the less educated and the rural population. Similar observations are also made by Chen, Huq and D'Souza in their study on sex bias in the family allocation of food and health care in rural Bangladesh (Chen, Huq and D'Sousa 1981).
A third means of detecting omission of children who died is through analysis of trends over time in infant and child mortality.
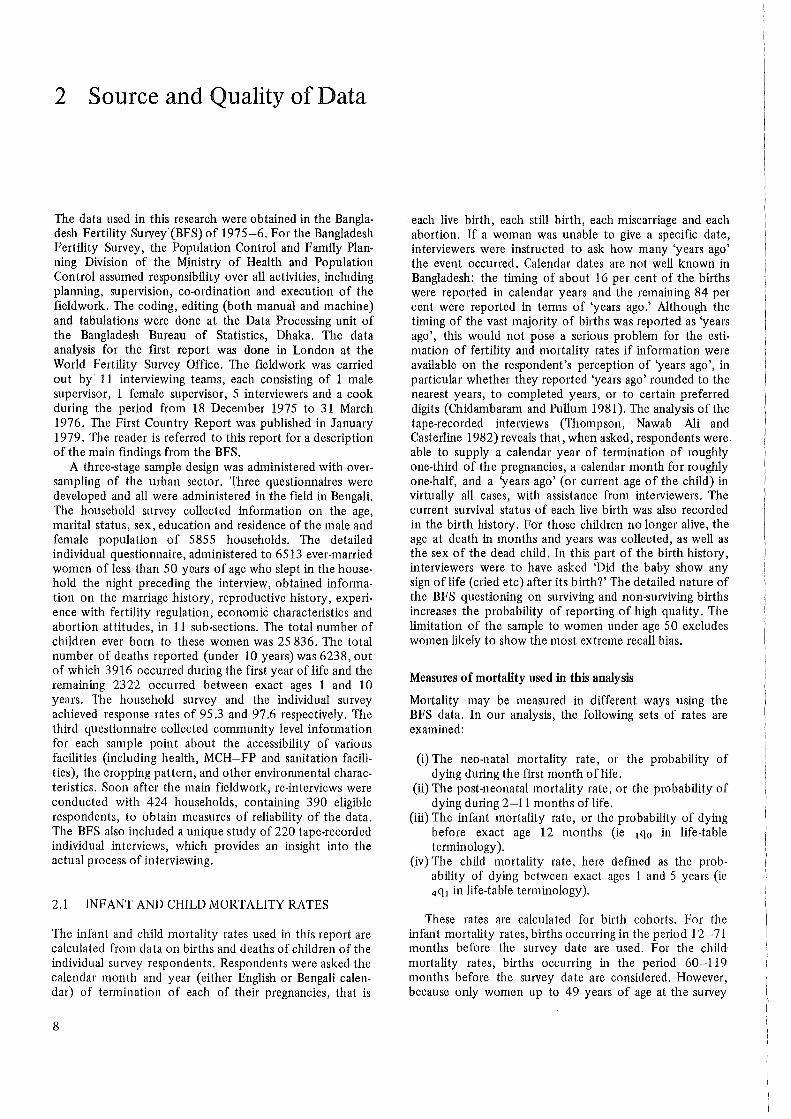
A detailed evaluation of the estimated BFS trends can be carried out for the period from 1960-74 (figure 1). The estimates show the infant mortality rate peaking during the 1971 Independence War period and post-Independence period of 1972 and 1973 and then declining during 1974. During the post-Independence period the mortality level did riot rise as much as might be expected, given the level of turmoil, due to several factors which acted to reduce it. These factors included availability of sufficient nutritional and food materials, due to relief efforts; nationwide programmes against cholera, smallpox and malaria; and changes in attitudes towards contraception and family extension during the period of political uncertainties. For example, the smallpox eradication programme was strengthened during the post-Independence period and by 1976 the country was declared free of smallpox (Maudood and Ruzicka 1981). During the post-Independence period organized religious opposition toward contraception was absent, whereas during the pre-Independence period this was a major obstacle to the promotion of family planning. Note that the trend observed in the BFS data during the post-Independence period closely corresponds to the infant mortality rate as recorded for the Matlab thana by the Cholera Research Laboratory (presently ICDDRB), as shown in figure 1. The Matlab data come from an intensive
1000 q(x) --- BFS 1 Infant
180
170
160
150 -·-·-
140
130
120
110
100 ... --.. '\
I · .. 90 I
'\
80 /\
70 / \ flO
// \
- - - - - - Matlab 2 Infant -·-·- BRSFM 3 Infant -···- BFS 1 Neo-natal --- BFS 1 Post-neonatal
I I
I I
I
·-·-
I
)
i' ,. I\
I I
I I
I I
I I I
0-1-~~-.-~..,.---.~-..-~...---.~-.-~.--.~..,.---,,--.~,---.~-
1960 61 62 63 64 65 66 67 68 69 70 71 72 73 74 75 Year
Figure 1 Mortality trends 1960-74 1 BFS estimates restricted to births to women less than 40 years of age. 2 National Academy of Science, Washington, DC (1981) NAS Report no 5: 92. Estimates from Matlab project of ICDDR,B. 3 Sharifa Begum (1980). MSc dissertation, LSHTM, estimates from BRSFM using Feeney's method.
10

data collection effort which assures relatively complete reporting of vital events.
Figure 1, along with tables 2 and 3, suggest that the failure to report children who later died does not seriously bias infant mortality rates for the recent past calculated from the BFS data.
Inaccuracy of age at death
In the BFS interview, once it was ascertained that a child had not survived to the survey date, the interviewer asked how long the child lived, in completed months and years. Figure 2 shows the distribution of month at death for infants dying within the first two years of life (excluding deaths at 0 months). This figure indicates a strong tendency to report deaths as occurring on certain months, especially months representing completed years or half-years (eg half, one, one and a half, and two years). It may be pointed out here that in Bengali one and a half years, two and a half years etc can be expressed in one word - 'Dher' and 'Arai', respectively - and the respondents at the time of interview showed preference for these rounded expressions. (This also may have contributed to heaping in the age distribution of surviving children.) Such heaping on preferred digits is also prevalent in the reporting of data on first marriage and duration of breastfeeding (see Ferry 1981, figure 1). For this analysis only heaping on 12 months will create problems, as only this month among the preferred months falls on one of the boundaries for classification of deaths by type of mortality (ie less than 1 month for neo-natal, 2-11
Percentage of deaths
40
35
30
25
20
15
10
5
0+-~r----.~-,-~-.--~..--:.~-'==;===T'=''------.~=;=~=r=L.-.
0 2 4 6 8 10 12 14 16 18 20 22 24
Age at death in months
Figure 2 Distribution of month at death for infants dying within the first two years of life
months for post-neonatal, less than 12 months for infant, and 1-4 years for child mortality). Assuming that some of the deaths reported at 12 months occurred at an earlier age, the estinrntes of post-neonatal mortality are downwardly biased and the estimates of child mortality are upwardly biased.
Mis-statement/misplacement of date of birth
A possibly common form of error in the BFS is mis-statement of the respondent's current age and the dates of her births. This type of error can distort some mortality estimation procedures, but the measures utilized here are essentially unaffected unless date misplacement is selective on survival status of the child. However, such errors do affect estimates of trends in mortality. The direction and magnitude of the effect are a function of the number of births women displace from one period to another and their total number of children ever born. Brass and Rashad (1980) note that most retrospective survey data (including data from the BFS) are deficient in this respect. The magnitude of the error increases with the age of women, ie when the respondents report further into the past. As the estimates utilized in this analysis are based on the ten years preceding the survey, this problem is somewhat alleviated.
2.2 THE BFS COMMUNITY SURVEY DATA
The BFS community questionnaire was administered in the field at the same time as the interviewing for the household and individual surveys. The male supervisors from each of the ten interviewing teams collected data from 166 rural villages. Among the 166 villages, six pairs (ie 12 villages) constituted the same sampling unit. The community data for these 12 units has been merged into six units. The BFS
·community survey data file contains 158 cases, lacking two cases for unknown reasons. Among these, three villages have missing data codes for all variables. A further three villages could not be matched to main survey respondents, resulting in a final sample of 152 villages. (The descriptive analysis below includes the three villages unmatched to main survey respondents, however.)
Measurement of the community data
The BFS community information focuses on matters related to the availability of social amenities and the administrative infrastructure of the community. The village ('gram') in Bangladesh is the smallest unit in terms of official records, communication, and administrative matters. Below a village the next unambiguous and welldefined unit is the 'paribar' (household). All 'grams' comprise some 'paribars', whatever the size of the 'gram'. One may also argue that the 'gusthi' (kin group) or the 'para' (neighbourhood group) can be considered as the smallest community unit. But in some instances only one household may make up a 'gusthi', and the term 'para' is not used in some areas. Confusion between the 'gram' and the 'mouza' (the lowest revenue unit) can sometin1es occur, but with minimal effort at the time of the training of interviewers the confusion can be avoided. The 'mouza' is normally smaller or at best similar in size to the 'gram'. It is very easy in Bangladesh to collect a map of the 'mouza' from the
11

Table 4 Mean difference in miles between the main community survey and PES of some selected variables (N = 54 villages)
Distance from Mean difference Number of village to (main survey villages with 2
minus PES) miles or more difference
Thana headquarters 0.06 6 (NSa = 19) Boys' primary 0 (NS= 19)
school Girls' primary 0 (NS= 16)
school Combined primary 0.23 2 (NS= 10)
school Government -0.06 8 (NS= 2)
dispensary Hospital 2.56 21 (NS= 2) FP clinic 0.35 9 (NS= 2) Qualified doctor 1.55 9 (NS= 3) Other doctor -0.02 10 (NS= 9) Dai 0.53 10 (NS= 9)
aNS: Not stated. Source: BFS First Report, 1975, Appendix H
villagers, and thus avoid any confusion in identifying the 'gram' and 'mouza'. Therefore, the common and universally known terminology in Bangladesh is 'gram', and the decision to take the 'gram' (village) as the unit for the community survey is consistent with the social structure of Bangladesh.
The interviewing for the community survey was carried out on the last day of the interviewing team's stay in the village. This strategy provided the benefit of an already established contact with the village authorities and elders. The respondents were selected by the supervisors during their stay in the field. They were instructed to choose someone whom they considered knowledgeable and of social standing in the village, eg matbar (village-leader), teacher, or doctor.
A post-enumeration survey (PES) was also undertaken in 54 villages in May 1976, to obtain responses for a subset of items asked in the initial community survey interview. The findings from the PES are published as an appendix to the main BFS report. Table 4 provides a brief summary of the differences between the main community survey and the PES for some selected variables. They suggest that the BFS community data are relatively reliable on balance. However, it is worth noting that the discrepancies between the two surveys are larger for the distances to medical services than for the distance to the thana headquarters or the distance to schools. Reported distances to the nearest hospital differ the most; greater distances were reported in the main survey. These findings indicate that the medical service variables, which figure prominently in this analysis, may be subject to a moderate level of response error.
Descriptive analysis of the community survey data
It should be stressed at the outset that this analysis pertains to rural communities in 1975-6, and may not accurately reflect the national picture in the 1980s. Furthermore,
12
because the villages were selected with probability propor'tional to size, villages of larger population size are overrepresented and villages of smaller population size are under-represented in this sample, relative to the entire body of rural villages. This means that the unweighted distributions of villages according to community characteristics are estimates of the distribution of these characteristics among rural Bangladeshi residents, rather than estimates of distributions of villages. That is, we provide here national estimates for the community setting of villagers, not the characteristics of villages.
In rural Bangladesh the thana headquarters is the nucleus of all administrative activities. (Note that since the 1982-3 reorganization and decentralization of the administrative system, the thana headquarters is known as 'upojela' (subdistrict)). For example, in almost every thana there is a hospital with bed capacity ranging from 4 to 31 staffed by full-time physicians. The BFS community data shows that for 96 per cent of the villagers the closest town is the thana headquarters, with the remainder close to other towns, eg sub-divisional headquarters or district headquarters. For about 58 per cent of the sampled villages the usual transport to thana headquarters is on foot, 13 per cent by bus and the remaining 29 per cent use other means of transport, such as boat, rickshaw, bicycle, train, launch. About 25 per cent of the villagers are within 3 miles of the thana headquarters, 26 per cent 4-:6 miles away, 25 per cent 7-9 miles away, and the remaining more than 10 miles away.
Bangladesh is an agrarian country, criss-crossed by rivers and close to the Bay of Bengal. Floods, cyclones and other types of natural calamities are a normal feature of each year. The BFS community data shows that in the period between 1970 and the survey only 31 per cent of the sampled villages did not face any flood or cyclone. Of the villages which experienced either of these or both, 21 per cent had some deaths as a result. Epidemic is also very common in Bangladesh. In the same period between 1970 and the survey, 49 per cent of the villages did not experience any epidemics and 38 per cent faced at least one epidemic with some deaths resulting.
There is almost no existence of piped water supply and electricity in the rural areas. Ninety-five per cent of the sampled villages have no electricity, and presumably where there is electricity only a small percentage of the village residents can afford to have a connection to their house. People normally obtain drinking water from ponds. Use of tubewells as a source of drinking water is a recent development. Where they are available, a large number of people do use tubewell water for drinking. About 19 per cent of the villages have more than 20 tubewells, 4 7 per cent of the villages have 5 to 19 tubewells, 29 per cent have 1 to 4 tubewells, and only 5 per cent of the villages have no tubewells. Sanitary latrines are not common in rural Bangladesh. About 76 per cent of the sampled villages have not a single sanitary latrine.
The literacy level in Bangladesh is very low. However, about 93 per cent of villagers have at least a primary school within a one mile radius of their village. This figure seems to be rather high. Hospitals are not commonly close to the village. For 20 per cent of the villagers the hospital is less than 3 miles away, between 3 and 9 miles in 47 per cent of the cases, and more than 10 miles away in 29 per cent of

the cases. The government dispensaries are generally closer than the hospitals: 32 per cent less than 3 miles, 59 per cent between 3 and 9 miles, and 6 per cent more than 10 miles away. Most rural hospitals provide in-patient curative treatments as well as out-patient clinical facilities, MCH care and family planning services. These facilities are mostly situated in the thana headquarters. It may be pointed out here that since 1975 a large number of health and MCH-FP facilities (known as FWCs) were established outside thana headquarters. Pharmacies are very common in Bangladesh, with about 20 per cent of the sampled villages having one and another 37 per cent located within 2 miles. Qualified doctors are rare in rural Bangladesh, on the other hand: about 91 per cent of the villages do not have one, but 58 per cent of the villages are between 1 and 5 miles from a qualified doctor. 'Other' doctors ( eg untrained practitioners, pharmacists, homoeopaths)are much more common: 55 per cent of the villages have such a doctor, and another 28 per cent of the villages are within a 1-2 mile radius of one. Nurses are mostly located where there are hospitals in rural Bangladesh. But the Dais (traditional birth attendants) are readily available, either in the village (56 per cent) or within a 2 mile radius (16 per cent).
We have also looked at the frequency of visits to the villages by the vaccination workers, family planning workers, and the malaria eradiction workers during the year before the survey. The BFS data shows that malaria workers visited 68 per cent of the sampled villages more than 10 times and paid no visits to less than 4 per cent of the villages. Similarly, with respect to family planning and vaccination teams, 26 per cent and 17 per cent of the villages, respectively, had more than 10 visits, and less than 3 per cent in both cases had no visits.
In Bangladesh only a few people have large landholdings and most of the landholding is at the subsistence level. In 70 per cent of the sampled villages, less than 10 per cent of the families possess more than 7 acres of land, while in only 6 per cent of the villages do 20 per cent or more of the families have more than 7 acres of land. At the other extreme, in 16 per cent of the sampled villages less than 30 per cent of the families own less than 2 acres of land, while in 18 per cent of the villages more than 80 per cent of the families own less than 2 acres ofland.
13

3 Univariate Analysis
3 .1 CHARACTERISTICS OF THE INDIVIDUAL SURVEY RESPONDENTS
In the BFS a total of 6513 ever-married women below the age of 50 residing in 5'355 households were interviewed. Here we briefly describe some of the important characteristics of these women. The median age of the interviewed woman is approximately 27 years. Marriage is almost universal in Bangladesh and children are born primarily within marriage. The median age at marriage for the BFS respondents aged 30 or more is about 12.5 but rises to 13.2, 13.5 and 15.0 for age groups 25-29, 20-24, and 15-19 respectively. The female age at first marriage is rising in Bangladesh. At the time of the BFS, 88 per cent of the total sample were currently married; the percentage is 90 for women up to age 34 and then declines steadily to 69 for those aged 45-49. Fecundity, the ability to produce live-born children, is evident for 93 per cent of the currently married women. The high fertility of Bangladeshi women is clear from the BFS data. The total fertility rate for the five-year period preceding the survey (1971-5) is 6.3 births. The BFS data also indicate that the number and the sex composition of living children have a definite effect on the desire for a future birth, and the data reveal a strong preference for sons. Of women wanting another child, 62 per cent would prefer a boy, 8 per cent a girl, and 30 per cent are undecided or had no preference. Those without a living son are much less prepared to contemplate family limitation. About 92 per cent of the respondents live in rural areas, and the remaining 8 per cent in the cities and towns. Seventy eight per cent of the interviewed women have no schooling, 18 per cent primary (5th grade) level education, and only 4 per cent secondary or more education. This reflects the low educational level of women in Bangladesh. (For further details, see BFS 1975, First Report.)
3 .2 DIFFERENTIALS BY DEMOGRAPHIC CHARACTERISTICS
We know from other studies that malnutrition and related biological factors are the chief causes of infant mortality in Bangladesh. Rosenberg (1973) observed that between 9 and 17 per cent of live births die from severe malnutrition in the first month and first year respectively. Twenty-six per cent die before reaching the age of about 3 years and those who survive suffer considerable retardation in development (Rosenberg 1973). Deaths due to endogenous factors related to pre-natal conditions and circumstances surrounding the delivery influence neo-natal rates. Of course, exposure to exogenous and environmental hazards after birth plays some role, but often a minor part. Exogenous hazards, such as infectious disease, gastrointestinal diseases, poor hygiene and other environmental factors are pro-
14
minent in affecting post-neonatal rates. The type of care provided by the mother at these ages· can be critical, and itself will be affected by factors such as her education and her work activities. Note that the neo-natal rate is a larger component of the overall infant rate than the post-neonatal rate. Child deaths arise from causes similar to post-neonatal deaths, but nutrition, hygiene and environmental factors play an even more significant role.
Table 5 presents mortality differentials by demographic characteristics of the mothers. (One variable - sex of the child - is a characteristic of the child, not the mother. For comparison we include it with the other demographic variables.) The classic U-shaped relationship between age of the mother at birth and mortality during the first year of life is evident. However, child mortality declines monotonically with the age of the mother. This latter pattern may reflect the fact that older mothers are more experienced in child care.
Neo-natal, post-neonatal and infant mortality are higher for boys than for girls, but child mortality is lower for boys. The same pattern is also observed in other WFS surveys (see Rutstein 1983). Other studies have also indicated that the infant mortality rate for boys is higher, but boys receive better care (because of son preference) and this is expressed in the child mortality differential (Chen et al 1981 ).
Effects on mortality of the birth order of the child are revealed by this study (see figure 3). The infant rate is high for first and second birth, then declines from the third to the eighth birth, and rises again for births of order nine or higher. This pattern may be attributed to the greater risk of low birthweight and other physiological problems of low and higher order births. Child mortality shows a different pattern by birth order, first rising and then falling. Nutritional and economic factors may explain the higher child mortality of births of order three to eight. The surprising drop in mortality at orders nine or more may be due to sampling error, as the number of cases under consideration is small. However, the explanation of this pattern, especially for child mortality, is not very clear.
The length of the interval since the previous birth influences the probability of survival. There is a strong inverse relationship between the interval and mortality, as shown in figure 4. The rates are higher for births following short intervals than for those following long intervals. The relationship is evident for both infant and child mortality.
3.3 DIFFERENTIALS BY REGION AND BY SOCIO-ECONOMIC CHARACTERISTICS
Table 6 presents mortality rates by region of residence and by socio-economic characteristics of the BFS respondents. Chittagong Division shows the lowest infant mortality and highest child mortality, Kil.ulna Division shows the highest
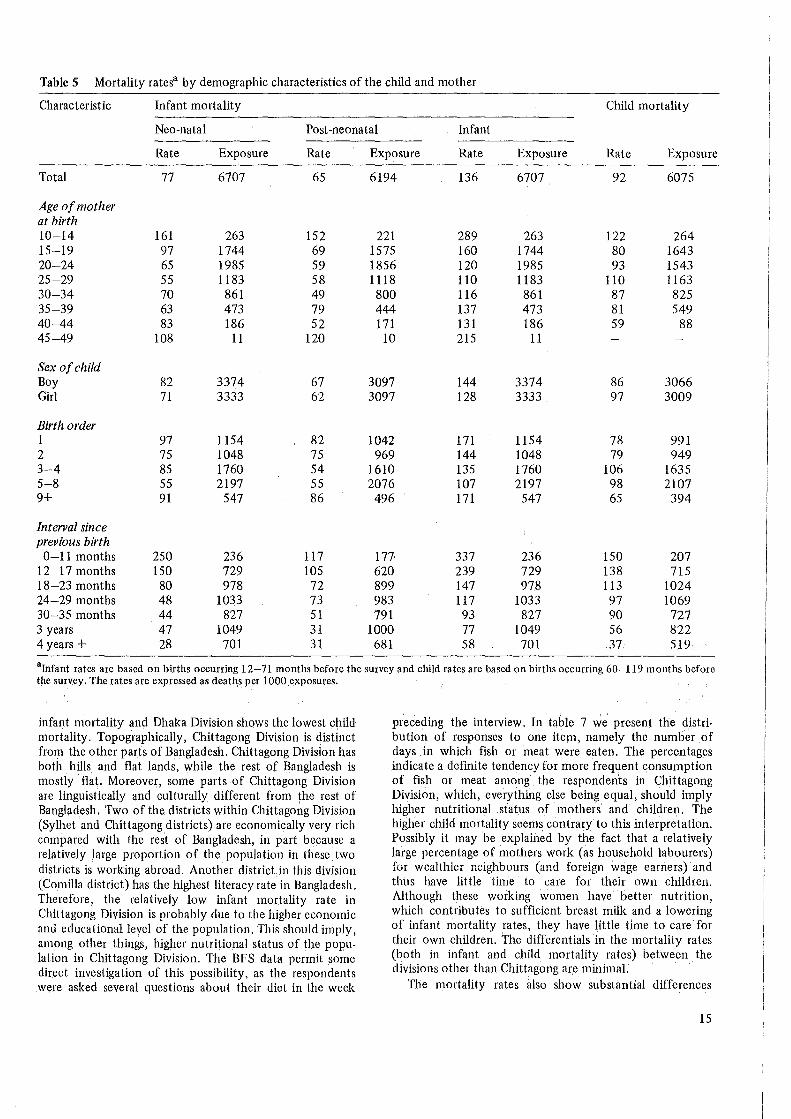
Table 5 Mortality ratesa by demographic characteristics of the child and mother
Characteristic Infant mortality Child mortality
Neo-natal Post-neonatal Infant
Rate Exposure Rate Exposure Rate Exposure Rate Exposure
Total 77 6707 65 6194 136 6707 92 6075
Age of mother at birth 10-14 161 263 152 221 289 263 122 264 15-19 97 1744 69 1575 160 1744 80 1643 20-24 65 1985 59 1856 120 1985 93 1543 25-29 55 1183 58 1118 110 1183 110 1163 30-34 70 861 49 800 116 861 87 825 35-39 63 473 79 444 137 473 81 549 40-44 83 186 52 171 131 186 59 88 45-49 108 11 120 10 215 11
Sex of child Boy 82 3374 67 3097 144 3374 86 3066 Girl 71 3333 62 3097 128 3333 97 3009
Birth order 1 97 1154 82 1042 171 1154 78 991 2 75 1048 75 969 144 1048 79 949 3-4 85 1760 54 1610 135 1760 106 1635 5-8 55 2197 55 2076 107 2197 98 2107 9+ 91 547 86 496 171 547 65 394
Interval since previous birth 0-11 months 250 236 117 177- 337 236 150 207
12-1 7 months 150 729 105 620 239 729 138 715 18-23 months 80 978 72 899 147 978 113 1024 24-29 months 48 1033 73 983 117 1033 97 1069 30-35 months 44 827 51 791 93 827 90 727 3 years 47 1049 31 1000 77 1049 56 822 4 years+ 28 701 31 681 58 701 37 519
alnfant rates are based on births occurring 12-71 months before the survey and child rates are based on births occurring 60-119 months before the survey. The rates are expressed as deaths. per 1000 exposures.
infant mortality and Dhaka Division shows the lowest child mortality. Topographically, Chittagong Division is distinct from the other parts of Bangladesh. Chittagong Division has both . hills and flat lands, while the rest of Bangladesh is mostly flat. Moreover, some parts of Chittagong Division are linguistically and culturally different from the rest of Bangladesh. Two of the districts within Chittagong Division (Syll1et and Chittagong districts) are economically very rich compared with the rest of Bangladesh, in part because a relatively large proportion of the population in these two districts is working abroad. Another districtin this division (Camilla district) has the highest literacy rate in Bangladesh. Therefore, the relatively low infant mortality rate in Chittagong Division is probably due to the higher economic and educational level of the population. This should imply, among other things, higher nutritional status of the population in Chittagong Division. The BFS data permit some direct investigation of this possibility, as the respondents were asked several questions about their diet in the week
preceding the interview. In table 7 we present the distribution of responses to one item, namely the numb'er of days in which fish or meat were eaten. The percentages indicate a definite tendency for more frequent consumption of fish or meat among fue respondents in Chittagong Division, which, everything else being equal, should imply higher nutritional status of mothers and children. The higher child mortality seems contrary to this interpretation. Possibly it may be explained by the fact that a relatively large percentage of mothers work (as household labourers) for wealthier neighbours (and foreign wage earners) and thus have little time to care for their own children. Althoug11 these working women have better nutrition, which contributes to sufficient breast milk and a lowering of infant mortality rates, they have little time to care for their own children. The differentials in the mortality rates (both in infant and child mortality rates) between the divisions other than Chittagong ar.e minimal.
The mortality rates also show substantial differences
15

1000 Q(x)
220
210
200
190
180
170
160
150
140
130
120
110
100
90
80
70
60
50
40
30
--- Neo-natal mortality
- · -·-· Post-neonatal mortality
-------Infant mortality
t\ I I I I I \ I I I 1 I I I I I \ I I \I I V I I
' ' ' I I
\ ' \ I \ I \ I \ I \ I
\ : \ I
\ ' \..--- I
\ / ' // ' / ' / \ / \ I
\ I \ I
\ I \ /
\ I \ I
\ I \ I
\ I \ / ' /
\ / "
I ·, ·, \ \
i I
\ I \ . . / \"
...
2 3 4 5 6 7 8 9 10 11 12 13 Birth order
Figure 3 Mortality rates by birth order of child
by place of residence: mortality in the urban areas is lower than in rural areas.
Religious differentials in mortality have been confirmed in many societies, both developed and developing. The BFS data show that Muslims have a lower mortality rate than Hindus. A majority of the Hindu population in Bangladesh are Scheduled Caste. Studies in India (where a majority of the population is Hindu) show that the mortality levels of Scheduled Caste Hindus are high relative to that of Caste Hindus. However, data from the Bangladesh Retrospective Survey of Fertility and Mortality suggest that there is no significant variation between Caste and Scheduled Caste Hindus in Bangladesh (Begum 1980).
The level of education of the mother shows a distinct influence on infant and child mortality. Mothers with schooling have lower rates of infant and child mortality. (Because there are few births to women of six or more years schooling, nothing can be said about their rates with any confidence). There is evidence from other studies that children of literate mothers enjoy better diets and better overall care (Bairagi 1980) and the data in table 7 confirm that they enjoy better diet. A similar pattern is evident for
16
births classified by the education of the mother's husband (not shown in table 6). The patterns of neo-natal and postneonatal differentials are not monotonic, but the overall infant and child mortality rates are inversely related to the husband's education. In the case of both the mother's and the father's education, the differentials are sharpest for child mortality. This is consistent with the view that factors such as nutrition and hygiene, which are related to the education and socio-economic status of the parents, are more important determinants of child than infant mortality.
The husband's occupation variable takes into account land ownership status. It shows one of the most interesting relationships with mortality. In Bangladesh only a small percentage of people have sufficient land to fulfil their family needs. The small landowners are, in some respects, the most disadvantaged group. Although individuals in this group often possess a minimal amount ofland, they are not supposed to work for others. Hence it is not surprising that those with land who depend on agriculture suffer relatively high loss of children during infancy. In the case of the landless agriculturalists, on the contrary, most of the women work for others and thus are better off than the non-

1000 q(x)
340
320 ---Neo-natal mortaHty
300 -·-·-Post-neonatal mortality
- - - - - - Infant mortality 280 - - Child mortality
260
240
220
200
180
160
140
120
100
80
60
40
20
d2 12-17 18-23 24-29 30-35 36-4 7
Birth interval in months
48+
Figure 4 Mortality rates by the length of the interval since the previous birth
working women in agricultural households possessing land. However, child mortality is higher for the landless because the working mothers have less time to care for their children than the mothers in households possessing land. The category of 'other' occupations includes professionals; skilled and unskilled workers, and those in sales and service occupations. Because some of these people are of higher socio-economic status, their mortality levels are expected to be lower than that of the agriculturalists. This is so for infant mortality but not for child mortality. The child mortality differentials show the same pattern as the differentials in diet in table 7.
3 .4 DIFFERENTIALS BY COMMUNITY CHARACTERISTICS
A total of 160 rural villages were included in the BFS community survey; this analysis is limited to births occurring in 152 villages. Table 8 presents distribution of births by selected community characteristics. Less than a quarter of the births occurred in villages within 4 miles of the thana headquarters. Only 7 per cent of the births occurred in villages more than 10 miles from a government dispensary and 16 per cent of the births occurred in villages within 3 miles of a family planning clinic. Only 11 per cent of the
births occurred in villages where there was a qualified doctor, whereas another doctor or a Dai (TBA) was available in the villages in which 60 per cent of births occurred. A recent intensive study at Teknaf (Bangladesh) by researchers at the ICCDDR,B (1980) concluded that the impact of the treatment centre is greatest around the immediate vicinity of the centre, within a distance of four miles in the case of diarrhoeal diseases.
In our analysis we use the distance of the villages from medical facilities as indicators of the accessibility of the facilities. Underlying this is the assumption that geographical distance is one determinant of the ability of rural Bangladeshis to make use of these facilities. Surely other factors enter as well, such as the cost of services, the quality of services offered, and the daily or weekly schedule of provision of services. Furthermore, the impact of the utilization of services on infant and child mortality is affected by the quality of the services: the training of personnel, the stock of pharmaceuticals. The BFS data provide no measures of these other factors which probably condition the nature of the relationship between geographical proximity of services and mortality. However, we believe that proximity is a fundamental aspect of the accessibility of health services, especially in rural Bangladesh where travel can be difficult and women are not mobile.
The BFS data contain other variables, such as the num-
17
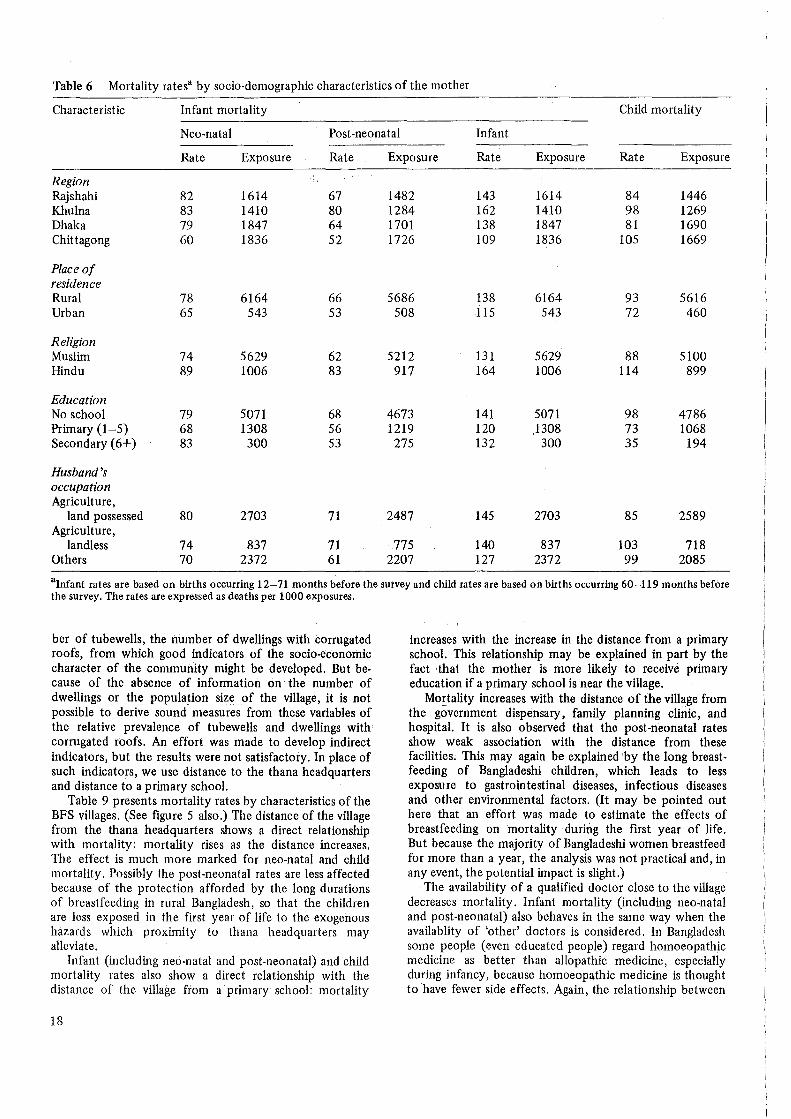
Table 6 Mortality ratesa by socio-demographic characteristics of the mother
Characteristic Infant mortality Child mortality
Neo-natal Post-neonatal Infant
Rate Exposure Rate Exposure Rate Exposure Rate Exposure
Region Rajshahi 82 1614 67 1482 143 1614 84 1446 Khulna 83 1410 80 1284 162 1410 98 1269 Dhaka 79 1847 64 1701 138 1847 81 1690 Chittagong 60 1836 52 1726 109 1836 105 1669
Place of residence Rural 78 6164 66 5686 138 6164 93 5616 Urban 65 543 53 508 115 543 72 460
Religion Muslim 74 5629 62 5212 131 5629 88 5100 Hindu 89 1006 83 917 164 1006 114 899
Education No school 79 5071 68 4673 141 5071 98 4786 Primary (1-5) 68 1308 56 1219 120 1308 73 1068 Secondary (6+) 83 300 53 275 132 300 35 194
Husband's occupation Agriculture,
land possessed 80 2703 71 2487 145 2703 85 2589 Agriculture,
landless 74 837 71 775 140 837 103 718 Others 70 2372 61 2207 127 2372 99 2085
alnfant rates are based on births occurring 12-71 months before the survey and child rates are based on births occurring 60-119 months before the survey. The rates are expressed as deaths per 1000 exposures.
ber of tubewells, the number of dwellings with corrugated roofs, from which good indicators of the socio-economic character of the community might be developed. But because of the absence of information on the number of dwellings or the population size of the village, it is not possible to derive sound measures from these variables of the relative prevalence of tubewells and dwellings with corrugated roofs. An effort was made to develop indirect indicators, but the results were not satisfactory. In place of such indicators, we use distance to the thana headquarters and distance to a primary school.
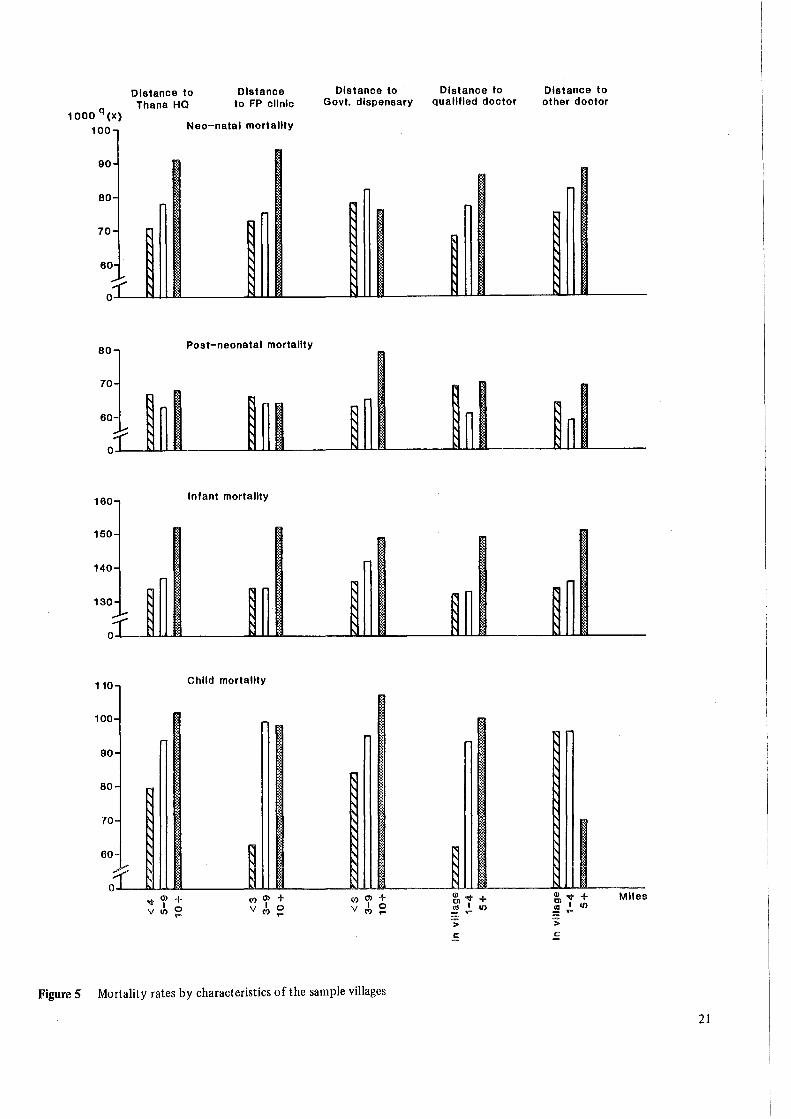
Table 9 presents mortality rates by characteristics of the BFS villages. (See figure 5 also.) The distance of the village from the thana headquarters shows a direct relationship with mortality: mortality rises as the distance increases. The effect is much more marked for neo-natal and child mortality. Possibly the post-neonatal rates are less affected because of the protection afforded by the long durations of breastfeeding in rural Bangladesh, so that the children are less exposed in the first year of life to the exogenous hazards which proximity to thana headquarters may alleviate.
Infant (including neo-natal and post-neonatal) and child mortality rates also show a direct relationship with the distance of the village from a primary school: mortality
18
increases with the increase in the distance from a primary school. This relationship may be explained in part by the fact that the mother is more likely to receive primary education if a primary school is near the village.
Mortality increases with the distance of the village from the government dispensary, family planning clinic, and hospital. It is also observed that the post-neonatal rates show weak association with the distance from these facilities. This may again be explained by the long breastfeeding of Bangladeshi children, which leads to less exposure to gastrointestinal diseases, infectious diseases and other environmental factors. (It may be pointed out here that an effort was made to estimate the effects of breastfeeding on mortality during the first year of life. But because the majority of Bangladeshi women breastfeed for more than a year, the analysis was not practical and, in any event, the potential impact is slight.)
The availability of a qualified doctor close to the village decreases mortality. Infant mortality (including neo-natal and post-neonatal) also behaves in the same way when the availablity of 'other' doctors is considered. In Bangladesh some people (even educated people) regard homoeopathic medicine as better than allopathic medicine, especially during infancy, because homoeopathic medicine is thought to have fewer side effects. Again, the relationship between
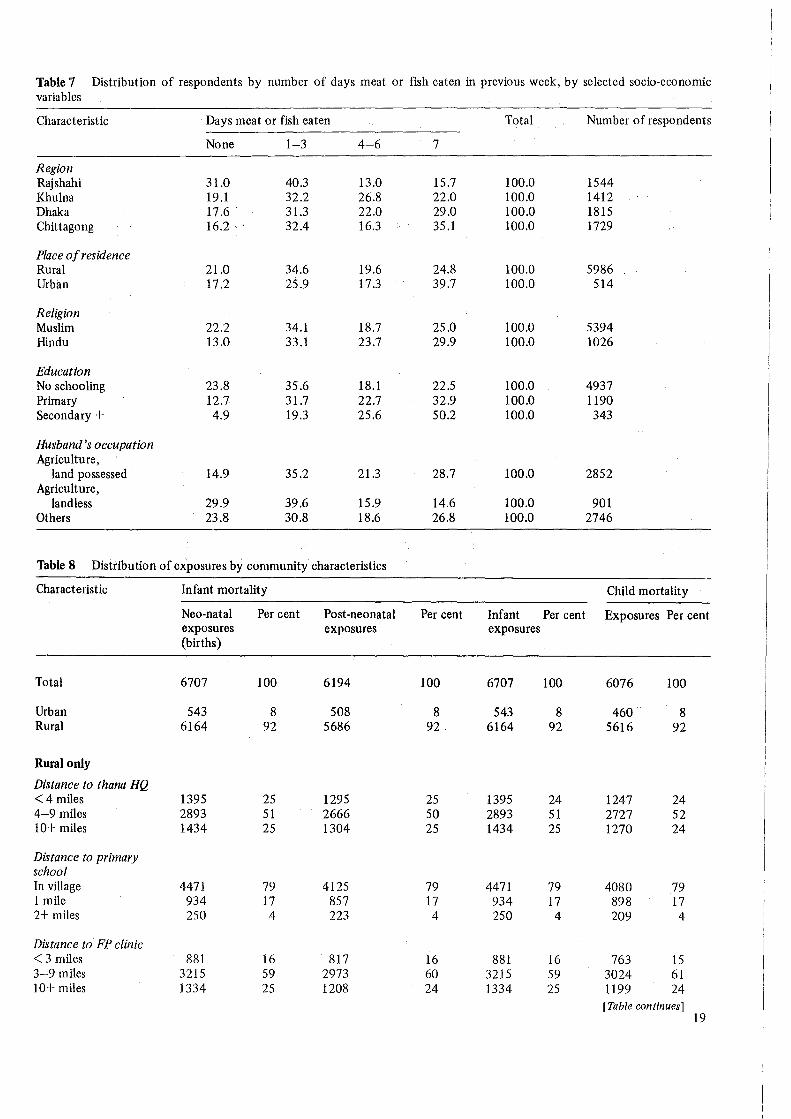
Table 7 Distribution of respondents by number of days meat or fish eaten in previous week, by selected socio-economic variables
C.haracteristic Days meat or fish eaten Total Number of respondents
None 1-3 4-6 7
Region Rajshahi 31.0 40.3 13.0 15.7 100.0 1544 Khulna 19.1 32.2 26.8 22.0 100.0 1412 Dhaka 17.6 31.3 22.0 29.0 100.0 1815 Chittagong 16.2 32.4 16.3 35.1 100.0 1729
Place of residence Rural 21.0 34.6 19.6 24.8 100.0 5986 Urban 17.2 25.9 17.3 39.7 100.0 514
Religion Muslim 22.2 34.1 18.7 25.0 100.0 5394 Hindu 13.0 33.1 23.7 29.9 100.0 1026
Education No schooling 23.8 35.6 18.1 22.5 100.0 4937 Primary 12.7 31.7 22.7 32.9 100.0 1190 Secondary+ 4.9 19.3 25.6 50.2 100.0 343
Husband's occupation Agriculture,
land possessed 14.9 35.2 21.3 28.7 100.0 2852 Agriculture,
landless 29.9 39.6 15.9 14.6 100.0 901 Others 23.8 30.8 18.6 26.8 100.0 2746
Table 8 Distribution of exposures by community characteristics
Characteristic Infant mortality Child mortality
Neo-natal Per cent Post-neonatal Per cent Infant Per cent Exposures Per cent exposures exposures exposures (births)
Total 6707 100 6194 100 6707 100 6076 100
Urban 543 8 508 8 543 8 460 8 Rural 6164 92 5686 92 6164 92 5616 92
Rural only
Distance to thana HQ <4 miles 1395 25 1295 25 1395 24 1247 24 4-9 miles 2893 51 2666 so 2893 51 2727 52 10+ miles 1434 25 1304 25 1434 25 1270 24
Distance to primary school In village 4471 79 4125 79 4471 79 4080 79 1 mile 934 17 857 17 934 17 898 17 2+ miles 250 4 223 4 250 4 209 4
Distance to FP clinic < 3 miles 881 16 817 16 881 16 763 15 3-9 miles 3215 59 2973 60 3215 59 3024 61 10+ miles 1334 25 1208 24 1334 25 1199 24
[Table continues) 19
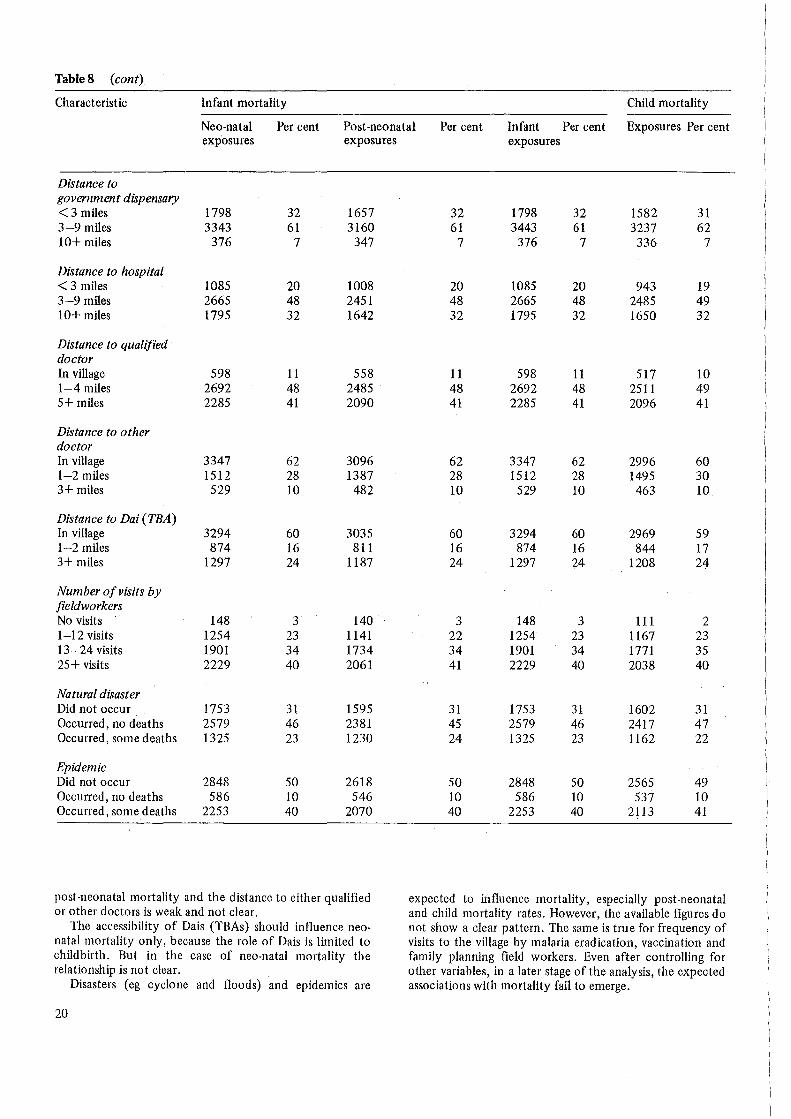
Table8 (cont)
Characteristic Infant mortality Child mortality
Neo-natal Per cent Post-neonatal Per cent Infant Per cent Exposures Per cent exp'osures exposures
Distance to government dispensary < 3 miles 1798 32 1657 3-9 miles 3343 61 3160 10+ miles 376 7 347
Distance to hospital < 3 miles 1085 20 1008 3-9 miles 2665 48 2451 10+ miles 1795 32 1642
Distance to qualified doctor In village 598 11 558 1-4 miles 2692 48 2485 5+ miles 2285 41 2090
Distance to other doctor In village 3347 62 3096 1-2 miles 1512 28 1387 3+ miles 529 10 482
Distance to Dai (TBA) In village 3294 60 3035 1-2 miles 874 16 811 3+ miles 1297 24 1187
Number of visits by fieldworkers No visits 148 3 140 1-12 visits 1254 23 1141 13-24 visits 1901 34 1734 25+ visits 2229 40 2061
Natural disaster Did not occur 1753 31 1595 Occurred, no deaths 2579 46 2381 Occurred, some deaths 1325 23 1230
Epidemic Did not occur 2848 50 2618 Occurred, no deaths 586 10 546 Occurred, some deaths 2253 40 2070
post-neonatal mortality and the distance to either qualified or other doctors is weak and not clear.
The accessibility of Dais (TBAs) should influence neonatal mortality only, because the role of Dais is limited to childbirth. But in the case of neo-natal mortality the relationship is not clear.
Disasters (eg cyclone and floods) and epidemics are
20
exposures
32 1798 32 1582 31 61 3443 61 3237 62
7 376 7 336 7
20 1085 20 943 19 48 2665 48 2485 49 32 1795 32 1650 32
11 598 11 517 10 48 2692 48 2511 49 41 2285 41 2096 41
62 3347 62 2996 60 28 1512 28 1495 30 10 529 10 463 10
60 3294 60 2969 59 16 874 16 844 17 24 1297 24 1208 24
3 148 3 111 2 22 1254 23 1167 23 34 1901 34 1771 35 41 2229 40 2038 40
31 1753 31 1602 31 45 2579 46 2417 47 24 1325 23 1162 22
50 2848 50 2565 49 10 586 10 537 10 40 2253 40 2113 41
expected to influence mortality, especially post-neonatal and child mortality rates. However, the available figures do not show a clear pattern. The same is true for frequency of visits to the village by malaria eradication, vaccination and family planning field workers. Even after controlling for other variables, in a later stage of the analysis, the expected associations with mortality fail to emerge.
1000 q(X)
100
90·
80·
70-
60 ... i.. ;r
80
70
160
150·
140-
130-
~ 0
110
100·
90·
80·
70-
60
f 0
Distance to Thana HQ
Distance to FP clinic
Nao-natal mortality
~ ~ ~
~ ~ ~
Post-neonatal mortality
Infant mortality
~
~
Child mortality
~
~
~
~ .. ~ r ~ ~
~ ~ ~ ~
~ ~
.a- Ol + (') Ol + I 0 V I 0 v II) (')
Distance to Govt. dispensary
r
r ~
~ ~ ~
~ ~
' ' ' ' ~
~ ~
r ~
~ ~
~
(') Ol + v I 0
(')
Figure 5 Mortality rates by characteristics of the sample villages
Distance to qualified doctor
~:
~
~
~ ~
~
., ~ ~. <• .. · :,
.. ·
Ql ~ + ~I II)
> .!::
Distance to other doctor
~ ~
~ ~
~ ~
Ql ~ + ~I II)
> ..!:
Miles
21

Table 9. Infant and child mortality ratesa by community characteristics: rural women
Variable and category Infant mortalityb Child mortalityc
Neo-natal Post-neonatal Infant
Distance to thana HQ < 4 miles 71 67 134 80 5-9 miles 78 63 136 94 10+ miles 91 68 152 102
Distance to FP clinic < 3 miles 73 66 134 63 3-9 miles 75 64 134 99 10+ miles 94 64 152 98
Distance to government dispensary < 3 miles 78 63 136 84 3-9 miles 82 65 142 95 10+ miles 76 79 149 107
Distance to hospital < 3 miles 72 57 124 73 3-9 miles 80 64 139 95 10+ miles 85 71 150 101
Distance to qualified doctor In village 68 69 132 62 1-4 miles 77 61 133 93 5+ miles 86 70 149 100
Distance to other doctor In village 75 64 134 96 1-2 miles 82 59 136 96 3+ miles 88 69 151 70
Distance to Dai (TBA) In village 79 62 136 92 1-2 miles 72 57 126 82 3+ miles 85 76 155 102
Distance to primary school In village 77 60 133 95 1 mile 82 84 159 85 2+ mile 105 91 187 74
Number of visits by fieldworkers No visits 56 43 97 129 1-12 visits 90 53 138 91 13-24 visits 83 71 148 78 25+ visits 76 70 140 102
Natural disaster Did not occur 90 69 153 91 Occurred, no deaths 77 66 138 85 Occurred, some deaths ' 72 58 126 107
Epidemic Did not occur 81 73 147 94 Occurred, no deaths 69 42 108 76 Occurred, some deaths 81 62 138 95
~Deaths per 1000 exposures. Calculated for births occurring 12-71 months before survey date.
0 Calculated for births occurring 60-119 months before survey date.
22
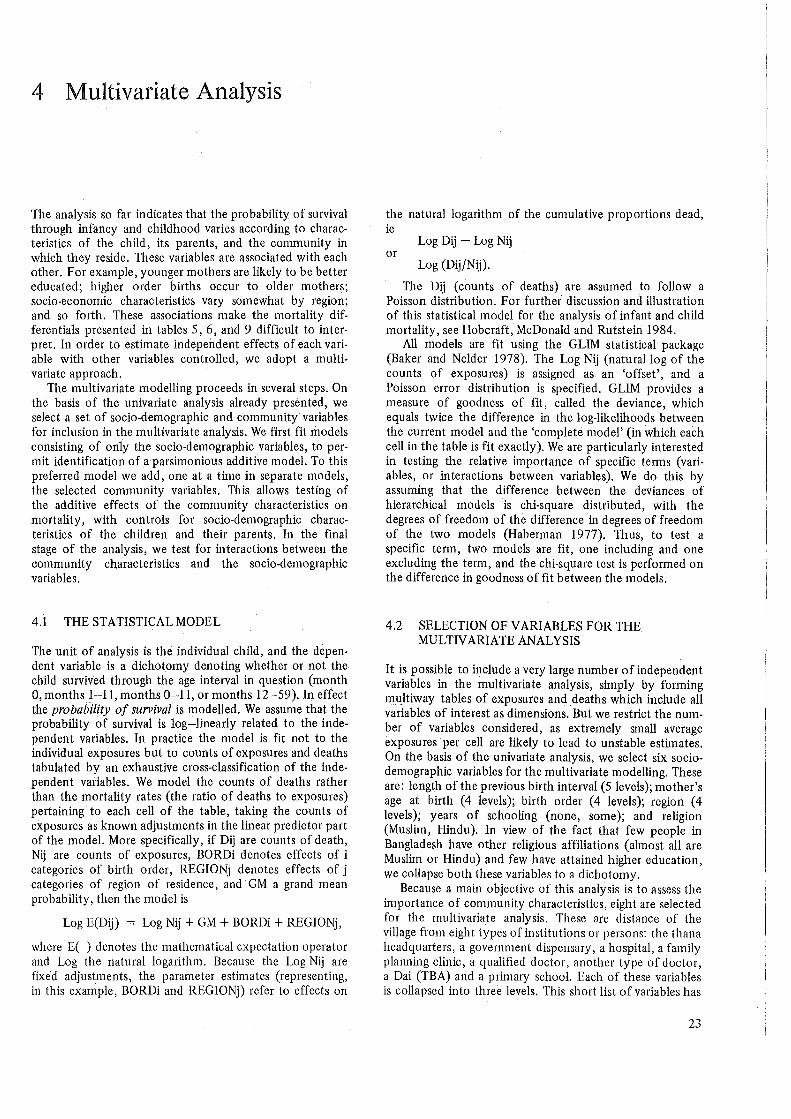
4 Multivariate Analysis
The analysis so far indicates that the probability of survival through infancy and childhood varies according to characteristics of the child, its parents, and the community in which they reside. These variables are associated with each other. For example, younger mothers are likely to be better educated; higher order births occur to older mothers; socio-economic characteristics vary somewhat by region; and so forth. These associations make the mortality differentials presented in tables 5, 6, and 9 difficult to interpret. In order to estimate independent effects of each variable with other variables controlled, we adopt a multivariate approach.
The multivariate modelling proceeds in several steps. On the basis of the univariate analysis already presented, we select a set of socio-demographic and community variables for inclusion in the multivariate analysis. We first fit models consisting of only the socio-demographic variables, to permit identification of a parsimonious additive model. To this preferred model we add, one at a time in separate models, the selected community variables. This allows testing of the additive effects of the community characteristics on mortality, with controls for socio-demographic characteristics of the children and their parents. In the final stage of the analysis, we test for interactions between the community characteristics and the socio-demographic variables.
4.1 THE STATISTICAL MODEL
The unit of analysis is the individual child, and the dependent variable is a dichotomy denoting whether or not the child survived through the age interval in question (month 0, months 1-11, months 0-11, or months 12-59). In effect the probability of survival is modelled. We assume that the probability of survival is log-linearly related to the independent variables. In practice the model is fit not to the individual exposures but to counts of exposures and deaths tabulated by an exhaustive cross-classification of the independent variables. We model the counts of deaths rather than the mortality rates (the ratio of deaths to exposures) pertaining to each cell of the table, taking the counts of exposures as known adjustments in the linear predictor part of the model. More specifically, if Dij are counts of death, Nij are counts of exposures, BORDi denotes effects of i categories of birth order, REGIONj denotes effects of j categories of region of residence, and GM a grand mean probability, then the model is
Log E(Dij) = Log Nij +GM+ BORDi + REGIONj,
where E( ) denotes the mathematical expectation operator and Log the natural logarithm. Because the Log Nij are fixed adjustments, the parameter estimates (representing, in this example, BORDi and REGIONj) refer to effects on
the natural logarithm of the cumulative proportions dead, ie
Log Dij - Log Nij or
Log (Dij/Nij).
The Dij (counts of deaths) are assumed to follow a Poisson distribution. For further discussion and illustration of this statistical model for the analysis of infant and child mortality, see Hobcraft, McDonald and Rutstein 1984.
All models are fit using the GLIM statistical package (Baker and Nelder 1978). The Log Nij (natural log of the counts of exposures) is assigned as an 'offset', and a Poisson error distribution is specified. GLIM provides a measure of goodness of fit, called the deviance, which equals twice the difference in the log-likelihoods between the current model and the 'complete model' (in which each cell in the table is fit exactly). We are particularly interested in testing the relative importance of specific terms (variables, or interactions between variables). We do this by assuming that the difference between the deviances of hierarchical models is chi-square distributed, with the degrees of freedom of the difference in degrees of freedom of the two models (Haberman 1977). Thus, to test a specific term, two models are fit, one including and one excluding the term, and the chi-square test is performed on the difference in goodness of fit between the models.
4.2 SELECTION OF VARIABLES FOR THE MULTN ARIATE ANALYSIS
It is possible to include a very large number of independent variables in the multivariate analysis, simply by forming multiway tables of exposures and deaths which include all variables of interest as dimensions. But we restrict the number of variables considered, as extremely small average exposures ·per cell are likely to lead to unstable estimates. On the basis of the univariate analysis, we select six sociodemographic variables for the multivariate modelling. These are: length of the previous birth interval (5 levels); mother's age at birth (4 levels); birth order (4 levels); region (4 levels); years of schooling (none, some); and religion (Muslim, Hindu). In view of the fact that few people in Bangladesh have other religious affiliations (almost all are Muslim or Hindu) and few have attained higher education, we collapse both these variables to a dichotomy.
Because a main objective of this analysis is to assess the in1portance of community characteristics, eight are selected for the multivariate analysis. These are distance of the village from eight types of institutions or persons: the thana headquarters, a government dispensary, a hospital, a family planning clinic, a qualified doctor, another type of doctor, a Dai (TBA) and a primary school. Each of these variables is collapsed into three levels. This short list of variables has
23

Table 10 P-values of chi-squared statistics for selected variables in models of infant and child mortality
Variable
Previous birth interval Mother's age Birth order Region Education Religion
Infant mortality
Neo-natal
0.000 0.036 0.007 0.060 0.223 0.265
been selected on the basis of the univariate analysis. Several other variables, such as the occurrence of epidemics and disasters, visits by fieldworkers, and number of tubewells, were considered in exploratory analysis but then omitted from the final analysis.
4.3 THE SOCIO-DEMOGRAPHIC VARIABLES
The first stage of the multivariate analysis consists of fitting models containing socio-demographic variables only. The objective is to assess the relative importance of each of the variables in this set, and to identify a basic model of control variables for the analysis of the community variables. In table 10 the statistical tests upon which the selection of a final model is based are presented. The P-values of the chisquared statistics indicate that the effect of length of the previous birth interval is the strongest variable and the effect· of the mother's age is the weakest variable among the six examined. Thus, the mother's age is excluded from the final model because of its relatively weaker effect. In the univariate analysis the mother's age shows some consistent patterns of effects on mortality, but when other variables are controlled there emerges no significant influence on mortality apart from neo-natal mortality. The table also indicates the existence of effects of the previous birthjnterval, birth order, region, education and religion, and hence these variables are retained for the next stage of modelling.
As we have mentioned, our first objective is to model the demographic and socio-economic determinants of infant and child mortality. To examine the effect of each of the socio-demographic variables, we present in table 11 indicators of the level of statistical significance and the adjusted mortality rates for the socio-demographic characteristics. It is ·interesting to observe here that the adjusted rates for each of the socio-demographic variables are similar to the observed rates. The length of the previous birth interval is significant at a 0.01 level and is inversely related to the probability of survival. The birth order also has a significant effect at all levels of mortality, but as the child ages the strength of the effect declines. The regional differentials are also similar to those observed in the univariate analysis. Education has a substantial effect on child mortality, with very little effect during the first year of life. The same applies to the effect of religion. In the case of both religon and education, interpretation is complicated by the small percentage of the population which is Hindu and which is educated. The figures in table 11 make clear that each of the selected socio-demographic variables is
24
Child mortality
Post-neonatal Infant
0.000 0.000 0.000 0.703 0.579 0.870 0.012 0.023 0.196 0.061 0.006 0.076 0.148 0.074 0.001 0.127 0.069 0.005
associated with the probability of survival through the first five years of life.
4.4 COMMUNITY VARIABLES
The reduced five-variable model constitutes the set of sociodemographic variables with which we compare the measures of the accessibility of health, MCH-FP and other community facilities. We consider the impact of the distance of each of the eight selected community variables, controlling for the socio-demographic variables. Table 12 shows the P-values for each of the community variables. Distance to hospital and distance to qualified doctor are marginally significant only for child mortality. But the distance to a family planning clinic is significant for neo-natal, infant and child mortality. Similarly, distance to a primary school is also significant for post-neonatal and infant mortality. It was originally expected that the other variables, especially distance to thana headquarters and distance to a dispensary, would show significant effects, but no such effects emerge.
We now turn to consider the patterns of the significant effects. However, we present the patterns of mortality according to all the community variables, including the non-significant ones. These are shown in tables 13 and 14. Table 13 shows the exponentiated parameter estimates, which represent the ratio of the mortality rate of each category to the mortality rate of the first category of the variable. Table 14 shows two adjusted rates for each vari· able. The adjusted rates (a) are adjusted with the five sociodemographic variables set at their mean values, and the adjusted rates (b) are mortality rates for children with length of the previous birth interval of 24-35 months, birth order of 5-8, Rajshahi region, 'none' years of schooling of the mother and 'Muslim' religion of the mother.
As mentioned earlier, significant effects of the distance to thana headquarters and the distance to a government dispensary are expected. The patterns shown in tables 13 and 14 conform to these expectations. But as these effects are not statistically significant, and as the patterns are not very sharp, it is not possible to reach any definite conclusion about these variables. The estimated lack of effects may be because of the non-existence of the effects or because of small sample size. The distance to hospital is significant only for child mortality, and the pattern of effects (tables 13 and 14) shows a strong association with child mortality: as the distance increases, so does child mortality. It is plausible that in Bangladeshi rural areas a hospital can have a noticeable impact, and that the impact is greater for child mortality. It is natural for the parents to

Table 11 Unadjusted and adjusted mortality rates by socio-demographic characteristics
Variable and category Infant mortalitya Child mortalityb
Neo-natal Post-neonatal Infant
Observed Adjustedc Observed Adjustedc Observed Adjustedc Observed Adjustedc
Previous birth interval First child 103 113 73 68 176 170 78 94 < 18 185 221 86 118 271 310 140 147 18-23 86 103 65 80 150 174 112 116 24-35 47 57 64 77 112 129 96 97 36+ 37 44 29 33 66 75 50 52
Significance * * * *
Birth order 1-2 90 87 73 83 163 163 79 84 3-4 90 98 48 54 138 144 106 105 5-8 55 60 52 56 106 112 98 97 9+ 99 87 80 80 179 159 67 65
Significance * t * :j:
Region Rajshahi 83 81 65 69 148 144 82 81 Khulna 93 94 73 81 166 167 94 94 Dhaka 82 84 56 61 138 140 84 85 Chittagong 62 64 49 54 110 115 107 109
Significance :j: :j: * :j:
Education None 80 82 61 68 141 144 98 100 Some 77 71 55 56 131 124 66 66
Significance :j: *
Religion Muslim 77 78 57 63 134 136 87 87 Hindu 93 88 76 78 169 161 118 123
Significance :j: *
aBased on births occurring 12-71 months before survey date. bBased on births occurring 60-119 months before survey date. cObtained by fitting a log-linear model. See text. Each set of adjusted rates is obtained from a model containing the remaining variables in the same column. *Denotes significant at 0.01 level. tDenotes significant at 0.05 level. :j:Denotes significant at 0.10 level.
Table 12 P-values of chi-squared statistics for community variables in models of infant and child mortality
Variable
Distance to thana HQ Distance to dispensary Distance to hospital Distance to FP clinic Distance to qualified doctor Distance to other doctor Distance to Dai (TBA) Distance to primary school
Infant mortality
Neo-natal
0.114 0.847 0.410 0,017 0.444 0.414 0.803 0.294
Post-natal Infant
0.487 0.152 0.235 0.438 0.283 0.150 0.600 0.034 0.482 0.411 0.759 0.600 0.271 0.354 0.013 0.019
Child mortality
0.292 0.540 0.072 0.007 0.067 0.248 0.527 0.360
25
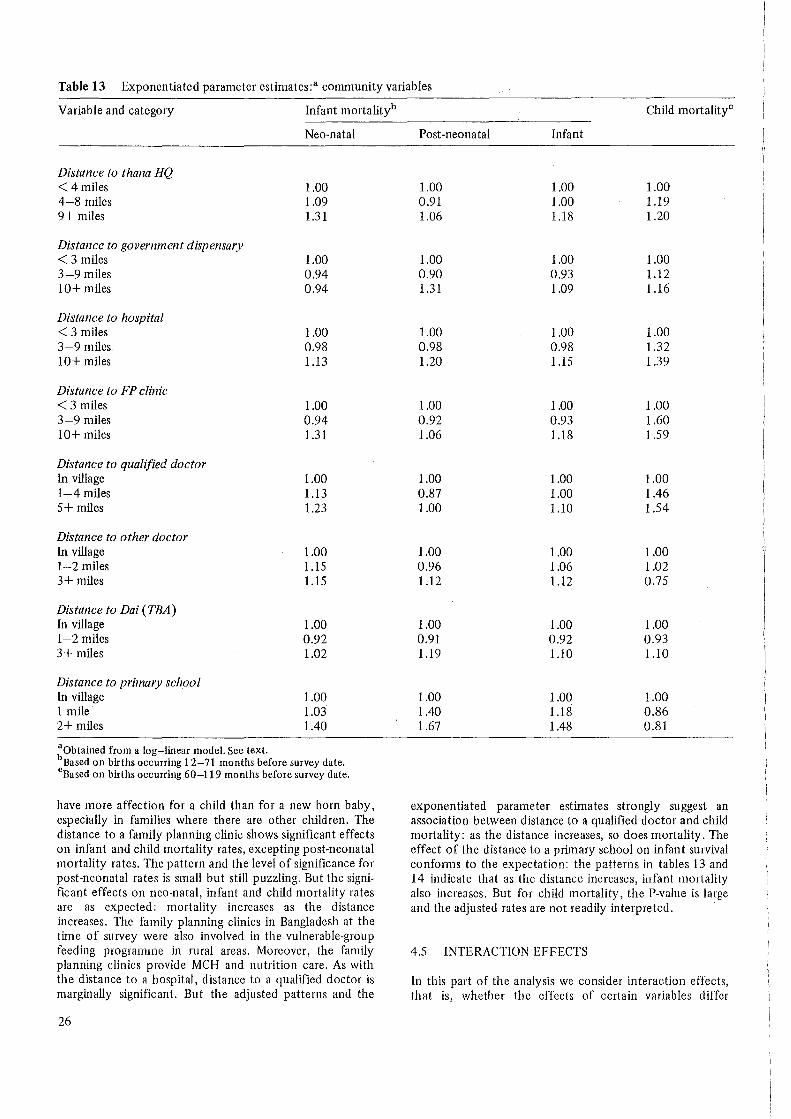
Table 13 Exponentiated parameter estimates:a community variables
Variable and category Infant mortalityb
Neo-natal
Distance to thana HQ < 4 miles 1.00 4-8 miles 1.09 9+ miles 1.31
Distance to government dispensary < 3 miles 1.00 3-9 miles 0.94 10+ miles 0.94
Distance to hospital < 3 miles 1.00 3-9 miles 0.98 10+ miles 1.13
Distance to FP clinic < 3 miles 1.00 3-9 miles 0.94 10+ miles 1.31
Distance to qualified doctor In village 1.00 1-4 miles 1.13 5+ miles 1.23
Distance to other doctor In village 1.00 1-2 miles 1.15 3+ miles 1.15
Distance to Dai (TBA) In village 1.00 1-2 miles 0.92 3+ miles 1.02
Distance to primary school In village 1.00 1 mile 1.03 2+ miles 1.40
aObtained from a log-linear model. See text. bBased on births occurring 12-71 months before survey date. cBased on births occurring 60-119 months before survey date.
have more affection for a child than for a new born baby, especially in families where there are other children. The distance to a family planning clinic shows significant effects on infant and child mortality rates, excepting post-neonatal mortality rates. The pattern and the level of significance for post-neonatal rates is small but still puzzling. But the significant effects on neo-natal, infant and child mortality rates are as expected: mortality increases as the distance increases. The family planning clinics in Bangladesh at the time of survey were also involved in the vulnerable-group feeding programme in rural areas. Moreover, the family planning clinics provide MCH and nutrition care. As with the distance to a hospital, distance to a qualified doctor is marginally significant. But the adjusted patterns and the
26
Child mortalityc
Post-neonatal Infant
1.00 1.00 1.00 0.91 1.00 1.19 1.06 1.18 1.20
1.00 1.00 1.00 0.90 0.93 1.12 1.31 1.09 1.16
1.00 1.00 1.00 0.98 0.98 1.32 1.20 1.15 1.39
1.00 1.00 1.00 0.92 0.93 1.60 1.06 1.18 1.59
1.00 1.00 1.00 0.87 1.00 1.46 1.00 1.10 1.54
1.00 1.00 1.00 0.96 1.06 1.02 1.12 1.12 0.75
1.00 1.00 1.00 0.91 0.92 0.93 1.19 1.10 1.10
1.00 1.00 1.00 1.40 1.18 0.86 1.67 1.48 0.81
exponentiated parameter estimates strongly suggest an association between distance to a qualified doctor and child. mortality: as the distance increases, so does mortality. The effect of the distance to a primary school on infant survival confonm to the expectation: the patterns in tables 13 and 14 indicate that as the distance increases, infant mortality also increases. But for child mortality, the P-value is large and the adjusted rates are not readily interpreted.
4.5 INTERACTION EFFECTS
In this part of the analysis we consider interaction effects, that is, whether the effects of certain variables differ

Table 14 Adjusteda infant and child mortality ratesb by community characteristics
Variable and category Infant mortality0 Child mortalityd
Neo-natal Post-neonatal Infant
Adjustede Adjustedf Adjustede Adjustedf Adjustede Adjustedf Adjustede Adjustedf
Distance to thana HQ <4 miles 72 33 67 68 134 93 81 75 4-8 miles 78 36 61 61 135 93 96 89 9+ miles 94 43 72 72 158 109 97 90
Distance to government dispensary <3 miles 84 39 68 68 147 102 85 81 3-9 miles 79 37 62 62 136 94 95 90 10+ miles 79 37 89 89 160 111 98 93
Distance to hospital <3 miles 78 36 61 57 135 90 73 66 3-9 miles 76 35 60 56 132 88 96 87 10+ miles 88 41 74 68 155 104 101 91
Distance to FP clinic < 3 miles 77 35 67 60 139 92 63 55 3-9 miles 73 33 61 56 130 85 100 89 10+ miles 102 47 70 64 164 108 100 88
Distance to qualified doctor In village 69 32 70 68 135 92 65 62 1-4miles 78 36 61 59 135 92 94 89 5+ miles 85 39 70 68 149 102 99 94
Distance to other doctor In village 75 35 63 60 133 91 95 84 1-2 miles 85 40 60 58. 141 96 98 86 3+ miles 85 40 71 68 149 102 72 63
Distance to Dai (TBA) In village 80 38 63 63 137 97 91 85 1-2 miles 74 35 57 57 127 90 85 79 3+ miles 82 39 75 75 150 106 100 93
Distance to primary school In village 78 37 61 62 134 96 96 88 1 mile 80 38 85 87 158 114 82 75 2+ miles 109 52 101 104 198 142 77 71
a Adjusted by fitting a log-linear model, assuming a Poisson error distribution. Each set of adjusted rates is obtained from a separate estimation. The control variables are as follows: length of the previous birth interval (5 levels), birth order (4 levels), region (4 levels), years of schooling (none, some) and religion (Muslim, Hindu). b All rates pertain to rural women only. :Calculated for births occurring 12-71 months before the survey data.
Calculated for births occurring 60-119 months before the survey data. 0 The fitted rates are calculated setting all other variables at their mean values. fThe fitted rates are calculated setting the values of the control variables as foiiows: iength of the previous birth interval, 24-35 months; birth order, 5-8; region, Rajshahi; years of schooling, none; and religion, Muslim.
depending on the level of other variables. It should be exposures per cell often seem the explanation for confus-stressed that although the size of the BFS sample is suffi- ing patterns of effects. We shall consider any rate based on cient for thorough analysis of the determinants of fertility, a cell size of less than 150 exposures as untrustworthy. the sample size is small for the analysis of mortality, be- Despite the problem caused by small sample sizes, the inter-cause it is a rare event. The problem is especially severe for action effects prove to be very interesting, especially where examining interaction effects, where small numbers of community variables which do not show significant direct
27
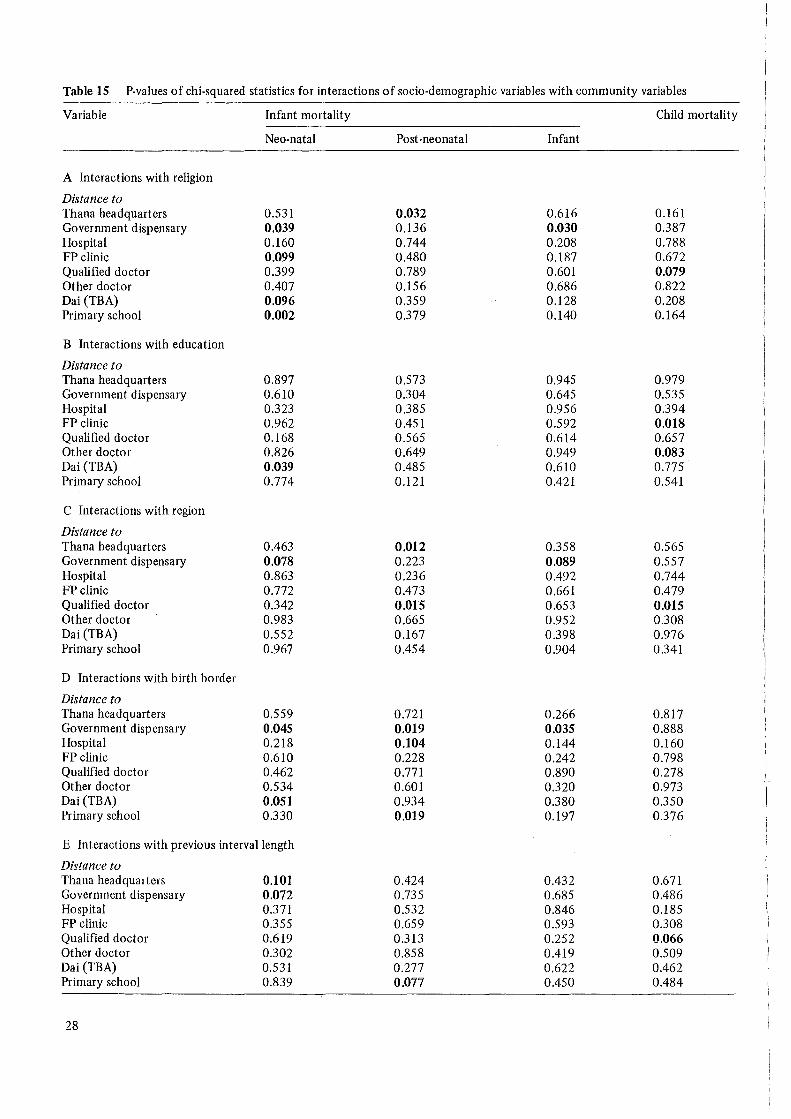
Table 15 P-values of chi-squared statistics for interactions of socio-demographic variables with community variables
Variable Infant mortality Child mortality
Neo-natal Post-neonatal Infant
A Interactions with religion
Distance to Thana headquarters 0.531 0.032 0.616 0.161 Government dispensary 0.039 0.136 0.030 0.387 Hospital 0.160 0.744 0.208 0.788 FP clinic 0.099 0.480 0.187 0.672 Qualified doctor 0.399 0.789 0.601 0.079 Other doctor 0.407 0.156 0.686 0.822 Dai (TBA) 0.096 0.359 0.128 0.208 Primary school 0.002 0.379 0.140 0.164
B Interactions with education
Distance to Thana headquarters 0.897 0.573 0.945 0.979 Government dispensary 0.610 0.304 0.645 0.535 Hospital 0.323 0.385 0.956 0.394 FP clinic 0.962 0.451 0.592 O.ot8 Qualified doctor 0.168 0.565 0.614 0.657 Other doctor 0.826 0.649 0.949 0.083 Dai (TBA) 0.039 0.485 0.610 0.775 Primary school 0.774 0.121 0.421 0.541
C Interactions with region
Distance to Thana headquarters 0.463 0.012 0.358 0.565 Government dispensary 0.078 0.223 0.089 0.557 Hospital 0.863 0.236 0.492 0.744 FP clinic 0.772 0.473 0.661 0.479 Qualified doctor 0.342 O.o15 0.653 O.ot5 Other doctor 0.983 0.665 0.952 0.308 Dai (TBA) 0.552 0.167 0.398 0.976 Primary school 0.967 0.454 0.904 0.341
D Interactions with birth border
Distance to Thana headquarters 0.559 0.721 0.266 0.817 Government dispensary 0.045 0.019 0.035 0.888 Hospital 0.218 0.104 0.144 0.160 FP clinic 0.610 0.228 0.242 0.798 Qualified doctor 0.462 0.771 0.890 0.278 Other doctor 0.534 0.601 0.320 0.973 Dai (TBA) 0.051 0.934 0.380 0.350 Primary school 0.330 0.019 0.197 0.376
E Interactions with previous interval length
Distance to Thana headquarters 0.101 0.424 0.432 0.671 Government dispensary 0.072 0.735 0.685 0.486 Hospital 0.371 0.532 0.846 0.185 FP clinic 0.355 0.659 0.593 0.308 Qualified doctor 0.619 0.313 0.252 0.066 Other doctor 0.302 0.858 0.419 0.509 Dai (TBA) 0.531 0.277 0.622 0.462 Primary school 0.839 0.077 0.450 0.484
28

Table 16 Mortality rates: interactions between religion and community characteristics
Variable and Adjusted rates Number of exposures category
Muslim Hindu Muslim Hindu
Government dispensary Neo-natal rates < 3 miles 87 56 1587 167 3-9 miles 77 94 2726 677 10+ miles 72 (269) 355 14
FP clinic Neo-natal rates < 3 miles 80 (43) 787 87 3-9 miles 71 85 2517 654 10+ miles 96 (176) 1214 82
Government dispensary Infant rates < 3 miles 147 139 1587 167 3-9 miles 132 161 2726 677 10+ miles 143 (522) 355 14
effects on mortality show effects in interaction with other variables. We examine all possible interactions between the selected eight community variables and the five sociodemographic variables. Table 15 shows the P-values for all these interactions. In the discussion we concentrate on the significant (at the 0 .10 level) interaction effects.
First of all we consider interactions between community variables and religion (panel A of table 15). Here we are testing whether community effects differ for Muslims or Hindus. It was our expectation that, because the Hindus are a minority population, they make optimum use of the free services available to both Muslims and Hindus. In this circumstance, the community effects should be greater for Hindus. In the case of neo-natal mortality, we observe interaction effects between religion and distance to a government dispensary, a family planning clinic, a Dai and a primary school. For post-neonatal mortality, religion interacts with distance to the thana headquarters, for infant mortality with distance to a government dispensary, and for child mortality with distance to a qualified doctor. The pattern of adjusted child mortality rates for the interaction between qualified doctor and religion is erratic and does not show any consistent pattern. But the remaining significant interaction effects with religion are mostly consistent with the expectations, as evident in the adjusted mortality rates shown in table 16. As Hindus comprise about 13 per cent of the total population, any conclusion about them must be cautious. However, the consistent pattern observed in the adjusted mortality rates for the interactions with community variables, especially for neo-natal rates, suggests that the community effects are greater for Hindus than for Muslims.
Secondly, we test whether community effects differ by educational level, ie the interactions of community variables with education (panel B of table 15). There are several reasons why such interactions might exist. If accessible services reduce educational differentials in utilization of services, then the community effects should be larger for
Table 17 Mortality rates: interactions between education and community characteristics
Variable and Adjusted rates Number of category exposures
None Some None Some
Dai (TBA) Neo-natal rates In village 88 57 2554 715 1-2 miles 70 87 638 184 3+ miles 78 91 931 352
FPclinic Child rates < 3 miles 59 (82) 607 147 3-9 miles 114 57 2384 602 10+ miles 104 92 915 239
Other doctor Child rates In village 102 79 2352 607 1-2 miles 109 62 1174 261 3+ miles 88 (14) 373 91
the less educated. On the other hand, if utilization of services is greater by the more educated, community effects should be larger for the more educated. It seems unlikely that utilization is not in some way related to education of the mother. Nevertheless, no significant interactions of community variables with education emerge for postneonatal and infant mortality, but several are apparent for neo-natal and child mortality. The adjusted mortality rates for the significant interactions are presented in table 17. In the case of neo-natal mortality, a significant interaction between Dai (TBA) and education emerges and the pattern fits our latter expectation, that the effect of distance to a Dai is greater for those with some education than those with no education. The role of the Dai in Bangladesh is limited to the time of birth and shortly before, so its effect is expected to be limited to the neo-natal period. In the case of child mortality, the significant interaction with distance to a family planning clinic fits with the idea of larger community effects for the less educated because the services reduce educational differentials. The adjusted child mortality rates for the interaction between the distance to another doctor and education do not show any pattern.
Thirdly, we consider interactions between community variables and region (panel C of table 15). At this stage we are testing whether community effects differ by region. Here our expectations depend on whether services are better or more effective in some regions, and transport is worse in some regions compared to others (eg Chittagong). We observed from the chi-square tests (P-values) in table 15 that interactions of region with distance to a government dispensary are significant for neo-natal and infant mortality and with distance to qualified doctor for child mortality and post-neonatal mortality. For post-neonatal mortality the interaction with distance to thana headquarters is significant as well. Table 18 shows some of the adjusted rates for the interactions between community variables and region. These show that Chittagong Division has relatively low mortality when the village is close to the facility or personnel as compared with other Divisions. The rates also
29

Table 18 Mortality rates: interactions between region and community characteristics
Variable and category Adjusted rates
Rajshahi Khulna Dhaka
Government dispensary Neo-natal rates < 3 miles 95 89 93 3-9 miles 79 97 76 10+ miles (35) (82) 118
Thana headquarters Post-neonatal rates <4 miles 55 62 103 4-9 miles 79 78 50 10+ miles 62 133 59
Qualified doctor Post-neonatal rates In village 79 (48) (115) l-4miles 64 68 58 5+ miles 75 115 58
Government dispensary Infant rates < 3 miles 181 160 146 3-9 miles 132 171 131 10+ miles (163) (l18) 198
imply that the community effect is greater in this region than in others. This is reasonable, as Chittagong Division has worse communications because of its topography. The adjusted post-neonatal mortality rates for the interaction between distance to thana headquarters and distance to a qualified doctor show a large positive effect in Khulna, that is, as the distance increases so does mortality. But in Dhaka a large negative effect is observed for distance to thana headquarters. This may be because residents of Dhaka Division are able to take advantage of the facilities available in the capital, and also because communication is better in this division. For child mortality the interaction between distance to qualified doctor and region is difficult to interpret.
Number of exposures
Chittagong Rajshahi Khµlna Dhaka Chittagong
66 416 159 479 701 78 947 1008 788 660
(25) 0 40 185 144
59 238 315 314 390 48 781 583 736 533 60 290 195 279 527
(22) 191 85 149 129 66 512 595 669 654 52 574 413 448 627
111 416 159 479 701 130 947 1008 788 660
(100) 0 40 185 144
Fourthly, we test whether the community effects differ by birth order, or birth order effects differ by community variables (panel D of table 15). A number of considerations lead to an expectation of such interactions. Lower order births are more likely to be taken to health services, and thus community effects may be greater for lower birth orders. Higher order births, on the contrary, will be less likely to be taken to the facilities, and in addition the parents will have more children to care for, so the community effects should be less for higher order births. It may also be that children with complications are more likely to go to services, and thus the higher probability of death of first and higher order births will be dampened by proximity to services. We find four significant interactions
Table 19 Mortality rates: interactions between birth order and community characteristics
Variables and category Adjusted rates Number of exposures
1-2 3-4 5-8 9+ 1-2 3-4 5-8 9+
Government dispensary Infant rates < 3 miles 181 170 113 129 577 427 589 161 3-9 miles 151 133 123 174 1078 912 1132 281 10+ miles (270) (161) (64) (182) 111 110 119 29
Primary school Post-neonatal rates In village 74 53 58 83 1296 1026 1385 337 1 mile 157 64 52 (91) 248 245 293 68 2+ miles (186) (43) (123) (0) 72 61 70 20
Hospital Post-neonatal rates < 3 miles 102 55 36 (59) 326 233 319 88 3-9 miles 68 48 58 104 765 617 829 209 10+ miles 102 59 72 (52) 501 445 571 117
30

Table 20 Mortality rates: interactions between length of the previous birth interval and community characteristics
Variable and category Adjusted rates
<18 18-23 24-35
Thana headquarters Neo-natal rates < 4miles 208 65 46 4-9 miles 185 107 66 10+ miles 315 141 50
Qualified doctor Child rates In village (122) (14) (83) 1-4 miles 165 111 99 5+ miles 135 158 110
Primary school Post-neonatal rates In village 115 72 77 1 mile (192) (150) 73 2+ miles (61) (118) (200)
with birth order. The interactions of distance to a government dispensary with birth order is significant for neo
. natal, post-neonatal and infant mortality. Distance to a hospital and a primary school interact significantly with birth order for post-neonatal mortality and the proximity of the Dai interacts with birth order for neo-natal mortality. Some of the adjusted mortality rates for the interactions between community variables and birth order are presented in table 19. The adjusted mortality rates for the interaction between distance to government dispensary and birth order are difficult to interpret for neo-natal and post-neonatal mortality, but in the case of infant mortality the effect of government dispensary is negative for lower order births and positive for higher order births. That is, higher order births to mothers residing close to a dispensary have lower mortality. The interactions between birth order and distance to Dai for neo-natal mortality and distance to hospital and distance to primary school for post-neonatal mortality are not readily interpretable.
Finally, we turn to interactions between community variables and the length of the previous interval (panel E of table 15). In the univariate and multivariate analysis the length of the previous interval was shown to have a powerful direct effect on mortality. Now we are testing whether community effects differ by the length of previous birth interval, or put differently, the length of previous interval effects differ according to the level of community vari-
Number of exposures
36+ < 18 18-23 24-35 36+
37 190 207 353 351 53 402 406 847 746 37 215 228 371 369
(46) 68 97 156 117 52 379 393 728 555 58 308 353 629 445
36 519 628 1164 1067 25 108 103 250 263
(66) 25 29 69 63
ables. Our expectation for this interaction is that children born following short birth intervals are more likely to be taken to the health services if required, and thus community effects should be greater for these children. It is reasonable that births with complications are more likely to be taken to services, so the detrimental effect of short birth intervals should be lessened when close to services. A very few interactions of community variables with previous birth interval are significant: for neo-natal mortality, interactions with distance to the thana headquarters and a government dispensary; for post-neonatal, the interaction with distance to a primary school; and for child mortality, the interaction .with distance to a qualified doctor. Table 20 shows adjusted mortality rates for some of these interactions. The rates indicate that births following short birth intervals are more affected by the distance to services. For births following long intervals, the differential by distance to services is very minimal. In the case of neo-natal and child mortality, the effects of distance to the thana headquarters and distance to a qualified doctor, respectively, are very clear: the differentials are larger for short birth intervals than for long birth intervals. For postneonatal mortality, the interaction of distance to a primary school and length of interval is difficult to interpret because very few rates are based on an acceptable level of sample size.
31

5 Concluding Remarks
This study poses as many new questions as it provides answers. In common with much demographic research, this study is hampered by the limitations of single-round interview survey data. Other limitations include: (a) the small sample size, as mortality is a rare event, and (b) the time reference of the community variables. The measurement of community services in this study pertains to the time of survey, but the mortality rates refer to periods before the survey. Throughout our analysis we have kept in mind these limitations in our interpretation of the results.
Among the significant determinants of infant and child mortality, length of the previous interval emerges as dominant. Among rural women, the range in rates between births following an interval of less than 18 months and those following an interval of more than 36 months is 185:37 for neo-natal mortality, 86:29 for post-neonatal mortality, 271:66 for infant mortality, and 140:50 for child mortality. The results suggest that if all mothers in Bangladesh spaced their children by at least three years, infant and child mortality would be reduced by one-third or more. We stress that this significant effect on infant and child mortality in rural Bangladesh occurs with controls for birth order of the child and education and religion of the mother. The cause of this strong effect of birth spacing on mortality is not disclosed by this study. Clinical studies would seem necessary. We suggest two possible causes: (a) maternal biological depletion, because of frequent pregnancies, and (b) competition for food and parental care with the previous closely spaced child.
This study also indicates that the birth order of a child has a very strong effect on survival in the first year of life, but the effect diminishes thereafter. Education has a significant effect on mortality, but the effect is confined to child mortality. Similarly, the effect of religion on mortality increases with age of the child. Muslim children experience lower mortality than do Hindu children. The analysis also reveals that mortality in the Chittagong Division is distinct from other areas of Bangladesh, perhaps because of its geographical and economic characteristics.
In analysis of effects of the community variables, the distance to a family planning clinic and the distance to a primary school emerge as the strongest correlates of mortality. In addition, the distance to the thana headquarters, the distance to a government dispensary, the distance to a hospital, and the distance to a qualified doctor show moderate effects. Post-neonatal mortality is least influenced by these variables, with the exception of distance to a primary school.
The data do not permit investigation of the causal mechanisms underlying these observed associations. The estimated effects of the distance to health services, for example, may not be the consequence of greater utilization of such services by those women residing closer to them. Rather, the associations could result from associations of community variables and mortality with other variables
32
omitted from the analysis. However, because the family planning clinics in rural areas provide general maternal and child health care, a beneficial impact on infant and child mortality is plausible. Similarly, government dispensaries, hospitals, and qualified doctors offer medical services which, if utilized, should increase the probability of child survival. The distance to a primary school and to the thana headquarters, on the other hand, are best regarded as indicators of the relative development of the village and of its relative isolation. Interpretation of effects of these variables is not straightforward.
Some of the community variables which do not show any significar.t direct effects show interaction effects. For example, in the case of neo-natal mortality, only distance to a family planning clinic shows a significant direct effect. But when interactions with religion are considered, additional effects of distance to a family planning clinic, distance to a government dispensary, distance to a Dai, and distance to a primary school are identified. The interactions consist of stronger effects of proximity to these community amenities among the minority Hindu population. Comparison of tables 12 and 15 highlights the importance of these interaction effects.
In summary, the strongest determinants of infant and child mortality in rural Bangladesh are the length of the previous interval and the birth order of the child. Of second importance are the distance to a family planning clinic, the distance to a primary school, and the mother's education, religion, and region of residence. Variables showing more moderate effects include: distance to the thana headquarters, distance to a government dispensary, distance to a hospital, and distance to a qualified doctor. We make these rankings on the basis of the overall analysis and the effects reflected in the adjusted rates.
The available studies and figures show that the Government of Bangladesh has not yet been able to make any significant headway in reducing the very high infant and child mortality prevailing in Bangladesh. The present policy of integrating health, MCH and family planning services is definitely a step towards breaking this stagnation. However, the policy implications of this study should be taken into consideration. Birth spacing should get national priority in the information, education 'and communications (IEC) and training programmes. Furthermore, the significant effects observed for proximity to some types of health ser1ices - family planning clinics and hospitals, in particular - indicate that continued investment in the maintenance and expansion of the network of these institutions is justified, as one component of overall policy to reduce infant and child mortality. Although this study suggests some of the important determinants of mortality in rural Bangladesh, there is still much room for investigating the determinants of mortality more thoroughly. We hope this study will provide one basis for future research in this area.
References and Bibliography
Alauddin, M. (1979). Rural Development and Family Planning Behaviour in Bangladesh Villages. Doctoral dissertation, School of Public Health, University of Michigan.
Bairagi, R. (1980). Is Income the Only Constraint on Child Nutrition in Rural Bangladesh? Bulletin of the World Health Organization 58(5): 767-72.
Baker, R.J. and J.A. Nelder (1978). The GLIM System -Release 3. Oxford: Numerical Algorithms Group.
Bangladesh Bureau of Statistics (1982). Statistical Yearbook of Bangladesh 1981.
Begum, Sharifa (1980). Childhood Mortality in Bangladesh: Trends and Differentials, 1960-74. MSc dissertation, London School of Hygiene and Tropical Medicine.
Brass, W. and Hoda Rashad (1980). Exploratory Demographic Analysis of Imperfect Maternity Histories to Determine Levels and Trends of Fertility. Seminar paper, IUSSP.
Chen, C. Lincoln, Emdedul Huq and Stan D'Souza (1981). Sex Bias in the Family Allocation of Food and Health Care in Rural Bangladesh. Population and Development Review 7(1).
Cain, Mead T. (1978). The Household Life Cycle and Economic Mobility in Rural Bangladesh. Population and Development Review 4( 3 ).
Chidambaram, V.C. and T. Pullum (1981). Estimating Fertility Trends from Retrospective Birth Histories: Sensitivity to Imputation of Missing Dates. Population Studies 35(2).
Chidambaram, V.C., J. Cleland and V. Verma (1980). Some Aspects of WFS Data Quality: A Preliminary Ass()ssment. WFS Comparative Studies no 16.
Curlin, G., L. Chen and S.B. Hussain (1976). Demographic Crisis: The Impact of the Bangladesh Civil War (1971) on Births and Deaths in a Rural Area of Bangladesh.Population Studies 30(1 ).
Ferry, Benoit (1981). Breastfeeding. WFS Comparative Studies no 13.
Frenzen, Paul D. and Dennis P. Hogan (1982). The Impact of Class, Education, and Health Care on Infant Mortality in a Developing Society: The Case of Rural Thailand. Demography 19(3).
Haberman, S.J. (1977). Log-Linear Models and Frequency Tables with Small Expected Cell Counts. Amwls of Statistics 5: 1148-69.
Hobcraft, John N., John McDonald and Shea Rutstein (1984). Socio-Economic Correlates of Infant and Child Mortality. Population Studies 38(2).
ICDDR,B (1980). Utilization of a Diarrhoea Clinic in Rural Bangladesh: Influence of Distance, Age and Sex on Attendance and Diarrhoeal Mortality. Scientific Report no 37. Dhaka: ICDDR,B.
Kabir, M. (1978). Infant and Child Mortality Levels in the Nine Asian Countries - A Comparative Analysis. WFS Technical Paper no 858.
Maudood, Elahi and L.T. Ruzicka (1981). Trends and Differentials in Mortality. In Population of Bangladesh, UN ESCAP Country Monograph Series no 8.
Mosley, W. Henry (1983). Will Primary Health Care Reduce Infant and Child Mortality? Seminar paper, IUSSP.
National Academy of Science (1981 ). Estimation of Recent Trends in Fertility and Mortality in Bangladesh. NAS Report no 5. Washington.
National Institute of Population Research and Training (1981). Bangladesh Contraceptive Prevalence Survey 1979. Dhaka: NIPORT.
Nilufer R. Ahmed (1981). Family Size and Sex Preferences among Women in Rural Bangladesh. Studies in Family Planning 12( 3 ).
Palloni, Alberto (1981). Design Problems and Data Collection Strategies in Studies of Mortality Differentials: Developing Countries. Seminar paper, IUSSP.
Population Control and Family Planning Division 1978. Bangladesh Fertility Survey 1975. First Report. Dhaka.
Rosenberg, I.H. (1973). Nutrition: Food Production, Dietary Patterns and Nutritional Deficiencies. In L.C. Chen, ed. Disaster in Bangladesh. London.
Rutstein, Shea Oscar (1983). Infant and Child Mortality: Levels, Trends and Demographic Differentials. WFS Comparative Studies no 24.
Somoza, Jorge L. ( 1980). Illustrative Analysis: Infant and Child Mortality in Colombia. WFS Scientific Reports no 10.
Thompson, L.V., M. Nawab Ali and J.B. Casterline (1982). Collecting Demographic Data in Bangladesh: Evidence from Tape-Recorded Interviews. WFS Scientific Reports no 41.
33
