effects of chemical treatments on hemp fibre reinforced...
TRANSCRIPT

1
Effects of Chemical Treatments on Hemp Fibre
Reinforced Polyester Composites
By
Mohammad Mazedul Kabir
Supervised by
Assoc Prof Hao Wang
Prof Alan Kin-tak Lau
Dr Francisco Cardona
Assoc Prof Thiru Aravinthan
A dissertation submitted for the award of
DOCTOR OF PHILOSOPHY
Centre of Excellence in Engineered Fibre Composites
Faculty of Engineering and Surveying
University of Southern Queensland
Toowoomba, Queensland, Australia.
September 2012

i
Abstract
Natural fibres have recently become an attractive alternative to synthetic fibres in the
implementation in polymer composite structures. This is due to contemporary
environmental concerns such as climate change which have caused engineers to
consider renewable resources in composite structures. Inherent flaws within natural
fibres in terms of their constituent contents (hemicellulose, cellulose and lignin)
reduce the compatibility of these fibres with polymer matrices. Fibre surface
modifications using chemical treatments have the potential to improve fibre-matrix
compatibility.
In this study, the effects of chemical treatments on hemp fibres and the resulted
polyester matrix composite are discussed. The fibres were treated with alkali (0-10%
NaOH), acetyl and silane chemicals.
The structural composition and thermal decomposition of the fibres after treatments
were investigated through chemical analysis, fibre morphology analysis, FTIR
analysis, and TGA and DSC analyses. Fibre structure and morphology analysis
showed that the amount of hemicellulose and lignin constituents decreased in the
case of alkalised and acetylated fibres. Conversely, silane molecules formed
couplings on fibre surfaces and there was no changes observed in terms of
hemicellulose and lignin contents. Thermal analysis revealed that, due to the
presence of hemicellulose constituents, the untreated fibres had lower thermal
stability.

ii
The tensile properties of treated hemp fibres were measured through DMA. Treated
fibres exhibited lower strengths compared to the untreated fibres due to the removal
of hemicellulose and lignin binder from their cellulose surfaces.
Long unidirectional fibre composites and sandwich structures were tested using
tension, compression, shear, bending and impact tests. In both composite cases, 4%
NaOH treatments reduced interface bonding strength and decreased composite
properties compared to untreated samples. At higher concentrations (6-10% NaOH),
composite properties increased as a result of greater interface bonding. The opposite
results were achieved in the case of alkalised fibres that were further treated with
acetyl and silane treatments. Failure analysis of tested composites was undertaken
through OM and SEM. Micrographs showed results which were in agreement which
the properties achieved.
Treated fibres were able to effectively improve the bonding properties of composites,
even though the mechanical strength of these fibres could be decreased. Thus, the use
of chemical treatments on fibres can be justified as overall composite mechanical
properties increased when compared to untreated cases.

iii
Certification of Dissertation
I certify that the ideas, experimental work, results, analysis and conclusions reported
in this dissertation are entirely my own effort, except where otherwise
acknowledged. I also certify that the work is original and has not been previously
submitted for any award, except where otherwise acknowledged.
------------------------------------------- / /
Signature of Candidate
Endorsed:
---------------------------------------- / / ------------------------------------ / /
Signature of Supervisor/s Signature of Supervisor/s
---------------------------------------- / / ------------------------------------ / /
Signature of Supervisor/s Signature of Supervisor/s

iv
Acknowledgements
Applying oneself to pursue a PhD project is as challenging as rewarding. Throughout
this process I have gained not only a greater insight into my topic but more
importantly a greater understanding of how the efforts of many people and factors
have come together to develop and present this work. I would like to convey my
thanks and appreciation to those who have helped me reach the end of this chapter of
work.
I would like to thank my Principle Supervisor, Associate Professor Hao Wang for his
guidance and valuable suggestions, without which I would have been unable to
complete this body of research. I would further like to convey my thanks to him for
his supportive and kind nature as he continuously provided valuable advice and
direction at times when it was most required. Many thanks go to Associate
Supervisor, Professor Alan Kin-tak Lau for his continuing confidence in me
throughout my studies. I am extremely appreciative of his constant support as he
facilitated my learning through his rich academic and practical experience. His
companionship and deep knowledge supported me greatly in this study. I am
thankful and appreciative of the helpful advice given to me by Associate Supervisor,
Dr. Francisco Cardona. Discussions with him helped me better understand specific
topic areas such as thermal analysis of natural fibres. I am also thankful to Associate
Supervisor, Associate Professor Thiru Aravinthan for his valuable suggestions and
inspirations.
I greatly appreciate the helpful technical insights, suggestions and reflections I
received as a result of discussions with Dr. Md. Mainul Islam and Mr. Ali Ashraf
Khurshid. Special mention also goes to the quiet and humble Mr. Wayne Crowell for
v
his immense help through the many stages of my study, especially when it came to
experimentation. I am very thankful for the technical and administrative support I
received from Mr. Kim Larsen, Mr. Mohan Tadra, Mr. Martin Geach, Mr. Justin Xu,
Miss Sandra Cochrane and Mr. Mubarok Hossain. I cannot thank all the
postgraduate students at CEEFC enough for their suggestions, support and friendship
as we all rallied together to further our research careers.
I greatly appreciate the academic, financial and technical support provided to me by
the Faculty of Engineering and Surveying and the Centre of Excellence in
Engineered Fibre Composites (CEEFC), which made this research possible. I am also
thankful to Bangladesh Jute Research Institute (BJRI) for supporting my study.
Whilst I have thanked the many professionals involved in helping me complete my
dissertation, I would like to express my sincere appreciation to my parents, brother,
mother in-law, father in-law and brothers in-law for their unconditional and endless
support. The most important ―thank you‖ goes to my dear wife Sultana Jahan Kabir.
Thank you for your endless patience, for comforting and encouraging me during the
challenging periods of this phase of my life. Without your support I would not have
been able to put a close to this chapter of my life.
All praise and thanks is to Almighty Allah who has blessed me with understanding
and strength. His blessings towards me are innumerable as it is through Him that I
have developed a sincere thirst for knowledge. To those whom I have failed to
mention but have played a contributing part of this endeavour, thank you very much.

vi
Associated Publications
Journals
Kabir, M.M., Wang, H., Lau, K.T., Cardona, F., Aravinthan, T. (2012). ‗Mechanical
properties of chemically-treated hemp fibre reinforced sandwich composites‘.
Composites Part B: Engineering, 43(2), 159-169.
Kabir, M.M., Wang, H., Lau, K.T., Cardona, F. (2012). ‗Chemical Treatments on
Plant-based Natural Fibre Reinforced Polymer Composites: An Overview‘.
Composites Part B: Engineering, 43B(7), 2883-2892.
Kabir, M.M., Wang, H., Lau, K.T., Cardona, F., Aravinthan, T. (2012). ‗Effects of
Surface Chemical Treatments on Hemp Fibre Structures‘. Applied Surface Science,
Accepted for publication.
Kabir, M.M., Wang, H., Lau, K.T., Cardona, F., Aravinthan, T. (2012). ‗Tensile
properties of chemically treated hemp fibres as reinforment for composites‘, Journal
of Natural Fibres, Under review.
Refereed Conference Proceedings
Kabir, M.M., Wang, H., Lau, K.T., Cardona, F., Aravinthan, T. (2012).
‗Compressive properties of chemically-treated unidirectional hemp fibre reinforced
composites‘. Conference on Diversity in Composites, Composite Australia & CRC-
ACS, 15-16 March, Fairmont Resort Blue Mountains Leura, NSW, Australia, pp 1-
14.

vii
Wang, H., Kabir, M.M., Lau, K.T. (2012). ‗The effect of fibre chemical treatments
on hemp reinforced composites‘. ICCM18: The 18th International Conference on
Composite Materials, 21-26 August, Jeju International Convention Center, Jeju
Island, South Korea.
Kabir, M.M., Wang, H., Lau, K.T., Cardona, F., Aravinthan, T. (2011). ‗Effects of
natural fibre surface on composite properties: A Review‘. eddBE2011 Procedings,
Energy, Environment and Sustainability, 27-29 April, Queensland University of
Technology, Brisbane, pp 94-99.
Kabir, M.M., Wang, H., Cardona, F., Aravinthan, T. (2010). ‗Effect of chemical
treatment on the mechanical and thermal properties of hemp fibre reinforced
thermoset sandwich composites‘. Incorporating sustainable practice in mechanics of
structures and materials, 21st Australian Conference on the Mechanics of Structures
and Materials, 7-10 December, Melbourn, Australia, pp 439-444.
Kabir, M.M., Wang, H., Islam, M. (2010). ‗Mechanical and thermal properties of
untreated and chemically treated jute fibre reinforced composites‘. ICMIEE 2010:
International Conference on Mechanical, Industrial and Energy Engineering, 23-24
December, Khulna, Bangladesh.

viii
Table of Contents
Chapter 1: Introduction ............................................................................................ 1
Chapter 2: Literature Review ................................................................................... 5
2.1 Introduction ........................................................................................................ 5
2.2 Conventional fibre composites ........................................................................... 6
2.2.1 Fibre reinforcements ................................................................................... 7
2.2.2 Polymer matrices ......................................................................................... 8
2.2.3 Fibre matrix interface ................................................................................ 10
2.2.4 Composite fabrication techniques ............................................................. 11
2.2.5 Composite properties ................................................................................ 12
2.3 Natural fibres .................................................................................................... 13
2.4 Issues in natural fibre composites .................................................................... 18
2.4.1 Hydrophilicity of fibre .............................................................................. 18
2.4.2 Inconsistence fibre properties ................................................................... 20
2.4.3 Poor fibre compatibility into the matrix .................................................... 21
2.4.4 Fibre degradation at high temperature ...................................................... 21
2.5 Surface treatment of natural fibres ................................................................... 22
2.5.1 Alkaline treatment ..................................................................................... 22
2.5.2 Acetyl treatment ........................................................................................ 24
2.5.3 Silane treatment ......................................................................................... 26
2.5.4 Benzoyl treatment ..................................................................................... 28
2.5.5 Peroxide treatment .................................................................................... 29
2.5.6 Maleated coupling agents .......................................................................... 30
2.5.7 Sodium chlorite treatment ......................................................................... 32
2.5.8 Isocyanate treatment.................................................................................. 32
2.5.9 Stearic acid treatment ................................................................................ 33
2.5.10 Permanganate treatment .......................................................................... 34
2.5.11 Triazine treatment ................................................................................... 35
2.5.12 Fatty acid derivate (oleoyl chloride) treatment ....................................... 36
2.5.13 Fungal treatment...................................................................................... 36
2.6 Summary .......................................................................................................... 37
Chapter 3: Materials and Experimental Methods ................................................ 38
3.1 Introduction ...................................................................................................... 38
ix
3.2 Materials ........................................................................................................... 39
3.2.1 Hemp fibre ................................................................................................ 39
3.2.2 Polyester matrix ........................................................................................ 43
3.3 Composite manufacturing processes ................................................................ 44
3.3.1 VARTM process ....................................................................................... 44
3.3.2 Hand layup process ................................................................................... 46
3.4 Structure and microstructure analysis .............................................................. 47
3.4.1 Fourier Transform InfraRed (FTIR) spectroscopy analysis ...................... 47
3.4.2 Optical microscopy analysis ..................................................................... 49
3.4.3 Scanning Electron Microscopy (SEM) analysis ....................................... 50
3.5 Thermal property analysis ................................................................................ 51
3.5.1 Thermogravimetric Analysis (TGA) ......................................................... 51
3.5.2 Differential Scanning Calorimetry (DSC) ................................................ 52
3.6 Mechanical property testing ............................................................................. 54
3.6.1 Tensile test ................................................................................................ 54
3.6.2 Compression test ....................................................................................... 57
3.6.3 Shear test ................................................................................................... 59
3.6.4 Flexural test ............................................................................................... 59
3.6.5 Impact test ................................................................................................. 62
Chapter 4: Effects of Chemical Treatments on Hemp Fibre Structure .............. 64
4.1 Introduction ...................................................................................................... 64
4.2 Result and discussion ....................................................................................... 64
4.2.1 Chemical analysis...................................................................................... 64
4.2.2 Fibre morphology analysis ........................................................................ 66
4.2.3 FTIR analysis ............................................................................................ 69
4.2.4 TGA analysis ............................................................................................. 74
4.2.5 DSC analysis ............................................................................................. 82
4.3 Summary .......................................................................................................... 88
Chapter 5: Chemical Treatments on Fibre Strength ............................................ 90
5.1 Introduction ...................................................................................................... 90
5. 2 Results and discussion .................................................................................... 92
5.2.1 Influences of fibre diameter on tensile properties ..................................... 92
5.2.2 Influences of chemical treatments on tensile properties ........................... 95
5.3 Summary ........................................................................................................ 106

x
Chapter 6: Chemical Treatments on Unidirectional Hemp Fibre Composites 108
6.1 Introduction .................................................................................................... 108
6.2 Result and discussion ..................................................................................... 109
6.2.1 Tensile properties of composites ............................................................. 109
6.2.2 Compressive properties of composites.................................................... 122
6.2.3 Shear properties of composites ............................................................... 135
6.2.4 Flexural properties of composites ........................................................... 146
6.2.5 Impact properties of composites ............................................................. 160
6.3 Summary ........................................................................................................ 174
Chapter 7: Chemical Treatments on Hemp Fibre Sandwich Structures ......... 176
7.1 Introduction .................................................................................................... 176
7.2 Result and discussion ..................................................................................... 177
7.2.1 Flexural properties of sandwich structures ............................................. 177
7.2.2 Shear properties of sandwich structures .................................................. 186
7.2.3 Compressive properties of sandwich structures ...................................... 191
7.3 Summary ........................................................................................................ 197
Chapter 8: Conclusion and Proposals for Future Work .................................... 199
References................................................................................................................205

xi
List of Figures
Figure 2.1: Composition of natural fibre ................................................................... 14
Figure 2.2: Structure of elementary fibre ................................................................... 15
Figure 2.3: Structural organisation of the three major constituents in the fibre cell
wall .......................................................................................................... 15
Figure 2.4: Chemical structure of (a) cellulose (b) hemicellulose and (c) lignin ...... 16
Figure 2.5: Schematic presentation of the orientation of fibre constituents that absorb
moisture ................................................................................................... 19
Figure 3.1: Hemp fibre (a) long (b) short and (c) woven fabric ................................ 39
Figure 3.2: Stages of chemical treatments on fibre .................................................... 40
Figure 3.3: Hemp fibre constituents (a) cellulose (b) hemicellulose and (c) lignin ... 41
Figure 3.4: Chemical formula of polyester matrix ..................................................... 43
Figure 3.5: VARTM process for unidirectional fibre composites (a) schematic
diagram (b) vacuum suction chamber (c) sample preparation ................ 45
Figure 3.6: Sandwich structure fabrication steps (hand layup) .................................. 46
Figure 3.7: Typical FTIR spectrum of hemp fibre ..................................................... 48
Figure 3.8: Typical OM images of (a) sing fibre surface (b) cross-sectional area of
the fibre (c) composites failure surface ................................................... 50
Figure 3.9: SEM images of (a) fibre surface (b) fibre embedded in a matrix ............ 50
Figure 3.10: Typical (a) TGA and (b) DTGA curve of hemp fibre ........................... 52
Figure 3.11: Typical DSC curve of hemp fibre.......................................................... 53
Figure 3.12: Mandrel wrapped fibre sample mounted in DMA................................. 54
Figure 3.13: Typical stress-strain curve of a single hemp fibre ................................. 55
Figure 3.14: Tensile specimens (a) matrix (b) composite (c) test setup .................... 56
Figure 3.15: Typical tensile stress-strain curve of polyester matrix .......................... 56
Figure 3.16: Compression test setup of matrix and composites ................................ 57
Figure 3.17: Compressive test setup of unidirectional fibre composites ................... 58
Figure 3.18: Typical compressive stress-strain curve of the unidirectional fibre
composite ................................................................................................ 58
Figure 3.19: V-notch shear test setup of the unidirectional fibre composite ............. 59
Figure 3.20: Flexural (three point bending) test setup ............................................... 60

xii
Figure 3.21: Typical flexural stress-strain curves of the polyester matrix and
unidirectional fibre composite ................................................................. 61
Figure 3.22: Four-point bending (shear) test setup of sandwich structure ................. 61
Figure 3.23: Charpy impact test setup ....................................................................... 62
Figure 3.24: A sample of impact test curve ............................................................... 63
Figure 4.1: SEM micrograph of hemp (a) untreated fibre (b) cellulose microfibril (c)
hemicellulose (d) lignin ........................................................................ 67
Figure 4.2: SEM micrograph of (a) alkalised (b) acetylated (c) silanised fibre surface
.............................................................................................................. 68
Figure 4.3: FTIR spectra of fibre constituents and treated fibres .............................. 71
Figure 4.4: (a) TGA (b) DTGA curves of fibre constituents and untreated fibre ...... 76
Figure 4.5: (a) TGA and (b) DTGA curves of alkalised fibres .................................. 79
Figure 4.6: (a) TGA and (b) DTGA curves of acetylated fibres ................................ 80
Figure 4.7: (a) TGA and (b) DTGA curves of silanised fibres .................................. 82
Figure 4.8: DSC curves of fibre constituents and untreated fibre .............................. 84
Figure 4.9: DSC curves of alkalised fibres ................................................................ 86
Figure 4.10: DSC curves of acetylated fibres ............................................................ 87
Figure 4.11: DSC curves of silanised fibres............................................................... 88
Figure 5.1: OM images of (a) fibre surface (b) cross-sectional area of fibre fractured
surface ..................................................................................................... 93
Figure 5.2: Tensile strength as a function of fibre diameter (cross-section) (a)
alkalised (b) acetylated fibre ................................................................... 95
Figure 5.3: Schematic diagram of fibre (a) structure (a) cross-section ...................... 97
Figure 5.4: Typical stress-strain curves of alkalised fibres ........................................ 99
Figure 5.5: Tensile properties of alkalised fibre (a) strength (b) failure strain .......... 99
Figure 5.6: Typical stress-strain curves of acetylated fibres .................................... 101
Figure 5.7: Tensile strength of alkali pre-treated acetylated fibres .......................... 101
Figure 5.8: Typical stress-strain curves of silanised fibres ...................................... 103
Figure 5.9: Tensile properties of alkali pre-treated silanised fibres (a) strength (b)
failure strain........................................................................................... 104

xiii
Figure 6.1: Typical tensile stress-strain curve of fibre composite ........................... 111
Figure 6.2: Typical tensile stress-strain curves of alkalised fibre composites ......... 111
Figure 6.3: Tensile properties of alkalised fibre composites (a) strength (b) failure
strain .................................................................................................... 113
Figure 6.4: Typical tensile stress-strain curves of acetylated fibre composites ....... 116
Figure 6.5: Tensile properties of alkali pre-treated acetylated fibre composites (a)
strength (b) modulus (α) ..................................................................... 116
Figure 6.6: Typical tensile stress-strain curves of silanised fibre composites ......... 119
Figure 6.7: Tensile properties of alkali pre-treated silanised fibre composites (a)
strength (b) failure strain ..................................................................... 119
Figure 6.8: Typical compressive stress strain curve of the fibre composite ............ 123
Figure 6.9: Typical compressive stress-strain curves for alkalised fibre composites
............................................................................................................ 125
Figure 6.10: Compressive properties of alkalised fibre composites (a) strength (b)
modulus (c) failure strain .................................................................... 126
Figure 6.11: Typical compressive stress-strain curves of acetylated fibre composites
............................................................................................................ 128
Figure 6.12: Compressive properties of alkali pre-treated acetylated fibre composites
(a) strength (b) α (c) α1 (d) failure strain............................................. 129
Figure 6.13: Typical compressive stress-strain curves of silanised fibre composites
............................................................................................................ 131
Figure 6.14: Compressive strength of alkali pre-treated silanised fibre composites 131
Figure 6.15: Microscopic images of failure surface for (a) flat-wise view (b) silanised
(c) alkalised (d) acetylated composites ............................................... 133
Figure 6.16: Typical shear stress- extension curve of fibre composites .................. 136
Figure 6.17: Typical shear failure modes of the composites ................................... 137
Figure 6.18: Shear failure modes of composites ...................................................... 138
Figure 6.19: Typical shear stress-extension curves of alkalised fibre composites .. 140
Figure 6.20: Shear properties of alkalised fibre composites (a) strength (b) extension
at break ................................................................................................ 140
Figure 6.21: Typical shear stress-extension curves of acetylated fibre composites 142
Figure 6.22: Shear properties of alkali pre-treated acetylated fibre composites (a)
strength (b) extension at break ............................................................ 142

xiv
Figure 6.24: Shear properties of alkali pre-treated silanised fibre composites (a)
strength (b) extension at break ............................................................ 144
Figure 6.24: Typical shear stress-extension curves of silanised fibre composites ... 144
Figure 6.25: Schematic diagram of flexural load distribution on the composite ..... 147
Figure 6.26: Typical flexural failure modes of tested samples ................................ 148
Figure 6.27: Typical flexural stress-strain curve of the fibre composite ................. 149
Figure 6.28: Typical flexural stress-strain curves of alkalised fibre composites ..... 151
Figure 6.29: Flexural properties of alkalised fibre composites (a) strength (b) α (c) α1
(d) failure strain .................................................................................. 152
Figure 6.30: Typical flexural stress-strain curves of acetylated fibre composites ... 154
Figure 6.31: Flexural properties of alkali pre-treated acetylated fibre composites (a)
strength (b) α (c) α1 (d) failure strain .................................................. 156
Figure 6.32: Typical flexural stress-strain curves of silanised fibre composites ..... 157
Figure 6.33: Flexural properties of alkali pre-treated silanised fibre composites (a)
strength (b) α (c) α1 ............................................................................. 158
Figure 6.34: Schematic diagram of impact damage processes ................................ 162
Figure 6.35: Typical impact force-deflection and energy-deflection curves of fibre
composites .......................................................................................... 163
Figure 6.36: Typical impact force-time and energy-time curves of fibre composites
............................................................................................................ 165
Figure 6.37: Typical impact energy-time curves of alkalised fibre composites ...... 166
Figure 6.38: Impact properties of alkalised fibre composites (a) Ea (b) Er (c) DD .. 167
Figure 6.39: Typical impact energy-time curves of acetylated fibre composites .... 168
Figure 6.40: Impact properties of alkali pre-treated acetylated fibre composites (a) Ea
(b) Er (c) DD ....................................................................................... 169
Figure 6.41: Typical impact energy-time curves of silanised fibre composites ...... 171
Figure 6.42: Impact properties of alkali pre-treated silanised fibre composites (a) Ea
(b) Er (c) DD ....................................................................................... 172
Figure 7.1: Typical flexural stress-strain curves of alkalised sandwich structures .. 178
Figure 7.2: Flexural properties of alkalised sandwich structures (a) strength (b)
modulus (c) failure strain .................................................................... 179
Figure 7.3: Flexural failure modes of (a) untreated (0% NaOH) (b) 4% NaOH (c) 6-
10% NaOH treated samples ................................................................ 180

xv
Figure 7.4: Micrographs of flexural failure surface of (a, b) untreated (c) NaOH
treated samples .................................................................................... 181
Figure 7.5: Typical flexural stress-strain curves of acetylated sandwich structures 182
Figure 7.6: Flexural failure modes of acetylated sample ......................................... 183
Figure 7.7: Flexural properties of alkali pre-treated acetylated sandwich structures
............................................................................................................ 183
Figure 7.8: Typical flexural stress-strain curves of silanised sandwich structures .. 185
Figure 7.9: Flexural failure modes of silanised sample ........................................... 185
Figure 7.10: Flexural properties of alkali pre-treated silanised sandwich structures
............................................................................................................ 185
Figure 7.11: Typical shear stress-strain curves of alkalised sandwich structures .... 186
Figure 7.12: Shear properties of alkalised sandwich structures (a) strength (b)
modulus ............................................................................................... 188
Figure 7.13: Shear failure modes of (a) 0% NaOH (b) 4% NaOH (c) 6-10% NaOH
treated samples .................................................................................... 189
Figure 7.14: Shear failure modes of acetylated sample ........................................... 189
Figure 7.15: Typical shear stress-strain curves of silanised sandwich structures .... 190
Figure 7.16: Shear properties of alkali pre-treated silanised sandwich structures ... 190
Figure 7.17: Typical compressive stress-strain curves of alkalised sandwich
structures ............................................................................................. 192
Figure 7.18: Compressive properties of alkalised sandwich structures (a) strength (b)
modulus ............................................................................................... 193
Figure 7.19: Compression failure mode of (a) 0% NaOH (b) 4% NaOH (c) 6-10%
NaOH treated samples ........................................................................ 193
Figure 7.20: Typical compressive stress-strain curves of acetylated sandwich
structures ............................................................................................. 194
Figure 7.21: Compressive failure mode of acetylated sample ................................. 194
Figure 7.22: Compressive properties of alkali pre-treated acetylated sandwich
structures ............................................................................................. 195
Figure 7.23: Typical compressive stress-strain curves of silanised sandwich
structures ............................................................................................. 196
Figure 7.24: Compressive failure mode of silanised sample ................................... 196
Figure 7.25: Compressive properties of alkali pre-treated silanised sandwich
structures ............................................................................................. 197
xvi
List of Tables
Table 2.1: Comparison of thermoset and thermoplastic matrices .............................. 10
Table 2.2: Structural constituents of natural fibres .................................................... 13
Table 2.3: Comparative properties of natural fibres with conventional manmade
fibres ........................................................................................................ 18
Table 2.4: Recent works on alkali treated fibre composites ...................................... 24
Table 4.1: Amount of fibre constituents (weight %) presents in the treated fibres ... 65
Table 4.2: Infrared transmittance peaks (frequency number, cm-1
) of fibre
constituents .............................................................................................. 70
Table 5.1: Comparison of two diameter (mm) measurement methods of treated fibres
................................................................................................................. 94
Table 5.2: Tensile properties of single fibre (considering fibre cross-section as
diameter).................................................................................................. 96
Table 6.1: Tensile properties of composites with different fibre treatments ........... 112
Table 6.2: Compressive properties of composites with different fibre treatments .. 124
Table 6.3: Shear properties of composites with different fibre treatments .............. 139
Table 6.4: Flexural properties of composites with different fibre treatments .......... 150
Table 6.5: Impact properties of composites with different fibre treatments ............ 165
Table 7.1: Flexural properties of the sandwich structures with different fibre
treatments .............................................................................................. 178
Table 7.2: Shear properties of the sandwich structure with different fibre treatments
............................................................................................................... 187
Table 7.3: Compressive properties of the sandwich structure with different fibre
treatments .............................................................................................. 192
1
Chapter 1: Introduction
There has recently been a growing interest in the use of natural fibres as
reinforcements in polymer composites. One of the main reasons for this is an
increase in environmental consciousness. The introduction of natural fibres in
composites can provide benefits to the environment as they are bio-degradable, cost
effective and naturally available (Rout, et al. 2001). Conventionally used synthetic
composite reinforcements are non-renewable resources and require substantial
amounts of energy for production which releases excessive amounts of carbon
dioxide.
Much research on natural fibres as reinforcements for thermoset and thermoplastic
composites has been conducted over the last decade. Studies indicate that natural
fibres display large variations in properties, as their structures are highly affected by
contemporary environmental factors such as climate change. These factors result in
natural fibres developing inconsistent cross-sectional areas and shapes along their
lengths, which affect the ultimate loads that can be carried by them. Natural fibres
can only stand up to certain temperature which complicates manufacturing processes.
Another major drawback when using natural fibres is that their structure absorbs
atmospheric moisture which makes the fibre hydrophilic in nature. Hydrophilic fibres
are incompatible with hydrophobic polymers (thermoset and thermoplastics).
Therefore natural fibres display poor fibre-matrix interfacial bonding which results in
poor composite mechanical properties.

2
It is, therefore, necessary to modify the fibre to improve bonding with the matrix.
Different treatments on fibres modify their structure and surfaces which lead to fibre
thermal and mechanical property improvements, thereby improving fibre bonding
with matrix and thus enhances composite properties.
Research objectives
The aim of this thesis was to achieve a greater understanding of the various
parameters that contribute to natural fibre properties, and their reinforced
composites. Hemp fibre reinforced polyester composites, in particular, were studied.
The research objectives are summarised below:
To gain an understanding of natural fibre reinforced polymer composites, and
to gain an insight into work previously done by other researchers in this area.
To investigate the influences of chemical treatments in terms of the following
fibre parameters:
- Constituent content change within structure and surface morphology
through chemical analysis, microstructure analysis, FTIR analysis
- Thermal properties through TGA and DSC analysis
- Tensile properties of fibres
- Interface bonding of hemp fibre reinforced polyester composites through
the mechanical property (tension, compression, sheer, bending and
impact testing) analysis of fibre composites.
Outline of thesis
This thesis is divided into 8 chapters.
Chapter 1 is an introduction and outlines the objectives of the study undertaken.

3
Chapter 2 entails a literature review which highlights fundamental knowledge and
the current developments of the topic that is being investigated in this dissertation.
This chapter begins by outlining the main constituents of both conventional synthetic
fibre and natural fibre composites. The structure and properties of natural fibres are
highlighted. Problems and inherent shortfalls associated with natural fibres that
contribute to reduced composite properties are then listed. Fibre modification
methods through various chemical treatments are discussed in order to improve fibre
composite properties.
Chapter 3 covers the experimental process component of the dissertation. It describes
in detail the equipment used, composite preparation and manufacturing methodology
and the characterisation methods that were utilised. The chemical treatment
processes that were applied to hemp fibres are extensively described and the
manufacturing process used to prepare composites is outline. The testing procedures
of fibre and their composites are presented.
Chapter 4 lists and explains the effects of chemical treatments on the fibre in terms of
fibre constituents, structure, morphology and thermal properties.
Chapter 5 focuses on the effects of chemical treatments on fibre strengths.
Chapter 6 characterises the effects of treatments on fibre composite properties.
Tension, compression, shear, flexure and impact properties of the composites are
presented and discussed.

4
Chapter 7 discusses the effects of chemical treatments on sandwich structures
through a mechanical properties analysis.
Chapter 8 concludes this body of research by presenting the conclusions drawn from
the study. Recommendations for future work are offered.

5
Chapter 2: Literature Review
2.1 Introduction
Increasing environmental awareness throughout the world has greatly impacted
materials engineering and design. Renewed interest in the utilisation of natural
materials addresses ecological issues such as renewability, recyclability and
environmental safety. Currently, synthetic fibres like glass, carbon and aramid are
being widely used in polymer-based composites because of their high strength and
stiffness properties (Rout, et al. 2001). However, these fibres have serious drawbacks
in terms of their biodegradability, initial processing costs, recyclability, energy
consumption, machine abrasion, health hazards, etc. (Bledzki & Gassan 1999). Most
significantly, adverse environmental impact alters the attention from synthetic fibres
to natural/renewable fibres. In recent years, the introduction of natural fibres (from
annually renewable resources) as reinforcements in the polymer matrix is receiving
great attention (Rout, et al. 2001).
Natural fibres like flax, hemp, jute, sisal etc. have been well recognised as good
potential reinforcements for engineering fibre composites. The advantageous features
of these fibres are that they are light in weight, have a high specific modulus, are
non-toxic and are easily processed (Abdelmouleh, et al. 2007; Tserki, et al. 2005).
These benchmarking properties open up the wide area of natural fibres to the
composite sector and challenge the use of synthetic fibres. The successful use of
these fibres is dependent on their well defined structural and mechanical properties.
These properties are influenced by the locality in which they originate, climate
conditions, age of the plants and the extraction methods that are used. These

6
parameters determine the characterisation factor for fibres (Bledzki & Gassan 1999;
Tserki, et al. 2005).
However, natural fibres are not a problem-free alterative and they possess certain
shortfalls in properties. Their structural constituents (cellulose, hemicellulose, lignin,
pectin and waxy substances) allow moisture absorption from the environment which
leads to poor bonding with the polymer matrix materials (Doan, Gao & Mader 2006).
Therefore, certain chemical treatments on the surface of natural fibres are needed.
These treatments are usually based on the use of reagent functional groups that are
capable of reacting with the fibre structures thus changing their composition. The
treatment is to reduce the tendency of moisture absorption of the fibres and facilitate
greater compatibility with the polymer matrix (Abdelmouleh, et al. 2007). Many
academics and industries focus on the improved compatibility of fibre and the
polymer matrix.
2.2 Conventional fibre composites
Generally, a composite is a material mixture created by a synthetic/natural assembly
of two or more physically and chemically distinct components. The first component
is a selected reinforcing agent (discontinuous phase) whilst the second is a
compatible matrix binder (continuous phase) (Bledzki & Gassan 1999). These two
components are combined to achieve specific characteristics and properties.
Different types of natural fibres, matrix and processing techniques are used for
composite fabrication.

7
2.2.1 Fibre reinforcements
Fibres are strategically placed in the matrix with specific orientations to meet
required strength and stiffness properties of the composites. The performance and
load distribution of a fibre reinforced composite depends on its reinforcing fibre
length, shape, orientation, content and composition in the matrix. The uniform load
distribution from matrix to fibre enhances the composite properties under different
loading conditions. The reinforcement orientation is capable of changing failure
mechanisms and enhancing their composite properties as desired.
Long continuous unidirectional fibre, twisted fibre (yarn), woven fabrics and short
discontinuous randomly oriented fibre are commonly used as reinforcement in
composites. Long and unidirectional fibre with 0° orientation to the applied load,
provides a continuous load transfer throughout the composite area. Optimum
performance from longitudinal fibre reinforced composites can be obtained if the
load is applied along its fibre direction. Conversely, fibre orientation perpendicular to
the loading direction (90°) possesses very low transverse stress as fibre cannot act as
a primary load carrying component. Cross play fabric, especially with 0° and 90°
fibres orientation, shows good stress distribution in a longitudinal direction (0°) but
the opposite results in a transverse direction (90°) (Ilomaki 2012).
The twisted fibre limits complete wet-out by the matrix, as fibre twisting prevents
complete penetration of liquid matrix into the fibre bundle. During loading fibre may
have less matrix support which reduces its composite mechanical properties.

8
Hybrid laminates combine different fibres and ply orientation within a matrix,
aiming to produce a part that has high strength and stiffness properties (Esfandiari
2007). Similarly, a sandwich structure consisting of two stiff skins separated by a
core material, aiming to produce a part that has high toughness values (Manalo,
Aravinthan & Karunasena 2010). The load distribution of hybrid laminate and
sandwich structures are complex as different material properties contribute to the
load transfers mechanisms throughout the composite cross-sections.
Random fibre orientation in the matrix generates a discontinuous load transfer
throughout its composites. Due to this, complex load distribution and non-uniform
stress concentration take place in the matrix which may develop matrix cracking,
debonding and failure of the composites. As a result, random fibre orientations in the
matrix exhibit lower mechanical properties of the composites than the unidirectional
fibre composites (Ilomaki 2012).
2.2.2 Polymer matrices
A matrix is a binding material that is used to hold the reinforcements (fibre). A
polymer matrix provides support to the fibre, assists the fibre in carrying load, and
usually has lower strength than the fibre. When load is applied to the composite
assembly, the matrix distributes the loads evenly among the fibres (Joseph, et al.
2003; Khalil, et al. 2001; Pickering, et al. 2007). The matrix also protects the fibres
from the environment and gives stability to the composite material.
Polymer matrix used in fibre composites are generally classified as thermosets and
thermoplastics (Hayes & Gammon 2010). Thermosets have low viscosity which

9
provides good fibre wetting. Unsaturated polyester, vinyl esters and epoxy are the
most commonly used as thermoset matrices. Catalyst is used to initiate the chemical
reaction of these matrices and is transferred from a liquid to solid state. Thermosets
undergo irreversible chemical cross-linking reactions upon heating and curing. Cured
thermosets are infusible and insoluble materials. In addition, cured matrices have
good mechanical properties, are easily processed and are resistant to environmental
degradation. Thermosets have high glass transition and decomposition temperature,
high ultimate strength and modulus (Hayes & Gammon 2010). However, cured
matrices are brittle which results in poor resistance to crack propagation.
Conversely, thermoplastics do not undergo a chemical reaction on application of
heat. Rather, they melt at an elevated temperature and pressure. Thermoplastics can
be repeatedly reshaped by heating and hardened by cooling, as their viscosity
changes under different temperatures. Polyethylene, polyamides (nylon),
polyurethane, polyetheretherketone, and polyphenylene are commonly used as
thermoplastic matrix (Ku, et al. 2011). These matrices do not require additional
curing and thus necessitate less time to produce a part. There are a number of
problems associated with incorporating fibres into thermoplastic matrices.
Thermoplastics have high viscosity and thus high temperature and pressure must be
employed for fibre wetting (Muzzy & Kays 1984). The reinforcing fibre may
experience thermal damage with the high processing temperatures. When the
material is dried, shrinkage of the fibres may take place resulting in dimensional
instability, propagation of debonding, cracks and severe deterioration of mechanical
properties. Table 2.1 outlines the differences in properties of thermoset and
thermoplastic matrices (Joseph, PV, et al. 2003).

10
Table 2.1: Comparison of thermoset and thermoplastic matrices (Joseph, PV, et al.
2003)
Advantages Disadvantages
Thermoset - Low viscosity
- Good fibre wetting
- Excellent thermal stability once
polymerised
- Chemically resistant
- Brittle
- Non-recyclable via
standard techniques
- Not post-formable
Thermoplastic - Recyclable
- Easy to repair by welding and
solvent bonding
- Post formable
- Tough
- Poor melt flow
- Need to be heated above
the melting point for
processing purposes.
2.2.3 Fibre matrix interface
The interface is a boundary region where fibre and matrix phases come in contact
with zero thickness (Khalil, et al. 2001). Matrices are connected to the fibre surface
by chemical reaction, absorption and mechanical interlocking. Chemical reaction
takes place between the fibre functional groups and the matrix monomers. The
absorption occurs between the primary forces (forms ionic and covalent bonds) and
the secondary forces (created by van der Waals forces, dipole interaction, dispersion
interaction, hydrogen bonds and acid base interactions). Mechanical interlocking
occurs when the liquid matrix is made to flow on the fibre surface. A strong interface
is required for efficient load transfer from matrix to fibre to enhance the composites
mechanical properties (Mohanty, Misra & Drzal 2005). Interface bonding strength
can be evaluated through different mechanical property analyses of the composites
such as tension, compression, shear, bending and impact tests.
11
2.2.4 Composite fabrication techniques
In principle, processing techniques of natural fibres composite are similar to those
utilised in processing of synthetic fibres composite. Depending on the length,
orientation and type of the fibre; randomly oriented (short), unidirectional (raw and
carded) and woven fabrics are used as reinforcements in thermoset and thermoplastic
matrices (Beckermann 2007).
For thermoset composites, the basic fabrication method is known as hand layup
(Mohanty, Misra & Drzal 2005). This is a manual mixing procedure between the
fibre and matrix. In this process, the uniformity of the composite in terms of
thickness, fibre-to-matrix ratio and void content throughout the sample, depend on
the workmanship. Conversely, in vacuum assisted resin transfer moulding
(VARTM), resin is pulled inside the mould under vacuum pressure and mixed with
the fibres. Under this condition, the resin impregnation quality in a composite is
much better than that fabricated by the hand layup technique and the void content
can be kept as minimal. Another method known as pultrusion, is used for both
thermosets and thermoplastics. The composite profile is produced by pulling the
reinforcement through a heated die which is then mixed with the matrix.
For the thermoplastic matrix, compression moulding (reinforcement is mixed with
the matrix and pressed with a heated plate) and injection mouldings (fibre-resin is
added as granulate to the machine and melted into fluid mass, then injected under
high pressure into the form) are used for composite fabrication (Adekunle, Akesson
& Skrifvars 2010). These processes involve high temperature (over 200°C) and
pressure (5 MPa) for complete mixing between the fibre and matrix.
12
2.2.5 Composite properties
Composites are macroscopically inhomogeneous as the reinforcing fibres and matrix
have different material properties. To characterise the composites as a combined
material, require further property analysis to ensure that the component satisfies
product requirements and material limitations.
Composites have different mechanical properties under different loading conditions.
Under the tensile loading, the matrix plays a minor role, whilst fibre can sustain
higher tensile load parallel to the fibre direction. In the case of compression loading,
the matrix prevents the fibres from buckling. Generally, unidirectional fibre
composites are stronger in tension but weaker in compression (Fleck & Liu 2001;
Jelf & Fleck 1992). The combination of tension and compression produces friction
due to the fibre sliding from the surrounding matrix and exhibiting shear properties.
During bending, the composite undergoes tension, compression and shear
deformation. The frictional resistance and ultimate composite failure reflects the
energy absorption capacity of the material which can be measured through impact
property analysis.
Composite property can also be investigated through micro-structural analysis.
Micro-structure analysis is a valuable tool for materials investigation, failure analysis
and quality analysis. The most widespread micro-structural analysis of fibre
composites is done by using an optical microscope (OM) and scanning electron
microscope (SEM). The use of a reflected-light (OM) and infrared beam (SEM)
provides insight through detailed analysis of the fibre surface, fibre microstructure,

13
fibre orientation into the matrix, degree of fibre matrix interface bonding, void
content, failure mechanisms, etc. (Ilomaki 2012).
2.3 Natural fibres
Plant based natural fibres are lignocellulosic in nature and are composed of cellulose,
hemicellulose, lignin, pectin and waxy substances. The structural constituents of
fibres are presented in Table 2.2 (Fakirov & Bhattacharyya 2007; Mohanty, Misra &
Hinrichsen 2000). The contents (weight %) of structural constituents are varied in
accordance to different natural fibre. The cellulose content ranges from 60-80%,
lignin content ranges from 1-15% and hemicellulose content ranges from 5-20%. The
other constituents are extractives (pectin, wax) which are usually less than 10% of
the total weight of the dry fibre.
Table 2.2: Structural constituents of natural fibres (Fakirov & Bhattacharyya 2007;
Mohanty, Misra & Hinrichsen 2000) Name
of the
Fibres
Cellulose
(wt%) Lignin
(wt%) Hemicellulose
(wt%) Pectin
(wt%) Wax
(wt%) Micro-
fibril/spiral
angle (0)
Moisture
Content
(wt%) Bast Fibres
Jute 61-71.5 12-13 13.6-20.4 0.2 0.5 8.0 12.6
Flax 71 2.2 18.6-20.6 2.3 1.7 10.0 10.0
Hemp 70.2-74.4 3.7-
5.7
17.9-22.4 0.9 0.8 6.2 10.8
Ramie 68.6-76.2 0.6-
0.7
13.1-16.7 1.9 0.3 7.5 8.0
Leaf Fibres
Sisal 67-78 8.0-
11.0
10.0-14.2 10.0 2.0 20.0 11.0
PALF 70-82 5-12 - - - 14.0 11.8
Seed Fibres
Cotton 82.7 0.7-
1.6
5.7 - 0.6 - 33-34
Figure 2.1 shows schematically the structural composition of a natural fibre in which
the fibre stem consists of fibre bundles (Kasuga, et al. 2001). Each fibre bundle

14
contains individual technical fibres and technical fibres consist of elementary fibres.
The elementary fibre consists of microfibrils. Microfibrils are the basic unit of
cellulose. Cellulose is glued together by hemicellulose and lignin constituents.
The elementary fibre structure consists of multi cell walls. Figure 2.2 shows a
schematic structure of a elementary fibre cell wall and Figure 2.3 presents the model
of the structural organisation of the three major structural constituents (cellulose,
hemicellulose and lignin) (Madsen 2004). In accordance with a specific type of fibre,
each fibre cell wall is made up of two distinct parts, namely the primary cell wall and
the secondary cell wall, which again, is made up of three layers (S1, S2 and S3).
These layers contain varying amounts of cellulose, hemicellulose and lignin
constituents. The fibre structure develops in the primary cell wall and is deposited
during its growth (John & Anandjiwala 2008). The cellulose content increases
Figure 2.1: Composition of natural fibre (Kasuga, et al. 2001)
Microfibril
Mesofibril
Elementary fibre Technical fibre
Fibre bundle
Fibre stem

15
steadily from primary to secondary walls, while the hemicellulose amounts are
similar in both walls. However, lignin content decreases from primary to secondary
walls. Cellulose content is highest at the secondary cell wall and is composed with
crystalline and amorphous cellulose microfibrils which are bonded together by
amorphous hemicellulose and lignin. The secondary cell wall makes up the fibre
diameter and determines its mechanical properties.
Cellulose
Hemicellulose
Lignin
Figure 2.3: Structural organisation of the three major constituents in the fibre cell wall
(Madsen 2004)
Figure 2.2: Structure of elementary fibre (Madsen 2004)
Secondary wall, S1
Cellulose microfibrils
(crystalline)
Primary wall
Secondary wall, S2
Secondary wall, S3
Cellulose microfibrils
(amorphous), consists
of lignin and
hemicellulose
Microfibril angle

16
Cellulose is considered the major framework component of the fibre structure. It
provides strength, stiffness and structural stability of the fibre. The chemical
structure of cellulose (Figure 2.4a (Bledzki & Gassan 1999)) consists of three
hydroxyl groups (-OH). Two of these form hydrogen bonds within the cellulose
macromolecules (intramolecular) whilst the rest of the group forms a hydrogen bond
with other cellulose molecules (intermolecular) (Mwaikambo & Ansell 2002).
n
O
OH
OH
HO
O
O
OH HO
O
OH
(a)
O H2C – C – OH
CH2
OCH3
O
OCH3
O
(c)
O
CH3–C–O
O
OH
H
H
O
OH
O
H
H H
H
H
H
HO
O
H
H
H
H
O
(b)
Figure 2.4: Chemical structure of (a) cellulose (b) hemicellulose and (c) lignin (Bledzki &
Gassan 1999, Saheb & Jog 1999)

17
Hemicellulose occurs mainly in the primary cell wall and has branched polymers
(Figure 2.4b) structures. Hemicellulose is completely amorphous and has a lower
molecular weight than cellulose (Mwaikambo & Ansell 2002). Hemicellulose
molecules are hydrogen bonded with cellulose microfibrils and they form cementing
materials for the fibre structure.
Lignin is amorphous and has an aromatic structure (Figure 2.4c) (Saheb & Jog 1999).
Lignin is coupled with the cellulose-hemicellulose network and provides an adhesive
quality to hold the microfibrils together as a fibre unit, as well as joining the adjacent
fibres together to form a fibre bundle. This adhesive quality provides the strength and
stiffness properties of the fibre. There are also small amounts of other organic
(extractives) and inorganic (ash) components present in the fibre structure. These
organic extractives are responsible for colour, odour and decay resistance, whilst the
inorganic constituents enhance the abrasive nature of the fibre.
Generally, fibres with a higher cellulose content and a lower microfibrillar angle (the
angle between the fibre axis and cellulose microfibrilis) have better strengths
(Fakirov & Bhattacharyya 2007; Mwaikambo & Ansell 1999). Mechanical properties
of natural fibre over synthetic fibre are presented in Table 2.3 (Dhakal, Zhang &
Richardson 2007; Fakirov & Bhattacharyya 2007; Mohanty, Misra & Hinrichsen
2000). Although natural fibres have relatively lower strengths compared to the
synthetic fibres, the specific modulus and elongation at break signifies the
potentiality of these fibres to replace synthetic fibres in engineering polymer
composites.

18
Table 2.3: Comparative properties of natural fibres with conventional manmade
fibres (Dhakal, Zhang & Richardson 2007; Fakirov & Bhattacharyya 2007; Mohanty,
Misra & Hinrichsen 2000) Name of
fibres Density
(g/cm3)
Tensile
strength
(MPa)
Young`s
modulus
(GPa)
Specific
strength
(GPa/g/cm3)
Specific
modulus
(GPa/g/cm3)
Elongation
at break
(%) Jute 1.3-1.4 393-773 13-26.5 0.3-0.5 10-18.3 1.16-1.5
Flax 1.50 345-1100 27.6 0.2-0.7 18.4 2.7-3.2
Hemp 1.14 690 30-60 0.6 26.3-52.6 1.6
Ramie 1.50 400-938 61.4-128 0.3-0.6 40.9-85.3 1.2-3.8
Sisal 1.45 468-640 9.4-22.0 0.3-0.4 6.4-15.2 3-7
PALF 1.52 413-1627 34.5-
82.51
0.3-1.1 22.7-54.3 1.6
Cotton 1.5-1.6 287-800 5.5-12.6 0.2-0.5 3.7-7.8 7.0-8.0
E-glass 2.5 2000-
3500
70 0.8-1.4 28 2.5
S-glass 2.5 4570 86 1.8 34.4 2.8
Aramid 1.4 3000-
3150
63-67 2.1-2.2 45-47.8 3.3-3.7
2.4 Issues in natural fibre composites
The properties of natural fibre reinforced polymer composites are generally governed
by the fibre properties and the quality of fibre matrix interface bonding. The
inconsistent fibre structure, hydrophilicity of fibre, poor fibre compatibility into the
matrix and low thermal resistance of fibre are the main causes of the reduction of the
composites‘ thermal and mechanical properties.
2.4.1 Hydrophilicity of fibre
Natural fibre consists of cellulose microfibrils which are covered by hemicellulose
and lignin constituents. The cellulose structure of the fibres is distinguished through
crystalline and amorphous regions, whereas hemicellulose and lignin are completely
amorphous (Figure 2.2). In cellulose crystalline region, large numbers of strongly
linked hydroxyl groups are present. These hydroxyl groups are inaccessible and so
other chemicals have difficulty penetrating the crystalline region (Figure 2.5)
(Walker 2006). However, in the amorphous region, the hydroxyl groups are loosely

19
linked with the fibre structure and are relatively free to react with other chemicals.
Due to this freedom, hydroxyl groups present in the amorphous region can easily
combine with water molecules from the atmosphere. The hydroxyl groups present in
the amorphous hemicellulose and lignin initially give the access of water molecules
to penetrate the fibre surface. Water molecules then combine with the hydroxyl
groups that are present in cellulose (in the amorphous region) and stay in the fibre
structure. This makes the fibre hydrophilic and polar in character.
The hydrophilic fibres are incompatible with most hydrophobic thermoset and
thermoplastic matrices. As a result, incomplete fibre wetting into the matrix takes
place and weak bonding exists at their interfaces. In addition, the hydrophilic fibre
causes fibre swelling within the matrix. Fibre swelling generates extra stresses on the
Figure 2.5: Schematic presentation of the orientation of fibre constituents that absorb
moisture (Walker 2006)
Amorphous
region of
hemicellulose
and lignin
HO-
Accessible
hydroxyl
groups
Amorphous
cellulose
microfibrils
Inaccessible
hydroxyl
groups
Crystalline
cellulose
microfibrils
Accessible
hydroxyl
groups
HO-
HO-
HO-
Atmospheric
moisture
(H-O-H)
Hemicellulose
lignin hydroxyl
groups
Cellulose hydroxyl groups
Cellulose microfibrils

20
surrounding matrix. Weak interface bonding and the induced swelling stress results
in propagation of debonding, cracks and severe deterioration of composites‘
mechanical properties (Zakaria & Poh 2002). In order to develop composites with
good properties, it is necessary to improve the interface bonding strength between the
fibre and matrix. Therefore, the removal of moisture from fibres is an essential step
for the preparation of composites. The moisture absorption of fibres can be reduced
by eliminating the hydroxyl groups in amorphous region from the fibre structure
through different chemical treatments (Wang, et al. 2007). Chemical reagents contain
functional groups that are capable of forming chemical bonds with the hydroxyl
groups of the fibre, thus providing good compatibility with the matrix. Interfacial
compatibility improves the stress transfer at the interface and leads to the
improvement of mechanical properties of the produced composites.
2.4.2 Inconsistence fibre properties
The physical dimensions of natural fibre are not uniform throughout its length. The
elementary fibre that comes from different parts of a plant has various lengths and
widths. Several elementary fibres associate with one another to form fibre structures,
which also have diverse lengths and widths. This variable fibre dimension affects the
fibre aspect ratio (length/diameter) which is a critical parameter for composite
properties. The critical fibre aspect ratio is defined as the minimum ratio in which the
maximum fibre stress can be achieved for a given load (Joseph, et al. 2003). The
critical fibre length determines greater load transfer from the fibre to matrix through
the interface.

21
2.4.3 Poor fibre compatibility into the matrix
The incorporation of natural fibres into a matrix is often associated with poor fibre
compatibility as their cellulose surface is covered by the hemicellulose and lignin
constituents. Hemicellulose and lignin act as a weak boundary layer between the
cellulose (elementary fibre) and the matrix. Due to the presence of weak boundary
layer at the fibre matrix interface, the stress distribution capacity throughout the
composite area is reduced. To obtain a satisfactory performance of the composite, it
is necessary to remove the weak boundary layers from the elementary fibres. A weak
boundary layer can be removed by dissolving hemicellulose and lignin coverings
through different chemical treatments of the fibre.
2.4.4 Fibre degradation at high temperature
Natural fibre generally starts degrading at about 240°C. Structural constituents of the
fibre (cellulose, hemicellulose, lignin etc) are sensitive to different ranges of
temperature. It was reported that, hemicellulose starts degrading at a temperature
around 200°C and cellulosic constituents degraded at higher temperatures (Joseph, et
al. 2003). Fibre degradations result in the exclusion of some high temperature
manufacturing processes (Hayes & Gammon 2010). Thermal stability of the fibre
can be enhanced by removing certain proportions of hemicellulose and lignin
constituents through different chemical treatments. The degradation of natural fibres
is an important issue in the development of composites in both manufacturing
(curing, extrusion or injection moulding) and materials in service (Sgriccia, Hawley
& Misra 2008; Taj, Munawar & Khan 2007).

22
2.5 Surface treatment of natural fibres
Natural fibre reinforced thermoset and thermoplastic matrices have inherently poor
mechanical properties due to weak interface bonding between the fibres and matrix.
To enhance interfacial bonding, modifications of fibre can be made by using
different chemical treatments on the reinforcing fibre. Chemical treatments allow
cellulose surface to react with the matrix (Dash, et al. 2000). Due to this, strong
fibre-matrix interface bonding can be achieved which ultimately results in greater
mechanical properties of the composites.
Several research activities have been conducted to improve fibre adhesion properties
with the matrix through chemical treatments. The following are reviews of different
chemical treatments on the fibre, and their effects on composite properties.
2.5.1 Alkaline treatment
The treatment on natural fibres by sodium hydroxide (NaOH) is being widely used to
modify fibre structure. Natural fibre absorbs moisture due to the presence of
hydroxyl groups in the amorphous region of cellulose, hemicellulose and lignin
constituents. During alkali treatment, alkalised groups (NaO-H) react with these
hydroxyl groups (-OH) of the fibre and produce water molecules (H-OH) which are
consequently removed from the fibre structure. Then the remaining alkalised groups
(Na-O-) react with the fibre cell wall and produce Fibre-cell-O-Na groups (John &
Anandjiwala 2008). The chemical reaction of the fibre-cell and NaOH is presented in
Equation 2.1. These chemical activities reduce the moisture related hydroxyl groups
(hydrophilic) and thus improve the fibres‘ hydrophobicity. Treatment also takes out a
certain portion of hemicellulose, lignin, pectin, wax and oil coverings (weak

23
boundary layer) from the cellulose surface (Li, Tabil & Panigrahi 2007; Mwaikambo,
Tucker & Clark 2007; Ray, et al. 2001). As a result, cellulose microfibrils are
exposed to the fibre surface. Consequently, treatment changes the orientation of the
highly packed crystalline cellulose order, forming an amorphous region
(Beckermann & Pickering 2008). This amorphous region of cellulose can easily mix
with matrix materials and form strong interface bonding which results in greater load
transfer capacity of the composites.
Alkaline treatment also separates the elementary fibres from their fibre bundles by
removing the covering materials. Thus increasing the effective surface area of fibre
for matrix adhesion, and improving the fibre dispersion within the composite.
Treated fibre surfaces become rougher, which can further improve fibre-matrix
adhesion by providing additional fibre sites for mechanical interlocking (Joseph, et
al. 2003). Mechanical and thermal behaviours of the composite are improved
significantly by this treatment. However, too high of alkali concentration can cause
an excess removal of covering materials from the cellulose surface, which results in
weakening or damage to the fibre structure (Li, Tabil & Panigrahi 2007; Wang, et al.
2007).
Table 2.4 summaries the recent results of alkali treatments on natural fibres and their
effects on the mechanical and thermal properties of the composites. From Table 2.4 it
can be observed that a wide range of different treatment concentrations (NaOH), time
and temperature were used on different plant based natural fibres. The treatment
effects were presented in terms of thermal and mechanical properties of their
Fibre-cell-OH + NaOH Fibre cell-O-Na
+ + H2O
(2.1)

24
composites. It is important to select a treatment condition for a particular natural
fibre (such as hemp fibre) to analyse the treatment effects on the fibre structure
(cellulose, hemicellulose and lignin) and the morphological changes. These changes
need to be systematically explored through the thermal property analysis of the fibre,
compatibility with the matrix and their composites‘ mechanical property analysis.
Table 2.4: Recent works on alkali treated fibre composites Fibre matrix
composites Applied treatment
methods Results on mechanical and
thermal properties References
Flax-Epoxy NaOH treatment 30% increase in tensile
strength and modulus. (Li, Tabil &
Panigrahi
2007) Sisal-
Polyester Various concentrations
of NaOH treatment at
room temperature
4% alkali treatment reported
maximum tensile strength. (Li, Tabil &
Panigrahi
2007) Hemp-
Euphorbia 0.16% NaOH for 48
hours Tensile strength was increased
by 30% and doubled the shear
strengths.
(Mwaikambo,
Tucker &
Clark 2007) Jute-
Vinylester 5% NaOH for various
times 4 hour alkali treated composite
accounted for 20% and 19%
increase in flexural strength and
interlaminar shear strength.
(Ray, et al.
2001)
Sisal-
Polycaprolac
tone
10% NaOH for various
times Increase in elastic modulus
with the increase in reaction
time.
(Vallo, et al.
2004)
Hemp fibre 8% NaOH treatment Thermal stability was
increased by 4%. (Ouajai &
Shanks 2005) Coir-
Polyester 5% NaOH treatment
for 72 hours Flexural and impact strength
was increased by 40% with
respect to the untreated fibre
composites.
(Prasad,
Pavithran &
Rohatgi 1983)
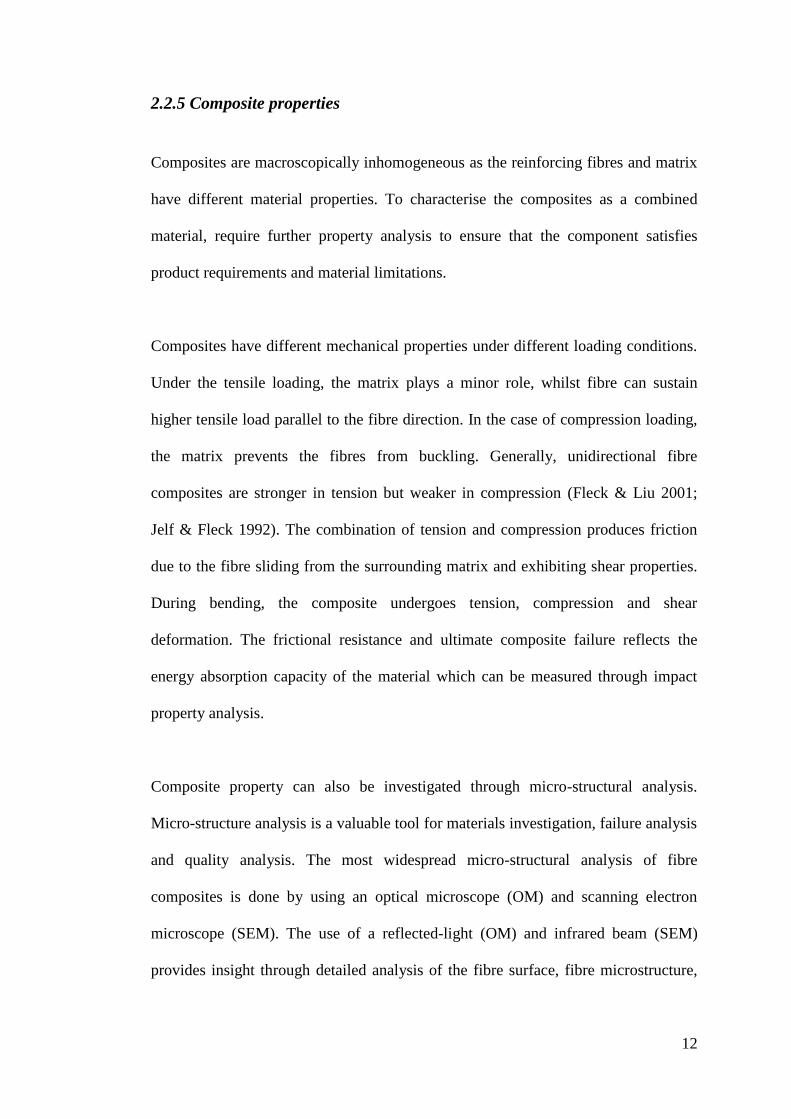
2.5.2 Acetyl treatment
Acetyl treatment is known as the esterification method to modify the natural fibre
structure. The acetyl group (CH3CO-) reacts with the hydroxyl groups (-OH) that

25
present in the amorphous region of the fibre and remove the existing moisture, thus
reducing the hydrophilic nature of the fibre (Bledzki, et al. 2008). Moreover,
treatment provides rough fibre surface topography that gives better mechanical
interlocking with the matrix (Li, Tabil & Panigrahi 2007; Tserki, et al. 2005).
Treatment also improves the fibres dispersion in to the matrix and thus enhances
dimensional stability of the composite. Acetylation process with and without acid
catalyst on fibre are given in Equations 2.2 and 2.3 (Mwaikambo & Ansell 1999).
Acetylation with acid catalyst
Acetylation without acid catalyst
Fibres are acetylated with and without an acid catalyst to graft the acetyl groups onto
the cellulose surface. In general, acetic acid does not react sufficiently with the
fibres. As a result, it is necessary to use a catalyst to speed up the acetylation process.
Acetic anhydrides, pyridine, sulphuric acid, potassium and sodium acetate etc. are
commonly used catalysts for acetylation process. However, strong acid catalysts
cause hydrolysis of cellulose which in results the damaging of the fibre structure. For
this, selection of catalyst is an important factor for the acetyl treatment. The
acetylation process is also influenced by the reaction time. Longer reaction time
allows acetic anhydride (catalyst) to access fibre constituents. The reagent then reacts
with hemicellulose and lignin constituents and removes them from the fibre,
(2.2) Fibre-OH + CH3COOH Fibre – O – C – CH3 + H2O (CH3CO)2O
Conc. H2SO4
O
O O O O
Fibre-OH + CH3 – C – O – C – CH3 Fibre – O – C – CH3 + CH3C - OH (2.3)

26
resulting in the opening of cellulose surface to allow reaction with the matrix
molecules.
Mwaikambo & Ansell (1999) used acetic acid and acetic anhydride (catalyst) to treat
hemp, flax, jute and kapok fibres. Rowell & Young (1997) investigated acetic
anhydride treatment on different types of natural fibres to analyse the effects of
equilibrium moisture content. They reported improved moisture resistance properties
of the treated fibres. This was due to the removal of hemicellulose and lignin
constituents from the treated fibre. Mishra, et al. (2003) used an acetic anhydride
treatment (with glacial acetic acid and sulphuric acid) on an alkali pre-treated (5%
and 10% NaOH solution for an hour at 30°C) sisal fibre and reported, improved fibre
matrix adhesion of the final composites. Bledzki, et al. (2008) studied different
concentrations of acetyl treatment on flax fibre and reported 50% higher thermal
properties. Moreover, 18% acetylated flax fibre polypropylene composites showed
25% higher tensile and flexural properties as compared to the untreated fibre
composites.
2.5.3 Silane treatment
Silane is a multifunctional molecule which is used as a coupling agent to modify
fibre surfaces. Silane molecules form a chemical link between the fibre surface and
the matrix through a siloxane bridge. Silane undergoes several stages of hydrolysis,
condensation and bond formation during the treatment process of the fibre. Silane
forms silanol in the presence of fibre moisture (hydrolysis, see Equation 2.4
(Sreekala, et al. 2000)). During the condensation process, one end of silanol reacts
with the cellulose hydroxyl group (Si-O-Cellulose, see Equation 2.5 (Sreekala, et al.
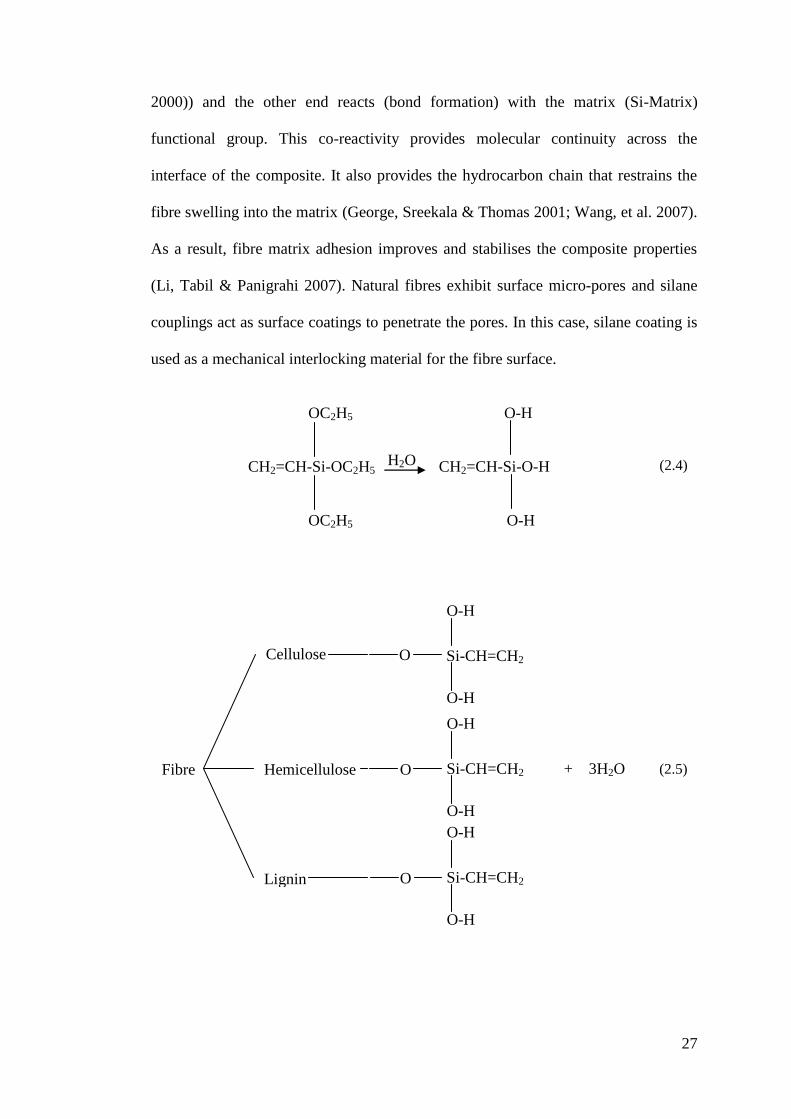
27
2000)) and the other end reacts (bond formation) with the matrix (Si-Matrix)
functional group. This co-reactivity provides molecular continuity across the
interface of the composite. It also provides the hydrocarbon chain that restrains the
fibre swelling into the matrix (George, Sreekala & Thomas 2001; Wang, et al. 2007).
As a result, fibre matrix adhesion improves and stabilises the composite properties
(Li, Tabil & Panigrahi 2007). Natural fibres exhibit surface micro-pores and silane
couplings act as surface coatings to penetrate the pores. In this case, silane coating is
used as a mechanical interlocking material for the fibre surface.
CH2=CH-Si-OC2H5 CH2=CH-Si-O-H
OC2H5 O-H
O-H
H2O
OC2H5
+ 3H2O
O
Fibre Hemicellulose
Cellulose
Lignin
Si-CH=CH2
O-H
O-H
Si-CH=CH2
O-H
O-H
Si-CH=CH2
O-H
O-H
O
O
(2.4)
(2.5)

28
During the silane treatment, hydroxyl groups on the fibre surface are covered by
silane molecules. Due to this, hydroxyl groups that presents in hemicellulose and
lignin constituents cannot absorb the atmospheric moisture. As a result, moisture
absorption capacity of the treated fibres is reduced.
Seki (2009) investigated the effect of alkali (5% NaOH for 2 hours) and silane (1%
oligomeric siloxane with 96% alcohol solution for an hour) treatments on flexural
properties of jute-epoxy and jute-polyester composites. For jute-epoxy composites,
silane over alkali treatments showed about 12% and 7% higher strength and modulus
properties compared to the alkali treatment alone. Similar treatments reported around
20% and 8% improvement for jute-polyester composites. Sever, et al. (2010) applied
different concentrations (0.1%, 0.3% and 0.5%) of silane (γ-Methacryloxy-propyl-
trimethoxy-silane) treatments on jute fabrics polyester composites. Tensile, flexural
and interlaminar shear properties were investigated and compared with the untreated
samples. The results for the 0.3% silane treated sample showed around 40%, 30%
and 55% improvement in tensile, flexural and interlaminar shear strength
respectively. Silane treated fibre composites provided better tensile strengths than the
alkali treated fibre composites (Valadez-Gonzalez, et al. 1999).
2.5.4 Benzoyl treatment
Benzoyl treatment uses benzoyl chloride to decrease the hydrophilic nature of the
fibre and improves interfacial adhesion, thereby increasing the strength of the
composite. Treatment also enhances the thermal stability of the fibre (Li, Tabil &
Panigrahi 2007; Manikandan, Thomas & Groeninckx 2001).
29
During benzoyl treatment alkali pre-treatment is used. At this stage, extractable
materials such as lignin, waxes and oil covering materials are removed from the fibre
and more hydroxyl groups (-OH) attached with cellulose are exposed on the fibre
surface. Then the fibres are treated with benzoyl chloride. OH groups of the fibre are
further replaced by the benzoyl group and it attaches to the cellulose backbone. This
results in a more hydrophobic nature of the fibre and improves adhesion with the
matrix. The reaction between the cellulosic –OH group of fibre and benzoyl chloride
is given in Equations 2.6 and 2.7 (Joseph, et al. 2003).
Joseph, Thomas & Pavithran (1996) applied benzoyl chloride treatment on alkali pre-
treated sisal fibre and reported higher thermal stability compared to the untreated
fibre composites. Similar treatment was carried out on flax fibre reinforced in low
density polyethylene composites by Wang, et al. (2007). The reported result was a
6% and 33% higher tensile strength and moisture resistance properties respectively.
2.5.5 Peroxide treatment
Interface properties of fibre and matrix can be improved by peroxide treatment. The
peroxide-induced grafting of polyethylene adheres to the fibre surface. Additionally,
peroxide initiates free radicals that react with the cellulose surface of the fibre as well
as with the matrix. As a result, good fibre matrix adhesion along the interface occurs.
This treatment also reduces the moisture absorption capacity of the fibre and
Fibre- O-Na
+ + C1C Fibre- O – C + NaCl
O O
(2.6)
(2.7)
Fibre – OH + NaOH Fibre- O-Na
+ + H2O

30
improves thermal stability (Kalaprasad, et al. 2004; Wang, et al. 2007). The reaction
between the cellulosic –OH group of the fibre and the peroxide is given in Equations
2.8 and 2.9 (Sreekala, et al. 2000).
Sapieha, Allard & Zang (1990) reported pre-treatment of fibre by benzoyl (or
dicumyl) peroxide and showed higher mechanical properties of the composites. The
mechanism of peroxide treatment involves alkali pre-treatment on the fibre then
coated with benzoyl peroxide or dicumyl peroxide (around 6% concentration) in
acetone solution for 30 minutes. Complete decomposition of peroxide can be
achieved by heating the solution at a higher temperature (Kalaprasad, et al. 2004; Li,
Tabil & Panigrahi 2007). Joseph, Thomas & Pavithran (1996) investigated optimum
concentration of benzoyl peroxide (6%) and dicumyl peroxide (4%) treatments on
short sisal fibre-reinforced polyethylene composites and reported improved tensile
strengths.
2.5.6 Maleated coupling agents
Maleated coupling agents provide efficient interaction between the fibre surface and
matrix. During grafting, maleic anhydride reacts with the hydroxyl groups in the
amorphous region of fibre and removes them from the fibre. Treatment also produces
a brush like long chain polymer coating on the fibre surface and reduces the
hydrophilic tendency. Additionally, maleated coupler forms a carbon-carbon bond to
RO OR 2RO
RO + Cellulose – H R – OH + Cellulose
R= peroxide functional group
(2.8)
(2.9)

31
the polymer chain with the matrix (George, Sreekala & Thomas 2001a). This
covalent bonding between the fibre surface and matrix provide balanced properties to
make a bridge interface (fibre-matrix) for efficient interlocking (Keener, Stuart &
Brown 2004). The reaction mechanism of maleic anhydride, polypropylene (MAPP)
and the fibre are presented in Equations 2.10 and 2.11.
MAPP copolymer is activated at a temperature of 170°C and then the esterification
of the cellulose fibres is carried out. This treatment results in better wettability of the
fibre and enhanced interfacial adhesion (Keener, Stuart & Brown 2004; Li, Tabil &
Panigrahi 2007). Mohanty, et al. (2004) used jute fibre (30% fibre loading, 6 mm on
fibre length) treated with a 0.5% MAPP concentration in toluene for 5 minutes and
reinforced in a polypropylene (PP) matrix. The composite showed around 72%
higher flexural strengths compared to the untreated fibre composites. Water
+ H2O
PP
chai
n
H
HO – C – C
O H
HO – C – C – C
H O
PP
chai
n
H
C – C
O H
C – C – C
H O
O
+
PP
chai
n
H
C – C
O H
C – C – C
H O
O Fibre OH
OH
H
C – C
O H
C – C – C
H O
Fib
re
O
O
H
C – C
O H
C – C – C
H O
Fib
re
O
O O
H - H
(2.10)
(2.11)
32
absorption tendency by the treated fibre composite was also reduced. Similar studies
were performed by Mohanty, et al. (2004) who reported that 1% MAPP treated sisal
fibre-PP composite exhibited around 50%, 30% and 58% higher tensile, flexural and
impact strengths respectively.
2.5.7 Sodium chlorite treatment
Sodium chlorite (NaClO2) is used for the bleaching of fibres in acid solution. NaClO2
is acidified and liberates choleric acid (HClO2), which undergoes an oxidation
reaction and forms chlorine dioxide (ClO2). ClO2 reacts with lignin constituents and
removes them from the fibre. It also reacts with the hydroxyl groups that presents in
the hemicellulose (Chattopadhyay & Sarkar 1945). These combined effects remove
moisture from the fibre and enhance the hydrophobic fibre nature. After
delignification, fibres become more flexible and have lower stiffness properties (Li,
Tabil & Panigrahi 2007).
Li, Panigrahi & Tabil (2009) studied the effects of sodium chlorite (sodium chlorite:
water = 1: 25 (by weight), at 70°C for 24 hours) treatment on alkali pre-treated (5%
NaOH for an hour) sisal fibre and found a higher tensile strength and a lower
moisture absorption rate. Similar results were reported by Misra, et al. (2002) on
sisal fibre reinforced polyester composites.
2.5.8 Isocyanate treatment
Isocyanate works as a coupling agent for fibre surface modification. The functional
group of isocyanate (-N=C=O) reacts with the hydroxyl groups attached in cellulose
and lignin constituents of the fibres and, therefore, a urethane linkage is formed. This

33
chemical linkage provides strong covalent bonds between the fibre and matrix.
Isocyanate also reacts with the moisture present on the fibre surface and forms urea
which can further react with the hydroxyl groups of the cellulose (George, Sreekala
& Thomas 2001). This secondary reaction results in higher moisture resistance
properties of the fibre and provides better bonding with the matrix to enhance
composite properties (Kalia, Kaith & Kaur 2009). The reaction between the fibre and
isocyanate coupling agent is shown in Equation 2.12, where R could be different
chemical groups.
George & Verpoest (1999) used isocyanate with dimethyl formamide (DMF) solvent
to treat flax fibre. The DMF solvent has a higher boiling point and better solubility
with isocyanates and the fibre. Due to this, thermal stability of the fibre was
increased. Compared to the untreated fibre composite, the resultant treated (flax-
epoxy) fibre composite showed 13% and 18% higher tensile strength and modulus
properties respectively.
2.5.9 Stearic acid treatment
Stearic acid (CH3(CH2)16COOH) in ethyl alcohol solution is used to modify fibre
surfaces. The carboxyl group of stearic acid reacts with the hydrophilic hydroxyl
groups of the fibre and improves the fibre‘s water resistance properties. Treatment
also removes pectin, wax and oil covering materials from the fibre surface which
results more cellulose microfibrils to expose on fibre surface (Paul, et al. 2010).
Cellulose microfibrils dispersion into the matrix facilitates better bonding at the
Fibre – OH + R – N = C = O Fibre – O – C – N – R
H O
(2.12)

34
interface and provides improved properties of the composites. The reaction between
fibre and stearic acid is presented in Equation 2.13.
Kalaprasad, et al. (2004) used stearic acid treatment on sisal fibre in ethyl alcohol
solution and showed higher tensile strength and modulus properties. Torres &
Cubillas (2005) used 3% stearic acid to treat sisal fibre reinforced in polyethylene
composites and reported 23% higher shear strength compared to the untreated
samples.
2.5.10 Permanganate treatment
Permanganate treatment on natural fibres is conducted by potassium permanganate
(KMnO4) in acetone solution. This treatment forms highly reactive permanganate
ions (Mn3+
) which react with the cellulose (hydroxyl groups) and form cellulose-
manganate and initiates graft copolymerization. This treatment enhances chemical
interlocking at the interface and provides better fibre adhesion with the matrix
(Rahman, Mallik & Khan 2007). Treatment also reacts with the OH groups in lignin
and removes them from the fibre, thus the hydrophilic nature of the fibre is reduced.
Higher concentrations of KMnO4 (more than 1%) cause excess delignification from
the fibre structure and degrade its strengths (Li, Tabil & Panigrahi 2007; Paul, et al.
2010). The reaction between the fibre–OH group and potassium permanganate is
given in Equation 2.14.
Fibre-OH + CH3(CH2)16COOH CH3(CH2)16COO-O-Fibre + H2O (2.13)
Fibre - OH + KMnO4 Fibre – O – H – O – Mn – OK+
O
O
(2.14)

35
Paul, et al. (2010) reported that, during oxidation reaction, KMnO4 etches the fibre
surface and makes it physically rougher to improve mechanical interlocking with the
matrix. Flexural strength and modulus properties were increased by 5% and 10% for
the treated banana fibre reinforced in polypropylene composites. Li, et al. (2004)
applied 0.2% KMnO4 solution (in 2% acetone) on alkali pre-treated (2% NaOH for
an hour) flax fibre and reported treated fibre-LLDPE and HDPE composites had
higher tensile strengths compared to the untreated samples.
2.5.11 Triazine treatment
Triazine treatment is used for the surface modification of the natural fibres. A
triazine (C3H3N3) derivative has multifunctional groups (e.g. C3H3N3Cl3) in its
structure. The reactive chlorines esterify the hydroxyl groups of the fibre and provide
linkage between the cellulose surface and the matrix. Treatment also provides better
moisture resistance properties of the fibre (Kalia, Kaith & Kaur 2009; Li, Tabil &
Panigrahi 2007; Mengeloglu & Karakus 2008). Due to this, strong adhesion at the
interface takes place and thus improves composite properties (Bledzki & Gassan
1999). The possible reaction between triazine derivative and fibre-OH groups are
given in Equations 2.15 and 2.16.
H2NR
Cl Cl
Cl
N
N
N
R
Cl Cl
HN
N
N
N + HCL
Fibre-OH +
R
Cl Cl
HN
N
N
N
R
Cl O
HN
N
N
N
Fib
re
+ HCL
(2.15)
(2.16)

36
Zadorecki & Flodin (1985) used trichloro-s-triazine based different coupling agents
to treat cellulose fibres and was reinforced in polyester matrix. Improved fibre matrix
adhesion and higher moisture resistance properties were reported for the treated fibre
composites.
2.5.12 Fatty acid derivate (oleoyl chloride) treatment
Fatty acid derivative is used as a coupling agent to modify the fibre surface while
improving wettability and interfacial adhesion characteristics. Oleoyl chloride is a
fatty acid derivate which reacts with the fibre hydroxyl groups (esterification) and
grafts to the cellulose backbone. Treatment also makes the fibre hydrophobic in
nature which improves the wetting and adhesion of fibre with the matrix.
Modification on jute fibre with dichloromethane and pyridine solvent under a dry
nitrogen atmosphere resulted in more hydrophobic characteristics and increased
composite properties (Corrales, et al. 2007).
2.5.13 Fungal treatment
Fungal treatment has been recently considered as a promising alternative for natural
fibres‘ surface modification. This biological treatment is environmentally friendly
and efficient. During treatment, fungi are used to remove wax and oil covering
materials from the fibre surface through the action of specific enzymes. White rot
fungi produces extracellular oxidases enzymes that react with lignin constituents
(lignin peroxidase). The enzyme also increases hemicellulose solubility and thus
reduces the hydrophilic tendency of the fibre. Fungi also produces hyphane that
creates fine holes on the fibre surface and provides a rough surface for better
interlocking with the matrix (Jafari, et al. 2007; Pickering, et al. 2007).
37
The treatment process involves sterilisation of the fibres in an autoclave for 15
minutes with 120°C. Afterwards, fungi are added proportionally with the fibre and
incubated for 2 weeks at 27°C. Fibres are then sterilised, washed and oven dried.
Pickering, et al. (2007) studied fungal treatment on hemp fibre and reported a 22%
higher composite strengths than the untreated sample.
2.6 Summary
The use of natural fibres as reinforcement in polymer composites is attracting much
interest due to its potential mechanical properties, processing advantages and
environmental benefits. However, the hydrophilic nature of the fibres lowers the
compatibility with the matrix which results in poor mechanical properties of the
composites. Chemical treatment is an essential processing parameter to reduce the
hydrophilic nature of the fibres and thus improving adhesion with the matrix. Pre-
treatments of fibre change its structure and surface morphology. Hydrophilic
hydroxyl groups are removed from the fibre by the action of different chemicals.
Significant improvements in the mechanical properties of the composites are
reported by using different chemical treatment processes on the reinforcing fibre.
In this study hemp fibre is selected as reinforcement due to its potential mechanical
properties compared to the other natural fibres. Widely used alkaline, acetyl and
silane treatments are chosen to modify the fibre structure. Most commercially
available polyester (thermoset) matrix is utilised to prepare composites. The effect of
treatments on the fibre surface and structure are investigated through thermal and
mechanical property analysis. The interface bonding strength between the treated
fibres and the polyester matrix are examined through mechanical property analysis of
their composites.

38
Chapter 3: Materials and Experimental Methods
3.1 Introduction
Natural fibres are potential alternative material resources that have the ability to
replace synthetic fibres in engineering fibre composites. The successful utilisation of
natural fibres as reinforcement requires pre-processing to achieve the desired thermal
and mechanical properties of composites. A good understanding of fibre and
composite behaviour and their failure mechanisms is necessary before this material
can be implemented in engineering applications. In this chapter, material preparation
and experimental details are presented with respect to fibre characterisation, thermal
analysis and mechanical property analysis of composites.
The experimental methods described in this chapter are: (1) the chemical treatments
on hemp fibre, which change the fibre structure and morphology, which in turn
affects the fibres‘ thermal and mechanical properties; (2) experimental methods to
analyse the fibre properties; (3) manufacturing processes that combine the
chemically treated fibres with polyester matrix to produce composites; (4)
mechanical testing on hemp-polyester composites to analyse the fibre treatment
affects on composite properties under different loading conditions.

39
3.2 Materials
3.2.1 Hemp fibre
Hemp fibres (Cannabis sativa L) of various sizes and orientations (Figure 3.1) were
used for composite preparation. Long fibres (approximately 1 m in length) and
woven fabrics (combining 0° and 90° fibre orientation) were obtained from Eco
Fibre Industries, Australia. Long fibres were cutted into 5-10 mm in length to
produce short fibres. Long fibres were used to produce unidirectional fibre
composites. Short, randomly orientated fibres were used to prepare sandwich cores
and woven fabrics (380 g/m2) were used for sandwich skins.
Fibre surface treatments
Alkaline, acetyl and silane treatments on hemp fibres (long fibre, short fibre and
woven fabrics) were performed. Figure 3.2 shows the treatment outline on the hemp
fibres.
Figure 3.1: Hemp fibre (a) long (b) short and (c) woven fabric
(a) (b) (c)

40
The alkali treatments used different concentrations of NaOH solution. The solution
was prepared by adding 0%, 4%, 6%, 8%, and 10% NaOH (by weight) in a water
ethanol mixture (water: ethanol = 80: 20). It was then stirred at room temperature for
an hour. Hemp fibres were soaked with different concentrations of NaOH solutions
for 3 hours at room temperature. The fibres were then washed several times with
distilled water to allow absorbed alkali to leach from the fibre. The washed fibres
were dried at room temperature for 8 hours, and then oven dried at 100°C for another
6 hours. The dried fibres were stored in a sealed plastic bag to avoid atmospheric
moisture contamination prior to chemical analysis, thermal analysis and composite
processing.
For acetyl treatments, alkali pre-treated hemp fibres were soaked in acetic acid
(glacial) and subsequently treated with acetic anhydride at room temperature for 3
hours. Following this treatment, the fibres were washed in distilled water several
times to remove residual acetic anhydride and then dried in the manner described
above.
Figure 3.2: Stages of chemical treatments on fibre
Hemp fibre Alkalisation
(0, 4, 6, 8, 10%) NaOH
Acetylation
Silanisation

41
For silane treatments, oligomeric siloxane (3% by weight) was dissolved in a methyl
alcohol solution (alcohol: water = 60: 40). The solution was stirred at room
temperature for an hour. Alkali pre-treated fibres were then immersed in the solution
for 3 hours at room temperature. The fibres were then dried in a similar manner to
the other treatments described above.
Determination of fibre constituents
The cellulose, hemicellulose and lignin contents in chemically treated hemp fibres
were determined. Figure 3.3 shows the cellulose, hemicellulose and lignin
constituents extracted from the hemp fibre.
Cellulose
Treated fibres were crushed into powder and oven dried at 100°C for 2 hours. The
dried hemp powder (4 g) was placed in an Erlenmeyer flask and 50 ml of distilled
water was added. The flask was then placed in a thermostat water bath and the
solution was heated at 80°C with constant stirring. Sodium chlorite and acetic acid
were added repeatedly to the solution mixture four times in one hour intervals. After
Figure 3.3: Hemp fibre constituents (a) cellulose (b) hemicellulose and (c) lignin
(a) (b) (c)

42
that, the flask was placed in an ice bath and cooled down below 10°C. The residue
from the solution mixture was collected by filtration and washed with distilled water
and rectified spirit. The collected residue was oven dried at 105°C for 8 hours before
being weighed.
The dried residue was placed in a beaker and mixed with potassium hydroxide (24%
KOH). The mixture was kept at room temperature for 8 hours. The residue was then
collected through filtration and the filtered residue was kept for hemicellulose
estimation. The residue (cellulose) was washed with water and rectified spirit, oven
dried at 1050C for 8 hours, cooled down in a desiccators and weighed. The drying
and weighing was repeated until a constant weight was achieved. The percentage of
cellulose was calculated by measuring weight differences.
Hemicellulose
The filtration from the cellulose was collected in a beaker. A solution of rectified
spirit containing 10% acetic acid was prepared and added to the beaker and stirred
constantly. During stirring, a gel-like precipitate formed, and was collected and
washed several times with rectified spirit, and then oven dried at 1000C for 8 hours.
The constant weight was recorded and the hemicellulose percentage was calculated.
Lignin
Hemp powder (0.4 g) was mixed with sulphuric acid (72% concentration) and the
mixture was kept in an ice bath for 12 hours where it was stirred frequently. The
mixture was then diluted to an acid strength of 4% and refluxed for six hours.
Following cooling, the mixture was filtered, transferred to the crucible and washed

43
repeatedly with hot water until free from acid. The residue was dried at 1050C for 15
hours, cooled in desiccators, and weighed. The drying and weighing was repeated
until a constant weight was achieved. The lignin weight percentage was calculated by
measuring the weight difference.
3.2.2 Polyester matrix
Unsaturated polyester was used as a thermoset matrix to prepare composites. A
chemical formula of the polyester matrix is presented in Figure 3.4. Generally,
unsaturated polyester matrix ((C8H6O2, C8H16O4, C5H12O2, C4H2O3)n) is formed
through a reaction of a dibasic acid (acid has two hydrogen ions) and a glycol (glycol
containing two hydroxyl groups). The resulting polymeric liquid is blended in a
monomer (a molecule that may bind chemically to other molecules to form a
polymer) in the presence of styrene (an organic compound, chemical formula
C6H5CH=CH2). Styrene contains carbon carbon double bonds (C=C) which act as
cross-linking sites (Li, et al. 2000). Cross-linking begins in the presence of a catalyst.
Catalysts such as methyl ethyl ketone peroxide (MEKP, chemical formula C8H18O6)
reacts with styrene (C=C) and polymerisation of polyester matrix begins at room
temperature (Han & Lem 1984). The resulting material is a solid polyester matrix.
Figure 3.4: Chemical formula of polyester matrix
44
A clear casting of the polyester matrix was prepared by pouring liquid polyester
mixed with 1.5 wt% of MEKP into glass moulds. The 4 mm thick casting was then
allowed to gel and cure at room temperature overnight. The solid casting was then
oven dried at 80°C for 4 hours to post cure. The casting was then cut into shapes
required for mechanical testing.
3.3 Composite manufacturing processes
Hemp fibre polyester composites were prepared by utilising Vacuum Assisted Resin
Transfer Moulding (VARTM) and hand layup processes. Generally, VARTM is a
safer manufacturing process compared to hand layup techniques (Cicala & Lo Faro
2012). In VARTM, fibre and matrix are mixed in a mould covered by a flexible
plastic vacuum bag. Mould covering prevents the exposure of volatile organic matter
to humans during sample preparation. Vacuum pressure, used in the VARTM
process, removes air voids from individual fibre spacing‘s and facilitates thorough
fibre mixing with the matrix. Proper sealing of the vacuum bag on to the mould
ensures void-free composite fabrication. However, in hand layup processes, the fibre-
matrix mixing occurs in an open mould which involves manual material handling
under an exposed resin fume environment.
3.3.1 VARTM process
The VARTM process was used to prepare long unidirectional fibre composites.
Figure 3.5 presents a schematic diagram of the VARTM process for composite
preparation.

45
During composite processing, two rectangular flat glass plates (1000×1000 mm2)
were used as a mould. The glass moulds were utilised to maintain a consistent
thickness throughout the samples, with smooth surface finishes being achieved in the
final composites. Initially, the glass moulds were waxed several times with a mould
releasing agent (Meguiars Universal Mould Release Wax, item number 88).
Unidirectional fibres (100 g) were placed (600×600 mm2) between the glass moulds.
The fibre weight remained constant for all treatment cases to produced composite
samples. A distribution media layer was placed on the top of the fibres to allow
effective flow of the matrix across the fibres. The mould (glass-fibre) assembly was
then covered with a vacuum bag and sealed with adhesive tape. Two ports were
created in the mold; a matrix inlet port and a vacuum port. The complete mould
assembly was then depressurised via the vacuum port. All air voids present in the
assembly were removed by vacuum pressure (92 kPa). At this stage, the matrix inlet
port was opened to allow the liquid polyester (mixed with the 1.5 wt% MEKP
Figure 3.5: VARTM process for unidirectional fibre composites (a) schematic diagram (b)
vacuum suction chamber (c) sample preparation
Resin inlet Vacuum port
Flexible vacuum bag
Adhesive tape
Perforated film
Unidirectional fibre Bottom glass plate
Top glass plate
(a)
(b) (c)
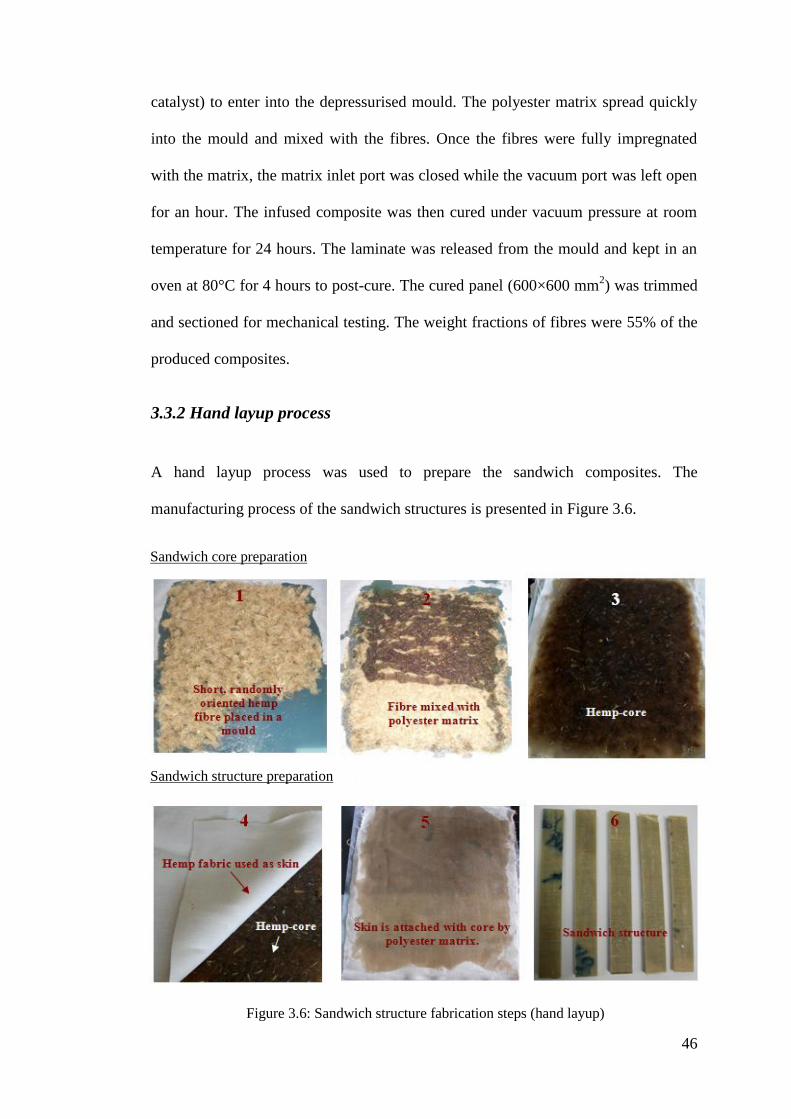
46
catalyst) to enter into the depressurised mould. The polyester matrix spread quickly
into the mould and mixed with the fibres. Once the fibres were fully impregnated
with the matrix, the matrix inlet port was closed while the vacuum port was left open
for an hour. The infused composite was then cured under vacuum pressure at room
temperature for 24 hours. The laminate was released from the mould and kept in an
oven at 80°C for 4 hours to post-cure. The cured panel (600×600 mm2) was trimmed
and sectioned for mechanical testing. The weight fractions of fibres were 55% of the
produced composites.
3.3.2 Hand layup process
A hand layup process was used to prepare the sandwich composites. The
manufacturing process of the sandwich structures is presented in Figure 3.6.
Figure 3.6: Sandwich structure fabrication steps (hand layup)
Sandwich core preparation
Sandwich structure preparation

47
The processing of sandwich structures involved two stages of sample preparations.
First, the sandwich cores were prepared. During the core manufacturing process, a
flat carbon steel sheet was used as a mould. The mould was waxed several times with
a mould releasing agent. Hemp fibres (chopped into 5–10 mm lengths) were laid
over the mould and the polyester matrix (with 1.5% MEKP) was spread over the
fibre carefully to ensure maximum fibre matrix wetting. A roller brush was used in
the fibre-matrix mixing process. Extreme care was taken to achieve a uniform matrix
distribution throughout the fibre cross-sections in the sample. The fibre content was
20% of the weight of the produced samples. The samples were kept at room
temperature overnight then post cured at 80°C for 4 hours. The cured composite
sample was used as a hemp core (thickness = 3.5 mm) for the sandwich composites.
In the second stage, sandwich skins were prepared by using hemp woven fabrics.
Woven fabrics were placed on the waxed mould and wet with the polyester matrix.
The hemp cores were then placed between the wetted fabrics. A roller brush was
used to remove excess matrix from the samples. The whole assembly was covered
with another flat mould to achieve uniform surface finishing on both sides of the
sandwich structure. The samples were kept at room temperature overnight followed
by post curing at 80°C for 4 hours. One layer of woven fabric was used to prepare
sandwich skin (thickness 0.75 mm/layer). The overall thickness of the prepared
sandwich structure was 5 mm.
3.4 Structure and microstructure analysis
3.4.1 Fourier Transform InfraRed (FTIR) spectroscopy analysis

48
FTIR spectroscopy is an effective analytical tool for used in identifying functional
groups present in fibre structures. In FTIR, InfraRed radiation passes though the
sample. The bonds present within the functional groups absorb the radiation energy
and vibrate with different frequencies (strong/weak), depending on the strength of
the bonds. The energy absorption produce peaks corresponding to vibration
frequencies and a molecular fingerprint of the samples are generated. The sample
fingerprint presents an IR transmission (absorbance) versus frequency curve to
explain the molecular structure of the fibre. Each molecule has a unique combination
of bonds that produce peaks at specific frequencies. The size and shape of the peaks
indicate the amount of materials present in the fibre (Smith 2009; Stuart 2005).
Figure 3.7 shows a typical FTIR spectrum for hemp fibres. The peak appears at
certain frequencies from which the existence of fibre constituents can be identified.
An FTIR analysis on the fibre constituents of treated and untreated fibre samples
were carried out using a Thermo Nicolet FTIR spectrometer Model Nexus. About
Figure 3.7: Typical FTIR spectrum of hemp fibre
400140024003400
Ab
sorb
ance
Frequency (cm-¹)
1214
, C-O
, C=O
(lig
nin)
1050
C-0,
C-H
(h
emic
ell
ulos
e)
1430
C-H
(cel
lulo
se)
1650
OH
(wat
er)
2901
C-H
(cel
lulo
se)

49
3mg of fibres was crushed into small particles and mixed with KBr (potassium
bromide) and pressed into a disc. The FTIR spectra were recorded at wave numbers
from 400 to 4000 cm-1
with 4 cm-1
resolution. An average of 64 scans was recorded
for each spectrum. A background spectrum of KBr (without sample) was measured
to determine a relative scale for absorption intensity. The background spectrum was
compared to the spectrum with sample in KBr to determine a resultant spectrum
which had no instrumental character. Thus, the presented spectrum is produced only
from the fibre sample.
3.4.2 Optical microscopy analysis
Optical microscopy (OM) was used in measuring fibre dimensions and composite
failure surfaces. The Olympus BX41 with a CC12 soft imaging system was used to
collect images. Figure 3.8a presents a typical OM image of a fibre surface along its
length from which fibre widths can be measured. Figure 3.8b presents a typical fibre
cross-section from which fibre diameters can be measured. Figure 3.8c shows a
failure surface of a composite sample where matrix cracking and fibre failures can
easily be identified to analyse composite failure modes.
(a)
(b)

50
3.4.3 Scanning Electron Microscopy (SEM) analysis
Fibre surface morphology and the extent of fibre matrix interface bonding was
analysed through SEM. Figure 3.9 shows SEM micrographs of a single fibre surface
and the embedded fibre in a matrix.
Figure 3.9: SEM images of (a) fibre surface (b) fibre embedded in a matrix
(a) (b)
Fibre
Matrix
Figure 3.8: Typical OM images of (a) sing fibre surface (b) cross-sectional area of the fibre
(c) composites failure surface
(c)
Matrix
failure
Fibre
failure

51
SEM produces electrons which were spread over the sample. The electronic ray
reacts with the sample, generating several types of signals. The intensity of the
signals varies according to the sample size. The signals were collected by a detector
and their output synchronised in a picture form.
SEM Model JSM-6400F (JEOL, Japan) was used to investigate fibre surface
conditions (20 kV) of different chemically-treated fibres and their bonding with the
matrix (5 kV). Samples were placed on aluminium discs using double-sided
electrically conductive adhesive tape. A conductive layer of carbon was spread on
the samples‘ surfaces to prevent electronic charge formation. The samples were then
placed in a vacuum chamber and coated with 20-30 angstroms of aluminium. A high
voltage was applied on the coated samples and output images were collected for
analysis.
3.5 Thermal property analysis
3.5.1 Thermogravimetric Analysis (TGA)
TGA was used to determine the thermal stability of the fibre. Fibre constituents have
different thermal reactivities and decompose at different temperatures. TGA analysis
on treated fibres was carried out by a thermal gravimetric analyser (TGA-Model No.
Q500). Between 6 mg to 10 mg of fibres was taken for analysis. Fibre samples were
heated between the temperature range of 10°C to 500°C at a rate of 10°C/min.
Experiments were carried out in a helium medium (60 ml/min) and the weight was
recorded as a function of increasing temperature. A differential thermogravimetric
analysis (DTGA) curve was collected from the TGA analysis. The heating conditions
were constant for all treated fibre samples.

52
Figure 3.10 presents a typical TGA thermograph for hemp fibres. From the curve,
different stages of weight loss of the fibre can be identified during the heating
process. The weight loss stages were used to analyse the thermal decomposition
process of the fibre.
3.5.2 Differential Scanning Calorimetry (DSC)
DSC analysis is used to determine the thermal energy released or absorbed via
chemical reactions of the fibre constituents during heating. A series of exothermic
and endothermic reactions take place during sample decomposition at different
temperatures (Menczel, et al. 2009). The magnitude and location of the exothermic
and endothermic peaks indicate the thermal phase transformation of the fibre. In the
case of an endothermic event, heat is absorbed by the sample, whereas heat is
released in an exothermic event. Endothermic reactions provide information on
sample melting, phase transitions, evaporation, dehydration and pyrolysis.
Figure 3.10: Typical (a) TGA and (b) DTGA curve of hemp fibre
20
45
70
95
0 100 200 300 400 500
Weig
ht lo
ss (
%)
Temperature ( C)
char formation
major weight loss
0
0.3
0.6
0.9
1.2
150 200 250 300 350 400 450 500
Deri
v. w
eig
ht (%
/ C
)
Temperature ( C)
Major degradation temperature (cellulose, hemicellulose and lignin
degrade)
(a) (b)

53
Exothermic reactions provide information on crystallisation, oxidation, combustion,
decomposition and chemical reactions (Ball, McIntosh & Brindley 2004).
DSC analysis on treated fibres was performed by using a thermal analyser (DSC
Instrument, Model No. Q100). Sample preparation and heating rate were applied in
the same manner as seen in TGA. The experiment was conducted in a nitrogen
environment purged at 20 ml/min. Nitrogen was used for efficient heat transfer and
removal of volatiles from the sample.
Figure 3.11 shows a typical DSC curve for hemp fibres. Several endothermic and
exothermic peaks at different temperatures can be identified from the curve. These
were used to analyse the thermal stability of fibres.
Figure 3.11: Typical DSC curve of hemp fibre
-18
-13
-8
-3
2
0 100 200 300 400
Heat fl
ow
(W
/g)
Temperature ( C)
Endothermic

54
3.6 Mechanical property testing
3.6.1 Tensile test
Tensile tests were carried out on single hemp fibres, polyester matrix and
unidirectional fibre composites. A dynamic mechanical analyser (DMA), Model
Q800 was used for single fibre testing. A 100 kN INSTRON Universal testing
machine (MTS) was used for matrix and composite testing.
Single fibre tensile test
Single hemp fibre tensile testing was performed under a controlled ambient
temperature of 30°C. DMA was operated in a stress-strain tension mode and the
ramp force rate was 0.5 N/min. All test fibres were wrapped around mandrels with
adhesive (3M super 77 multipurpose spray) and cured at room temperature for 24
hours. The wrapped fibres were then gripped in the DMA film/fibre grip from two
sides with a 10 mm gauge length maintained between them. Fibres were stretched at
a constant strain rate until failure. Figure 3.12 shows a mandrel wrapped specimen
gripped in DMA. Ten specimens of each sample were tested.
Fibre is wrapped
around the mandrel
Tensile loaded
single fibre
Fibre grip
Fibre failure
Figure 3.12: Mandrel wrapped fibre sample mounted in DMA

55
The tensile strength was determined by dividing the applied load by the average
cross-section diameter (methods of measurement are described in Chapter 5) of the
fibres. Strain was measured by the change in fibre length. A typical tensile stress–
strain curve of a single fibre is given in Figure 3.13. The modulus of elasticity was
calculated from the linear portion of the curve.
Matrix and composite tensile test
The polyester matrix specimens were prepared in a dog-bone shape. At the gage
region the specimen width was 10 mm and thickness was 4 mm (Figure 3.14a). For
the composite sample, rectangular flat specimens were used. The ends of the
specimens were carefully attached with the tabs using epoxy glue (Epiglue - 2 Part
Epoxy Glue) cured at room temperature for 24 hours (Figure 3.14b). The tabs were
used to prevent specimen slippage and premature fracture at the gripping area. The
test set-up and instrumentation is presented in Figure 3.14c.
Figure 3.13: Typical stress-strain curve of a single hemp fibre
0
50
100
150
200
250
0 0.05 0.1 0.15
Sin
gle
fib
re ten
sile
str
ength
(M
Pa)
Strain
Maximum strength = 234 MPa,
Modulus = 2.5 GPa, Failure
strain = 0.14

56
Tensile testing of the polyester matrix and long and unidirectional fibre reinforced
composites were performed following the ISO 527 test standard. A load was applied
to the specimen (parallel to the fibre direction) at a rate of 2 mm/min, and strain in
the specimen during loading was monitored using a laser extensometer. Six
specimens were tested for each sample. Figure 3.15 is a sample of the stress-strain
curve from the tensile test from which specimen‘s maximum strength, modulus and
failure strain can be obtained.
Figure 3.15: Typical tensile stress-strain curve of polyester matrix
0
15
30
0 0.002 0.004 0.006 0.008 0.01
Ten
sile
str
en
gth
(M
Pa)
Strain
Polyester resin, max tensile strength = 31 MPa,
modulus = 3.16 GPa, failure strain = 9.8 10-3
Figure 3.14: Tensile specimens (a) matrix (b) composite (c) test setup
250mm
25mm
25mm
(a) (b) (c)
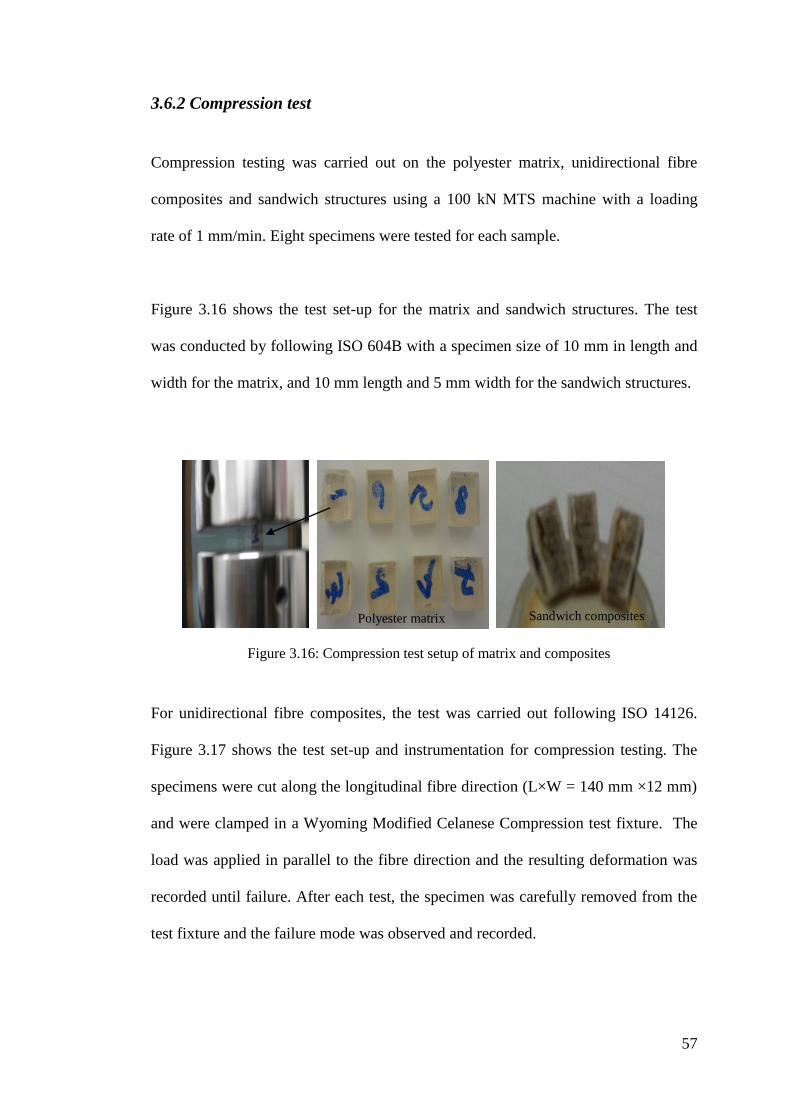
57
3.6.2 Compression test
Compression testing was carried out on the polyester matrix, unidirectional fibre
composites and sandwich structures using a 100 kN MTS machine with a loading
rate of 1 mm/min. Eight specimens were tested for each sample.
Figure 3.16 shows the test set-up for the matrix and sandwich structures. The test
was conducted by following ISO 604B with a specimen size of 10 mm in length and
width for the matrix, and 10 mm length and 5 mm width for the sandwich structures.
For unidirectional fibre composites, the test was carried out following ISO 14126.
Figure 3.17 shows the test set-up and instrumentation for compression testing. The
specimens were cut along the longitudinal fibre direction (L×W = 140 mm ×12 mm)
and were clamped in a Wyoming Modified Celanese Compression test fixture. The
load was applied in parallel to the fibre direction and the resulting deformation was
recorded until failure. After each test, the specimen was carefully removed from the
test fixture and the failure mode was observed and recorded.
Figure 3.16: Compression test setup of matrix and composites
Polyester matrix Sandwich composites

58
Figure 3.18 shows a sample stress-strain curve from the compression test. The
sample deformed elastically, followed by plastic deformation. After they reached
maximum strength, the materials failed either by fibre buckling, matrix cracking or
fibre-matrix debonding. In the case of the sandwich structures, the failure could be
due to either core crushing, skin delamination or shear crimping, or any combination
of these.
Figure 3.17: Compressive test setup of unidirectional fibre composites
0
10
20
30
40
50
60
70
0 0.02 0.04 0.06 0.08
Co
mp
ress
ive
stre
ng
th (
MP
a)
Strain (mm)
Long unidirectional fibre
composite max strength = 66
MPa, modulus = 4.4 GPa, failure
strain = 3.8 102
Figure 3.18: Typical compressive stress-strain curve of the unidirectional fibre composite

59
3.6.3 Shear test
Shear testing of the unidirectional fibre composite was conducted following the
ASTM D 5379. The specimen was loaded in a modified Iosipescu shear test fixture
and placed in a 10kN MTS machine. Six specimens were tested for each sample.
Load was applied perpendicular to the fibre direction at a constant rate of 2 mm/min.
The shear strength was determined by dividing the applied load by the area of the
cross section between the notches. Figure 3.19 shows the v-notch shear test setup of
unidirectional fibre composite.
3.6.4 Flexural test
Three point bending test
Flexural testing of the polyester matrix (following ISO 178), and unidirectional fibre
composites and sandwich structures (following ISO 14125) were conducted using a
10 kN MTS testing machine at a loading rate of 2 mm/min. The specimens were
simply supported and tested under 3-point loading with the span set at approximately
16 times the thickness of the specimen. Six specimens were tested for each sample.
The load was applied at mid-span of the specimens, perpendicular to the fibre
76 mm
20 mm
38 mm
11 mm
4.5 mm
45°
90°
Figure 3.19: V-notch shear test setup of the unidirectional fibre composite

60
direction. To determine the strength and elastic properties in bending the load and
mid-span deflection were recorded up to failure. The failure mode was also observed
after each test. Figure 3.20 shows the test setup for flexural testing. Before each test,
the loading pin was set to almost touch at the top surface of the specimen. The load
and specimen deflection were recorded up to failure to determine the strength and
elastic properties of the sandwich composites.
A sample of flexural stress-strain curves of the matrix and fibre composite are shown
in Figure 3.21. Based on the curve, the maximum flexural strength, modulus and
failure strain of the polyester matrix and fibre composites were determined.
Figure 3.20: Flexural (three point bending) test setup
a
a/2 a/2
Polyester matrix Unidirectional fibre composites
Sandwich composites

61
Four point bending test
Sandwich structures were tested under four point bending following ISO 14125 with
the same 10 kN MTS machine at the same cross-head speed of 2 mm/min. Figure
3.22 shows the test setup of sandwich structure shear test. Six specimens were tested
for each sample.
0
50
100
150
200
0 0.02 0.04 0.06
Fle
xu
ral st
ren
gth
(M
Pa)
Strain
Composite
Neat resin
Max strength = 191
MPa, modulus = 11
GPa, failure strain
= 0.035
Max strength = 80
MPa, modulus = 3
GPa, failure strain
= 0.026
Figure 3.21: Typical flexural stress-strain curves of the polyester matrix and unidirectional
fibre composite
Polyester matrix
Figure 3.22: Four-point bending (shear) test setup of sandwich structure
a
a/2 a/4 a/4

62
3.6.5 Impact test
The impact behaviour of the polyester matrix and unidirectional fibre composite was
tested through Charpy (without notches) impact testing by using an Instron Dynatup
impact tester. The experiment was conducted by following ASTM D 256. During
testing, the specimen (L×W = 160 mm × 20 mm) rested freely and an impactor
(projectile) was stuck at the centre of the specimen. The experimental setup and
instrumentation used is presented in Figure 3.23. Six specimens were tested for each
sample. The load was applied perpendicular to the fibre direction. The potential
impact energy was the product of impactor mass (6.05 kg), nominal drop height and
acceleration due to gravity.
Figure 3.23: Charpy impact test setup

63
A sample of the impact test curve is presented in Figure 3.24. From the curve, the
impact force, maximum impact energy, absorbed energy and rebounded energy of
the specimen can be measured.
0
0.25
0.5
0.75
1
0
50
100
150
200
250
0 10 20 30 40 50 60
Imp
act en
erg
y (
J)
Imp
act fo
rce (
N)
Time (ms)
Neat resin impact energy (maximum = 0.9 J,
absorbed = 0.47 J, rebounded = 0.43 J, damage
degree = 0.52
Matrix
Figure 3.24: A sample of impact test curve

64
Chapter 4: Effects of Chemical Treatments on Hemp Fibre
Structure
4.1 Introduction
The structure of hemp fibres consist of three main constituents, i.e. cellulose,
hemicellulose and lignin. These components of the fibres contribute to determining
the thermal and mechanical properties of the fibres. Fibre constituents are sensitive to
the actions of different chemical reagents, treatment times and temperatures.
In this study, alkali treatments on hemp fibres with different (0%, 4%, 6, 8% and
10%) NaOH concentrations were carried out. Alkalised fibres were further treated
with acetyl and silane chemicals. Fibre treatment methods were outlined in Chapter 3
(Section 3.2.1). The celluloses, hemicellulose and lignin constituents were separated
from the treated fibres (Chapter 3, Section 3.2.1). SEM, FTIR, TGA and DSC
analysis of these constituents was performed separately to develop a basic
understanding of the individual fibre constituent behaviours. These constituent
behaviours were used to systematically analyse treatment effects on fibre thermal
properties.
4.2 Result and discussion
4.2.1 Chemical analysis
The content of fibre constituents of different treated fibres are presented in Table 4.1.

65
Table 4.1: Amount of fibre constituents (weight %) presents in the treated fibres Fibre
treatments Alkalisation Alkalisation + Acetylation Alkalisation + Silanisation
%NaOH Cell* Hemicell
* Lignin Cell* Hemicell
* Lignin Cell* Hemicell
* 0 77.20 5.40 6.67 81.29 4.96 10.26 83.36 5.69
4 78.91 4.93 4.66 82.47 5.66 4.70 90.70 6.07
6 81.46 4.51 5.02 85.80 5.10 4.80 88.25 6.51
8 83.73 7.76 3.55 88.14 7.57 3.48 84.50 9.41
10 88.35 4.67 3.46 92.58 3.85 2.65 89.69 5.57
*Cell: cellulose; *Hemicell: hemicellulose
From Table 4.1 it can be observed that the hemicellulose and lignin contents were
decreased with higher concentrations of (4-10%) NaOH treatment compared to the
untreated fibres (0% NaOH). Removal of hemicellulose and lignin increased the
relative amount of cellulose contents on the treated fibres. These results indicate that,
NaOH treatments dissolved a portion of hemicellulose and lignin constituents from
the fibres.
Acetyl treatments on the untreated fibres reduced the hemicellulose contents but
increased the lignin contents. This indicates that hemicellulose initially reacted with
the acetyl groups, then the acetylated hemicellulose were deposited on the lignin
constituents. The effect of the treatments can, therefore, be expressed as a weight
percentage gained by the formation of acetyl linkages with the lignin. Therefore,
acetyl treatment on alkali pre-treated fibres showed that the amount of cellulose
contents were increased with higher concentrations of (4-10%) NaOH pre-treatment.
This was due to the extraction of more lignin in two consecutive treatment processes
as compared to the NaOH treated samples.
In the case of silane treatments, the amount of cellulose and hemicellulose was
increased compared to the untreated fibres. This may be due to the fact that silane

66
molecules formed couplings with the fibre constituents and were deposited on the
fibre surfaces which in turn contributed to the weight percentage gains of the fibres.
Similar results were also found for alkali pre-treated silanised fibre samples.
From the above discussion it can be stated that, alkali treatments have higher
reactivity in removing hemicellulose and lignin constituents from the fibre when
compared to the acetyl treatments, whereas silane treatments provide couplings with
the fibre constituents.
4.2.2 Fibre morphology analysis
Figure 4.1 shows SEM micrographs of untreated hemp fibres and its constituents i.e.
cellulose, hemicellulose and lignin. Images show that the cellulose microfibril
surface (Figure 4.1b) was the cleanest when compared with original fibre (Figure
4.1a). Hemicellulose (Figure 4.1c) and lignin (Figure 4.1d) were black in colour and
gummy in appearance. This indicated that hemp fibre structure consists of cellulose
microfibrils where the microfibril surfaces were covered with hemicellulose and
lignin constituents. From these micrographs it can be seen that the cellulosic fibre
surface (cellulose microfibrils) was covered by non-cellulosic constituents
(hemicellulose and lignin).

67
Figure 4.1: SEM micrograph of hemp (a) untreated fibre (b) cellulose microfibril (c)
hemicellulose (d) lignin
(a) (b)
(c) (d)

68
Figure 4.2: SEM micrograph of (a) alkalised (b) acetylated (c) silanised fibre surface
(a)
(b)
(c)
Covering layer
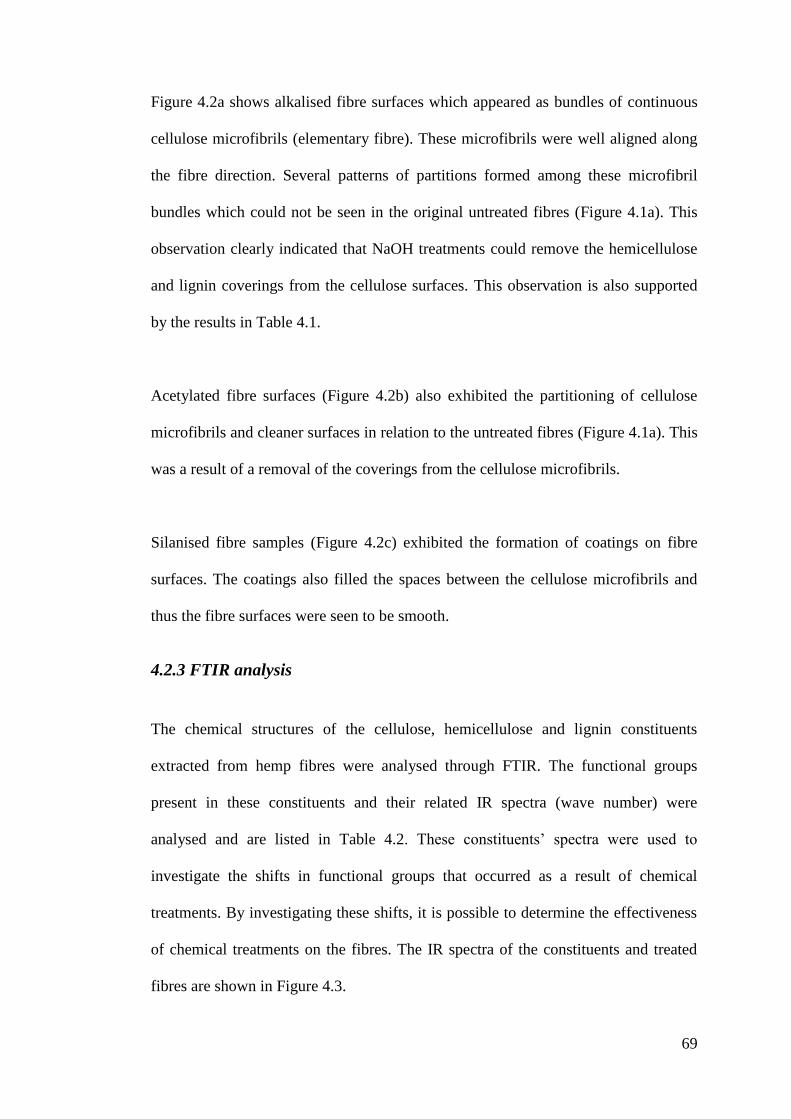
69
Figure 4.2a shows alkalised fibre surfaces which appeared as bundles of continuous
cellulose microfibrils (elementary fibre). These microfibrils were well aligned along
the fibre direction. Several patterns of partitions formed among these microfibril
bundles which could not be seen in the original untreated fibres (Figure 4.1a). This
observation clearly indicated that NaOH treatments could remove the hemicellulose
and lignin coverings from the cellulose surfaces. This observation is also supported
by the results in Table 4.1.
Acetylated fibre surfaces (Figure 4.2b) also exhibited the partitioning of cellulose
microfibrils and cleaner surfaces in relation to the untreated fibres (Figure 4.1a). This
was a result of a removal of the coverings from the cellulose microfibrils.
Silanised fibre samples (Figure 4.2c) exhibited the formation of coatings on fibre
surfaces. The coatings also filled the spaces between the cellulose microfibrils and
thus the fibre surfaces were seen to be smooth.
4.2.3 FTIR analysis
The chemical structures of the cellulose, hemicellulose and lignin constituents
extracted from hemp fibres were analysed through FTIR. The functional groups
present in these constituents and their related IR spectra (wave number) were
analysed and are listed in Table 4.2. These constituents‘ spectra were used to
investigate the shifts in functional groups that occurred as a result of chemical
treatments. By investigating these shifts, it is possible to determine the effectiveness
of chemical treatments on the fibres. The IR spectra of the constituents and treated
fibres are shown in Figure 4.3.

70
Table 4.2: Infrared transmittance peaks (frequency number, cm-1
) of fibre
constituents Assigned functional groups Frequency number References
Cellulose structure
The C-H bending of amorphous and crystalline cellulose
900, 1430
(Lojewska, et
al. 2005) The C-OH in plane stretching of cellulose
1373
(Yang, et al.
2007) Hemicellulose structure
The C-O and C-C stretching band of xylanes and C-O-C
stretching of the glycosidic linkage in hemicellulose
1050
(Wang, et al.
2010) The C-H bending and C-O stretching frequencies of
hemicellulose
1348, 1412, 1465
(Peng, et al.
2009) -OH bending mode principally related to the presence of
water in hemicellulose
1650
Acetyl and uronic ester groups attached to hemicellulose
1740
(Liu, et al.
2011) Lignin Structure
Aromatic C-H in plane deformation and C-O stretching of
lignin
1024
(Sun, et al.
2005) Aromatic ring breathing with C-O and C=O stretching of
lignin
1214
(Yang, et al.
2007) Conjugated carbonyl groups of hydroxycinnamic acids
1713
(Sun, et al.
2005) C-H stretching in aromatic methoxyl group and
methylene group
2920

71
Generally, cellulose structures consist of carbonyl, carboxyl and aldehyde groups.
Hemicellulose structures consist of a number of different polysaccharides, where
extensive hydrogen bonding is present between individual polysaccharides (Bjerre,
Schmidt & Riso 1997). These polysaccharides contain xylanes, xylose, arabinose,
glucose, galactose, mannose and ketone groups. Xylanes are linked together by
glycosidic bonds and are attached to a number of arabino and glucuronic acid
residues (Peng, et al. 2009). Lignin is a highly branched aliphatic and phenolic
structure which contains aromatic syringyl, guaiacyl, hydroxycinnamic, methoxyl
and methylene groups. It is tightly linked to polysaccharides in the cell wall by ether
linkages of the alcoholic hydroxyl groups or ester linkages of the cinnamic acid unit
Figure 4.3: FTIR spectra of fibre constituents and treated fibres
2900
2920
1430
1550
1650 1
740
896
1024
1214 1512
1712
1373
1348
900
Frequency (cm-1)
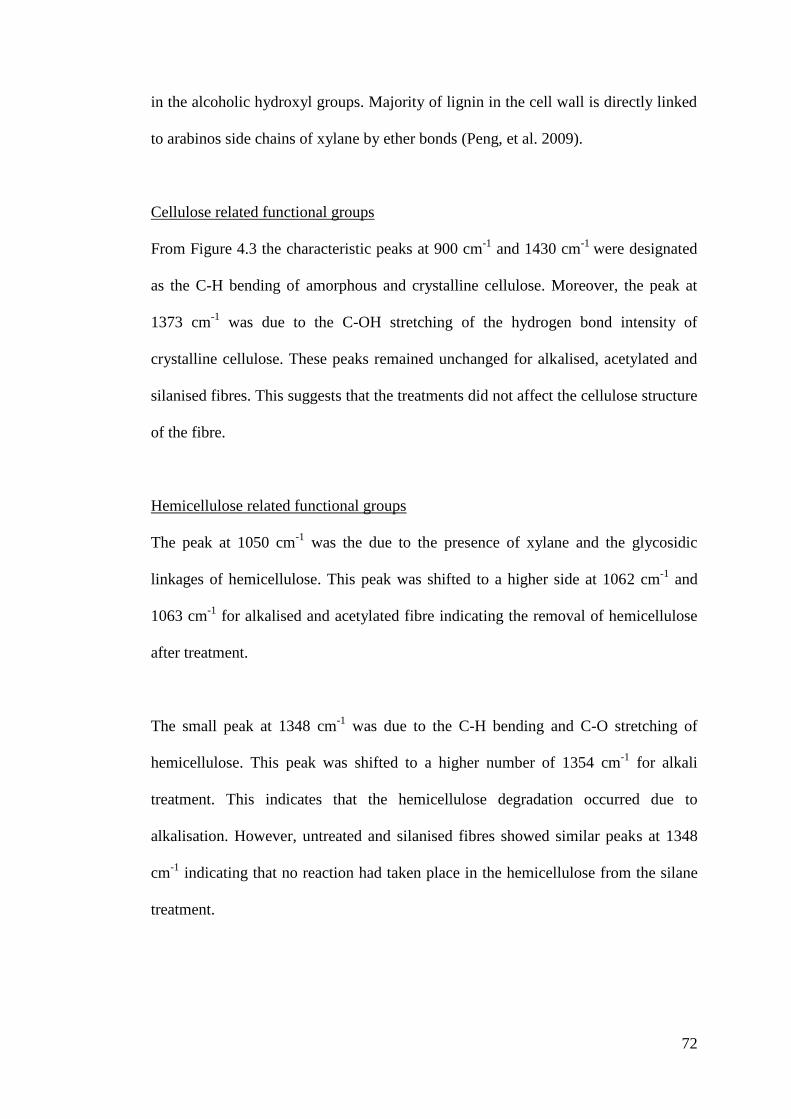
72
in the alcoholic hydroxyl groups. Majority of lignin in the cell wall is directly linked
to arabinos side chains of xylane by ether bonds (Peng, et al. 2009).
Cellulose related functional groups
From Figure 4.3 the characteristic peaks at 900 cm-1
and 1430 cm-1
were designated
as the C-H bending of amorphous and crystalline cellulose. Moreover, the peak at
1373 cm-1
was due to the C-OH stretching of the hydrogen bond intensity of
crystalline cellulose. These peaks remained unchanged for alkalised, acetylated and
silanised fibres. This suggests that the treatments did not affect the cellulose structure
of the fibre.
Hemicellulose related functional groups
The peak at 1050 cm-1
was the due to the presence of xylane and the glycosidic
linkages of hemicellulose. This peak was shifted to a higher side at 1062 cm-1
and
1063 cm-1
for alkalised and acetylated fibre indicating the removal of hemicellulose
after treatment.
The small peak at 1348 cm-1
was due to the C-H bending and C-O stretching of
hemicellulose. This peak was shifted to a higher number of 1354 cm-1
for alkali
treatment. This indicates that the hemicellulose degradation occurred due to
alkalisation. However, untreated and silanised fibres showed similar peaks at 1348
cm-1
indicating that no reaction had taken place in the hemicellulose from the silane
treatment.

73
The peak at 1650 cm-1
was due to the presence of bonded water in hemicellulose. For
acetylated fibres, this peak shifted to a lower number of 1623 cm-1
compared to the
untreated fibres (1650 cm-1
). This indicates the removal of bonded water from the
hemicellulose as a result of the acetyl treatments.
The characteristics‘ peak at 1740 cm-1
was due to substantial acetyl and uronic ester
groups becoming attached to the hemicellulose. This peak was not present in the
alkalised fibres. The removal of hemicellulose from the fibre surfaces caused this
peak to disappear.
Lignin related functional groups
The characteristics peak at 1024 cm-1
was assigned to the aromatic C-H in plane
deformation and C-O stretching in primary alchohols (guaiscyl) of lignin. For alkali
and acetyl treatments these peaks increased by 12 cm-1
and 8 cm-1
respectively. This
indicated that lignin was removed from the treated fibres. However, for silane treated
fibres, a similar peak as the untreated fibres appeared at this region. This indicates
that there was no reaction between lignin and silane chemicals.
The peak at 1214 cm-1
was due to the aromatic ring breathing with C-O and C=O
stretching in condensed guaiacyl units of lignin. This band was shifted to a lower
number at 1210 cm-1
, 1208 cm-1
and 1205 cm-1
for alkali, acetyl and silane
treatments respectively, indicating that treatments caused the degradation of a portion
of lignin.

74
The peak at 1713 cm-1
originated from conjugated carbonyl stretching due to the
presence of hydroxycinnamic acids associated with the alcoholic polysaccharides of
lignin. For alkali treated fibres, this peak disappeared due to the removal of lignin.
Untreated fibres showed a C-H stretching peak at 2918 cm-1
. Lignin also showed a
strong peak at 2920 cm-1
. This indicates that C-H stretching of lignin aromatic
hydrocarbon, methoxyl and methylene groups of lignin had taken place. In the case
of alkalised and acetylated fibres, these peaks shifted to 2910 cm-1
and 2916 cm-1
compared to the untreated fibres. This indicated that the alkalisation and acetylation
removed lignin constituents. However, the silane had no reactivity with the lignin
constituents as it had a similar peak to the untreated fibre.
From the above analysis it can be concluded that, alkali and acetyl treatments had a
degree of reactivity in removing hemicellulose and lignin constituents from the fibre.
However, silane treatments did not show any reactivity on the fibre constituents as
there were no changes of FTIR spectra as compared to the untreated fibres.
4.2.4 TGA analysis
Thermo gravimetric analysis (TGA) was used to measure the weight loss of fibres as
a function of rising temperature. The weight loss in fibres occurs due to the
decomposition of cellulose, hemicellulose and lignin constituents during heating.
Higher decomposition temperatures give greater thermal stability (Kim & Eom 2001;
Manikandan, Thomas & Groeninckx 2001). In this study, TGA analysis was first
carried out on cellulose, hemicellulose and lignin constituents and then compared

75
with untreated fibres. TGA analysis was also carried out on the treated fibres to
determine the effect of treatment on fibre.
The fibre degradation process was divided into four stages: moisture evaporation,
hemicellulose degradation, cellulose degradation and lignin decomposition. Moisture
presents in the fibre in two forms: free water and linked water. Free water attached
on the fibre surface and evaporates at lower temperature (25-150°C). The linked
water form chemical bonds with the hydroxyl groups presented in hemicellulose and
lignin, and evaporate at higher temperatures (Randriamanantena, et al. 2009). After
the removal of free water, between the temperature ranges of 150-500°C, the
degradation process begins in the cellulose, hemicellulose, lignin constituents and the
associated linked water (Kim & Eom 2001).
TGA analysis of cellulose, hemicellulose and lignin constituents
The decomposition behaviour of fibre constituents and untreated fibre are presented
in Figure 4.4.
Cellulose
From Figure 4.4a it can be observed that the cellulose decomposition process (weight
loss) was very mild until around 250°C. Then a sharp and large weight loss occurred
at about 350°C. At these temperature ranges (250-350°C) the cellulose was entirely
decomposed due to the breaking down of its molecular structures. The degradation
temperature of cellulose was higher than the hemicellulose (25-290°C) and lignin
(150-420°C). This was due to the fact that most of the cellulose structure was
crystalline, which is strong and resistant to hydrolysis. The crystalline structure

76
contained strong intramolecular and intermolecular hydrogen bonding which
required higher energies to be broken down (Placet 2009; Tajeddin, et al. 2009;
Thakur & Singha 2010). Derivative of TGA curves (Figure 4.4b) show the
degradation of cellulose is at about 320°C.
Hemicellulose
The decomposition of hemicellulose began at lower temperatures compared to
cellulose and lignin. The thermograph of hemicellulose presented three stages of
Figure 4.4: (a) TGA (b) DTGA curves of fibre constituents and untreated fibre
(a)
(b)
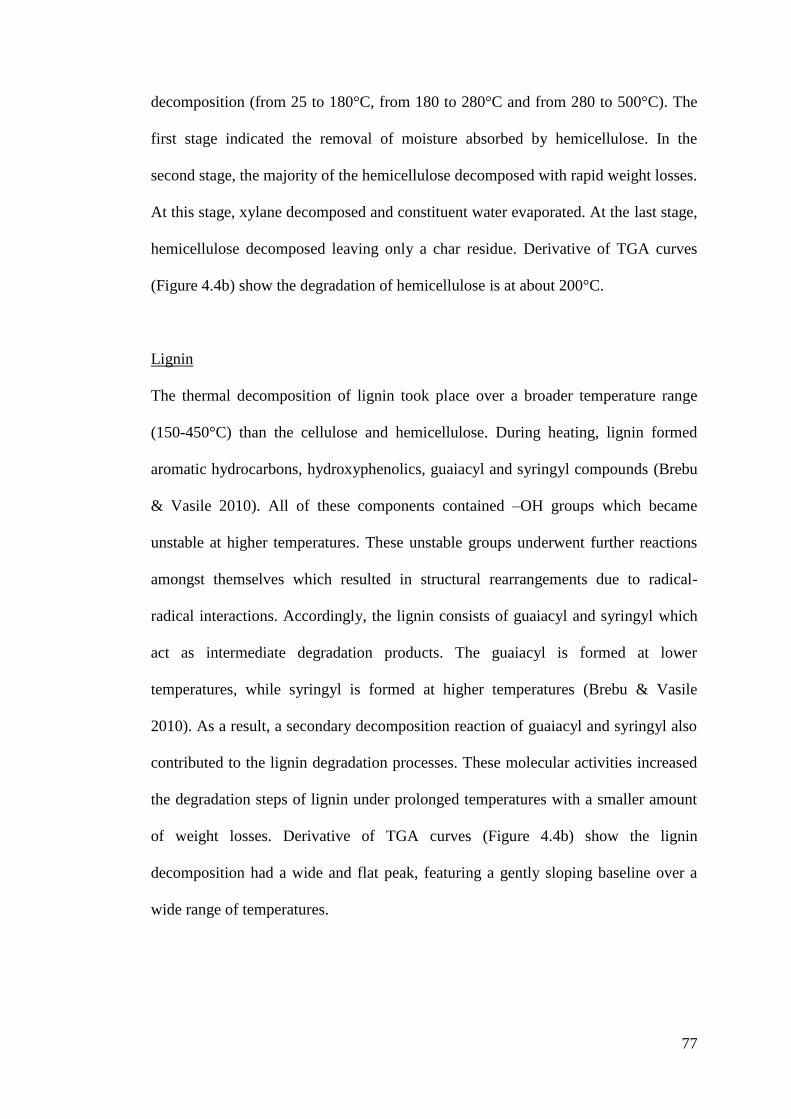
77
decomposition (from 25 to 180°C, from 180 to 280°C and from 280 to 500°C). The
first stage indicated the removal of moisture absorbed by hemicellulose. In the
second stage, the majority of the hemicellulose decomposed with rapid weight losses.
At this stage, xylane decomposed and constituent water evaporated. At the last stage,
hemicellulose decomposed leaving only a char residue. Derivative of TGA curves
(Figure 4.4b) show the degradation of hemicellulose is at about 200°C.
Lignin
The thermal decomposition of lignin took place over a broader temperature range
(150-450°C) than the cellulose and hemicellulose. During heating, lignin formed
aromatic hydrocarbons, hydroxyphenolics, guaiacyl and syringyl compounds (Brebu
& Vasile 2010). All of these components contained –OH groups which became
unstable at higher temperatures. These unstable groups underwent further reactions
amongst themselves which resulted in structural rearrangements due to radical-
radical interactions. Accordingly, the lignin consists of guaiacyl and syringyl which
act as intermediate degradation products. The guaiacyl is formed at lower
temperatures, while syringyl is formed at higher temperatures (Brebu & Vasile
2010). As a result, a secondary decomposition reaction of guaiacyl and syringyl also
contributed to the lignin degradation processes. These molecular activities increased
the degradation steps of lignin under prolonged temperatures with a smaller amount
of weight losses. Derivative of TGA curves (Figure 4.4b) show the lignin
decomposition had a wide and flat peak, featuring a gently sloping baseline over a
wide range of temperatures.

78
From the above analysis it was observed that the amount of moisture evaporation of
hemicellulose was much higher than the cellulose and lignin. Due to this, the
hydrophilic nature of the fibre was predominantly caused by the presence of
hemicellulose. The major fibre decomposition was caused in the second stage where
large weight losses were recorded. This was primarily caused by the decomposition
of hemicellulose and partly by the lignin degradation. The decomposition
temperature of cellulose was much higher than hemicellulose and lignin.
TGA analysis of treated fibres
Alkalised fibres
Figure 4.5a shows the TGA thermographs of alkalised fibre samples. The alkalised
(4-10% NaOH) fibres showed higher decomposition temperatures compared to the
untreated fibres (0% NaOH). For the main fibre decomposition region (250-350°C),
the alkalised fibres had less weight loss than the untreated fibres. These results
indicate that alkali treatments removed portions of hemicellulose and lignin
constituents from the fibre. Due to this, the decomposition process mainly occurred
on the cellulose which in turn increased the overall degradation temperature of the
treated fibres.

79
DTGA (Figure 4.5b) curves also showed a lower temperature peak at around 240°C
for untreated fibres which corresponded with the decomposition of hemicellulose.
For the treated fibres, this peak was not visible, indicating the removal of
hemicellulose from the fibre. In addition, a large peak at a temperature around 320°C
was due to cellulose and lignin decomposition. At this stage, all the treated fibres
showed higher decomposition temperatures compared to the untreated fibres. This
again proved that hemicellulose and lignin were removed from the treated fibres.
(a)
(b)
Figure 4.5: (a) TGA and (b) DTGA curves of alkalised fibres
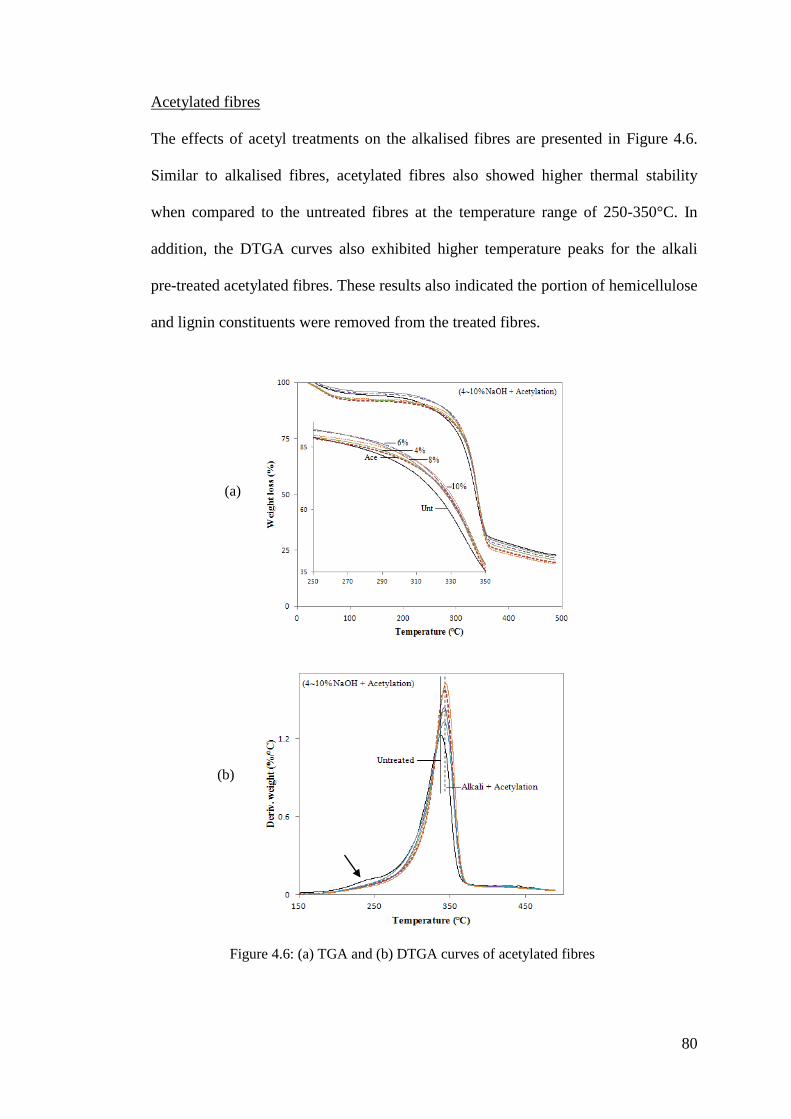
80
Acetylated fibres
The effects of acetyl treatments on the alkalised fibres are presented in Figure 4.6.
Similar to alkalised fibres, acetylated fibres also showed higher thermal stability
when compared to the untreated fibres at the temperature range of 250-350°C. In
addition, the DTGA curves also exhibited higher temperature peaks for the alkali
pre-treated acetylated fibres. These results also indicated the portion of hemicellulose
and lignin constituents were removed from the treated fibres.
(a)
(b)
Figure 4.6: (a) TGA and (b) DTGA curves of acetylated fibres

81
Silanised fibres
The effects of silane treatments on the alkalised fibres are presented in Figure 4.7.
From Figure 4.7b it can be observed that silane treatments on the 0% NaOH treated
fibres exhibited a hemicellulose peak at around 240°C, similar to the original
untreated fibres. This indicated that silane treatments were not capable of removing
hemicellulose from the fibre. Instead, silane molecules formed couplings with the
hemicellulose and lignin constituents of the fibre. These chemical couplings acted as
a covering layer on the fibre surface (Figure 4.2c). This silane covering protected the
fibre from thermal decomposition at higher temperatures. These actions prevented
the breakdown of the fibre‘s molecular structure thus enhancing the overall thermal
stability of the silane treated fibres at higher temperatures (250-350°C) compared to
the untreated fibres. Therefore, hemicellulose peaks for alkali pre-treated silanised
fibres were not observed, indicating that the initial NaOH pre-treatment removed the
hemicellulose from the fibre. The further silane coverings on the pre-treated fibres
enhanced the thermal resistance at 250-350°C thus increasing the decomposition
temperatures.
(a)

82
From the above analysis it can be stated that, alkali and acetyl treatments removed a
portion of hemicellulose and lignin constituents from the fibre thus exhibiting a
higher thermal stability at a temperature range of 250-350°C. However, silane
molecules formed couplings with hemicellulose and lignin which prevented thermal
decomposition of fibre constituents thus improving the fibres‘ thermal stability.
4.2.5 DSC analysis
DSC analysis allowed for the detection of phase transformation during the heating of
fibre. Cellulose, hemicellulose and lignin constituents showed separate peaks of
decomposition which appeared through the sequence of endothermic and exothermic
peaks of phase transformation at defined temperatures (Reh, Kraepelin & Lamprecht
1986). Ball, McIntosh & Brindley (2004) reported that the endothermal reactions
occurred due to the volatilisation (gases) of the molecules, whereas exothermal
reactions occurred due to the formation of charring (solid residue). In this study,
DSC analysis was first carried out on the cellulose, hemicellulose and lignin
Figure 4.7: (a) TGA and (b) DTGA curves of silanised fibres
(b)

83
constituents and then compared with untreated fibres. DSC analysis was also carried
out on the treated fibres to determine the effect of treatment on fibre.
DSC analysis of cellulose, hemicellulose and lignin constituents
The decomposition behaviour of fibre constituents and untreated fibre are presented
in Figure 4.8.
Cellulose
The DSC curve of cellulose exhibited an endothermic event at the temperature range
of 10-150°C. Heat absorbed in this endothermic region was due to the evaporation of
water (volatilisation) in the intercellular region of the fibre. Generally, free water was
removed easier than the linked water (attached to the cellulose). Linked water
requires higher temperatures (about 100°C) to be removed (MonteiroI, et al. 2010).
In the temperature range of 315-360°C one broad endothermic event occurred and a
small exothermic event took place at around 360°C. In the endothermic event,
depolymerisation of cellulose had taken place with the formation of volatiles. The
depolymerisation process also generated cellulose char residue via exothermic
reactions. This behaviour was supported from the reported information that the
cellulose structure did not completely decompose until the temperature had reached
340°C (Kim & Eom 2001).
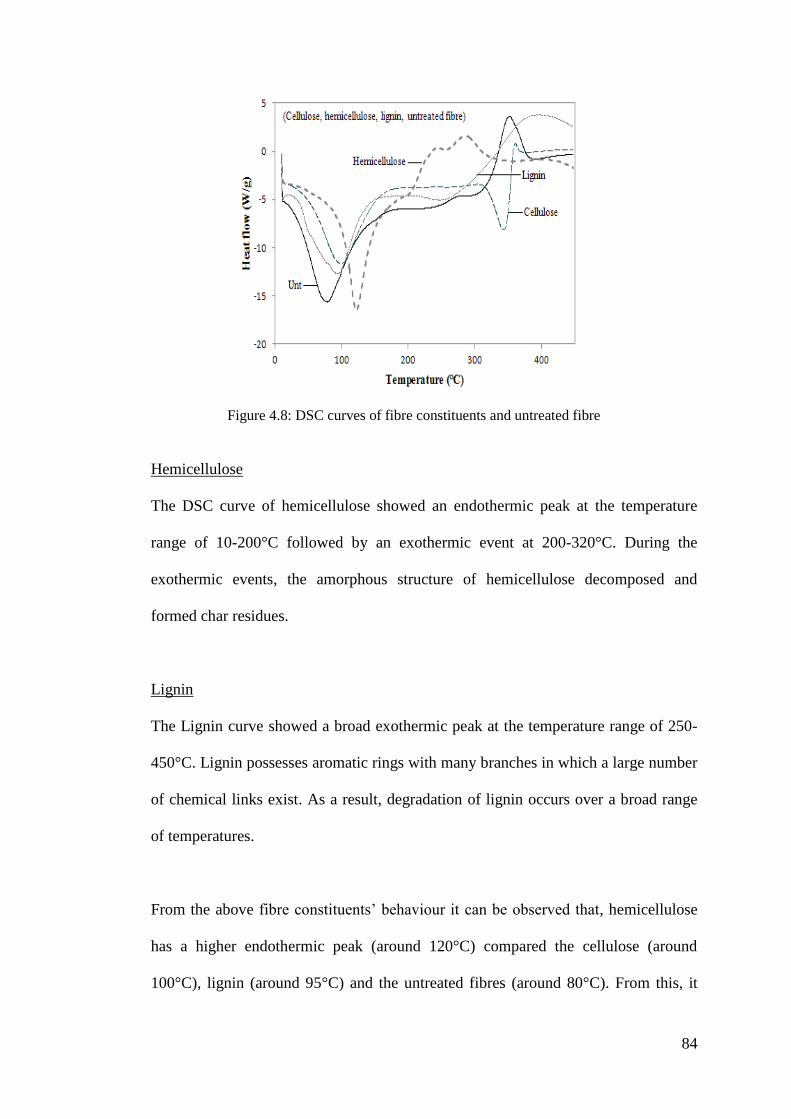
84
Hemicellulose
The DSC curve of hemicellulose showed an endothermic peak at the temperature
range of 10-200°C followed by an exothermic event at 200-320°C. During the
exothermic events, the amorphous structure of hemicellulose decomposed and
formed char residues.
Lignin
The Lignin curve showed a broad exothermic peak at the temperature range of 250-
450°C. Lignin possesses aromatic rings with many branches in which a large number
of chemical links exist. As a result, degradation of lignin occurs over a broad range
of temperatures.
From the above fibre constituents‘ behaviour it can be observed that, hemicellulose
has a higher endothermic peak (around 120°C) compared the cellulose (around
100°C), lignin (around 95°C) and the untreated fibres (around 80°C). From this, it
Figure 4.8: DSC curves of fibre constituents and untreated fibre

85
can be stated that hemicellulose absorbs more water compared to the other
constituents of the fibre. This may be due to the fact that the structure of
hemicellulose consists of rich amorphous branches of hydroxyl groups that link with
water molecules from the atmosphere.
Exothermal peaks of cellulose (around 360°C), hemicellulose (200-320°C) and lignin
(250-450°C) indicate that hemicellulose and lignin generate higher solid residues
(char) compared to cellulose. These results were also supported by the TGA curves
(Figure 4.4a) in which the weight of solid residue (400-500°C) was higher for
hemicellulose and lignin compared to the cellulose. Based on this, it can be stated
that hemicellulose begins to degrade earlier than lignin and cellulose. Cellulose
possesses higher thermal stability and lignin decomposes over broad temperature
ranges. These decomposition mechanisms of fibre constituents were used to analyse
the behaviour of treated fibres.
DSC analysis of treated fibres
Alkalised fibres
Figure 4.9 shows DSC curves of alkalised fibres. Alkalised fibres (6-10% NaOH)
showed a higher endothermic peak (around 100°C) for water evaporation compared
to the untreated fibres (around 80°C). This result indicates that the treatment
removed hemicellulose from the fibre. However, the endothermic peak of 4% NaOH
treated fibre took place at the same temperature (around 80°C) as untreated fibres.
This indicates that 4% NaOH concentration was not strong enough to remove
hemicellulose from the fibre.

86
A small exothermic peak (arrow mark) appeared at the temperature range of 250-
290°C for untreated fibres. This peak was mainly due to the decomposition of
hemicellulose and a portion of lignin degradation. This exothermic peak disappeared
from the alkali treated fibres indicating that greater amount of hemicellulose and
lignin were removed from the fibre.
Untreated fibres showed one strong exothermic peak at 300-400°C, whereas treated
fibre showed exothermic (390-380°C) and endothermic peaks (around 360°C) in this
region. The initial exothermic peak on treated fibres indicated complete
decomposition of the hemicellulose and the later endothermic peak indicated
decomposition of the cellulose. This exothermic peak differences between the
untreated and treated fibres gave further evidence of hemicellulose removes from the
fibre during alkali treatments.
Figure 4.9: DSC curves of alkalised fibres

87
Acetylated fibres
Figure 4.10 shows the effect of acetyl treatments on the alkalised fibres. The
acetylated fibres had higher endothermic peaks (90-110°C) compared to the
untreated fibres (80°C). Similar to alkalised fibres, acetylated fibres also exhibited
small exothermic and endothermic peaks at the temperature range of 310-380°C.
These results indicate that acetyl treatments also remove hemicellulose and a portion
of lignin constituents from the fibre.
Silanised fibres
Figure 4.11 shows the effect of silane treatments on the alkalised fibres. Silane
treatments on the untreated fibre exhibited a higher endothermic peak temperature
(around 110°C) compared to the untreated fibre. This was due to the fact that silane
molecules formed couplings with the hemicellulose and lignin constituents of the
fibre. The water molecules held by the hemicellulose were covered by the silane
coupling layers. As a result, removal of water molecules from the silane treated
Figure 4.10: DSC curves of acetylated fibres

88
fibres required higher temperatures. Therefore, silane treated fibres had similar a
DSC profile to untreated fibre at the temperature range of 230-450°C indicating the
presence of hemicellulose on the silanised fibres. All of these results indicate that,
hemicellulose and lignin remained on the silane treated fibres.
From the above analysis, it is confirmed that alkali and acetyl treatments on the
fibres remove hemicellulose and lignin constituents, whereas silane formed
couplings with these constituents and provided a covering on fibres protecting them
from thermal degradations.
4.3 Summary
Chemical treatments change fibre structures by reacting with its constituents.
Alkalisation and acetylation reduce the content of hemicellulose and lignin from the
fibre. These treatments also expose cellulose microfibrils on their fibre surface.
Whereas, silane treatments forms coverings on the fibre surfaces and fills the spaces
among the microfibrils.
Figure 4.11: DSC curves of silanised fibres

89
FTIR analysis shows that alkali and acetyl treatments remove hemicellulose and
lignin constituents from the fibre surface whereas silane has no reactivity with these
constituents.
Thermal analysis (TGA and DSC analysis) of fibre revealed that hemicellulose is the
most reactive constituent and decomposes early. Cellulose is more thermally stable
and lignin decomposes under a wide temperature range. Treated fibres show higher
thermal stability compared to the untreated fibres.

90
Chapter 5: Chemical Treatments on Fibre Strength
5.1 Introduction
Among the three main structural constituents of hemp fibre, cellulose was the
primary load carrying component while hemicellulose and lignin acts as a binder to
hold the cellulose. Chemical treatments reacted with hemicellulose and lignin
constituents, and as a result reconfigured their proportions within the fibres. These
changes play a role in affecting fibre strengths. In this chapter, the effects of
chemical treatments on single fibre strength are discussed.
In single fibre tensile tests, accurate fibre diameter measurement is a particular
challenge. Unlike synthetic fibres, natural fibres have irregular shapes and textures
along their lengths. Single fibres consist of a bundle of elementary fibres. Cross-
sectional geometries of fibre bundles are generally not circular and diameters are not
uniform along their lengths. Also, there are inherent natural and artificial defects
within these fibres (Hu, et al. 2010). These factors contribute to the presence of
variations within natural fibres.
Accurate measurements of cross-sectional areas are essential for measuring the
tensile properties of single fibres. Different microscopic measurements have been
used to determine fibre diameter. Eichhorn & Young (2004) used SEM to measure
hemp fibre diameters with an assumption that the fibres had a circular cross section.
Devi, Bhagawan & Thomas (1997) used a stereo microscope to obtain pineapple

91
fibre diameters based on the same assumption. Considering circular cross-sections of
fibres may lead to an underestimation in the calculation of fibre tensile properties.
During tensile tests, particular attention must be given to the manner in which the
fibres are mounted in the apparatus to avoid the introduction of stress concentrations
at various locations on the grip. Also, load cells need to be sensitive enough to detect
small forces and to make precise measurements of fibre elongation. Slippage in the
gripping assembly can result in error of elongation values and lead to underestimated
fibre modulus. Fan (2010) used paper frames, in which hemp fibres were glued and
mounted to the testing machine. The paper was cut to open in the middle to free the
fibre to perform the test. This method was efficient in handling and transferring the
fibres to the testing machine without fibre damage. Similar fibre preparation was also
performed by Feih, Thraner & Lilholt (2005) on glass fibres. A number of studies
have also reported on strain measurements by means of non-contacting video
extensometer (Adusumalli, et al. 2006).
In this study, the tensile properties of single hemp fibres were measured by taking
into account, the variations in fibre diameters. Alkali, acetyl and silane treatments‘
effects on the fibres with respect to tensile properties are discussed. The relationship
between tensile properties of the treated fibres and the variation of their diameters
were also studied.

92
5. 2 Results and discussion
5.2.1 Influences of fibre diameter on tensile properties
Fibre diameters are also subject to variances due to the loss of hemicellulose and
lignin coverings as a result of chemical treatments. Two methods were used to
determine the diameter of the treated fibres.
The first method used the averaged fibre widths at different locations along the
fibre‘s length. For this, fibres were placed horizontally under the microscope
(Chapter 3, Section 3.4.2) and attached with glue tag to avoid movement. At least 20
locations were measured and average values were reported. The second method
measured the diameters around the breakage of the tested fibres. For this case, it was
important to obtain a flat and clear cross-section at the fracture end. Tested fibres
were perpendicularly attached with glue tag and the equivalent diameters were
obtained through image analysis. The fracture end of the tested fibres was strained
and had relatively smaller cross sections. Therefore fibre ends were cut close to
unstrained points.
Figure 5.1a presents typical OM images of a single fibre which features an irregular
shape and size along the fibre length. Figure 5.1b shows that the cross section of the
fibre is not circular.
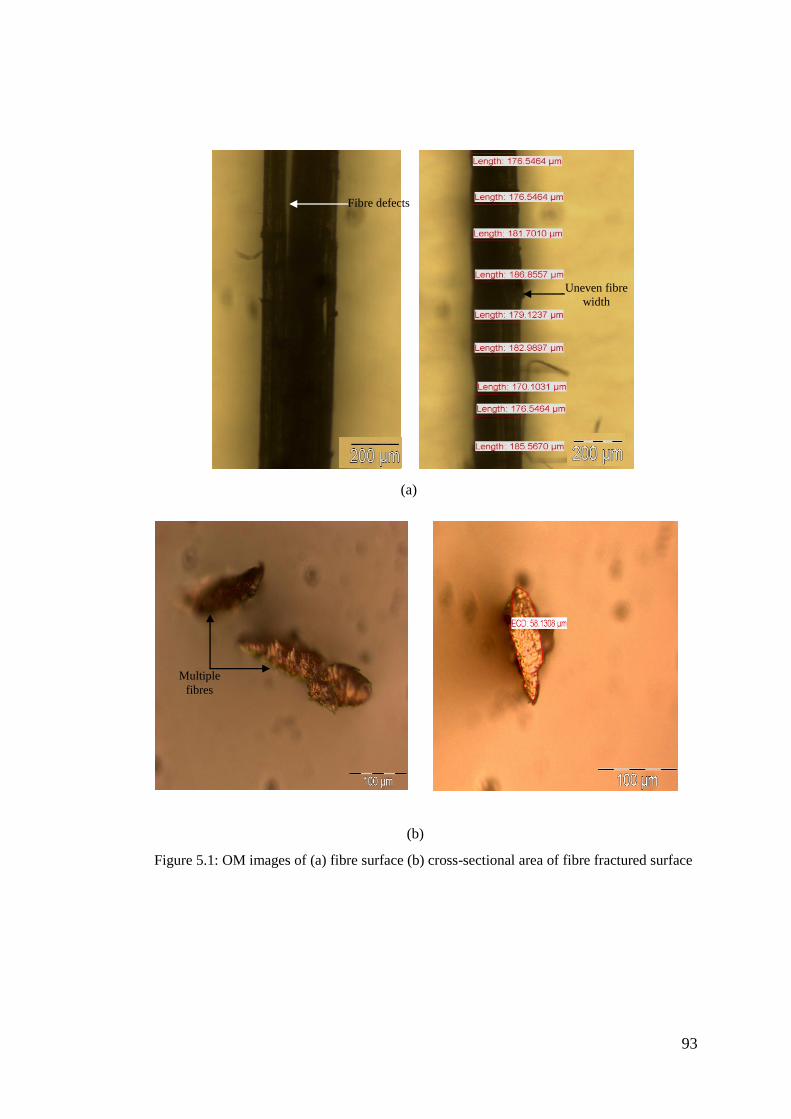
93
Figure 5.1: OM images of (a) fibre surface (b) cross-sectional area of fibre fractured surface
Multiple
fibres
(b)
(a)
Uneven fibre
width
Fibre defects

94
Table 5.1 summarises the differences in the measurements of the diameters of fibres
achieved when using both methods of calculation. The results indicate that there is a
great difference between measuring widths along the fibre and fibre cross sections at
the fracture point. Cross-sectional measurement at fracture points were less when
compared to widths along the fibre length. This variance in the results was due to the
fact that the measurement of the widths along the fibre did not take into account the
location of the fracture point. As a result, fracture point diameters were chosen in
calculating single fibre tensile strengths.
Table 5.1: Comparison of two diameter (mm) measurement methods of treated fibres Type of
fibre Width along the fibre length Cross-section of fibre fracture end
%NaOH Alkalised Acetylated Silanised Alkalised Acetylated Silanised
0 0.226 ±0.083
0.243 ±0.092
0.273 ±0.080
0.127 ±0.032
0.112 ±0.018
0.162 ±0.019
4 0.262 ±0.0435
0.180 ±0.040
0.301 ±0.081
0.149 ±0.031
0.127 ±0.030
0.135 ±0.041
6 0.169 ±0.041
0.168 ±0.029
0.404 ±0.178
0.119 ±0.028
0.121 ±0.041
0.182 ±0.045
8 0.223 ±0.072
0.184 ±0.087
0.323 ±0.123
0.150 ±0.048
0.085 ±0.030
0.145 ±0.025
10 0.178 ±0.059
0.277 ±0.011
0.289 ±0.092
0.110 ±0.027
0.177 ±0.039
0.138 ±0.040
Figure 5.2 presents strength variations as a function of fibre diameters of alkalised
and acetylated fibres. In both treatment cases, a downward trend of fibre tensile
strength was observed when the fibre diameter increased. These results highlight the
fact that lower strengths would be obtained if the widths along the fibres were used
instead of the cross-section measurements at the fracture point.

95
5.2.2 Influences of chemical treatments on tensile properties
The single fibre tensile test method is outlined in Chapter 3 (Section 3.6.1). The
strength, modulus and failure strain was calculated from the diameter closest to the
specimen failure and average values are shown in Table 5.2.
0
50
100
150
200
250
300
350
0 0.1 0.2 0.3
Ten
sile
str
en
gth
(M
Pa
)
Fracture diameter (mm)
(0~10% NaOH+Acetylation)
0%(Acet)
4%
6%
8%
10%
0
50
100
150
200
250
0 0.1 0.2 0.3
Ten
sile
str
en
gth
(M
Pa
)
Fracture diameter (mm)
0% (unt)
4%
6%
8%
10%
(0~10% NaOH)
(a)
(b)
Figure 5.2: Tensile strength as a function of fibre diameter (cross-section) (a) alkalised (b)
acetylated fibre

96
Table 5.2: Tensile properties of single fibre (considering fibre cross-section as diameter) Fibre type Alkalised Alkalised + Acetylated Alkalised + Silanised
%NaOH Stress
(MPa) Modulus
(GPa) Failure strain
(%) Stress
(MPa) Modulus
(GPa) Failure strain
(%) Stress
(MPa) Modulus
(GPa) Failure strain
(%)
0 235.42 ±75.90
2.54 ±0.04
0.140 ±0.022
232.27 ±83.39
2.56 ±1.16
0.131 ±0.024
158.47 ±45.60
0.99 ±0.19
0.153 ±0.036
4 104.18 ±17.68
1.51 ±0.47
0.073 ±0.005
188.24 ±64.31
1.44 ±0.50
0.072 ±0.017
179.86 ±50.28
1.08 ±0.15
0.156 ±0.027
6 166.28 ±47.92
2.72 ±1.04
0.076 ±0.025
114.86 ±52.13
1.10 ±0.16
0.103 ±0.041
78.53 ±23.47
0.56 ±0.15
0.143 ±0.040
8 152.92 ±58.40
1.31 ±0.77
0.090 ±0.053
148.78 ±75.43
1.68 ±0.07
0.046 ±0.014
97.76 ±15.00
0.72 ±0.23
0.154 ±0.033
10 171.83 ±64.35
2.42 ±0.64
0.102 ±0.045
134.17 ±55.44
1.66 ±0.35
0.089 ±0.063
160.01 ±75.79
1.32 ±0.47
0.103 ±0.011

97
To explain the effects of treatments on fibres, background information regarding
fibre structures and reaction mechanisms are outlined.
Natural fibres consist of cellulose microfibrils which are enveloped and
interconnected by hemicellulose and lignin. Cellulose microfibril appears as
crystalline and amorphous structures. In amorphous region, the microfibrils are less
compacted and more irregularly oriented compare to the crystalline region. The
hydroxyl groups present in the amorphous region are relatively free to react with
other chemicals compared to the crystalline regions (Beckermann & Pickering 2008).
Hemicellulose and lignin are always in amorphous structures where hydroxyl groups
are also present. The orientation of cellulose, hemicellulose, lignin and their
hydroxyl groups are outlined in Figure 5.3.
Figure 5.3: Schematic diagram of fibre (a) structure (a) cross-section
(a) (b)

98
When fibres are loaded in tension, cellulose microfibrils are stretched and stress
concentrations develop at their joints. These stress concentrations at the joints initiate
microcracks and trigger ultimate fibre failure. Also, the load transfer in tension
causes cellulose to undergo shearing between individual microfibrils (Fan 2010). The
extent of this shearing is reflected in the fibre tensile properties. As a result, it is clear
that hemicellulose and lignin constituents also play an important role in fibre
structural stability in tensile loading cases. The effects on fibres as a result of
alkalisation, acetylation and silanisation are discussed below.
Alkalisation on fibres
Figure 5.4 shows a typical stress-strain curve of alkalised fibres and Table 5.2
summarises their results. From Figure 5.5 it can be seen that the average tensile
strength and failure strain of the treated fibres was lower than the untreated fibres.
During tensile loading of the untreated fibres, cellulose underwent irreversible
slippage between individual microfibrils. The presence of hemicellulose and lignin
between the cellulose microfibrils held the microfibrils in position and resisted
slippage to an extent. Hence, untreated fibres had greater resistance against tensile
loading and exhibited higher properties compared to the NaOH treated fibres. In the
case of NaOH treatments, hemicellulose and lignin were removed from the fibre
resulting in easy deformations of cellulose microfibrils during tensile loading. Due to
this, treated fibres exhibited lower tensile properties compared to untreated fibres.

99
235
104
166
153
172
50
100
150
200
250
300
0 2 4 6 8 10 12
Ten
sile
str
en
gth
(M
Pa)
%NaOH
(0-10%NaOH)
0 4 6 8 10
(a)
Figure 5.5: Tensile properties of alkalised fibre (a) strength (b) failure strain
0.140
0.073 0.076
0.090 0.102
0.02
0.06
0.1
0.14
0.18
0 2 4 6 8 10 12
Fail
ure
str
ain
%NaOH
(0-10%NaOH)
0 4 6 8 10
(b)
0
50
100
150
200
250
0 0.05 0.1 0.15
Ten
sile
str
engt
h (
MP
a)
Strain
0% (unt)
6%
4%
10%
8%
(0~10%NaOH)
Figure 5.4: Typical stress-strain curves of alkalised fibres

100
From Figure 5.5a it can be observed that 4% NaOH treatments exhibited the lowest
tensile properties. These samples exhibited about half the strength and failure strain
of untreated fibres. At higher (6-10%) NaOH concentrations the strengths were
increased and stabilised at around 165 ~ 170 MPa and failure strains at about 0.07 ~
0.1 (Figure 5.5b).
These results indicated that the initial 4% NaOH concentrations were not strong
enough to remove the covering layers (provided by hemicellulose and lignin
constituents) from the cellulose microfibrils effectively. Rather, treatments split the
hemicellulose and lignin coverings on the cellulose surfaces. Hemicellulose and
lignin remained in the fibre structure at random orientations. These random
orientations facilitated fibre hydroxyl groups in becoming free to react with
atmospheric moisture. This caused the formation of a slippery layer which reduced
the frictional resistance between microfibrils during tensile deformation of the fibre.
Due to this, individual microfibrils deformed easily during loading and thus
exhibited lower tensile properties compared to the untreated fibres.
Higher NaOH concentrations (6-10%) effectively removed hemicellulose and lignin
coverings from fibre surfaces. Hydroxyl groups were also removed from the
hemicellulose and lignin region within the fibre. The lack of these hydroxyl groups
prevented the formation of the slippery materials layer among the microfibrils. Due
to this, higher strengths and failure strains of the treated fibres were observed when
compared to the 4% NaOH treated fibres.

101
Acetylation on alkali pre-treated fibres
Figure 5.6 shows the typical stress-strain curves of acetylated fibres and Table 5.2
summarises their results. The changes in strength of the acetylated fibres are shown
in Figure 5.7. In Figure 5.7 it can be observed that an acetyl treatment on untreated
fibres (0% NaOH) has not changed fibre strength (approximately 235 MPa).
Acetylation on the 4% NaOH pre-treated fibre increased strength from about 105 to
190 MPa. However, acetylation on 8% and 10% NaOH pre-treated fibres diminished
the fibre strengths.
0
50
100
150
200
250
300
350
0 0.05 0.1
Ten
sile
str
engt
h (
MP
a)
Strain
8%4%
10%
6%
Acety
(0~10%NaOH +Acetylation)
Figure 5.6: Typical stress-strain curves of acetylated fibres
Figure 5.7: Tensile strength of alkali pre-treated acetylated fibres
235
104
166
153172
232
188
115
149 134
50
100
150
200
250
300
0 2 4 6 8 10 12
Ten
sile
str
engt
h (
MP
a)
%NaOH
0 4 6 8 10
NaOH+ Acetylation
NaOH

102
During acetyl treatments, hydroxyl groups present in hemicellulose were esterified
by the acetyl groups and consequently moved out from the fibre. Treatments also
took out certain portions of covering layers of hemicellulose and lignin from the
cellulose microfibrils. Thus, moisture absorption by the treated fibres reduced and
enhanced frictional resistance among the microfibrils during tensile deformations.
As discussed previously, 4% NaOH treatments initially exposed free hydroxyl
groups that present in hemicellulose and lignin in the fibre structure, which in turn
absorb atmospheric moisture. Further acetyl treatments esterified the hydroxyl
groups which existed on the pre-treated fibres. Due to this, the fibre became
hydrophobic and eliminated the moisture related slippery materials among the
cellulose microfibrils. During tensile loading, fibres experienced higher frictional
resistances against irreversible microfibrils slippage and thus exhibited higher
strength compared to the 4% NaOH treated fibres.
At higher pre-treatment concentrations (8% and 10% NaOH), the hemicellulose and
lignin coverings and their hydroxyl groups were removed from the fibre. Further
acetylation created more losses of covering materials from the cellulose microfibrils.
The extensive removal of these covering materials led to easy fibre deformation in
tensile loading. Thus, two consecutive treatment processes reduced the fibre
strengths as compared to the (6-10%) NaOH treated fibres.

103
Silanisation on alkali pre-treated fibres
Figure 5.8 shows the typical stress-strain curves of silanised fibres and Table 5.2
summarises their results. The changes in strength and failure strain of the silanised
fibres are shown in Figure 5.9. From Figure 5.9a it can be observed that silane
treatments on untreated fibres reduced strength from around 235 MPa to 160 MPa.
As the untreated fibre surface was covered by hemicellulose and lignin, silane
molecules could not get access to cellulose microfibrils. Due to this, silane formed
couplings with hemicellulose and lignin coverings instead of cellulose microfibrils.
Generally, cellulose microfibrils can respond to bear high stresses while
hemicellulose and lignin can withstand low stresses (Park, et al. 2006). Thus, the
silane coupling effects with the hemicellulose and lignin constituents reduced the
tensile properties of the fibre.
Figure 5.8: Typical stress-strain curves of silanised fibres
0
50
100
150
200
0 0.05 0.1 0.15 0.2 0.25
Ten
sile
str
engt
h (
MP
a)
Strain
10%
Sila
4%
6%
8%
(0~10% NaOH+Silane)

104
Silane treatments on the 4% NaOH pre-treated fibres increased the fibre strength
from around 105 to 180 MPa. As the initial 4% NaOH pre-treatments provided
atmospheric moisture to enter into the fibre, the follow-up silane treatments formed
couplings with the cellulose microfibrils. These couplings provided support to the
microfibrils against tensile deformation and thus the fibre exhibited higher strength
than the 4% NaOH treated samples. These results again proved that the initial 4%
235
104
166
153
172
158
180
7898
160
50
100
150
200
250
300
0 2 4 6 8 10 12
Ten
sile
str
en
gth
(M
Pa)
%NaOH
0 4 6 8 10
NaOH+ Silane
NaOH
(a)
Figure 5.9: Tensile properties of alkali pre-treated silanised fibres (a) strength (b) failure
strain
(b)
0.140
0.073 0.076
0.090
0.102
0.153
0.156
0.1430.154
0.103
0.04
0.08
0.12
0.16
0 2 4 6 8 10 12
Fail
ure
str
ain
%NaOH
0 4 6 8 10
NaOH
NaOH+ Silane
105
NaOH treatment was not strong enough to remove hydroxyl groups in hemicellulose
and lignin effectively, and allowed the atmospheric moisture to remain in the fibre
structure.
Silane treatments significantly reduced the strength of 6% NaOH pre-treated fibres
from 166 to 78 MPa. Strengths also reduced at higher (8% and 10%) NaOH pre-
treatment concentrations. This may be due to the fact that at higher pre-treatment
concentrations (6-10% NaOH), hemicellulose lignin hydroxyl groups were removed
effectively from the fibre and there were no available hydroxyl groups to make
further couplings with silane molecules. The weak silane couplings led the cellulose
microfibrils to deform under lower tensile loads, thus treated fibres exhibit lower
tensile properties compared to the 6-10% NaOH treated fibres.
From Figure 5.9b, silane treatments on the (4-10% NaOH) alkali pre-treated fibres
exhibited higher failure strains than the NaOH treated fibres. NaOH pre-treatments
created more weakness among cellulose microfibrils and led to easy deformations of
fibres during tensile loadings. Conversely, silane couplings tended to hold the
microfibrils in the original position which in turn resulted in high fibre deformation.
Silane couplings also developed a layer of chemicals on the surface on the
microfibrils. The chemical layer provides shear resistance between the microfibrils
and the couplings. The shear resistance also contributes to the longer microfibril
deformations thus enhancing fibre failure strain.
It can be noted from Figure 5.9 that silane treatments on 10% NaOH pre-treated
fibres increased fibre strength but lowered the failure strain when compared to the
106
6% and 8% NaOH pre-treated fibres. This may be due to the fact that 10% NaOH
pre-treatment concentrations were strong enough to remove the hemicellulose-lignin
covering layers in such a manner that greater amounts of cellulose microfibrils were
exposed on the fibre surfaces. Consequently, the treatment reduced the crystalline
cellulose structure to a more amorphous cellulose structure. As a result, greater
amounts of hydroxyl groups were exposed. These amorphous cellulose hydroxyl
groups may have absorbed atmospheric moisture which in turn facilitated silane
molecules to form strong couplings with cellulose microfibrils. The strong coupling
effect supported the microfibrils during tensile deformations and thus enhanced fibre
strength. However, the extensive removal of hemicellulose and lignin caused a lack
of interlocking adhesives of cellulose microfibrils and thus the individual microfibril
deformations became easier. During tensile loading, strong silane couplings tended
to hold the cellulose microfibrils in the original position but weak interlocking
adhesion allowed the microfibrils to fail at lower elongations. Thus the treated fibres
exhibited lower failure strain.
5.3 Summary
Hemp fibres have an irregular shapes, non-uniform transverse dimensions and
defects along their lengths. To obtain accurate tensile properties, the cross-sectional
area at the fibre failure point was used as fibre diameter instead of considering fibre
width along their lengths.
The tensile strength of the chemically treated fibres decreased compared to untreated
fibres. As hemicellulose and lignin coverings were removed from the treated fibres,
cellulose microfibrils received less support against tensile loading.

107
Among all the NaOH pre-treatment conditions, alkalisation reduced the fibre
strength, 4% NaOH had the lowest. Additional acetylation could recover some of the
strength loss. Silane treatment increased the failure strain of the fibre.

108
Chapter 6: Chemical Treatments on Unidirectional Hemp
Fibre Composites
6.1 Introduction
For composite preparation, it is desirable to have fibre surfaces which can facilitate
strong bonding with the matrix. Composite properties depend greatly on the quality
of interface bonding to overcome the intrinsic weaknesses of the structure. Weak
bonding limits the efficiency of the composite‘s load bearing performance and leads
to under-utilisation of material properties. Chemical treatments on the fibre can
improve interface bonding with the matrix which ultimately enhances the overall
load bearing capacity of the composites.
In this chapter, the effect of chemical treatments on hemp fibres, and the associated
quality of interface bonding, will be illustrated through a composite mechanical
property analysis. In this analysis alkali (0%, 4%, 6%, 8% and 10% NaOH), acetyl
and silane treatments on hemp fibres were used. Long unidirectional hemp fibre
composites were prepared by VARTM. Interface bonding was examined through
tension, compression, shear, bending and impact testing. A possible sequence of
failure initiation and propagation is explained through the analysis of stress-strain
relationships and microscopic observations. The failure surfaces of the tested
samples were examined through the Optical Microscopy (OM).

109
6.2 Result and discussion
In order to ascertain tension, compression, shear, bending and impact properties of
the composites, experimentation was conducted in accordance with standards set out
in Chapter 3 (Section 3.6). At least 6 specimens for each treatment case were tested
and average values are reported.
6.2.1 Tensile properties of composites
The deformation characteristics of composites in tension are governed by the
strength of reinforcing fibres and the interface bonding behaviour between fibres and
the matrix (Van & Beukers 1999). During tensile testing, initial loading causes
elastic stress transfer from matrix to fibres through the bonded interface. Progressive
loading causes the matrix to yield and begin to plastically deform while the fibres
deforms elastically. At this stage, interface debonding take place between the fibres
and matrix (Fischer 2004).
Interface debonding initiate matrix cracking which then propagates along the
interfaces of the neighbouring fibres. Interface debonding and matrix cracking
separates the fibres from the matrix, which causes a discontinuation of stress transfer
across the composite (Gonzalez & Lorca 2007). At the crack location, fibres are used
to carry the applied stress to bridge the matrix cracking. Subsequent composite
deformation increases the crack opening which adds further strain to the bridging
fibres (Delaet, Lataillade & Wolff 1994). The fibre bridging stress reaches its critical
level and result in fibre fractures follows by the fracture of the composite.

110
The ability of fibres to carry loads depends on the quality of interface bonding.
During tensile testing, two types of interface failure are prevalent. First, interfacial
debonding initiates fibre sliding within their surrounding matrix. Fibre sliding
produces frictional stress transfers at the interface (Cho, Chen & Daniel 2007;
Kitsutaka & Takahashi 2001). Second, matrix cracking reduces support to fibres
which results in fibres being pulled-out from the matrix. A combination of interface
debonding and matrix cracking reduce the strength and stiffness of the composites.
Strong interfaces increase frictional resistance against tensile loading. From this it
can be stated that, in order to enhance tensile properties of composites, interface
bonding strength need to be increased.
Chemical treatments on fibres are used to improve fibre surfaces promoting strong
interface bonding between fibres and matrix. In this section, the effect of alkali,
acetyl and silane treatments on composite properties were analysed through tensile
testing.
The tensile behaviour of untreated and treated fibre composites was analysed through
stress-strain curves. Figure 6.1 shows a typical tensile stress-strain curve of a fibre
composite. The curve path displays an elastic region where a rapid increase in stress
is observed up to 30 MPa with increasing strain of 0.0015, followed by a plastic
region. In the plastic region, the stress reaches up to 140 MPa and strain of 0.145.
During plastic deformation debonding, interface cracking and matrix cracking
develops which leads to final failure of the entire composite.

111
Fibre alkalisation on composites
Figure 6.2 shows the typical stress–strain curves of composites with different
concentrations of NaOH treatments, and Table 6.1 summarises their results. The
changes in strength and failure strain of the treated composites are shown in Figure
6.3.
0
25
50
75
100
125
150
0 0.0025 0.005 0.0075 0.01 0.0125 0.015
Ten
sil
e s
tren
gth
(MP
a)
Strain
Plastic deformation
Elastic deformation
Matrix crack formation
α
α1
Figure 6.1: Typical tensile stress-strain curve of fibre composite
Figure 6.2: Typical tensile stress-strain curves of alkalised fibre composites
0
50
100
150
0 0.005 0.01 0.015
Ten
sile
str
en
gth
(M
Pa)
Strain
Un (0%)
6%
10%
4%
8%
0-10% NaOH
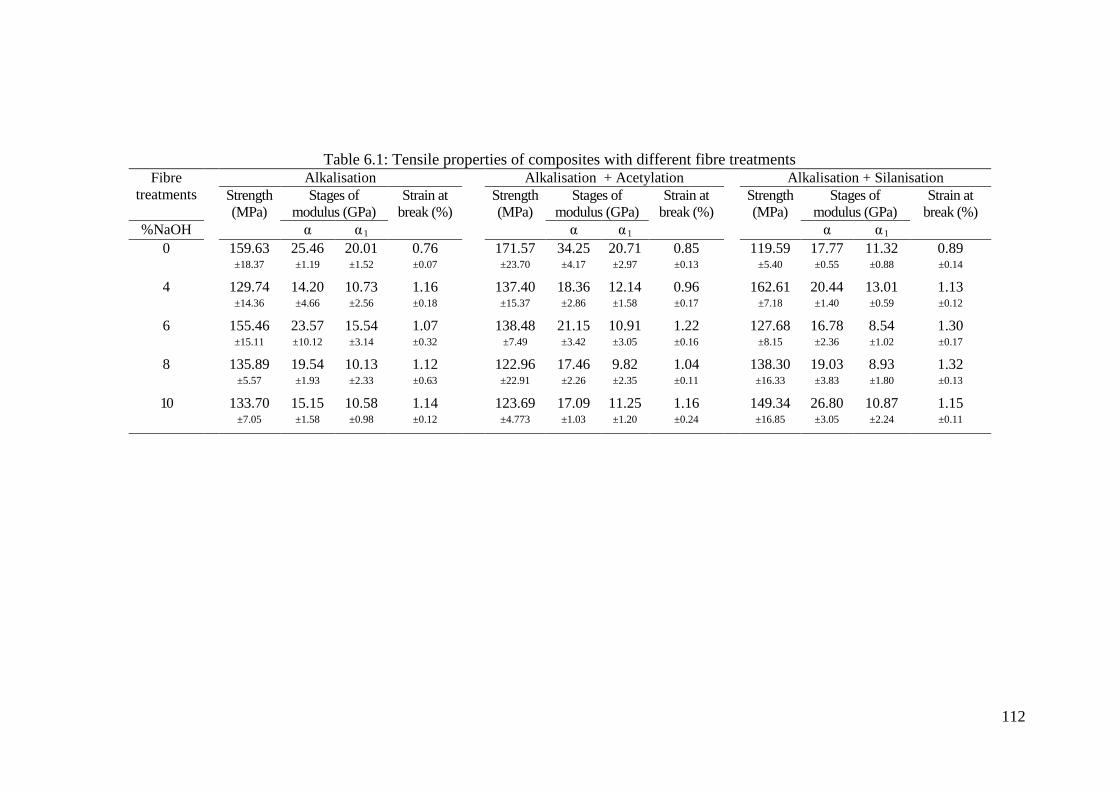
112
Table 6.1: Tensile properties of composites with different fibre treatments Fibre
treatments Alkalisation Alkalisation + Acetylation Alkalisation + Silanisation
Strength
(MPa) Stages of
modulus (GPa) Strain at
break (%) Strength
(MPa) Stages of
modulus (GPa) Strain at
break (%) Strength
(MPa) Stages of
modulus (GPa) Strain at
break (%) %NaOH α α 1 α α 1 α α 1
0
159.63 ±18.37
25.46 ±1.19
20.01 ±1.52
0.76 ±0.07
171.57 ±23.70
34.25 ±4.17
20.71 ±2.97
0.85 ±0.13
119.59 ±5.40
17.77 ±0.55
11.32 ±0.88
0.89 ±0.14
4
129.74 ±14.36
14.20 ±4.66
10.73 ±2.56
1.16 ±0.18
137.40 ±15.37
18.36 ±2.86
12.14 ±1.58
0.96 ±0.17
162.61 ±7.18
20.44 ±1.40
13.01 ±0.59
1.13 ±0.12
6
155.46 ±15.11
23.57 ±10.12
15.54 ±3.14
1.07 ±0.32
138.48 ±7.49
21.15 ±3.42
10.91 ±3.05
1.22 ±0.16
127.68 ±8.15
16.78 ±2.36
8.54 ±1.02
1.30 ±0.17
8
135.89 ±5.57
19.54 ±1.93
10.13 ±2.33
1.12 ±0.63
122.96 ±22.91
17.46 ±2.26
9.82 ±2.35
1.04 ±0.11
138.30 ±16.33
19.03 ±3.83
8.93 ±1.80
1.32 ±0.13
10
133.70 ±7.05
15.15 ±1.58
10.58 ±0.98
1.14 ±0.12
123.69 ±4.773
17.09 ±1.03
11.25 ±1.20
1.16 ±0.24
149.34 ±16.85
26.80 ±3.05
10.87 ±2.24
1.15 ±0.11

113
From Figure 6.3, it can be observed that alkali treated fibre composites (4-10%
NaOH) exhibited lower strengths but higher failure strains compared to the untreated
(0% NaOH) samples. In the original untreated fibre composites, cellulose
microfibrils were enveloped and joined together by hemicellulose and lignin
constituents. Cellulose microfibrils were also joined together through hydrogen
bonding (OH). The hemicellulose and lignin provided adhesion to hold the cellulose
microfibrils in position. These orientations of fibre constituents gave structural
(a)
160
130
155
136
134
100
125
150
175
0 2 4 6 8 10 12
Ten
sile
str
en
gth
(M
Pa)
%NaOH
(0-10%NaOH)
0 4 6 8 10
Figure 6.3: Tensile properties of alkalised fibre composites (a) strength (b) failure strain
(b)
0.007
0.012
0.0110.011
0.011
0.005
0.01
0.015
0 2 4 6 8 10 12
Fail
ure
str
ain
%NaOH
(0-10%NaOH)
0 4 6 8 10

114
stability to the fibre against tensile loading. During alkali treatments, NaOH removed
the hemicellulose and lignin constituents and their associated OH groups from the
fibre. Consequently, cellulose microfibrils began to lose their structural strength. At
higher concentrations of NaOH, more losses of hemicelluloses and lignin occurred,
and this weakened fibres (Beckermann & Pickering 2008; Goda, et al. 2006). As a
result, composite strengths gradually decreased (Figure 6.3a).
From Figure 6.3a it can be observed that 0-10% NaOH treated composites exhibit
three stages of strength variations:
(i) at 4%, strength decreases
(ii) at 6%, strength increases
(iii) at 8-10%, strength decreases.
The strength decrease at 4% NaOH was a result of concentrations was insufficient to
cause effective removal of the hemicellulose and lignin binders from the cellulose
surfaces. Instead, treatments facilitated hydroxyl groups‘ absorption of atmospheric
moisture. The presence of moisture in the fibre led to poor bonding with the matrix.
The weak interface bonding reduced the composites‘ load carrying capacity and thus
the composites failed at lower strength.
Whilst treatments reduced individual fibre strengths, the removal of hemicellulose
and lignin from the fibre surfaces provided more accessible cellulose surfaces for
matrix adhesion. Due to this, strong interface bonding between the fibres and matrix
was made possible. Strong interfaces tended to hold the microfibrils in position but
the weakness in strength of individual fibres eventually allowed gradual microfibril

115
deformation during tensile loading. As a result, treated composites showed higher
failure strain compared to the untreated samples (Figure 6.3b).
At 6% NaOH concentrations, treatments effectively removed the hemicellulose,
lignin and their associated hydroxyl groups from fibre surface. This facilitated strong
fibre-matrix interface bonding and thus the composites exhibited higher strength.
At 8-10% NaOH concentrations, treatments sufficiently removed hemicellulose and
lignin constituents from the fibre and so cellulose microfibrills became weaker in
strength. When such fibres were used in reinforcing composites, plastic deformation
took place at lower tensile loads which in turn caused the ultimate failure of
composites.
Fibre acetylation on composites
Figure 6.4 shows the typical stress-strain curves of NaOH pre-treated acetylated fibre
composites, and Table 6.1 summarises their results. The changes in strength and
modulus of the acetylated composites are presented in Figure 6.5. From Figure 6.5, it
can be observed that acetyl treatments on original hemp fibres (0% NaOH) increase
composite strength from 160 MPa to 172 MPa and modulus from 14 GPa to 18 GPa.
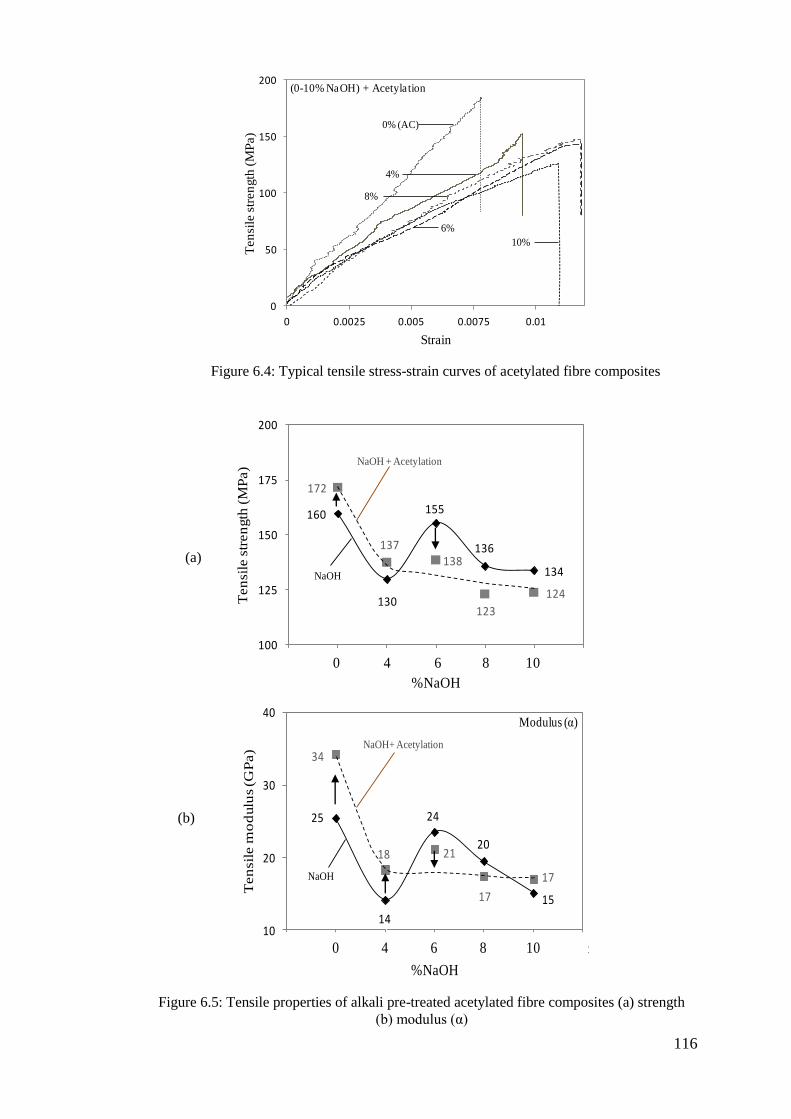
116
Figure 6.4: Typical tensile stress-strain curves of acetylated fibre composites
0
50
100
150
200
0 0.0025 0.005 0.0075 0.01
Ten
sile
str
en
gth
(M
Pa)
Strain
0% (AC)
8%
4%
10%
6%
(0-10% NaOH) + Acetylation
(b)
25
14
24
20
15
34
18 21
17
17
10
20
30
40
0 2 4 6 8 10 12
Ten
sil
e m
od
ulu
s (G
Pa)
%NaOH
NaOH
NaOH+ Acetylation
Modulus (α)
0 4 6 8 10
Figure 6.5: Tensile properties of alkali pre-treated acetylated fibre composites (a) strength
(b) modulus (α)
(a)
160
130
155
136
134
172
137
138
123
124
100
125
150
175
200
0 2 4 6 8 10 12
Ten
sile
str
en
gth
(M
Pa)
%NaOH
NaOH + Acetylation
0 4 6 8 10
NaOH

117
During acetylation, fibres underwent two stages of chemical reactions. First,
hemicellulose and lignin coverings from fibre surfaces were removed by the acetyl
groups. Second, hydroxyl groups of the fibre were esterified by acetyl groups and
eliminated from the fibres. This provided the hydrophobic fibre surfaces more
accessibility to cellulose microfibrils for matrix adhesion. As a result, strong
interface bonding between the fibres and matrix took place in the composites. Strong
interfaces provided higher frictional resistance against tensile loading increasing
overall composite properties.
Acetyl treatments on 4% NaOH pre-treated composites also exhibited higher strength
and modulus compared to the 4% NaOH treated samples. Fibres with initial 4%
NaOH treatments exposed hydroxyl groups on the fibre surfaces. Further acetylation
esterified existing hydroxyl groups within the pre-treated fibres. Treatments also
exposed cellulose microfibrils by removing further amounts of fibre surface
coverings. Consequently, strong interface bonding was achieved and composites
exhibited higher tensile properties.
For the higher concentrations of (6-10%) NaOH pre-treated fibres, large amounts of
covering materials and their hydroxyl groups had already been removed by alkali
treatments. Additional acetyl treatment caused further removal of coverings from the
fibres and this had the effect of weakening fibre structures. Also, a lack of hydroxyl
groups caused ineffective esterification with the fibres. These factors caused an
inadequacy in interface bonding strengths of the composites. As a result, acetylation
on 6-10% NaOH pre-treated samples exhibited lower strengths and moduli compared
to NaOH treated samples.

118
Fibre silanisation on composites
Figure 6.6 shows typical stress-strain curves of NaOH pre-treated silanised fibre
composites, and Table 6.1 summarises their results. The changes in strength and
failure strain of the silanised composites are presented in Figure 6.7. From Figure
6.7a, it can be observed that silanisation on untreated fibres (0% NaOH) significantly
reduced their associated composite strength from 160 MPa to 120 MPa. During
silane treatments, silanol molecules formed in the presence of moisture. One end of
the silanol molecule reacted with fibre hydroxyl groups and formed bonds with the
fibres while the other end of the silonol molecule reacted with the matrix. These
chemical couplings (linkages) between fibres and the matrix provided strong
interface bonding in the composites. As untreated surfaces were covered with
hemicellulose and lignin, the silane molecules could not achieve access to react with
hydroxyl groups attached to the cellulose surfaces within the fibres. At this stage,
silane molecules set an additional layer of coverings on the fibre surfaces, concealing
the possible reaction sites of the fibres that would otherwise be able to react with the
matrix. As a result, poor bonding between the fibres and matrix occurred, and
composites exhibited lower strength.
During composite deformation, silane couplings (layers) between the fibres and
matrix produced shear deformation at the interface. Interface shear enhanced the
composite`s tensile deformation process thus increasing their failure strain compared
to the untreated samples (Figure 6.7b).

119
Figure 6.6: Typical tensile stress-strain curves of silanised fibre composites
0
50
100
150
0 0.005 0.01 0.015
Ten
sile
str
en
gth
(M
Pa)
Strain
0% (Sil)
10%
4%
6%
8%
(0-10% NaOH) + Silane
(a)
160
130
155
136134
120
163
128
138149
100
125
150
175
0 2 4 6 8 10 12
Ten
sile
str
en
gth
(M
Pa)
%NaOH
NaOH+ Silane
0 4 6 8 10
NaOH
0.009 0.011
0.013 0.013
0.011
0.007
0.012
0.0110.011
0.011
0.005
0.01
0.015
0 2 4 6 8 10 12
Fail
ure
str
ain
%NaOH
NaOH
NaOH + Silane
0 4 6 8 10
(b)
Figure 6.7: Tensile properties of alkali pre-treated silanised fibre composites (a) strength
(b) failure strain

120
Silane treatments on 4% NaOH pre-treated composites exhibited higher strength
(130 MPa to 163 MPa) compared to the 4% NaOH treated samples. Fibres with
initial 4% NaOH treatments exposed hydroxyl groups on the fibre surface. Further
silanisation sufficiently formed silanol molecules by reacting with the existing
hydroxyl groups within the pre-treated fibres. The silanol molecules then formed
strong couplings between the fibre surfaces and the matrix. As a result, better
bonding at the interface was achieved facilitating higher resistance against tensile
loading thus improving composite strength.
Silane treatments on 6% NaOH pre-treated composites exhibited lower strength (155
MPa to 128 MPa) compared to the 6% NaOH treated samples. This result indicates
that 6% NaOH pre-treatments removed hemicellulose and lignin constituents and
their associated hydroxyl groups from the fibres. Further silane treatments could not
facilitate sufficient hydroxyl groups to form silanol molecules within the fibres. The
lack of silanol formation reduced the coupling efficiency between the fibres and
matrix. As a result, weak interface bonding took place and this ultimately reduced
composite strength.
Silane treatments on (8-10%) NaOH pre-treated composites exhibited higher
strengths compared to the (8-10%) NaOH treated samples. As discussed previously
(in Chapter 5), higher NaOH concentrations enabled the rupturing of the crystallinity
of cellulose structures which exposed hydroxyl groups to react with other molecules.
Further silane treatments sufficiently enabled hydroxyl groups within the pre-treated
fibre to form silanols and thus produced strong couplings between the fibre surfaces
121
and the matrix. Strong interfaces enhanced the load transfer capacity of the
composites which caused the composites to exhibit higher tensile properties.
From the above analyses, it can be stated that alkali treatments removed
hemicellulose and lignin binders from cellulose surfaces which ultimately lowered
composite strength compared to the untreated samples. However, treatments exposed
cellulose surfaces to react with matrix materials which enhanced their interface
bonding. As a consequence, treated fibre composites exhibited higher failure strains.
Acetylation caused the replacement of hydroxyl groups present within the fibre with
acetyl groups thus improving bonding at the interface. As a result, treated composites
exhibited higher tensile properties compared to untreated samples. However, alkali
pre-treated acetylated samples exhibited lower tensile properties. In two consecutive
treatment processes, fibres lost large amounts of binding materials (hemicellulose
and lignin) which decreased their structural strength and thus their ability to carry
tensile load.
Silane treatments on the untreated fibres did not facilitate the formation of strong
couplings between fibre surfaces and the matrix due to the presence of hemicellulose
and lignin coverings. As a result, weak interface bonding took place which decreased
the composite load carrying capacity. However, NaOH pre-treatments removed fibre
coverings which exposed hydroxyl groups to form silane couplings between fibres
and matrix. This enhanced interface bonding strength and allowed composites to
exhibit higher tensile properties.

122
6.2.2 Compressive properties of composites
For unidirectional composites, fibres are the primary load-carrying component,
whiles the matrix provides support to the fibres as a result of strong interface
bonding. Under incremental compression loading, fibres begin to buckle at weak
interface locations within the matrix (Ranganathan & Mantena 2003). Buckled fibres
generate strains on neighbouring fibres and cause them to bend (Fleck, Jelf & Curtis
1995; Jelf & Fleck 1992). This leads to instability along the fibre-matrix interface
and generates disproportionately high stresses on the matrix (Gonzalez & Lorca
2007). As a result, the matrix shifts from pre-buckling to post buckling deformation
which progressively involves damage initiation of the composites (Jensen, et al.
2006).
Figure 6.8 presents a typical compressive stress-strain curve for untreated fibres. The
curve indicates that the response was linear (pre-buckling) up to strength value of 30
MPa and strain value of 0.007. Following this stage, the composites began to yield.
As strain increased further, the curve deviated from this linear proportionality and a
geometrical nonlinear response (post-buckling) increased to a stress of around 65
MPa. Finally the failure stress point was reached. In the post-buckling path, the
tangent modulus diverged in several points with different stages of modulus values.
Varying recordings of modulus in the post-buckling path were due to the fact that, as
the compressive loading increased, matrix cracks initiated and propagated along the
interfaces (Jensen, et al. 2006). Crack propagation gradually reduced the load
carrying capacity of the composite, thereby lowering the modulus at several points
on the stress-strain curve. In Figure 6.8, α was the initial tangent modulus in the pre-
buckling state and α1, α2 and α3 were the tangent modulus in the post-buckling state.

123
Fibre alkalisation on composites
Figure 6.9 shows typical compressive stress-strain curves of alkalised fibre
composites, and their properties are summarised in Table 6.2. The changes in
compressive strength, modulus and failure strain of the composites are presented in
Figure 6.10. From Figure 6.10(a) it can be observed that, alkali treatments on
untreated fibres increased their associated composite strength from 69 MPa to 75
MPa.
0
20
40
60
0 0.02 0.04 0.06
Co
mp
ress
ive
stre
ngth
(M
Pa)
Strain
α1
α2
α3
α
Figure 6.8: Typical compressive stress strain curve of the fibre composite
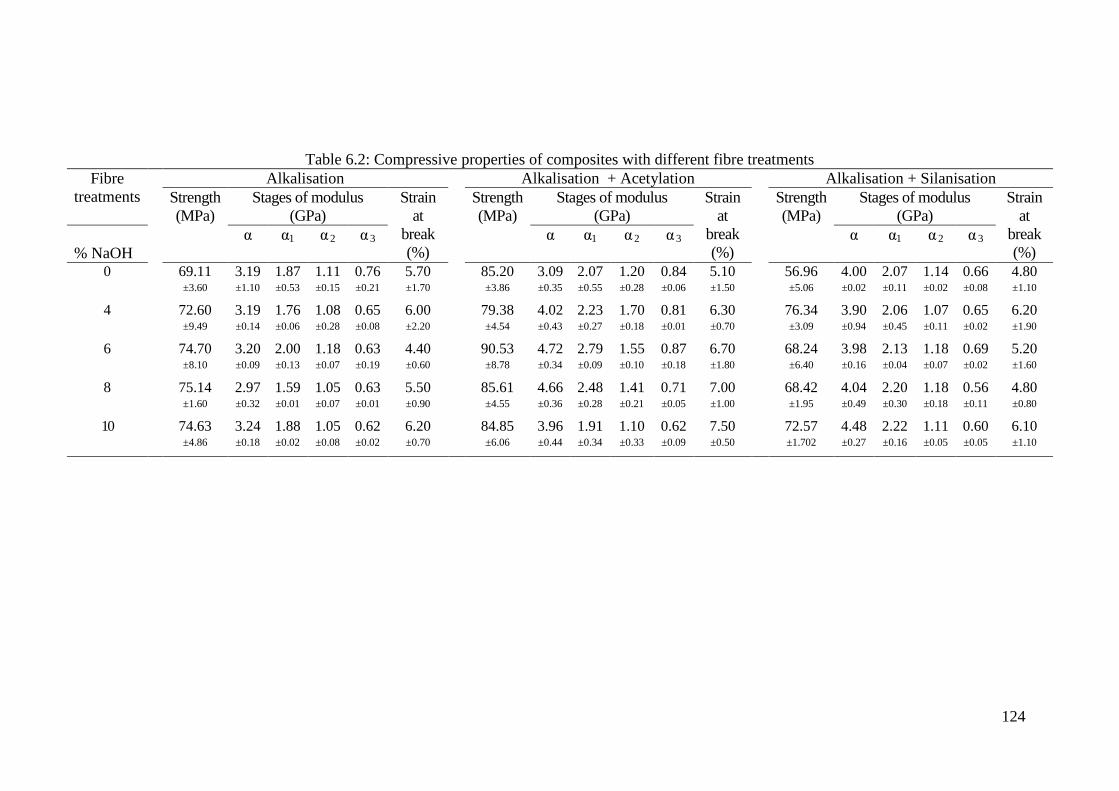
124
Table 6.2: Compressive properties of composites with different fibre treatments
Fibre
treatments
Alkalisation Alkalisation + Acetylation Alkalisation + Silanisation
Strength
(MPa)
Stages of modulus
(GPa)
Strain
at
break
(%)
Strength
(MPa)
Stages of modulus
(GPa)
Strain
at
break
(%)
Strength
(MPa)
Stages of modulus
(GPa)
Strain
at
break
(%)
% NaOH
α α1 α 2 α 3 α α1 α 2 α 3 α α1 α 2 α 3
0
69.11 ±3.60
3.19 ±1.10
1.87 ±0.53
1.11 ±0.15
0.76 ±0.21
5.70 ±1.70
85.20 ±3.86
3.09 ±0.35
2.07 ±0.55
1.20 ±0.28
0.84 ±0.06
5.10 ±1.50
56.96 ±5.06
4.00 ±0.02
2.07 ±0.11
1.14 ±0.02
0.66 ±0.08
4.80 ±1.10
4
72.60 ±9.49
3.19 ±0.14
1.76 ±0.06
1.08 ±0.28
0.65 ±0.08
6.00 ±2.20
79.38 ±4.54
4.02 ±0.43
2.23 ±0.27
1.70 ±0.18
0.81 ±0.01
6.30 ±0.70
76.34 ±3.09
3.90 ±0.94
2.06 ±0.45
1.07 ±0.11
0.65 ±0.02
6.20 ±1.90
6
74.70 ±8.10
3.20 ±0.09
2.00 ±0.13
1.18 ±0.07
0.63 ±0.19
4.40 ±0.60
90.53 ±8.78
4.72 ±0.34
2.79 ±0.09
1.55 ±0.10
0.87 ±0.18
6.70 ±1.80
68.24 ±6.40
3.98 ±0.16
2.13 ±0.04
1.18 ±0.07
0.69 ±0.02
5.20 ±1.60
8
75.14 ±1.60
2.97 ±0.32
1.59 ±0.01
1.05 ±0.07
0.63 ±0.01
5.50 ±0.90
85.61 ±4.55
4.66 ±0.36
2.48 ±0.28
1.41 ±0.21
0.71 ±0.05
7.00 ±1.00
68.42 ±1.95
4.04 ±0.49
2.20 ±0.30
1.18 ±0.18
0.56 ±0.11
4.80 ±0.80
10
74.63 ±4.86
3.24 ±0.18
1.88 ±0.02
1.05 ±0.08
0.62 ±0.02
6.20 ±0.70
84.85 ±6.06
3.96 ±0.44
1.91 ±0.34
1.10 ±0.33
0.62 ±0.09
7.50 ±0.50
72.57 ±1.702
4.48 ±0.27
2.22 ±0.16
1.11 ±0.05
0.60 ±0.05
6.10 ±1.10
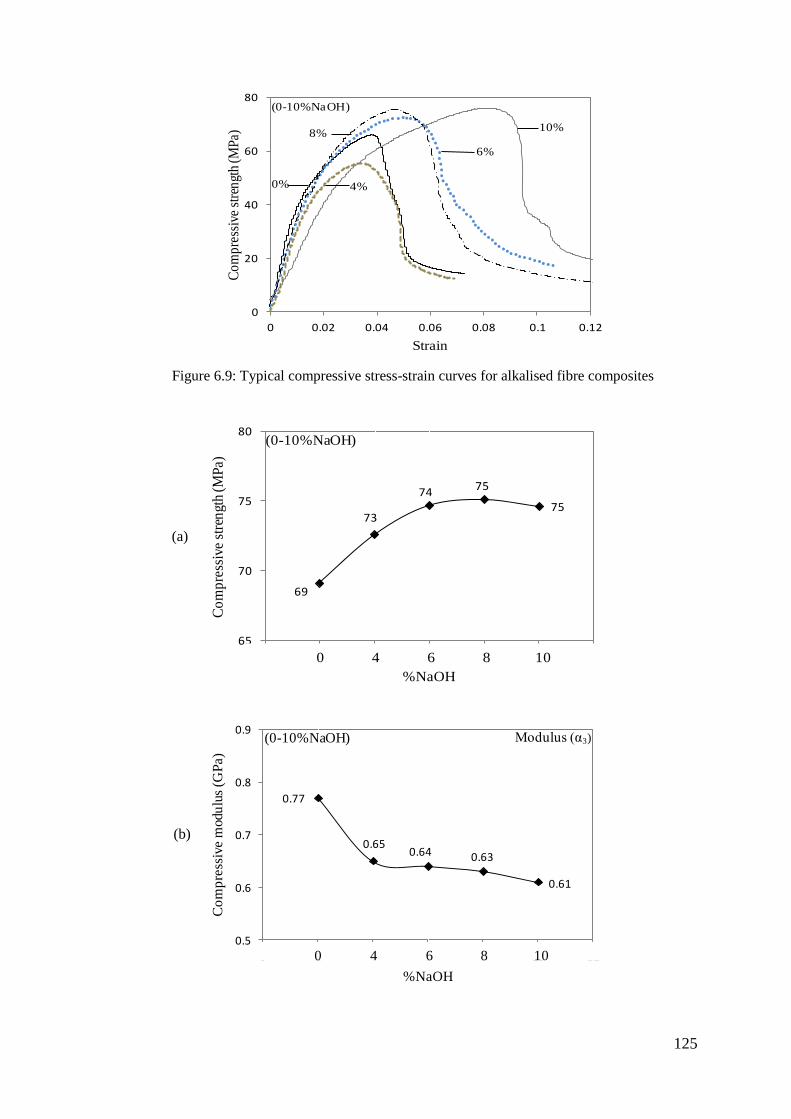
125
(a)
69
73
74 75
75
65
70
75
80
0 2 4 6 8 10 12
Co
mp
ress
ive
stre
ngt
h (M
Pa)
%NaOH
(0-10%NaOH)
0 4 6 8 10
0
20
40
60
80
0 0.02 0.04 0.06 0.08 0.1 0.12
Co
mp
ress
ive
stre
ngt
h (M
Pa)
Strain
0%
8%
6%
4%
10%
(0-10%NaOH)
Figure 6.9: Typical compressive stress-strain curves for alkalised fibre composites
0.77
0.650.64 0.63
0.61
0.5
0.6
0.7
0.8
0.9
0 2 4 6 8 10 12
Co
mp
ress
ive m
odu
lus
(GP
a)
%NaOH
Modulus (α3)(0-10%NaOH)
0 4 6 8 10
(b)

126
Enhanced composite strengths were exhibited as a result of the removal of fibre
surface coverings (hemicellulose and lignin) by NaOH treatments. The removal of
the fibre surface coverings facilitated strong interfacial bonding with matrix
materials. Strong interfaces prevented fibre buckling, which ultimately delayed the
formation of matrix cracks. Greater stress transfer from matrix to fibres took place
and thus composite strengths increased.
Although alkalised fibre composites showed increased strengths, the removal of fibre
surface coverings created weaknesses within cellulose microfibrils. This has the
effect of weakening fibres. During compression, weak cellulose microfibrils tended
to buckle within the fibre. This microbuckling generated microstrains on fibres
which ultimately produced extra strains at the fibre-matrix interface. The extra strain
initiated microcracks at the bonded interface which gradually reduced the
composites‘ load carrying capacity. As a result, the composite failed under large
Figure 6.10: Compressive properties of alkalised fibre composites (a) strength (b)
modulus (c) failure strain
0.057
0.060
0.044
0.055
0.062
0.035
0.05
0.065
0.08
0 2 4 6 8 10 12
Fail
ure
str
ain
%NaOH
(0-10%NaOH)
0 4 6 8 10
(c)

127
deformations. Figure 6.10c highlights gradual increase in failure strains at higher
concentrations of NaOH treatments (6-10%).
From Figure 6.10b it can be seen that the post-buckling moduli (α3) gradually
decreased as NaOH concentration increased. This clearly highlights the fact that fibre
weaknesses were caused by alkali treatments. As discussed before, at α3, progressive
matrix cracking and fibre buckling produced large strains on neighbouring fibres. At
this stage, weak fibres could not take further strains developed from buckling and
matrix cracking. As a result, fibres failed at lower loads and the composites exhibited
lower α3 values.
Fibre acetylation on composites
Figure 6.11 shows a typical compressive stress-strain curve for NaOH pre-treated
acetylated fibre composites, and their properties are summarised in Table 6.2. The
changes in strength, modulus and failure strain of the acetylated composites are
presented in Figure 6.12. Figures 6.12a and 6.12d show that acetyl treatments exhibit
around 23% higher strength but 10% lower failure strain compared to untreated
samples. These results indicated that, the acetyl groups were able to react with the
hydroxyl groups that attached to the cellulose and developed strong bonding with the
matrix. During composite deformation, strong interfaces prevented fibre buckling
and provided higher frictional resistance against compression loading. Due to this,
the applied compressive load rapidly increased and reached its peak at relatively
small elongations. This resulted in higher strengths but lower failure strains of the
treated composites.
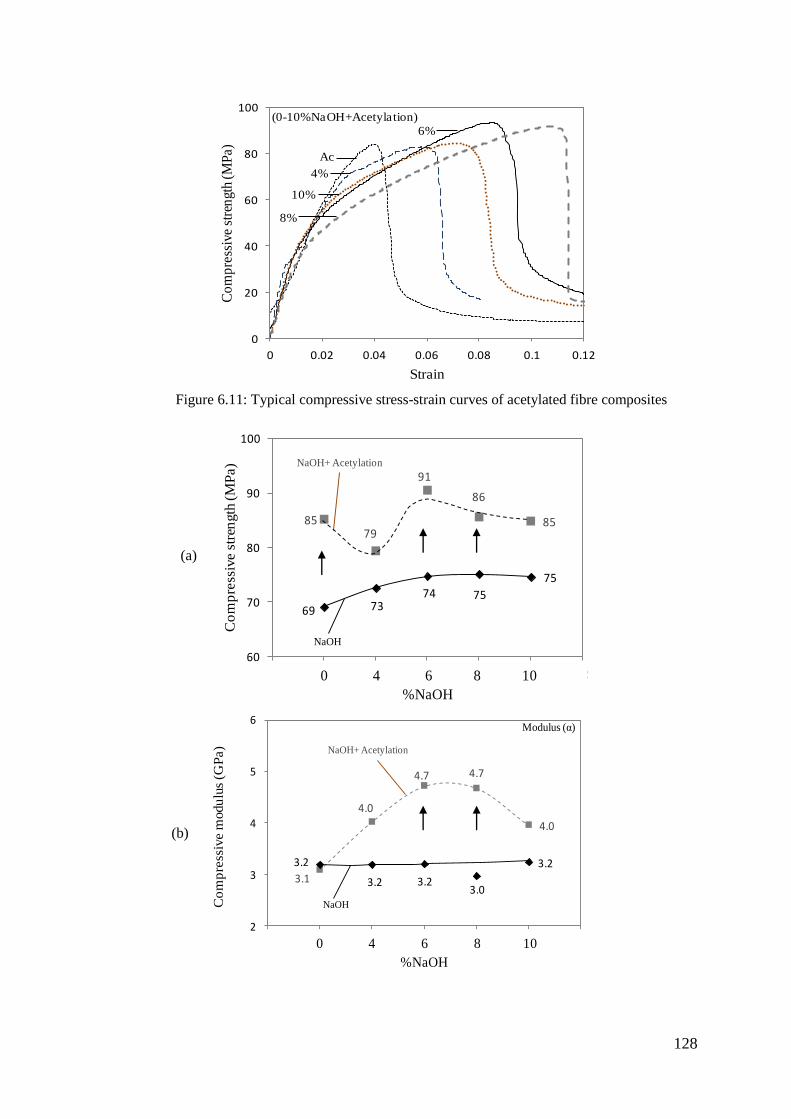
128
0
20
40
60
80
100
0 0.02 0.04 0.06 0.08 0.1 0.12
Co
mp
ress
ive
stre
ngt
h (M
Pa)
Strain
Ac
4%
6%
8%
10%
(0-10%NaOH+Acetylation)
Figure 6.11: Typical compressive stress-strain curves of acetylated fibre composites
(a)
69 7374 75
75
8579
91
86
85
60
70
80
90
100
0 2 4 6 8 10 12
Co
mp
ress
ive s
tren
gth
(M
Pa)
%NaOH
NaOH+ Acetylation
0 4 6 8 10
NaOH
(b)
3.1
4.0
4.7 4.7
4.0
3.2
3.2 3.23.0
3.2
2
3
4
5
6
0 2 4 6 8 10 12
Co
mp
ress
ive m
odu
lus
(GP
a)
%NaOH
NaOH+ Acetylation
0 4 6 8 10
NaOH
Modulus (α)
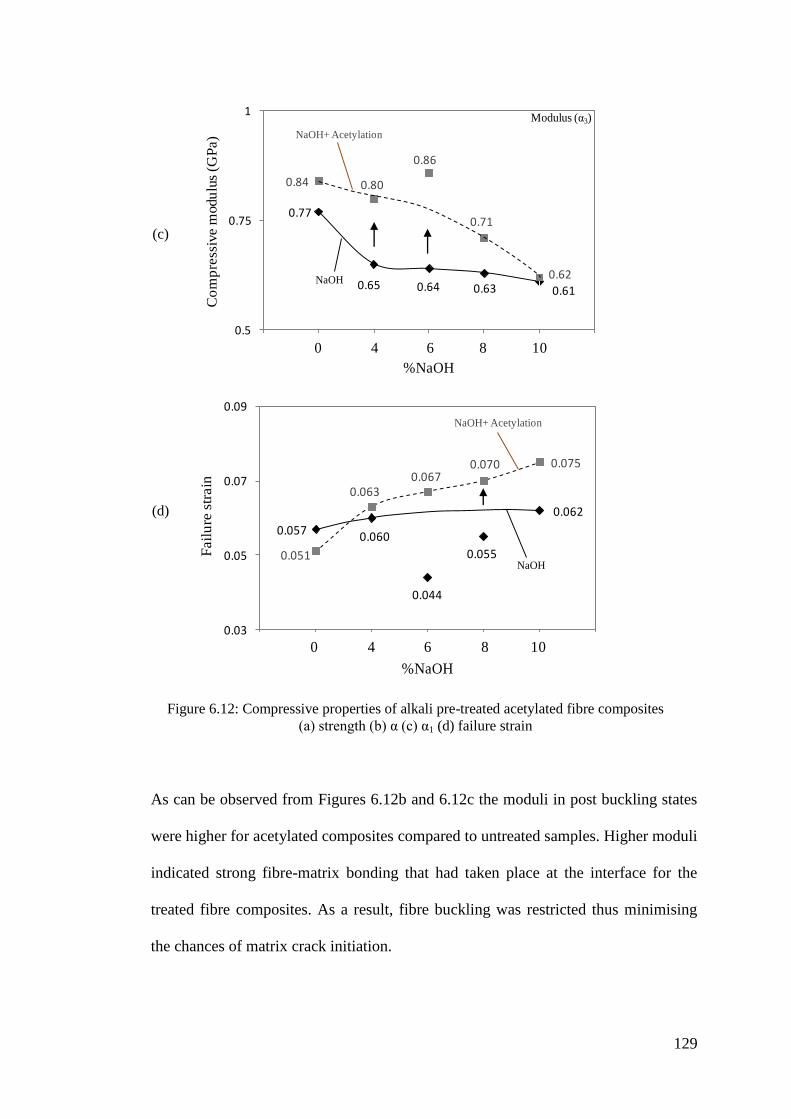
129
As can be observed from Figures 6.12b and 6.12c the moduli in post buckling states
were higher for acetylated composites compared to untreated samples. Higher moduli
indicated strong fibre-matrix bonding that had taken place at the interface for the
treated fibre composites. As a result, fibre buckling was restricted thus minimising
the chances of matrix crack initiation.
(c)
0.77
0.65 0.64 0.63 0.61
0.84 0.80
0.86
0.71
0.62
0.5
0.75
1
0 2 4 6 8 10 12
Co
mp
ress
ive m
odu
lus
(GP
a)
%NaOH
NaOH+ Acetylation
0 4 6 8 10
NaOH
Modulus (α3)
Figure 6.12: Compressive properties of alkali pre-treated acetylated fibre composites
(a) strength (b) α (c) α1 (d) failure strain
(d)
0.051
0.0630.067
0.070 0.075
0.057 0.060
0.044
0.055
0.062
0.03
0.05
0.07
0.09
0 2 4 6 8 10 12
Fail
ure
str
ain
%NaOH
NaOH+ Acetylation
0 4 6 8 10
NaOH

130
Similarly, acetylation on (4-10%) NaOH treated fibre composites exhibited higher
strengths, moduli (α, α1, α2 and α3) and breaking strains compared to the (4-10%)
NaOH treated samples. These results confirm that strong interface bonding was
achieved due to the removal of fibre surface coverings (hemicellulose and lignin) in
two consecutive treatment processes. During compression loading fibres did not have
sufficient space at their surrounding interfaces to develop fibre buckling which
reduced the chances of matrix cracking. As a result, greater load transfers throughout
the composites could be achieved and this justified higher compression properties of
the composites.
Fibre silanisation on composites
Figure 6.13 illustrates the typical compressive stress-strain curves for NaOH pre-
treated silanised fibre composites, and their properties are summarised in Table 6.2.
The changes in strength of the silanised composites are presented in Figure 6.14.
Figure 6.14 shows that silane treatments exhibit around 17% lower compressive
strength compared to untreated samples. Cellulose surfaces in the untreated samples
were covered by hemicellulose and lignin coverings. Silane molecules were unable
to penetrate the fibre surfaces to react with hydroxyl groups that were attached with
the cellulose. Rather, silane formed chemical linkages with the hydroxyl groups from
the surface coverings (hemicellulose-lignin). Due to this, the silane did not facilitate
strong couplings with fibres. Instead, it acted as an additional chemical layer on the
fibre surfaces. During compression loading, the chemical layers also generated
buckling strain on the fibres and their surrounding interfaces, and thus contributed to
the formation of matrix cracking. Fibre buckling and matrix cracking reduced the

131
composites‘ load carrying capacities and thus exhibited lower compression
properties.
It can be seen from Figure 6.14 that, 4% NaOH pre-treated silanised samples exhibit
higher compressive strengths compared to the original 4% NaOH treated samples.
This again proved that the initial 4% NaOH concentration was not strong enough to
Figure 6.13: Typical compressive stress-strain curves of silanised fibre composites
0
20
40
60
80
0 0.02 0.04 0.06 0.08
Co
mp
ress
ive
stre
ngt
h (M
Pa)
Strain
Sil
4%
8%
6%
10%
(0-10%NaOH+Silane)
Figure 6.14: Compressive strength of alkali pre-treated silanised fibre composites
6973
74 75
75
57
76
68 68
73
50
60
70
80
0 2 4 6 8 10 12
Co
mp
ress
ive
stre
ngth
(M
Pa)
%NaOH
NaOH+ Silane
0 4 6 8 10
NaOH

132
remove covering materials from the fibre surface effectively; rather it exposed fibre
hydroxyl groups. Silane molecules then reacted with these hydroxyl groups and
formed silanols. Silanols, in turn, formed strong couplings between fibre surfaces
and the matrix. These chemical couplings promoted strong bonding at the interface.
Strong interfaces enhanced the composites‘ load carrying capacities and produced
higher compressive properties.
On the other hand, higher concentrations (6-10%) of NaOH treatments removed
hemicellulose and lignin coverings and their associated hydroxyl groups from the
fibres. Further silane treatments did not leave sufficient hydroxyl groups to form
silanols. As a result, chemical couplings at the interface became less able in carrying
compressive loads and thus lowered composite properties were exhibited.
Among all reinforcing fibre treatments, acetylated composites showed the best
results in terms of strength, failure strain and modulus. Alkali treatments also
exhibited similar composite properties. Higher composite properties indicated that
treatments were effective in removing fibre surface coverings to provide strong
interface bonding. Due to the presence of fibre surface coverings on untreated fibres,
silane molecules were not able to form effective bonding with the fibre surfaces. As a
consequence, weak bonding between the fibres and matrix took place and, silane
treated composites showed weaker properties compared to the alkalised and
acetylated samples.

133
Composites failure surface analysis
Figure 6.15a shows a flat wise view of a typical composite failure surface. The image
indicates that the reinforced fibres were banded on a composite surface plane at an
angle to the loading direction, and the fibres‘ bends were spread over the composite
surface. This section of bent fibres is known as a kink band. Kink bands develop due
to fibres buckling (Azzam 2007; Jensen, et al. 2006). This band forms in the post
buckling state when the composite fail gradually under large deformations (ductile
failure) (Azzam 2007; Cho, Chen & Daniel 2007).
Figure 6.15: Microscopic images of failure surface for (a) flat-wise view (b) silanised (c)
alkalised (d) acetylated composites
(a) (b)
(c) (d)
In plane
fibre bends
(buckling)
Applied
load
Shear bands due
to fibre buckling
Fibre fracture
Interface
crack
opening
Interface crack
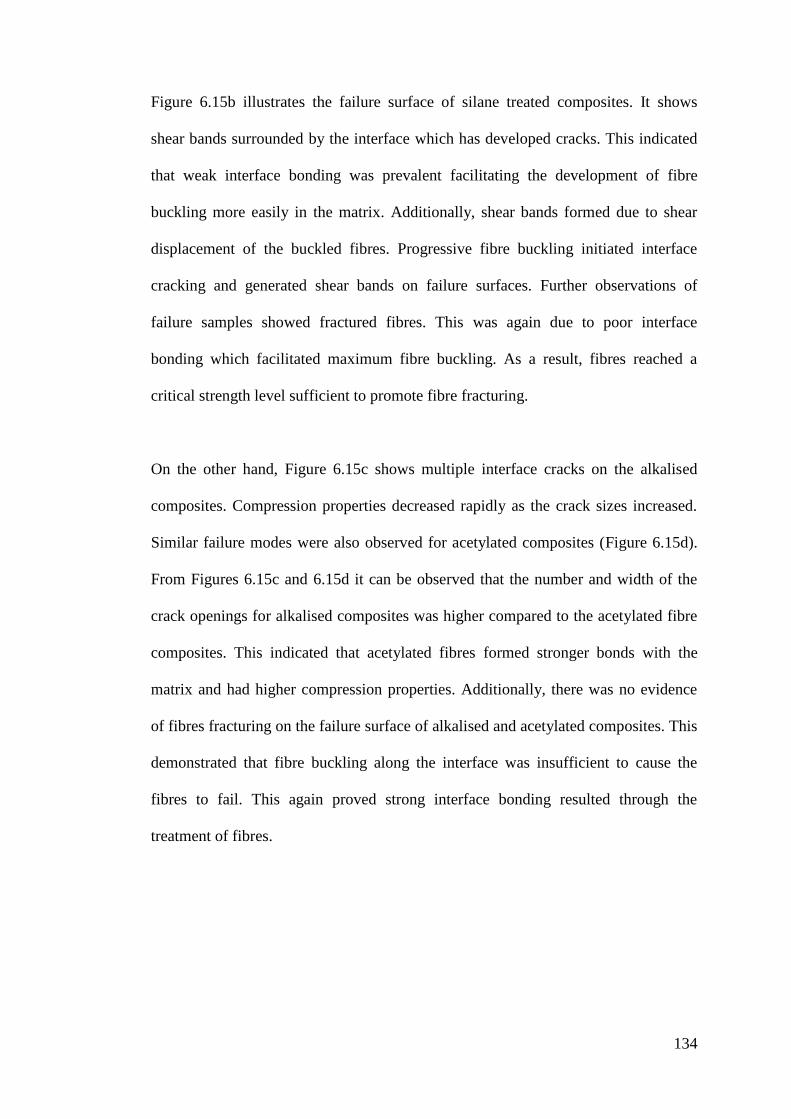
134
Figure 6.15b illustrates the failure surface of silane treated composites. It shows
shear bands surrounded by the interface which has developed cracks. This indicated
that weak interface bonding was prevalent facilitating the development of fibre
buckling more easily in the matrix. Additionally, shear bands formed due to shear
displacement of the buckled fibres. Progressive fibre buckling initiated interface
cracking and generated shear bands on failure surfaces. Further observations of
failure samples showed fractured fibres. This was again due to poor interface
bonding which facilitated maximum fibre buckling. As a result, fibres reached a
critical strength level sufficient to promote fibre fracturing.
On the other hand, Figure 6.15c shows multiple interface cracks on the alkalised
composites. Compression properties decreased rapidly as the crack sizes increased.
Similar failure modes were also observed for acetylated composites (Figure 6.15d).
From Figures 6.15c and 6.15d it can be observed that the number and width of the
crack openings for alkalised composites was higher compared to the acetylated fibre
composites. This indicated that acetylated fibres formed stronger bonds with the
matrix and had higher compression properties. Additionally, there was no evidence
of fibres fracturing on the failure surface of alkalised and acetylated composites. This
demonstrated that fibre buckling along the interface was insufficient to cause the
fibres to fail. This again proved strong interface bonding resulted through the
treatment of fibres.

135
6.2.3 Shear properties of composites
Iosipescu shear specimens were employed in experimentation. They had v-notches at
the top and bottom edges, which reduced the cross-sectional area at the specimen
centreline (Chapter 3, Section 3.6.3). The reduced cross-sectional area between the
notches allowed shear stresses to be concentrated near the centre region (Bradley, et
al. 2007).
During shear tests, specimens were mounted on both sides of the test fixture. One
side of the fixture was moved vertically while the other side remained stationary.
This action produced force couples on the specimen. The force couples generated
two counteracting moments at the specimen‘s mid-sections. The induced moments
exactly cancelled at the specimen mid-length, thus producing a pure shear loading
state (Odegard & Kumosa 2000; Zhou, Green & Morrison 1995). Additionally,
vertical displacement imposed compressive loads on the specimen‘s mid-sections.
This action tended to cause fibre bending of the specimen. Consequently, the
specimen also experienced tensile deformation. Such deformations also produced
transverse normal stresses and transverse strain at the mid-section (Totry, et al.
2009). Tension and compression together, produced shear deformation at the
specimen just below the V-notches (Mattoni & Zok 2005; Totry, Gonzalez & Lorca
2009). As a result, the stress fields on both sides of the notch-root axis experienced
shear/transverse compression and shear/transverse tension simultaneously.
Tensile deformation along the fibres led to fibre fracture while compression in the
same direction induced failure through localised fibre bending. Tensile deformation
resulted in matrix cracking, interfacial debonding, fibre sliding, fibre fracture and
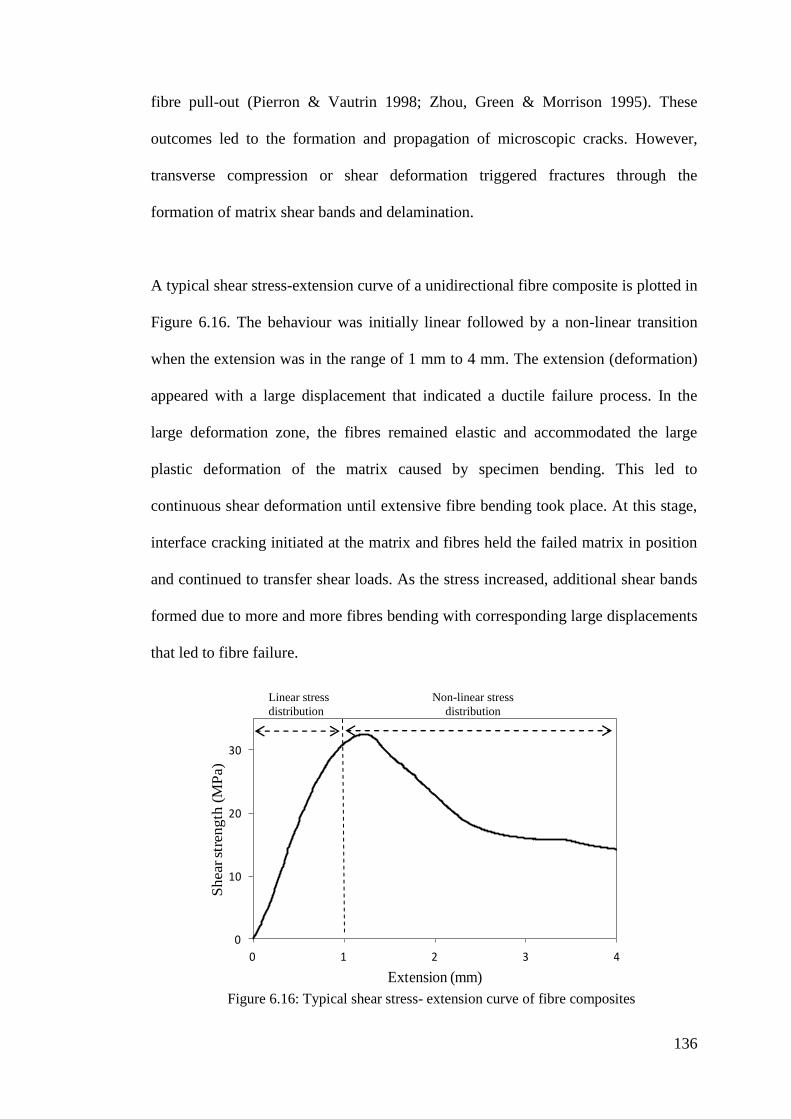
136
fibre pull-out (Pierron & Vautrin 1998; Zhou, Green & Morrison 1995). These
outcomes led to the formation and propagation of microscopic cracks. However,
transverse compression or shear deformation triggered fractures through the
formation of matrix shear bands and delamination.
A typical shear stress-extension curve of a unidirectional fibre composite is plotted in
Figure 6.16. The behaviour was initially linear followed by a non-linear transition
when the extension was in the range of 1 mm to 4 mm. The extension (deformation)
appeared with a large displacement that indicated a ductile failure process. In the
large deformation zone, the fibres remained elastic and accommodated the large
plastic deformation of the matrix caused by specimen bending. This led to
continuous shear deformation until extensive fibre bending took place. At this stage,
interface cracking initiated at the matrix and fibres held the failed matrix in position
and continued to transfer shear loads. As the stress increased, additional shear bands
formed due to more and more fibres bending with corresponding large displacements
that led to fibre failure.
Figure 6.16: Typical shear stress- extension curve of fibre composites
0
10
20
30
0 1 2 3 4
Shear st
rength
(M
Pa)
Extension (mm)
Linear stress
distribution
Non-linear stress
distribution

137
Figure 6.17 (Odegard & Kumosa 2000) and 6.18 show different shear failure modes
of the tested specimens. Axial shear cracking was observed at the mid-section of the
specimen between notches. These axial cracks formed due to shear/transverse tension
and shear/transverse compression of the specimen. Shear/transverse compression
caused short cracks and shear/transverse tension caused long cracks along the fibre
axis. Axial cracks also produced notch root splitting. Notch root splitting initiated at
the root of the v-notch section and propagated along the fibre axis. The direction of
the notch root axial split is dependent on the fibre directions. The splitting was
predominantly caused by the large compressive stresses that were concentrated near
the notch root.
Failure modes
Figure 6.17: Typical shear failure modes of the composites
(2) Small intralaminar cracks
(Damage Zone)
Loading Block
(3) Large intralaminar
axial cracks
(1) Notch root axial split Notch root
(4) Crushing

138
A microscopy (OM) inspection of the specimens‘ mid-section showed fibre bending,
matrix cracking, debonding, fibre sliding and fibre fracture. Large shear
displacements at the specimen mid-section caused fibres to bend and led to plastic
Figure 6.18: Shear failure modes of composites
1 4
2 & 3
Matrix cracking
Fibre failure
Fibre bending
Fibre sliding
Delaminating
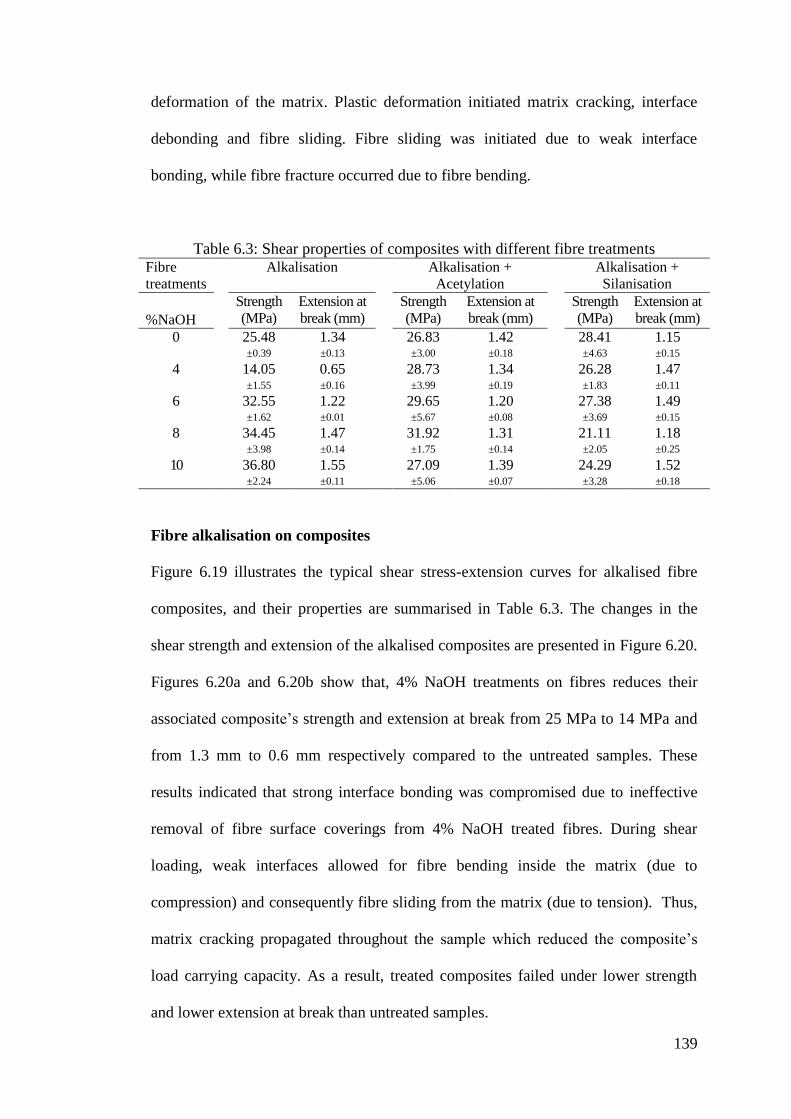
139
deformation of the matrix. Plastic deformation initiated matrix cracking, interface
debonding and fibre sliding. Fibre sliding was initiated due to weak interface
bonding, while fibre fracture occurred due to fibre bending.
Table 6.3: Shear properties of composites with different fibre treatments Fibre
treatments Alkalisation Alkalisation +
Acetylation Alkalisation +
Silanisation
%NaOH
Strength
(MPa) Extension at
break (mm) Strength
(MPa) Extension at
break (mm) Strength
(MPa) Extension at
break (mm)
0 25.48 ±0.39
1.34 ±0.13
26.83 ±3.00
1.42 ±0.18
28.41 ±4.63
1.15 ±0.15
4 14.05 ±1.55
0.65 ±0.16
28.73 ±3.99
1.34 ±0.19
26.28 ±1.83
1.47 ±0.11
6 32.55 ±1.62
1.22 ±0.01
29.65 ±5.67
1.20 ±0.08
27.38 ±3.69
1.49 ±0.15
8 34.45 ±3.98
1.47 ±0.14
31.92 ±1.75
1.31 ±0.14
21.11 ±2.05
1.18 ±0.25
10 36.80 ±2.24
1.55 ±0.11
27.09 ±5.06
1.39 ±0.07
24.29 ±3.28
1.52 ±0.18
Fibre alkalisation on composites
Figure 6.19 illustrates the typical shear stress-extension curves for alkalised fibre
composites, and their properties are summarised in Table 6.3. The changes in the
shear strength and extension of the alkalised composites are presented in Figure 6.20.
Figures 6.20a and 6.20b show that, 4% NaOH treatments on fibres reduces their
associated composite‘s strength and extension at break from 25 MPa to 14 MPa and
from 1.3 mm to 0.6 mm respectively compared to the untreated samples. These
results indicated that strong interface bonding was compromised due to ineffective
removal of fibre surface coverings from 4% NaOH treated fibres. During shear
loading, weak interfaces allowed for fibre bending inside the matrix (due to
compression) and consequently fibre sliding from the matrix (due to tension). Thus,
matrix cracking propagated throughout the sample which reduced the composite‘s
load carrying capacity. As a result, treated composites failed under lower strength
and lower extension at break than untreated samples.

140
Figure 6.19: Typical shear stress-extension curves of alkalised fibre composites
0
10
20
30
40
0 1 2 3
Sh
ear
stre
ngth
(M
Pa)
Extension (mm)
0%
10%8%
(0-10% NaOH)
4%
6%
(a)
25
14
3234
37
10
20
30
40
0 2 4 6 8 10 12
Sh
ear
stre
ngth
(M
Pa)
%NaOH
(0-10%NaOH)
0 4 6 8 10
(b)
Figure 6.20: Shear properties of alkalised fibre composites (a) strength (b)
extension at break
1.3
0.6
1.2
1.5
1.5
0.2
0.6
1
1.4
1.8
0 2 4 6 8 10 12
Ex
ten
sio
n a
t b
reak (
mm
)
%NaOH
(0-10%NaOH)
0 4 6 8 10

141
On the other hand, as treatment concentrations increased from 4% to 6% NaOH, the
composite strength (from 14 MPa to 32 MPa) and extension at break (from 0.6 mm
to 1.2 mm) greatly increased. At higher concentrations (8-10% NaOH), strength and
extension at break stabilised at around 35 MPa and 1.5 mm. These results indicated
that, at higher (6-10%) NaOH concentrations, hemicellulose and lignin coverings
were removed from the cellulose surface and allowed for strong bonding with the
matrix. Strong interface bonding reduced fibre bending and fibre sliding within the
matrix during shear deformations. As a result, the load transfer capacity at the
interface increased and composites exhibited higher shear properties.
Fibre acetylation on composites
Figure 6.21 shows the typical shear stress-extension curve for NaOH pre-treated
acetylated fibre composites, and their properties are summarised in Table 6.3. The
changes in strength and extension at break of the acetylated composites are presented
in Figure 6.22. From Figure 6.22 it can be observed that acetyl treatments on 4%
NaOH pre-treated samples increased more than double the strength and extension at
break when compared to 4% NaOH treated samples. These results indicated that the
4% NaOH pre-treatment exposed fibre hydroxyl groups. Further acetylation
esterified these hydroxyl groups within the pre-treated fibres and promoted strong
bonding between fibres and matrix. This activity facilitated strong interface bonding
thus justifying the higher shear strengths and extensions at break that were achieved.
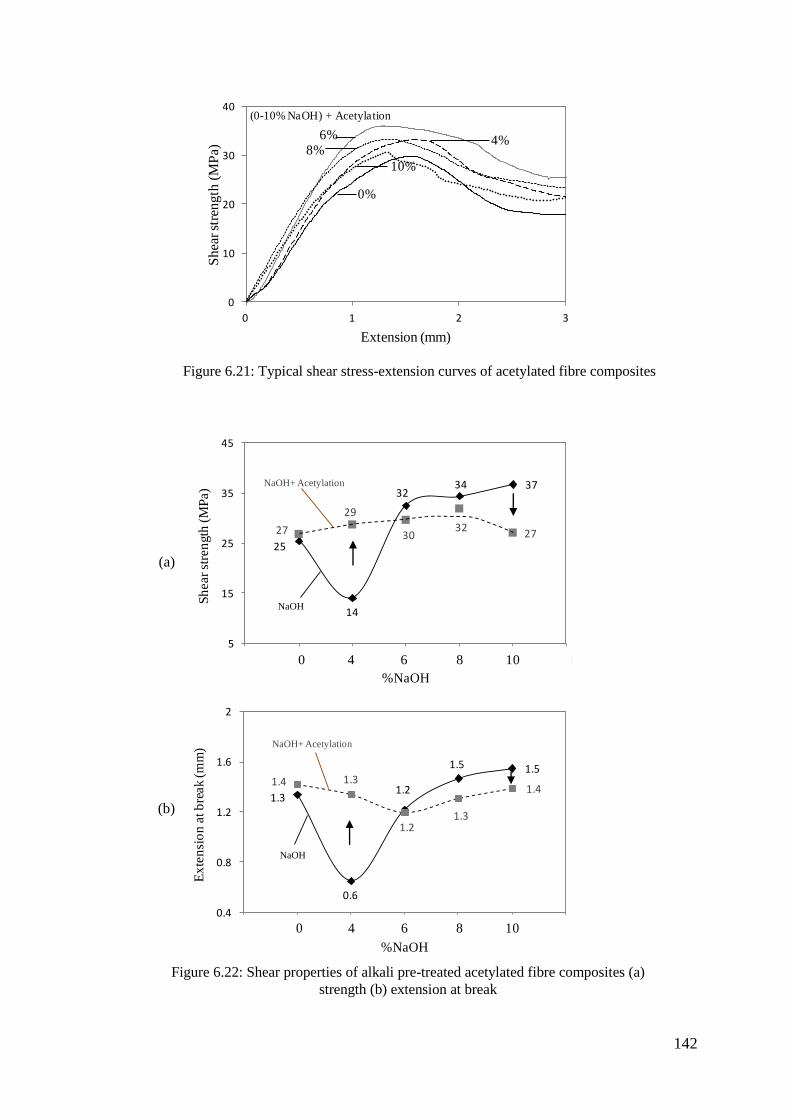
142
0
10
20
30
40
0 1 2 3
Sh
ear st
ren
gth
(M
Pa)
Extension (mm)
(0-10% NaOH) + Acetylation
0%
6%8%
4%
10%
Figure 6.21: Typical shear stress-extension curves of acetylated fibre composites
(a)
25
14
3234 37
27
29
3032
27
5
15
25
35
45
0 2 4 6 8 10 12
Sh
ear
stre
ngth
(M
Pa)
%NaOH
NaOH+ Acetylation
0 4 6 8 10
NaOH
(b)
1.3
0.6
1.2
1.5 1.51.4 1.3
1.21.3
1.4
0.4
0.8
1.2
1.6
2
0 2 4 6 8 10 12
Ex
ten
sio
n a
t b
reak (
mm
)
%NaOH
NaOH+ Acetylation
0 4 6 8 10
NaOH
Figure 6.22: Shear properties of alkali pre-treated acetylated fibre composites (a)
strength (b) extension at break
143
There was an optimum concentration level which allowed for stronger composite
properties to be achieved. Beyond this limit, composite properties were
compromised. Specifically, at higher concentrations (6-10%) of NaOH pre-treatment
and further acetyl treatments on the fibres, excess removal of hemicellulose and
lignin constituents took place. This caused fibre weaknesses in carrying shear loads.
As can be seen in Figures 6.22a and 6.22b, the dual treated samples exhibited
lowered shear strengths and extensions at break compared to the 6-10% NaOH
treated samples.
Fibre silanisation on composites
Figure 6.24 presents a typical shear stress-extension curve for NaOH pre-treated
silanised fibre composites, and their properties are summarised in Table 6.3. The
changes in strength and extension at break of the silanised composites are presented
in Figure 6.24. From Figure 6.24a it can be observed that silane treatments on alkali
(0-4% NaOH) pre-treated fibres initially increased the composite‘s strength then
significantly decreased their strength at higher pre-treatment concentrations (6-10%
NaOH) compared to NaOH treated samples. When 4% NaOH treated fibre was then
treated with silane, the hydroxyl groups reacted with silane to form silanols. Silanols
produced strong couplings at the fibre matrix interface. During shear loading, strong
interfaces reduced fibre bending and fibre sliding in the matrix and thus composites
exhibited higher stress transfer capacities. As a result, silane treatments on 4% NaOH
pre-treated composites showed over 85% higher shear strength compared to 4%
NaOH treated samples.

144
(a)
25
14
3234 37
28
26 27
21
24
5
15
25
35
45
0 2 4 6 8 10 12
Sh
ear
stre
ngth
(M
Pa)
%NaOH
NaOH+ Silane
0 4 6 8 10
NaOH
(b)
1.3
0.6
1.2
1.5 1.5
1.1
1.5 1.5
1.2
1.5
0.4
0.8
1.2
1.6
2
0 2 4 6 8 10 12
Ex
ten
sio
n a
t b
reak (
mm
)
%NaOH
NaOH+ Silane
0 4 6 8 10
NaOH
Figure 6.24: Shear properties of alkali pre-treated silanised fibre composites (a) strength
(b) extension at break
Figure 6.24: Typical shear stress-extension curves of silanised fibre composites
0
10
20
30
0 1 2 3
Sh
ear
str
en
gth
(M
Pa)
Extension (mm)
(0-10% NaOH) + Silane0%
4%
8%
10%
6%

145
At higher (6-10%) NaOH pre-treatment conditions, hydroxyl groups attached with
hemicellulose and lignin were removed from the fibres. Silane treatments on the pre-
treated fibres were ineffective as insufficient hydroxyl groups were left to form
silanols, thus reducing coupling efficiency at their interfaces. Due to this, weak
interface bonding was prevalent and composites failed at lower shear loads.
From Figure 6.24b it can be observed that 4-6% NaOH pre-treated silanised samples
exhibits higher extension at break compared to the NaOH treated samples. Silane
couplings at the interface experienced shear deformation during fibre bending.
Further fibre bending caused a gradual breakdown of couplings and allowed the
fibres to slide from their surrounding matrix. At this stage, silane coupling
contributed additional shear resistance during composite deformation and exhibited
higher extension at break. However, at higher (8-10%) NaOH pre-treatment
concentrations, fibres became weak in resisting progressive fibre bending and thus
failed at lower extensions compared to the NaOH treated samples.
Among all the above mentioned treatments, higher concentrations of NaOH (6-10%)
exhibited higher shear strengths and deformations compared to untreated fibres.
These results proved that higher NaOH concentrations effectively removed
hemicellulose and lignin coverings from the cellulose surfaces in the fibres.
Cellulose microfibrils then reacted with the matrix and provided strong interface
bonding thus improving composite shear properties. On the other hand, acetyl
treatments on the alkali pre-treated fibres showed improvements in the composite‘s
shear strength and extension up to 4% NaOH pre-treatment conditions. At higher
pre-treatment concentrations (6-10% NaOH) composite properties decreased. As

146
acetylation esterified hydroxyl groups and also removed the surface coverings from
the 4% NaOH treated fibres, matrices formed strong bonding with cellulose
microfibrils. During shear loading, strong interface bonding provided higher
resistance against fibre bending and thus improved composite strength and extension.
However, at higher NaOH pre-treatment concentrations, fibres had less available
hydroxyl groups on the fibres. Further acetylation could not effectively esterify the
hydroxyl groups. Due to this, weak interface bonding took place and composites
exhibited lower shear properties. Similar observations were also made for alkali pre-
treated silanised fibre composites. In this case, silane molecules could effectively
form couplings with the 4% NaOH pre-treated fibres and composites exhibited
higher shear properties. At higher (6-10%) NaOH pre-treatment concentrations,
silanols could not form due to a lack of available hydroxyl groups on the pre-treated
fibres. As a result, weak interface bonding took place and composites exhibited
lower shear properties.
6.2.4 Flexural properties of composites
Flexural properties of composites were measured through conventional three-point
bending tests. Flexural load was applied perpendicularly to the fibre direction.
Initially, the loading nose came in contact with the upper surface of the specimen.
Load was transferred from the elastic matrix to the fibres. Under incremental loading
the fibres started to bend, and strained into the matrix. Bent fibres generated further
strains to neighbouring fibres and caused them to bend also (Huang 2004). This led
to fibre-matrix interface instability and generated disproportionately high stresses on
the matrix. As a result, the matrix shifted from elastic to plastic deformation and
initiated damage of the composites.

147
During flexural testing, the top and bottom faces of the specimen mid-section
experienced compressive and tensile stresses. Compressive stresses produced large
longitudinal tensile stresses on the lower surfaces of the specimen. The combination
of vertical compressive stress and longitudinal tensile stress produced shear stresses
(Jeng & Chen 2000; Lu, Kao & Su 1998). Figure 6.25 presents a schematic diagram
which outlining the flexural load distribution on composites.
Figure 6.26 shows typical flexural failure modes of the tested samples. From this
figure it can be observed that considerable damage appeared on the compression side
of the specimen. An upper shear crack is visible just below the compressive crack.
The compression cracks propagate downward causing the expansion of the upper
shear cracks. Moreover, the compression and upper shear cracks produced the
tension crack at the specimen‘s bottom layer. A shear crack is also visible at the
bottom face of the specimen just above the tension crack. Tensile failure of the
outermost fibres on the tension side is observed.
Figure 6.25: Schematic diagram of flexural load distribution on the composite
Loading nose
1
3 2
4
1. Compression
2, 3. Shear
4. Tension

148
Figure 6.27 presents a typical flexural stress-strain curve for untreated fibre
composites. The curve shows that the material response was linear (elastic-linear) up
to the strength of around 80 MPa and strain of 0.0095 where both fibre and matrix
behaved linearly. The linear elastic response was marked by α. Afterwards, the curve
deviated from this linear proportionality and a geometric nonlinear response went up
to a stress of about 190 MPa and the failure stress point was reached. At this stage,
Shear failure
Tensile failure
Fibre tensile
failure of the
bottom face of
the specimen
Figure 6.26: Typical flexural failure modes of tested samples
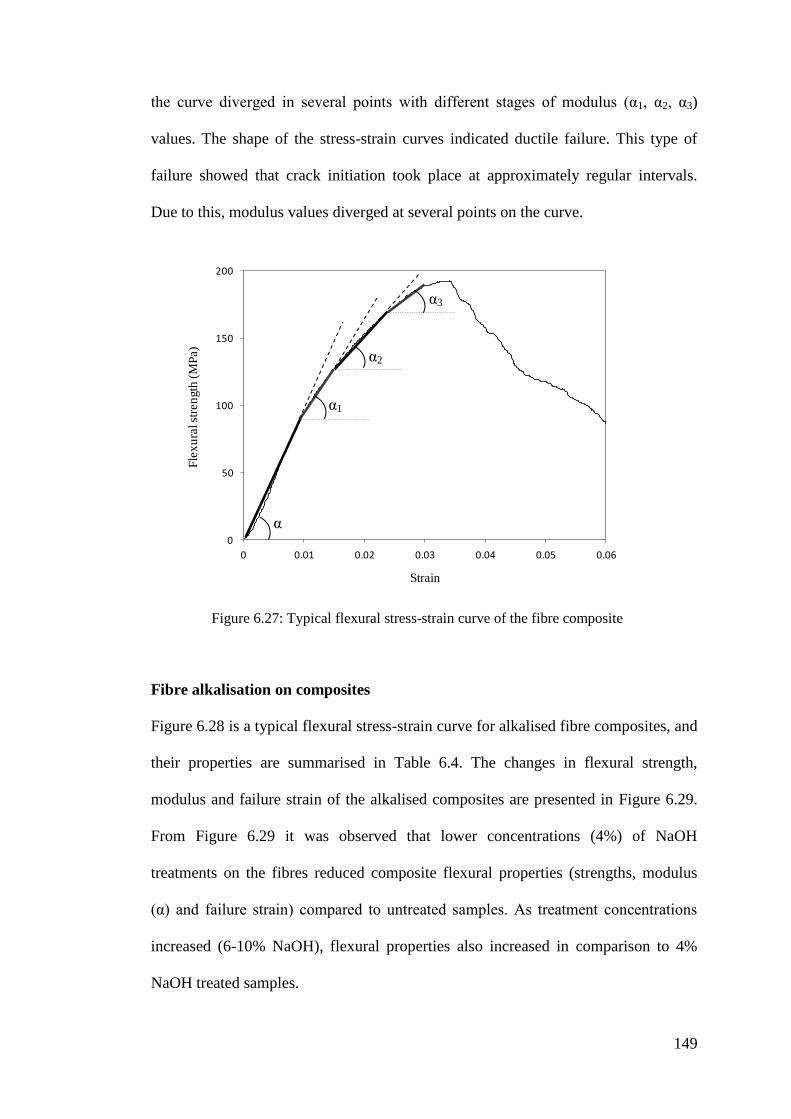
149
the curve diverged in several points with different stages of modulus (α1, α2, α3)
values. The shape of the stress-strain curves indicated ductile failure. This type of
failure showed that crack initiation took place at approximately regular intervals.
Due to this, modulus values diverged at several points on the curve.
Fibre alkalisation on composites
Figure 6.28 is a typical flexural stress-strain curve for alkalised fibre composites, and
their properties are summarised in Table 6.4. The changes in flexural strength,
modulus and failure strain of the alkalised composites are presented in Figure 6.29.
From Figure 6.29 it was observed that lower concentrations (4%) of NaOH
treatments on the fibres reduced composite flexural properties (strengths, modulus
(α) and failure strain) compared to untreated samples. As treatment concentrations
increased (6-10% NaOH), flexural properties also increased in comparison to 4%
NaOH treated samples.
Figure 6.27: Typical flexural stress-strain curve of the fibre composite
0
50
100
150
200
0 0.01 0.02 0.03 0.04 0.05 0.06
Fle
xu
ral st
ren
gth
(M
Pa)
Strain
α
α1
α2
α3

150
Table 6.4: Flexural properties of composites with different fibre treatments Fibre
treatments Alkalisation Alkalisation + Acetylation Alkalisation + Silanisation
Strength
(MPa) Stages of modulus (GPa) Strain
at
break
(%)
Strength
(MPa) Stages of modulus (GPa) Strain
at
break
(%)
Strength
(MPa) Stages of modulus (GPa) Strain
at
break
(%)
% NaOH
α α1 α 2 α 3 α α1 α 2 α 3 α α1 α 2 α 3
0
190.87 ±1.92
12.56 ±1.75
7.72 ±0.33
5.33 ±0.27
3.75 ±0.41
3.56 ±0.16
254.78 ±16.35
18.64 ±2.05
12.59 ±1.28
8.15 ±0.55
5.81 ±0.35
3.19 ±0.10
182.08 ±10.15
10.88 ±0.94
8.28 ±0.73
5.90 ±0.47
4.36 ±0.26
2.84 ±0.06
4
174.97 ±17.27
11.83 ±1.68
7.75 ±0.65
5.27 ±0.52
3.89 ±0.24
3.26 ±0.17
197.63 ±3.59
13.80 ±0.57
9.25 ±0.66
5.86 ±0.22
4.04 ±0.23
2.97 ±0.01
185.59 ±2.67
11.26 ±0.54
7.27 ±1.24
5.16 ±0.43
2.92 ±0.28
3.21 ±0.18
6
213.10 ±11.64
14.34 ±0.91
9.68 ±0.73
6.79 ±0.68
5.04 ±0.25
2.92 ±0.01
213.37 ±8.82
15.04 ±1.52
9.85 ±0.64
6.58 ±0.33
4.79 ±0.60
2.87 ±0.01
176.62 ±8.08
13.63 ±1.28
7.63 ±0.51
5.51 ±1.02
3.67 ±0.37
3.14 ±0.04
8
221.71 ±14.28
14.64 ±0.50
8.40 ±0.09
4.97 ±0.37
3.16 ±0.23
3.35 ±0.01
209.37 ±6.48
15.27 ±0.57
10.25 ±1.00
6.67 ±0.32
4.75 ±0.39
3.14 ±0.15
132.94 ±2.87
8.57 ±0.49
4.79 ±0.45
3.43 ±0.11
2.11 ±0.16
3.99 ±0.51
10
218.75 ±6.37
10.83 ±0.77
6.53 ±0.24
4.09 ±0.21
2.76 ±0.28
4.32 ±0.01
188.99 ±19.95
11.47 ±1.16
7.03 ±0.58
4.90 ±0.38
3.72 ±0.29
3.67 ±0.12
155.30 ±6.01
10.78 ±0.68
5.59 ±0.33
3.68 ±0.25
2.43 ±0.28
4.23 ±0.08

151
(b)
(a)
(a)
191
175
213
222
219
150
175
200
225
250
0 2 4 6 8 10 12
Fle
xu
ral st
ren
gth
(M
Pa)
%NaOH
(0-10%NaOH)
0 4 6 8 10
(b)
12.6
12.0
14.3 14.6
11.0
6
10
14
18
0 2 4 6 8 10 12
Fle
xu
ral m
od
ulu
s (G
Pa)
%NaOH
Modulus (α)(0-10%NaOH)
0 4 6 8 10
0
50
100
150
200
250
0 0.01 0.02 0.03 0.04 0.05 0.06
Ben
din
g s
tren
gth
(M
Pa)
Strain
(0-10% NaOH)
0%
10%
8%
6%
4%
Fle
xura
l st
rength
(MP
a)
Figure 6.28: Typical flexural stress-strain curves of alkalised fibre composites

152
As discussed in previous sections, lower treatment concentrations (4% NaOH)
produced weak interface bonding between the fibres and matrix. Weak bonding
reduced the matrix support to the fibres which ultimately lowered frictional
resistance at their interface. During flexural loading, compressive cracking was
initiated at weak interfaces due to fibres bending in the matrix. Compressive cracks
generated further strains on neighbouring interfaces. The bottom surface of the
(c)
7.7
7.7
10.0
8.4
6.5
5
7
9
11
0 2 4 6 8 10 12
Fle
xu
ral m
od
ulu
s (
GP
a)
%NaOH
Modulus (α1)(0-10%NaOH)
0 4 6 8 10
Figure 6.29: Flexural properties of alkalised fibre composites (a) strength (b) α (c) α1 (d)
failure strain
(d)
0.036 0.033
0.029
0.033
0.043
0.02
0.03
0.04
0.05
0 2 4 6 8 10 12
Fail
ure
str
ain
%NaOH
(0-10%NaOH)
0 4 6 8 10

153
specimens experienced relatively higher tensile stresses due to the contribution of
progressive compressive cracks. The higher tensile stresses and the progressive
compressive cracks collectively caused tensile failure of the fibre and thus failure of
overall composites. As a result, weak interface bonding reduced the composite‘s
ultimate load carrying capacities and consequently reduced its strength, strain and
modulus values.
However, at higher treatments concentrations (6-10% NaOH), composite strengths
increased from around 175 MPa to 220 MPa compared to 4% NaOH treated samples.
The enhanced composite properties were primarily governed by the higher degree of
interface bonding which facilitated greater load transfer action of the samples. This
was possibly due to the fact that higher NaOH concentrations effectively removed
the hemicellulose and lignin coverings from the fibre surface. As a result, more
accessible cellulose surfaces were exposed for matrix adhesion and thus produced
strong interface bonding.
Beyond optimum concentration levels, fibres began losing their strength. During
composite deformations, weak fibres gradually deformed at the strong fibre-matrix
interfaces. From Figure 6.29d it can be seen that higher concentrations (6-10%) of
NaOH treatments increase the composites failure strain. This was indicative of weak
fibre deformation at their strong interface. Thus, the materials were able to sustain
large deflections before the break. Similar observations were made from Figures
6.29b and 6.29c where the moduli (α, α1) also decreased at higher treatment
concentrations (6-10% NaOH). At α and α1, interface cracks developed and
propagated throughout the matrix. Weak fibres gradually lost their load carrying

154
capacities to bridge the matrix cracks and failed under large deformations, thus
reducing composite moduli.
Fibre acetylation on composites
Figure 6.30 is a typical flexural stress-strain curve of NaOH pre-treated acetylated
fibre composites, and their properties are summarised in Table 6.4. The changes in
strength modulus and failure strain of the acetylated composites are presented in
Figure 6.31. From Figure 6.31 it is observed that acetyl treatments on untreated
fibres (0% NaOH) increase composites‘ strength from 191 MPa to 255 MPa which is
an increase of 30%. Similarly, composites‘ moduli also increase (α=48%, α1=63%,
α2=53%, α3=55%) but the failure strain is decreased when compared to untreated
samples (Table 6.4). These results indicated that acetylation removed the
hemicellulose and lignin coverings and also esterified hydroxyl groups present
within the fibre. Consequently, interface adhesion increased, allowing the composites
to carry greater flexural loads at relatively small elongations. As a result, the flexural
properties of the acetylated composites increased.
0
50
100
150
200
250
0 0.01 0.02 0.03 0.04 0.05 0.06
Ben
din
g s
tren
gth
(M
Pa)
Strain
(0-10% NaOH) + Acetylation
0%
6%
4%
8%
10%
Fle
xura
l st
rength
(M
Pa)
Figure 6.30: Typical flexural stress-strain curves of acetylated fibre composites

155
(a)
191
175
213
222
219
255
198
213
209
189
150
175
200
225
250
275
0 2 4 6 8 10 12
Fle
xu
ral st
ren
gth
(M
Pa)
%NaOH
NaOH+ Acetylation
0 4 6 8 10
NaOH
(b)
12.6
12.0
14.3 14.6
11.0
18.6
13.815.0 15.3
11.5
7
12
17
22
0 2 4 6 8 10 12
Fle
xu
ral m
od
ulu
s (G
Pa)
%NaOH
NaOH+ Acetylation
0 4 6 8 10
NaOH
Modulus (α)
(c)
7.7
7.7
9.7
8.4
6.5
12.6
9.29.8
10.2
7.0
6
8
10
12
14
0 2 4 6 8 10 12
Fle
xu
ral m
od
ulu
s (G
Pa)
%NaOH
NaOH+ Acetylation
NaOH
Modulus (α1)
0 4 6 8 10

156
Acetyl treatments on the 4% NaOH pre-treated sample also improved composites‘
strength and moduli compared to the 4% NaOH treated samples. The hydroxyl
groups presented on the pre-treated fibre were esterified during acetyl treatments.
Also, the hemicellulose and lignin constituents were removed through acetylation.
Due to this, cellulose surfaces were more accessible for matrix adhesion which
promoted strong fibre-matrix interface bonding. As a result, the application of two
consecutive treatments on the fibres improved the composites‘ properties.
However, at higher (6-10%) NaOH pre-treatment concentrations, further acetylation
caused greater removal of fibre surface coverings thus enhancing interface bonding.
Fibres became weaker in strength due to the removal of hemicellulose and lignin
covering materials. During flexural loading, weak fibres transferred compressive
loads effectively through strong interfaces but suddenly failed under tensile loading.
These observations can be further supported by the tensile (Section 6.2.1, Figure 6.5)
(d)
0.0360.033
0.029
0.033
0.043
0.032
0.0300.029
0.031
0.037
0.02
0.03
0.04
0.05
0 2 4 6 8 10 12
Fail
ure
str
ain
%NaOH
NaOH+ Acetylation
0 4 6 8 10
NaOH
Figure 6.31: Flexural properties of alkali pre-treated acetylated fibre composites
(a) strength (b) α (c) α1 (d) failure strain

157
and compressive properties (Section 6.2.2, Figure 6.12) of the acetylated composites.
Thus, 6-10% NaOH pre-treated acetylated samples exhibited lower flexural strength
but higher modulus compared to the NaOH treated samples.
Fibre silanisation on composites
Figure 6.32 is a typical flexural stress-strain curve for silanised fibre composites, and
their properties are summarised in Table 6.4. The changes in flexural strength and
modulus of the silanised composites are presented in Figure 6.32. From Figure 6.32
it is observed that silane treatments on the untreated fibres reduced the composite‘s
flexural strengths and moduli. These results indicated that silane molecules were
unable to penetrate the untreated fibre surfaces due to the presence of surface
coverings. As a result, weak interface bonding took place and the composites failed
with lower flexural properties compared to the untreated sample.
Figure 6.32: Typical flexural stress-strain curves of silanised fibre composites
0
50
100
150
200
0 0.01 0.02 0.03 0.04 0.05 0.06
Ben
din
g s
tren
gth
(M
Pa)
Strain
(0-10% NaOH) + Silane
8%
10%
0%
4%6%
Fle
xura
l st
rength
(M
Pa)

158
(a)
191
175
213222
219
182
185
177
133
155
100
125
150
175
200
225
250
0 2 4 6 8 10 12
Fle
xu
ral s
tren
gth
(M
Pa)
%NaOH
NaOH+ Silane
0 4 6 8 10
NaOH
(b)
12.6 11.8
14.3 14.6
11.010.8
11.3
13.6
8.6
10.8
7
10
13
16
0 2 4 6 8 10 12
Fle
xu
ral m
od
ulus
(G
Pa)
%NaOH
NaOH+ Silane
0 4 6 8 10
NaOH
Modulus (α)
Figure 6.33: Flexural properties of alkali pre-treated silanised fibre composites
(a) strength (b) α (c) α1
(c)
7.7
7.7
10
8.4
6.5
8.3
7.3 7.6
4.8 5.6
4
6
8
10
12
0 2 4 6 8 10 12
Fle
xu
ral m
od
ulu
s (G
Pa)
%NaOH
NaOH+ Silane
NaOH
Modulus (α1)
0 4 6 8 10
159
However, silane treatments on the 4% NaOH pre-treated samples exhibited higher
strength compared to the 4% NaOH treated samples. This again proved that silane
molecules formed strong couplings with the pre-treated fibres in the presence of fibre
hydroxyl groups. This provided strong bonding between the fibres and matrix, and
the composites were able to transfer greater flexural loadings compared to the 4%
NaOH treated samples (Figure 6.33a).
As pre-treatment concentrations (6-10% NaOH) increased, fibres lost their hydroxyl
groups and silane molecules could not achieve sufficient reaction sites to form strong
couplings with the fibres. This created weaknesses at the fibre-matrix interface. As a
result, silanisation on the pre-treated fibres exhibited lower strengths and moduli
compared to the 6-10% NaOH treated samples (Figure 6.33).
From the above analysis, it can be stated that higher concentrations (6-10%) of
NaOH treatments on untreated fibres improved composite flexural properties. Fibre
surface coverings were removed at higher treatment concentrations, which facilitated
stronger bonding with the matrix and thus exhibited higher properties. However,
acetyl treatments effectively removed fibre surface coverings and also esterified
hydroxyl groups from the (0-4%) NaOH pre-treated fibres. Stronger interface
bonding was achieved and composites exhibited higher flexural properties.
Therefore, higher (6-10%) NaOH concentrations weakened fibres and further
acetylation caused more losses of fibre strength. Consequently, at higher pre-
treatment conditions, acetylated samples exhibited lower strengths. Similarly, silane
treatments on the alkali pre-treated fibre composites initially showed higher
strengths, but at higher pre-treatments conditions the samples exhibited lower

160
properties compared to the NaOH treated samples. This was due to the reduced
amounts of hydroxyl groups being present on the pre-treated fibres forming strong
silane couplings with the fibre. As a result, weak interface bonding took place and
composites exhibited lower flexural properties.
6.2.5 Impact properties of composites
Impact testing utilises a sudden application of force to a part of a structure that
produces gross damage in the structure. The damage absorbed by the material
reflected the impact energy absorption capacity of the structure (Delfosse &
Poursartip 1997).
During impact, the specimen generally experiences localised bending in which the
upper face experiences compression whilst the lower face experiences tension
(Hamada, Ramakrishna & Satoh 1995). Compressive stress at the upper face
produces high progressive tensile stresses on the lower face. As the impact process
progresses, the laminate continue to become strained under tension, until matrix
cracking takes place. At this point, fibres are used to carry load to bridge the matrix
crack. These cracks are extended to the neighbouring fibre and the fibre-matrix
interfaces. Further matrix cracking produced stress concentrations on the bridging
fibre (Shyr & Pan 2003; Singleton, et al. 2003). As a result, fibres undergo heavy
tensile deformation and tend to slide or become pulled-out from the surrounding
matrix. There is a substantial frictional resistance to sliding taking place because of
the interface bonding (Reid & Zhou 2000). A higher frictional resistance from the
interface delays the initiation of fibre sliding and thus improve the overall impact

161
resistance properties. Conversely, weak bonding allows the fibre to be pulled-out
easily from the matrix and thus reduces the composites impact resistance capacity.
The impacted composite specimen can produce different damage modes
simultaneously. The damage mode can be categorised as through matrix cracking,
fibre matrix debonding, fibre pull-out from the surrounding matrix and fibre failure
(Delfosse & Poursartip 1997; Hamada, Ramakrishna & Satoh 1995). Following
matrix cracking, the fibre failures occur. The matrix cracking and fibre failure are an
important source of impact energy absorption in composites.
A schematic diagram of the impact damage process was presented in Figure 6.34
(David-West, Nash & Banks 2008; Henkhaus 2003). At first, the projectile comes
into contact with the specimen with an impact velocity. The projectile then starts to
penetrate into the specimen and the surrounding matrix undergoes a compression-
shear mode of damage, whereby the lower face of the specimen experiences a
tension-shear mode of damage. During the entire impact process, as the projectile
penetrates through the sample, frictional resistance from the interface develops. The
amount of frictional resistance from the specimen is known as the energy absorption
capacity of the sample (Belingardi, Cavatorta & Salvatore 2008).
The relationships between impact load, damage initiation and energy absorption were
used to characterise the impact performance of the composites. Key impact
parameters such as peak load, energy at peak load, deflection at peak load and
absorbed energy data were recorded from the test. An analysis of force/time and
force/ displacement curves allowed for the calculation of impact energy.

162
Figure 6.35 shows typical impact force-deflection and energy-deflection curves of
fibre composites. From Figure 6.35, the impact force at the contact stages between
the projectile and specimen increased sharply to a maximum value, and then
gradually decreased. The curve was linear up to the maximum force of around 315 N
where the deformation recorded was about 12 mm. No damages were developed in
the specimen at this stage. At the maximum force, a crack in the matrix was initiated
and then cracks were propagated along the interfaces. The interface crack initiated
debonding and delamination of the composites. From the maximum load, a rapid
load drop of 210 N was observed which was accompanied by the formation of large
cracking randomly orientated throughout the specimen. After the initial load drop,
the curve was serrated. The load fluctuations were caused by various micro-fracture
1- Impact contact
2- Compression
3- Compression-shear
4- Tension-shear
5- Tension
Figure 6.34: Schematic diagram of impact damage processes
Fibre bending due
to compression Impactor
Unidirectional fibres
Fibre tensile
failures Matrix cracks
due to shear
Matrix cracks
due to tension

163
processes in the specimen. At this stage, the magnitude of load fluctuations depended
on the quality of interface bonding. The microcrack formation continues up to the
specimen deformation of about 32 mm. Afterwards, progressive interface cracks
spread away from the impact point and new debondings were created in
neighbouring interfaces. As a result, load drops continued and reached at around 150
N with a deformation of about 33 mm. The load bearing capacity of the sample
diminished as the impact forces decreased down zero, where the deformation was
recorded as around 50 mm. At this stage, fibres were fractured in tension and final
failure of the specimens took place.
From Figure 6.36, using the total area under the force–time curve, it is possible to
deduce the total energy require to initiate and propagate the specimen damage
(Belingardi, Cavatorta & Salvatore 2008). The damage is initiated on the composites
at a maximum impact energy (EMax), corresponding to the maximum impact force.
Figure 6.35: Typical impact force-deflection and energy-deflection curves of fibre
composites
0
2
4
6
8
0
50
100
150
200
250
300
350
0 10 20 30 40 50
Imp
act e
ner
gy (
J)
Imp
act f
orc
e (N
)
Deflection (mm)
Matrix crack
Compression
& shear crackTensile &
shear crack
Tensile crack
164
Once the impact energy is high enough, the composite failures eventually take place.
At this stage, the entire impact energies is absorbed (Ea) by the specimen. If the
specimen does not completely fail, the projectile bounces back from the specimen.
The energy created when the projectile bounces back is known as rebounded energy
(Er). When the specimen fails, the projectile is not rebound. Once the rebound energy
became zero, all of the impactor energy is absorbed by the specimen and complete
failure of the specimen occurs (Belingardi, Cavatorta & Salvatore 2008). From this
discussion it can be stated that, the initial impacts create rebound cases, the later
impacts increase the absorbed energy, thus decreasing the rebound energy. Here, the
absorbed energy (Ea) was calculated by subtracting the rebound energy (Er) from the
maximum impact energy (EMax). Additionally, the damage degree (DD) was
calculated from the ratio of absorbed energy (Ea) to impact energy (EMax)
(Belingardi, Cavatorta & Salvatore 2008). Table 6.9 outlines the impact properties of
the composites under different treatment conditions.
EMax = Ea + Er (6.1)
DD = Ea/ EMax (6.2)

165
Table 6.5: Impact properties of composites with different fibre treatments Fibre
treatments
Alkalisation Alkalisation + Silanisation Alkalisation + Acetylation
Energy (J) Energy (J) Energy (J)
% NaOH EMax Ea Er DD EMax Ea Er DD EMax Ea Er DD
0 7.60 ±0.22
7.25 ±0.22
0.34 ±0.01
0.95 ±0.01
6.76 ±0.42
6.37 ±0.43
0.38 ±0.05
0.94 ±0.01
5.92 ±0.73
5.56 ±0.74
0.36 ±0.02
0.93 ±0.01
4 5.33 ±0.53
4.76 ±0.46
0.57 ±0.15
0.89 ±0.02
6.69 ±0.89
6.33 ±0.92
0.36 ±0.04
0.94 ±0.01
3.87 ±0.38
3.43 ±0.38
0.44 ±0.01
0.88 ±0.01
6 5.86 ±0.69
5.33 ±0.69
0.52 ±0.08
0.90 ±0.01
6.90 ±0.11
6.51 ±0.10
0.39 ±0.08
0.94 ±0.01
6.93 ±1.43
6.63 ±1.43
0.30 ±0.06
0.95 ±0.02
8 4.69 ±0.43
4.11 ±0.36
0.58 ±0.09
0.87 ±0.01
6.86 ±0.33
6.51 ±0.33
0.34 ±0.004
0.95 ±0.001
5.94 ±0.27
5.53 ±0.27
0.40 ±0.007
0.93 ±0.01
10 5.53 ±0.69
5.00 ±0.82
0.52 ±0.13
0.90 ±0.03
7.25 ±0.43
6.91 ±0.44
0.34 ±0.01
0.95 ±0.01
5.17 ±0.49
4.74 ±0.49
0.43 ±0.09
0.92 ±0.01
Fibre alkalisation on composites
Figure 6.37 shows the typical impact force-time and energy-time curves of alkalised
fibre composites, and their properties are summarised in Table 6.5. The changes in
Ea, Er and DD of the alkalised composites are presented in Figure 6.38.
0
2
4
6
8
0
50
100
150
200
250
300
350
0 10 20 30 40 50 60
Imp
act e
ner
gy (
J)
Imp
act f
orc
e (N
)
Time (ms)
Absorbed energy
Maximum energy
Rebounded energy
Figure 6.36: Typical impact force-time and energy-time curves of fibre composites

166
0
2
4
6
8
0 20 40 60
Imp
act en
erg
y (
J)
Time (ms)
6%
4%
8%
10%
0-10% NaOH
0%
Figure 6.37: Typical impact energy-time curves of alkalised fibre composites
(a)
7.2
4.7
5.3
4.1
5.0
2
4
6
8
0 2 4 6 8 10 12
Imp
act en
erg
y (
J)
%NaOH
(0-10% NaOH)
0 4 6 8 10
Ea
(b)
0.34
0.57
0.52
0.58
0.52
0.3
0.5
0.7
0 2 4 6 8 10 12
Imp
act en
erg
y (
J)
%NaOH
(0-10%NaOH)
0 4 6 8 10
Er

167
During impact, the specimen simultaneously experienced compressive, shear and
tensile loadings. Strong interface bonding between the fibre and matrix provided
greater resistance during compression and shear. Conversely, strong fibre strength
contributed to higher tensile properties.
From the previous sections, it was observed that alkali treatments removed fibre
surface coverings and facilitated strong fibre-matrix interface bonding. Strong
bonding provided higher compressive and shear strengths of the composites.
However, due to the fibre weakness caused by the treatments, tensile properties of
the composites were decreased.
From Figure 6.38 it can be seen that alkali treated fibre composites exhibited lower
Ea and DD but higher Er values compared to the untreated samples. The lower Ea
indicates that, treated samples absorb less impact energy due to the strong interface
bonding (Bledzki, et al. 2008). During impact, strong interface bonding generated
higher resistances of fibre bending (during compression) and fibre sliding (during
(c)
0.95
0.890.90
0.87
0.90
0.8
0.9
1
0 2 4 6 8 10 12
Dam
age d
egre
e
%NaOH
(0-10% NaOH)
0 4 6 8 10
DD
Figure 6.38: Impact properties of alkalised fibre composites (a) Ea (b) Er (c) DD

168
shear) from their surrounding matrix. Due to this, the overall impact resistance
properties of the treated composites increased and exhibited lower absorbed energies
(Figure 6.38a).
Likewise, the higher Er values for treated composites indicated that strong interfaces
prevented the impactor from penetrating the samples and thus more rebounded cases
were observed and recorded (Figure 6.38b). Similarly, the lower DD values indicated
that the extent of impact damage was less on treated specimens (Figure 6.38c). These
results again proved that the treated fibres provided strong interface bonding which
were capable of resisting impact damages on the specimens.
Fibre acetylation on composites
Figure 6.39 illustrates the typical impact force-time and energy-time curves of NaOH
pre-treated acetylated fibre composites, and their properties are summarised in Table
6.5. The changes in Ea, Er and DD of the acetylated composites are presented in
Figure 6.40.
0
2
4
6
8
0 20 40 60
Imp
act e
ner
gy (
J)
Time (ms)
AC
6%
4%
8%
10%
(0-10% NaOH) + Acetylation
Figure 6.39: Typical impact energy-time curves of acetylated fibre composites

169
5.6
3.4
6.6
5.5
4.7
7.2
4.75.3
4.1
5.0
2
4
6
8
0 2 4 6 8 10 12
Imp
act en
erg
y (
J)
%NaOH
NaOH+ Acetylation
0 4 6 8 10
NaOH
Ea
(a)
Figure 6.40: Impact properties of alkali pre-treated acetylated fibre composites (a) Ea
(b) Er (c) DD
0.93
0.88
0.95
0.93
0.92
0.95
0.890.90
0.87
0.90
0.85
0.9
0.95
1
0 2 4 6 8 10 12
Dam
age d
egre
e
%NaOH
0 4 6 8 10
NaOHNaOH+ Acetylation
DD
(c)
0.34
0.57
0.52
0.58
0.52
0.36 0.44
0.30
0.40
0.43
0.2
0.4
0.6
0.8
0 2 4 6 8 10 12
Imp
act en
erg
y (
J)
%NaOH
0 4 6 8 10
NaOH
NaOH+ Acetylation
Er
(b)

170
From Figure 6.40 it can be observed that acetyl treatments on the (0-4%) NaOH
treated fibres initially lower the composites‘ Ea and DD values compared to the
NaOH treated samples. These results indicated that acetyl treatments on the (0-4%)
NaOH treated fibres efficiently esterified the existed hydroxyl groups from the fibres
and developed strong interface bonding with the matrix. The strong interface
prevented the initiation of fibre bending (compression) and fibre sliding (shear) into
the matrix. Consequently, the impact resistance properties of the composites
increased. As a result, in the two consecutive treatment conditions, composites
absorbed lower impact energy (Ea) and thus reduced the extent of damage (DD)
compared to the NaOH treated samples.
On the other hand, at higher pre-treatment concentrations (6-10%) fibres were losing
their strength. Further acetylation created more fibre weakness. During impact, weak
fibres could not sustain the large tensile deformations (which exerted from the
progressive compressive and shear deformations of neighbouring fibres) and thus
easily failed at lower loads. As a result, the impactor could easily penetrate through
the samples and lower rebounded values (Er) were recorded compared to the NaOH
treated samples (Figure 6.40b).
Fibre silanisation on composites
Figure 6.41 presents the typical impact force-time and energy-time curves of NaOH
pre-treated silanised fibre composites, and their properties are summarised in Table
6.5. The changes in Ea, Er and DD of the silanised composites are presented in Figure
6.42. From Figure 6.42 it can be observed that silane treatments on the alkali pre-
treated fibres increased the composites Ea and DD values and decreased the Er values

171
compared to the NaOH treated samples. These results clearly indicate that silane
treatments on the alkali pre-treated fibres reduced the impact resistance properties of
the composites. This may be due to the fact that, NaOH pre-treated fibres had less
hydroxyl groups on their surface. Further, silane treatments could not get a sufficient
amount of hydroxyl groups required to form silanols. Due to this, silanols could not
develop strong interface bonding between the fibres and matrix.
0
2
4
6
8
0 20 40 60
Imp
act en
erg
y (
J)
Time (ms)
6%
4%
8%
10%
(0-10% NaOH) + Silane
Sil
Figure 6.41: Typical impact energy-time curves of silanised fibre composites
7.2
4.7
5.3
4.1
5.0
6.4
6.3 6.56.5
6.9
2
4
6
8
10
0 2 4 6 8 10 12
Imp
act en
erg
y (
J)
%NaOH
NaOH+ Silane
0 4 6 8 10
NaOH
Ea
(a)

172
During impact loading, weak interfaces allowed fibre bending and fibres sliding into
matrix. Additionally, silane couplings (chemical layer) at the interface also split by
impact which imposed additional strains on the matrix. For this, matrix cracking was
initiated, which progressively applied higher tensile stresses to the fibres at the
bottom face of the specimen and composites eventually failed. Due to this, the
impactor could easily penetrate through the samples and produce higher degrees of
damage (Figures 6.42b and 6.42c). As a result, composites absorbed large impact
0.34
0.57
0.52
0.58
0.52
0.38
0.360.39
0.340.34
0.2
0.4
0.6
0.8
0 2 4 6 8 10 12
Imp
act en
erg
y (
J)
%NaOH
NaOH+ Silane
0 4 6 8 10
NaOH
Er
(b)
0.95
0.89
0.90
0.87
0.90
0.94
0.94 0.940.95
0.95
0.8
0.85
0.9
0.95
1
0 2 4 6 8 10 12
Dam
age d
egre
e
%NaOH
NaOH+ Silane
0 4 6 8 10
NaOH
DD
(c)
Figure 6.42: Impact properties of alkali pre-treated silanised fibre composites (a) Ea
(b) Er (c) DD

173
energies (Figure 6.42a) thus reducing the impact resistance properties compared to
the NaOH treated samples.
Similar observations were also made for the NaOH pre-treated silanised composites
during compressive (Section 6.2.2, Figure 6.14a), shear (Section 6.2.3, Figure 6.24a)
and flexure (Section 6.2.4, Figure 6.33a) property analysis. In all these cases, alkali
pre-treated silanised composites exhibited lower strengths compared to the NaOH
treated samples. These results indicate that the bonding strengths decreased during
two treatments conditions and thus reduced the impact properties of the composites.
From the above analysis, it can be stated that alkali treatments on the untreated fibres
effectively removed the fibre coverings and thus developed strong interface bonding
to resist impact damages of the composites. As a result, the impact resistance
properties of the composites were increased, reducing damage propagations. On the
other hand, acetyl treatments on the higher concentrations of NaOH pre-treated fibres
reduced the fibres‘ ability to support impact loadings. Due to this, in two treatment
conditions, composites exhibited lower impact properties compared to the NaOH
treated samples. Similar impact properties were also recorded for alkali pre-treated
silanised composites. As alkali pre-treatment removed the hydroxyl groups from the
fibre, further silane treatment could not develop silanols to develop strong interface
bonding. As a result, composites failed under lower impact resistance compared to
the NaOH treated samples.

174
6.3 Summary
In this study, the effects on the mechanical properties of hemp fibres composites
treated by different concentrations of alkali solution (NaOH) and followed by acetyl
and silane treatments were analysed. Tension, compression, shear, flexural and
impact tests were conducted to categorise their properties. In the experiments, it was
found that NaOH could remove the hemicellulose and lignin attached on the surface
of the fibres. These components may affect the interfacial bonding strength between
the fibre and surrounding matrix.
4-10% NaOH treatments on fibres showed two distinguishable mechanical property
features of the composites. 4% NaOH treated composites exhibited lower mechanical
properties whereas 6-10% NaOH treatment cases produced higher properties when
compared to the untreated fibre composites. The removal of hemicellulose and lignin
coverings from the fibre as a result of 4% NaOH treatment was insufficient to
promote effective bonding with the matrix. This treatment facilitated hydroxyl
groups to react with atmospheric moisture. The existence of moisture at the interface
lessened the load carrying capacity of the composites.
6-10% NaOH treated fibres effectively removed hemicellulose and lignin coverings
as well as the hydroxyl groups from the fibre. This reaction provided ample
accessibility for the matrix to react with the fibre cellulose. Thus, stronger interface
boding was achieved, and composites exhibited greater mechanical properties.
These findings were further confirmed as was seen through the mechanical properties
achieved in acetyl and silane treated composites. Both treatments facilitated strong

175
linkages with cellulose within the fibres, in the presence of hydroxyl groups. In both
cases, 4% NaOH pre-treated acetylated and silanised composites exhibited greater
mechanical properties. This was due to the effective esterification that took place.
Silanol formation was also apparent and further produced strong interface bonding.
The opposite results were achieved for higher concentrations of NaOH pre-treated
cases.
Based on the above discussion, it can be stated that chemical treatments on hemp
fibre enhances mechanical properties of their associated composites. Such
improvements were achieved due to an absence of hemicellulose and lignin
coverings at the fibre-matrix interface.

176
Chapter 7: Chemical Treatments on Hemp Fibre Sandwich
Structures
7.1 Introduction
The mechanical properties of fibre reinforced composites do not only depend on
fibre properties, but also on the fibre length and orientation in the polymer matrix.
Long unidirectional fibres can uniformly distribute applied load throughout the
composite structure, while in the case of short and random fibres the load distribution
is discontinued. Additionally, random fibre orientation frequently changes load
distribution paths and multidirectional stresses are imposed within a single plane. As
a result, randomly oriented short fibre composites involve complex load distributions
and their composite properties are relatively lower than that of long unidirectional
fibre composites.
In this chapter, the effect of fibre chemical treatments on sandwich structures,
particularly mechanical property analyses are outlined. Sandwich structures were
used in order to model a complex load distribution between fibre and matrix. A
concept of sandwich laminate was utilised in which short randomly oriented hemp
fibre composites were used as a core, and long continuous hemp woven fabrics
(longitudinal and transverse fibre directions are 0° & 90°) were used as skins. The
skins were adhesively bonded onto the core to enable continuous load transfer
throughout the sandwich structure. This method allowed for the determination of the
effects of treatments on interface bonding strength in a complex distribution load
scenario.

177
The sandwich structures were tested in various loading conditions and their flexural,
shear and compressive behaviours were determined under different fibre treatment
conditions. The failure modes of the tested samples such as core failure, skin
delamination, fibre fracture and fibre-matrix debonding were also examined.
7.2 Result and discussion
7.2.1 Flexural properties of sandwich structures
The effect of chemical treatments on interface bonding between the fibre and matrix
is reflected in the flexural properties of the structure. In flexural testing normal loads
were applied to specimens. The skin located at the top and bottom planes carried
compression and tension respectively, while the core experienced shear. The most
common failure modes of sandwich structures under flexural loading are skin
compressive/tensile failure, skin delamination, core shear failure and core
tensile/compressive failure.
Fibre alkalisation on sandwich structures
Alkali treatments were applied to both short hemp fibres for the core and hemp
woven fabrics for the skin.
Figure 7.1 shows the typical flexural stress-strain curves of alkalised sandwich
structures, and Table 7.1 provides the summary of their results. The stress-strain
curves of the alkalised samples (Figure 7.1) shows linear behaviour until the failure
at the maximum stress. At the maximum stress, load dropped due to the tensile
failure of the specimen. From Figure 7.2a, 4% NaOH treatments on the 0% NaOH
(untreated) fibre reduced composite strength from 47 to 42 MPa, while at higher

178
treatment concentrations (6-10% NaOH) the strength increased and stabilised at
about 60 MPa. Treatments also showed around 26% increase in modulus and 11%
increase in failure strain compared to the 4% NaOH treated samples (Figures 7.2b
and 7.2c). Higher composite properties indicated that strong bonding was provided
through alkalisation of the fibres. Strong interface bonding was achieved due to a
lack of hemicellulose and lignin constituents within 6-10% NaOH treated fibres.
Table 7.1: Flexural properties of the sandwich structures with different fibre
treatments Fibre
treatments Alkalisation Alkalisation + Acetylation Alkalisation + Silanisation
%NaOH
Strength
(MPa) Modulus
(GPa) Failure
strain
(%)
Strength
(MPa) Modulus
(GPa) Failure
strain
(%)
Strength
(MPa) Modulus
(GPa) Failure
strain
(%)
0
47.50 ±1.38
3.44 ±0.21
1.60 ±0.29
44.47 ±2.27
3.74 ±0.25
1.48 ±0.16
49.65 ±3.50
3.14 ±0.45
2.12 ±0.29
4
42.23 ±7.79
3.55 ±0.40
1.59 ±0.26
48.15 ±5.80
3.58 ±0.21
1.51 ±0.23
42.64 ±1.61
3.69 ±0.29
1.41 ±0.11
6
56.84 ±3.45
3.63 ±0.11
1.87 ±0.07
53.00 ±2.46
3.41 ±0.09
1.83 ±0.17
46.69 ±3.26
4.00 ±0.13
1.35 ±0.12
8
59.20 ±3.80
4.47 ±0.14
1.69 ±0.25
54.68 ±1.33
3.93 ±0.10
1.82 ±0.14
52.66 ±4.67
3.40 ±0.54
1.58 ±0.13
10
59.00 ±1.44
4.46 ±0.08
1.76 ±0.01
51.44 ±4.98
3.60 ±0.30
1.71 ±0.09
53.40 ±5.96
3.74 ±0.21
2.16 ±0.23
0
10
20
30
40
50
60
0 0.005 0.01 0.015 0.02
Fle
xu
ral st
ren
gth
(M
Pa)
Strain
0-10% NaOH
0%4%
6%
8%
10%
Tensile failure
Figure 7.1: Typical flexural stress-strain curves of alkalised sandwich structures

179
(c)
Figure 7.2: Flexural properties of alkalised sandwich structures (a) strength (b)
modulus (c) failure strain
0.016
0.016
0.019
0.017
0.018
0.014
0.016
0.018
0.02
0 2 4 6 8 10 12
Fail
ure
str
ain
% NaOH
(0-10% NaOH)
0 4 6 8 10
(a)
47
42
5759
59
30
40
50
60
70
0 2 4 6 8 10 12
Fle
xu
ral st
ren
gth
(M
Pa)
% NaOH
(0-10% NaOH)
0 4 6 8 10
(b)
3.4
3.53.6
4.54.5
3
3.5
4
4.5
5
0 2 4 6 8 10 12
Fle
xu
ral m
od
ulu
s (G
Pa)
% NaOH
(0-10% NaOH)
0 4 6 8 10

180
Fracture behaviours of the untreated and treated samples are presented in Figure 7.3.
Tensile and shear failures of the core, tensile failures of the skin, and delamination of
skin from the core took place. Figure 7.3a indicates that the tensile failure of the skin
and core took place for untreated samples. For 4% NaOH treated samples, an upper
skin delamination was seen (Figure 7.3b). However, for 6-10% NaOH treatment
cases, core shear failure was observed (Figure 7.3c). Upper skin delamination
indicated that weak bonding had taken place due to the presence of hemicellulose
and lignin which were not completely removed from the fibre during 4% NaOH
treatment cases. Thus, composites exhibited lower load carrying capacities. Core
shear failure indicated that strong bonding had taken place in the 6-10% NaOH
treatment cases.
Figure 7.3: Flexural failure modes of (a) untreated (0% NaOH) (b) 4% NaOH (c)
6-10% NaOH treated samples
(a)
Skin and core tensile failure
(b)
Skin delamination
(c)
Core shear failure

181
Figure 7.4 shows micrographs of flexural failure surfaces of untreated and alkalised
composites (core). It was observed that some holes appeared on the fracture surfaces
of the untreated samples and some gaps were present between the fibres and the
matrix interfaces. Under the loading condition, fibres were pulled out from the
matrix and so low strengths were exhibited. This was presumably due to the presence
of hemicellulose and lignin coverings on the fibres surface which hindered the
cellulose surfaces‘ reaction with the matrix. Due to this, weak interface bonding
between fibre and matrix took place and the composites suffered with stress being
transferred from the matrix to the fibres. This observation was a further indication of
Figure 7.4: Micrographs of flexural failure surface of (a, b) untreated (c) NaOH treated
samples
(a) (b)
(c)
Fibre pull-out holes Gaps at the interface

182
the low strength and modulus values that were achieved under mechanical testing of
the untreated samples.
On the other hand, alkali treated fibre composites (core) showed different fracture
surfaces from the untreated samples. There were less fibre pull-out holes, and the gap
between fibre and matrix was also unnoticeable. This indicated that alkali treatments
improved fibre-matrix adhesion. These observations were compatible with the higher
mechanical properties of the composites.
Fibre acetylation on sandwich structures
In Figure 7.5, the typical stress-strain curves of alkali pre-treated acetylated sandwich
structures show linear elastic behaviour until failure. At the maximum stress, the
samples failed in tension. The failure specimens also showed the tensile failure of the
lower skin and core (Figure 7.6).
0
10
20
30
40
50
60
0 0.005 0.01 0.015 0.02
Fle
xu
ral st
ren
gth
(M
Pa)
Strain
(0-10% NaOH) + Acetylation
0% (Ac)
4%
6%
8% 10%
Figure 7.5: Typical flexural stress-strain curves of acetylated sandwich structures

183
Table 7.1 shows that acetylation on 0% NaOH samples exhibited around 9% higher
modulus compared to the untreated samples. This result indicated that acetylation
made the composites stiffer. This was due to the removal of weak boundary layers
(hemicellulose and lignin) from the untreated fibre surfaces which facilitated strong
interface bonding.
From Figure 7.7, it can be observed that acetylation on 4% NaOH pre-treated
samples exhibited over 14% higher strength compared to the 4% NaOH treated
sample. This result indicates that, acetyl groups could have effectively esterified the
hydroxyl groups existing within the pre-treated fibres and facilitated strong fibre-
matrix interface bonding.
Figure 7.6: Flexural failure modes of acetylated sample
44
4853
5551
47
42
5759
59
30
40
50
60
70
0 2 4 6 8 10 12
Fle
xu
ral st
ren
gth
(M
Pa)
% NaOH
NaOH
0 4 6 8 10
NaOH + Acetylation
Figure 7.7: Flexural properties of alkali pre-treated acetylated sandwich structures

184
At higher pre-treatment concentrations (6-10% NaOH), the hydroxyl groups were
removed from the fibres. Further acetylation had less hydroxyl groups within the
fibre to make effective esterification of fibre. Also, in two treatments fibres strength
weakened due to the excessive removal of hemicellulose and lignin constituents from
the fibre. Consequently, the load carrying capacity of the composites was reduced
which resulted lower in strengths when compared to the original 6-10% NaOH
treated samples.
Fibre silanisation on sandwich structures
In Figure 7.8, typical stress-strain curves of silanised samples show linear elastic
behaviour up to the maximum stress. After reaching the peak strength, multiple
stages of strength drops were observed with progressive strain. After the load drop,
the specimen continued to sustain the load as only the sandwich skins were still
carrying the load. The strength drops indicated that gradual failures had taken place
in the samples. At peak strength, cores failed in tension and upper skins delaminated.
This was followed by tensile failure of the bottom skins (Figure 7.9). Stages of
failure of the treated samples indicated good interface bonding had taken place
between the fibre and matrix. However, the gradual load drops reduced the
composites‘ overall strength compared to the NaOH treated samples (Figure 7.10).

185
Skin delamination
Core tensile failure
Skin tensile failure
Figure 7.9: Flexural failure modes of silanised sample
Figure 7.8: Typical flexural stress-strain curves of silanised sandwich structures
0
10
20
30
40
50
60
0 0.005 0.01 0.015 0.02 0.025
Ben
din
g s
tren
gth
(M
Pa)
Strain (mm)
(0-10% NaOH) + Silane
0% (Si)4%
6%
8%
10%
Core failure
DelaminationBottom skin failure
Fle
xura
l st
reng
th (
MP
a)
5043
47
5353
47
42
5759
59
30
40
50
60
70
0 2 4 6 8 10 12
Fle
xu
ral st
ren
gth
(M
Pa)
% NaOH
NaOH
0 4 6 8 10
NaOH + Silane
Figure 7.10: Flexural properties of alkali pre-treated silanised sandwich structures

186
7.2.2 Shear properties of sandwich structures
The most common test method to determine the shear properties of sandwich
structures is the four-point bending test. The test method outlined is in Chapter 3,
Section 3.6.4. The experimental results of the four-point bending test are discussed in
relation to stress-strain curve and the failure mode of the structures.
Fibre alkalisation on sandwich structures
The typical stress-strain curves of alkalised specimens show a strength drop taking
place before reaching peak strength (Figure 7.11). This strength drop indicates crack
initiation at the specimen core. Then the specimen continued to carry load until the
core failed in tension. Afterwards, a significant load drop was observed due to the
tensile failure of the bottom skin of the specimens.
0
10
20
30
40
50
60
70
0 0.005 0.01 0.015
Sh
ear
stre
ngth
(M
Pa)
Strain
0-10% NaOH
0%
4%
6%
8%
10%
Core failureBottom skin failure
Figure 7.11: Typical shear stress-strain curves of alkalised sandwich structures

187
Table 7.2: Shear properties of the sandwich structure with different fibre treatments Fibre
treatments Alkalisation Alkalisation + Acetylation Alkalisation + Silanisation
%NaOH
Strength
(MPa) Modulus
(GPa) Failure
strain
(%)
Strength
(MPa) Modulus
(GPa) Failure
strain
(%)
Strength
(MPa) Modulus
(GPa) Failure
strain
(%)
0
56.59 ±2.81
4.52 ±0.30
1.51 ±0.11
44.78 ±2.51
3.88 ±0.34
1.60 ±0.12
57.27 ±3.28
3.77 ±0.18
1.96 ±0.16
4
52.11 ±2.47
4.30 ±0.07
1.34 ±0.05
43.85 ±2.60
3.69 ±0.18
1.42 ±0.04
42.94 ±3.21
3.62 ±0.24
1.61 ±0.22
6
55.87 ±3.33
4.56 ±0.03
1.37 ±0.11
46.86 ±2.33
3.93 ±0.23
1.32 ±0.02
48.56 ±2.93
3.77 ±0.21
1.55 ±0.13
8
64.58 ±0.77
5.10 ±0.21
1.67 ±0.13
59.67 ±3.10
4.17 ±0.06
1.64 ±0.10
47.31 ±5.09
3.75 ±0.31
1.68 ±0.31
10
68.61 ±5.90
4.94 ±0.17
1.91 ±0.16
53.50 ±4.64
3.97 ±0.19
1.47 ±0.14
52.72 ±4.56
3.67 ±0.40
1.92 ±0.42
In Figure 7.12, it can be observed that initial 4% NaOH treatments on the fibres
reduced the composites‘ shear strengths and moduli compared to the 0% NaOH
(untreated) samples. However, at higher treatment concentrations (6-10%NaOH) the
strength and modulus increased by 21% and 11% respectively compared to the
untreated samples. These results indicated that higher NaOH concentrations excited
the cellulose surface by removing weak boundary layers (hemicellulose-lignin) from
the fibre surfaces. Due to this, strong bonding at the interface was achieved and
composites‘ exhibited stronger mechanical properties.
57
52
56
65
69
50
55
60
65
70
0 2 4 6 8 10 12
Sh
ear
stre
ngth
(M
Pa)
% NaOH
(0-10% NaOH)
0 4 6 8 10
(a)

188
From Figure 7.13, it can be seen that 4% NaOH treated samples exhibited tensile
failure of the core followed by debonding between the bottom skin and the core at
the end of the specimen. For 6-10% NaOH treated samples, core failure in shear and
tension and bottom skin failure in tension was observed. In this case, the
delamination between the skins and cores was not observed proving that strong
interface bonding was achieved at higher concentrations of NaOH treatments.
4.54.3
4.6
5.1
5.0
4
4.5
5
5.5
0 2 4 6 8 10 12
Sh
ear
mo
dulu
s (G
Pa)
% NaOH
(0-10% NaOH)
0 4 6 8 10
(b)
Figure 7.12: Shear properties of alkalised sandwich structures (a) strength (b) modulus
(a)
(b)
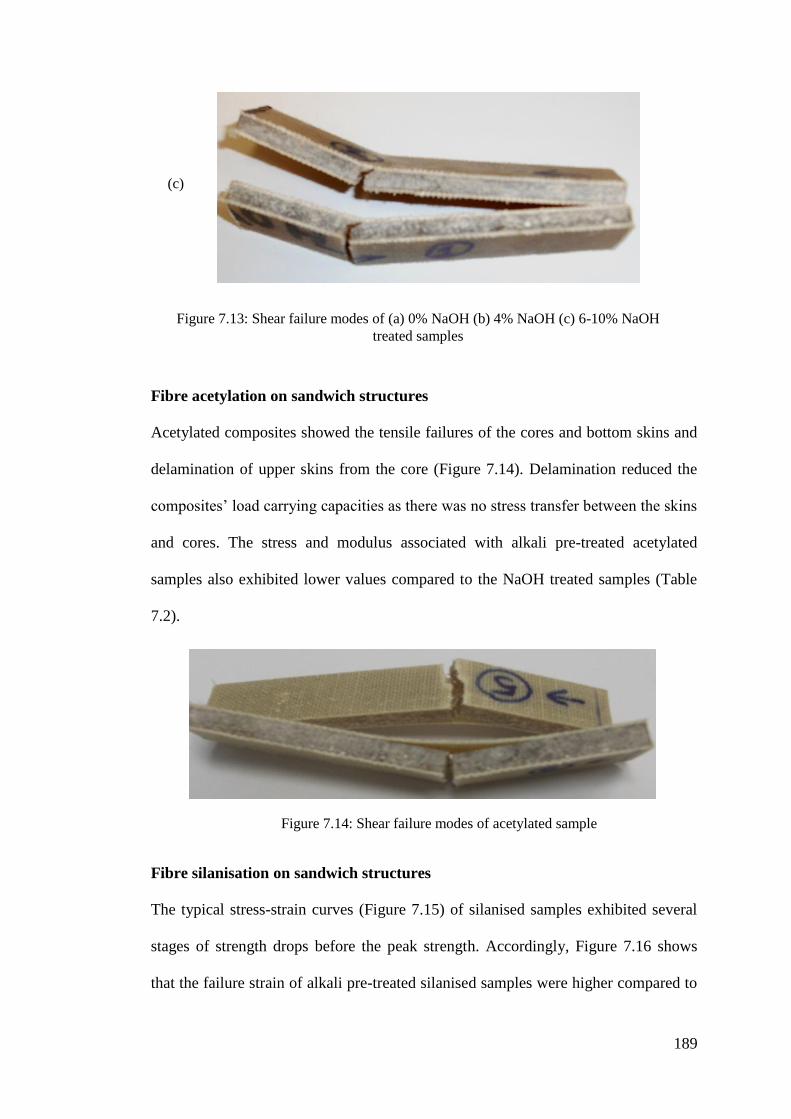
189
Fibre acetylation on sandwich structures
Acetylated composites showed the tensile failures of the cores and bottom skins and
delamination of upper skins from the core (Figure 7.14). Delamination reduced the
composites‘ load carrying capacities as there was no stress transfer between the skins
and cores. The stress and modulus associated with alkali pre-treated acetylated
samples also exhibited lower values compared to the NaOH treated samples (Table
7.2).
Fibre silanisation on sandwich structures
The typical stress-strain curves (Figure 7.15) of silanised samples exhibited several
stages of strength drops before the peak strength. Accordingly, Figure 7.16 shows
that the failure strain of alkali pre-treated silanised samples were higher compared to
Figure 7.14: Shear failure modes of acetylated sample
Figure 7.13: Shear failure modes of (a) 0% NaOH (b) 4% NaOH (c) 6-10% NaOH
treated samples
(c)

190
the NaOH treated samples. Stronger properties resulted because silane coupling
layers on the fibre surfaces were gradually broken down during loading. This
provided shear resistance at the interface. Shear resistance allowed the longer
deformation of the composites and thus enhanced the failure strain properties.
0
10
20
30
40
50
60
0 0.005 0.01 0.015 0.02
Sh
ear
stre
ngt
h (
MP
a)
Strain
(0-10% NaOH) + Silane
8% 4%6%
10%
0% (Si)
Figure 7.15: Typical shear stress-strain curves of silanised sandwich structures
0.015
0.0130.014
0.017
0.0190.020
0.016
0.015
0.017
0.019
0.01
0.013
0.016
0.019
0.022
0 2 4 6 8 10 12
Fail
ure
str
ain
% NaOH
0 4 6 8 10
NaOH
NaOH + Silane
Figure 7.16: Shear properties of alkali pre-treated silanised sandwich structures

191
7.2.3 Compressive properties of sandwich structures
The compressive properties of sandwich structures can be measured through
edgewise compression testing. The test methods are outlined in Chapter 3, Section
3.6.2. During compression testing, the applied load is mainly carried by the skins of
the sandwich, whereas the core stabilises the structure and prohibits premature
buckling of the skin. The compressive response (in-plane direction) of the sandwich
structures depends on the degree of interface bonding strength. To analyse the
compressive properties of the sandwich composites, stress-strain responses and
failure mechanisms of the samples were investigated.
Fibre alkalisation on sandwich structures
Figure 7.17 shows the typical stress-strain behaviour of alkalised fibre composites,
and Table 7.3 summarises their results. From Figure 7.18, it can be observed that
NaOH treatments on the fibres improved composite strength and modulus compared
to untreated samples. According to higher treatment concentrations (4-10% NaOH),
the strength and modulus of the composites registered increases of around 23% and
16% respectively compared to the untreated samples. These results indicated that
treatments contributed to strong interface bonding by removing weak boundary
layers from the fibre surfaces.

192
Table 7.3: Compressive properties of the sandwich structure with different fibre
treatments Fibre
treatments Alkalisation Alkalisation +
Acetylation Alkalisation +
Silanisation
%NaOH
Strength
(MPa) Modulus
(GPa) Strength
(MPa) Modulus
(GPa) Strength
(MPa) Modulus
(GPa)
0
89.95 ±10.65
2.28 ±0.17
90.16 ±6.59
2.60 ±0.12
90.46 ±6.99
2.52 ±0.18
4
98.49 ±1.74
2.33 ±0.14
96.59 ±3.78
2.67 ±0.06
88.53 ±3.77
2.35 ±0.17
6
101.60 ±9.44
2.60 ±0.11
97.97 ±1.92
2.62 ±0.05
97.71 ±5.52
2.57 ±0.06
8
107.64 ±2.40
2.43 ±0.15
85.76 ±3.47
2.39 ±0.17
93.71 ±4.30
2.58 ±0.19
10
111.04 ±3.86
2.65 ±0.06
95.59 ±2.44
2.65 ±0.04
82.16 ±1.80
2.29 ±0.11
0
20
40
60
80
100
120
0 0.02 0.04 0.06 0.08
Co
mp
ress
ive s
tren
gth
(M
Pa)
Strain
0-10% NaOH
0% 4%
8%
10%
Skin delamination
6%
Figure 7.17: Typical compressive stress-strain curves of alkalised sandwich structures
90
98
102
108 111
80
90
100
110
120
0 2 4 6 8 10 12
Co
mp
ress
ive s
tren
gth
(M
Pa)
% NaOH
(0-10% NaOH)
0 4 6 8 10
(a)
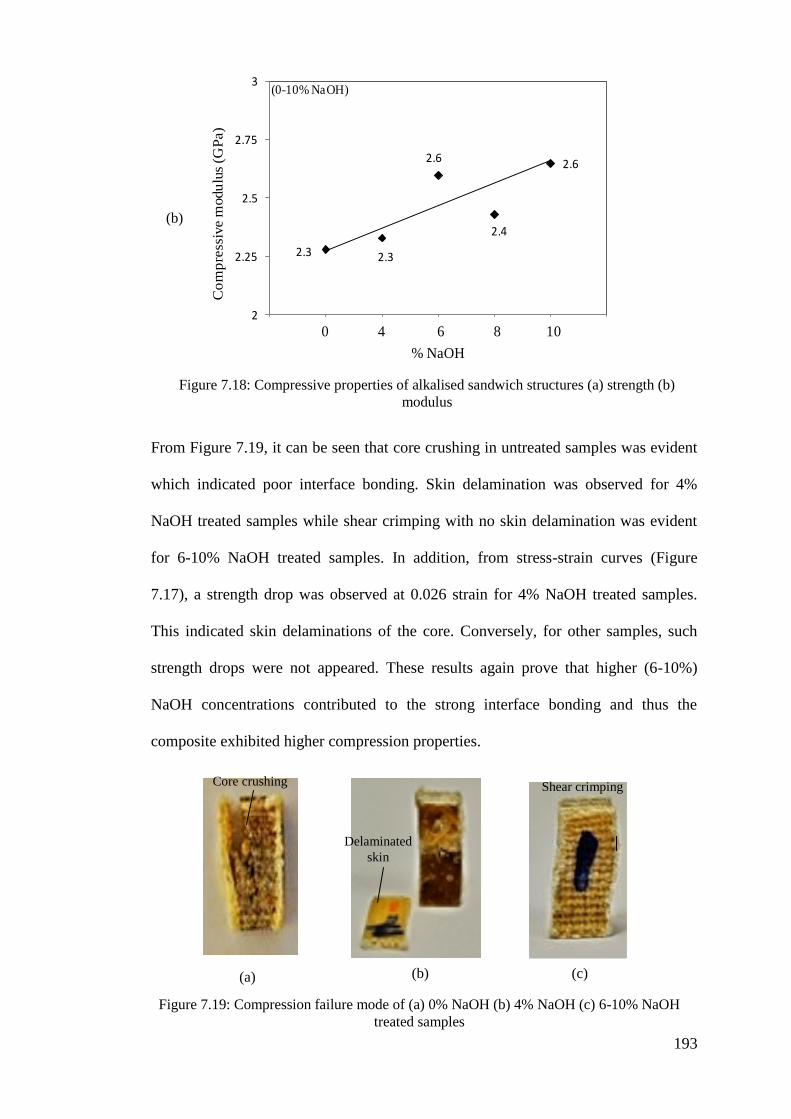
193
From Figure 7.19, it can be seen that core crushing in untreated samples was evident
which indicated poor interface bonding. Skin delamination was observed for 4%
NaOH treated samples while shear crimping with no skin delamination was evident
for 6-10% NaOH treated samples. In addition, from stress-strain curves (Figure
7.17), a strength drop was observed at 0.026 strain for 4% NaOH treated samples.
This indicated skin delaminations of the core. Conversely, for other samples, such
strength drops were not appeared. These results again prove that higher (6-10%)
NaOH concentrations contributed to the strong interface bonding and thus the
composite exhibited higher compression properties.
Figure 7.19: Compression failure mode of (a) 0% NaOH (b) 4% NaOH (c) 6-10% NaOH
treated samples
(a) (b) (c)
Core crushing
Delaminated
skin
Shear crimping
2.3 2.3
2.6
2.4
2.6
2
2.25
2.5
2.75
3
0 2 4 6 8 10 12
Co
mp
ress
ive m
odu
lus
(GP
a)
% NaOH
(0-10% NaOH)
0 4 6 8 10
(b)
Figure 7.18: Compressive properties of alkalised sandwich structures (a) strength (b)
modulus
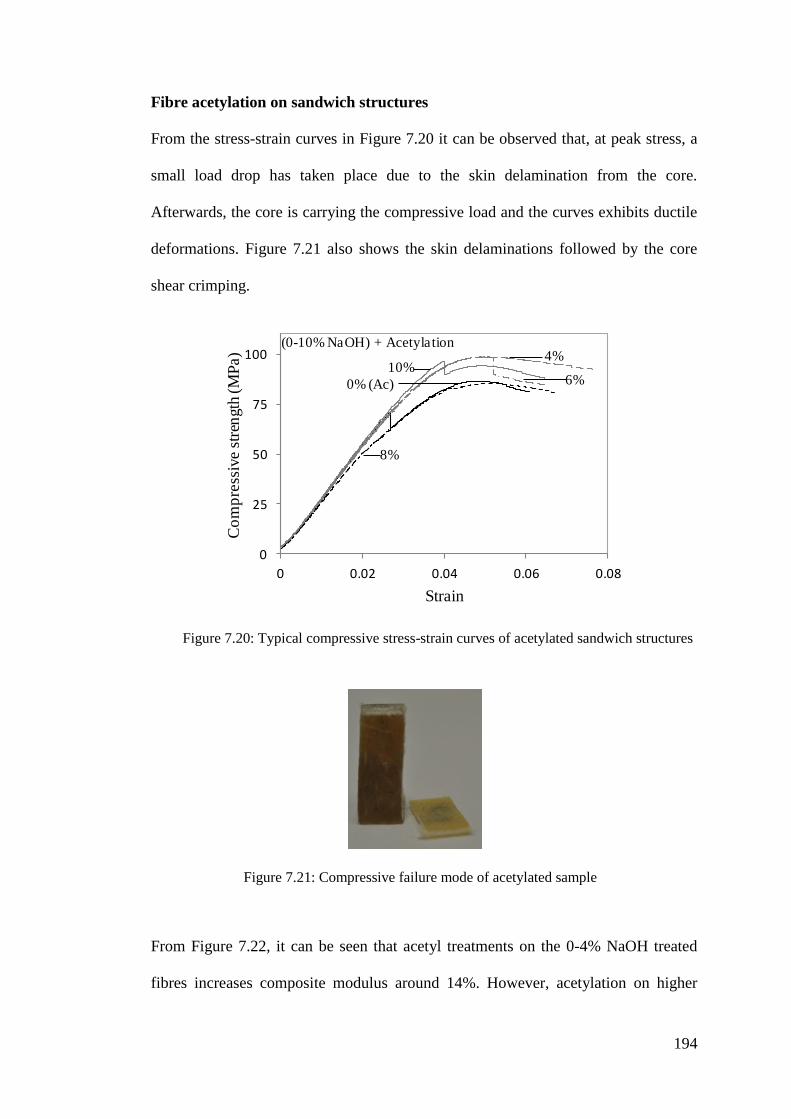
194
Fibre acetylation on sandwich structures
From the stress-strain curves in Figure 7.20 it can be observed that, at peak stress, a
small load drop has taken place due to the skin delamination from the core.
Afterwards, the core is carrying the compressive load and the curves exhibits ductile
deformations. Figure 7.21 also shows the skin delaminations followed by the core
shear crimping.
From Figure 7.22, it can be seen that acetyl treatments on the 0-4% NaOH treated
fibres increases composite modulus around 14%. However, acetylation on higher
0
25
50
75
100
0 0.02 0.04 0.06 0.08
Co
mp
ress
ive s
tren
gth
(M
Pa)
Strain
(0-10% NaOH) + Acetylation
0% (Ac)
4%
6%
8%
10%
Figure 7.20: Typical compressive stress-strain curves of acetylated sandwich structures
Figure 7.21: Compressive failure mode of acetylated sample

195
concentrations of (6-10%) NaOH treated fibres does not improve modulus values.
These results indicated that strong interface bonding was taking place due to
effective estrification of fibre hydroxyl groups as well as the removal of
hemicellulose and lignin coverings from the (0-4% NaOH) pre-treated fibre surfaces
during acetylation. As a result, the strong interface could transfer greater
compression load and thus treated samples exhibited higher composite properties.
However, due to the fibre weakness induced by the two treatments (at higher
concentrations of NaOH and acetylation), composites deform under lower
compressive loads. As a result, at higher pre-treatment concentrations, acetylated
composites had lower modulus than the NaOH treated samples.
Fibre silanisation on sandwich structures
Similar to acetylated samples, the stress-strain curves of alkali pre-treated silanised
samples also showed load drops at the peak strength (Figure 7.23) and the skin
delamination from the core (Figure 7.24).
2.3 2.3
2.6
2.4
2.62.6
2.72.6
2.4
2.6
2
2.25
2.5
2.75
3
0 2 4 6 8 10 12
Co
mp
ress
ive m
odu
lus
(GP
a)
% NaOH
0 4 6 8 10
NaOH
NaOH + Acetylation
Figure 7.22: Compressive properties of alkali pre-treated acetylated sandwich structures

196
From Figure 7.25, it can be observed that silane treatments on the alkalised fibres
reduced composite strengths compared to the NaOH treated samples. This may be
due to the fact that silane couplings formed an additional chemical layer onto the
fibre surface. During compression loading, fibre buckling generated strains onto the
neighbouring fibres. At this stage, the chemical layers on the fibres produced extra
strains onto the neighbouring fibres. This additional strain disproportionately induced
higher stresses among the buckled fibre interfaces and thus failure of the composites
0
25
50
75
100
0 0.02 0.04 0.06 0.08
Co
mp
ress
ive s
tren
gth
(M
Pa)
Strain
(0-10% NaOH) + Silane
0% (Si)
4%
6%8%
10%
Skin delamination
Figure 7.23: Typical compressive stress-strain curves of silanised sandwich structures
Figure 7.24: Compressive failure mode of silanised sample

197
was initiated. Due to this, silanised composites deformed under lower compressive
loads compared to the NaOH treated samples.
It can be noted that, silane treatment on the 10% NaOH treated fibres suffered
maximum strength losses (26%) compared to the NaOH treated samples (Figure
7.25). This may be due to the fact that 10% NaOH pre-treated fibre lost their
structural strength in carrying extra bucking strains generated from the silane
chemical layers. As a result, silane treatments on the 10% NaOH treated fibres
exhibited lower composite strengths.
7.3 Summary
In this study it was observed that the mechanical properties of hemp fibre sandwich
structures were highly influenced by their interface bonding strength. Chemically
treated fibre samples showed improved fibre matrix adhesion properties when
compared to the untreated samples. According to the results, higher concentrations of
NaOH treated samples exhibited stronger mechanical properties when compared to
90
98102
108 111
90
89
98
94
8280
90
100
110
120
0 2 4 6 8 10 12
Co
mp
ress
ive s
tren
gth
(M
Pa)
% NaOH
NaOH
0 4 6 8 10
NaOH + Silane
Figure 7.25: Compressive properties of alkali pre-treated silanised sandwich structures

198
other treated (acetyl and silane treatments) samples. This may have been due to the
effective removal of hemicellulose and lignin constituents from the fibres which
contributed to stronger fibre-matrix interface bonding. Different failure modes of the
tested samples were observed. Skin delamination from the core reduced the overall
composite properties. This failure event was less observed at higher concentrations
of NaOH treated samples. This was further evidence that the removal of
hemicellulose and lignin constituents from the fibres after treatment provided
stronger interface adhesion properties.

199
Chapter 8: Conclusion and Proposals for Future Work
From this study, a greater understanding of the effects of chemical treatments on
natural fibres and their composite properties were achieved.
Effects of chemical treatments on fibre
Hemp fibre properties were found to be highly influenced by changes in the amounts
of cellulose, hemicellulose and lignin constituents within the fibre. Alkali (0-10%
NaOH), acetyl and silane treatments on fibres reacted with constituent contents by
varying their amounts. Chemical analysis revealed that, 4-10% NaOH solution
reduced hemicellulose and lignin amounts compared to untreated fibres. Further
acetyl treatments on alkalised fibres created more losses of lignin constituents.
Conversely, silane treatments formed couplings with fibre constituents, thereby
forming a chemical layer on the fibre. This effect increased the overall weight
percentages of fibre constituents.
An analysis of fibre surface morphology revealed that cellulose provided the main
structural basis for the fibre and had the cleanest surface appearances, whilst
hemicellulose and lignin had black in colour and gummy in appearances and adhered
onto the cellulose surface. The prevalence of fibre constituents was observed on the
untreated fibre surfaces. Alkalised and acetylated fibre surfaces exhibited clean
distinctive microfibril separation. Alternatively, silanised fibre surfaces exhibited a
visible chemical layer.

200
FTIR analysis proved that hemicellulose and lignin functional groups were not
present on the alkalised and acetylated fibres. TGA and DSC analyses revealed that
moisture absorption by the fibre was primarily caused due to the presence of
hemicelluloses. Hemicelluloses also exhibited lower thermal stability compared to
cellulose and lignin constituents. Cellulose showed higher decomposition
temperatures compared to lignin, and lignin decomposed over a broad temperature
range. Treated fibres showed higher thermal decomposition temperatures compared
to the untreated fibres.
Tensile tests on hemp fibres revealed higher strength when fibre cross-sections were
considered as diameter instead of fibre width along their lengths. Tensile properties
of hemp fibres were reduced by the action of (4-10%) NaOH treatments. Cellulose
microfibrils became weaker in tension due to the removal of their binder materials
(hemicellulose and lignin) as a result of treatment. Acetyl treatments on the alkalised
fibres lessened their strength values. However, silane couplings provided support to
the cellulose microfibrils against tensile deformation and thus silanised samples
exhibited higher failure strain properties.
Effects of chemical treatments on composites
Chemical treatments lowered fibre strength but the removal of hemicellulose and
lignin coverings allowed for the direct bonding between cellulose microfibrils and
the polyester matrix. The treatment effects on interface bonding in long
unidirectional hemp fibre polyester composites were characterised by performing
property analysis through tensile, compression, shear, flexural and impact tests.

201
Mechanical testing revealed that interface bonding between NaOH treated fibres and
the polyester matrix increased due to an absence of hemicelluloses and lignin
coverings on cellulose surfaces. This caused the absence of the majority of fibre
hydroxyl groups (-OH). In the case of 4% NaOH concentrations, hemicellulose and
lignin coverings were present on the cellulose surface and their orientations allowed
hydroxyl groups to absorb atmospheric moisture. The presence of moisture at the
interface resulted in a very weak load transfer capacity of fibres and thus their
composites had poor properties compared to the untreated samples. However, this
tendency was not observed for samples under higher concentrations (6 – 10%) of
NaOH treatment. Stronger interfacial bonding strength promoted better stress
transfer between fibres and matrix, and thus, higher mechanical strength was
exhibited. As hemicellulose and lignin coverings were removed under a higher
concentration of NaOH treatment, the strength of the fibres was lower as compared
with an untreated fibre case.
For acetyl treatments on NaOH (up to 4%) treated fibre, the mechanical properties of
composites increased. This was due to the fact that acetylation effectively esterifed
OH groups on the NaOH treated fibre‘s surface. However, by applying higher
concentration acetyl treatment, properties of the fibre were weakened.
Silane treatments on NaOH (up to 4%) treated fibre achieved similar mechanical
results to acetyl treatment. The mechanical strengths of composites increased due to
a successful formation of silanols on the fibre‘s surface. These silanols promoted
strong couplings between the fibre surfaces and matrix. However, the results were
reversed for fibres treated with over 6% concentration of NaOH pre-treatment.

202
Similar mechanical properties were observed for sandwich structures. Different
failure modes of the tested samples revealed that core failure and skin delamination
from the core reduced the overall composite properties. These failure events were
unnoticeable at higher concentrations of NaOH treated samples. The microstructure
of the composites failure surface also showed improved fibre-matrix interfacial
bonding for the treated composites. These micrographs confirmed the results
achieved by composite mechanical properties.
Based on the discussions above, it can be concluded that chemical treatments on
hemp fibres can enhance the mechanical strength of its composites. Improvements
are governed by the removal of hemicellulose and lignin from the fibre, which
provides a platform for better chemical reactions between fibres and matrix.
However, due to the removal of these two components, the fibre itself, becomes
relatively weak and cannot withstand higher loads when compared with untreated
cases.
Proposals for future work
The following aspects need to be further studied in more detail to further improve the
properties of hemp fibres and their roles as reinforcements in polyester composites.
Some recommendations for future work have been proposed:
- Environmental degradation behaviours of hemp fibre polyester composites
need to be studied through outdoor weathering tests in order to analyse the
properties of such structures. The effect of environment factors on interface
bonding strength need to be understood through mechanical property analysis.
Such environmental factors include moisture resistance, UV index and

203
sunlight. The thermal and mechanical properties of fibre composites need to be
investigated after they have been periodically exposed to natural weathering.
The treatment effects on fibre matrix interface bonding on natural weathering
condition also need to be analysed in order to gain greater understanding of
natural fibre composite structures.
- In order to achieve a greater understanding of interface bonding strength in
treated fibre composites, dynamic mechanical testing through fatigue and
delamination analysis need to be conducted. Through dynamic loadings,
treatment effects on interface bonding can be investigated in more detail. By
conducting such dynamic mechanical testing, the fatigue life of fibre
reinforced polymer composites can be observed. This process would ultimately
reveal further mechanical properties of nature fibre composites.
- Theoretical modelling of hemp fibre polyester composites need to be
established using the results observed from this study. The model will help in
the analysis of treatment effects on fibre matrix interface bonding and
composite failure mode analysis. Moreover, this modelling process would be
beneficial in analysing parameters which can be used to improve and optimise
fibre properties and their associated roles as reinforcements in composite
materials.
- Some systematic statistical analyses on the mechanical property results of fibre
and their reinforced composites need to be carried out. These analyses will

204
provide the statically prove the mechanical property improvement of fibres and
their reinforced composites under different treatment conditions.

205
References
Abdelmouleh, M, Boufi, S, Belgacem, M & Dufresne, A 2007, 'Short natural-fibre
reinforced polyethylene and natural rubber composites: Effect of silane coupling
agents and fibres loading', Composites science and technology, vol. 67, no. 7, pp.
1627-39.
Adekunle, K, Akesson, D & Skrifvars, M 2010, 'Biobased composites prepared by
compression molding with a novel thermoset resin from soybean oil and a
natural‐fiber reinforcement', Journal of Applied Polymer Science, vol. 116, no. 3, pp.
1759-65.
Adusumalli, RB, Muller, U, Weber, H, Roeder, T, Sixta, H & Gindl, W 2006,
'Tensile testing of single regenerated cellulose fibres', Wiley Online Library, pp. 83-
8.
Azzam, H 2007, 'Compressive properties of stretch-broken carbon fiber
(SBCF)/polyamide 12 commingled unidirectional composites', Journal of
Engineering and Applied Science, vol. 54, no. 4, p. 409.
Ball, R, McIntosh, A & Brindley, J 2004, 'Feedback processes in cellulose thermal
decomposition: implications for fire-retarding strategies and treatments', Combustion
Theory and Modelling, vol. 8, no. 2, pp. 281-91.
Beckermann, G 2007, 'Performance of hemp-fibre reinforced polypropylene
composite materials', PhD thesis, The University of Waikato.
Beckermann, G & Pickering, KL 2008, 'Engineering and evaluation of hemp fibre
reinforced polypropylene composites: Fibre treatment and matrix modification',
Composites Part A: Applied Science and Manufacturing, vol. 39, no. 6, pp. 979-88.
Belingardi, G, Cavatorta, MP & Salvatore Paolino, D 2008, 'Repeated impact
response of hand lay-up and vacuum infusion thick glass reinforced laminates',
International Journal of Impact Engineering, vol. 35, no. 7, pp. 609-19.
Bjerre, AB, Schmidt, AS & Riso, F 1997, Development of chemical and biological
processes for production of bioethanol: Optimization of the wet oxidation process
and characterization of products, Riso National Laboratory.
Bledzki, A & Gassan, J 1999, 'Composites reinforced with cellulose based fibres',
Progress in polymer science, vol. 24, no. 2, pp. 221-74.
Bledzki, A, Mamun, A, Lucka, M & Gutowsk, V 2008, 'The effects of acetylation on
properties of flax fibre and its polypropylene composites', eXPRESS Polymer Letters,
vol. 2, no. 6, pp. 413-22.

206
Bradley, L, Bowen, C, McEnaney, B & Johnson, D 2007, 'Shear properties of a
carbon/carbon composite with non-woven felt and continuous fibre reinforcement
layers', Carbon, vol. 45, no. 11, pp. 2178-87.
Brebu, M & Vasile, C 2010, 'Thermal degradation of lignin—A review', Cellulose
Chemistry & Technology, vol. 44, no. 9, p. 353.
Chattopadhyay, H & Sarkar, P 1945, 'A new method for the estimation of cellulose',
Dacca University.
Cho, J, Chen, J & Daniel, I 2007, 'Mechanical enhancement of carbon fiber/epoxy
composites by graphite nanoplatelet reinforcement', Scripta Materialia, vol. 56, no.
8, pp. 685-8.
Cicala, G & Lo Faro, C 2012, 'Material Selection: Polymeric Composites Matrix', in
Wiley Encyclopedia of Composites, John Wiley & Sons, Inc.
Corrales, F, Vilaseca, F, Llop, M, Gironcs, J, Mendez, J & Mutjc, P 2007, 'Chemical
modification of jute fibers for the production of green-composites', Journal of
hazardous materials, vol. 144, no. 3, pp. 730-5.
Dash, BN, Rana, AK, Mishra, SC, Mishra, HK, Nayak, S & Tripathy, S 2000, 'Novel
low-cost jute–polyester composite. II. SEM observation of the fractured surfaces',
Polymer-Plastics Technology and Engineering, vol. 39, no. 2, pp. 333-50, viewed
2012/06/27.
David-West, O, Nash, D & Banks, W 2008, 'An experimental study of damage
accumulation in balanced CFRP laminates due to repeated impact', Composite
Structures, vol. 83, no. 3, pp. 247-58.
Delaet, M, Lataillade, J & Wolff, C 1994, 'Intralaminar shear loading effects on the
damage process of multiply composites at impact rates', Journal de Physique, vol. 4,
no. 4, pp. 213-8.
Delfosse, D & Poursartip, A 1997, 'Energy-based approach to impact damage in
CFRP laminates', Composites Part A: Applied Science and Manufacturing, vol. 28,
no. 7, pp. 647-55.
Devi, LU, Bhagawan, S & Thomas, S 1997, 'Mechanical properties of pineapple leaf
fiber‐reinforced polyester composites', Journal of Applied Polymer Science, vol. 64,
no. 9, pp. 1739-48.
Dhakal, H, Zhang, Z & Richardson, M 2007, 'Effect of water absorption on the
mechanical properties of hemp fibre reinforced unsaturated polyester composites',
Composites science and technology, vol. 67, no. 7, pp. 1674-83.
Doan, TTL, Gao, SL & Mader, E 2006, 'Jute/polypropylene composites I. Effect of
matrix modification', Composites science and technology, vol. 66, no. 7, pp. 952-63.

207
Eichhorn, S & Young, R 2004, 'Composite micromechanics of hemp fibres and
epoxy resin microdroplets', Composites science and technology, vol. 64, no. 5, pp.
767-72.
Esfandiari, A 2007, 'Mechanical Properties of PP/Jute and Glass Fibers Composites:
The Statistical Investigation', Journal of Applied Sciences, vol. 7, no. 24, pp. 3943-
50.
Fakirov, S & Bhattacharyya, D 2007, Handbook of engineering biopolymers:
homopolymers, blends and composites, Hanser Gardner Pubns.
Fan, M 2010, 'Characterization and performance of elementary hemp fibres: factors
influencing tensile strength', BioResources, vol. 5, no. 4, pp. 2307-22.
Feih, S, Thraner, A & Lilholt, H 2005, 'Tensile strength and fracture surface
characterisation of sized and unsized glass fibers', Journal of Materials Science, vol.
40, no. 7, pp. 1615-23.
Fischer, G 2004, 'Characterization of Fiber-Reinforced Cement Composites by their
Tensile Stress-Strain Behaviour and Quantification of Crack Formation', proceedings
of BEFIB, pp. 20-2.
Fleck, N, Jelf, P & Curtis, P 1995, 'Compressive failure of laminated and woven
composites', Journal of composites technology & research, vol. 17, no. 3, pp. 212-
20.
Fleck, NA & Liu, D 2001, 'Microbuckle initiation from a patch of large amplitude
fibre waviness in a composite under compression and bending', European Journal of
Mechanics – A/Solids, vol. 20, no. 1, pp. 23-38.
George, J & Verpoest, JI 1999, 'Mechanical properties of flax fibre reinforced epoxy
composites', Die angewandte makromolekulare Chemie, vol. 272, no. 1, pp. 41-5.
George, J, Sreekala, MS & Thomas, S 2001a, 'A review on interface modification
and characterization of natural fiber reinforced plastic composites', Polymer
Engineering & Science, vol. 41, no. 9, pp. 1471-85.
George, J, Sreekala, MS & Thomas, S 2001b, 'A review on interface modification
and characterization of natural fiber reinforced plastic composites', Polymer
Engineering and Science, vol. 41, no. 9, pp. 1471-85.
Goda, K, Sreekala, M, Gomes, A, Kaji, T & Ohgi, J 2006, 'Improvement of plant
based natural fibers for toughening green composites—Effect of load application
during mercerization of ramie fibers', Composites Part A: Applied Science and
Manufacturing, vol. 37, no. 12, pp. 2213-20.
Gonzalez, C & Lorca, J 2007, 'Mechanical behaviour of unidirectional fiber-
reinforced polymers under transverse compression: microscopic mechanisms and
modeling', Composites science and technology, vol. 67, no. 13, pp. 2795-806.

208
Hamada, H, Ramakrishna, S & Satoh, H 1995, 'Crushing mechanism of carbon
fibre/PEEK composite tubes', Composites, vol. 26, no. 11, pp. 749-55.
Han, CD & Lem, KW 1984, 'Chemorheology of thermosetting resins. IV. The
chemorheology and curing kinetics of vinyl ester resin', Journal of Applied Polymer
Science, vol. 29, no. 5, pp. 1879-902.
Hayes, BS & Gammon, LM 2010, Optical Microscopy of Fiber-Reinforced
Composites, ASM International.
Henkhaus, K 2003, 'Overview of research on composite material impact behaviour',
in 16th ASCE Engineering Mechanics Conference: proceedings of the16th ASCE
Engineering Mechanics Conference Seattle, pp. 16-8.
Hu, W, Ton‐That, MT, Perrin‐Sarazin, F & Denault, J 2010, 'An improved method
for single fiber tensile test of natural fibers', Polymer Engineering & Science, vol. 50,
no. 4, pp. 819-25.
Huang, ZM 2004, 'Progressive flexural failure analysis of laminated composites with
knitted fabric reinforcement', Mechanics of materials, vol. 36, no. 3, pp. 239-60.
Ilomaki, KM 2012, 'Adhesion Between Natural Fibers and Thermosets', Master
thesis, Tampere University of Technology.
Jafari, M, Nikkhah, A, Sadeghi, A & Chamani, M 2007, 'The effect of Pleurotus spp.
fungi on chemical composition and in vitro digestibility of rice straw', Pakistan
Journal of Biological Sciences, vol. 10, no. 15, pp. 2460-4.
Jelf, P & Fleck, N 1992, 'Compression failure mechanisms in unidirectional
composites', Journal of composite materials, vol. 26, no. 18, pp. 2706-26.
Jeng, CC & Chen, M 2000, 'Flexural failure mechanisms in injection-moulded
carbon fibre/PEEK composites', Composites science and technology, vol. 60, no. 9,
pp. 1863-72.
Jensen, FM, Falzon, B, Ankersen, J & Stang, H 2006, 'Structural testing and
numerical simulation of a 34 m composite wind turbine blade', Composite Structures,
vol. 76, no. 1-2, pp. 52-61.
John, MJ & Anandjiwala, RD 2008, 'Recent developments in chemical modification
and characterization of natural fiber-reinforced composites', Polymer Composites,
vol. 29, no. 2, pp. 187-207.
Joseph, K, Thomas, S & Pavithran, C 1996, 'Effect of chemical treatment on the
tensile properties of short sisal fibre-reinforced polyethylene composites', Polymer,
vol. 37, no. 23, pp. 5139-49.
Joseph, P, Mathew, G, Joseph, K, Groeninckx, G & Thomas, S 2003, 'Dynamic
mechanical properties of short sisal fibre reinforced polypropylene composites',
Composites Part A: Applied Science and Manufacturing, vol. 34, no. 3, pp. 275-90.

209
Joseph, P, Joseph, K, Thomas, S, Pillai, C, Prasad, V, Groeninckx, G & Sarkissova,
M 2003, 'The thermal and crystallisation studies of short sisal fibre reinforced
polypropylene composites', Composites Part A: Applied Science and Manufacturing,
vol. 34, no. 3, pp. 253-66.
Kalaprasad, G, Francis, B, Thomas, S, Kumar, CR, Pavithran, C & Groeninckx, G
2004, 'Effect of fibre length and chemical modifications on the tensile properties of
intimately mixed short sisal/glass hybrid fibre reinforced low density polyethylene
composites', Polymer international, vol. 53, no. 11, pp. 1624-38.
Kalia, S, Kaith, B & Kaur, I 2009, 'Pretreatments of natural fibers and their
application as reinforcing material in polymer composites—a review', Polymer
Engineering & Science, vol. 49, no. 7, pp. 1253-72.
Kasuga, T, Ota, Y, Nogami, M & Abe, Y 2001, 'Preparation and mechanical
properties of polylactic acid composites containing hydroxyapatite fibers',
Biomaterials, vol. 22, no. 1, pp. 19-23.
Keener, T, Stuart, R & Brown, T 2004, 'Maleated coupling agents for natural fibre
composites', Composites Part A: Applied Science and Manufacturing, vol. 35, no. 3,
pp. 357-62.
Khalil, H, Ismail, H, Rozman, H & Ahmad, M 2001, 'The effect of acetylation on
interfacial shear strength between plant fibres and various matrices', European
Polymer Journal, vol. 37, no. 5, pp. 1037-45.
Kim, HJ & Eom, YG 2001, 'Thermogravimetric analysis of rice husk flour for a new
raw material of lignocellulosic fiber thermoplastic polymer composites', Journal of
the Korean Wood Science and Technology, vol. 20, no. 3, pp. 59-67.
Kitsutaka, Y & Takahashi, Y 2001, 'Fracture mechanics based bending failure
analysis for fiber reinforced light-weight concrete panel considering crack dispersion
effect', Journal of Structural and Construction Engineering, no. 541, pp. 37-42.
Ku, H, Wang, H, Pattarachaiyakoop, N & Trada, M 2011, 'A review on the tensile
properties of natural fibre reinforced polymer composites', Composites Part B:
Engineering.
Li, H, Burts, E, Bears, K, Ji, Q, Lesko, J, Dillard, D, Riffle, J & Puckett, P 2000,
'Network structure and properties of dimethacrylate-styrene matrix materials',
Journal of composite materials, vol. 34, no. 18, pp. 1512-28.
Li, X, Tabil, L & Panigrahi, S 2007, 'Chemical Treatments of Natural Fiber for Use
in Natural Fiber-Reinforced Composites: A Review', Journal of Polymers and the
Environment, vol. 15, no. 1, pp. 25-33.
Li, X, Panigrahi, S & Tabil, L 2009, 'A study on flax fiber-reinforced polyethylene
biocomposites', Applied Engineering in Agriculture, vol. 25, no. 4, pp. 525-31.

210
Li, X, Panigrahi, S, Tabil, L & Crerar, W 2004, 'Flax fiber-reinforced composites and
the effect of chemical treatments on their properties', Paper No. MB04-305. St
Joseph, MI: American Society of Agricultural and Biological Engineers.
Liu, Q, Zhong, Z, Wang, S & Luo, Z 2011, 'Interactions of biomass components
during pyrolysis: A TG-FTIR study', Journal of Analytical and Applied Pyrolysis,
vol. 90, no. 2, pp. 213-8.
Lojewska, J, Miskowiec, P, Lojewski, T & Proniewicz, LM 2005, 'Cellulose
oxidative and hydrolytic degradation: In situ FTIR approach', Polymer Degradation
and Stability, vol. 88, no. 3, pp. 512-20.
Lu, W, Kao, P & Su, A 1998, 'Flexural failure of unidirectional carbon/epoxy
composites: Effects of interleaving and flexural rate', Journal of Polymer Research,
vol. 5, no. 3, pp. 133-42.
Madsen, B 2004, 'Properties of plant fibre yarn polymer composites', PhD thesis,
Technical University of Denmark, BYG-DTU.
Manalo, AC, Aravinthan, T & Karunasena, W 2010, 'Flexural behaviour of glue-
laminated fibre composite sandwich beams', Composite Structures, vol. 92, no. 11,
pp. 2703-11.
Manikandan, NK, Thomas, S & Groeninckx, G 2001, 'Thermal and dynamic
mechanical analysis of polystyrene composites reinforced with short sisal fibres',
Composites science and technology, vol. 61, no. 16, pp. 2519-29.
Mattoni, MA & Zok, FW 2005, 'Strength and Notch Sensitivity of Porous‐Matrix
Oxide Composites', Journal of the American Ceramic Society, vol. 88, no. 6, pp.
1504-13.
Menczel, JD, Judovits, L, Prime, RB, Bair, HE, Reading, M & Swier, S 2009,
'Differential scanning calorimetry (DSC)', Thermal Analysis of Polymers, pp. 7-239.
Mengeloglu, F & Karakus, K 2008, 'Thermal degradation, mechanical properties and
morphology of wheat straw flour filled recycled thermoplastic composites', Sensors,
vol. 8, no. 1, pp. 500-19.
Mishra, S, Mohanty, A, Drzal, LT, Misra, M, Parija, S, Nayak, S & Tripathy, S 2003,
'Studies on mechanical performance of biofibre/glass reinforced polyester hybrid
composites', Composites science and technology, vol. 63, no. 10, pp. 1377-85.
Misra, S, Misra, M, Tripathy, S, Nayak, S & Mohanty, A 2002, 'The influence of
chemical surface modification on the performance of sisal‐polyester biocomposites',
Polymer Composites, vol. 23, no. 2, pp. 164-70.
Mohanty, A, Misra, M & Hinrichsen, G 2000, 'Biofibres, biodegradable polymers
and biocomposites: An overview', Macromolecular Materials and Engineering, vol.
276, no. 1, pp. 1-24.

211
Mohanty, A, Misra, M & Drzal, LT 2005, Natural fibers, biopolymers, and
biocomposites, CRC Press Taylor & Francis Group 6000 Broken Sound Parkway
NW.
Mohanty, S, Verma, S, Nayak, S & Tripathy, S 2004, 'Influence of fiber treatment on
the performance of sisal–polypropylene composites', Journal of Applied Polymer
Science, vol. 94, no. 3, pp. 1336-45.
Mohanty, S, Nayak, S, Verma, S & Tripathy, S 2004, 'Effect of MAPP as a Coupling
Agent on the Performance of Jute–PP Composites', Journal of reinforced plastics
and composites, vol. 23, no. 6, pp. 625-37.
MonteiroI, SN, RodriguezI, RJS, da CostaI, LL, Godinho, T, PortelaI, R & SantosII,
NSS 2010, 'Thermal behaviour of buriti biofoam', Revista Matéria, vol. 15, no. 2, pp.
104-9.
Muzzy, JD & Kays, AO 1984, 'Thermoplastic vs. thermosetting structural
composites', Polymer Composites, vol. 5, no. 3, pp. 169-72.
Mwaikambo, LY & Ansell, MP 1999, 'The effect of chemical treatment on the
properties of hemp, sisal, jute and kapok fibres for composite reinforcement', Die
angewandte makromolekulare Chemie, vol. 272, pp. 108-16.
Mwaikambo, LY & Ansell, MP 2002, 'Chemical modification of hemp, sisal, jute,
and kapok fibers by alkalization', Journal of Applied Polymer Science, vol. 84, no.
12, pp. 2222-34.
Mwaikambo, LY, Tucker, N & Clark, AJ 2007, 'Mechanical Properties of Hemp-
Fibre-Reinforced Euphorbia Composites', Macromolecular Materials and
Engineering, vol. 292, no. 9, pp. 993-1000.
Odegard, G & Kumosa, M 2000, 'Determination of shear strength of unidirectional
composite materials with the Iosipescu and 10° off-axis shear tests', Composites
science and technology, vol. 60, no. 16, pp. 2917-43.
Ouajai, S & Shanks, R 2005, 'Composition, structure and thermal degradation of
hemp cellulose after chemical treatments', Polymer Degradation and Stability, vol.
89, no. 2, pp. 327-35.
Park, JM, Quang, ST, Hwang, BS & DeVries, KL 2006, 'Interfacial evaluation of
modified Jute and Hemp fibers/polypropylene (PP)-maleic anhydride polypropylene
copolymers (PP-MAPP) composites using micromechanical technique and
nondestructive acoustic emission', Composites science and technology, vol. 66, no.
15, pp. 2686-99.
Paul, S, Joseph, K, Mathew, G, Pothen, L & Thomas, S 2010, 'Influence of polarity
parameters on the mechanical properties of composites from polypropylene fiber and
short banana fiber', Composites Part A: Applied Science and Manufacturing, vol. 41,
no. 10, pp. 1380-7.

212
Paul, S, Oommen, C, Joseph, K, Mathew, G & Thomas, S 2010, 'The role of
interface modification on thermal degradation and crystallization behaviour of
composites from commingled polypropylene fiber and banana fiber', Polymer
Composites, vol. 31, no. 6, pp. 1113-23.
Peng, F, Ren, J-L, Xu, F, Bian, J, Peng, P & Sun, R-C 2009, 'Fractional Study of
Alkali-Soluble Hemicelluloses Obtained by Graded Ethanol Precipitation from Sugar
Cane Bagasse', Journal of Agricultural and Food Chemistry, vol. 58, no. 3, pp. 1768-
76, viewed 2012/06/27.
Pickering, KL, Li, Y, Farrell, RL & Lay, M 2007, 'Interfacial Modification of Hemp
Fiber Reinforced Composites Using Fungal and Alkali Treatment', Journal of
Biobased Materials and Bioenergy, vol. 1, no. 1, pp. 109-17.
Pierron, F & Vautrin, A 1998, 'Measurement of the in-plane shear strengths of
unidirectional composites with the Iosipescu test', Composites science and
technology, vol. 57, no. 12, pp. 1653-60.
Placet, V 2009, 'Characterization of the thermo-mechanical behaviour of Hemp
fibres intended for the manufacturing of high performance composites', Composites
Part A: Applied Science and Manufacturing, vol. 40, no. 8, pp. 1111-8.
Prasad, S, Pavithran, C & Rohatgi, P 1983, 'Alkali treatment of coir fibres for coir-
polyester composites', Journal of Materials Science, vol. 18, no. 5, pp. 1443-54.
Rahman, MM, Mallik, AK & Khan, MA 2007, 'Influences of various surface
pretreatments on the mechanical and degradable properties of photografted oil palm
fibers', Journal of Applied Polymer Science, vol. 105, no. 5, pp. 3077-86.
Randriamanantena, T, Razafindramisa, FL, Ramanantsizehena, G, Bernes, A &
Lacabane, C 2009, 'Thermal behaviour of three woods of Madagascar by
thermogravimetric analysis in inert atmosphere', proceedings of theFourth high-
energy physics international conference Antananarivo, Madagascar, pp. 1-10.
Ranganathan, S & Mantena, PR 2003, 'Axial loading and buckling response
characteristics of pultruded hybrid glass-graphite/epoxy composite beams', Journal
of reinforced plastics and composites, vol. 22, no. 7, pp. 671-9.
Ray, D, Sarkar, B, Rana, A & Bose, N 2001, 'Effect of alkali treated jute fibres on
composite properties', Bulletin of Materials Science, vol. 24, no. 2, pp. 129-35.
Reh, U, Kraepelin, G & Lamprecht, I 1986, 'Use of differential scanning calorimetry
for structural analysis of fungally degraded wood', Applied and environmental
microbiology, vol. 52, no. 5, pp. 1101-6.
Reid, SR & Zhou, G 2000, Impact behaviour of fibre-reinforced composite materials
and structures, CRC Woodhead Publishing Limited, 80 High Street, Sawston,
Cambridge, CB22 3HJ, UK.

213
Rout, J, Misra, M, Tripathy, S, Nayak, S & Mohanty, A 2001, 'The influence of fibre
treatment on the performance of coir-polyester composites', Composites science and
technology, vol. 61, no. 9, pp. 1303-10.
Rowell, RM & Young, RA 1997, Paper and composites from agro-based resources,
CRC Press Inc. Taylor & Francis Group, United States.
Saheb, DN & Jog, J 1999, 'Natural fiber polymer composites: a review', Advances in
Polymer Technology, vol. 18, no. 4, pp. 351-63.
Sapieha, S, Allard, P & Zang, Y 1990, 'Dicumyl peroxide‐modified cellulose/LLDPE
composites', Journal of Applied Polymer Science, vol. 41, no. 9‐10, pp. 2039-48.
Seki, Y 2009, 'Innovative multifunctional siloxane treatment of jute fiber surface and
its effect on the mechanical properties of jute/thermoset composites', Materials
Science and Engineering: A, vol. 508, no. 1-2, pp. 247-52.
Sever, K, Sarikanat, M, Seki, Y, Erkan, G & Erdoğan, ÜH 2010, 'The Mechanical
Properties of γ-Methacryloxypropyltrimethoxy silane-treated Jute/Polyester
Composites', Journal of composite materials, vol. 44, no. 15, pp. 1913-24.
Sgriccia, N, Hawley, M & Misra, M 2008, 'Characterization of natural fiber surfaces
and natural fiber composites', Composites Part A: Applied Science and
Manufacturing, vol. 39, no. 10, pp. 1632-7.
Shyr, TW & Pan, YH 2003, 'Impact resistance and damage characteristics of
composite laminates', Composite Structures, vol. 62, no. 2, pp. 193-203.
Singleton, A, Baillie, C, Beaumont, P & Peijs, T 2003, 'On the mechanical
properties, deformation and fracture of a natural fibre/recycled polymer composite',
Composites Part B: Engineering, vol. 34, no. 6, pp. 519-26.
Smith, BC 2009, Fundamentals of Fourier transform infrared spectroscopy, CRC
Press Taylor & Francis Group, 6000 Broken Sound Parkway NW.
Sreekala, M, Kumaran, M, Joseph, S, Jacob, M & Thomas, S 2000, 'Oil palm fibre
reinforced phenol formaldehyde composites: influence of fibre surface modifications
on the mechanical performance', Applied Composite Materials, vol. 7, no. 5, pp. 295-
329.
Stuart, B 2005, Infrared Spectroscopy: Fundamentals and Applications, John Wiley
& Sons, Ltd, Chichester, England
Sun, XF, Sun, RC, Fowler, P & Baird, MS 2005, 'Extraction and characterization of
original lignin and hemicelluloses from wheat straw', Journal of Agricultural and
Food Chemistry, vol. 53, no. 4, pp. 860-70.
Taj, S, Munawar, MA & Khan, S 2007, 'Natural fiber-reinforced polymer
composites', proceedings of thePakistan academy of sciences pp. 129-44.

214
Tajeddin, B, Abdul Rahman, R, Chuah, L, Ibrahim, NA & Yusof, YA 2009,
'Thermal properties of low density polyethylene-filled kenaf cellulose composites',
European Journal of Scientific Research, vol. 32, no. 2, pp. 223-30.
Thakur, VK & Singha, AS 2010, 'Physico-chemical and mechanical characterization
of natural fibre reinforced polymer composites', Iranian Polymer Journal, vol. 19,
no. 1, pp. 3-16.
Torres, F & Cubillas, M 2005, 'Study of the interfacial properties of natural fibre
reinforced polyethylene', Polymer testing, vol. 24, no. 6, pp. 694-8.
Totry, E, Gonzalez, C & Llorca, J 2009, 'Mechanical behaviour of composite
materials in shear: experiments and simulations', Anales de Mecánica de la Fractura,
vol. 26, no. 1, pp. 187-92.
Totry, E, González, C, LLorca, J & Molina-Aldareguía, J 2009, 'Mechanisms of
shear deformation in fiber-reinforced polymers: experiments and simulations',
International journal of fracture, vol. 158, no. 2, pp. 197-209.
Tserki, V, Zafeiropoulos, N, Simon, F & Panayiotou, C 2005, 'A study of the effect
of acetylation and propionylation surface treatments on natural fibres', Composites
Part A: Applied Science and Manufacturing, vol. 36, no. 8, pp. 1110-8.
Valadez-Gonzalez, A, Cervantes-Uc, J, Olayo, R & Herrera-Franco, P 1999,
'Chemical modification of henequen fibers with an organosilane coupling agent',
Composites Part B: Engineering, vol. 30, no. 3, pp. 321-31.
Vallo, C, Kenny, JM, Vazquez, A & Cyras, VP 2004, 'Effect of chemical treatment
on the mechanical properties of starch-based blends reinforced with sisal fibre',
Journal of composite materials, vol. 38, no. 16, pp. 1387-99.
Van, DJO & Beukers, A 1999, 'The potential of a new rigid-rod polymer fibre (M5')
in advanced composite structures', Polymer, vol. 40, no. 4, pp. 1035-44.
Walker, JCF 2006, Primary wood processing: principles and practice, vol. 2nd
edition, Springer Verlag, Netherlands.
Wang, B, Panigrahi, S, Tabil, L & Crerar, W 2007, 'Pre-treatment of Flax Fibers for
use in Rotationally Molded Biocomposites', Journal of reinforced plastics and
composites, vol. 26, no. 5, pp. 447-63.
Wang, K, Jiang, JX, Xu, F, Sun, RC & Baird, MS 2010, 'Influence of steam pressure
on the physicochemical properties of degraded hemicelluloses obtained from steam-
exploded Lespedeza stalks', BioResources, vol. 5, no. 3, pp. 1717-32.
Yang, H, Yan, R, Chen, H, Lee, DH & Zheng, C 2007, 'Characteristics of
hemicellulose, cellulose and lignin pyrolysis', Fuel, vol. 86, no. 12-13, pp. 1781-8.
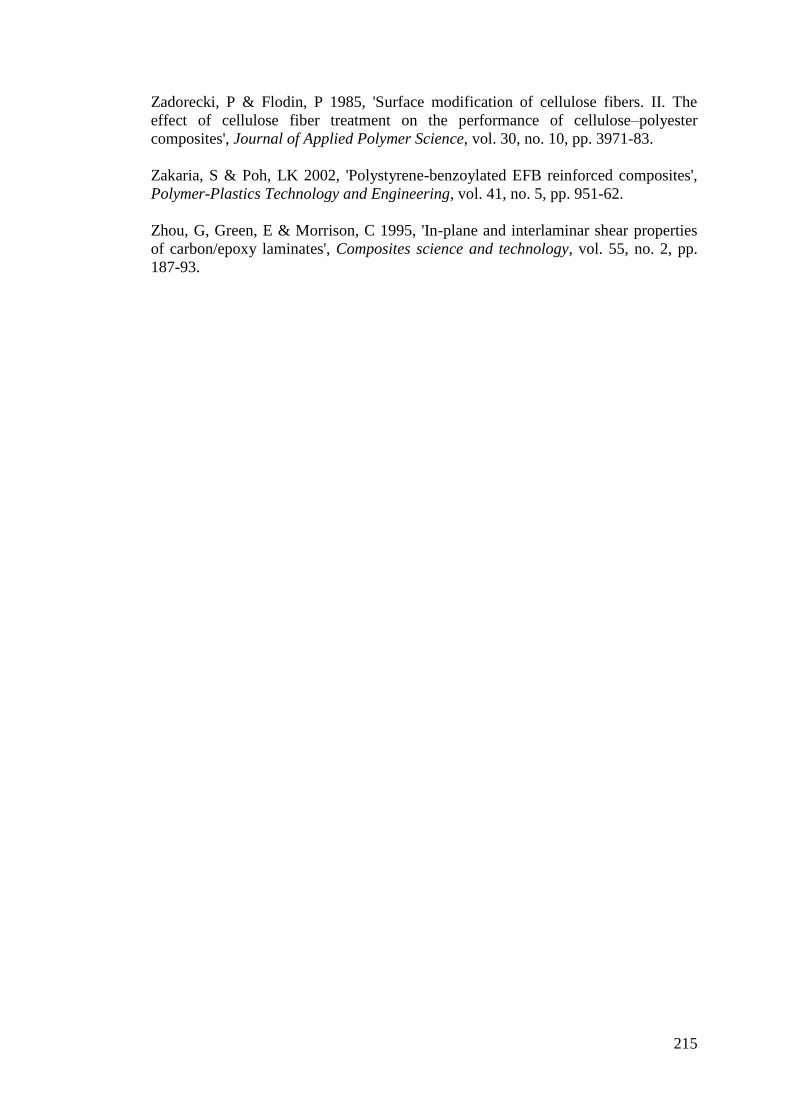
215
Zadorecki, P & Flodin, P 1985, 'Surface modification of cellulose fibers. II. The
effect of cellulose fiber treatment on the performance of cellulose–polyester
composites', Journal of Applied Polymer Science, vol. 30, no. 10, pp. 3971-83.
Zakaria, S & Poh, LK 2002, 'Polystyrene-benzoylated EFB reinforced composites',
Polymer-Plastics Technology and Engineering, vol. 41, no. 5, pp. 951-62.
Zhou, G, Green, E & Morrison, C 1995, 'In-plane and interlaminar shear properties
of carbon/epoxy laminates', Composites science and technology, vol. 55, no. 2, pp.
187-93.