effects of axle loads as applied by rubber-tired earth-moving
TRANSCRIPT

EFFECTS OF AXLE LOADS AS APPLIED BY RUBBER-TffiED EARTHMOVING EQUIPMENT
TO BRIDGES AND TO RIGID AND FLEXIBLE PAVEMENT
F. Copple
A Study in Cooperation with The Michigan Road Builders Association
and The Tire and Rim Association
Research Laboratory Division Office of Testing and Research Research Project R-61 F-61 Research Report No. R-390
Michigan State Highway Department John C. Mackie, Commissioner
Lansing, July 1964

ACKNOWLEDGMENTS
The general aims and objectives of this research project were defiDed by Howard E. Hill, Managing Director, Michigan state Highway Department, aDd the late C. J. Carroll, Executive Secretary, Michigan Road Builders Associatl.on, It was conducted under the general supervision of W. W. McL'aughlin, Testing and Research Engineer, Michigan state IDghway Department, and under the immediate supervision of E. A. Finney, Director, Research Laboratory Division, who provided guidance throughout execution of the project.
Grateful acknowledgment is made to members of the Michigan Road Builders Association for providing earthmoving equipment and operators to conduct pavement load tests, Members of the Tire and Rim Association, and R. Spoonamore, its Task Force Chairman, were most helpful in providing general information, data on tire charallteristics, and suggestions for organizing the project,
L. T. Oehler, Supervisor, Physical Research Section, Research Laboratory DJvision, provided invaluable technical guidance and also contributed particularly to the information presented here concerning bridges, Instrumentation of the pavements at the field test sites was done by the Laboratory's Instrumentation Unit under supervision of Paul Milliman. other Laboratory personnel aided in field testing and data processing.

CONTENTS
Synopsis .. 1
Introduction 1
Tire Information 3 Test Methods and Equipment . 3 Test Results 6
Rigid Pavement . 7 Test Methods and Equipment . 7 Test Results . 15
Flexible Pavement 18 Test Methods and Equipment . 18 Test Results . . . . • . . . . 22
General Discussion: Rigid Pavement. 22 Warping Effects: Reduced Support as Pavement Curls Upward., 25 Warping Effects: Dead Load Stresses as Pavement Resists
Curling. . . . . . . . . . . . 27 Effects of Tire Contact Area . . . . . . . . . . . . 2 8 Effect of Impact . . . . . . . . . . . . . . . . . . . 32 Effect of Seasonal Variations in Subgrade Modulus 32 Effect of Lateral Placement of Load on Pavement. 33
General Discussion: Determination of Axle Load Limits 34
General Discussion: Flexible Pavement . . . . . . • . . 37 Performance Related to Shear Stress and Structural Fatigue . 37 Seasonal Variations . . . . 3 8
General Discussion: Bridges . 39
Summary. . 42
Conclusions 43
References . 44
Appendices 47

EFFECTS OF AXLE LOADS AS APPLIED BY RUBBER TIRED EARTHMOVING EQUIPMENT
TO BRIDGES AND TO RIGID AND FLEXIBLE PAVEMENT
Synopsis
This report describes the results of field studies made to determine the strain and deflection effects of wheel loads as applied to rigid and flexible pavements, and presents a theoretical analysis of stresses induced in bridges, by self-propelled earthmoving equipment using large, low-pressure, rubber tires. The objective was re-evaluation ·of current laws regulating over-the-road movement of these construction vehicles, with particular attention to the current wheel load limit which is based on a unit of load per inch of the width.
In addition to data from the field studies, results of previous experiments conducted by the Department, by the AASHO, and by the Highway Research Board were utilized in reaching some of the conclusions.
The effects of equal wheel loads on rigid pavement were approximately the same regardless of whether applied through low-pressure tires or through conventional truck tires. On the basis of this evidence, it appears that existing regulations based on tire width should .be replaced by load limits based on total axle load.
In particular, such heavy vehicles as earthmovers might be permitted to move over rigid pavements without causing undue distress, regardless of tire size, provided that their axle loads do not exceed a recommended maximum of 50 kips, and if their movements are infrequent and restricted to certain daylight hours when pavement slab corners are warped downward, and if seasonal load restrictions are observed.
Flexible pavements normally are not rigid enough to spread concentrated loads. For this reason, low-pressure tires with their lower contact pressures could be permitted to carry slightly heavier loads than could higher pressure tires, without causing undue damage to the pavement'. For flexible pavements built to Interstate standards it appears that axle loads up to 50 kips might be carried if seasonal load restrictions are observed.
Since there are both Hl5-44 and H20-Sl6-44 bridges throughout Michigan's highway system, extended permits (which allow almost unrestricted movement of earthmovers) should be granted only for vehicles with no single-axle load exceeding 32 kips and with a wheelbase of at least 22 ft because of the limited capacity of the Hl5.
Problems have arisen in recent years involving the movement of self-propelled rubber-tired earthmoving equipment, or "scrapers," over highways from one job site to another. It is very convenient and comparatively economical for a contractor to move this type of equipment under its own power rather than to haul it on a "low boy" trailer. However,

axle loads on the larger types of empty earthmoving equipment often exceed 50 kips. Loads of this magnitude exceed the following current Michigan limits for both wheel load and axle load:
Wheel load - 700 lb per in. of tire width (based on the tire manufacturer's rated size).
Axle load- 18,000 lb per axle for single axles with pneumatic tires, and 32,000 lb on one set of tandem axles in a combination (on designated highways).
Because of improvements in highway design since promulgation of the law limiting wheel loads to 700 lb per in. of tire width, the Department, in 1961, modified the limit to 850 lb per in. of tire width, pending the outcome of the AASHO Road Test and other relevant tests to be conducted by the Department.
It was decided to investigate the practicality of the current maximum wheel load limits, and in particular to determine how total wheel loads would be affected by this modification in limits (33. 5-33 tires could legally carry single axle loads of 46.9 kips under the 700-lb limit, and could legally carry single axle loads of 56.9 kips under the 850-lb limit), and what effect these increased loads would have on pavements.
Because very little information is available regarding the effects of loads applied to pavements by the large low-pressure type tires used on earthmoving equipment, the Department established a project in May 1961, to investigate the strains, stresses, and deflections induced in pavements by various loads applied through this type of tire. Such values could then be compared with theoretical values obtained by applying the same loading figures to conventional equations. It was also proposed to investigate the relationships between effects of various loads on pavements and corresponding tire characteristics such as air pressure and size of contact area. A theoretical analysis was used to determine the stresses induced in bridges by the scrapers.
As a result of several discussions between representatives of the Department, the Michigan Road Builders Association, and the Tire and Rim Association, it was decided that the best approach to the problem would be to measure the strains and deflections induced in a pavement when loaded with various sizes and types of rubber-tired earthmoving equipment.
-2-

Both rigid and flexible pavements would be load tested. The rigid pavement would be instrumented with electronic strain gages and deflectometers. Benkelman beams would be used for measuring load deflections of the flexible surface.
Fortunately, at the time of the test certain rigid and flexible pavements were available which had been built to Interstate standards but had not yet been opened to traffic. This was a great convenience because it eliminated the hazards involved in installing test instruments and moving large vehicles on highways open to normal traffic. The site selected for conducting the rigid pavement tests formed part of the westbound lane of I 96 near Cascade, Michigan. A section of the eastbound roadway of I 196 near Fruitport, Michigan, was used for the bituminous test pavement. Typical cross -sections of rigid and flexible pavements used in this experiment are given in Fig. 1.
MRBA members agreed to furnish a variety of heavy equipment together with equipment operators for test loading the pavement. In order to determine what influence vehicle speed might have on the load effect, each unit of equipment would be moved over the test area a number of times both at "creep speed" and at approximately 20 mph,
In the case of rigid pavement, it was realized that certain stresses exist in concrete slabs at all times because of shrinkage and movement due to temperature and moisture differentials. For this reason, it was planned to measure only load stresses, rather than total stresses which would include warping.
TIRE INFORMATION
Test Methods and E.quipment
Vehicle loads are transmitted to the pavement through vehicle tires. Knowledge of the characteristics of the area of contact between the tire of a vehicle and a pavement, therefore; is quite important. Tire contact area data for each vehicle used in the test were obtained, including gross contact area, wheel load, and air pressure.
Fig. 2 shows a tire print being lllllde. At least one tire print was obtained for each test vehicle at the time of load testing. A large sheet of paper was taped over a 3- by 4-ft metal frame. The frame was laid flat over a 3- by 4-ft sheet of metal coated on the surface with a thin
-3-

J,. I
RIGID PAVEMENT Cl 96 WESTBOUND ROADWAY)
,._
ro------+o-- a' 12' j 12' I0'---<-1 I
REINFORCED I CONCRETE PAVEMENT I
C9" UNIFORM l
j I I 318" CROWN
.....--:---= ~mY%\§'§>>1 ;~ :1,.,,1 ~ IGmM/l??pmVZz>.t -------=------- 3
11 SELECTED SUBBASE SUBBASE -----
FLEXIBLE PAVEMENT 11--, CI 196 EASTBOUND ROADWAY)
r.. 12' 12'
BIT. PRIME COAT @ 0.25 GAL SQ YO BIT. BINDER COURSE @ 200 LB SQ YO BIT. CONC. LEVELING COURSE @ 130 LB SQ YO BIT. CONC. WEARING COURSE@ 130 LB SQYD
--+12'
SUBBASE
3" SELECTED SUBBASE AGGREGATE BASE COURSE SPECIAL
81
UNIFORM COMPACTED
Figure 1. Typical pavement cross-sections at test site.

layer of printer's ink. The tire to be printed, still on the vehicle, was rolled onto the middle of the framed paper. By using a level and plumb bob, the location of the center of the axis of rotation of the vehicle tire was projected onto the tire print and marke<:l. The vehicle was then carefully backed off the paper, leaving a tire print continuous in the direction from which the vehicle rolled onto the frame, but of a semi -elliptical shape where the front edge of the tire was stopped on the paper. Using the projected location of the axis of rotation of the tire, a true picture of a halftire print was obtained.
Figure 2. Making a tire print.
Using a planimeter, the gross contact areas of the half-tire prints were measured. The tire print was assumed to be symmetrical; therefore the half-print measurements could be doubled to yield full print areas.
In addition, the Tire and Rim Association conducted an independent series of load tests which provided information regarding the relationships between contact area, tire size, wheel load, and tire air pressure. A typical graph illustrating tire-load relationships as determined by the Tire and Rim Association is given in Fig. 3. Additional graphs providing industry average data for other specific tire sizes are given in App. A.
-5-

Test Results
Gross tire contact areas obtained in these field tests and average values as furnished by the Tire and Rim Association may be compared in Table 1. There is close agreement between these values. When measuring the area of a tire print, it was difficult to determine the exact perimeter because the extreme edges of the prints were not sharply defined. This could account for small discrepancies between separate measurements of the same tire print.
•• 36
34
32
30
::l •• % ! 26
• 24 %
i 22
~ zo· %
I; 10 z w ~ 16
I;
~ 14
8 12
10
• • 4
2
0
50
45 1-b
' /1 r--,,'"1 / ~r.v
I / v f, ~!' / Vj I 17._.,&
IF 1/ I /!'_ /J I I ~li./-
40
30
/I I .... ~ •' • // I ~1' ~/ ;! .,.
~&; I /j V// / ~ // // 1/ ~,. /
o~r-.;, ~v _..p 1/ I /_// / c ~'/ "~· I II.
" IV/ / /fh V/ l TIRE SIZE, 2&.5-25 ~-
-!{ TIRE INDUSTRY AVEAAc;£
v OCTOBER 1981 _
15
10
•
0 0 tOO 200 300 400 .500 600 700 800 900 1000
GROSS CONTACT AREA 1 SQUARE INCHES
Figure 3. Characteristics of tire contact areas for various wheel loads and air pressure.
Fig. 3 provides a comparison of measured tire contact areas from vehicles typical of those used in this field test, with theoretical contact areas obtained when wheel loads are divided by corresponding tire pressures. Theoretical areas differ considerably from measured areas and this difference increases in proportion to the wheel load,
-6-

Average relationships between net and gross contact areas for tires used on earthmovers as provided by the Tire and Rim Association are as follows, with "net contact area" defined as that portion of the tread actually in contact with the pavement:
Traction Type Earthmover : Rock Type Earthmover : Trailing Type Earthmover:
net is 54 percent of gross net is 66 percent of gross net is 60 percent of gross
TABLE 1 CHARACTERISTICS OF TIRES ON LOAD TEST VEIDCLES
Tire Gross Contact Area, sq in.
Tire Air Test
Pressure, Wheel Load, Tire & Rim Michigan Theoretical Area,
Size psi kips wheel load Assn. Field Tests + air pressure
33.5-33 60 17.95 348 344 300 33.5-33 48 22.7 442 427 470 24.0-25 44 7.35 154 156 160 33.5-33 55 17.7 362 384 320 29.5-35 45 22.86 400 514 510 30.0-33 35 23.49 540 560 670 29.5-35 48 10.42 200 217 220 24.0-25 40 16.07 350 343 400 27.0-33 45 11.28 232 236 250 33.5-33 59 24.5 440 446 420 11.0-20 80 9. 0 209* 110 29.5-25 Hydro- 13.44 510
inflated
• Dual wheel group.
RIGID PAVEMENT
Test Mefuods and Equipment
Fig. 4 shows the area used for the rigid pavement phase of the test. All rigid pavement strains were measured using SR-4, type A-9 (6-in. length) electrical resistance strain gages. Starting from a reference contraction joint, SR-4 electronic strain gages were placed 18 in. apart continuously along the free edge of the pavement to a distance 12 ft from tile joint. The same type of strain gages were placed parallel to the reference contraction joint at distances from the pavement free edge of 1 ft, 2ft 3 in. ,
-7-

Figure 4. Site of rigid pavement load tests.
3 ft 6 in. , 4 ft 6 in. , and 9 ft. Delta rosettes constructed of SR-4 gages were placed along a line bisecting the free edge and contraction joint. The rosettes were placed at distances of 4 and 6 ft from the corner. Single gages were placed along the free edge of the pavement 49 ft 6 in. from the joint in either direction.
-8-

Due to the limited number of available electronic data recorders, the dynamic load testing of the pavement could be conducted with no more than 10 strain gages simultaneously. Initially, there were approximately 18 gages installed on the pavement, so that several had to be eliminated from the dynamic tests. This was done by statically loading the pavement before beginning the dynamic tests. Thus, time was allowed to obtain readings from all gages. The gages yielding the most significant results were selected for use during the test. Location of the strain gages used in the dynamic test is diagrammed in Fig. 5. All gages except the rosettes were placed 6 in. from and parallel to the slab edge.
The strain gages used in the test were situated as follows:
3 gages -one delta rosette 6ft from corner. 1 gage -longitudinal free edge, 49ft 6 in. approach side of reference
contraction joint. 1 gage - longitudinal free edge, 49 ft 6 in. leaving side of reference
contraction joint. 4 gages -parallel to longitudinal free edge at 4, 7, 10, 12 ft from
reference contraction joint on approach side. 1 gage -parallel to transverse contraction joint at 4 ft from longi
tudinal free edge.
The gages were installed by the following method:
An abrasive stone was used to smooth the areas of concrete which were to receive the gages. A layer of Armstrong A-1 epoxy resin cement was placed on the concrete to act as a moisture barrier. After the epoxy resin had dried, a strain gage was placed on this moisture barrier and cemented in place, again using Armstrong A-1 cement. Infra-red lamps were used to accelerate the set of the epoxy resin. Another layer of epoxy resin was placed over the gage as protection against weather. Wire leads running from the electronic measuring equipment were soldered onto the gage leads. Fig. 6 illustrates some operations during application of the SR-4 strain gages to the pavement.
Four deflectometers used during the test to measure pavement deflections were located as illustrated in Fig. 5. A typical deflectometer installation and use of a Benkelman beam to measure load deflection of the subgrade which supported the deflectometer base are shown in Fig. 7. After completing the load measurements of the test joint area, two deflectometers were set up at another contraction joint labeled as "Test Area 2" in Fig. 5. Loads of known weight were moved over Test Area 2 to record joint deflection characteristics for comparison with those of the original reference joint.
-9-

.lAIR TC ~
. ' .. .., .. .. "' -:s: :s:
-+----="a.:"=-+-~----- ~~ ~~ !~ -------'"'-'--jj----~ -'+'------- . -----''"-'-+
If---,._ ,•------1
~
. ~ • • ~ • • ~
TEST AREA
I
,-----·---"_:1-:-:l.,:-F*.r_'_' ---------, .. ·-r··_· -------------,'t--r;-.:}t.rr"-:_~_---, ~ ~ ~
NOTES: Sl THAU SIO - SR-4 TYPE A-~ STRAIN GAGES
ATTACHED TO PAVEMENT.------------------
01 THRU 04 - 0Efl£CTOMETERS1 TEST AR£A I ----- e 0~ THRU 07 - DEfLECTOMETERS, TEST AREA 2 ----- e !VENT. MARKERS 1,3,!i~ 7-SANSORN, T£S7 AREA!_ ___ _
EVENT MARKERS t ~II- SANBORN, TEST AREA 2----
EVENT MARKERS 2,4,0 r,O-HATHAWAY, TEST AREA I_ __ _
EVENT MARKERS 10 I, 12- HATHAWAY TEST AREA 2---
TC-THERMOCOUPLES, TOP ANO IOTTOM Of SLAS ____ A
<
Figure 5. Location of test apparatus on I 96 rigid pavement.
-10-
TEST AREA
2

I 1-' 1-' I
~-~--~-~~---·~--~~-~-~ -~--~ ::=-=-~ -==-=-=::=~==:==:: .. ___ ~'.~~·-:.::.~-~ "''~·-·-~-~~'"'::::....::.;::..:::_-~-~--=-,· "'«"'""-~"'"~---~"·-~-«-· ~~· -=-=----·------::_--~'i__~-
Figure 6. Installation of strain gages on rigid pavement, showing preparation of surface (left) and drying adhesive with heat lamps (right).

Figure 7. Deflectometer (top) positioned for use and Benkelman beam (bottom) as placed for measuring deflection of soil under deflectometer.
-12-

.i
~ !
Thermocouples for continuous temperature measurement were placed a) under the pavement, b) on top of the pavement slab, and c) freely suspended in air. The temperature differential between the slab top and bottom could then be calculated as an indication of pavement warping.
Masking tape l-in. wide was used as a vehicle alignment strip and was placed parallel to and 1 ft in from the edge of the pavement. As vehicles moved over the test area, they were guided so that the outer edge of their outer wheels continuously coincided with the alignment strip. Electronic event markers were distributed over the test area as shown in Fig. 5.
The load tests were conducted on June 27, 1961, from 2:00 to 6 :00 p.m. Heavy equipment units provided by the MRBA for load testing the rigid pavement (Fig. 8) were as follows:
Wheelbase Axle Load, lb Vehicle Type ft Front I Rear
Euclid TB-24 (Scraper) 25.6 49,000 35,000 Euclid TB-24 (Scraper) 25.6 45,420 35,900 Le Tourneau-Westinghouse Model B (Scraper) 26.3 46,980 22,560 Caierpillar 631A (Scraper) 22.7 45,720 20,820 Le Tourneau-Westinghouse Model C (Scraper) 22.3 32, 150 14,700 Le Tourneau-Westinghouse Model D (Scraper) 14.9 15, 600 6,400 Michigan Model 280 (Bulldozer) 8.7 26,870 30,890 Federal Type IT Truck (MSHD property) 18,000
Before any strain or deflection measurements were taken, a large rubber-tired earthmover was run over the test area to cause an initial settlement of the pavement. The test equipment was then lined up in a caravan starting approximately 100 yd from the first strain gage. Each unit of equipment was moved over the test area and out of the influence zone before the next was permitted to begin its run. Each earthmover made three runs at creep speed and three at approximately 20 mph. An MSHD Federal (Type II) truck with a standard 18-kip axle load was moved over the area intermittently during the test period, providing a standard load to be used in correcting the changing deflection values for a given load due to the effect of pavement movement resulting from changing temperatures.
After the dynamic load tests had been completed, two 6-in. concrete cores were removed from the pavement in the vicinity of the test area. These cores were used to measure the true thickness of the pavement and were tested in the laboratory to determine modulus of elasticity and compressive strength.
-13-

I
~
NO.I
AXLE LOAD
N0.2
AXLE LOAD
AXLE LOAD
ElL".~ 49,000 LB 35;000 LB
~ ... __ift 45,420 LB 35"900 LB
I EUCLID TS-24 (SCRAPER>] VEHICLE NO.$ I AND 2
FRONT REAR
~,.,____Sp 40,980 LB 221 560 LB
I LETOURNEAU-WESTINGHOUSE MODEL 6-<SCRA?ER>J VEHICLE NO. 5
Figure 8.
AXLE LOAD
AXLE LOAD
t1L_,_~ 45~ 720 LB 201 820 LB
I CATERPILLAR 631 A (SCRAPER) I VEHICLE NO. 3
REAR
t1L_,,._ip 32,150 LB 14,700 LB
1 LETOURNEAu-wESTINGHousE MoDEL <::cscR"Ai>"Ef'l)]
VEHICLE NO. 6
AXLE LOAD
~ .. 9 26,870 LB 30,890 LB
I MICHIGAN MODEL 280 (BULLDOZER) I
AXLE LOAD
VEHICLE NO.4
FRONT REAR
tg__,.JP 151 600 LB 6,400 LB
I LETOURNEAU-WESTINGHOUSE MODELDCSCAAPERJ]
VEHICLE NO. 7
Vehicles provided by MRBA for load testing.

I·
I I I I ! •
' .
Test Results
The maximum strains measured by each gage were compressive in all cases, except at gages 8 and 9 (one leg of the rosette and parallel to the transverse joint) which indicated tensile stress in every instance. The tensile strains measured by these two gages were consistently small as compared to the compressive strains present elsewhere in the slab.
Each strain value used in this report is an average of measurements made at a single gage during three load tests as repeated with each earthmoving vehicle. The corner gage giving the highest strain reading was used for obtaining the values given in this report. The free edge strains of two separate slabs were averaged to obtain more representative values. A static modulus of elasticity for the concrete of 4. 7 x 10⁶ psi was determined from two cores taken from the pavement. These cores also indicated an average pavement thickness of 9.1 in. and a compressive strength of approximately 5300 psi.
Wheel load-slab strain relationships are plotted in Fig. 9. Fig. 9A shows strains and loads at the slab corner, while providing a comparison of strain values with scraper vehicles moving b.oth at creep speeds and at 20 mph. An excellent linear correlation exists between corner strain and wheel load, and there appears to be no appreciable difference in corner strain as a result of variations in vehicle speed. Fig. 9B shows corresponding strains measured at the pavement's longitudinal free edge, at creep speed and 20 mph. Very little variation in strain due to speed appears for any of the wheel loads tested. Figs. 9C and D indicate that for the greater wheel loadings strains are greater at the edge than the corner, but that strain values for the two areas of loading converge with lesser wheel loads. Greater stresses should be expected at the free .edge, since load testing was conducted in the afternoon when the slab corners were curled downward.
Deflection-load relationships for corner and free edge loading are plotted in Fig. 10, with excellent linear correlation between load and deflection for all data. Vehicle speed clearly affects the load-deflection relationship at both loading locations. Deflection appears to decrease when vehicle speed is increased. Trace measurements indicate no signs of increased deflection due to impact, probably because of the smooth condition of the new pavement and the relatively low speeds at which vehicles moved over the test slab. Impact would almost certainly increase both deflections and strains when applied to a rough or uneven surface.
-15-

••,r------------------------------------------------, ••r---------------------------------------------,

I .... _, I
·.~--~.:.=.:::::n:::::-;;;:::·:c:,~,· • ··,s~;'c::2::_. ~._:_:_,__ :re:.~;<:::
••,-----------------------------------------------,
~ 10
• ~ . 0 • ~~ 6
" ~ 4
< ~ '
o,
" ,.
. " g
• ::1 10
0 • -. z 0
" u •
~ 0 4
• 'o
C~EEP SPEED ~; ~:::· + '"'~ 0 0
0
l1 0 ...- ..t..,...,....
'"'L TKUOK _ _- ........... ~ -.,.__.-.o _...-- A I _.o-- _;-·~ ~
_....-- ,_,_- CREEP ~:.EE EDGE 20 MPH ED AND 20
>'"' o.322X + MPH
• 4 6 • 00
ro= 0.961 o.e!>
"12 14--le
WHEEL. t...OAO, KIPS
06 " " ,.
o Bo A 0 • :;..-
CREEP SPEED _..,..,........;A y:0.442x+3A6 0 ,.,....
,. ,.
b
r:0.94e .Y FED't... TRUCK -< ........... liJ .......... A B I
o ~ 6/"A VEHICLE APPROACHING ~A /'f!' CORNER
_......~~-~ 20MPH ,.,.,.- ~~ >'"'0.422:X-'"2.$1!
.,..........- r "'0.9.52
0
•
' 4 • 6 " flif .. re 1s " "lf2 24 2-6 ,. WHEEL. L.OAO, KIPS
06,-----------------------------------------------,
•• .. ..
)( 121
~ ~ 10
z' 2 •
~ ~. ~
• 2
·o
0
2......-t'/ ;/" .......... b A
FEO'L. TRUCK-<>?-" y_,A_, O
0 0~..... A I ii. VEHICLE LEAVING
~06 ,•
CORNER ~ 20 MPH CREEP SPEED AND 20
/ o ~::.::g• + zu MPH
9o
~- • • 00 12 14 16 18 20 22 ,. .. .. WHEEl.. I..OA01 KIPS
••,-----------------------------------------------~
04
• CREEPSPE ~ o
o 00 y:0442< +~~4;00KN"' ./ ~ ·-0046 _,-~ ----~ ~-6 y -"•
" " 2
i= A ,.,..8" A
:;!& y/~ < ,/ • _,- 0
CREEP SPEED CORNER AND FREE EDGE
0:/;;.---~ CREEP SPEED tFREE EDGEJ >'"0.364-x.+ 1.234 r=0.975
0
oo z • ' • 00 " .. " " " " 24 28 28
WHEEL. L.0,401 KIPS
"c---___ _ ..
~ 12
• 13 10
~ - . z' 0
§ 8
~ 0 4
o,
__./
'
20 MPH {CORNER) ............
y=0.422x+2.!>~ ,~ r= o.!l!>2 A ~
•y' _,-/
,/
• ' •
~· ?"' 0
00 12 14 16 " WHEEl.. L.0,40, KIP.$
20
20 MPH CORNER AND FREE EDGE
22 ,. ,. ,.
Figure 10. Rigid pavement deflection vs. load at creep speed and 20 mph, along free edge and at slab corner
i! I!
.I!
"

Deflections caused by the Federal weight truck as shown in Figs. lOA, B, and C are somewhat greater than the values predicted by the equation of the regression lines. Figs. lOD and E compare the deflection-load relationship as observed at the corner and free edge, with corner deflections significantly greater than those at the edge, for equal loads. Although it may seem paradoxical that corner deflections are greater than those of the free edge while corner stresses are less, a theoretical analysis indicates that this situation is quite possible.
The temperature differential between the top and bottom of the slab is shown in Fig. 11, measured in degrees Fahrenheit per inch of slab thickness. The graph indicates that during the period of load testing (2:30 to 6:30p.m.) the temperature differential for the rigid pavement varied from 1. 25 to 2. 5 deg F per in. of slab thickness. During the test, the slab was warmer on the top surface than at the bottom. This resulted in arching of the pavement slab, with the center tending to rise from the base and the corners tending to be forced down onto the supporting soil.
., : 3 z
.J'"'
.. !,! -:1: .... z .... «zz ..... 1:::; Q~ .. : 0: ::> ... rO ~i UJ.. 0: :;., ~ ..
...
I
" 0 ~ 12!00
~ /' I'\ / \. /"-e..
2:00 3:00 4:00 s.oo
TIME, PM
Figure 11. Rigid slab temperature differential (test date: 6-27-61).
FLEXIBLE PAVEMENT
Test Methods and Equipment
7.00
Due to the somewhat plastic nature of asphalt it was decided to measure load deflections of the flexible pavement by using Benkelman beams. The pavement was marked off to aid in vehicle positioning and the Benkelman beams set up in the general positions shown in Fig. 12. A transverse
-18-

-19-

profile of the pavement, as it deflected under loading, was determined by taking deflection readings at locations relative to the vehicle as shown in Fig. 13. The transverse profiles obtained for the various test vehicles are shown in Fig, 14. The vehicles were located initially outside the zone of influence until the Benkelman beams had been positioned on the pavement. One vehicle then rolled into position for the deflection measurements, stopped for about 5 sec, and moved back out of the area. This procedure was repeated for a minimum of three deflection readings at each position on the pavement. An average value of the readings was taken as the true deflection of the pavement at each location.
I
~ ~I LL 0
u.l
v '
lJ ...J Ill Ill :r !n 3:
'% w
Ill .J u f Ill > LL 0
~ I
I
AXLE OF' VEHICLE
ll .J Ill
~ Ill ,, :r 3:
'% w
X• LOCATION OF' DEFLECTION MEASUREMENTS W= DISTANCE FROM VEHICLE q;, TO INSIDE EDGE
OF TIRE
Figure 13. Location of deflection measurements for flexible pavements.
1-z Ill ::ll Ill > ~ LL 0
Ill
" 0 Ill
Thermocouples were placed a) under the pavement, b) on top of the pavement, and c) suspended in air, for continuous measurement of temperatures at these locations.
-20-

i
• I EUCLIOTS-2411 NO, 2 CSCRAPERl
' 0 0
" ~ .. ~ " ~ " 0 " .. " .. .. ~ " '
_,
. '\ _____ / ~-- // • -· ' / ' ' ...... ~ ....... . , __
' ' -· 0
_,
' _,
• '
•.--------------t----------1 CATERPILLAR I I &31 A (SCRAPER) I
_,
\ /f\ / \ I ', I ' / .... _,. ...
' ' ' ' ,_, " "
-· -·
_,
0 -t4•L--------------I--------------~-•
• I MICHIGAN MODEL 2&0_1 C BULLDOZER>
' 0 0
ro " ~ .. " " " 0 " " " " .. " ro
-
"' ~- / -·
,/ • ' ....... __ ... .:' ' ~
' ' . ' ' ' -· ' .. _, ... _,
0 ' "
_,
" '
. I LETOURNEAU -WESTINGHOUSE I MODEL B (SCRAPER>
' 0 0
" " .. .. " " " 0 " " " " .. " " ' '
\ ,/ ~' -·
I -· ' ' ' • ' ' ' -· ' ', ' " ' ,// ' \ ' ' _,.
\ ..... ___ ...
" ,_, _,
" _,
. '
i
•
' 0
' . •
" " "
•
' 0
' • • •
" "
-· ~ •
•
' 0
' • • -· " " "
-21-
I LETOURNEAU -WESTINGHOUSE MODEL C CSCRAPER>
0
" .. .. 00 " " " 0 " " " .. ~ .. " '
,/ ~' -·
\ -· ' I • ' ' ' ' ' ' ' ' . ' '
_, ..... / ' ' ' ' ' ' ' '-1
'
-~ LETOURNEAU -WESTINGHOUS£1 MODEL D <SCRAPER)
0
" .. .. .. " .. " 0 " .. .. .. .. " "
ro
"' _,
/ ' ' / ' ' ' ' ' ' .... _ .... ' .. .. _ ..... '
-_,
-·
l. FEDERAL TYPE li TRUCK I
~ ~ .. .. .. " 0 " " .. .. .. .. ro
\ I ' \ I
' I
' I • I
' I • I I I \ I
• I ' I • I ' I • I \ I • I \ I
' \ ' • ' ,, ,_, OIS,. ... NCE fROM LAN£ C£NTEA, INCHES
Figure 14. Transverse profiles for flexible pavement deflection. Dasbed lines indicate extrapolated values.
0
_,
-· -· •
_, 0
-· ' -"

Test Results
Withtheequipment available, it was impossible to measure deflections directly under the vehicle wheels. However, using the transverse deflection profile and extrapolating data from the AASHO Road Test, maximum deflections which would occur directly under the wheels were estimated as shown in Table 2. Each deflection value given is an average of at least three successive loading tests.
Fig. 15 shows the estimated maximum pavement deflections in relation to wheel loads. The correlation coefficient for the line of regression is 0. 644, indicating no significant correlation between deflection and wheel load in these tests. However, it is believed that such a correlation could be shown if further tests were conducted.
Fig. 16 expresses the temperature of the bituminous pavement during the test period.
TABLE 2 ESTIMATED MAXIMUM DEFLECTIONS OF FLEXIBLE PAVEMENT
UNDER VARIOUS WHEEL LOADS
Vehicle Type
Euclid TS-24 (Scraper) Le Tourneau-Westinghouse Model B (Scraper) Caterpillar 631A (Scraper) Le Tourneau-Westinghouse Model C (Scraper) Le Tourneau-Westinghouse Model D (Scraper) Michigan Model 280 (Bulldozer) Federal Type II (Truck)
* Dnal group.
Wheel Load, kips
22.7 23.5 22.7 16.1 7.8
15.5 18.3*
GENERAL DISCUSSION: RIGID PAVEMENT
Deflection Under Tire, in. x 103
8.6 11.8 13.4 13.0 6.6 9.2
10.6
Fig. 17 shows the observed free edge and corner stresses determined by tests conducted during this study as compared with those obtained from the AASHO and Maryland Road Tests (1, 2), and with theoretical stresses obtained using Westergaard's equations (3). Because these tests were
-22-

,.,_--------------------------------------------------------------,
'2
g 9
t w ;;' . w 0
7
•
FED'L TRUCK __.......
0
)';:0.133?'+ 5.63 t=0.644
0
0
·L_-~~----~----~~--~~--~~----~----~~--~~--~~~ 5.0 7.5 10.0 12.5 15.0 17.5 20.0 22.5 25.0
WHEEL LOAD, I< IPS
Figure 15. Relationship between flexible pavement deflection and wheel load .
., • ., ... z " 0 :r >-1- • \r z ... ::! ... > ~ ._ 0
i, 0: ... ._ IL
" ... 0
J'
:!0 >-z ... 0: ... IL IL
i5 ... 0: ::> ~ 0: ... ._ :li
ll
4
3
2
~ 0 12·00 1:00
Figure 16. (test date:
~
\ \; !\
~
2:oo 4:00 ~:oo 8:00
TIME 1 PM
Flexible pavement surface source temperature differential 6-29-61).
-23-

480r-----------------------------------------------------,
320
"' .. ' "' 240
"' ... 0: .... "'
160
I FREE EDGE 80
00 2 4 8 8 10 12 14 16 18 20 22 24 28
WHEEL LOA-01 KIPS
320
280 ~Q "',..,.. "'~~ 24o ~~.,
200 -"' .. ' .U) 160
"' ... 0: .... "' 120
I SLAB CORNER 80
40
00 2 4 6 8 10 12 14 18 18 20 22 24 26 WHEEL LOAD, KIPS
Figure 17. Stress vs. wheel load for loads placed at two locations on slab.
-24-

made under different conditions, the following two modifications were made:
1. The loads were corrected to a common lateral placement in which the outside edge of the tire load coincided with the edge of the pavement. This correction was made using information from the Maryland Road Test (4) .
. 2. A dynamic modulus of elasticity, E = 6 x 10⁶ psi, was used to convert measured strains to stresses. This value of E appears reasonable, based on data from both the AASHO and the Mary land Road Tests (5 ,6). Since Westergaard's equations are based upon a static loading condition, a static modulus, E = 5 x 10⁶ psi, is used in solving for the theoretical stresses.
Westergaard's equations have been used for this comparison because they are applicable to situations where the pavement is in uniform contact with the soil, which approximated conditions during the Michigan tests. Other commonly used stress equations, such as Pickett's (1), are applicable when the pavement corners are warped upward.
The curves in Fig. 17 agree quite well, especially when the possible sources of variation are considered. In addition to those listed in Table 3, sources of variation between tests includE:) 1) warped condition of pavement, 2) differences in soil base, and 3) duration of loading. Because of the agreement between the various test results, it appears that the results of the Michigan load tests may be applied to rigid pavements throughout the state.
Warping Effects: Reduced Support as Pavement Curls Upward
It is very important to understand that the load stresses observed during these tests would change significantly throughout each day due to thermalwarpingofthe pavement. Under equal loadings, observedstresses should be much higher in the evening, when the pavement corners and edges are warpe'd upward, than they were for these daytime tests. The Maryland Road Test (8) showed that the increase in load strain due to pavement warping was as high as 300 percent. This increased strain, caused by reduced subgrade support, was shown to be especially severe for corner loading.
Therefore, if load stresses were the only consideration, much greater loads could be carried by a rigid pavement during the day than at night. Modern pavement design equations, such as Pickett's analysis, allow for this condition of reduced slab support, and thus most new pavements are
-25-

I
"" "' I
TABLE 3 TEST CONDITIONS AT THREE RIGID PAVEMENT TEST SITES
Test Factor
Slab length
Slab thickness
Subbase thickness
Reinforced
Subject to heavy traffic before load testing
Location of slab strain measurements
Michigan
99ft
9 in.
14 in.
Yes
No
(a) Corner (b) Midpoint of longitudinal
free edge
AASHO Road Test
15ft
11 in.
6 in.
No
Yes
(a) Midpoint of longitudinal free edge
Type of vehicle loading Rubber-tired, self-propelled Rubber-tired, self-propelled earth movers earth movers
Dowel bars at transverse Yes joint for load transfer
Temperature differential Top warmer than bottom in slab at time of test
Yes
None
Maryland Road Test
40ft
9-7-9 cross-section
None
Yes
Yes
(a) Corner (b) Midpoint of
longitudinal free edge
Conventional trucks with high-pressure tires
Yes
(a) Top warmer than bottom (b) Top cooler than bottom

i I I
)
designed for an unfavorable warping condition. Fig. 18 illustrates the results of pavement temperature differential tests conducted elsewhere in Michigan. The temperature differential between the top and bottom of the slab was zero at about 9:00 a.m. and again at about 8:30p.m .. Between these times, during the day, the temperature differential tended to warp the slab into a favorable position for load carrying. This shows that pavements are not necessarily warped into a favorable position continuously from dawn to dusk. The times of favorable temperature differential would change throughout the seasons of the year, as the periods of sunlight became shorter or longer.
...
.,' "' "' 0: ... "' a
+30
+20
+10
0
-10
<>-
~ 1/' \ /
TOP 1 HIGH~R TEMr~ 1
BOT+ OM- H11GHER
1TEMP \ I
./ -20
-30 12 2 4 6 8 10 12 2 4 6 8 10 12 \ ' I '---------PM------- _ _.,..._ ___ - ----AM-------_,
Figure 18. Temperature differential between top and bottom of a 9-in. rigid pavement measured over a 24-hr period in June.
It has been suggested that because of warping forces caused by a moisture differential, a concrete slab would always remain curled up, never returning to a flat condition (9, 10). However, the daytime cur ling effect appears to reduc'e the load stresses observed in concrete pavements.
Warping Effects: Dead Load stresses as Pavement Resists Curling
As the edges of a pavement are warped up from the supporting soil, the pavement exerts a dead load resisting this movement. These dead load warping stresses appear to be of significant magnitude. The Maryland Road Test indicated that dead load warping stresses during the day reached values up to 560 psi (tension in bottom surface), and during the night; reached 190 psi (tension in top surface). Although these large stresses,
-27-

when caused repeatedly by vehicle loading, should have caused severe cracking of the pavement, in all cases they did not. To some extent, this may be due to the difference in rate of strain for the two types of loading. Watstein (11) showed that the rate of strain could alter the modulus of elasticity of concrete by as much as 33 percent. Therefore, slowly applied strains may not cause stresses as great as those caused by vehicle loading.
It is almost certain that dead load warping stresses are a factor in pavement cracking. If cracking were due only to vehicle loading, pavements should crack diagonally across slab corners. However, pavement performance surveys (12, 13, 14) show a predominance of transverse cracks and relatively few diagonal corner cracks. This helps substantiate the widely accepted concept that critical stresses in sound concrete pavements are due to the combined effect of pavement warping and superimposed traffic loads (13, 15, 16).
Vehicle load stresses in the bottom of a slab are tensile directly under the load and have peak or near peak values for only a short distance. Therefore, theperiodwhen both vehicle load and dead load warping stresses are additive could be during the day when the wheel load is at the free edge of the slab, whose corners would be warped down. Thus, although the vehicle load stresses during the day would be relatively low because of improved pavement edge support, the load carrying capacity of a slab would probably not be increased during the day because of the large daytime dead load warping stresses.
Effects of Tire Contact Area
Within the range of tire sizes currently in use, tire contact area has relatively little effect on either stress or deflection. In a theoretical analysis, it is assumed that the outside edge of the tire coincides with the pavement edge. Therefore, the center of load is considered to be at the center of the tire print, and an important consideration for the tire print is its radius or distance of the center of the load from the pavement edge, rather than the tire contact area. Because the radius is a function of the square root of the tire contact area, small changes in area have very little effect on the radius.
Fig. 19 illustrates the theoretical relationships between corner stress md corner deflection of rigid pavement, expressed as a function of the
radius of the tire contact area. Pickett• s stress equation for protected corners (App. B) and Westergaard's equation for corner deflections (App. C) were used ;n computing the theoretical values. Fig. 19
-28-

70,-------------------------------------------------~
~ eo ! II .;: 0 ~ "' 50 ., • • v ., ~ ., 40 0 z < ~ § ii!30 ~ z
~ 5 20 ;,;
!z ~ a: ... ... 10
STRESS
DEFLECTION
oL-----------~------------------L---------------~~~ 0 !t 10
RADIUS OF TIRE CONTACT AREA/ IN.
Figure 19. Theoretical percent change in stress and deflection due to variance of radii of tire contact areas.
15
suggests that variations in tire contact areas cause somewhat similar effects on both corner stresses and deflections. Data provided by the Tire and Rim Association (App. A) suggest that a wheel load of 20 kips would be carried by a scraper whose radius of tire contact area would normally range between 10 and 14 in. This same load, if carried by the dual wheel group of a conventional truck, would result in a radius of gross contact area of approximately 10 in. When the effects of these two radii are compared, using Fig. 19, there is little indication of any large difference in pavement reaction to the various tire types.
-29-

An 18-kip axle load was applied by a conventional truck (the Federal Type II) in the Michigan test, producing the pavement strains noted in Fig. 9. Although the strain values measured for this conventional truck load fall somewhat above the regression line determined for the earthmover loads, no reliable relationship can be established from the Michigan data until further tests are conducted.
Results of the AASHO Road Test (17) as shown in Fig. 20 indicate no significant difference in stresses caused by different air pressures in the tires of earthmoving equipment used. Further, the AASHO data indicate no increase in compressive strains recorded for the conventional truck loads as compared to the rubber-tired earthmovers. Fig. 21 illustrates the relationship between corner deflection and wheel load (17) for the same pavement shown in Fig. 20. In most cases, the conventional tire loads caused greater deflections than equal loads applied through scraper tires.
• 0
6 0
40
0
60
40
20
0 0
--------------.. / \
: Medium Scraper Unit j ,-------------,
I \ ! Small Scraper Unit l • kpa! I It 45pai o DUAL TIRES !)""----
/ •/
_./ • ........
.....:•
/ /,
__.Y • ;I
y / ..... . ,.,..
; -6 f, I
15 Tph J>/
/'I /(' I 15 "lph
l.r---/
/' ...... __ ..... •• ... /
'...-""'< •
y'" /./
/ ' /
,./" .. ,---
o-'1 Creip Spee1 '"' ,/ cip sp••j 'I
• 10 13 20 •• 30 0 • 10 13 20 23 WHEEL LOAD, KIPS
Figure 20. AASHO Road Test strain-wheel load relationship for rigid pavement (11-in. slab, 6-in. base).
-30-
30

,-----------,, : Small Scraper Unit \
.05 I I
Section 397 11-6 Design
.03
"' ~ .01 u z
15 mph
5 ;:: 0 '-:----'----'----:-' u w -' ~ ~5~----,------,----~
" <r w z <r 8 .041---+---
.01
Creep Speed
o'----'----'---.J 0 10 20 30
,-----------, : Medium Scraper Unit {
' I
/
"I /y"-45PSI}C/
i;x· I ' . I It r---· ~-/ --30PSI
*'-· I DUAL TIRE
1--o/ I
15 mph
I
Creep Speed
0 10 20
WHEEL LOAD, KIPS
3C
Figure 21. Effects of tire pressure on rigid corner deflection for scrapers and conventional dual-tire truck units at creep speed and 15 mph (11-in. slab, 6-in. base).
However, in the AASHO tests, the wheel loads of the conventional vehicles were not nearly as great as the loads of the heavy earthmovers. Therefore, conclusions drawn from these AASHO tests are reliable only for wheel loads up to about 10 kips. The AASHO small scraper unit had a struck capacity of 14 cu yd and used 26. 5 x 25 size tires. The medium scraper unit had a struck capacity of 21 cu yd and used 29.5 x 35 size tires.
-31-

From the information presented in this report, it appears that any load limitations based upon maximum allowable rigid pavement corner stress would be applicable either to conventional trucks or to rubber-tired earthmovers without regard to air pressure or tire type.
Effect of Impact
During this test, no impact effect could be measured when the rubbertired scrapers were moving over the pavement. Since the scrapers moved over the highways at relatively low speeds (about 20 mph) and were equipped with low-pressure tires, inflated to about 45 psi, it appears that they caused no great increase in stress due to impact. However, the effects of impact should be considered for conventional load-carrying vehicles which move over highways at much greater speeds and with tire air pressures of 100 psi.
Effect of Seasonal Variations in Subgrade Modulus
Highway deflection: measurements taken during a series of load tests on M 78 in Michigan indicate that seasonal fluctuations in subgrade modulus have a considerable effect on pavements. Average deflections during the March thaw were about 400 percent higher than those measured during summer. By extrapolating the curves in Fig. 22, it appears that this increase in deflection should be accompanied by an increase in stress of about 30 percent.
Fig. 22 illustrates the theoretical relationship between rigid pavement corner stress and corner deflection expressed as a function of subgrade modulus, k. Values of the relationships were computed using Pickett's stress equation for protected corners (App. B) and Westergaard's equation for corner deflections (App. C). Parameters used in obtaining the curves shown in Fig. 22 are the same as those given in App. · C, except that the radius of tire contact area was held constant at 10 in. Subgrade modulus was permitted to vary from 50 to 300 lb per cu in. The computed stress for a subgrade modulus of 300 lb per cu in. was used as a base figure. Any gain in stress or deflection due to a reduced subgrade modulus was plotted on the graph as a percent increase over the base value.
It appears from Fig. 22 that pavement deflection is affected considerably more by variance of subgrade modulus than is the stress. A reduction in subgrade modulus from 300 to 50 lb per cu in. increases the deflection by almost 200 percent while the stress is increased orily 20 percent. The 300 to 50 lb per cu in. range of subgrade modulus is believed
-32-

to be a reasonable indication of the seasonal variance in support qualities of a typical pavement base.
200r-----~~-----------------------------------------------,
~ "' . "';;
180
~a 160
"'"' ~ ~ 140
z"' a-' f=O 0 g 120 ~!I ~"' ""' 0 .J I 00 ~5 ,..a "'~ < LiJ 80 "'o 5~ ~ ~ 60
!ziii "' ~ ~ 40
~~ CORNER STRESS
CORNER DEFLECTION
2:L::==-========~~ 50 100 200 300
SUBGRADE MODULUS,K,LB PER CUIN,
Figure 22. Theoretical relationship between rigid pavement corner stress and. deflection, as a function of subgrade modulus, k.
Effect of Lateral Placement of Load on the Pavement
All rigid pavement load testing was conducted during this study with the outer edge of the vehicle's wheels moving parallel to and 1 ft in from the longitudinal free edge of the slab. According to the Maryland Road Test report (4), an increase exceeding · 40 percent in both stress and deflection would result if a load were moved a distance of 1 ft to the outer free edge.
Typical track widths for three types of rubber-tired vehicles, in terms of distance from center to center of wheels, or of dual wheel groups where applicable, are as follows :
Vehicle Type
automobile truck
Track Width
60 in. 72 in.
scraper 87 in.
This suggests that the scrapers will probably travel with their outer wheels very close to the edge of the pavement.
-33-

GENERAL DISCUSSION: DETERMINATION OF AXLE LOAD LIMITS
MaJtimum permissible axle load for a pavement of a given design may be computed in a number of ways. Four are discussed here and one is selected for use as most applicable to the situation.
1. Portland Cement Association (PCA) Design Criteria. The PCA (7) recommends the use of Pickett's equation for pavement design. Pickett's equation (App. B) considers the slab corners to be warped up and therefore is supposed to yield a design that will be valid under conditions of reduced subgrade support, but will be conservative for conditions when the slab corners are warped down and are thus in contact with the base material. The PCA further states that "it is unnecessary, under normal conditions and with the jointing arrangements recommended herein, to reduce the allowable working stress due to loads in order to compensate for curling stresses." The PCA method indicates that a 9-in. rigid pavement can carry single axle loads up to 32 kips without exceeding 325 psi. Since Michigan requires a minimum modulus of rupture of 650 psi for concrete used in highway pavements, the 325 psi value (50 percent of the modulus of rupture) is used as the working stress of the concrete. Stresses which do not exceed this working stress may be sustained by the concrete for an unlimited number of repetitions without suffering fatigue failure (18). A modulus of subgrade reaction of 200 lb per cu in. is assumed in determining this maximum allowable axle load.
2. Michigan Observations. The strain measurements made during these tests, when the pavement was subjected to the earthmover loads, were taken when the slab was warped into a very favorable condition. If the measurements had been taken during the evening when the pavement corners were warped up, much higher load stresses would have been observed. Therefore, any axle load limits based on the strain values observed during these tests would be valid only during that period of the day when the pavement corners were warped downward. If the 325-psi allowable working stress is again used, Fig. 17 indicates that the 9-in. test pavement could safely carry single axle loads up to about 44 kips. Dead load warping stresses again have been ignored in determining the maximum allowable load.
AASHO Road Test Observations
Fig. 23 was plotted from AASHO Road Test information. The load strains used in the diagram were computed for conditions when the pavement edges were warped up (19), and are therefore the maximums to be
-34-

I g; I
---"':;__. -·->:::i.:i:--_,__ .. :-._,:.-.<.- :---'<:_.:;
400 r-----------------------------------------------------------, 400 r---------------------------------~r------------------------, X
300 ~ ... g 0
~ 0:
"' ~ ~ ... z :::; 200 .; z ;: ~ 5 ~ z "' :E
~ 11. 100
I SINGLE-AXLE I
9
X X
0 xo
I I
0
0
X
X
XI X
I X
vv•e ... X
X X
X
X
300 ~
I ... " ., 0 0
I 2 0:
"' ~ ~ ..
I z J 200
.,-I i!'
"' " I
.. a:
" ~ z "' :E
"' > .. ll. I 00
I TANDEM-AXLE ml
X
'X
xl /x xo
X x I X X
xo
0
8
I
0
0
0
X
X
rv---v = e .163 x
0 0 oL---==~=----L-~--~----~----~----~ 0 10 20 30 40 50 80 0 10 20 30 40 50 eo
STRAIN~ MIC~OINCHES PER INCH STRAIN, MICR~INCHES PEA INCH
O=CRACKING AFTER 1,114~000 AXLE APPLICATIONS X= REMOVED FROM TEST BECAUSE OF SEVERE DISTRESS
Figure 23. Relationship between rigid (reinforced concrete) pavement cracking and strain.
[dj

expected under the various loadings. These load strains were probably considerably less throughout the rest of the day when the corners were not warped up as much. It is interesting to note that in almost all instances these maximum load strains converted into stress values considerably less than 50 percent of the modulus of rupture of the concrete. Therefore, the concrete should not have cracked at all (18), unless there were stresses present caused by other forces. These other forces were probably due to the dead load of the warped pavement.
From Fig. 23 it appears that single axle load strains above 35 microinches per in., or load stresses above 200 psi, cause excessive pavement cracking. This suggests that the average effect of dead load warping stresses was about 150 psi and was added to the live load stresses. Since physical characteristics of the concrete used in Michigan pavements do not differ greatly from the AASHO Road Test pavement, it appears that the effect of fatigue would be similar for the two.
3. PCA Criteria plus AASHO Effect of Dead Load Warping stresses. The PCA method indicates a maximum allowable single axle load of 18 to 20 kips if the load stress in the 9-in. slab is never permitted to exceed this 200-psi limit. The present single axle load limit in Michigan is 18 kips. An axle load limit determined in this manner would be valid regardless of the time of day or warped condition of the pavement.
4. Michigan Observations plus AASHO Effect of Dead Load Warping Stresses. By limiting vehicle travel only to hours when the pavement is warped into a favorable condition, Fig. 17 indicates that axle loads up to about 28 kips can be carried without exceeding the 200-psi stress limit. This method of evaluation is valid only if the dead load warping stresses in the slab are constant during all hours of the day. This is very unlikely since, as stated previously, the Maryland Road Test indicated great pavement dead load warping stresses during the day, which were additive to the vehicle load stresses.
Table 4 summarizes the maximum allowable axle loads determined by these methods. The table also indicates the behavior of a 9-in. rigid pavement under a 50-kip single axle load (the maximum used in the Michigan load tests). For the PCA analysis, the modulus of subgrade reaction was assumed to be 200 lb per cu in. and the average effect of dead load warping stresses was 150 psi. For reasons discussed previously, the PCA analysis in combination with the AASHO Road Test data should give the most practicable results when hours of vehicle travel are not restricted.
-36-

GENERAL DISCUSSION: FLEXIDLE PAVEMENT
Performance Related to Shear Stress and Structural Fatigue
Two of the most common causes of flexible pavement failure are: 1) plastic deformation of the foundation material, and 2) fatigue of the bituminous surface due to repeated, excessively large deflections. Further, as a bituminous surface ages it normally becomes less flexible and is less resistant tp cracking due to fatigue. Failure due to plastic deformation might occur suddenly as a shear failure, or more gradually as the foundation material moves under repeated loading.
TABLE 4 SUMMARY OF MAXIMUM ALLOWABLE AXLE LOADS
DETERMINED BY FOUR METHODS
Max. Single Axle Load Stress
Method (kips) for
Assumptions (psi) due
Continuous to 50-Kip Satisfactory Axle Load Perfonnance
No. of repetitions to Failure
under 50-Kip
Axle Load
PCA (Pickett's) Design 32 Slab corners warped 530 less than 100 Criteria up. Dead load
warping stresses ignored.
Michigan Observations 44 Load carried only 360 150,000 when slab corners warped down. Dead load warping stresses ignored.
PCA Criteria in 18 Slab corners waiped 655 1 Combination with AASHO up. Dead load Road Test Information warping stresses
considered.
Michigan Observations in 28 Loads carried only 485 150
Combination with AASHO when slab corners Road Test Information warped down. Dead
load warping stresses considered.
Because of the structural strength built into the pavement and because the pavement rests upon a very deep foundation of nat1,1ral granular material, failure due to plastic deformation of the foundation material is unlikely if the highway design and loads are similar to those fn this test.
-37-

Regarding the possibility of a failure of the pavement surface due to fatigue, there are two characteristics of load deflection to be considered, magnitude of the deflection and shape of the deflection curve. Table 2 shows that the greatest deflection caused by any of the equipment used during the test was less than 0. 014 in. According to Hveem (20), who conducted extensive field studies to investigate pavement fatigue-deflection relationships, a flexible pavement surface 4. 5 in. thick could probably endure 10-million load repetitions without failing, if the load deflection did not exceed 0. 017 in. This indicates that none of the wheel loads used during the field test would cause fatigue failure of the particular pavement surface tested.
A second important characteristic of load-deflection relationships is the shape of the deflection curve. In Fig. 15, low pressure tires of the earthmovers gave a deflection curve with a much larger radius than did the high pressure tires of the conventional truck. The load deflection curve of smaller radius, with its more sharply bending curvatures, will be accompanied by greater stress concentrations. This should cause a more rapid fatigue than the load deflection curves of large radius caused by the large low-pressure tires used on earthmovers. There is considerable work being done by various agencies to determine a more exact relationship between radius of load deflection curvature and pavement fatigue, but no results are available for application to this test.
Seasonal Variations
Measurements taken during the AASHO Road Test (App. D) indicate pronounced variation in deflections of a flexible pavement from one season to another. During summer and fall, deflections under a given load are relatively constant; during winter when the foundation is frozen, deflections become very small, and during spring thaw, deflections become very large. Thickness of the pavement surface course exerts considerable effect on the magnitude of deflections measured during the spring thaw. Thicker pavement surface courses reduce springtime deflection a great deal, apparently because a thicker surface acts more as a rigid plate than does a thinner one.
The AASHO Road Test equations relating deflection to axle load and design were used to determine theoretical deflections in spring (App. D). A flexible pavement similar to that load tested in Michigan during these experiments (4-1/2-in. surface, 8-in. base, 28-in. subbase) would have a theoretical deflection of 0. 049 in. in fall and 0. 079 in. in spring when subjected to a 60-kip wheel load. This would be about a 60-percent
-38-

increase in deflection during the spring thaw. There should be a greater increase in deflection for flexible pavements built to less than Interstate standards, which are common in Michigan (2-1/2-in. surface, 7-in. base, 12- or 18-in. subbase).
GENERAL DISCUSSION: BRIDGES
The AASHO Bridge Specifications (21) contain criteria for the rating of existing bridges. In 1961, the AASHO Bridge Committee appointed a subcommittee to study revision of this specification concerning overload provisions and rating of existing bridges, for the purpose of updating the policy for controlling permissible loads on bridges. The subcommittee's recommendation (22), as approved by the Bridge Committee, read in part as follows:
"The unit working stresses used in determining the load-carrying capacity of each member of a structure to be crossed by a vehicle operating under a special permit shall take into account the type of material from which the member is made and the physical condition of the member. For structural .elements for which plans are available and properties of the material are known, the tensile stress produced by any such special permit load (including impact, if any) and dead load shall not exceed:
"1. 75 percent of the yield point of structural steel members or of the bars in the reinforced concrete member. This percentage should be reduced for high strength steels.
"2. 75 percent of the modulus of rupture for prestressed concrete members.
"3. A 33-percent increase in the allowable design stress of treated timber. For untreated timber, no overstress is to be permitted.
"Compressive stresses shall be checked on a corresponding basis."·
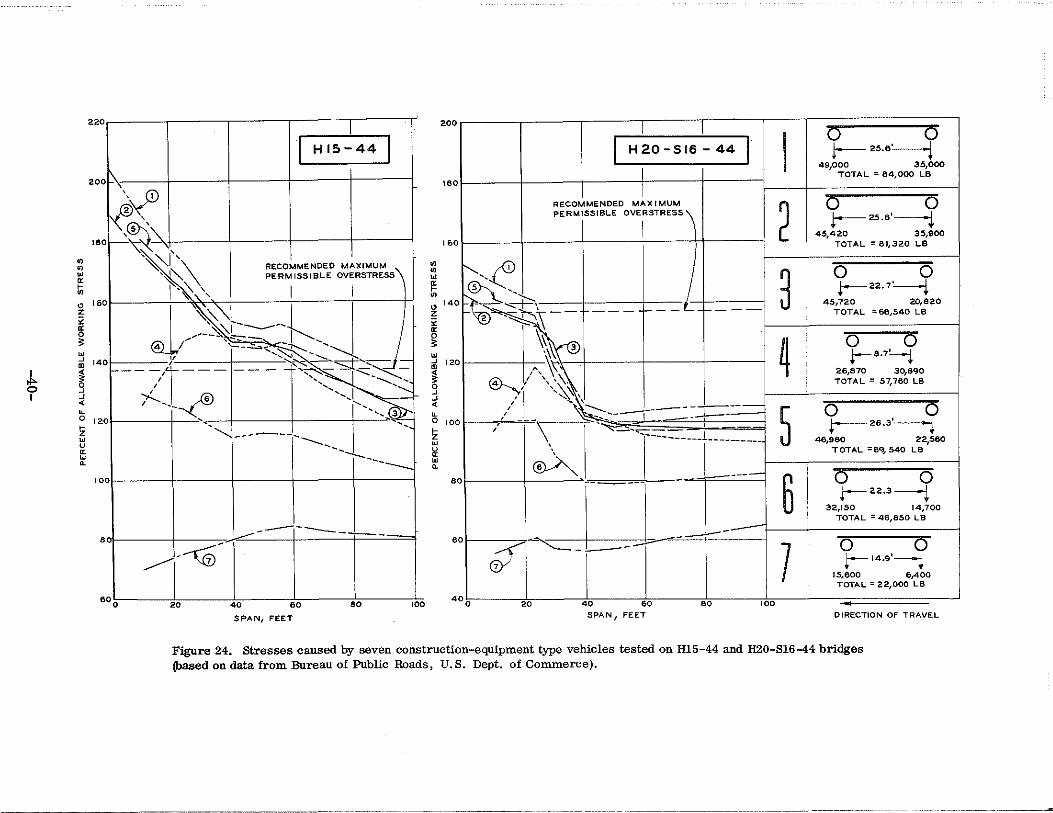
The Bridge Division of the Bureau of Public Roads has computed the theoretical stresses induced in B20-S16-44 and H15-44 bridges by each of the seven units of construction equipment used in the Michigan pavement load tests. The results are shown in Fig. 24. Table 5 lists the dead loadlive load moment ratio~;~ used in the analysis. The recommended maximum permissible overstress limit for steel bridges is 7 5 percent of the yield
-39-
0 0 w ~
~ ~ z ~ ~ 0 ~ w J ~
I II> ~ 0 J I J
< ~
0
z w u ~ w ~
0 22' I
I H 15-44 I
0~'! 0~~~
''\ '.,J~\ RECOMMENOEO MAXIMUM '~ PERMISSIBLE OVERSTRESS
I-~,> I I ' J '~"J- l ' ~-------
----~- I J= ... ,- ... -I '-- - ... , -::t'----. ........ '-..l
0 1/ .... ~ ............. I ,._~ ............. ~ 1----T--- ---- ~-~----~ ,' '.......... ... ....................
--!--- ~ ---J -, ' --- ---- ::®-
a • ' 3
-- ""-J -------------------~
20
18
16
14
12
>0
------0 ~ ---...-----~--\G)-
n I 0
_. 20 --40 >A 80
., 80 100
SPAN, FEET
20 )
I H20-SI6- 44 I 18 0
RECOMMENDED MlXIMUM
0 0 w I" "'
,.
~ 14 z ;: ~
~ w .J 121 ~
~ g J < ~
0 10
~ w .. w ~
PERMISSIBLE OVERSTRESS
I )
r:--.c: l ~-..,..___ 'H"-" ---+"· ~· -- t--- - - - - '- r-
'® -~\
~~ 0 A \\'
" :~ ®----.., ' ' ·\ ' ' ~ ,' '-- ....... ~,
/ I -~--- ---------' --~ __]___.== 0
1 --\ :-.._ --- I
I -...... "<:::::: ......... ______ l __________ '
-_L--= ~ 0 - ---
;o 0)~-~-~-~--
•oo 20 40 60 80 100 SPAN 1 FEET
0
I 0 }--- 25.8'---------i
49,000 35,000 TOTAL = 84,000 LB
~ 0 0 r-25.6'-----i
45,42.0 35,900 TOTAL = 81,320 LB
j 0 0 .r--22. 7 '-----1. 45,720 2.0,820
TOTAL = 66,540 LB
~ 0 0 r--··''--l.
26,870 30,890 TOTAL= 511160 LB
J 0 0 r-26.3'---i
46,980 22.,560 TOTAL =eq, 540 LB
0 0 0 !---- 22.3 ----i
32.,150 14,700 TOTAL = 46,850 LB
l 0 0 r-14.9'-i
15,600 6.,400 TOTAL = 2.21000 LB
DIRECTION OF TRAVEL
Figure 24. Stresses caused by seven construction-equipment type vehicles tested on Hl5-44 and H20-Sl6-44 bridges (based on data from Bureau of Public Roads, U.S. Dept. of Commerce).
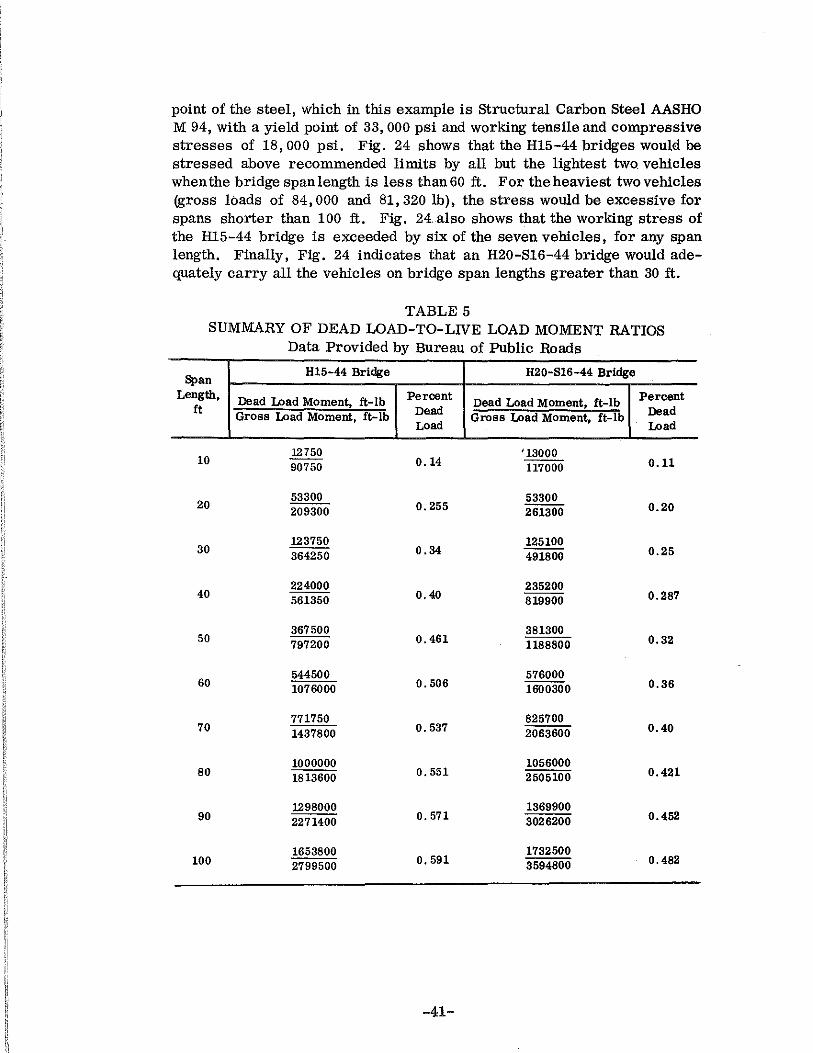
point of the steel, which in this example is Structural Carbon Steel AASHO M 94, with a yield point of 33, 000 psi and working tensile and compressive stresses of 18,000 psi. Fig. 24 shows that the H15-44 bridges would be stressed above recommended limits by all but the lightest two. vehicles when the bridge spanlength is less than60 ft. For the heaviest two vehicles (gross loads of 84,000 and 81, 320 lb), the stress would be excessive for spans shorter than 100 ft. Fig. 24. also shows that the working stress of the H15-44 bridge is exceeded by six of the seven vehicles, for any span length. Finally, Fig. 24 indicates that an H20-S16-44 bridge would adequately carry all the vehicles on bridge span lengths greater than 30 ft.
TABLE 5 SUMMARY OF DEAD LOAD-TO-LIVE LOAD MOMENT RATIOS
Data Provided by Bureau of Public Roads
Span H15-44 Bridge H20-S16 -44 Bridge
Length, Dead Load Moment, ft-lb Percent Dead Load Moment, ft-lb Percent
ft Gross Load Moment, ft-lb Dead Gross Load Moment, ft-lb Dead Load Load
12750 '13000 10 90750 0.14 117000 0.11
20 53300 53300 209300 0.255 261300 0.20
30 123750 125100 364250 0.34 491800 0.25
40 224000 561350 0.40
235200 819900 0.287
50 367500 797200 0.461
381300 1188800 0.32
60 544500 576000 1076000 0. 506 1600300 0.36
771750 825700 70 1437800 0.537 2063600 0.40
1000000 1056000 80 1813600 o. 551 2505100 0.421
1298000 1369900 90 2271400 0.571 3026200 0.452
1653800 o. 591
1732500 100 2799500 3594800 0.482
-41-

Currently, approximately 28 percent of the bridges on Michigan trunklines, or over trunklines at grade separations, are of H15 or lower design. Since extended permits now issued to contractors allow almost unrestrained movement of earthmovers over State trunklines, in most cases the very heavy equipment would not be restricted from the Hl5-44 bridges. From Fig. 24 it can be seen that the extended permits should be issued only for earthmovers with axle loads not exceeding 32 kips and with a wheelbase of at least 22 ft. Heavier vehicles may be permitted to travel over bridges that can carry them safely.
SUMMARY
Rigid Pavement
Because of the very complex nature of rigid pavement warping stresses, determination of correct maximum load stresses is somewhat difficult. However, information presented in this report has been used to suggest a maximum single axle load limit based on both load and warping stresses.
1. For equal axle loads, no significant difference could be discovered between pavement strains caused by low pressure tires used on earthmovers and by conventional dual truck tires.
2, For equal loads, the radii of the gross contact areas of tires used on large scrapers, and those of the conventional dual wheel groups do not differ significantly.
3. By restricting travel to hours when slab corners are warped down, greater loads can be carried safely by rigid pavement. During summer months this condition occurs approximately between 9:00 a.m. and 8:00 p.m.
4. Dead load warping stresses appear to have a significant effect on performance of rigid pavements and should be considered in design.
5. Earthmovers, because of their wider track width, will probably travel with their wheels closer to the pavement edge and therefore would induce higher stresses in pavements than would other vehicles.
6. Ignoring dead load warping stresses, it appears that a limited number of repetitions of single-axle loads up to 50 kips may be carried by 9-in. rigid pavements, providing that movements are restricted to daytime hours when the pavement is warped favorably and that seasonal load restrictions are observed.
-42-

Flexible Pavement
Flexible pavements derive their strength almost directly from the supporting soil, which varies with both area and season. These variances were considered in the following observations:
1. The low pressure tires of the large earthmovers appear to cause deflections of smaller magnitude than conventional tires with equal loadings.
2. Stress concentrations may occur when the load deflection curve of a pavement surface course is relatively small. Since the radius of a load deflection curve is inversely related to tire contact pressure, pavement surface fatigue will be more rapid under conventional tire loads than under earthmover tire loads for equal deflection.
3. Flexible pavements built to Interstate specifications apparently can carry rubber-tired earthmoving equipment with axle. loads of 50 kips without causing the asphalt surface to suffer rapid fatigue failure, if spring load restrictions are observed.
Bridges
1. H20-S16-44 bridges with spans 30ft or more in length can safely carry any of the vehicles used in these load tests (gross loads up to 84, 000 lb).
2. H15-44 bridges can carry the heavier vehicles used in these tests only if the bridge spans are 90 ft or longer. The two lighter velllcles (gross loads of 46,850 and 22,000 lb) can be carried by Hl5-44 bridges having any span lengths.
3. Extended permits should be restricted to earthmovers with single axle loads not exceeding 32 kips and a wheelbase of at least 22 ft.
CONCLUSIONS
1. From this study, it appears that existing wheel load limits based on tire width should be replaced by regulations based on axle load.
2. 1f vehicle movements are restricted to daytime hours and seasonal load restrictions are observed, 9-in. rigid pavements may carry limited repetitions of single axle loads up to 50 kips.
-43-

3. Flexible pavements built to Interstate standards appear to be capable of carrying earthmover axle loads up to 50 kips without causing excessive fatigue failure, when seasonal load restrictions are observed.
4. Because the Michigan trunkline system includes both H15 and H20 design bridges, extended permits (which allow almost unrestricted movement of earthmovers) may be authorized for vehicles with single-axle loads up to 32 kips and a wheelbase of at least 22 ft. For heavier vehicles, single trip special permits should be required.
REFERENCES
1. "The AASHO Road Test: Report 5--Pavement Research." Highway Research Board Special Report 61E (1962), p. 192.
2. "Road Test One-MD." HRB Special Report 4 (1952), p. 133.
3. Teller, L. W., and Sutherland, E. C. "The structural Design of Concrete Pavements--Part 5: An Experimental study of the Westergaard Analysis of Stress Conditions in Concrete Pavement Slabs of Uniform Thickness." Public Roads, Vol. 23, No. 8 (Apr-May-June, 1943), pp. 167-212.
4. HRB Special Report 4, p. 125.
5. HRB Special Report 61E, p. 141.
6. HRB Special Report 4, p. 79.
7. "Concrete Pavement Design." Chicago: Portland Cement Assn. (1951), p. 17.
8. HRB Special Report 4, p. 132.
9. Childs, L. D. "A study of Slab Action in Concrete Pavements Under Static Loads." HRB Proc., Vol. 27 (1947), pp. 64-84.
10. Rhodes, C. C., and Evans, J. R. "An Appraisal of the Membrane Method of Curing Concrete Pavements." Mich. state College Eng. Exp. Sta. Bull. 108 (Winter 1949).
-44-

11. Watstein, D. "Effect of Straining Rate on the Compressive Strength and Elastic Properties of Concrete." Jrnl of the ACI, Vol. 24, No. 8 (April1953}, pp. 729-44.
12. HRB Special Report 4, p. 13.
13. Friberg, B. F. "Pavement Research, Design, and Prestressed Concrete." HRB Proc., Vol. 34 (1955), pp. 65-84.
14. Pavement Performance Surveys Conducted by the Mich. State Highway Dept.
15. HRB Special Report 4, p. 138.
16. Jackson, F. H., and Allen, H. "Concrete Pavements on the German Autobahnen." Journal of the ACI, Vol. 19, No. 10 (June 1948), pp. 933-76.
17. "The AASHO Road Test: Report 6--Special Studies." HRB Special Report 61F (1962), pp. 57-8.
18. Bradbury, R. D. "Reinforced Concrete Pavements." Washington, D. C.: Wire Reinforcement Institute (1938).
19. HRB Special Report 61E, p. 192.
20. Hveem, F. N. "Pavement Deflections and Fatigue Failures. " HRB Bull. 114 (1955), pp. 43-73, 83-7.
21. "Standard Specifications for Highway Bridges. " Washington, D. C. : AASHO (1961), pp. 122-6.
22. Letter to AASHO Highway Transport Committee from AASHO Bridge Committee (Nov. 2, 1962).
-45-

APPENDICES
A. Tire Contact Area and Load Relationships Based on Industry Averages
B. Pickett's Equation for Stresses at Protected Corners of Pavements, Westergaard's Equation for Stresses at Free Edges of Pavements, and Westergaard's Analysis for Stresses Induced in a Pavement by Corner Loading
C. Westergaard's Equation for Corner Deflections
D. Computation of Fall and Spring Normal Deflection by AASHO Road Test Equations
-47-

--------------------------~
APPENDIX A
Procedure for Use of Appendix A Graphs
Tire gross contact area, contact length, and contact width may be determined by the following method, when wheel load and tire pressure are !mown:
1. Enter graph using !mown wheel load as ordinate and proceed to intersection A with curve for a given tire pressure.
2. Obtain gross contact area by proceeding vertically to abscissa scale. The vertical line drawn in this step intersects curves for contact length B and contact width C.
3. Proceed horizontally from B to ordinate and obtain value for contact length.
4. Proceed horizontally from C to ordinate and obtain value for contact width.
•
.t
0 z
•
0 ---"' --
~ 25
%
r-0- --c---3 -
.I .,.._ - 1-{4 }- -· <>"1_.e;l __
0 .. ~ ~ ~- 2
"" ';!' .... ~ P/ -,;r---~,0 u/<.'/j/ /
• "if';;/ 0 I '!/
II. / •
11/
q~) w 1
-f .0
r7r -7/j P"IB qo,' i ~0
/ v ~~ !riC -
/ I
0 I I
l I I
i I I I
0 0 100 200 30 0 400 600 1r 800 700 800
GROSS CONTACT AREA, SQUARE INCHES
-48-
800 I 000

35 ., "' :z: u '!;
.. 30 .. :z:'
!i i " Q 0 .. z 0 .. .J
.J :1: ... w " "' z :1: "' " 20 .J
•
·f ' ..,
I t 1.--
1/ ..-7 ~ ;~ ,.o .I F/ -JI
r."-~7 -!?- r-~~
"'7 .. ~ V-7 / ;f_.,Y~~J-IV ""Y _, ,/}if//
TIRE SIZE, 24.00 -2&
r/ / TIRE INDUSTRY AVERAGE I OCTOBER 1981
II v w
100 200 300 400 ~00 800 700 800
GROSS CONTACT AREA, SQUARE INCHES
Relationship of control area and load for 24. 00-25 size tires, based on Industry averages.
-49-
APPENDIX A
900 1000

APPENDIX A
o' < 3 .J
"' ... :r 3:
5 0
4 • 4 0
4 4
4 2
4 0
:!l 3
1i • z 3 • f3 j: 3 Q z
4
2
< 3 0
:r t; 2 • z ~ 2 •
4 ~ 2
8 2 2
2 0
•
.. ¥ ":r-<; I f.
c./~~ t-7-;.~(/ I
,f .,.,
I ~.,f .,
I v lv I /"_;
I 11/".,/Y V// /
/ rl / -11 / '£ ~ / v
TIRE SIZE1 27.00-33 1-cP~ .. p"'iv-7 TIRE INDUSTRY AVERAGE
• 4
2
0
"VII/ v OCTOBER 1981
J V/
0 100 200 300 400 500 600 700 800 GROSS CONTACT AREA, SQUARE INCHES
llelationship of control area and load for 27, 00-33 size tires, based on industry averages.
-50-
900 1000

70
" .. ~
0 <( 0 .J
.J ... ... ~
"
APPENDIX A
46
44
42
40
.J :f .,., <It
..... .j 38
36
I ....... .....
/ ~ ll ....... / ~ 34
/j / / ~ u ~ 32
~-1- 30 0
" 28
/, I / / // / / ~ ..
/' I v / 0 z <( 26 ~ ... 24
" z ... .J 2
t 20 ;! z 18 0 u
16
14
12
10
•
/ L -/ L- --r :7 I --v / / """ x -r· / / " /
2 ~ ..,."' [// / v / - ,,o , I / / /
v ~ ~' / // v
o/ -~.. I / v / TIRE SIZE, 30.00-33
-"r TIRE INDUSTRY AVERAGE 1-
I v/ / OCTOBER 1901
I / v/ lv //
/ '/h-0too 200 300 400 500 eoo 100 aoo eoo 1 ooo uoo 1200 t3oo GROSS CONTACT AREA, SQUARE INCHES
Relationship of control area and load for 30.00-33 size tires, based on industry averages.
-51-

APPENDIX A
40
35
40
.. .. ~ u '!:
.. r.' 30 .. b ;:
~ o' Q
" z g 30 " .J :1: .. 1-... " ~
z ~
.. 25 .J
t; " 1-z Q u
20
••
!--,
f? ~ I / ~ij' ,;;
q 0
'-) I 5I I I ~ v c,."t WIDlH //I
0 0~1P..;.,-
!." I t 1,5:~ ....... jl I f
vi I/. / I /I
v I f I I (/ TIRE SIZE, 33.5-33 1-
I/ I TIRE INDUSTRY AVERAGE OCTOBER 1981 -( I I
II "I
0 100 2.00 300 400 500 800 •700 800 900 1000 GROSS CONTACT AREA1 SQUARE INCHES
Relationship of control area and load for 33.5-33 size tires, based on industry averages.
-52-

" .. "' ~ £ I;
;;: i Q '0
"' z g < .J "' "' t; .. z "' ... ;= .J
... u
"' 1-z 0 u
40
30
20
10
., ~j/ I ·r cf'f
~~ 1 ~ "q .,.19' ~ ~~-I "~ ... 9<7 [lcci"
o~ .. c:y-;;;;q"'ll J .,-1 cf:'~· I 1/ "/.,.,., I
~.¢ I vI rP 7711
) '/ J I) I
1/l
0 / '7 TIRE SIZ£1 29.&- 35
TIRE INDUSTRY AVERAGE OCTOBER 19&1
II v If
0 ~ ~ - ~ ~ - ~ ~ ~ ~ GROSS CONTACT AREA 1 SQUARE INCHES
Relationship of control area and load for 29. 5-35 size tires, based on industry averages.
-53-
APPENDIX A

APPENDIXB
APPENDIXB
Pickett's Equation for Stresses at Protected Corners of Pavements (7)
where
s _ 3. 36 P <1 _ -::-=v.:..:a:::,l,:::..r..,..,...--,) c- d2 0.925+0.22a/r
Sc = corner stress P = wheel load in pounds d = pavement thickness in inches = 9 in. a= radius of contact area in inches. In this case, the actual mea
sured gross tire contact area was used for determining the radius to be used with its respective wheel load.
r = radius of relative stiffness in inches = .{/; E d2
2 k 12 (1 - J.! )
E =modulus of elasticity of the concrete = 4. 7 x 10⁶ psi J.! =Poisson's ratio for concrete = 0.15 k = modulus of subgrade reaction in lb per cu in; assumed to be
200 lb per cu in. in tbis case.
Therefore
r = 34.8 in., and is assumed to be constant for this study.
Westergaard's Equation for Stresses at Free Edges of Pavements (3)
0.572 p r;; :;"] se = d2 ~ log10 (r/b) + 0. 35!]
where d, P, and r are the same as in Pickett's Equation, and
Se = edge stress in direction parallel to longitudinal edge
b=V1.6a2+d2 -0.675wherea<l.724d. otherwise, a=b.
Westergaard's Analysis for Stresses Induced in a Pavement by Corner Loading (3)
O'c =3d~~- (a f2t6l where l J
P =point load, in pounds d = thickness of concrete slab in inches a = radius of area of load contact (contact area assumed to be
.circular
-54-

APPENDIX C and D
APPENDIXC
Westergaard's Equation for Corner Deflections (3)
D.= ..E_ (1.1 e-x/r- a1 0. 88 e-2 x/r) k r2 r
where
D. = corner deflection in inches P =wheel load; held constant at 20,000 lb k = subgrade modulus, held constant at 200 psi in this instance r = radius of relative stiffness x = distance of corner to point of deflection as measured along the
bisector of the right angle of the corner. This distance is equal to zero in this instance.
a1 =distance of pavement corner to center of tire contact area = 2 x radius of tire contact area
Pavement thickness = 9 in. Modulus of elasticity = 5 x 10⁶ psi Poisson's ratio = 0.15
APPENDIX D
Computation of Fall and Spring Normal Deflection by AASHO Road Test Equations
For Fall Deflections:
log d = 0.74 + 1.13log L1- 3.61log (.049 D1 + .014 D2 + 0.23 D3 + 1) d = 49 x 1o-3
For Spring Deflections:
log d = 1. 07 + 1. 46 log L1 - 4. 42 log (. 125 D1 + . 020 D2 + . 028 D3 + 1) d = 79 X lQ-3
where
L1 = axle load in kips = 60 D1 = thickness of surfacing = 4. 5 in. D2 = thickness of base = 8 in. D3 = thickness of subbase = 28 in.
d = deflection in 0. 001 inches due to load L1
-55-