effects of attitudes, subjective norms, self-efficacy, and ...effects of attitudes, subjective...
TRANSCRIPT
Effects of Attitudes, Subjective Norms,
Self-Efficacy, and Bike Rodeo
Participation on Intention to Bike Safely
by
Kayla G. Payton
A Thesis Presented in Partial Fulfillment of the Requirements for the Degree
Master of Science
Approved April 2011 by the Graduate Supervisory Committee:
Ariel Rodríguez, Chair
Timothy Tyrrell Kenichi Maruyama
ARIZONA STATE UNIVERSITY
May 2011

i
ABSTRACT
Thousands of children are being injured every day in bicycling
accidents. Interventions, like Safe Routes to School, are currently in place
to combat injury rates by providing programs to teach children safe biking
behaviors. In order to develop effective behavioral change programs,
behavior and the components of which it is composed must be understood.
Attitudes, subjective norms, and self-efficacy are important predictors of
intention to perform a behavior. The purpose of this study was to
ascertain the extent to which attitude, subjective norms, self-efficacy, and
bike rodeo participation explain third through eighth graders‟ intentions
to bike safely. These constructs were tested using a survey research design
in a purposive sample of fifty-seven third through eighth grade students in
Safe Routes to School schools in the Southwest. Students took an online
survey in the computer lab at their respective schools supervised by a
teacher. The study found attitudes to be comprised of three factors:
happy/safe, not afraid, and calm. Overall, the model explained
approximately 71% of the variance in children‟s intentions to bike safely,
R2=.749, Adjusted R2=.713, F(7, 49)=20.854, p<.01. The significant
predictors were happy/safe attitudes, subjective norms, self-efficacy, and a
quadratic self-efficacy term explaining 10% (p=.019), 28% (p<.01), 18%
(p<.01), and 15% (p<.01) respectively. The results of the study can be used
to create future and improve current bike safety interventions for children.

ii
DEDICATION
I would like to dedicate this paper to a friend of mine who I will see again
someday after this life is over, Matt King (March 19, 1987 – April 19,
2010). Matt was a swing dancing friend of mine who was a mathematical
genius, a dedicated Christian, and an avid cyclist. After being hit by a
truck while cycling to the food pantry where he regularly volunteered,
Matt‟s death raised bicycle awareness in Charlottesville, Virginia. Matt, I
want this paper to be a drop in the bucket of your far-reaching legacy. I
only hope that this small research project can lead to interventions that
can save others from what you had to experience. Love and miss you,
friend. Save a dance for me in heaven.
iii
ACKNOWLEDGMENTS
I would like to thank Jesus Christ, first and foremost, without whom
nothing would happen. He is the reason I live, move, breathe, create,
defend, and grow. His death and resurrection have given me the ability to
live in freedom, apart from eternal judgment and in union with him, and
for that I will be eternally grateful.
I would like to thank my parents, Terry and Pam Payton, for their undying
support of my success, even though I did move far away. You are always
my biggest cheerleaders in my hardest times. You believe in me when I
don‟t believe in myself.
I would also like to extend gratitude to my committee, Dr. Ariel Rodríguez,
Dr. Tim Tyrrell, and Dr. Kenichi Maruyama. They have guided and
supported me throughout this whole process, and I would not have made
it without their encouragement and expertise.
I would like to thank Roosevelt Community Church and its members for
being my local family during this graduate school process. You have
reminded me that there is constantly more to life than school, and I
appreciate friendship, spiritual encouragement, support and fun you‟ve
added to my life.

iv
I would also like to extend thankfulness to my friend, colleague, and
cohort member, Andy Holloway. Thank you for being the curious one and
always motivating me to try harder and keep pushing. You have been “my
buddy” in this process, and I look forward to cheering you on through your
Ph.D.
I would like to extend my deepest gratitude to Peggy Rubach and the rest
of the Valley Metro team. You made this degree program and thesis an
option for me. Without your support, I would not have attended Arizona
State University.
To Jeniece Perez, you are the backbone of the School of Community
Resources and Development. Thank you for keeping this boat sailing.
Lastly, thank you to all others who made this degree and study possible.
This whole process has been a “team effort,” so thank you for being a part
of my team.
v
TABLE OF CONTENTS
Page
LIST OF TABLES............................................................................................ viii
LIST OF FIGURES ........................................................................................... ix
CHAPTER
1 INTRODUCTION ........................................................................... 1
What is biking? ........................................................................... 1
Biking Injury Statistics ............................................................... 1
Agencies Involved with Biking Safety ....................................... 2
Safe Routes to School ................................................................. 2
Bike Rodeos ................................................................................ 3
Current Bicycle Safety Research ................................................ 3
Theory of Planned Behavior to Help Predict Intention ........... 4
Importance of Intention ............................................................ 5
Problem of the Study .................................................................. 5
Purpose of the Study .................................................................. 5
Delimitations .............................................................................. 5
Limitations ................................................................................. 6
Hypotheses ................................................................................. 6
2 LITERATURE REVIEW ................................................................ 8
Attitudes ..................................................................................... 8
Subjective Norms ....................................................................... 9
Self-Efficacy .............................................................................. 10
vi
Page
Intentions .................................................................................. 11
Behavior .................................................................................... 12
Bicycle Safety ............................................................................ 12
Safety Interventions ................................................................. 16
3 METHODOLOGY ........................................................................ 19
Population Analyzed ................................................................ 19
Pilot Study ................................................................................ 19
Instrument ................................................................................ 19
Procedures ................................................................................ 21
4 DATA ANALYSIS AND RESULTS ............................................. 23
Analysis of Data ........................................................................ 23
Results....................................................................................... 26
5 DISCUSSION AND CONCLUSIONS .......................................... 36
Summary of Findings ............................................................... 36
Discussion ................................................................................. 37
Recommendations ................................................................... 42
REFERENCES ................................................................................................ 46
APPENDIX
A SURVEY INSTRUMENT ......................................................... 53
B IRB APPROVAL FORM ........................................................... 58
C IRB APPROVED MODIFIED CONSENT FORM .................... 63
vii
Page
D SELF-EFFICACY INVESTIGATION ........................................ 68
E EXCLUDED REGRESSORS ..................................................... 72
F ANALYSIS WITHOUT PILOT STUDY ..................................... 76
viii
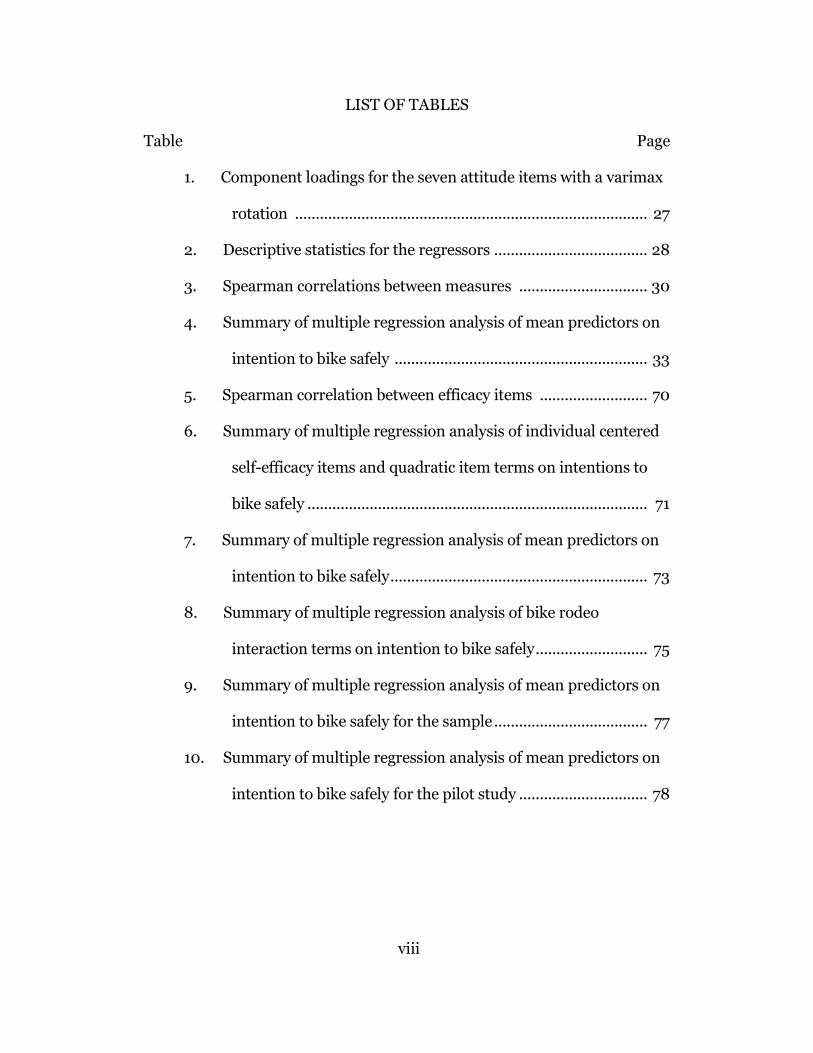
LIST OF TABLES
Table Page
1. Component loadings for the seven attitude items with a varimax
rotation ..................................................................................... 27
2. Descriptive statistics for the regressors ..................................... 28
3. Spearman correlations between measures ............................... 30
4. Summary of multiple regression analysis of mean predictors on
intention to bike safely ............................................................. 33
5. Spearman correlation between efficacy items .......................... 70
6. Summary of multiple regression analysis of individual centered
self-efficacy items and quadratic item terms on intentions to
bike safely .................................................................................. 71
7. Summary of multiple regression analysis of mean predictors on
intention to bike safely .............................................................. 73
8. Summary of multiple regression analysis of bike rodeo
interaction terms on intention to bike safely ........................... 75
9. Summary of multiple regression analysis of mean predictors on
intention to bike safely for the sample ..................................... 77
10. Summary of multiple regression analysis of mean predictors on
intention to bike safely for the pilot study ............................... 78

ix
LIST OF FIGURES
Figure Page
1. Figure 1. Hypothesized relationships of attitude, subjective
norms, self-efficacy, bike rodeo participation, and demographic
variables .................................................................................... 25
2. Relationship between self-efficacy and intention ...................... 32
3. Relationships between the regressors and the dependent
variable ...................................................................................... 35
4. Predicted slop of the self-efficacy-intention relationship ......... 40
1
Chapter 1
INTRODUCTION
What is Biking?
Bicycles have many uses in today‟s society. Moreover, there are
many different forms of biking as exercise and recreation, including street
cycling, mountain biking, and cruising. Biking is also a growing form of
regular transportation; nationally, biking trips have increased from 1.7
billion to 4 billion since 1990 (The University of North Carolina Highway
Safety Research Center [UNCHSRC], 2010). There is a trend of bike
sharing as an extension of public transportation which has prospered in
many major metropolitan cities both nationally and internationally (L.
Jones [B-cycle] & G. Crivello [Bixi], personal communication, January 18,
2011). This study examines biking as a means of transportation for 3rd
through 8th grade students to and from school and the safety with which
they are riding.
Biking Injury Statistics
In the year 2005 alone, 103 children were killed in bicycle-related
incidents. In 2000, 370,317 child bicyclists were injured, which means on
average, approximately 1,000 children are injured per day while bicycling.
These statistics are based on emergency department visits, which may
indicate the severity of the injuries (National Center for Injury Prevention
[NCIP], 2000;2005). In fact, there are more childhood emergency room
incidents related to biking than to any other sport (Brain Injury
2
Association of America. Bicycle Safety. [Fact Sheet] McLean (VA): BIA,
April 2001), and, other than motor vehicles, bicycles are related to more
injuries in children than any other consumer product (Wilson, Baker,
Teret, Shock, & Garbarino, 1991).
Agencies Involved with Biking Safety
These injury statistics show that biking safety is a national concern
and the necessity of supportive safety organizations. Many agencies
advocate awareness and provide resources for solutions. Some of these
agencies and programs include Safe Kids USA, KidsHealth from Nemours,
United States Department of Transportation, National Highway Traffic
Safety Administration, Bicycle Helmet Safety Institute, and Safe Routes to
School. The National Highway Traffic Safety Administration is taking
strides to change these statistics by setting forth traffic safety initiatives
and offering funding to complying departments of transportation
(National Highway Traffic Safety Administration, 2006).
Safe Routes to School
Safe Routes to School (SRTS) is a leader among organizations
providing programs to support and grow bicycle (and pedestrian) safety.
The international organization originated in 1970 in Odense, Denmark.
The national program was adopted in the United States in 2005 by Section
1404 of the federal transportation bill Safe, Accountable, Flexible,
Efficient, Transportation Equity Act: A Legacy for Users Act. The goal of
SRTS is to simultaneously make routes to school safer while encouraging

3
more children to walk and bike to school (in the safe routes). SRTS uses
the concept of 5Es (education, engineering, enforcement, education, and
evaluation) as guiding strategies to meet these goals. By April of 2007,
every state and the District of Columbia hired interim or full-time SRTS
coordinators for the state (UNCHSRC, 2010). SRTS continues to grow, and
since 2005, the national apportionment has risen from $51,000,000 to
$180,000,000 (National Center for Safe Routes to School, 2009).
Bike Rodeos
Bike rodeos are often integrated into SRTS programs, although they
have not become mandatory. Bike rodeos are a five-station obstacle course
geared at teaching participants real world bicycling skills by simulating
traffic conditions cyclists are likely to encounter. These stations include
Bike Basics, Driveway Dangers, Intersection Inspection, See and Be Seen,
and Road Risks (Valley Metro, 2010). Smithville, Texas; Omro,
Wisconsin; Vacaville, California; Tampa, FL; Boulder, CO; Cleveland, OH;
Bellingham, Washington; and Burgin, Kentucky are just a few examples of
cities offering Bike Rodeos in conjunction with their SRTS programs
(National Center for Safe Routes to School, 2010).
Current Bicycle Safety Research
As far as bicycle safety research goes, a vast majority of the
literature focuses solely on helmet use. The literature review section
rightly reflects the literature in the field, which gives the impression that
helmets are the only item of value regarding bicycle safety. Conceptually,
4
this argument makes as much sense as only focusing on seat belts when
researching automobile safety, when it is known that seat belts are not the
only measure that prevents a driver or passenger from getting injured;
avoiding the collision or accident is the best way to evade injury. This new
holistic view of bike safety in no way means that one should not wear a
seat belt (or a helmet); it just means that there is a bigger picture. In the
same thread, research on bicycle safety should begin to encompass safe
riding practices and other preventative measures.
Theory of Planned Behavior to Help Predict Intention
Bicycling safety, and preventing death in bicycling incidents, is a
large public concern (Finnoff, Laskowski, Shock, & Garbarino, 1991). The
injury statistics must be changed, and changing behavior is largely done
through interventions. The theory of planned behavior provides an
excellent basis to begin a behavioral prediction study (Ajzen, 1991). As a
behavioral prediction model, the end of the model is the behavior itself.
Intention is the direct antecedent to behavior being a function of attitude
toward the behavior, subjective norms, and perceived behavioral control.
Each of these three constructs is a function of underlying behavioral
beliefs, normative beliefs, and control beliefs respectively. So according to
the model, in order for a behavior to take place, there needs to be positive
intention to perform that behavior, which is fueled by a positive attitude
toward the behavior, positive social norms concerning that behavior, and a
positive self-efficacy about that behavior (Ajzen, 1991). This study is not

5
an application of the theory of planned behavior; rather this theory
provided the theoretical springboard on which the study model is based.
Importance of Intention
In regards to health and leisure behaviors, intention can be the end
product of a particular study (Evans & Norman, 2003). Evans and
Norman (2003) predicted road-crossing intentions of adolescents, and
Quine, Rutter, and Arnold (2001) studied helmet use intentions of school-
age cyclists. Although there has been a more recent model with more
constructs intersecting the path from intentions to behavior (Fishbein,
2000; 2008), intention is still the best single predictor of behavior (Buhi &
Goodson, 2007; Fishbein, 2000; 2008; Fishbein & Cappella, 2006).
Problem of the Study The problem of this study was to analyze the extent to which
attitudes, subjective norms, self-efficacy, and bike safety intervention
predicted children‟s intentions to bike safely.
Purpose of the Study
The purpose of this study was to add a holistic perspective to bicycle
safety using a behavioral prediction model. Most of studies concerning
bicycle safety primarily revolve around helmet use and related issues.
There is a lack of studies that address bike safety as a complete concept in
predicting behaviors, where complete concept is defined as encompassing
more facets of safe biking than helmet use alone.
Delimitations
6
The scope of the study was delimited to:
1. Children attending school in third through eighth grade
2. Schools with access to a bike rodeo in the last two years
3. Schools in Maricopa County, Arizona
Limitations
The generalizability of the study results were limited by the sample
size. The small sample size was due to two main reasons. First, many
parents did not give their child consent. Second, teachers were not able to
grant all consented students access to take the survey. However, the
sample and population demographics were compared, and no significant
differences were found. The ethnic and gender distribution of the sample
mirrors the ethnic and gender distribution of the state of Arizona (U.S.
Census Bureau, 2009). Additionally, the analyses used were limited by
multiple regression which did not allow for more extensive analysis
between the independent variables, which could be analyzed using other
techniques such as structural equation modeling.
Hypotheses
The following null hypotheses were tested:
H1: Attitudes have no effect on intention, H0: βattitudes≠0, α=.05
H2: Subjective norms have no effect on intention, H0: βnorms≠0,
α=.05
H3: Self-efficacy has no effect on intention, H0: βself-efficacy≠0, α=.05
7
H4: Bike rodeo participation has no effect on intention, H0:
βrodeo≠0, α=.05
H5: The full model is not useful in explaining variance in intention,
H0: R2≠0, α=.05
8
Chapter 2
LITERATURE REVIEW
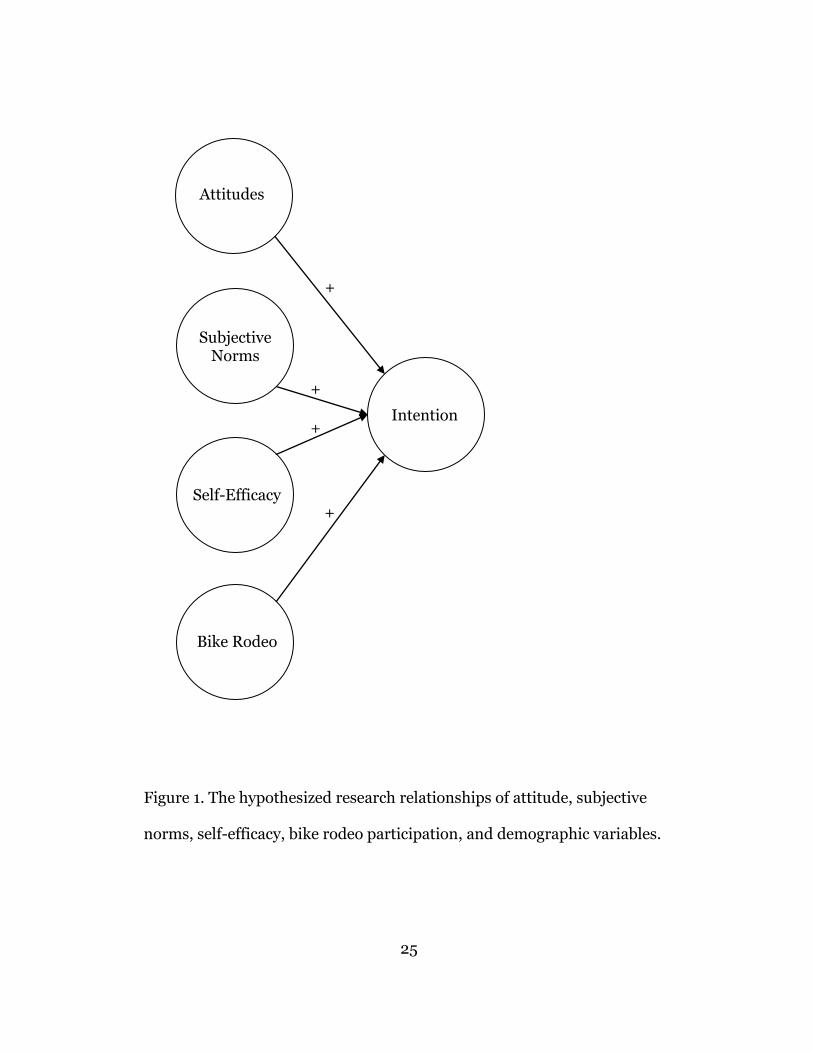
This literature review covers research on attitudes, subjective
norms, self-efficacy, and intention, and their relation to health and leisure
behaviors as well as a review of bicycle safety research. The hypothesized
relationships are depicted in Figure 1 (p.25 ). Previous literature supports
the listed hypotheses.
Attitudes
An attitude is an individual‟s positive or negative assessment of
performing the behavior (Rivis & Sheeran, 2003). Attitudes affect the
behavior by directly affecting the intention to perform the behavior
(Armitage & Conner, 2001). Attitudes are normally measured through a
semantic differential scale, which Ajzen, the father of the theory of
planned behavior, supports (Ajzen, 1991). However, others found that
semantic differential scales were weaker than expectancy-value scale
(Bagozzi, 1981). Semantic differential scale items are constructed by using
two opposing ideas and asking the respondent to choose which idea most
closely matches his or her evaluation of the behavior (Bagozzi, 1981).
Regardless of the means of measurement, attitudes have been an
important predictor of intention and behavior in many studies (Sheppard
et al., 1988). Negative attitudes towards helmet use in teenagers were
explored in order to be able to target those precursor beliefs causing the
9
negative attitude, with the end desire to eventually convince teenagers to
wear helmets. The negative beliefs most closely associated with the
negative attitude related to appearance and comfort (Finch, 1996).
Another study investigated gender differences in attitudes towards eating
sweet snacks, predicting that women would have more of a negative
attitude than men. Although the hypothesis was not supported, attitudes
were still seen to have been a good predictor of intentions (Grogan, Bell, &
Conner, 1997). Attitudes also had strong predictive power towards
intention to donate blood (Bagozzi, 1981). As the literature shows,
attitudes, and their direct affect on intention, have been documented and
supported in many studies, including those concerning health and leisure
behaviors.
Subjective Norms
Subjective norms refer to the perceived social pressure the
individual experiences surrounding the behavior in question; another term
for this idea is injunctive social norms (Rivis & Sheeran, 2003). This
social pressure comes from the persons closest to the individual that have
influential capabilities (Ajzen, 1991); these individuals may be family
members, friends, co-workers, or children (Buhi & Goodson, 2007). An
item to measure these subjective norms would ask if a certain important
person would say that one should or should not perform the behavior.
This can then be multiplied by one‟s “motivation to comply” (p. 218) with
the views of the important people (Rivis & Sheeran, 2003). Subjective
10
norms influence behavior by their impact upon intentions. The perception
of positive support of the behavior lends a positive intention to perform
the behavior (Armitage & Conner, 2001). The subjective norm construct
tends to be the weakest construct in predicting intentions (Armitage &
Conner, 2001; Rivis & Sheeran, 2003). This weakness may be due to
improper measurement, since many of the studies used a single-item
indicator to measure subjective norms (Armitage & Conner, 2001).
Subjective norms have been used in many studies and have shown
to be a useful predictor of health behaviors. In Buhi and Goodson‟s (2007)
study, perceiving that friends are having more sex was a predictor for
adolescents to have more sex themselves. This study models the above
description that perception of a favorable opinion of the behavior leads to
a positive intention to perform the behavior. For an example of the
adverse case, misperceptions of norms have been shown to have a great
negative effect on elementary school children wearing a helmet (Howland
et al., 1989), meaning that a perceived negative view of a behavior offered
a negative intention to perform that behavior. Together, attitudes and
subjective norms account for 33 to 50 percent of the variance in intentions
(Ajzen, 1991; Armitage & Conner, 2001; Sheeran & Taylor, 1997; Rivis &
Sheeran, 2003).
Self-Efficacy
Self-efficacy is the confidence in oneself and one‟s capability to
perform a behavior (Bandura, 1977; Baranowski, Perry, & Parcel, 2002)
11
and has been identified as one of the most important predictor of
behavioral change (Bandura, 1977). Efficacy expectations are created
through four sources: personal accomplishments, vicarious experience,
persuasion, and physiological states (Bandura, 1977). Self-efficacy
accounts for an additional 7% of intention prediction, above and beyond
the contribution of attitude and subjective norms (Armitage & Conner,
2001) and has a positive relationship with behavioral change (Bandura,
1977). One of its major strengths is that self-efficacy is behavior specific; it
is not a broad over-arching life capability (Bandura, 2006).
Self-efficacy and perceived behavioral control, the original
construct in the theory of planned behavior (Ajzen,1991) are closely related
constructs, but self-efficacy has greater empirical support for predicting
intentions and behavior (de Vries, Dijkstra, & Kuhlman, 1988;
Dzewaltowski, Noble, & Shaw, 1990; Manstead & van Eekelen, 1998; Terry
& O‟Leary, 1995; White, Terry, & Hogg, 1994) and is also used in more
recent and more comprehensive models of behavioral prediction
(Fishbein, 2000; 2008). As far as its efficacy in health and leisure studies
goes, in a study concerning safe sexual behaviors, it negotiated safer sex in
eleven instances (Buhi & Goodson, 2007) and predicted intentions to
discuss condom use with a partner (Terry & Hogg, 1994). In a study
predicting exercise behavior, self-efficacy predicted intentions very well
(Terry & O‟Leary, 1995).
Intentions
12
Based on the model, intentions are the proposed result of the three
previously explained constructs; the stronger the positive intention, the
higher the likelihood of performing the behavior (Ajzen, 1991). This
construct should illustrate the motivation behind performing the behavior.
Intentions are important to study because they are the best single
determinant of behavior (Buhi & Goodson, 2007; Fishbein, 2000; 2008;
Fishbein & Cappella, 2006). Intentions can be accurately predicted from
attitudes towards the specific behavior, subjective norms surrounding the
specific behavior, and perceived behavioral control concerning the specific
behavior (Sheppard et al., 1988).
Behavior
Behavior is defined by target, context, action, and time, and that
same specificity must be maintained throughout all other constructs in
regard to the behavior (Ajzen, 1991; Fishbein, 2008; Sheppard et al.,
1988). Also, a behavior is a behavior and not a goal; while that seems like a
simplistic statement, goals have far-reaching constraints that cannot be
seen or perceived by the individual. Lastly, in order to question an
individual about a behavior, his or her intention to perform the behavior,
or his or her attitude, subjective norms, and self-efficacy toward the
behavior, the individual must know and understand the behavior (Ajzen,
1991).
Bicycle Safety
Injury and accidents.
13
Children make up approximately 70 percent of reported bicycle-
related injuries, both fatal and nonfatal (Kraus, Fife, & Conroy, 1987).
Head and brain injuries are likely consequences to serious bicycle
accidents (Kraus, et al., 1987) as are face, neck, and abdomen injuries
(Grimard, Nolan, & Carlin, 1995). Approximately 90 percent of bicycle
related deaths and 3 to 85 percent of nonfatal bicycle injuries involved
collision with an automobile (Kraus, et al., 1987). The highest incidence of
bicycling brain injury occurs at ages 5-9 for females and 10-14 for males
where the annual incidence is 13.5 injuries per 100,000 people (Kraus, et
al., 1987). Nineteen to twenty-five percent of all bicycle-related brain
injuries occur with children less than 14 years old (Kraus, et al., 1987;
Gallagher, Finison, Guyer, & Goodenough, 1984; Ivan, Choo, &
Ventureyra, 1983; Klauber, Barrett-Connor, Marshall, & Bowers, 1981).
The morbidity and mortality rates annually cost the United States over $1
billion (Sacks, Holmgreen, Smith, & Sosin, 1991). Other nonfatal wounds
can include a multitude of fractures: skull, humerus, forearm and elbow,
scaphoid, lower limb, clavicle, and other minor ones (Illingworth, Noble,
Bell, et al., 1981). In one study of 150 bicycle injuries in children, 17.3% of
the accidents were caused by a collision with an obstruction: stone,
pothole, speed bump, or grate; 16% were due high speeds or loss of
control; and 14.7% were due to skidding on gravel or around a curve. The
other children in the study either pulled a „wheelie,‟ rode two to a bicycle,
collided with another bicycle, collided with a parked car, tumble over the

14
handlebars when braking quickly, and fell due to various reasons. These
reasons include swerving, when the foot slipped off the bicycle pedal, when
brakes failed, during a gear malfunction, when the wheel came off, due to
an ill-fitting bicycle, because of dogs, after the removal of brake blocks,
and after collision with an automobile (Illingworth, et al., 1981). The
reasons for these accidents are common with other studies (Illingworth et
al., 1981; Waller, 1995)
Helmet efficacy.
In order to combat head and brain injuries, helmet use is
encouraged because wearing a helmet reduces the seriousness of head
injuries in accidents (Dorsch, Woodword, & Somers, 1987; Grimard, et al.,
1995; Thompson, Rivara, & Thompson, 1989). The hard-shell helmet with
the polystyrene liner is the most protective type of helmet, beyond racing-
style or hard-shell with soft inner lining (Dorsch, Woodward, & Somers,
1987). This good type of helmet produced smaller amounts of
concussions, skull fractures, scalp bruising, and facial lacerations, but
larger amounts of soft tissue injury to the scalp or face (Dorsch,
Woodward, & Somers, 1987). Children who wear helmets tend to have as
many facial injuries as those who do not, but children who wear helmets
tend to have milder injuries overall (Grimard, et al., 1995). Helmets have
been conservatively shown to overall reduce the risk of brain injury by 58
to 88 percent, head injury by 60 to 85 percent (Thompson, et al., 1989;
Attewell, Glase, & McFadden, 2001), facial injury by 33%, fatal injury by

15
73%, and a statistically insignificant increase risk in neck injury (Attewell,
Glase, & McFadden, 2001). The American Academy of Pediatrics supports
the use of helmets that are approved by the American National Standards
Institute (ANSI) or the Consumer Product Safety Commission (CPSC;
Committee on Accident and Poison Prevention, 1990).
Helmet use.
Despite the risk of injury and the known protectiveness of helmets,
helmet use tends to be low. In 1991, 26% of children owned helmets, with
86% of those being the support hard-shell with the polystyrene inner
padding, but only 15% of the children wore them all or most of the time
(Rodgers, 1996). Children are more likely to wear helmets if they are under
12, have experienced a bicycle accident that required medical attention, or
if their parents attended college (Rodgers, 1996). Another study, in 1986
in Tucson, Arizona, found that less than 2% of school-aged child bicyclists
wore helmets while riding to and from school (Weiss, 1986) and was up to
17.1% in 1992 (Weiss, 1992). The range of 2-17% is still a very low
percentage when considering the amount of time they spend on their bike.
Approximately 27.7 million children ride bicycles (Sacks, et al., 1996)
approximately 300 hours annually (Rodgers, 2000). That is a large
number of children riding for a long amount of time without wearing a
helmet.
Attitudes and barriers to helmet use.
Since the facts of helmet protectiveness and risk of injury are there,

16
why are children not wearing helmets? This question is generally
answered by means of attitude and social or peer pressure (Howland,
Sargent, Weitzman, et al., 1989; Coté, Sacks, Kresnow, et al., 1992;). A
qualitative study posits that attitudes were a major barrier to helmet use
by elementary school children (Howland et al., 1989). Attitude in this
study would be explained by words such as stupid, not cool, embarrassing,
and not tough. Perceived social pressure was found after asking children
about what their friends would think if they wore a helmet. Answers
ranged from being called stupid and ugly, being laughed at, being called
names, being called a sissy, and not being seen as tough (Howland et al.
1989). Thirty-one percent of teenagers find helmets uncomfortable, while
22% think helmets are unfashionable (Finch, 1996). Another main reason
helmets are not worn is simply because people do not own them (Finnoff,
et al., 2001; Berg & Westerling, 2001; Howland et al., 1989; Pendergast,
Ashworth, DuRant, & Litaker, 1992; Graitcer, Kellermann, & Christoffel,
1995).
Safety Interventions
The only way to combat the barriers listed above is to intervene in
some way; legislation and education are the mediums previously under
investigation.
Legislation.
The enactment of a bicycle helmet law does increase helmet use
significantly but only as much as it is enforced (Gilchrist, Schieber,
17
Leadbetter, & Davidson, 2000; Coté et al., 1992; Dannenberg, Gielen,
Beilenson, Wilson, & Joffe, 1993; Macknin & Medendorp, 1994). The
community support for the law, the probability of detection of violation,
and the quickness and weight of punishment are much better predictors of
increased helmet use than the presence of the law itself (Coté et al., 1992).
Also, when the enactment of a law is preceded by a great deal of education
regarding the law, helmet use tends to increase significantly more and the
effect tends to prolonged (Coté et al., 1992; Dannenberg et al., 1993). Still,
a large percentage of people who still disregard the law remain (Gilchrist
et al., 2000)
Education.
Education is meant to bridge the gap between the law or the idea
and the individual, and in fact, when combined with legislation, makes a
much larger impact than legislation alone (Graitcer, et al., 1995).
Education programs in existence have a tendency to focus on helmet use
and the importance of wearing a helmet (Coté et al., 1992; Graitcer, et al.,
1995, Dowswell, Towner, Simpson, & Jarvis, 1996; Dannenberg et al.,
1993; Gilchrist, et al., 2000; Nixon, Clacher, Pearn, & Corcoran, 1987) and
may be performed by police officers (Gilchrist et al., 2000), teachers
(Carlin, Taylor, & Nolan, 1998; Pendergrast et al., 1992; Quine, Rutter, &
Arnold, 2001; Towner & Marvel, 1992; Nagel, et al., 2003), medical
personnel (Cushman, Down, MacMillan, & Waclawik, 1991; Cushman,
James, & Waclawik, 1991), or concerned community members (Schneider,
18
et al., 1993, Rivara et al., 1994). Large community-wide educational
programs, supported by education, media, and concerned community
members have the best and most lasting impact (Schneider, Ituarte, &
Stokols, 1993, Rivara et al., 1994).
19
Chapter 3
METHODOLOGY
The purpose of this study was to determine the extent to which
attitudes, subjective norms, self-efficacy, and bike rodeo participation
predicted children‟s intentions to bike safely.
Population Analyzed
The population analyzed in this study was third through eighth
grade students in Safe Routes to School pilot schools of Maricopa County.
The participants were sampled from the schools receiving funding through
Arizona Department of Transportation grants. They were identified
through their participation in the Safe Routes to School program, which
encourages holding at least one bike rodeo each year. This study used a
purposive sample because one of the independent variables is
participation in a bike rodeo, and they have the resources to host a safety
intervention. These schools also agreed to undergo evaluation for these
Safe Routes to School programs.
Pilot Study
A pilot study was conducted with students in 3rd through 8th grade,
some of which participated in a classroom computer lab setting. The
results of this study were significant, and there were no major qualms with
the survey items.
Instrument

20
The instrument used in this study was a 36 question online survey.
The items in this survey follow methods used in prior research on Safe
Routes to School programs and guidelines set by Ajzen (2006). Attitudes
were measured by items 18 through 24, subjective norms were measured
by items 33 through 36, self-efficacy was measured by items 29 through
32, bike rodeo participation was measured by item 11, and intention was
measured by items 25 through 28. There are multiple concepts that create
the encompassing idea of bicycle safety which have not previously been
researched and their importance has been determined important through
a review of national programs, the Center for Disease Control‟s Kidswalk,
SafeKids USA, and Safe Routes to School. The overall topics for the
questions were selected by the most frequently cited tips and facts that the
leading bicycle safety program for children hosted on their respective web
pages. Those tips were wearing bright or reflective clothing while riding a
bike, obeying traffic signs and signals, riding on the street with traffic if
you are over 10 years old, not playing around in the road when riding a
bike, and wearing a properly fitted helmet.
All primary constructs have multiple item indicators except for bike
rodeo participation. The four constructs are attitude, subjective norms,
self-efficacy, and bike rodeo participation. Attitudes were measured
through items 18-24 on a 3-point Likert-type scale: not at all, a little, very
much. Subjective norms were measured through items 33 through 36 on a
4-point Likert-type scale: never, some of the time, most of the time, all the

21
time. Self-efficacy was measured through items 29 through 32 on a 4-point
Likert-type scale: never, some of the time, most of the time, all the time.
Bike rodeo participation was measured through item 11, where the
students indicated how many bike rodeos they had attended: 0, 1, 2, 3, 4, 5
or more. Intention was measured through items 25 through 28 on a 4-
point Likert-type scale: never, some of the time, most of the time, all the
time. The secondary variables, such as age, grade, sex, and ethnicity, were
measured through items 2, 3, 4, and 5 accordingly. The instrument and
consent form underwent IRB approval, and the stamped copies of those
two forms are available in Appendices A, B, and C, respectively. The
survey was created through the Qualtrics program (Qualtrics Labs, Inc.,
Provo, UT) and was administered as an online assessment.
A power analysis was conducted using G*Power 3 (Faul, Erdfelder,
Lang, & Buchner, 2007). A total of 46 participants were necessary to
maximize the statistical significance/power relationship given the
statistical tests used in this study.
Procedures
Two schools within the Safe Routes to School program who had
access to a bike rodeo agreed to go forth with the evaluation, so
permission/consent forms were delivered to Burk Elementary and
Ashland Ranch Elementary. Burk Elementary has a total of 269 students
in third through sixth grade and Ashland Ranch Elementary has 540. The
total sample size was 65. Sixty-five students‟ teachers agreed to invite
22
students to take the survey. From the sample, thirty-six completed the
survey with consent and assent. Primary reasons cited for refusal to
participate included: parents not signing and returning consent form, and
busyness of teachers disallowing students to access the survey; the survey
window was during AIMS (Arizona‟s Instrument to Measure Standards)
testing season.
The survey was accessed by the students through the computer labs
at school under the supervision of the teacher. The teachers were
instructed to share the link with the students, and then allow the students
to take the assessment on their own. The students were only allowed to
grant assent to continue to take the survey if their parents signed and
returned the consent form. The students accessed the survey March 8,
2011 through April 5, 2011. The data were collected and analyzed with the
PASW Statistics 18 program (SPSS for Windows, 2009).

23
Chapter 4
DATA ANALYSIS AND RESULTS
Analysis of Data
The problem of the study was to analyze the extent to which
attitudes, subjective norms, self-efficacy, and bike rodeo participation
explain children‟s intentions to bike safely. This section identifies the
demographics of the population studied, the reliability of the instruments,
and the results of the study. These results are reported in the format of the
correlations between each of the independent variables and the dependent
variables, regression coefficients, and related significance tests.
The analysis conducted for this study was as follows:
1. Descriptive statistics
a. Mean
b. Standard deviation
c. Scatterplot
d. Factor Analysis
2. Spearman correlation
a. Attitudes & Intention
b. Subjective Norms & Intention
c. Self-Efficacy & Intention
d. Bike Rodeo & Intention
3. Multiple Regression
24
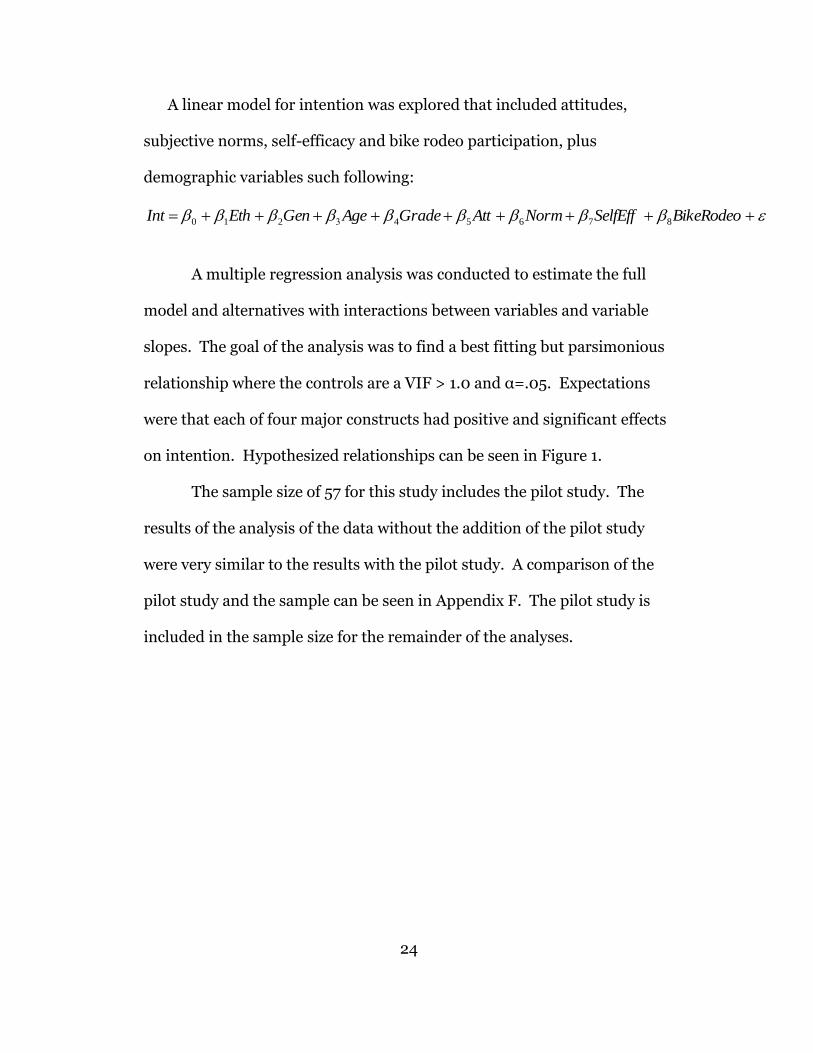
A linear model for intention was explored that included attitudes,
subjective norms, self-efficacy and bike rodeo participation, plus
demographic variables such following:
BikeRodeoSelfEffNormAttGradeAgeGenEthInt 87654210
A multiple regression analysis was conducted to estimate the full
model and alternatives with interactions between variables and variable
slopes. The goal of the analysis was to find a best fitting but parsimonious
relationship where the controls are a VIF > 1.0 and α=.05. Expectations
were that each of four major constructs had positive and significant effects
on intention. Hypothesized relationships can be seen in Figure 1.
The sample size of 57 for this study includes the pilot study. The
results of the analysis of the data without the addition of the pilot study
were very similar to the results with the pilot study. A comparison of the
pilot study and the sample can be seen in Appendix F. The pilot study is
included in the sample size for the remainder of the analyses.
25
Figure 1. The hypothesized research relationships of attitude, subjective
norms, self-efficacy, bike rodeo participation, and demographic variables.
Attitudes
Subjective Norms
Self-Efficacy
Bike Rodeo
Intention
+
+
+
+

26
Results
Response Rate
The reported response rate for this study is 58%. This score was
calculated using the sample without the pilot study. Within the same, 62
students were allowed by their teacher to take the survey and 36 of the 62
had consent and could have assented to taking the survey. Consent forms
were distributed to 269 students at one primary school in Maricopa
County and 540 students at another. More students could have been given
consent and could have assented to taking the survey, but the known
sample size (62) is only based on the students whose teachers fostered the
data collection.
Demographics
The sample included 52.1% boys and 47.9% girls. The sample included
varying ethnicities: 62% White, 25.4% Latino or Hispanic, 7% Black, and
2.8% Asian. The gender and ethnic spread closely mirror the general
composition of Maricopa county and Arizona as a whole (U.S. Census
Bureau, 2009). The grades ranged from third through eighth with 1.4% in
third grade, 40.8% in fourth grade, 16.9% in fifth grade, 32.4% in sixth
grade, 2.8% in seventh grade, and 4.2% in eighth grade. The total sample
size was 57 students, including the pilot study.
Factor Analysis
An exploratory principal components factor analysis was performed
within constructs to determine the amount of components measured

27
within each factor. All primary constructs showed each to be of a single
component, except attitudes. Factor loadings of the attitude items are
shown in Table 1.
Table 1
Component loadings for the 7 attitude items with a varimax rotation
Component 1 2 3
To what extent do you feel the following when you are biking in safe manner – Happy
.578
To what extent do you feel the following when you wear your helmet when riding a bike – Happy
.815
To what extent do you feel the following when you wear your helmet when riding a bike – Safe
.820
To what extent do you feel the following when you are biking in safe manner – Afraid
.842
To what extent do you feel the following when you wear your helmet when riding a bike – Afraid
.924
To what extent do you feel the following when you are biking in a safe manner – Calm
.935
To what extent do you feel the following when you wear your helmet when riding a bike – Calm
.588
Eigenvalues 2.330 1.667 1.025
Percentage of total variance 33.290% 23.807% 14.647%
Number of test measures 3 2 2
Note. Only factor loadings >.5 were retained
28
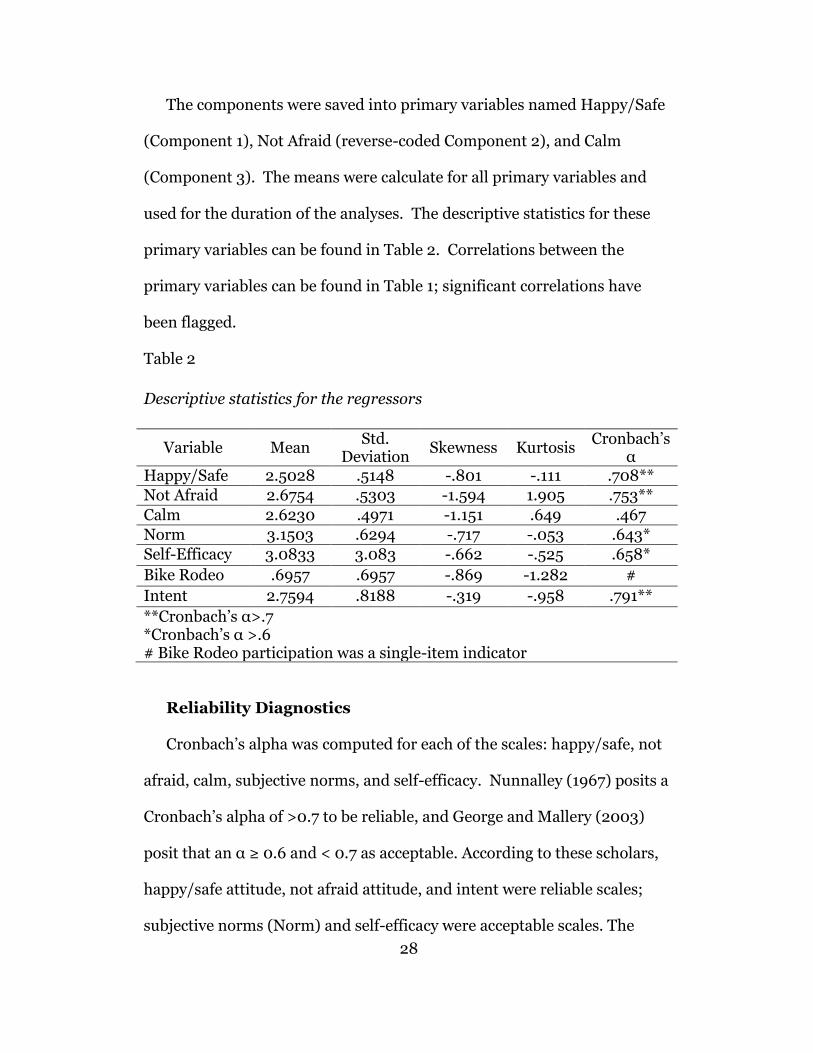
The components were saved into primary variables named Happy/Safe
(Component 1), Not Afraid (reverse-coded Component 2), and Calm
(Component 3). The means were calculate for all primary variables and
used for the duration of the analyses. The descriptive statistics for these
primary variables can be found in Table 2. Correlations between the
primary variables can be found in Table 1; significant correlations have
been flagged.
Table 2
Descriptive statistics for the regressors
Variable Mean Std.
Deviation Skewness Kurtosis
Cronbach‟s α
Happy/Safe 2.5028 .5148 -.801 -.111 .708**
Not Afraid 2.6754 .5303 -1.594 1.905 .753**
Calm 2.6230 .4971 -1.151 .649 .467
Norm 3.1503 .6294 -.717 -.053 .643*
Self-Efficacy 3.0833 3.083 -.662 -.525 .658*
Bike Rodeo .6957 .6957 -.869 -1.282 #
Intent 2.7594 .8188 -.319 -.958 .791**
**Cronbach‟s α>.7 *Cronbach‟s α >.6 # Bike Rodeo participation was a single-item indicator
Reliability Diagnostics
Cronbach‟s alpha was computed for each of the scales: happy/safe, not
afraid, calm, subjective norms, and self-efficacy. Nunnalley (1967) posits a
Cronbach‟s alpha of >0.7 to be reliable, and George and Mallery (2003)
posit that an α ≥ 0.6 and < 0.7 as acceptable. According to these scholars,
happy/safe attitude, not afraid attitude, and intent were reliable scales;
subjective norms (Norm) and self-efficacy were acceptable scales. The

29
calm attitude scale did not meet any reliability standards. The actual
Cronbach‟s alphas recorded can be seen above in Table 2.
Data Transformation for Analysis
First, the items were divided by construct, where attitudes had seven
items, subjective norms had four items, self-efficacy had four items, and
bike rodeo participation had one item. After the exploratory factor
analysis, it was determined that attitude was composed of three factors
and the remaining constructs sustained one factor status. After
determining the final regressors: happy/safe attitude, not afraid attitude,
calm attitude, subjective norms, self-efficacy and bike rodeo participation,
the mean was determined for each regressor for each individual. These
mean terms were used for the duration of the analyses.
Correlations
The data were analyzed through a Spearman correlation and reported
in Table 3. The happy/safe attitude was significantly correlated with the
calm attitude, subjective norms, self-efficacy and intent. The not afraid
attitude was not significantly correlated with any other construct. The
calm attitude was significantly correlated with the happy/safe attitude and
self-efficacy. Norms were significantly correlated with the happy/safe
attitude, self-efficacy, and intention. Self-efficacy was significantly
correlated with the happy/safe attitude, the calm attitude, subjective
norms, and intent. Bike rodeo participation was not significantly
correlated with any other construct. Based on these correlations, the
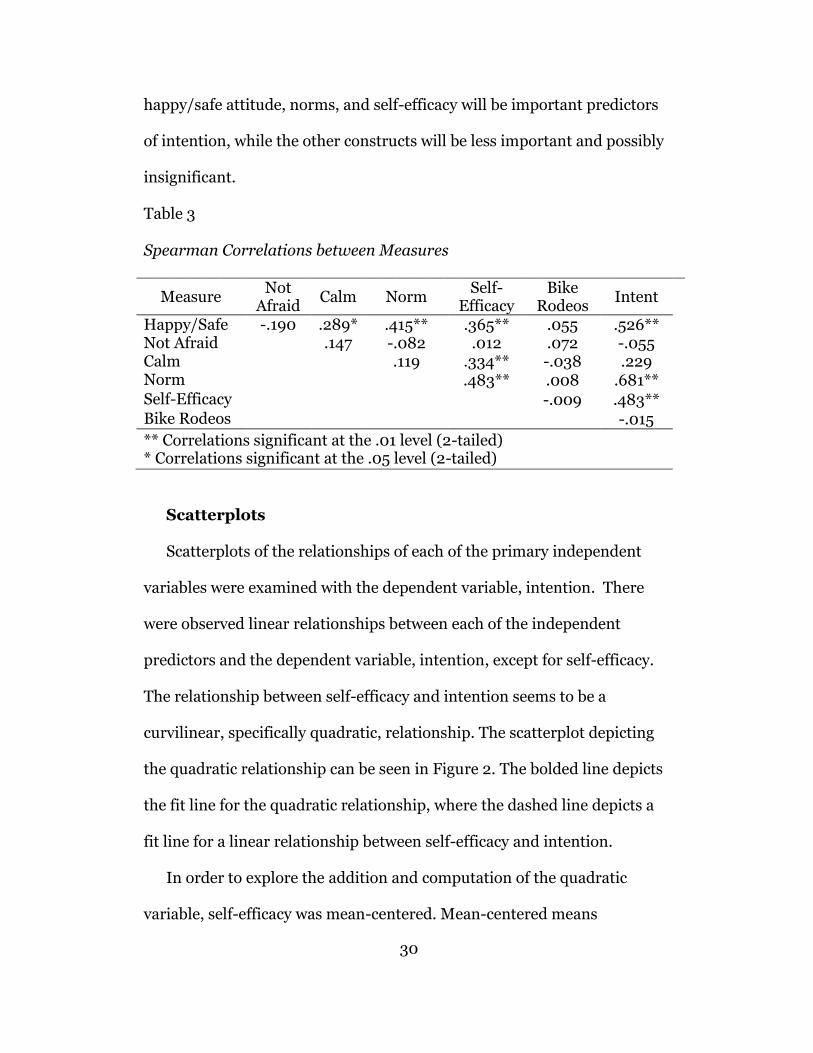
30
happy/safe attitude, norms, and self-efficacy will be important predictors
of intention, while the other constructs will be less important and possibly
insignificant.
Table 3 Spearman Correlations between Measures
Measure Not
Afraid Calm Norm
Self-Efficacy
Bike Rodeos
Intent
Happy/Safe -.190 .289* .415** .365** .055 .526** Not Afraid .147 -.082 .012 .072 -.055 Calm .119 .334** -.038 .229 Norm .483** .008 .681** Self-Efficacy -.009 .483** Bike Rodeos -.015
** Correlations significant at the .01 level (2-tailed) * Correlations significant at the .05 level (2-tailed)
Scatterplots
Scatterplots of the relationships of each of the primary independent
variables were examined with the dependent variable, intention. There
were observed linear relationships between each of the independent
predictors and the dependent variable, intention, except for self-efficacy.
The relationship between self-efficacy and intention seems to be a
curvilinear, specifically quadratic, relationship. The scatterplot depicting
the quadratic relationship can be seen in Figure 2. The bolded line depicts
the fit line for the quadratic relationship, where the dashed line depicts a
fit line for a linear relationship between self-efficacy and intention.
In order to explore the addition and computation of the quadratic
variable, self-efficacy was mean-centered. Mean-centered means
31
subtracting the mean from each observation. This method reduced
nonessential multicollinearity between the predictors x and x2. Centering
data in polynomial equations is a method used and encouraged by leading
social scientists (Cohen, 2003). The addition of a quadratic term
accounted for the rate of change of the slope of the curve of the
relationship of self-efficacy to intention. The quadratic term is not a stand
alone predictor; it must be used in combination with the corresponding
linear predictor (Cohen, 2003). Implications and explanations of this
concept can be found in the discussion and conclusions chapter. The
quadratic term adds an approximate 4.4% of explained variance to the
model (ΔR2=.044, F Change (1, 49)=8.668, p=.005) above and beyond all
other predictors.

32
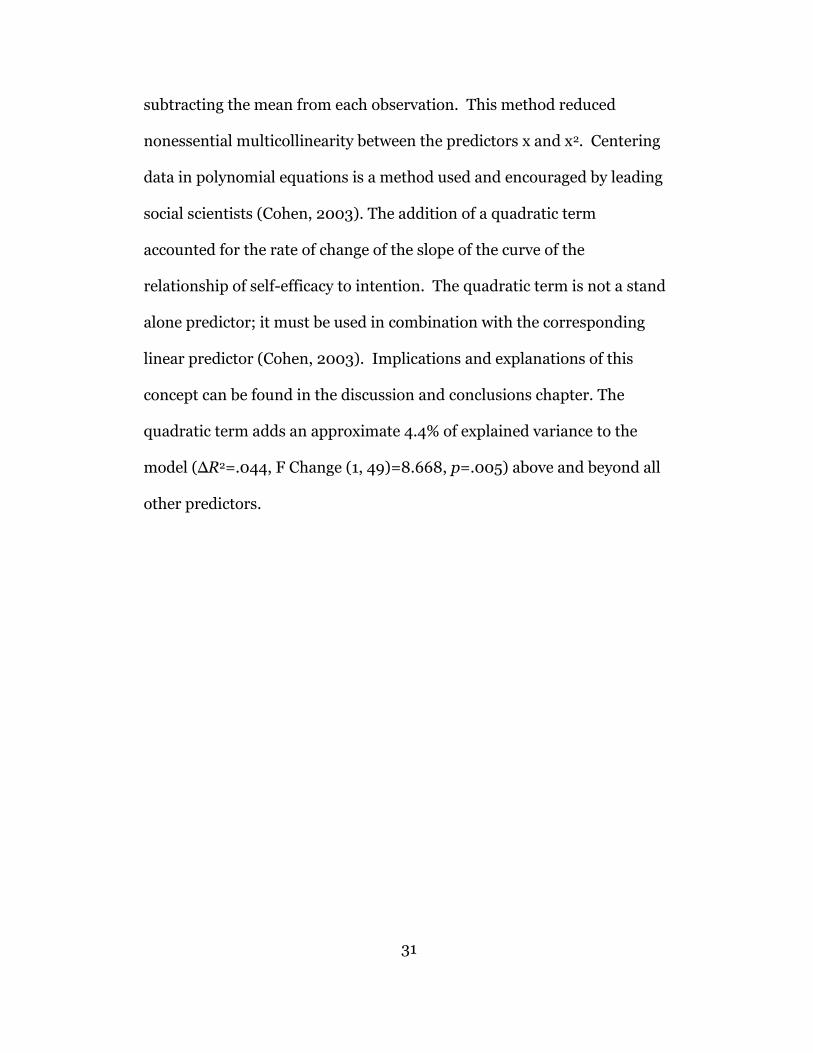
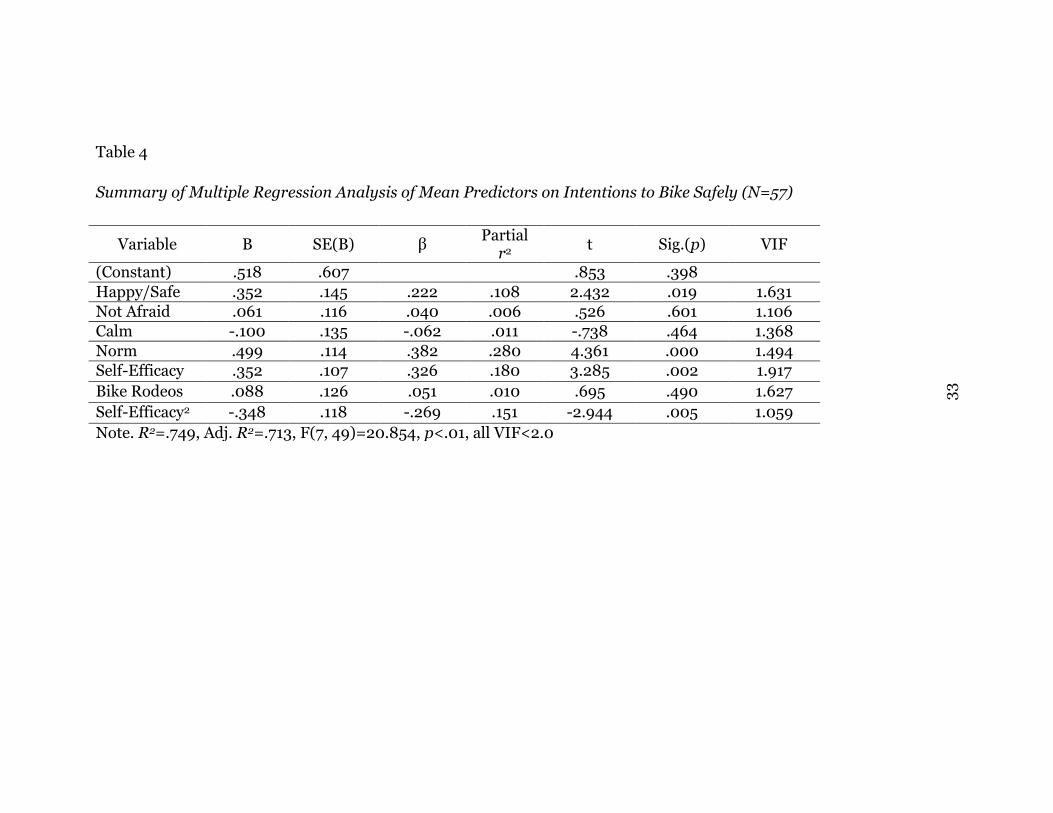
Multiple Regression
A multiple regression analysis was conducted and the model
significantly explained approximately 71% of the variance of intentions to
bike safely, R2=.749, Adjusted R2=.713, p<.01. Regression coefficients
(standardized and unstandardized), partial r2, and significance tests of
each predictor are shown in Table 4. The significant predictors were
happy/safe attitude (p=.019), subjective norms (p<.01), self-efficacy
(p=.002), and the quadratic self-efficacy term (p=.005).
Key: Linear Quadratic
33
Table 4
Summary of Multiple Regression Analysis of Mean Predictors on Intentions to Bike Safely (N=57)
Variable B SE(B) β Partial
r2 t Sig.(p) VIF
(Constant) .518 .607 .853 .398
Happy/Safe .352 .145 .222 .108 2.432 .019 1.631
Not Afraid .061 .116 .040 .006 .526 .601 1.106
Calm -.100 .135 -.062 .011 -.738 .464 1.368
Norm .499 .114 .382 .280 4.361 .000 1.494
Self-Efficacy .352 .107 .326 .180 3.285 .002 1.917
Bike Rodeos .088 .126 .051 .010 .695 .490 1.627
Self-Efficacy2 -.348 .118 -.269 .151 -2.944 .005 1.059
Note. R2=.749, Adj. R2=.713, F(7, 49)=20.854, p<.01, all VIF<2.0
34
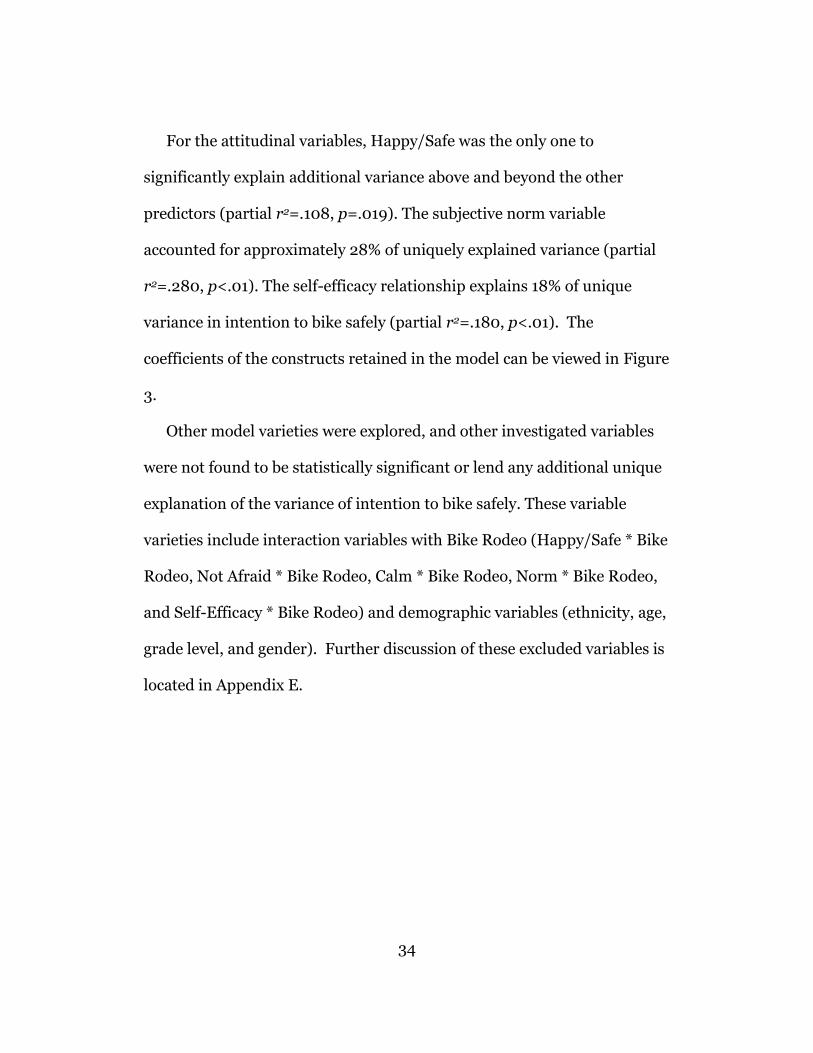
For the attitudinal variables, Happy/Safe was the only one to
significantly explain additional variance above and beyond the other
predictors (partial r2=.108, p=.019). The subjective norm variable
accounted for approximately 28% of uniquely explained variance (partial
r2=.280, p<.01). The self-efficacy relationship explains 18% of unique
variance in intention to bike safely (partial r2=.180, p<.01). The
coefficients of the constructs retained in the model can be viewed in Figure
3.
Other model varieties were explored, and other investigated variables
were not found to be statistically significant or lend any additional unique
explanation of the variance of intention to bike safely. These variable
varieties include interaction variables with Bike Rodeo (Happy/Safe * Bike
Rodeo, Not Afraid * Bike Rodeo, Calm * Bike Rodeo, Norm * Bike Rodeo,
and Self-Efficacy * Bike Rodeo) and demographic variables (ethnicity, age,
grade level, and gender). Further discussion of these excluded variables is
located in Appendix E.

35
Figure 3. Relationships between the regressors and the dependent
variable.
Attitudes
Subjective Norms
Self-Efficacy
Bike Rodeo
Intention
βhappy/safe= .222, p=.019
βnorm=.382, p<.01
βself-efficacy= .326, p<.01 βself-efficacy
2= -.269, p<.01
βrodeo=.051, p=.490
βnotafraid= .040, p=.601
βcalm=-.062, p=.464
36
Chapter 5
DISCUSSION AND CONCLUSIONS
Summary of Findings
The goal of this study was to determine the effect that attitudes,
subjective norms, self-efficacy, and bike rodeo participation had on
children‟s intention to bike safely. The original hypotheses were compared
with the results to determine the conclusions of the study.
H1A: Attitudes have an effect on intention
H10: Attitudes have no effect on intention, βattitudes≠0, α=.05,
Result: βhappy/safe=.222, p=.019, βnotafraid=.040, p=.601,
βcalm=-.062, p=.464, F(3, 49)=1.976, p=.130
Conclusion: Fail to reject the null hypothesis
H2A: Subjective norms have an effect on intention.
H20: Subjective norms have no effect on intention, βnorms≠0, α=.05
Result: βnorms=.382, p<.01
Conclusion: Reject the null hypothesis
H3A: Self-efficacy has an effect on intention.
H30: Self-efficacy has no effect on intention, βself-efficacy≠0, α=.05
Result: βself-efficacy=.326, p<.01, βself-efficacy2=-.269, p<.01
Conclusion: Reject the null hypothesis
H4A: Bike rodeo participation has an effect on intention.
H40: Bike rodeo participation has no effect on intention, βrodeo≠0,
α=.05
37
Result: βrodeo=.051, p=.490
Conclusion: Fail to reject the null hypothesis
H5A: The full model is useful in explaining variance in intention.
H50: The full model does not explain any variance in intention,
R2≠0, α=.05
Result: R2=.749, Adjusted R2=.713, F(7,49)=20.854, p<.01
Conclusion: Reject the null hypothesis
The study successfully rejected three hypotheses, which is interpreted as
subjective norms have an effect on intention to bike safely, self-efficacy has
an effect on intention to bike safely, and the overall model is useful in
explaining variance in children‟s intention to bike safely. The other
hypotheses did not have enough evidence to support their postulations.
Discussion
Attitudes
The attitudes construct was divided into three factors: happy/safe,
not afraid, and calm. Of these three factors, only the happy/safe factor
had a positive direct effect on intention. The happy/safe and not afraid
scales both tested to be reliable with Cronbach‟s alpha greater than 0.7.
The calm scale was not reliable or acceptable with a Cronbach‟s alpha of
less than 0.6.
Practical implications.
The individual contribution of each of these attitudes has practical
implications for bicycle safety programs, specially the bike rodeo.
38
Anecdotally, when explaining the need for a helmet in a bicycle safety
program, organizers like to present the negative consequences in a graphic
way in order to scare the kids into wearing their helmets. According to
this study, fear-related motivational tactics will not affect the children‟s
intention to bike safely. In order to ameliorate these programs, organizers
should try to use the happy/safe attitude as a motivator. Practical
examples of this would be to have a helmet decorating station, allow
children to have different clip or slide on decorations, or a paint-your-
own-helmet station. Enforce happiness over skill development to a certain
extent. If the children perceive their experiences of safety as a happy
experience, they are more likely to intend to bike safely in the future.
Organizers need to determine the goal of the program: is it to change
behavior or is it to teach skills? If the answer is to change behavior, then
attitudes are an important aspect to consider.
Subjective norms
Subjective norms were significant in predicting children‟s
intentions to bike safely, β=.382, p<.01. This supports the listed
hypothesis of subjective norms having a positive direct effect on intention.
The subjective norm scale lent a Cronbach‟s alpha of .643, which is an
acceptable amount of reliability. In the broader scope of literature, norms
tend to be the weakest predictor of intentions (Armitage & Conner, 2001).
The results of this study do not follow the trend in the general behavioral
39
literature. The importance of subjective norms has direct practical
implications on bike rodeos and other bicycle safety programs.
Practical implications.
The normative importance poses the necessity of important people
being involved in the rodeo. “Important people” means people who are
important to the child, which very well may vary by culture and age.
Specific examples of positive recommended changes are to first identify
the important people, then use that information accordingly. If it is the
parents, then make the rodeo at a time when parents could be involved.
Make sure to advertise the program enough to where parents know to be
involved. If the important people are older kids or older siblings, allow
those older children to be rodeo rangers, modeling and encouraging the
safety behavior on the younger children. If all of these options are
procedurally or logistically impossible, allow children to participate in the
rodeo as a group. For safety‟s sake, children should practice the behavior
and ride individually, but if children did the whole course as a group, they
would create some normative experience through the process. Find and
collaborate with the influential people and have a better behavioral change
result.
Self-efficacy
The self-efficacy/intention relationship has an overall positive trend
(linear β=.326). The quadratic term revealed that for every one unit
increase in self-efficacy, the slope of the relationship changes -.269
40
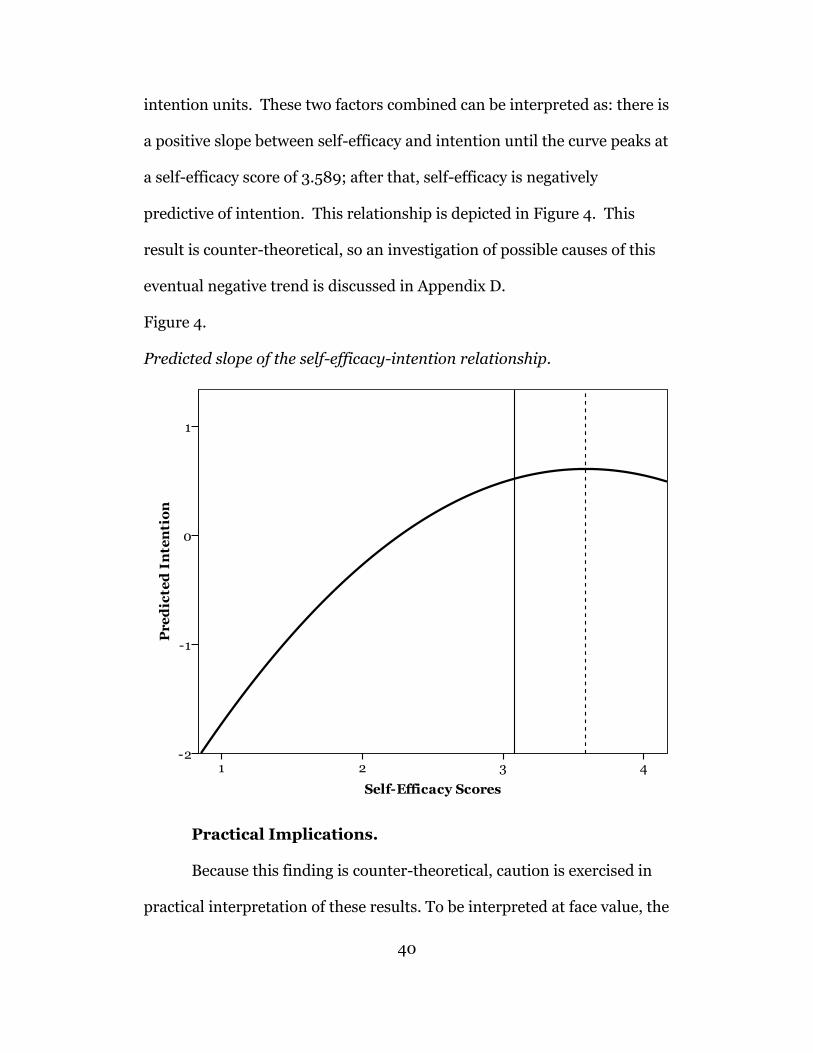
intention units. These two factors combined can be interpreted as: there is
a positive slope between self-efficacy and intention until the curve peaks at
a self-efficacy score of 3.589; after that, self-efficacy is negatively
predictive of intention. This relationship is depicted in Figure 4. This
result is counter-theoretical, so an investigation of possible causes of this
eventual negative trend is discussed in Appendix D.
Figure 4.
Predicted slope of the self-efficacy-intention relationship.
Practical Implications.
Because this finding is counter-theoretical, caution is exercised in
practical interpretation of these results. To be interpreted at face value, the
41
practical programmatic step would be to foster self-efficacy to a point, but
high confidence in children‟s ability to bike safety leads to a lower
intention to actually perform those behaviors. This interpretation should
not be implemented until future studies add further investigation.
Bike Rodeo
Bike rodeo participation was not a significant predictor of intention
to bike safely, partial r2=.010, p=.490, which did not support the listed
hypothesis. This could have been due to the nature of bike rodeos and the
aim of the program. If the results of the self-efficacy analysis are accurate,
and if bike rodeos tend to instill self-efficacy in children to the highest
degree, that could be the reason that bike rodeos did not significantly
predict intention.
Practical Implications.
Bike rodeos can be improved to better affect children‟s intentions to
bike safely by using the constructs shown to strongly and significantly
affect intention. Rodeos need to cater more to the happy/safe attitude as
opposed to instilling fear in consequences of unsafe behavior. Rodeos can
also more effectively harness the power of subjective norms in the process
of the rodeo. Specific recommendations may be read in the earlier
sections.
Full Model
42
The full model significantly predicts intention to bike safely,
approximately 71% of the variance. This supports the last listed
hypothesis.
Study significance
This study closes a gap by focusing on comprehensive bicycle safety
behavior as opposed to just helmet use. Specifically, the behavioral
prediction model explained 71% of children‟s intentions to bike safely.
Equipped with this information, research can begin to focus on biking
safely as a behavior encompassing more than helmet use. This study also
offers practical programmatic ideas to better affect children‟s intentions to
bike safely.
Recommendations
Procedural
Procedurally, data collection timing was the most difficult
component. The study data were collected during the AIMS (Arizona
Instrument to Measure Standards) testing season. If the data had not
been collecting during the standardized testing season, the teachers may
have been more willing and able to take their classroom to the computer
lab to participate in the study, which would have lead to an increased
sample size.
Secondly, although the IRB consent form has a fairly pre-existing
structure, thought should be given on a better way to gain consent from
the parents. Sending home the IRB consent form with a letter from the

43
school attached was not an effective method of achieving a great consent
rate. Some of the comments concerning the form dealt with issues such as
scary wording of the form, institutional verbiage, and sheer mass of
information on one piece of paper. Sending a consent form home like that
assumes that the parents are capable of reading the form, understanding
the (small) risk their children could undergo during participation, and
make a rational decision accordingly. This train of logic contains
assumptions that may not hold true.
Possible recommendations could be to be able to talk to the parents
at a PTO meeting before the consent form is disseminated. If parents could
hear the researcher verbally explain the process, maybe they would be
more perceptive. This PTO method still only reaches a select few. If the
school sends out a weekly call to their parents, the researchers could come
up with a 20-30 second blurb about their study, the parents possibly could
be more prepared and perhaps more trusting of the process. Re-wording
the IRB consent form is a possibility for future implementation, but there
are limited allowable adjustments due to IRB guidelines.
Instruments
The online survey instrument had advantages and disadvantages.
The advantages were the ability to create filters, so that respondents did
not need to see irrelevant questions to them, the speed with which the data
could be cleaned and analyzed, the speed with which the instrument could
be disseminated, and the ease of collection organization. The main

44
disadvantage was the necessity of moving children and changing a weekly
schedule to be able to access the survey. Although computer usage is very
common in schools in current society, this use has not reached the
optimum saturation level for online surveys to be most effective. It is much
more efficient on the front end for a teacher to use an open 15 minutes to
pass out and moderate the use of a paper survey than it is to take the 25
minutes to pack up the class, schedule computer lab time, take the class to
the computer lab, bring them back to the classroom, and try to get
students focused in the classroom again. Although the massive amount of
paper tends to be an organizational headache on the back end, a larger
sample size is likely more probably if the instrument can be completed in a
regular classroom by all students at one time.
As far as the scales themselves within the instrument, it is
preferable for all scales to have a Cronbach‟s alpha of over 0.7 (Nunnally,
1967). Further investigation as to the wording of the items should be done
to determine if the children taking the survey and the researchers creating
the survey are really interpreting each item in the same way.
Conceptual
Future research should embrace the utility of a behavior prediction
model in explaining children‟s intentions to bike safely. Future research
should also look into this self-efficacy intention relationship and its
relationship with safety behaviors, specifically biking. Appendix D
discusses the possible causes for the counter-theoretical relationship, and
45
future studies should further investigate those ideas. Future research
should re-test the scale with another larger sample, and record and
compare the findings. The wording of the items themselves should be
investigated. Interviewing the students themselves and asking them to
interpret the questions would be an effective, elucidating next step.
Since only the happy/safe attitude was a significant predictor, more
studies should be done to determine what other attitudes surround
children‟s intentions to perform safety behaviors. Attitudes might be
specific to certain types of behaviors. Researchers should investigate the
intricacies of attitude with intention to bike safely, so that future programs
can be improved.
46
REFERENCES
Ajzen, I. (1991). The theory of planned behavior. Organizational Behavior and Human Decision Processes, 50, 179-211.
Ajzen, I. (2006). Constructing a TPB questionnaire: conceptual and methodological considerations. Unpublished manuscript, Department of Psychology, University of Massachusetts. Retrieved from http://www.people.umass.edu/aizen/pdf/tpb.measurement.pdf
Ajzen, I. & Fishbein, M. (1980). Understanding attitudes and predicting social behavior. Englewood Cliffs, NJ: Prentice Hall.
Attewell, R. G., Glase, K., McFadden, M. (2001). Bicycle helmet efficacy: A meta-analysis. Accident Analysis and Prevention, 33, 345-352.
Armitage, C.J. & Conner, M. (2001). Efficacy of the theory of planned behavior: A meta-analytic review. British Journal of Social Psychology, 40, 471-499.
Bagozzi, R.P. (1981). Attitudes, intentions, and behavior: A test of some key hypotheses. Journal of Personality and Social Psychology, 41(4), 607-627.
Bandura, A. (1977). Self efficacy: Toward a unifying theory of behavioral change. Psychological Review, 84(2), 191-215.
Bandura, A. (2006). Guide for constructing self-efficacy scales. In T. Urdan & F. Pajares (Eds.), Self-Efficacy Beliefs of Adolescents (307-337). Retrieved from http://www.des.emory.edu/mfp/014-BanduraGuide2006.pdf.
Baranowski, T., Perry, C.L., Parcel, G.S. (2002). How individuals, environments, and health behavior interact. In K. Glanz, B.K. Rimer, & F.M. Lewis (Ed.), Health behavior and health education: Theory, research, and practice (pp. 165-184). San Francisco, CA: Jossey-Bass.
Berg, P. & Westerling, R. (2001). Bicycle helmet use among schoolchildren – the influence of parental involvement and children‟s attitudes. Injury Prevention, 7, 218-222.
Bonefield, E. H. (1974). Attitude, social influence, personal norm, and intention interactions as related to brand purchase behavior. Journal of Marketing Research, 11(4), 379-389.
47
Brain Injury Association of America. (2004). Bicycle safety. Retrieved from http://www.biausa.org/elements/aboutbi/factsheets/BicycleSafety.pdf
Buhi, E.R. & Goodson, P. (2007). Predictors of adolescent sexual behavior and intention: A theory-guided systematic review. Journal of Adolescent Health, 40, 4-21.
Carlin, J.B., Taylor, P., & Nolan. (1998). School based bicycle safety education and bicycle injuries in children: A case-control study. Injury Prevention, 4, 22-27.
Cohen, J., Cohen, P., West, S.G., & Aiken, L.S. (2003). Applied multiple regression analysis for the behavioral sciences. Mahwah, New Jersey: Lawrence Erlbaum Associates.
Committee on Accident Poison Prevention. (1990). Bicycle helmets.
Pediatrics, 85, 229-230.
Coté, T. R., Sacks, J. J., Kresnow, M., Lambert-Huber, D. A., Schmidt, E. R., Dannenberg, A. L., & Lipsitz, C. M. (1992). Bicycle helmet use among Maryland children: Effect of legislation and education. Pediatrics, 89(6), 1216-1220.
Cushman, R. Down, J., MacMillan, N., & Waclawik, H. (1991). Health promotion in the emergency room following a bicycle injury: A randomized trial. Pediatrics, 88, 43-47.
Cushman, R., James, W. & Waclawik, H. (1991). Physicians promoting bicycle helmets for children: A randomized trial. American Journal of Public Health, 81(8), 1044-1046.
Dannenberg, A. L., Gielen, A. C., Beilenson, P. L., Wilson, M. H., & Joffe, A. (1993). Bicycle helmet laws and educational campaigns: An evaluation of strategies to increase children‟s helmet use. American Journal of Public Health, 83(5), 667-674.
Davidson, A.R. & Jaccard, J.J. (1979). Variables that moderate the attitude-behavior relation: Results of a longitudinal survey. Journal of Personality and Social Psychology, 37(8), 1374-1376.
48
de Vries, H., Dijkstra, M., & Kuhlman, P. (1988). Self-efficacy: the third factor besides attitude and subjective norm as a predictor of behavioural intentions. Health Education Research, 3(3), 273-282.
Dorsch, M. M., Woodward, A. J., & Somers, R. L. (1987). Do bicycle safety helmets reduce severity of head injury in real crashes? Accident Analysis & Prevention, 19(3), 183-190.
Dowswell, T., Towner, E. M. L., Simpson, G., & Jarvis, S. N. (1996). Preventing childhood unintentional injuries – what works? A literature review. Injury Prevention, 2, 140-149.
Dzewaltowski, D. A., Noble, J.M., & Shaw, J.M. (1990). Physical activity participation – social cognitive theory versus the theories of reasoned action and planned behavior. Journal of Sport and Exercise Psychology, 12, 388-405.
Evans, D. & Norman, P. (2003). Predicting adolescent pedestrians‟ road-crossing intentions: An application and extension of the theory of planned behaviour. Health Education Research, 18(3), 267-277.
Finch, C.F. (1996). Teenagers‟ attitudes towards bicycle helmets three years after the introduction of mandatory wearing. Injury Prevention, 2, 126-130.
Finnoff, J.T., Laskowski, E.R., Altman, K.L., & Diehl, N.N. (2001). Barriers to bicycle helmet use. Pediatrics, 108.
Fishbein, M. (2000). The role of theory in HIV prevention, Aids Care, 12(3), 273-278.
Fishbein, M. (2008). A reasoned action approach to health promotion. Medical Decision Making, 28, 834-844.
Fishbein, M. & Ajzen, I. (1975). Belief, attitude, intention, and behavior: An introduction to theory and research. Retrieved from http://www.people.umass.edu/aizen/f&a1975.html.
Fishbein, M. & Cappella, J.N. (2006). The role of theory in developing effective health communications. Journal of Communication, 56, S1-S17.
Fishbein, M. & Coombs, F.S. (1974). Basis for decision: An attitudinal analysis of voting behavior. Journal of Applied Social Psychology, 4(2), 95-124.
49
Gallagher,S.S., Finison, K., Goyer, B., & Goodenough, S. (1984). The incidence of injuries among 87,000 Massachusetts children and adolescents: Results of the 1980-81 statewide childhood injury prevention program surveillance system. American Journal of Public Health, 74, 1340-1347.
Gilchrist, J., Schieber, R. A., Leadbetter, & Davidson, S. C. (2000). Police enforcement as part of a comprehensive bicycle helmet program. Pediatrics, 106, 6-9.
Godin, G. & Kok, G. (1996). The theory of planned behavior: A review of its applications to health-related behaviors. American Journal of Health Promotion, 11(2), 87-98.
George, D., & Mallery, P. (2003). SPSS for Windows step by step: A simple guide and reference. 11.0 update (4th ed.). Boston: Allyn & Bacon.
Graitcer, P. L., Kellerman, A. L., & Christoffel. (1995). A review of educational and legislative strategies to promote bicycle helmets. Injury Prevention, 1, 122-129.
Grimard, G., Nolan, T., & Carlin, J.B. (1995). Head injuries in helmeted child bicyclists. Injury Prevention, 1, 21-25.
Grogan, S.C., Bell, R., Conner, M. (1997). Eating sweet snacks: Gender differences in attitudes and behavior. Appetite, 28, 19-31.
Howland, J., Sargent, J., Weitzman, M., Mangione, T., Ebert, R., Mauceri, M., & Bond, M. (1989). Barriers to bicycle helmet use among children. American Journal of Diseases of Children, 143(6), 741-744.
Illingworth, C.M., Noble, D., Bell, D., Kemn, I., Roche, C., & Pascoe, J. (1981). 150 bicycle injuries in children: A comparison with accidents due to other causes. Injury, 13(1), 7-9.
Ivan, L., Choo, S., & Ventureyra, E. (1983). Head injuries in childhood: A 2-year survey. Canadian Medical Association Journal, 128, 281-284.
Klauber, M.R., Barrett-Connor, E., Marshall, L.F., and Bowers, S.A. (1981). The epidemiology of head injury. American Journal of Epidemiology, 113, 500-509.
Kraus, J.F., Fife, D., & Conroy, C. (1987). Incidence, severity, and outcomes of brain injuries involving bicycles. American Journal of Public Health, 77(1), 76-78.
50
Macknin, M. L. & Medendorp, S. V. (1994). Association between bicycle helmet legislation, bicycle safety education, and use of bicycle helmets in children. Archives of Pediatric & Adolescent Medicine, 148(3), 255-259.
Manstead, A.S.R. & van Eekelen, S.A.M. (1998). Distinguishing between perceived behavioral control and self-efficacy in the domain of academic achievement intentions and behavior. Journal of Applied Psychology, 28, 1375-1392.
Nunnally, J. (1967). Psychometric Theory. New York: McGraw-Hill.
Nagel, R. W., Hankenhof, B. J., Kimmel, S. R., & Saxe, J. M. (2003). Educating grade school children using a structured bicycle safety program. Journal of Trauma Injury, Infection, and Critical Care, 55I(5), 920-923.
National Center for Injury Prevention and Control. (2000 & 2005). Fatal and nonfatal injury reports. [Data file] Retrieved from http://www.cdc.gov/injury/wisqars/index.html.
National Highway Traffic Safety Administration. (2006). Highway safety program guideline no. 14. Uniform Guidelines for State Highway Safety Programs.
Newman, J.E. (1974). Predicting absenteeism and turnover: A field comparison of Fishbein‟s model and traditional job attitude measures. Journal of Applied Psychology, 59(5), 610-615.
Nixon, J., Clacher, R., Pearn, J., & Corcoran, A. (1987). Bicycle accidents in childhood. British Medical Journal, 294, 1267-1269.
Pedestrian and Bicycle Information Center. (2007). Safe Routes to School Guide. University of North Carolina: Raleigh, NC.
Pendergast, R. A., Ashworth, C. S., DuRant, R. H., & Litaker, M. (1992). Correlates of children‟s bicycle helmet use and short-term failure of school-level interventions. Pediatrics, 90(3), 354-358.
Qualtrics Labs Inc. (2009). Provo, Utah, USA. Version 18081.
Quine, L., Rutter, D. R., & Arnold, L. (2001). Persuading school-age cyclists to use safety helmets: Effectiveness of an intervention based on the theory of planned behaviour. British Journal of Health Psychology, 6, 327-345.
51
Rodgers, G.B. (1996). Bicycle helmet use patterns among children. Pediatrics, 97(2), 166-173.
Rodgers, G. B. (2000). Bicycle and bicycle helmet use patterns in the United States in 1998. Journal of Safety Research, 31(2), 149-158.
Rivara, F. P., Thompson, D. C., Thompson, R. S., Rogers, L. W., Alexander, B., Felix, D. & Bergman, A. B. (1994). The Seattle children‟s bicycle helmet campaign: Changes in helmet use and head injury admissions. Pediatrics, 93, 567-569.
Rivis, A. & Sheeran, P. (2003). Descriptive norms as an additional predictor in the theory of planned behavior: A meta-analysis. Current Psychology: Developmental, Learning, Personality, Social, 22(3), 218-233.
Sacks, J.J., Holmgreen, P., Smith, S.M., & Sosin, D.M. (1991). Bicycle-associated head injuries from deaths in the United States from 1984 through 1988. Journal of the American Medical Association, 26(21), 3016-3018.
Sacks, J.J., Kresnow, M., Houston, B., & Russell, J. (1996). Bicycle helmet use among American children, 1994. Injury Prevention, 2(4), 258-262.
Sheeran, P. & Taylor, S. (1997). Predicting intentions to use condoms: Meta-analysis and comparison of the theories of reasoned action and planned behavior. Journal of Applied Social Psychology, 29, 1624-1675.
Schneider, M. L., Ituarte, P., & Stokols, D. (1993). Evaluation of a community bicycle helmet promotion campaign: What works and why. American Journal of Health Promotion, 7(4), 281-287.
Sheppard, B.H., Hartwick, J., & Warshaw, P.R. (1988). The theory of reasoned action: A meta-analysis of past research with recommendations for modifications and future research. Journal of Consumer Research, 15, 325-343.
SPSS for Windows, Rel. 18.0.0. 2009. Chicago: SPSS Inc.
Terry, D.J. & O‟Leary, J.E. (1995). The theory of planned behavior: The effects of perceived behavioral control and self-efficacy. British Journal of Social Psychology, 34, 199-220.
52
Thompson, R. S., Rivara, F. P., & Thompson, D. C. (1989). A case-control study of the effectiveness of bicycle safety helmets. The New England Journal of Medicine, 320(21), 1361-1366.
Towner, P. & Marvel, K. (1992). A school-based intervention to increase the use of bicycle helmets. Family Medicine, 24(2), 156-158.
U.S. Census Bureau. (2009). State & County QuickFacts. Maricopa County, Arizona.
Valley Metro. (2010). Bike Rodeo Guidebook.
Waller, J.A. (1995). Bicycle ownership, use, and injury patterns among elementary school children. Injury Prevention, 1, 256-261.
Weiss, B.D. (1986). Bicycle helmet use by children. Pediatrics, 77(5), 677-679.
Weiss, B. D. (1992). Trends in bicycle helmet use by children: 1985 to 1990. Pediatrics, 89(1), 78-80.
White, K.M., Terry, D.J., & Hogg, M.A. (1994). Safer sex behavior: The role of attitudes, norms, and control factors. Journal of Applied Social Psychology, 24, 2164-2192.
Wilson, M.H., Baker, S.P., Teret, S.P., Shock, S., & Garbarino, J. (1991). Saving children: A guide to injury prevention. New York, NY: Oxford University Press.

53
APPENDIX A
SURVEY INSTRUMENT
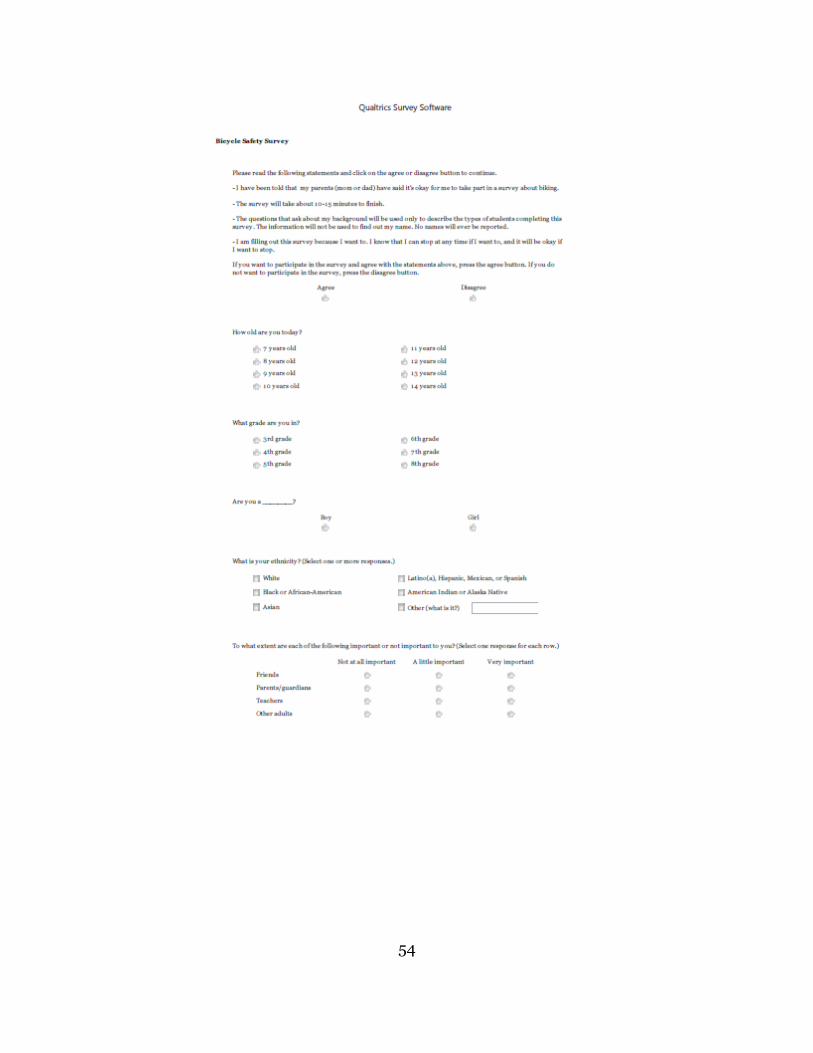
54
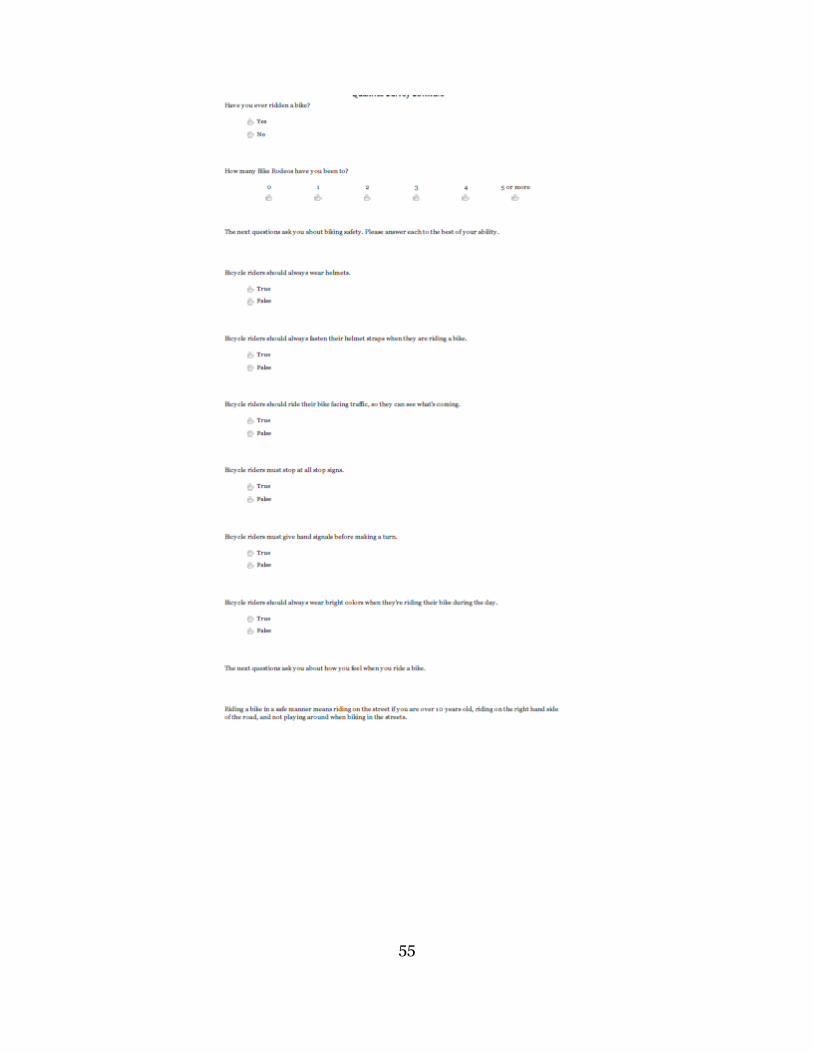
55

56
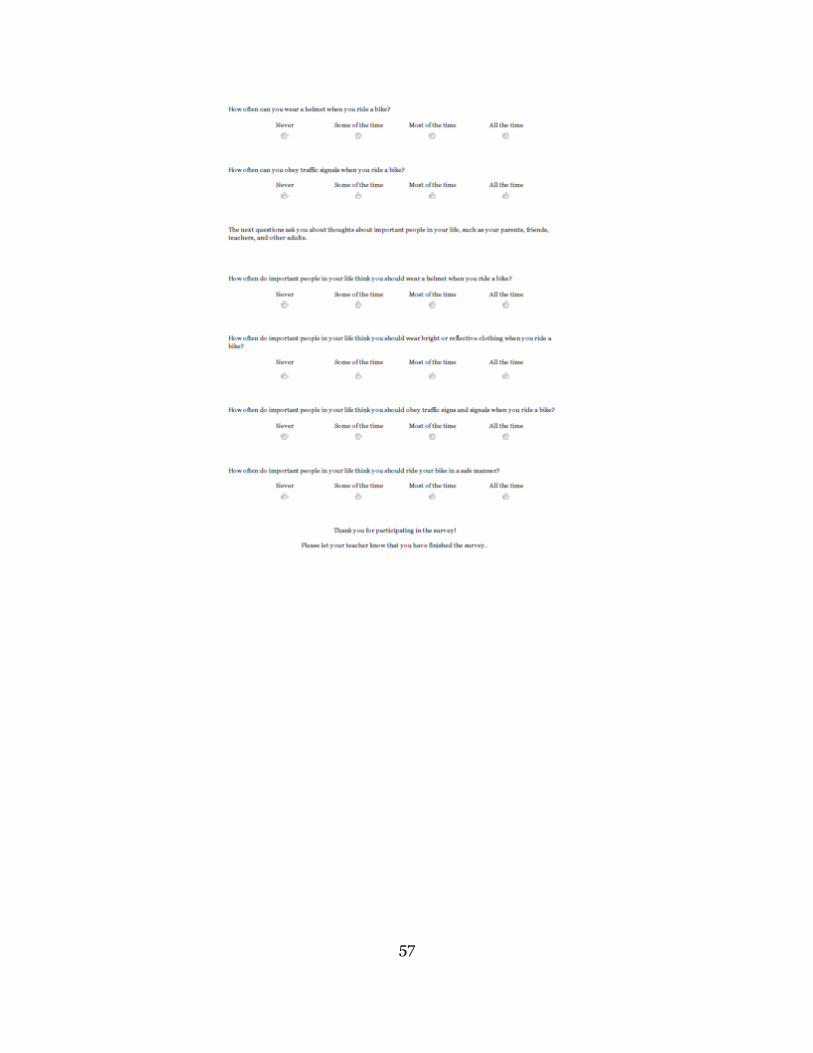
57
58
APPENDIX B
IRB APPROVAL FORM
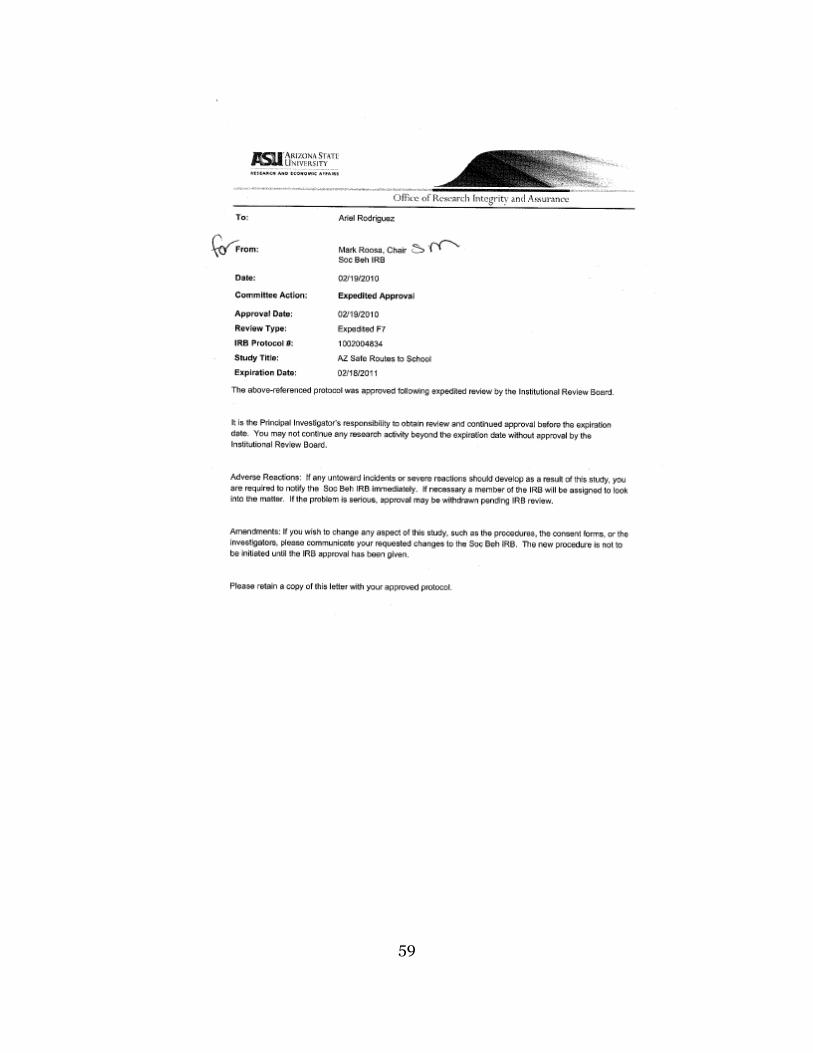
59
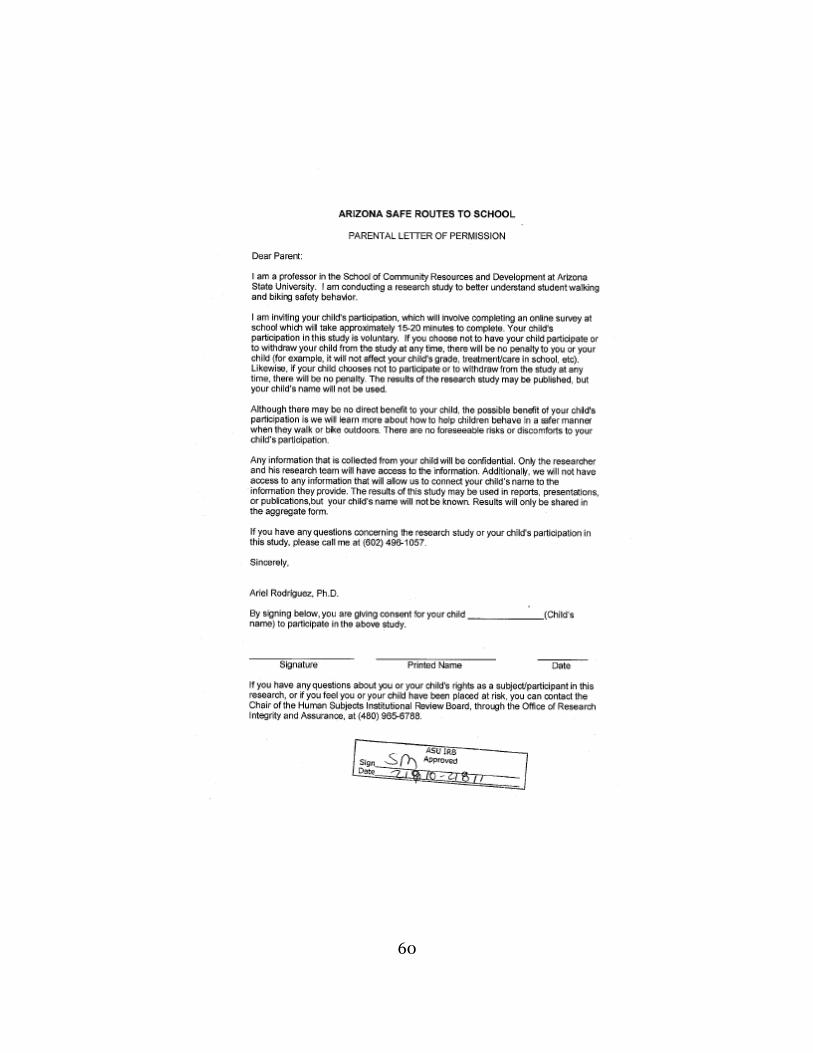
60

61

62

63
APPENDIX C
IRB APPROVED MODIFIED CONSENT FORM

64
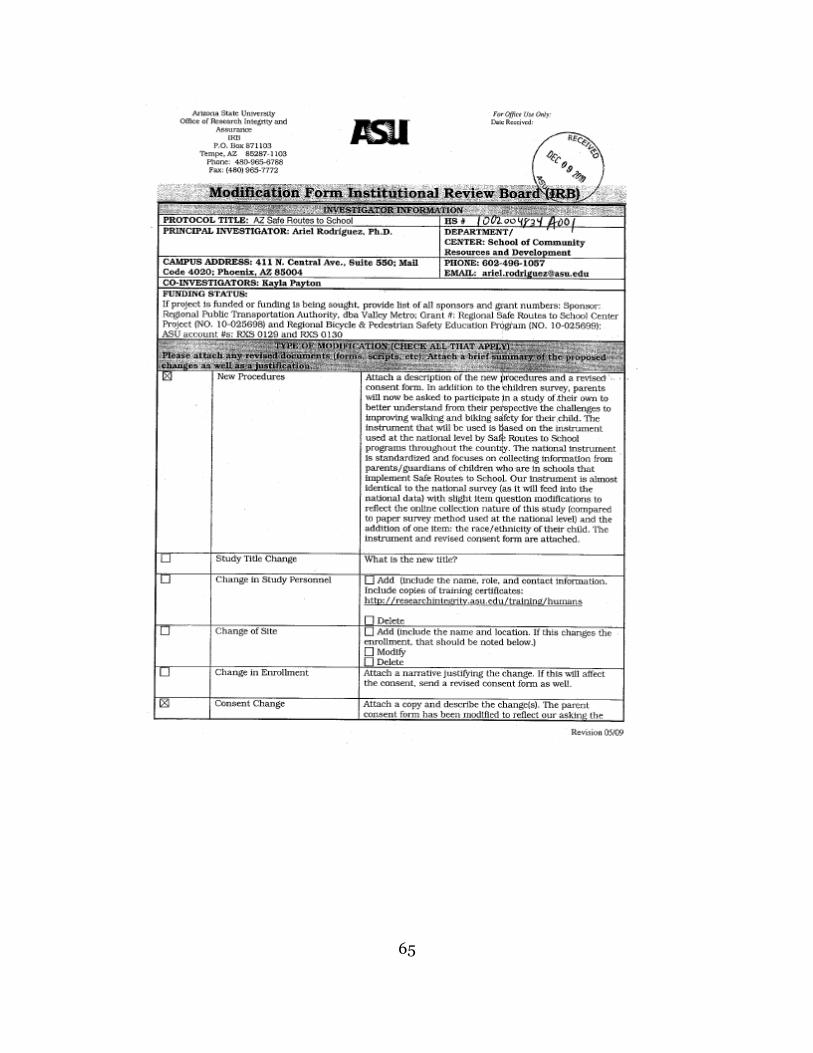
65

66
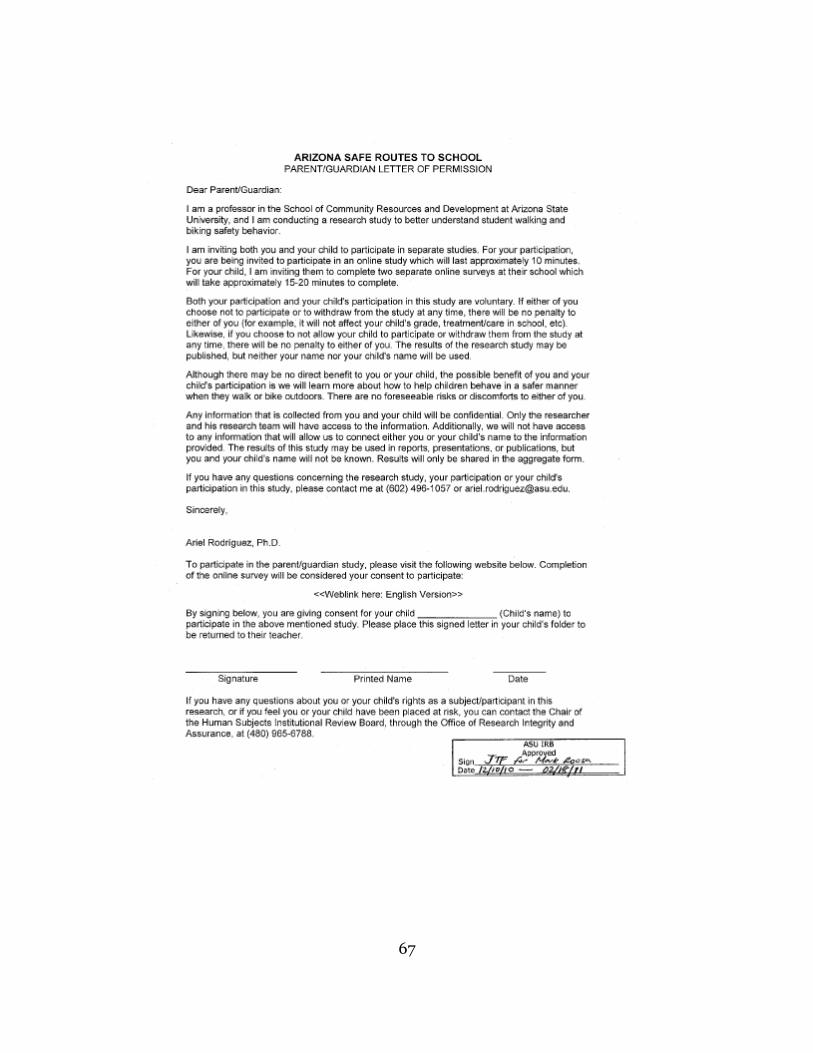
67

68
APPENDIX D
SELF-EFFICACY INVESTIGATION
69
Several avenues were explored in the pursuit of explaining the
counter-theoretical nature of self-efficacy in the model. These avenues
were outlier analysis, correlations between items, and items as individual
predictors.
Outlier Analysis
Case-wise diagnostics were run to find any data outside of 3
standard deviations, and none were found. There was one individual
outside of two standard deviations. That item was removed and a
regression analysis was conducted again, and the standardized regression
coefficient for the quadratic relationship of self-efficacy to intention
remained negative. Outliers are not an acceptable explanation of this
counter-theoretical nature.
Correlation between Items
The items concerning obeying traffic signs and signals and helmet
use are the only items significantly correlated with intention. All items are
significantly correlated with the helmet use item. The safe manner item is
only significantly correlated with helmet use. Correlations between items
can be seen in Table 5. Significant correlations have been flagged. These
correlations do not completely explain the nature of the self-efficacy
construct, but in combination with other factors, they might lend some
explanation.
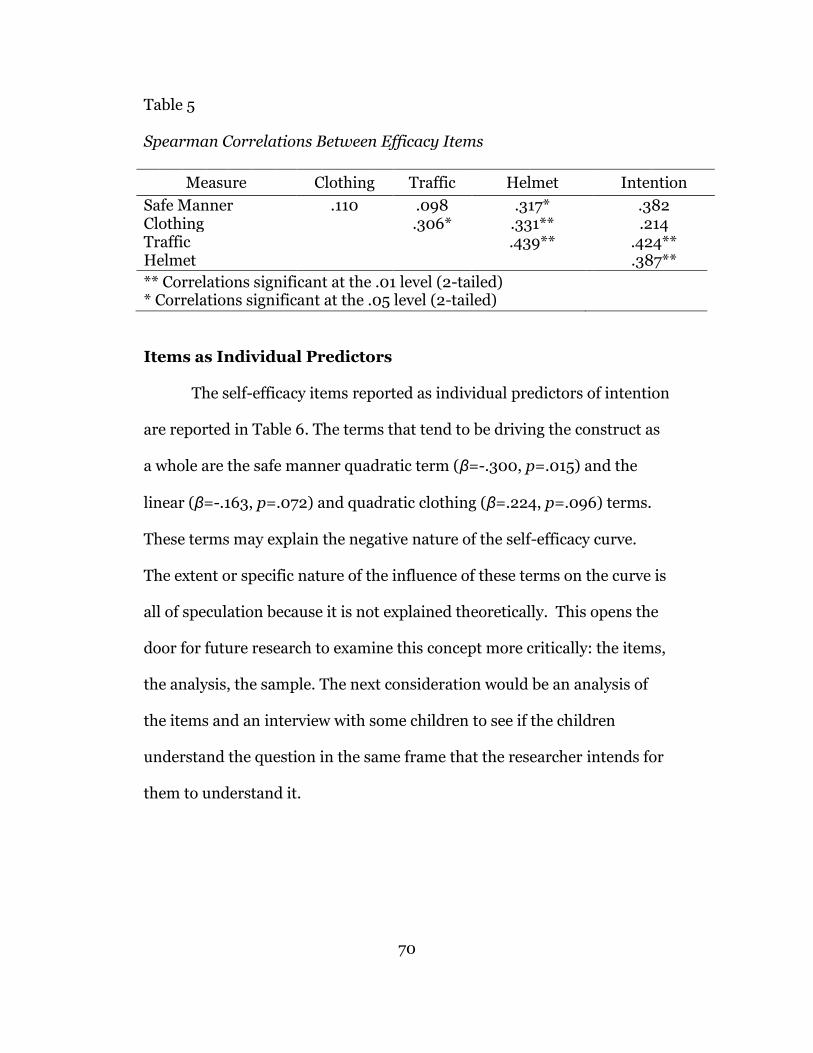
70
Table 5 Spearman Correlations Between Efficacy Items
Measure Clothing Traffic Helmet Intention
Safe Manner .110 .098 .317* .382 Clothing .306* .331** .214 Traffic .439** .424** Helmet .387**
** Correlations significant at the .01 level (2-tailed) * Correlations significant at the .05 level (2-tailed)
Items as Individual Predictors
The self-efficacy items reported as individual predictors of intention
are reported in Table 6. The terms that tend to be driving the construct as
a whole are the safe manner quadratic term (β=-.300, p=.015) and the
linear (β=-.163, p=.072) and quadratic clothing (β=.224, p=.096) terms.
These terms may explain the negative nature of the self-efficacy curve.
The extent or specific nature of the influence of these terms on the curve is
all of speculation because it is not explained theoretically. This opens the
door for future research to examine this concept more critically: the items,
the analysis, the sample. The next consideration would be an analysis of
the items and an interview with some children to see if the children
understand the question in the same frame that the researcher intends for
them to understand it.
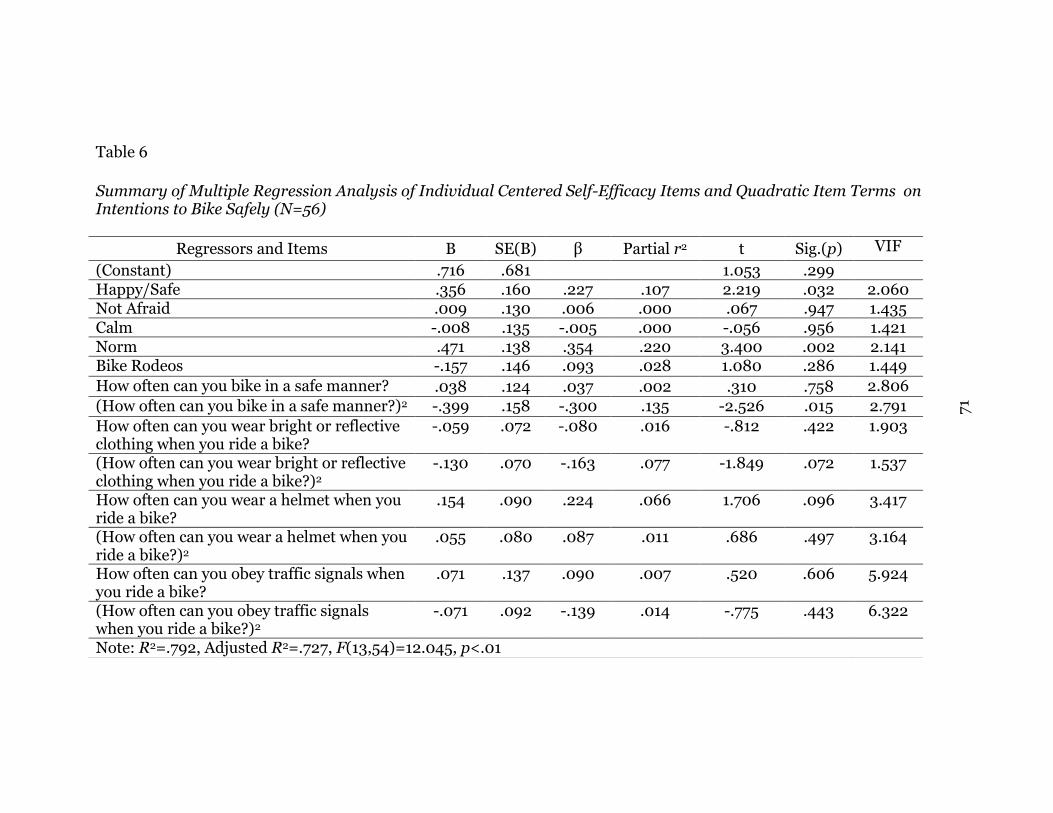
71
Table 6
Summary of Multiple Regression Analysis of Individual Centered Self-Efficacy Items and Quadratic Item Terms on Intentions to Bike Safely (N=56)
Regressors and Items B SE(B) β Partial r2 t Sig.(p) VIF
(Constant) .716 .681 1.053 .299 Happy/Safe .356 .160 .227 .107 2.219 .032 2.060 Not Afraid .009 .130 .006 .000 .067 .947 1.435 Calm -.008 .135 -.005 .000 -.056 .956 1.421 Norm .471 .138 .354 .220 3.400 .002 2.141 Bike Rodeos -.157 .146 .093 .028 1.080 .286 1.449
How often can you bike in a safe manner? .038 .124 .037 .002 .310 .758 2.806
(How often can you bike in a safe manner?)2 -.399 .158 -.300 .135 -2.526 .015 2.791
How often can you wear bright or reflective clothing when you ride a bike?
-.059 .072 -.080 .016 -.812 .422 1.903
(How often can you wear bright or reflective clothing when you ride a bike?)2
-.130 .070 -.163 .077 -1.849 .072 1.537
How often can you wear a helmet when you ride a bike?
.154 .090 .224 .066 1.706 .096 3.417
(How often can you wear a helmet when you ride a bike?)2
.055 .080 .087 .011 .686 .497 3.164
How often can you obey traffic signals when you ride a bike?
.071 .137 .090 .007 .520 .606 5.924
(How often can you obey traffic signals when you ride a bike?)2
-.071 .092 -.139 .014 -.775 .443 6.322
Note: R2=.792, Adjusted R2=.727, F(13,54)=12.045, p<.01

72
APPENDIX E
EXCLUDED REGRESSORS

73
A regression equation was explored that included ethnicity, gender,
age and grade. These items did not explain any additional variance of
intention to bike safely beyond the other predictors, and even the lack of
prediction was insignificant. Due to their poor predictive ability,
demographic variables were left out of the final model. The coefficients
and significance levels are recorded in Table 7.
Table 7
Summary of Multiple Regression Analysis of Mean Predictors on Intentions to Bike Safely (N=57)
Variable B SE(B) β Partial
r2 t Sig.(p)
(Constant) .446 .754 .591 .558
Happy/Safe .353 .164 .223 .095 2.147 .037
Not Afraid .081 .129 .053 .009 .631 .531
Calm -.108 .145 -.067 .013 -.746 .460
Norm .490 .124 .376 .262 3.959 .000
Self-Efficacy .365 .119 .336 .177 3.077 .004
Bike Rodeos .101 .132 .059 .013 .764 .449
Self-Efficacy2 -.351 .126 -.272 .150 -2.783 .008
Ethnicity -.015 .134 -.008 .000 -.110 .913
Gender .024 .134 .014 .000 .175 .862
Age .010 .128 .015 .000 .076 .940
Grade .005 .149 .007 .000 .036 .971
Interaction terms of bike rodeo participation with all other
sustained predictors were analyzed. The results can be seen in Table 8.
None of the interaction terms were significant nor did they lend any

74
explanation of the variance over 2% to the final model. Due to these
reasons, these variables were excluded.
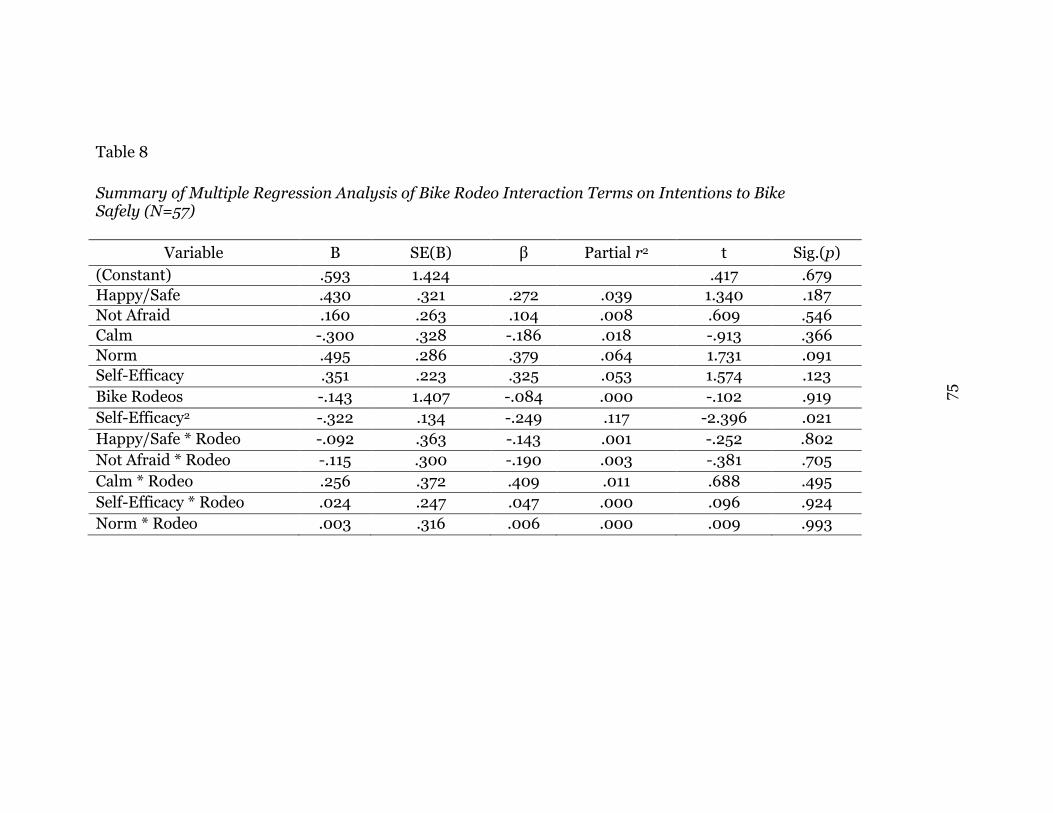
75
Table 8
Summary of Multiple Regression Analysis of Bike Rodeo Interaction Terms on Intentions to Bike Safely (N=57)
Variable B SE(B) β Partial r2 t Sig.(p)
(Constant) .593 1.424 .417 .679
Happy/Safe .430 .321 .272 .039 1.340 .187
Not Afraid .160 .263 .104 .008 .609 .546
Calm -.300 .328 -.186 .018 -.913 .366
Norm .495 .286 .379 .064 1.731 .091
Self-Efficacy .351 .223 .325 .053 1.574 .123
Bike Rodeos -.143 1.407 -.084 .000 -.102 .919
Self-Efficacy2 -.322 .134 -.249 .117 -2.396 .021
Happy/Safe * Rodeo -.092 .363 -.143 .001 -.252 .802
Not Afraid * Rodeo -.115 .300 -.190 .003 -.381 .705
Calm * Rodeo .256 .372 .409 .011 .688 .495
Self-Efficacy * Rodeo .024 .247 .047 .000 .096 .924
Norm * Rodeo .003 .316 .006 .000 .009 .993

76
APPENDIX F
ANALYSIS WITHOUT PILOT STUDY
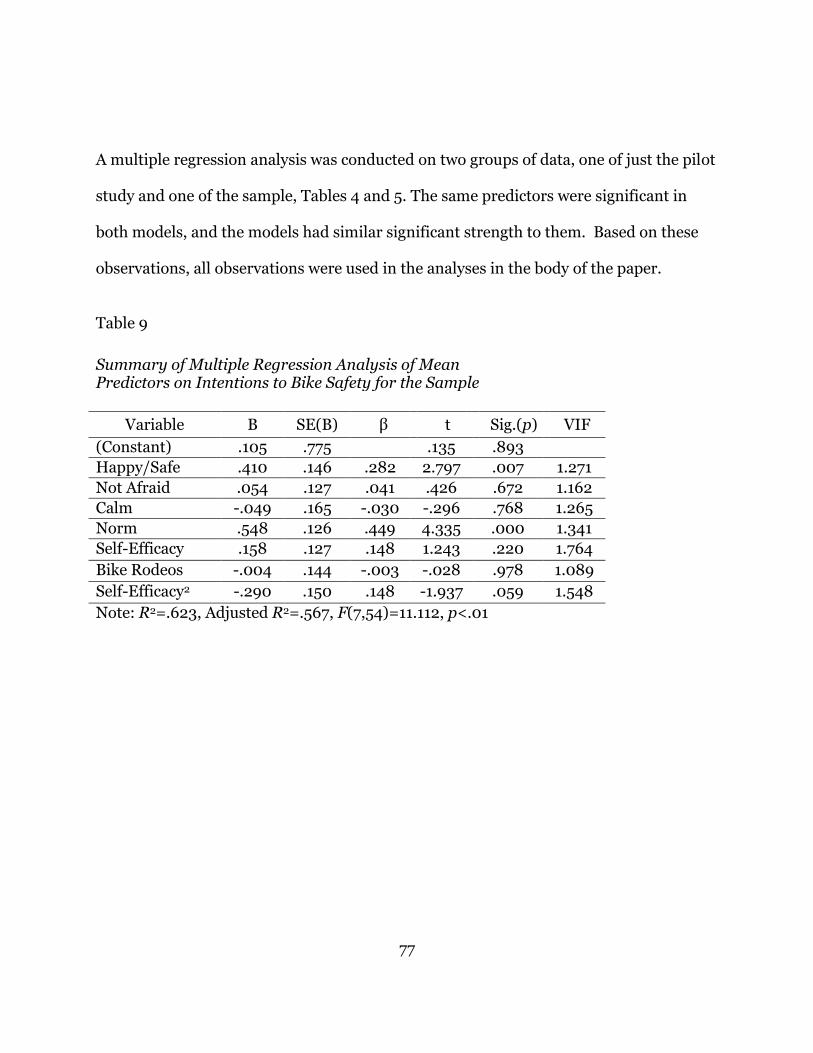
77
A multiple regression analysis was conducted on two groups of data, one of just the pilot
study and one of the sample, Tables 4 and 5. The same predictors were significant in
both models, and the models had similar significant strength to them. Based on these
observations, all observations were used in the analyses in the body of the paper.
Table 9
Summary of Multiple Regression Analysis of Mean Predictors on Intentions to Bike Safety for the Sample
Variable B SE(B) β t Sig.(p) VIF
(Constant) .105 .775 .135 .893
Happy/Safe .410 .146 .282 2.797 .007 1.271
Not Afraid .054 .127 .041 .426 .672 1.162
Calm -.049 .165 -.030 -.296 .768 1.265
Norm .548 .126 .449 4.335 .000 1.341
Self-Efficacy .158 .127 .148 1.243 .220 1.764
Bike Rodeos -.004 .144 -.003 -.028 .978 1.089
Self-Efficacy2 -.290 .150 .148 -1.937 .059 1.548
Note: R2=.623, Adjusted R2=.567, F(7,54)=11.112, p<.01
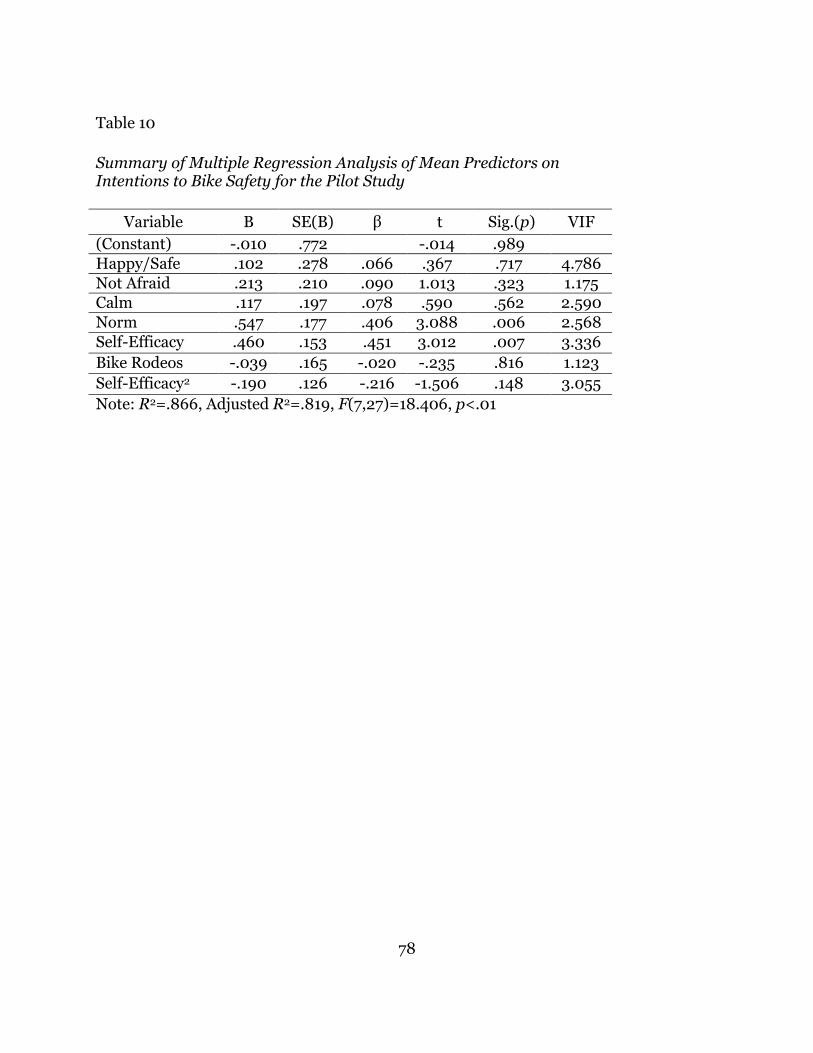
78
Table 10
Summary of Multiple Regression Analysis of Mean Predictors on Intentions to Bike Safety for the Pilot Study
Variable B SE(B) β t Sig.(p) VIF
(Constant) -.010 .772 -.014 .989
Happy/Safe .102 .278 .066 .367 .717 4.786
Not Afraid .213 .210 .090 1.013 .323 1.175
Calm .117 .197 .078 .590 .562 2.590
Norm .547 .177 .406 3.088 .006 2.568
Self-Efficacy .460 .153 .451 3.012 .007 3.336
Bike Rodeos -.039 .165 -.020 -.235 .816 1.123
Self-Efficacy2 -.190 .126 -.216 -1.506 .148 3.055
Note: R2=.866, Adjusted R2=.819, F(7,27)=18.406, p<.01