effects of air pollution on biomarkers of obesity and
TRANSCRIPT

Kelly J. Nabaglo Air Pollution Effects on Children’s Health Spring 2017
1
Effects of Air Pollution on Biomarkers of Obesity and
Oxidative Stress in Children from the San Joaquin Valley, CA
Kelly J. Nabaglo
ABSTRACT
Air pollution is widely known to contribute to the development of chronic health conditions, such as respiratory and cardiac diseases, through mechanisms involving oxidative stress and inflammation. However, its effects on obesity, a prevalent health disorder defined by excess accumulation of body fat and oxidative stress, have yet to be extensively reviewed. Adipose tissue secretes adipokines, including adiponectin and leptin, which have inflammatory and hormonal functions contributing to increased levels of reactive oxygen species. Imbalance of these reactive oxygen species, or oxidative stress, can be measured via isoprostanes, providing insight into the relationship between pollutant exposure and obesity outcomes. This project aims to analyze the biomarkers of obesity and oxidative stress in order to determine the influence of air pollution in a cohort of children (N=210) living in the San Joaquin Valley, CA, an area with notoriously high levels of pollution. Urinary isoprostane and plasma leptin and adiponectin were quantified using enzyme-linked immunosorbent assays (ELISAs). Findings showed that leptin levels are positively and adiponectin levels are negatively associated with BMI (p<0.001). Isoprostane was found to be positively associated with daily PAH exposure (p=0.03) and with weekly PAH exposure (p=0.04). These results demonstrate that weight status is related to adipokines concentrations. Furthermore, air pollution exposure may influence oxidative stress and weight status, suggesting the need for further investigation of the role of air pollution in affecting biomarkers of obesity and oxidative stress and the development of obesity.
KEYWORDS
adipokines, Children’s Health and Air Pollution Study (CHAPS), isoprostane, ambient air
pollution, oxidative stress, obesity
Kelly J. Nabaglo Air Pollution Effects on Children’s Health Spring 2017
2
INTRODUCTION
The health effects of ambient air pollution have been the target of much scientific inquiry.
Worldwide, air pollution is estimated to be responsible for several millions of deaths per year,
most of which are attributed to cardiovascular causes (Miller 2014). Short term exposure to
airborne pollutants has increased hospital admissions and doctors visits for respiratory and
cardiovascular illnesses in adults, as well as diagnoses of respiratory and pulmonary dysfunction
in children (Katsouyanni et al. 1996, Chan-Yeung 2000, Padula et al. 2015). Such outcomes
resonate especially in the San Joaquin Valley (SJV) of California, a region where air pollution
concentrations are regularly above federal clean air standards and youth experience some of the
highest asthma rates in the nation (Central California Asthma Collaborative n.d., US EPA n.d.).
The social, economic and environmental factors classify the SJV as highly subject to
environmental hazards, health risks, concentrated poverty, which together result in social
vulnerability (Huang and London 2012).
Considering that many pollutants are potent oxidants (Lodovici and Bigagli 2011),
potential mechanisms of the aforementioned health effects involve oxidative stress and
inflammation. This is supported by studies reporting that ambient levels of particulate matter 2.5
(PM2.5) and benzopyrene (a polycyclic aromatic hydrocarbon (PAH)) were significant
predictors of oxidative stress in a cohort of mothers and newborns (Ambroz et al. 2016). My
study aims to examine the health implications of air pollution exposure with oxidative stress
serving as a mechanistic link between the environmental pollutant and the health outcome.
Like air pollution, obesity poses a major public health issue, affecting approximately one
in six children in the United States (Ogden et al. 2012). Obesity is characterized by an increase in
body weight and excessive accumulation of adipose tissue due to an energy imbalance
(Marseglia et al. 2014). Factors that influence this balance include genetics, dietary habits,
geographical location, social behavior and socioeconomic status (“Clinical Guidelines on the
Identification, Evaluation, and Treatment of Overweight and Obesity in Adults: The Evidence
Report - NHLBI, NIH” n.d.). Obesity is further characterized by a state of chronic inflammation
(Marseglia et al. 2014). This inflammation can come about in two ways; first, obesity promotes
the inflammation of adipose tissue through lipid peroxidation, which is modulated by adipokine
hormones (Bouloumié et al. 1999, Nakanishi et al. 2005). Alternatively, initial weight gain
Kelly J. Nabaglo Air Pollution Effects on Children’s Health Spring 2017
3
triggers an inflammatory response and prompts macrophages to infiltrate adipose tissue, directly
contributing to and perpetuating the inflammatory state of fat (Weisberg et al. 2003, Johnson et
al. 2012). Given the prevalence of obesity, there is a need to better understand its causes.
Inflammation resulting from oxidative stress, or the imbalance of free radical production
and the body’s ability to counter these molecules’ harmful effect, may serve as a link between
exposure to air pollutants and the development of obesity. Epidemiological evidence suggests
that air pollution is a risk factor for childhood obesity, and that markers of ambient air pollution
are associated with biomarkers of oxidative stress (Li et al. 2016, Wei et al. 2016). Obesity may
be mediated by an inflammatory response triggered by pollutants (Xu et al. 2010, Møller et al.
2014). This study relies on the measurement of leptin, adiponectin and isoprostane; the former
two are hormones produced by adipose tissue that can be used to characterize obesity status.
Leptin is known to regulate satiety through communication with the hypothalamus, and increases
in proportion to body fat content (Moran and Phillip 2003, Volberg 2013). Adiponectin serves in
the regulation of blood glucose levels and combats free radical production from lipid
peroxidation (Behre 2007). Generally, adiponectin decreases alongside body fat (Cnop et al.
2003, Volberg 2013). Isoprostane is a class of products formed by the free radical-catalyzed
peroxidation of arachidonic acid (Montuschi et al. 2004). Isoprostane is one of the most reliable
indicators of oxidative stress in vivo, and can serve as a proxy of total oxidative stress
measurement (Roberts II and Morrow 2000, Montuschi et al. 2000). Studying these biomarkers
can therefore provide valuable insight into the relationship between ambient pollution exposure
and obesity development.
Air pollution has known influence on public health, particularly respiratory and cardiac
health, and may have impacts on the development of obesity. As obesity is related to chronic
inflammation and oxidative stress, isoprostane can serve as a useful biomarker and mediate a
causal pathway between air pollution exposure and obesity development. This research addresses
this little-studied intersection between ambient air pollution and obesity using biological samples
from child participants in the Children’s Health and Air Pollution Study (CHAPS) and the
Children’s Environmental Health Center at the University of California, Berkeley and Stanford
University (PI-Hammond). This research seeks to: characterize the cohort by determining of the
effect of age on isoprostane and identifying any sex differences for isoprostane; assess the
relationship between isoprostane and weight status; evaluate the relationship between isoprostane

Kelly J. Nabaglo Air Pollution Effects on Children’s Health Spring 2017
4
and air pollution exposure; and evaluate the relationship between weight status and air pollution
exposure.
METHODS
Study design and population
The Children’s Health and Air Pollution Study (CHAPS) is a longitudinal study
examining the effects of ambient air pollution on allergic disorders and metabolic syndrome. The
objectives of the study are focused on immune- and metabolism-related health outcomes. In
order to investigate the impact of air pollution on immune function and metabolism, CHAPS
uses a “piece-wise natural history” design in their longitudinal study (Mann n.d.). All study
subjects are recruited into one of three cohorts, with each representing a different age group:
infants (20th week of pregnancy-2 years old), children (6-9 years old), and adolescents and young
adults (12-23 years old). This project is focused on analyses in children, since is known that they
are most susceptible to air pollutants (Committee on Environmental Health 2004).
Subjects for this project included 210 participants from the San Joaquin Valley, CA - an
area known to have high air pollution and high social vulnerability (Huang and London 2012).
All participants speak and are literate in English or Spanish, are currently non-smokers, and do
not have a history of autoimmune disease, HIV, or cancer. Assessments from a single visit at
UCSF Fresno Clinical Research Center were performed for this cohort. Urine, buccal cells, and
50 ml of blood were collected from each participant during the single visit. Anthropometry was
collected, and a baseline interview and questionnaires were administered in order to obtain
baseline historical, dietary, and residential information.
Air pollution exposure data
Hourly, quality-assured, ambient air quality and meteorological data collected at the
Fresno “Supersite” were obtained from California Air Resources Board (Watson et al. 2000).
Daily pollutant exposures were assigned to participants based on measurements at the Supersite.
We used the average 24-hour exposure for the day of the subjects’ visit and the average exposure
Kelly J. Nabaglo Air Pollution Effects on Children’s Health Spring 2017
5
values during the 1-week and 12 months prior to the visit for PM2.5 mass (micrograms per cubic
meter), elemental carbon (EC; micrograms per cubic meter), and PAH456 (nanograms per cubic
meter). Black carbon (BC) was determined from aethalometer (model AE42; Magee Scientific,
Berkeley, CA) measurements of the optical absorption of PM2.5 ambient aerosol at 880 nm. EC
concentrations were estimated from these BC measurements (EC = 1.19 × BC) (Chow et al.
1993). Pollutant data were subject to checks for quality assurance, including range checks,
comparison of values at nearby monitoring sites, and consistency with historical temporal and/or
diurnal patterns for each pollutant.
Anthropometric data
Individual height and weight for each participant were measured according to the
NHANES Anthropometry Protocol. Height, without shoes, was measured in meters using a
stadiometer with a fixed vertical backboard and adjustable headpiece. Weight was measured in
kilograms using a Tanita scale. All measurements were measured in duplicate or triplicate and
averaged. The averaged values were used to calculate body mass index (BMI) in weight (kg) /
[height (m)]2. Children were categorized into weight status categories (underweight, normal,
overweight, and obese) according to their BMI percentile rankings using age-specific and
gender-specific BMI cutoffs from the 2000 Center for Disease Control and Prevention child
growth charts and NHANES growth curves.
Adipokine data
Whole blood samples from participants were collected and processed by field personnel.
Plasma samples were aliquoted and stored at -80ºC until analysis at the Center for Environmental
Research and Children’s Health (CERCH). Adiponectin and leptin concentrations were
measured using RayBio® Human Adiponection and RayBio® Human Leptin ELISA kits,
respectively. For leptin analysis, plasma was diluted further than recommended in the standard
protocol provided by RayBio® for a wider range of detection. Final dilutions for adiponectin and
leptin were 1:30,000 and 1:70, respectively. The same internal controls were included on each
Kelly J. Nabaglo Air Pollution Effects on Children’s Health Spring 2017
6
plate for quality assurance and reproducibility between each experimental run. All samples were
run in duplicate to ensure accuracy of results. Analysis used averaged paired measurements.
Isoprostane data
Urine samples from all participants were collected and stored at -80ºC until analysis at
the CERCH. 15-isoprostane2t concentrations were measured using Oxford Biomedical Research®
Urinary Isoprostane ELISA kits. The same internal controls were included on each plate for
quality assurance and reproducibility between each experimental run, and all samples were run in
duplicate in order to assure accuracy of the results. Paired values were averaged for analysis.
Creatinine was also measured using Oxford Biomed Creatinine Microplate assays. Isoprostane
concentrations were normalized in order to adjust for urinary dilution by dividing isoprostane
values (ng/mL) by creatinine values (mg/dL).
Statistical analysis
Prior to analyses, leptin, adiponectin and isoprostane values were log transformed in
order to achieve a normal distribution because these values were right-skewed. BMI values are
represented by the BMI percentile of each participant for comparability between ages and sexes.
Simple linear regressions were used to characterize associations between age and biomarker
concentration. T-tests were used to examine differences in biomarker concentration by sex.
Differences in biomarker concentration by participant’s weight status were examined through
analyses of variance (ANOVAs). Linear regressions were performed to assess associations
between biomarker concentration and BMI. Additional regressions were used to examine the
relationship between concentrations of biomarkers and each pollutant of interest, as well as the
associations between BMI and each pollutant of interest. Stata Version 12.1 was used to conduct
statistical analyses. A statistical significance level of p<0.05 was used.
Kelly J. Nabaglo Air Pollution Effects on Children’s Health Spring 2017
7
RESULTS
Cohort summary
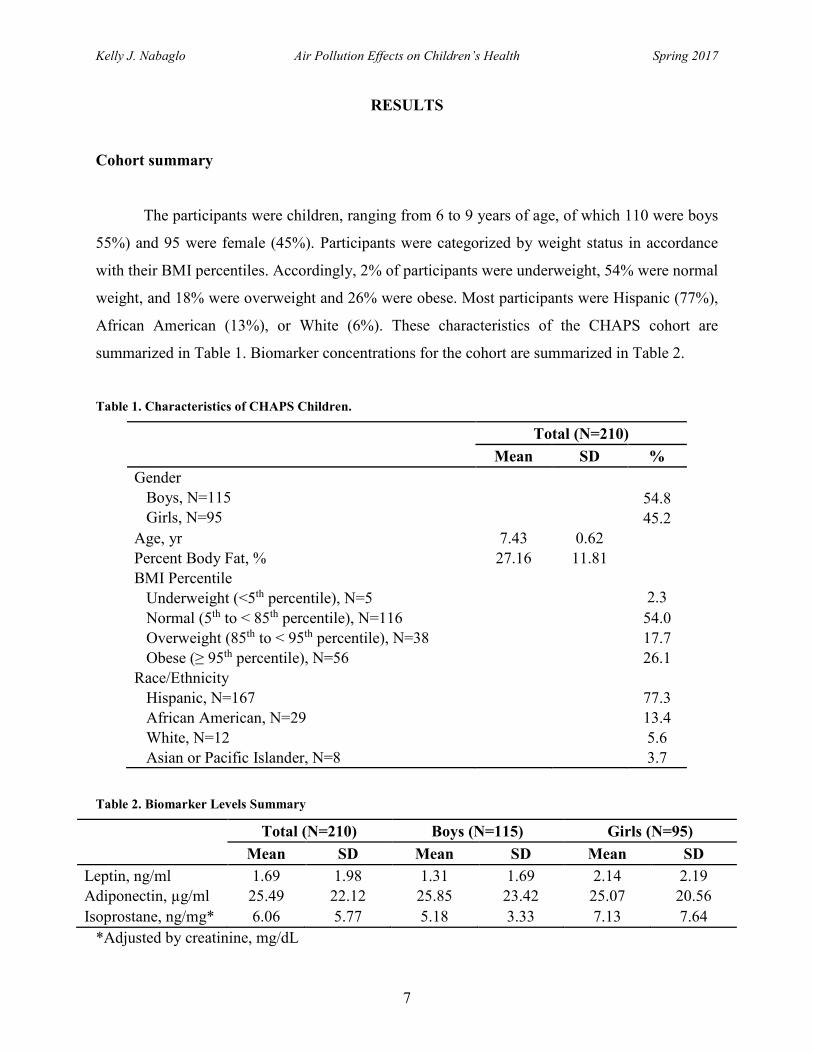
The participants were children, ranging from 6 to 9 years of age, of which 110 were boys
55%) and 95 were female (45%). Participants were categorized by weight status in accordance
with their BMI percentiles. Accordingly, 2% of participants were underweight, 54% were normal
weight, and 18% were overweight and 26% were obese. Most participants were Hispanic (77%),
African American (13%), or White (6%). These characteristics of the CHAPS cohort are
summarized in Table 1. Biomarker concentrations for the cohort are summarized in Table 2.
Table 1. Characteristics of CHAPS Children.
Total (N=210) Mean SD % Gender Boys, N=115 54.8 Girls, N=95 45.2 Age, yr 7.43 0.62
Percent Body Fat, % 27.16 11.81
BMI Percentile
Underweight (<5th percentile), N=5 2.3 Normal (5th to < 85th percentile), N=116 54.0 Overweight (85th to < 95th percentile), N=38 17.7 Obese (≥ 95th percentile), N=56 26.1 Race/Ethnicity
Hispanic, N=167 77.3
African American, N=29 13.4
White, N=12 5.6
Asian or Pacific Islander, N=8 3.7
Table 2. Biomarker Levels Summary
Total (N=210) Boys (N=115) Girls (N=95) Mean SD Mean SD Mean SD Leptin, ng/ml 1.69 1.98 1.31 1.69 2.14 2.19 Adiponectin, µg/ml 25.49 22.12 25.85 23.42 25.07 20.56 Isoprostane, ng/mg* 6.06 5.77 5.18 3.33 7.13 7.64
*Adjusted by creatinine, mg/dL
Kelly J. Nabaglo Air Pollution Effects on Children’s Health Spring 2017
8
Biomarker inter-relationships
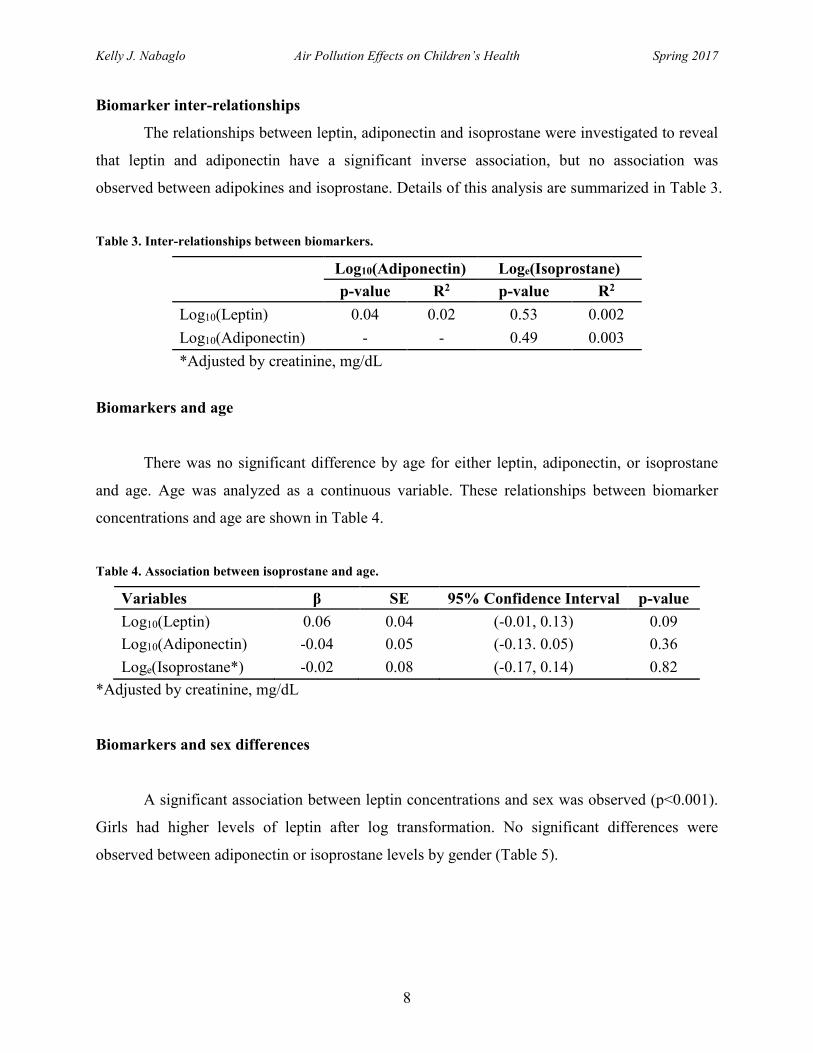
The relationships between leptin, adiponectin and isoprostane were investigated to reveal
that leptin and adiponectin have a significant inverse association, but no association was
observed between adipokines and isoprostane. Details of this analysis are summarized in Table 3.
Table 3. Inter-relationships between biomarkers.
Log10(Adiponectin) Loge(Isoprostane) p-value R2 p-value R2 Log10(Leptin) 0.04 0.02 0.53 0.002 Log10(Adiponectin) - - 0.49 0.003 *Adjusted by creatinine, mg/dL
Biomarkers and age
There was no significant difference by age for either leptin, adiponectin, or isoprostane
and age. Age was analyzed as a continuous variable. These relationships between biomarker
concentrations and age are shown in Table 4.
Table 4. Association between isoprostane and age.
Variables β SE 95% Confidence Interval p-value Log10(Leptin) 0.06 0.04 (-0.01, 0.13) 0.09 Log10(Adiponectin) -0.04 0.05 (-0.13. 0.05) 0.36 Loge(Isoprostane*) -0.02 0.08 (-0.17, 0.14) 0.82
*Adjusted by creatinine, mg/dL
Biomarkers and sex differences
A significant association between leptin concentrations and sex was observed (p<0.001).
Girls had higher levels of leptin after log transformation. No significant differences were
observed between adiponectin or isoprostane levels by gender (Table 5).

Kelly J. Nabaglo Air Pollution Effects on Children’s Health Spring 2017
9
Table 5. Biomarkers by sex of children.
Boys (N=115) Girls (N=95) Variables Mean SD Mean SD p-value Log10(Leptin) -0.003 0.26 0.18 0.33 <0.001 Log10(Adiponectin) 1.24 0.41 1.25 0.39 0.98 Loge(Isoprostane*) 1.18 0.70 1.13 0.72 0.57
*Adjusted by creatinine, mg/dL
Biomarkers and BMI
Significant associations between leptin and adiponectin concentration and BMI category
were observed (p<0.001 for both), but this was not the case for isoprostane (p=0.78) (Table 6).
Table 6. Distributions of leptin, adiponectin, and isoprostane by weight group.
Underweight (N=5)
Normal (N=116)
Overweight (N=38) Obese (N=56)
Variables Mean SD Mean SD Mean SD Mean SD p-value
Leptin, ng/ml 0.60 0.08 0.89 0.32 1.26 0.70 3.79 3.00 <0.001 Adiponectin, µg/ml 20.71 13.42 29.49 22.29 23.00 23.09 18.48 19.99 <0.001
Isoprostane, ng/mg* 5.27 2.87 5.59 4.00 5.70 3.50 7.47 9.41 0.78
*Adjusted by creatinine, mg/dL
Normal weight children had average leptin values of 0.89 ng/mL, while overweight
participants averaged 1.26 ng/mL, and obese 3.79 ng/mL. The positive relationship between
leptin and BMI category is illustrated in Figure 1.

Kelly J. Nabaglo Air Pollution Effects on Children’s Health Spring 2017
10
Figure 1. Association between leptin and BMI category (underweight/normal/overweight/obese).
Normal weight individuals had average adiponectin values of 29.49 ug/mL, overweight
individuals had values averaging 23.00 ug/mL, and obese individuals had values averaging 18.48
ug/mL. This negative association between adiponectin and weight status is illustrated in Figure 2.
Figure 2. Association between adiponectin and BMI category (underweight/normal/overweight/obese).

Kelly J. Nabaglo Air Pollution Effects on Children’s Health Spring 2017
11
BMI was also evaluated as a continuous variable. Findings of this analysis similarly
revealed a positive association between leptin and BMI (p<0.001) and a negative association
between adiponectin and BMI (p=0.01). No significant relationship between isoprostane and
BMI was found. Results are shown in Table 7.
Table 7. Associations between biomarkers and BMI.
Total Boys Girls Variables β p-value β p-value β p-value Log10(Leptin) 0.01 <0.001* 0.005 <0.001* 0.007 <0.001* Log10(Adiponectin) -0.003 0.01* -0.002 0.25 -0.004 0.02* Loge(Isoprostane) 0.002 0.40 -0.001 0.78 0.004 0.13
Biomarkers and air pollution exposure
The relationship between leptin, adiponectin and isoprostane concentrations and air
pollution exposure are summarized in Tables 8-10. Significant relationships were observed
between isoprostane and daily PAH exposure, and isoprostane and weekly PAH exposure.
Table 8. Association between biomarkers and polycyclic aromatic hydrocarbon (PAH) exposure.
PAH Mean Day-of Exposure (ng/m3) Total Boys Girls
Variables β p-value β p-value β p-value
Log10(Leptin) -0.58 0.57 -0.90 0.56 -1.05 0.50
Log10(Adiponectin) 0.26 0.74 1.00 0.31 -0.68 0.59
Loge(Isoprostane) 0.95 0.03* 0.74 0.23 1.11 0.08
PAH Mean Week Exposure (ng/m3) Total Boys Girls
Variables β p-value β p-value β p-value
Log10(Leptin) -0.83 0.44 -0.74 0.68 -1.17 0.43
Log10(Adiponectin) 1.05 0.20 1.90 0.09 -0.03 0.98
Loge(Isoprostane) 0.97 0.04* 0.91 0.19 1.08 0.08
PAH Mean Year Exposure (ng/m3) Total Boys Girls
Variables β p-value β p-value β p-value
Log10(Leptin) -0.06 0.54 0.05 0.74 -0.02 0.26
Log10(Adiponectin) 0.07 0.37 0.06 0.54 0.08 0.51
Loge(Isoprostane) -0.07 0.11 -0.11 0.07 -0.03 0.65
Kelly J. Nabaglo Air Pollution Effects on Children’s Health Spring 2017
12
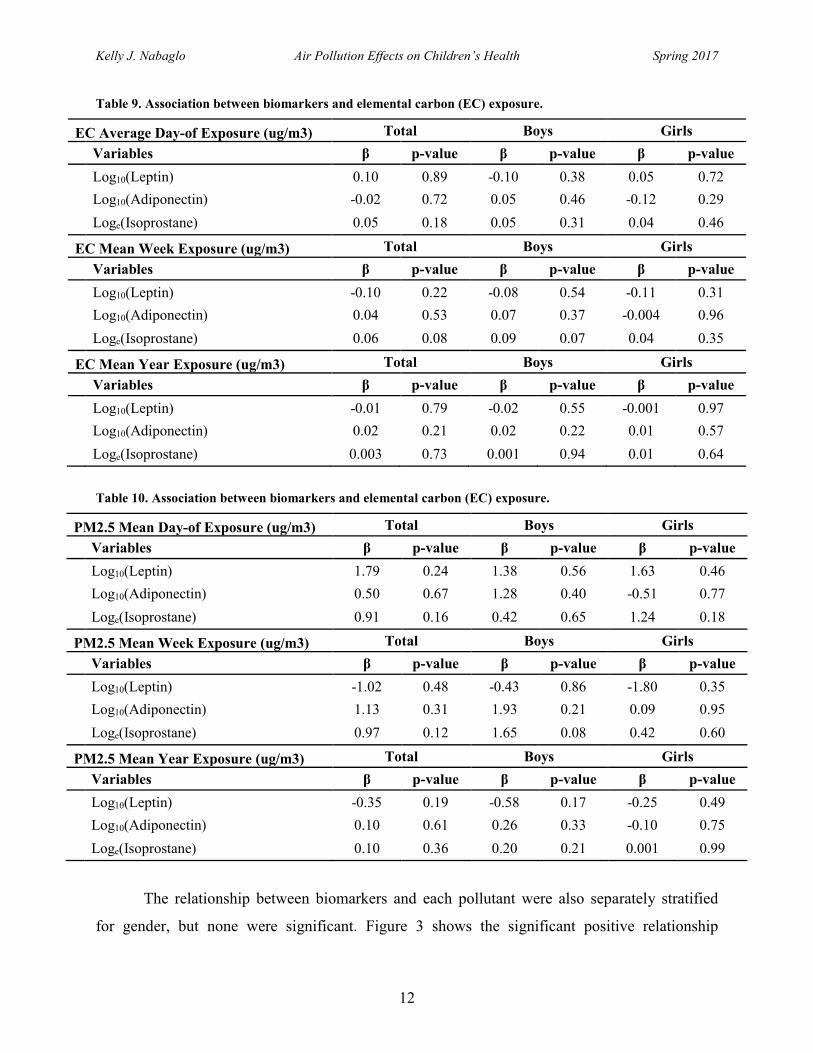
Table 9. Association between biomarkers and elemental carbon (EC) exposure.
EC Average Day-of Exposure (ug/m3) Total Boys Girls Variables β p-value β p-value β p-value
Log10(Leptin) 0.10 0.89 -0.10 0.38 0.05 0.72
Log10(Adiponectin) -0.02 0.72 0.05 0.46 -0.12 0.29
Loge(Isoprostane) 0.05 0.18 0.05 0.31 0.04 0.46
EC Mean Week Exposure (ug/m3) Total Boys Girls Variables β p-value β p-value β p-value
Log10(Leptin) -0.10 0.22 -0.08 0.54 -0.11 0.31
Log10(Adiponectin) 0.04 0.53 0.07 0.37 -0.004 0.96
Loge(Isoprostane) 0.06 0.08 0.09 0.07 0.04 0.35
EC Mean Year Exposure (ug/m3) Total Boys Girls Variables β p-value β p-value β p-value
Log10(Leptin) -0.01 0.79 -0.02 0.55 -0.001 0.97
Log10(Adiponectin) 0.02 0.21 0.02 0.22 0.01 0.57
Loge(Isoprostane) 0.003 0.73 0.001 0.94 0.01 0.64
Table 10. Association between biomarkers and elemental carbon (EC) exposure.
PM2.5 Mean Day-of Exposure (ug/m3) Total Boys Girls Variables β p-value β p-value β p-value
Log10(Leptin) 1.79 0.24 1.38 0.56 1.63 0.46
Log10(Adiponectin) 0.50 0.67 1.28 0.40 -0.51 0.77
Loge(Isoprostane) 0.91 0.16 0.42 0.65 1.24 0.18
PM2.5 Mean Week Exposure (ug/m3) Total Boys Girls Variables β p-value β p-value β p-value
Log10(Leptin) -1.02 0.48 -0.43 0.86 -1.80 0.35
Log10(Adiponectin) 1.13 0.31 1.93 0.21 0.09 0.95
Loge(Isoprostane) 0.97 0.12 1.65 0.08 0.42 0.60
PM2.5 Mean Year Exposure (ug/m3) Total Boys Girls Variables β p-value β p-value β p-value
Log10(Leptin) -0.35 0.19 -0.58 0.17 -0.25 0.49
Log10(Adiponectin) 0.10 0.61 0.26 0.33 -0.10 0.75
Loge(Isoprostane) 0.10 0.36 0.20 0.21 0.001 0.99
The relationship between biomarkers and each pollutant were also separately stratified
for gender, but none were significant. Figure 3 shows the significant positive relationship

Kelly J. Nabaglo Air Pollution Effects on Children’s Health Spring 2017
13
between isoprostane levels and daily polycyclic aromatic hydrocarbon exposure (p=0.03). Figure
4 illustrates similar positive associations between isoprostane and weekly PAH exposure
(p=0.04).
Figure 3. Association between isoprostane and daily PAH exposure.
Figure 4. Association between isoprostane and weekly PAH exposure.

Kelly J. Nabaglo Air Pollution Effects on Children’s Health Spring 2017
14
Air pollution exposure and BMI
Exposure was analyzed as a continuous variable. Regression analysis of air pollution
exposure and BMI (also treated as a continuous variable) found that there was an association
between annual PM2.5 exposure and BMI (p=0.02). This is shown in Figure 5.
Figure 5. Association between annual PM2.5 exposure and BMI.
Analysis by gender revealed that BMI is associated with annual PM2.5 exposure in boys
only (Figure 6). Results for measures of pollution exposure and BMI are presented in Table 11.
Figure 6. Association between annual PM2.5 exposure and BMI by gender.

Kelly J. Nabaglo Air Pollution Effects on Children’s Health Spring 2017
15
Table 11. Associations between air pollution exposure and BMI.
PAH (ng/m3) Total Boys Girls Variables, Mean β p-value β p-value β p-value Day-of exposure 0.01 0.43 0.003 0.85 0.01 0.39 Week 0.01 0.43 0.01 0.58 0.01 0.56 Year 0.001 0.32 0.001 0.35 0.001 0.63 EC (ug/m3) Total Boys Girls Variables, Mean β p-value β p-value β p-value Day-of exposure 0.00004 0.99 -0.001 0.17 0.001 0.28 Week -0.0001 0.88 0.00 0.88 0.00001 0.99 Year 0.0003 0.21 0.0001 0.73 0.0004 0.16 PM2.5 (ug/m3) Total Boys Girls Variables, Mean β p-value β p-value β p-value Day-of exposure 0.01 0.55 -0.01 0.82 0.02 0.30 Week -0.01 0.54 -0.01 0.69 -0.01 0.66 Year -0.01 0.02* -0.01 0.009* -0.003 0.49
DISCUSSION
Biomarkers of obesity and oxidative stress were analyzed to assess the relationship with
exposure to air pollutants of interest, including polycyclic aromatic hydrocarbons, elemental
carbon, and particulate matter, and associations with obesity, along with host factors such as age
and sex. Leptin, adiponectin and isoprostane were not associated with age in this cohort of
CHAPS children. Leptin levels were significantly higher in girls, and both leptin and adiponectin
were found to have positive and negative relationships with BMI/BMI category, respectively.
Isoprostane did not differ by sex, weight group status, or BMI. Associations between isoprostane
and air pollution were observed specifically for both daily and weekly polycyclic aromatic
hydrocarbon exposure. Moreover, investigation of air pollution exposures and BMI found that
BMI and annual particulate matter 2.5 exposure were associated. This relationship was
significant in boys only, and unexpectedly in the negative direction. These findings may be
attributed to oxidative stress resulting from any number of stressors, as well as the process of
lipid peroxidation caused by excess body fat, both of which warrant further exploration. It is
important to note that these stressors may include ambient air pollutants of interest in this study
Kelly J. Nabaglo Air Pollution Effects on Children’s Health Spring 2017
16
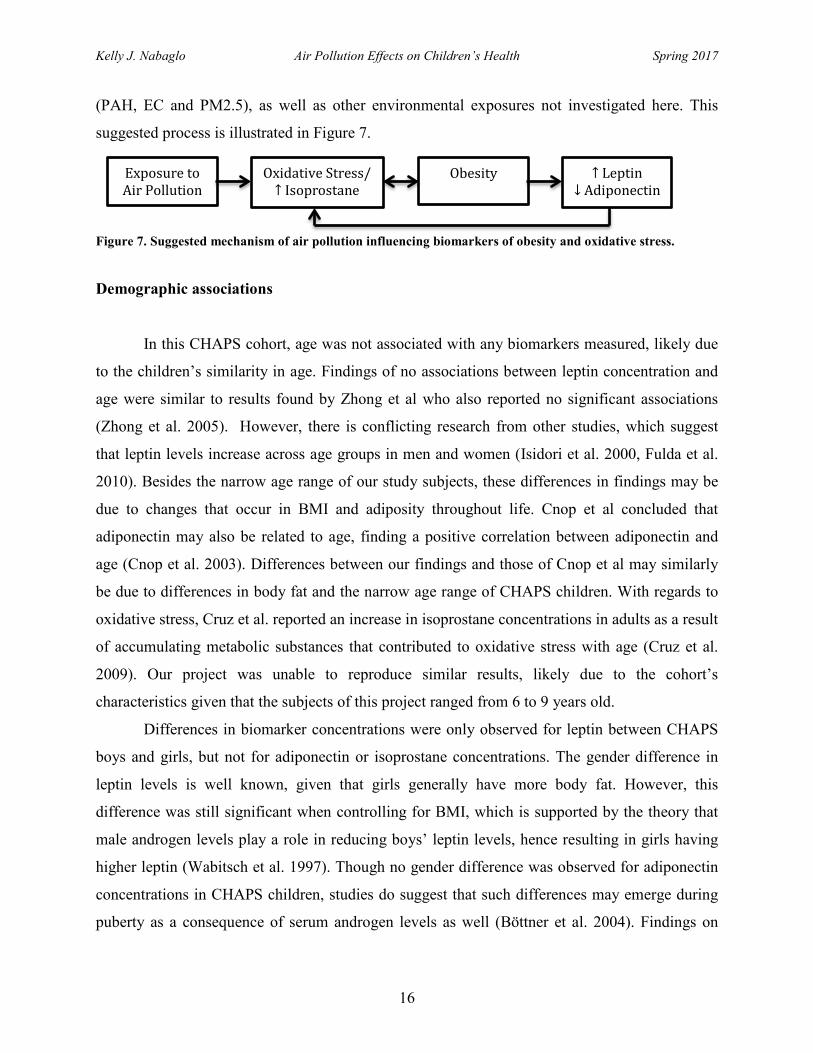
(PAH, EC and PM2.5), as well as other environmental exposures not investigated here. This
suggested process is illustrated in Figure 7.
Figure 7. Suggested mechanism of air pollution influencing biomarkers of obesity and oxidative stress.
Demographic associations
In this CHAPS cohort, age was not associated with any biomarkers measured, likely due
to the children’s similarity in age. Findings of no associations between leptin concentration and
age were similar to results found by Zhong et al who also reported no significant associations
(Zhong et al. 2005). However, there is conflicting research from other studies, which suggest
that leptin levels increase across age groups in men and women (Isidori et al. 2000, Fulda et al.
2010). Besides the narrow age range of our study subjects, these differences in findings may be
due to changes that occur in BMI and adiposity throughout life. Cnop et al concluded that
adiponectin may also be related to age, finding a positive correlation between adiponectin and
age (Cnop et al. 2003). Differences between our findings and those of Cnop et al may similarly
be due to differences in body fat and the narrow age range of CHAPS children. With regards to
oxidative stress, Cruz et al. reported an increase in isoprostane concentrations in adults as a result
of accumulating metabolic substances that contributed to oxidative stress with age (Cruz et al.
2009). Our project was unable to reproduce similar results, likely due to the cohort’s
characteristics given that the subjects of this project ranged from 6 to 9 years old.
Differences in biomarker concentrations were only observed for leptin between CHAPS
boys and girls, but not for adiponectin or isoprostane concentrations. The gender difference in
leptin levels is well known, given that girls generally have more body fat. However, this
difference was still significant when controlling for BMI, which is supported by the theory that
male androgen levels play a role in reducing boys’ leptin levels, hence resulting in girls having
higher leptin (Wabitsch et al. 1997). Though no gender difference was observed for adiponectin
concentrations in CHAPS children, studies do suggest that such differences may emerge during
puberty as a consequence of serum androgen levels as well (Böttner et al. 2004). Findings on
Exposure to Air Pollution
Oxidative Stress/ ↑ Isoprostane
Obesity ↑ Leptin ↓ Adiponectin

Kelly J. Nabaglo Air Pollution Effects on Children’s Health Spring 2017
17
isoprostanes and gender contribute to a body of conflicting literature. For example, in contrast to
the Ide et al. report that females had lower levels of isoprostane and other oxidative stress
markers in their plasma than males, Helmersson et al. reported significantly higher levels of the
same biomarkers in females (Helmersson et al. 2002, Ide et al. 2002). Such variations could be
the result of differences in sample handling techniques or biomarker measurement methods. The
results of this project add to the equivocal prior findings on gender differences of oxidative stress
biomarkers, suggesting a need for further future investigation into the role of gender in the
presentation of oxidative stress.
Same factors may explain the isoprostane results by weight status group and BMI
differences. This study found that there was no association between weight status category and
isoprostane concentration, as well as between BMI and isoprostane. In contrast, Komakula et al.
reported that elevated levels of 8-isoprostanes were associated with BMI. However, Il’yasova et
al. reported lower F2-isprostane levels among obese and diabetic subjects due to metabolic
adaptation (Komakula et al. 2007, Il’yasova et al. 2012). Conflicting results may also be
explained by the known association between obesity and inflammation, since leptin, a biomarker
of obesity that increases with adiposity, contributes to the generation of oxidative stress
(Fernández-Sánchez et al. 2011). This challenges the directionality of the relationship between
oxidative stress and obesity, providing reason for obesity to cause the increase in oxidative stress.
Further study is needed to clarify and understand the anthropometric determinants of isoprostane.
However, previous studies have demonstrated that leptin and adiponectin concentrations are
positively and negatively associated with BMI, respectively (Cnop et al. 2003, Moran and Phillip
2003). More specifically, Volberg et al illustrates that adipokine and BMI trends also are
observed in children, reporting that leptin levels closely and positively correlate to child size in
the CHAMACOS birth cohort, and adiponectin has an inverse association with body mass index
(Volberg et al 2013). This project found similar results and reaffirmed that BMI is a significant
determinant of leptin and adiponectin levels in children.
Biomarkers and air pollution
Limited data were available on the relationship between leptin and adiponectin levels and
air pollution exposure. While the current study found no associations between adipokines and

Kelly J. Nabaglo Air Pollution Effects on Children’s Health Spring 2017
18
any exposure metric, including daily, weekly and annual average exposure to polycyclic
aromatic hydrocarbons, elemental carbon and particulate matter, future investigations with larger
sample sizes are warranted. In contrast, previously conducted studies have demonstrated that
isoprostane concentrations were positively associated with exposure to air pollutants.
Specifically, Li et al. reported that particulate matter can exacerbate asthmatic response due to an
effect on oxidative stress, as observed by increased isoprostane (Li et al. 2003). Investigation of
the effects of polycyclic aromatic hydrocarbons similarly show that they elicit oxidative stress as
a result of exposure (Araujo et al. 2008, Liu et al. 2009). The results of this project corroborate
these findings that exposure to polycyclic aromatic hydrocarbons (measured both with a daily
average and a weekly average) was positively related to isoprostane levels. Thus, this project
confirmed that some air pollutants are determinants of isoprostane levels in CHAPS children.
These findings imply that exposure to pollution is related to oxidative stress, and present support
for inflammation and oxidative stress to be mechanistic pathways for the deleterious effects of
accumulated exposure, such as well-known outcomes like respiratory and cardiac distress, and
potentially others such as obesity.
Air pollution and BMI
A negative association between annual particulate matter exposure and BMI was
observed, contradicting findings of Potera et al whose review of PM2.5 and inflammation found
a positive influence of particulate matter exposure on total inflammation and subjects’ weight
(Potera et al 2014). Similarly to Potera, Sun et al found that exposure to fine particulate matter
exaggerates adipose inflammation and visceral adiposity (Sun et al. 2009). The contradictory
negative direction of the PM2.5 and BMI relationship observed in this study was strongly driven
by the small subset of underweight children (N=5). These children may have underlying health
conditions that are unaccounted for and thus affect the analysis. When these subjects were
removed, there was no significant relationship between children’s weight status and PM2.5
exposure. Given these results, there may still be an important relationship between air pollution
in relation to the development of obesity, however it was not observed in this cohort.
Kelly J. Nabaglo Air Pollution Effects on Children’s Health Spring 2017
19
Limitations
Several limitations of the study design should be taken into account when interpreting the
results. Participants may have health issues that influence study outcomes and are unaccounted
for. Second, cross-sectional analyses were used; hence, they are not indicative of any causal
relations. Third, the pollutants of interest for this study are by no means inclusive of all air
pollution measures and may not be an adequate representation of exposures that may or may not
contribute to oxidative stress. Moreover, the parameter of exposure assessment may not be the
most accurate metric of the pollution burden of participants, since their proximity to the Fresno
Supersite where data was obtained may vary for children by their residence. Future directions
include utilizing other biomarkers of oxidative stress that may be more characteristic of
accumulated pollution load. In addition, CHAPS contains other age-group cohorts, and this
project might be expanded to those other cohorts or subjects may be followed over time in order
to perform longitudinal analyses. Further, inclusion of additional metrics such as blood pressure
and diabetic and asthmatic status may allow for the assessment of the associations between air
pollution and diseases such as metabolic syndrome.
Conclusions and broader implications
In conclusion, study results indicated that oxidative stress, as measured by isoprostane,
was positively associated with polycyclic aromatic hydrocarbon exposure. This finding suggests
that exposure to ambient air pollutants may play a role in disrupting metabolic balance and
contribute to the development of obesity, implying a significant need to further investigate
mechanistic pathways and preventative measures against such outcomes.
This study may encourage further understanding of factors contributing to chronic
disease, in particular metabolic syndrome. As discussed before, populations such as those living
in the San Joaquin Valley, CA are considered especially vulnerable to pollution due to the nature
of their socioeconomic status and geographic location. This study may be beneficial in guiding
policy and in environmental justice advocacy to protect people from harms resulting from their
disproportionate burden of exposure to environmental contaminants.
Kelly J. Nabaglo Air Pollution Effects on Children’s Health Spring 2017
20
ACKNOWLEDGEMENTS
Thank you to my faculty mentor, Professor Nina Holland, for the guidance in completing
this project. I gratefully acknowledge Children’s Environmental Health Lab members, Maria
Escudero and Michael Zhou, for their assistance in my work. Thank you to Professor Katharine
Hammond (CHAPS Principal Investigator), Professor John Balmes, Dr. Mary Prunicki and Dr.
Liza Lutzer for granting me access to CHAPS samples and exposure data. Special thanks to
CHAPS staff and participants for making this work possible.
Thank you also to my thesis instructors, Dr. Patina Mendez and Dr. Kurt Spreyer, and
especially to Abigail Cochran and the members of my peer reviewing group, Betty Huang,
Ramanjot Kaur, and Cathy Ton for the extensive editing of drafts and the year-long support. This
project was funded by the National Institute of Environmental Health Sciences and the
Environmental Protection Agency. This project was funded by the National Institute of
Environmental Health Sciences and the Environmental Protection Agency.
REFERENCES Ambroz, A., V. Vlkova, P. Rossner Jr., A. Rossnerova, V. Svecova, A. Milcova, J. Pulkrabova, J.
Hajslova, M. Veleminsky Jr., I. Solansky, and R. J. Sram. 2016. Impact of air pollution on oxidative DNA damage and lipid peroxidation in mothers and their newborns. International Journal of Hygiene and Environmental Health 219:545–556.
Araujo, J. A., B. Barajas, M. Kleinman, X. Wang, B. J. Bennett, K. W. Gong, M. Navab, J. Harkema, C. Sioutas, A. J. Lusis, and A. E. Nel. 2008. Ambient Particulate Pollutants in the Ultrafine Range Promote Early Atherosclerosis and Systemic Oxidative Stress. Circulation Research 102:589–596.
Behre, C. J. 2007. Adiponectin, obesity and atherosclerosis. Scandinavian Journal of Clinical and Laboratory Investigation 67:449–458.
Böttner, A., J. Kratzsch, G. Müller, T. M. Kapellen, S. Blüher, E. Keller, M. Blüher, and W. Kiess. 2004. Gender Differences of Adiponectin Levels Develop during the Progression of Puberty and Are Related to Serum Androgen Levels. The Journal of Clinical Endocrinology & Metabolism 89:4053–4061.

Kelly J. Nabaglo Air Pollution Effects on Children’s Health Spring 2017
21
Bouloumié, A., T. Marumo, M. Lafontan, and R. Busse. 1999. Leptin induces oxidative stress in human endothelial cells. The FASEB Journal 13:1231–1238.
Central California Asthma Collaborative. (n.d.). Lifetime Asthma Prevalence Rates for School Aged Children. http://cencalasthma.org/resources/county-level-statistics/.
Chan-Yeung, M. N. W. 2000. Air pollution and health.
Chow, J. C., J. G. Watson, L. C. Pritchett, W. R. Pierson, C. A. Frazier, and R. G. Purcell. 1993. The dri thermal/optical reflectance carbon analysis system: description, evaluation and applications in U.S. Air quality studies. Atmospheric Environment 27:1185–1201.
Clinical Guidelines on the Identification, Evaluation, and Treatment of Overweight and Obesity in Adults: The Evidence Report - NHLBI, NIH. (n.d.). . http://www.nhlbi.nih.gov/health-pro/guidelines/archive/clinical-guidelines-obesity-adults-evidence-report.
Cnop, M., P. J. Havel, K. M. Utzschneider, D. B. Carr, M. K. Sinha, E. J. Boyko, B. M. Retzlaff, R. H. Knopp, J. D. Brunzell, and S. E. Kahn. 2003. Relationship of adiponectin to body fat distribution, insulin sensitivity and plasma lipoproteins: evidence for independent roles of age and sex. Diabetologia 46:459–469.
Committee on Environmental Health. 2004. Ambient Air Pollution: Health Hazards to Children. Pediatrics 114:1699–1707.
Cruz, M.-J., S. Sánchez-Vidaurre, P.-V. Romero, F. Morell, and X. Muñoz. 2009. Impact of age on pH, 8-isoprostane, and nitrogen oxides in exhaled breath condensate. Chest 135:462–467.
Fernández-Sánchez, A., E. Madrigal-Santillán, M. Bautista, J. Esquivel-Soto, Á. Morales-González, C. Esquivel-Chirino, I. Durante-Montiel, G. Sánchez-Rivera, C. Valadez-Vega, and J. A. Morales-González. 2011. Inflammation, Oxidative Stress, and Obesity. International Journal of Molecular Sciences 12:3117–3132.
Fulda, S., J. Linseisen, G. Wolfram, S. Himmerich, K. Gedrich, T. Pollmächer, and H. Himmerich. 2010. Leptin plasma levels in the general population: influence of age, gender, body weight and medical history. Protein and peptide letters 17:1436–1440.
Kelly J. Nabaglo Air Pollution Effects on Children’s Health Spring 2017
22
Huang, G., and J. K. London. 2012. Cumulative Environmental Vulnerability and Environmental Justice in California’s San Joaquin Valley. International Journal of Environmental Research and Public Health 9:1593–1608.
Ide, T., H. Tsutsui, N. Ohashi, S. Hayashidani, N. Suematsu, M. Tsuchihashi, H. Tamai, and A. Takeshita. 2002. Greater Oxidative Stress in Healthy Young Men Compared With Premenopausal Women. Arteriosclerosis, Thrombosis, and Vascular Biology 22:438–442.
Il’yasova, D., I. Spasojevic, K. Base, H. Zhang, F. Wang, S. P. Young, D. S. Millington, R. B. D’Agostino, and L. E. Wagenknecht. 2012. Urinary F2-isoprostanes as a biomarker of reduced risk of type 2 diabetes. Diabetes Care 35:173–174.
Isidori, A. M., F. Strollo, M. Morè, M. Caprio, A. Aversa, C. Moretti, G. Frajese, G. Riondino, and A. Fabbri. 2000. Leptin and Aging: Correlation with Endocrine Changes in Male and Female Healthy Adult Populations of Different Body Weights. The Journal of Clinical Endocrinology & Metabolism 85:1954–1962.
Johanna Helmersson, Peter Mattsson, and Samar Basu. 2002. Prostaglandin F2α metabolite and F2-isoprostane excretion rates in migraine. Clinical Science 102:39–43.
Johnson, A. R., J. J. Milner, and L. Makowski. 2012. The inflammation highway: metabolism accelerates inflammatory traffic in obesity. Immunological reviews 249:218–238.
Katsouyanni, K., J. Schwartz, C. Spix, G. Touloumi, D. Zmirou, A. Zanobetti, B. Wojtyniak, J. M. Vonk, A. Tobias, A. Pönkä, S. Medina, L. Bachárová, and H. R. Anderson. 1996.
Short term effects of air pollution on health: a European approach using epidemiologic time series data: the APHEA protocol. Journal of Epidemiology & Community Health 50:S12–S18.
Komakula, S., S. Khatri, J. Mermis, S. Savill, S. Haque, M. Rojas, L. Brown, G. W. Teague, and F. Holguin. 2007. Body mass index is associated with reduced exhaled nitric oxide and higher exhaled 8-isoprostanes in asthmatics. Respiratory Research 8:32.
Li, N., M. Hao, R. F. Phalen, W. C. Hinds, and A. E. Nel. 2003. Particulate air pollutants and asthma: A paradigm for the role of oxidative stress in PM-induced adverse health effects. Clinical Immunology 109:250–265.
Kelly J. Nabaglo Air Pollution Effects on Children’s Health Spring 2017
23
Li, W., E. H. Wilker, K. S. Dorans, M. B. Rice, J. Schwartz, B. A. Coull, P. Koutrakis, D. R. Gold, J. F. Keaney, H. Lin, R. S. Vasan, E. J. Benjamin, and M. A. Mittleman. 2016. Short‐Term Exposure to Air Pollution and Biomarkers of Oxidative Stress: The Framingham Heart Study. Journal of the American Heart Association 5:e002742.
Liu, H., D. Weisman, Y. Ye, B. Cui, Y. Huang, A. Colón-Carmona, and Z. Wang. 2009. An oxidative stress response to polycyclic aromatic hydrocarbon exposure is rapid and complex in Arabidopsis thaliana. Plant Science 176:375–382.
Lodovici, M., and E. Bigagli. 2011. Oxidative Stress and Air Pollution Exposure. Journal of Toxicology 2011:e487074.
Mann, J. (n.d.). Community Outreach and Translation Core (Mann). Grantome.
Marseglia, L., S. Manti, G. D’Angelo, A. Nicotera, E. Parisi, G. Di Rosa, E. Gitto, and T. Arrigo. 2014. Oxidative Stress in Obesity: A Critical Component in Human Diseases. International Journal of Molecular Sciences 16:378–400.
Miller, M. R. 2014. The role of oxidative stress in the cardiovascular actions of particulate air pollution. Biochemical Society Transactions 42:1006–1011.
Møller, P., P. H. Danielsen, D. G. Karottki, K. Jantzen, M. Roursgaard, H. Klingberg, D. M. Jensen, D. V. Christophersen, J. G. Hemmingsen, Y. Cao, and S. Loft. 2014. Oxidative stress and inflammation generated DNA damage by exposure to air pollution particles. Mutation Research/Reviews in Mutation Research 762:133–166.
Montuschi, P., P. J. Barnes, and L. J. Roberts. 2004. Isoprostanes: markers and mediators of oxidative stress. The FASEB Journal 18:1791–1800.
Montuschi, P., J. V. Collins, G. Ciabattoni, N. Lazzeri, M. Corradi, S. A. Kharitonov, and P. J. Barnes. 2000. Exhaled 8-Isoprostane as an In Vivo Biomarker of Lung Oxidative Stress in Patients with COPD and Healthy Smokers. American Journal of Respiratory and Critical Care Medicine 162:1175–1177.
Moran, O., and M. Phillip. 2003. Leptin: obesity, diabetes and other peripheral effects – a review. Pediatric Diabetes 4:101–109.

Kelly J. Nabaglo Air Pollution Effects on Children’s Health Spring 2017
24
Nakanishi, S., K. Yamane, N. Kamei, H. Nojima, M. Okubo, and N. Kohno. 2005. A protective effect of adiponectin against oxidative stress in Japanese Americans: the association between adiponectin or leptin and urinary isoprostane. Metabolism 54:194–199.
Ogden, C. L., M. D. Carroll, B. K. Kit, and K. M. Flegal. 2012. Prevalence of Obesity and Trends in Body Mass Index Among US Children and Adolescents, 1999-2010. JAMA 307:483–490.
Padula, A. M., J. R. Balmes, E. A. Eisen, J. Mann, E. M. Noth, F. W. Lurmann, B. Pratt, I. B. Tager, K. Nadeau, and S. K. Hammond. 2015. Ambient polycyclic aromatic hydrocarbons and pulmonary function in children. Journal of exposure science & environmental epidemiology 25:295–302.
Potera, C. 2014. Toxicity beyond the Lung: Connecting PM2.5, Inflammation, and Diabetes. Environmental Health Perspectives 122:A29.
Roberts II, L. J., and J. D. Morrow. 2000. Measurement of F2-isoprostanes as an index of oxidative stress in vivo. Free Radical Biology and Medicine 28:505–513.
Sun, Q., P. Yue, J. A. Deiuliis, C. N. Lumeng, T. Kampfrath, M. B. Mikolaj, Y. Cai, M. C. Ostrowski, B. Lu, S. Parthasarathy, R. D. Brook, S. D. Moffatt-Bruce, L. C. Chen, and S. Rajagopalan. 2009. Ambient Air Pollution Exaggerates Adipose Inflammation and Insulin Resistance in a Mouse Model of Diet-Induced Obesity. Circulation 119:538–546.
US EPA, R. 09. (n.d.). EPA Activities for Cleaner Air. Overviews and Factsheets. https://www.epa.gov/sanjoaquinvalley/epa-activities-cleaner-air.
Volberg, V. A. 2013. Environmental and epigenetic determinants of child adipokines in a Mexican-American population. eScholarship.
Wabitsch, M., W. F. Blum, R. Muche, M. Braun, F. Hube, W. Rascher, E. Heinze, W. Teller, and H. Hauner. 1997. Contribution of androgens to the gender difference in leptin production in obese children and adolescents. Journal of Clinical Investigation 100:808–813.
Watson, J. G., J. C. Chow, J. L. Bowen, D. H. Lowenthal, S. Hering, P. Ouchida, and W. Oslund. 2000. Air Quality Measurements from the Fresno Supersite. Journal of the Air & Waste Management Association 50:1321–1334.

Kelly J. Nabaglo Air Pollution Effects on Children’s Health Spring 2017
25
Wei, Y., J. (Jim) Zhang, Z. Li, A. Gow, K. F. Chung, M. Hu, Z. Sun, L. Zeng, T. Zhu, G. Jia, X. Li, M. Duarte, and X. Tang. 2016. Chronic exposure to air pollution particles increases the risk of obesity and metabolic syndrome: findings from a natural experiment in Beijing. The FASEB Journal 30:2115–2122.
Weisberg, S. P., D. McCann, M. Desai, M. Rosenbaum, R. L. Leibel, and A. W. Ferrante. 2003. Obesity is associated with macrophage accumulation in adipose tissue. Journal of Clinical Investigation 112:1796–1808.
Xu, X., Z. Yavar, M. Verdin, Z. Ying, G. Mihai, T. Kampfrath, A. Wang, M. Zhong, M. Lippmann, L.-C. Chen, S. Rajagopalan, and Q. Sun. 2010. Effect of Early Particulate Air Pollution Exposure on Obesity in Mice. Arteriosclerosis, Thrombosis, and Vascular Biology 30:2518–2527.
Zhong, N., X.-P. Wu, Z.-R. Xu, A.-H. Wang, X.-H. Luo, X.-Z. Cao, H. Xie, P.-F. Shan, and E.-Y. Liao. 2005. Relationship of serum leptin with age, body weight, body mass index, and bone mineral density in healthy mainland Chinese women. Clinica Chimica Acta 351:161–168.