effects of advertising on tourism demand: an econometric...
TRANSCRIPT

1
EFFECTS OF ADVERTISING ON TOURISM DEMAND: AN ECONOMETRIC STUDY1
Sarath Divisekera2 and Nada Kulendran3
School of Applied Economics
Victoria University, Melbourne, Australia
ABSTRACT
The objective of this study is to quantify the long-term effects of advertising on tourism demand. A single equation demand model is specified which includes advertising as an explanatory variable along with other economic determinants of demand, prices and incomes. Using the Phillip-Hanson procedure, long-run elasticities of demand for Australian tourism from its major markets (Japan, New Zealand, United Kingdom and United States of America are estimated. The results indicate that Japanese and New Zealand tourists are relatively more responsive to advertising compared with United Kingdom and United States tourists. Results also indicate that the former two markets are highly sensitive to prices compared with the latter two.
Keywords: Economics of tourism promotion, economics of advertising, tourism demand modelling, effects of tourism advertising.
INTRODUCTION
The last two decades showed a rapid expansion in inbound tourism to Australia. Total visitor/tourist arrivals increased from 0.904 million in 1980 to 4.385 million in 2003 and receipts from international tourists increased from A$988 million to A$11,171 million (Australian Tourist Commission 2004). This impressive growth is often attributed to two factors: increased competitiveness of Australia as a tourist destination following the depreciation of the Australian currency in the early 1980s and the increased popularity of Australia as a tourist destination in the Asia Pacific region (Industry Assistance Commission 1988; Divisekera 1995). The latter was effect of increased promotional efforts by the national tourist authority (the Australian Tourist Commission – ATC) and other media coverage.
Since the late 1970s, Australia has been aggressively promoting its image worldwide as an attractive holiday destination to lure potential tourists. On average, Australia spends around A$1 billion in annual promotional strategies, a lion share of which is devoted to four major source markets: Japan, New Zealand, the United Kingdom and the United States. The Commonwealth Government finances the bulk of the promotional expenditures and the
1 This paper is based on a study funded by the Sustainable Tourism Cooperative Research Centre. The views are those of the authors and should not be attributed to the sponsoring agency. 2 Email: [email protected] 3 Email: [email protected]

2
demand for public funds are growing over time.4 However, little is known about the effects of vast public promotional spending on tourism demand, an issue often overlooked in the literature. For example, whilst there are a number of published studies on the demand for Australian tourism (e.g. Divisekera 1995, 2003; Kulendran 1996), except for Crouch, Schultz and Valerio (1992) none of them incorporate advertising/promotion into their studies.5
Crouch, Schultz and Valerio (1992) estimated a log linear demand model where the number of tourists was the dependent variable. Tourist numbers were regressed against per capita disposable income of source countries, relative prices (defined as the real exchange rate between the source country and Australia), airfares (economy-class), marketing expenditure by the ATC and a time trend. In addition, several dummy variables were included to capture the effects of special events. The model was estimated using 13 annual observations up to 1989 and was fitted for the demands from Japan, New Zealand, the United Kingdom, the United States of America and West Germany. The study revealed small but positive advertising elasticities associated with tourism demands from the five source countries.
As the first attempt to incorporate the advertising/marketing, Crouch, Schultz and Valerio (1992) was an important contribution. However, the study has its limitations, in particular the measurement of key economic variables such as tourism and travel prices. In relation to prices, a realistic measure of tourism prices should reflect the cost of a common basket of goods and services (i.e. accommodation, food, local transport, recreation and various other goods and services) consumed by tourists (Divisekera 2003). However, they use Consumer Price Indices (CPIs) as the measure of tourism prices.6 Further, in relation to the travel cost, there is no uniformity or consistency in the travel cost variable (airfare) used. For example, in the case of the United States, use was made of one-way economy airfare as the measure of travel costs, whereas in the case of other countries return economy-class airfares (Y-class) was used. Whether one uses one-way or round-trip airfares, standard economy airfares fail to capture the effective travel costs, as the actual fares borne by travellers are affected by the pricing practices of airlines serving a particular route (for a detailed discussion, see Divisekera 1995). These practices lead to various discount fares such as excursion, promotional and seasonal fares which are substantially different from the distance-based normal economy airfares. In addition, Crouch, Schultz and Valerio (1992) failed to incorporate alternative/substitutable destination prices in their model.
Besides the measurement problems associated with the key economic variables and exclusion of alternative prices in their model leading to possible bias in parameter estimates, the reliability of the estimated parameters may be questioned on technical grounds as well. For example, Crouch, Schultz and Valerio (1992) use the Ordinary Least Squares (OLS) 4 For example, government funding to the Australian Tourist Commission increased from A$47.7 million in 1987 to A$99.7 million in 2003. 5 In general, quantitative studies evaluating the effects of advertising/promotion on tourism demand is relatively scarce and only four studies were found in the literature. One early such study by Barry and O’Hagan (1972) who examined the demand by British tourists in Ireland during the period 1956 to 1969. Uysal and Crompton (1984) analysed the international demand for tourism in Turkey from major source countries during the period 1960 to 1980. In addition to key economic variables such as prices and incomes, they also used promotional expenditure as an independent variable. Papadopoulos (1987) examined foreign tourist arrivals in Greece from its eight most important tourist-generating countries during the period 1972 to 1982. The estimated promotional expenditure elasticities were all positive and the general conclusion that emerged from the above studies is that promotional variables may well be significant determinants of tourism demand. 6 The implicit assumption underlying the use of CPI is that prices of tourism goods and services tend to move in the same direction as overall consumer prices. However, movements in the general price levels implied in CPI may not necessarily coincide with movements in the prices of tourism goods and services. This is because the basket of goods and services included in the CPI of a given country could differ significantly from a basket of goods and services consumed by tourists visiting that country for a short period. Moreover, there is no uniformity in the coverage, weights and/or components included in the CPIs between countries. They depend on the particular socio-economic characteristics and consumption habits of the residents of the country in question (for a detailed discussion on the limitations of CPIs as a measure of tourism prices see O’Hagan & Minnock 1983; Divisekera 1995, 2003).
3
method to obtain parameter estimates, with variables being specified in level terms. When time series models are specified in level terms, the possibility of discovering ‘spurious’ relationships using conventional test statistics is very high and conventional F- and T-tests cannot be meaningfully intepreted (Granger & Newbold 1974). The implication is that explanatory variables may turn out to be significant (statistically), although there are no effects on the dependent variable. In this study, we attempt to re-examine the effects of advertising on demand for Australian tourism, by extending the early work of Crouch, Schultz and Valerio (1992) covering the time period 1980 to 2001. The study is focused on the four major source markets, Japan, New Zealand, the United Kingdom and the United States of America.
The remainder of this paper is organised as follows. The next section starts with a brief review of the literature on the economics of advertising. The goal is to set out the conceptual framework and specify the theoretical model. Variable specification and the data used are discussed and the empirical model is presented. Following this, modelling strategy, data generation and the econometric procedures are discussed. Empirical results are discussed in the next section and a summary of the major findings and conclusions are presented in the final section.
THE CONCEPTUAL FRAMEWORK AND THE MODEL
There are two schools of thought about the economic effects of advertising; one is based on the ‘market power model’ and the other follows from the ‘theory of information’. According to the market power model, advertising is viewed as a means of persuasion and is postulated to lead to increased product differentiation that decreases perceived substitutability among competing alternatives (Bain 1956; Comanor & Wilson 1979). The second approach, based on the theory of economics of information due to Stiglar (1961) and Telser (1964), postulates that responsiveness to demand is a function of consumer awareness and of qualitative knowledge about close substitutes. According to this school of thought, advertising provides information about alternatives and, therefore, increases price elasticity of demand (Nelson 1974).
Both of these schools of thought highlight possible effects of advertising on the demand for goods and services, although the postulated effects are contrary. The available empirical evidence on the economic and advertising/marketing relationship is mixed. Some authors have found supporting evidence for the view that advertising decreases price elasticity of demand (Comanor & Wilson 1974; Kshishnamurthi & Raj 1985) and others (Moriarty 1983) have found evidence supporting the predictions of the information theory.
The controversy over whether advertising increases or decreases elasticity of demand, as Mitra and Linch (1995) pointed out, is unnecessary; the outcome depends on the consideration set. For example, for product markets in which consumers have to rely on memory to generate alternatives, the effect of increased advertising by brands may be to increase price elasticity. At the same time, there are product markets in which consumers rely on point-of-sale purchase information to generate alternatives; the net effect of increased advertising will be to decrease price elasticity. However, what is important is that advertising does have some economic value beyond providing information on the existence of substitutes and thereby increases the number of effective substitutes considered at the time of choice. This is particularly the case for international tourism given that, unlike most brand products purchased by consumers for day-to-day use at the point of sale, the decision to purchase tourism products (choice of destinations) are made in advance. Thus, the information about the destinations available to the consumer plays a key role in the choice process. In the absence of complete information, it is reasonable to assume that marketing and promotional efforts by the destination countries could have significant effects on the destination choice and therefore demand to a particular destination.

4
Research on the effectiveness of advertising campaigns indicates that the effectiveness of advertising is not limited to the simple purchase of a product but rather is extended to a range of psychological and cognitive aspects related to awareness and intention that may play an important role in the purchase decision in a longer timeframe (Bendixen 1993; Siegel and Ziff-Levine 1990). Accordingly, we assume that advertising affects destination choice and the demand for a given destination is positively correlated with the level of advertising. The level of advertising and hence the amount of information about a given destination is assumed to depend on the level of advertising expenditure.7
The consumer theory of choice postulates that the demand for a given commodity depends on prices, consumer incomes and consumer preferences. In the context of tourism, the level of discretionary income available to individuals and the costs associated with foreign travel are the key economic determinants. These, together with non-economic factors – destinational attributes – influence destination choices. Advertising provides information on destination attributes and influences the consumer preferences. Thus, visitor flows from a given origin to an alternative destination may be expressed as a function of prices, incomes, and advertising expenditure:
Q = f(Pi ,Y, A) (1)
where Pi is the vector of prices, Y is discretionary income and A is the advertising expenditure.
This simple model assumes that a decision to consume tourism services at a given destination is affected by prices, incomes and advertising expenditure. International tourism is a luxury commodity, the consumption of which depends on the discretionary incomes available to individuals. Therefore, we use per capita disposable incomes of the origin country as proxy for the income variable. The necessary data are obtained from official sources of each origin country.
Among the remaining variables, prices (costs) associated with tourism demand are two-fold: the cost associated with the consumption of tourism goods and services at a given destination (tourism prices) and the cost of international transport (travel costs). Prices of tourism goods and services at different destinations are affected by two factors; differences in cost structures and official exchange rates. Ideally, then, a comparison of price levels must be based on the cost of a given basket of goods usually consumed by visitors in the destination, adjusted for exchange rates and differences in price levels (O’Hagan & Harrison 1984; Divisekera 1995). Accordingly, we use Tourism Price Indices (TPI) to approximate the trends in prices of a common basket of goods and services consumed by tourists.8 Further, theory of consumer choice postulates that consumers evaluate purchases on the basis of relative prices and the price definition used in the study takes the following form:
iji
jTi ER
TPITPI
P ⎟⎠
⎞⎜⎝
⎛= (2)
where Pi
T is the price of the composite tourism product faced by a tourist from the ith country of origin, TPIj is the tourism price index of the jth destination and ERij is the bilateral exchange rate between country pairs i and j (i ≠ j). The price variable defined above captures 7 Admittedly, this is rather a restrictive assumption. Note that there can be many other sources that provide information about destinations and their attributes such as various publications, word-of-mouth, historical relations between countries and socio-political events of international significance. However, quantification of the effects of such sources is practically impossible. 8 Tourism Price Indices necessary for this study was derived updating the series developed for the four origin countries (New Zealand, Japan, the United Kingdom and the United States of America) and Australia (for details see Divisekera 1995; 2003).
5
the trends in prices of a common basket of goods and services consumed by tourists and exchange rate differentials between a pair of destinations. The prices of alternative/competing destinations, Pi
S, are defined similarly:
iki
kSi ER
TPITPIP ⎟
⎠
⎞⎜⎝
⎛= (3)
where TPIk is the tourism price index of the kth alternative destination and ERik is the bilateral exchange rate between country pairs i and k.
In relation to the prices of alternatives, it is desirable to include all destinations that may be considered as potentially competing or complementary to Australia. Practically, this is not possible and following the previous authors, we include a single destination in each model. For example, in the Japanese, New Zealand and the United Kingdom models, the United States was included as an alternative to Australia and in the United States model, the United Kingdom was included as an alternative destination. The choice of these alternatives was based on the observed travel patterns of tourists from these origins (for a detailed discussion, see Divisekera 2003).
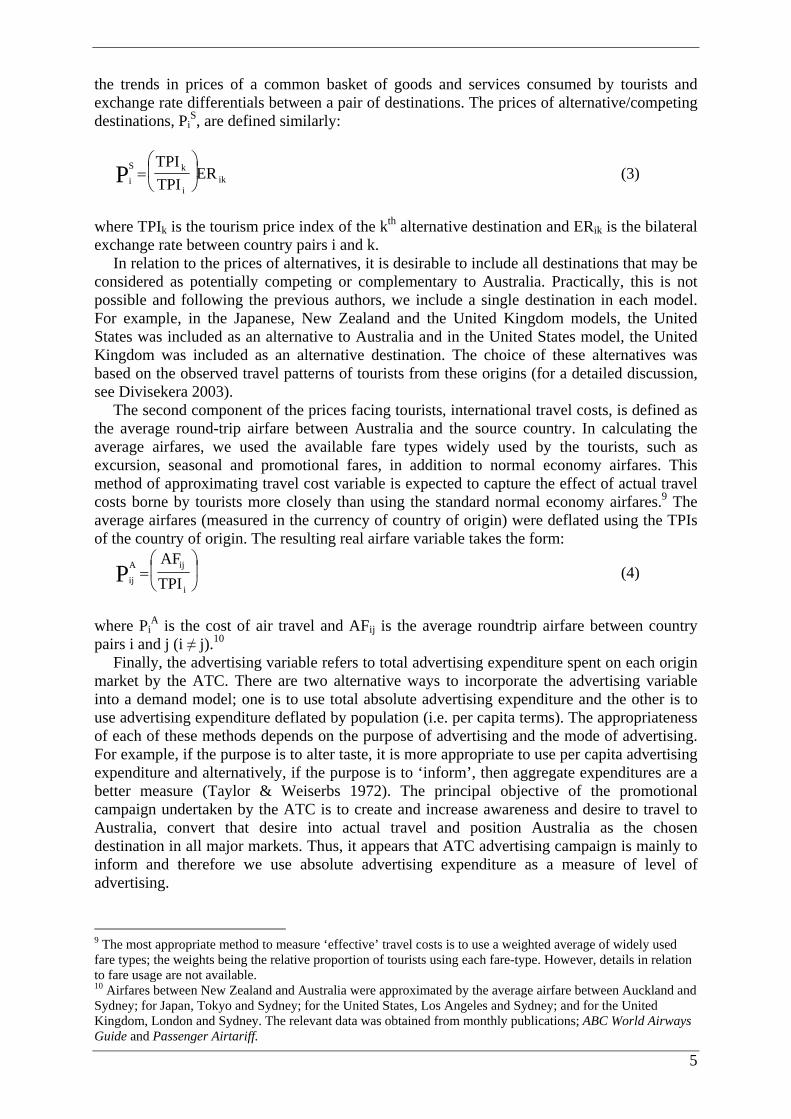
The second component of the prices facing tourists, international travel costs, is defined as the average round-trip airfare between Australia and the source country. In calculating the average airfares, we used the available fare types widely used by the tourists, such as excursion, seasonal and promotional fares, in addition to normal economy airfares. This method of approximating travel cost variable is expected to capture the effect of actual travel costs borne by tourists more closely than using the standard normal economy airfares.9 The average airfares (measured in the currency of country of origin) were deflated using the TPIs of the country of origin. The resulting real airfare variable takes the form:
⎟⎠
⎞⎜⎝
⎛=
i
ijAij TPI
AFP (4)
where Pi
A is the cost of air travel and AFij is the average roundtrip airfare between country pairs i and j (i ≠ j).10
Finally, the advertising variable refers to total advertising expenditure spent on each origin market by the ATC. There are two alternative ways to incorporate the advertising variable into a demand model; one is to use total absolute advertising expenditure and the other is to use advertising expenditure deflated by population (i.e. per capita terms). The appropriateness of each of these methods depends on the purpose of advertising and the mode of advertising. For example, if the purpose is to alter taste, it is more appropriate to use per capita advertising expenditure and alternatively, if the purpose is to ‘inform’, then aggregate expenditures are a better measure (Taylor & Weiserbs 1972). The principal objective of the promotional campaign undertaken by the ATC is to create and increase awareness and desire to travel to Australia, convert that desire into actual travel and position Australia as the chosen destination in all major markets. Thus, it appears that ATC advertising campaign is mainly to inform and therefore we use absolute advertising expenditure as a measure of level of advertising.
9 The most appropriate method to measure ‘effective’ travel costs is to use a weighted average of widely used fare types; the weights being the relative proportion of tourists using each fare-type. However, details in relation to fare usage are not available. 10 Airfares between New Zealand and Australia were approximated by the average airfare between Auckland and Sydney; for Japan, Tokyo and Sydney; for the United States, Los Angeles and Sydney; and for the United Kingdom, London and Sydney. The relevant data was obtained from monthly publications; ABC World Airways Guide and Passenger Airtariff.
6
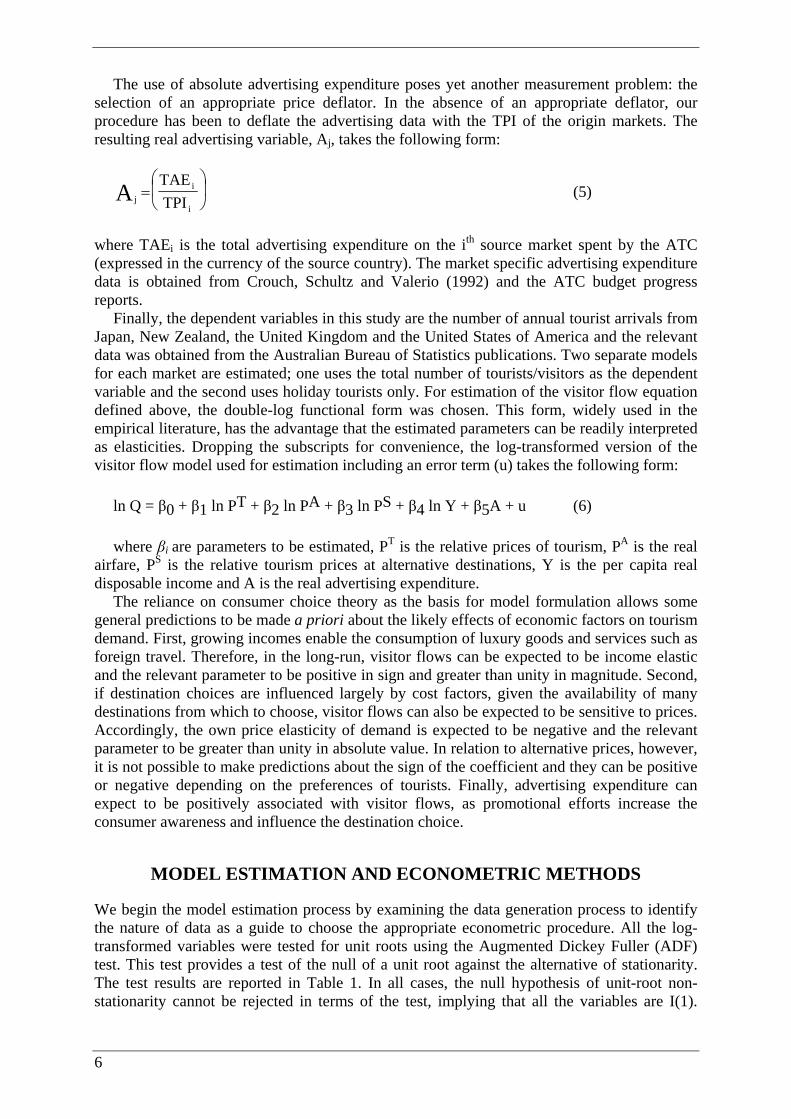
The use of absolute advertising expenditure poses yet another measurement problem: the selection of an appropriate price deflator. In the absence of an appropriate deflator, our procedure has been to deflate the advertising data with the TPI of the origin markets. The resulting real advertising variable, Aj, takes the following form:
⎟⎠
⎞⎜⎝
⎛=
i
ij TPI
TAEA (5)
where TAEi is the total advertising expenditure on the ith source market spent by the ATC (expressed in the currency of the source country). The market specific advertising expenditure data is obtained from Crouch, Schultz and Valerio (1992) and the ATC budget progress reports.
Finally, the dependent variables in this study are the number of annual tourist arrivals from Japan, New Zealand, the United Kingdom and the United States of America and the relevant data was obtained from the Australian Bureau of Statistics publications. Two separate models for each market are estimated; one uses the total number of tourists/visitors as the dependent variable and the second uses holiday tourists only. For estimation of the visitor flow equation defined above, the double-log functional form was chosen. This form, widely used in the empirical literature, has the advantage that the estimated parameters can be readily interpreted as elasticities. Dropping the subscripts for convenience, the log-transformed version of the visitor flow model used for estimation including an error term (u) takes the following form:
ln Q = β0 + β1 ln PT + β2 ln PA + β3 ln PS + β4 ln Y + β5A + u (6) where βi are parameters to be estimated, PT is the relative prices of tourism, PA is the real
airfare, PS is the relative tourism prices at alternative destinations, Y is the per capita real disposable income and A is the real advertising expenditure.
The reliance on consumer choice theory as the basis for model formulation allows some general predictions to be made a priori about the likely effects of economic factors on tourism demand. First, growing incomes enable the consumption of luxury goods and services such as foreign travel. Therefore, in the long-run, visitor flows can be expected to be income elastic and the relevant parameter to be positive in sign and greater than unity in magnitude. Second, if destination choices are influenced largely by cost factors, given the availability of many destinations from which to choose, visitor flows can also be expected to be sensitive to prices. Accordingly, the own price elasticity of demand is expected to be negative and the relevant parameter to be greater than unity in absolute value. In relation to alternative prices, however, it is not possible to make predictions about the sign of the coefficient and they can be positive or negative depending on the preferences of tourists. Finally, advertising expenditure can expect to be positively associated with visitor flows, as promotional efforts increase the consumer awareness and influence the destination choice.
MODEL ESTIMATION AND ECONOMETRIC METHODS
We begin the model estimation process by examining the data generation process to identify the nature of data as a guide to choose the appropriate econometric procedure. All the log-transformed variables were tested for unit roots using the Augmented Dickey Fuller (ADF) test. This test provides a test of the null of a unit root against the alternative of stationarity. The test results are reported in Table 1. In all cases, the null hypothesis of unit-root non-stationarity cannot be rejected in terms of the test, implying that all the variables are I(1).

7
Thus, in order to avoid the possibility of estimating spurious relationships, the estimation of the models needs to be undertaken with procedures that are appropriate for I(1) variables.
The technique most widely used for modelling I(1) variables is the static OLS method proposed by Engle and Granger (1987). This involves a two-step procedure to obtain model parameters. In the first stage, static regression is run on variables in level forms to obtain the cointegrating vector representing the long-run relationship among variables. In the second stage, the one-period lagged residuals from the level equation are entered into the error correction model as a separate argument to account for the effects of long-run deviations on the short-run.
However, concerns have been expressed in the literature about the robustness of the Engle-Granger procedure in its application to data samples of the size typical in most economic applications. Some authors have stressed the fact that the OLS estimator, as applied to non-stationary data, has an asymptotic distribution which is non-normal and depends on nuisance parameters. This makes inference difficult since the standard t-statistics will not be valid asymptotically and spurious regressions may result. To redress this problem, an alternative technique proposed in the literature to model I(1) variables is the Phillips-Hansen (PH) method.
Essentially, the Phillips-Hansen methodology is ‘fully modified’ OLS, which results in an optimal single-equation technique (Phillips & Loretan 1991, p. 419) for estimating with I(1) variables and is asymptotically equivalent to maximum-likelihood. It applies a semi-parametric correction to the OLS estimator to eliminate dependency on nuisance parameters and gives median-unbiased t-statistics that follow a standard normal distribution asymptotically. Further, Phillips-Hansen methodology also corrects regression coefficients and associated test statistics for statistical endogeneity of right-hand side regressors and serial correlation. Thus the long-run estimates one derives using this procedure are robust and the test statistics can be interpreted in a conventional way.
Table 1: Unit root test results: I(0) (levels) versus I(1) first difference
Japan United States United Kingdom New Zealand
DF/ADF Test Variable
I(0) I(1) I(0) I(1) I(0) I(1) I(0) I(1)
LQD -1.09 -4.23 -2.35 -2.78 -2.00 -4.24 -0.94 -3.92
LQH -2.26 -4.29 -2.20 -2.99 -2.59 -3.05 -1.49 -4.29
AD -1.00 -4.41 1.53 -4.28 -1.25 -4.28 -1.86 -6.18
PT -0.85 -3.26 -0.97 -9.87 -2.76 -3.98 -3.77 -3.42
PS -1.95 -3.65 -1.71 -3.22 -2.85 -3.22 -3.09 -3.38
PA -1.98 -4.89 -1.79 -6.06 -0.80 -6.52 -2.48 -5.16
Y -1.79 -5.08 -1.74 -3.77 -0.29 -4.32 -1.52 -3.94
Notes: LQD log of Total tourist arrivals; LQH Log of Holiday tourist arrivals;95% critical value for the augmented Dickey-Fuller statistic = --3.69; PT = Log of Tourism prices; AD = Log of Advertising
expenditure; PS =Log of Alternative prices; PA = Log of Travel costs; Y = Log of Real disposable per capita income

8
EMPIRICAL RESULTS
Estimated long-run parameters of the demand equations using the PH procedure are given in Tables 2 to 5. Overall statistical fit of the models is satisfactory; most variables possess the expected theoretical signs and are statistically significant at 5% or less. As can be seen from Table 2, where the long-run parameter estimates of the two models for Japan are reported, with the exception of travel cost, all other variables are statistically significant at 5% or less. The Japanese demand for Australian tourism appears to be highly sensitive to incomes, with long-run elasticities ranging from about 6 (total tourists – henceforth average tourists) to 8 (holiday tourist). Although these parameter values are similar in magnitude to that of the Crouch, Schultz and Valerio (1992) study (see Table 6), it is likely that the income effect is overstated and may reflect the effect of other factors that were excluded in the model.
Table 2: Fully modified Phillips-Hansen estimates: Japanese demand
Holiday tourists Total tourists Regressors
Coefficient T-Ratio [Prob] Coefficient T-Ratio [Prob]
Intercept -95.39 -2.63 [.019] -62.99 -1.74 [.102]
PT -2.99 -9.07 [.000] -2.8 -8.48 [.000]
PA 0.09 0.58 [.567] 0.07 0.453 [.657]
PS 1.4 3.17 [.006] 1.56 3.53 [.003]
Y 8.4 2.88 [.011] 5.77 1.98 [.066]
A 0.65 9.95 [.000] 0.61 9.34 [.000] The Japanese demand also appears to be highly sensitive to prices, with own price
elasticities around 3 in absolute value. Similarly, the coefficient for the alternative destination price is highly statistically significant and positive with a coefficient of about 1.5. This implies that the Japanese tourists perceive Australia and the United States as substitutes. The coefficient for advertising is also highly statistically significant (1% level) and has the expected positive sign. The holiday tourists appear to be relatively more sensitive to advertising, with an elasticity of 0.65 compared with an average tourist with elasticity of 0.61. Overall, Japanese demand for Australian tourism reveals a highly price and income elastic demand.
The New Zealand demand for Australian tourism also reveals a relatively price elastic demand with own price elasticities ranging from 2.5 (total tourists) to 2.8 (holiday) in absolute value (Table 3). The coefficient for alternative prices is highly statistically significant, positive with values ranging from 1.3 to 1.5. Thus, the New Zealand tourist appears to consider the United States as a substitute for Australia. While the two price variables, own and substitute, are highly significant both statistically and in magnitude, the travel cost variable has the wrong sign and is significant only at 10% in the holiday model (and is not significantly different from zero in the total tourist model).

9
Table 3: Fully modified Phillips-Hansen estimates: New Zealand demand
Holiday tourists Total tourists Regressors
Coefficient T-Ratio [Prob] Coefficient T-Ratio [Prob]
Intercept -6.88 -0.81 [.427] -3.0 -0.44 [.665]
PT -2.54 -3.34 [.004] -1.8 -2.94 [.010]
PA 0.37 1.77 [.095] 0.14 0.85 [.407]
PS 1.5 3.05 [.008] 1.32 3.31 [.005]
Y 1.67 1.75 [.099] 1.51 1.96 [.069]
A 0.35 4.49 [.000] 0.3 4.67 [.000] The New Zealand demands reveal relatively income elastic demand; however, unlike
Japanese demand, no significant differences are evident between the total and holiday tourists, with income elasticity of around 1.5. The advertising variable is highly statistically significant, with elasticity coefficients ranging from 0.30 (total tourists) to 0.35 (holiday tourists). Overall, New Zealand demand for Australian tourism is both price and income elastic and also appears to be sensitive to advertising.
All the variables in the United Kingdom model are statistically significant at 5% or less and the only exception is the alternative price variable, which is significant at 10% (Table 4). It is also noteworthy that the coefficient for alternative prices is negative implying that United Kingdom tourists consider the United States as a complementary destination to Australia. The long-run elasticity coefficient for the travel cost variable possesses the expected negative sign and is statistically significant at 5% (holiday model only). We also observe that United Kingdom tourists are less sensitive to tourism prices (with elasticity coefficient of 0.9 in absolute value).
Table 4: Fully modified Phillips-Hansen estimates: United Kingdom demand
Holiday Tourists Total Tourists Regressors
Coefficient T-Ratio [Prob] Coefficient T-Ratio [Prob]
Intercept -2.3 -0.36 [.718] -13.06 -3.56 [.003]
PT -0.91 -4.00 [.001] -0.28 -2.14 [.048]
PA -0.34 -2.17 [.046] -0.1 -1.13 [.274]
PS -0.36 -1.81 [.090] -0.42 -3.59 [.003]
Y 2.19 3.34 [.004] 3.33 8.70 [.000]
A 0.12 2.28 [.037] 0.06 2.02 [.061]
10
The advertising variable is highly statistically significant, with the expected positive sign. Thus, advertising appears to be a significant factor affecting United Kingdom demand. However, the sensitivity of the United Kingdom tourists to advertising is quite low with elasticities ranging from 0.12 (holiday) to 0.06 (total). Overall, United Kingdom demand for Australian tourism appears to be price inelastic and is also less sensitive to advertising. The major force behind United Kingdom demand for Australian tourism in the long-run appears to be disposable incomes, with elasticities ranging from 2.19 (holiday) to 3.4 (total).
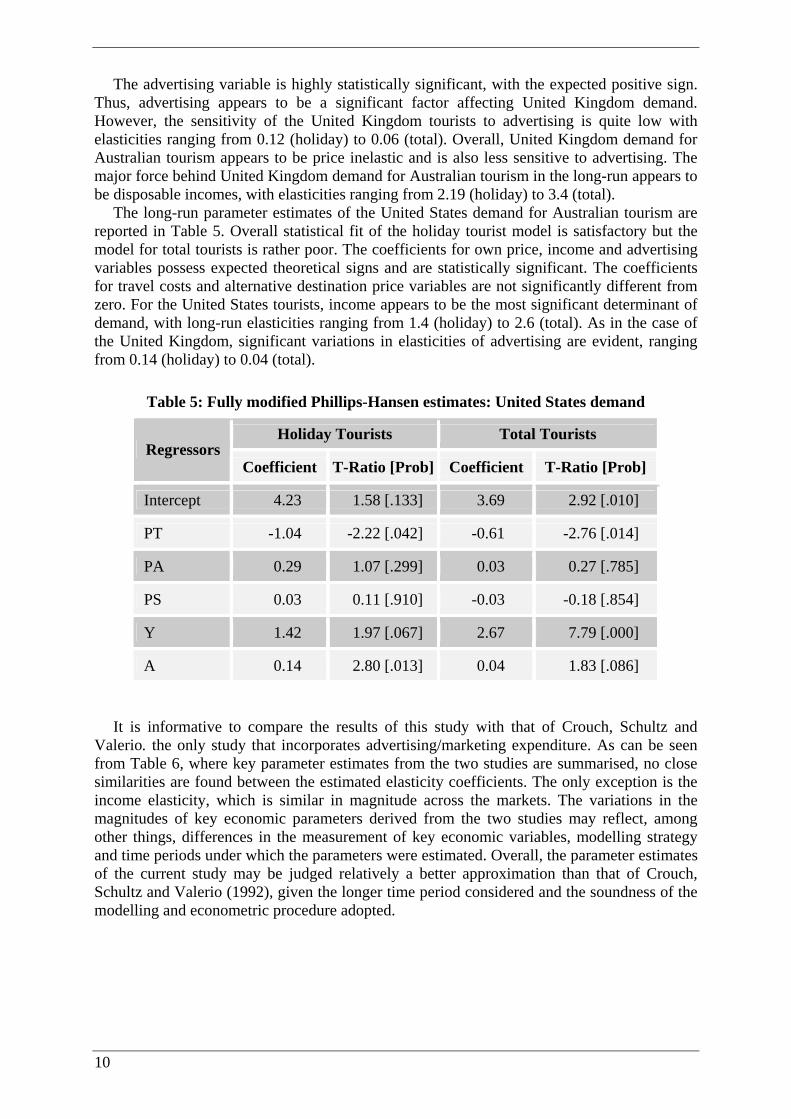
The long-run parameter estimates of the United States demand for Australian tourism are reported in Table 5. Overall statistical fit of the holiday tourist model is satisfactory but the model for total tourists is rather poor. The coefficients for own price, income and advertising variables possess expected theoretical signs and are statistically significant. The coefficients for travel costs and alternative destination price variables are not significantly different from zero. For the United States tourists, income appears to be the most significant determinant of demand, with long-run elasticities ranging from 1.4 (holiday) to 2.6 (total). As in the case of the United Kingdom, significant variations in elasticities of advertising are evident, ranging from 0.14 (holiday) to 0.04 (total).
Table 5: Fully modified Phillips-Hansen estimates: United States demand
Holiday Tourists Total Tourists Regressors
Coefficient T-Ratio [Prob] Coefficient T-Ratio [Prob]
Intercept 4.23 1.58 [.133] 3.69 2.92 [.010]
PT -1.04 -2.22 [.042] -0.61 -2.76 [.014]
PA 0.29 1.07 [.299] 0.03 0.27 [.785]
PS 0.03 0.11 [.910] -0.03 -0.18 [.854]
Y 1.42 1.97 [.067] 2.67 7.79 [.000]
A 0.14 2.80 [.013] 0.04 1.83 [.086] It is informative to compare the results of this study with that of Crouch, Schultz and
Valerio. the only study that incorporates advertising/marketing expenditure. As can be seen from Table 6, where key parameter estimates from the two studies are summarised, no close similarities are found between the estimated elasticity coefficients. The only exception is the income elasticity, which is similar in magnitude across the markets. The variations in the magnitudes of key economic parameters derived from the two studies may reflect, among other things, differences in the measurement of key economic variables, modelling strategy and time periods under which the parameters were estimated. Overall, the parameter estimates of the current study may be judged relatively a better approximation than that of Crouch, Schultz and Valerio (1992), given the longer time period considered and the soundness of the modelling and econometric procedure adopted.

11
Table 6: A summary of long-run demand elasticities
Real income Relative prices Advertising Origin
Holiday Total Holiday Total Holiday Total
Japan 8.40 5.70 (6.91)* -2.99 -2.80 (n.a) 0.65 0.61 (0.20)
New Zealand 1.67 1.51 (2.22) -2.54 -0.1.80 (-0.88) 0.36 0.30 (0.25)
United Kingdom 2.19 3.33 (2.24) -0.91 -0.29 (-0.37) 0.12 0.06 (0.14)
United States 1.42 2.67 (2.70) -1.04 -0.61 (-0.92) 0.14 0.04 (0.11)
* Figures in parentheses are comparable elasticities derived from Crouch, Schultz & Valerio (1992) based on the best-fit models; n.a = not available
Effects of Advertising: An Interpretation As revealed from the foregoing discussion, the advertising variable in each model is found to be statistically significant and has the expected sign, implying that advertising has a positive effect on the demand. While the degree of the impact of advertising as reflected in the long-run elasticity coefficients varied across markets, in general holiday tourists appear to be relatively more sensitive to advertising than average tourists. For example, in each market, advertising elasticities were relatively high in models with holiday tourists as the dependent variable compared with the elasticities estimated from models where the total number of tourists is the dependent variable. Further, the effect of advertising is among the greatest in the Japanese market, where an overwhelming majority are holiday tourists compared with the other three markets having a substantial proportion of tourists belonging to other categories; visiting friends and relatives (VFR) and business (see Table 7).
Table 7: Average market shares and growth rates 1981-2001
Inbound markets Average market shares Annual average growth rates
VFR Holiday Business Holidaytourists
Advertising expenses
Growth ratio*
Japan 0.02 0.91 0.06 16.7 26.5 1:0.63
New Zealand 0.31 0.49 0.20 6.0 11.6 1:0.51
United Kingdom 0.46 0.43 0.12 12.3 25.0 1:0.49
United States 0.18 0.58 0.24 7.3 41.1 1:0.18
*Growth Ratio = (Average annual growth rate of holiday tourists/Annual average growth rate of Advertising expenditure)

12
Relatively high responsiveness of Japanese demand to advertising would reflect the impact of the generic advertising campaign by the ATC over the last two decades, which focused on promoting Australia as a destination. Note that unlike the other three major origins (New Zealand, the United Kingdom and the United States) which are Australia’s traditional allies, with long-established economic, political and social links, Japan is a new market and only in recent times has its economic links been established. Thus, in the early phase of Japanese market development, an advertising campaign would have had a significant influence in transforming Japanese preferences for Australia as an alternative tourist destination. Note also that not only is Japanese demand the most sensitive to advertising but also that it is highly sensitive to prices as well. Thus, highly price elastic demand coupled with relatively high advertising elasticity is consistent with the predictions of the information theory that advertising provides information about alternatives and, therefore, increases price elasticity of demand (Nelson 1974). Further, as Mitra and Lynch (1995) pointed out, beyond providing information on the existence of substitutes, advertising provides recall cues and thereby increases the number of effective substitutes considered at the time of choice. Note that the coefficient for competitive price is highly significant and had a positive sign, implying that Japanese demand is highly competitive.
A similar feature is evident in the New Zealand case; the demand is highly sensitive to prices, both own and alternative, and has the second-highest advertising elasticity among the four markets considered. Despite the fact that New Zealand has historically close links with Australia, relatively high advertising elasticities would reflect the effectiveness of advertising campaign by the ATC in this market.
Effects of advertising appear to be minimal in relation to the remaining two traditional markets, the United States and the United Kingdom, with elasticity coefficients of 0.14 and 0.12 respectively. The low advertising elasticities are associated with relatively low price elasticities as well. In both cases, price elasticities are around unity. Further, as pointed out earlier, no significant cross price effects are evident. The low elasticities of advertising, however, should not be taken as an indication that advertising has little or no economic significance on tourism demand. It may be the case that either the particular advertising campaigns in these markets are less effective as a means of persuasion or there are other factors such as cost of travel and tourism prices which dominate the destination choice. In relation to the latter, note that Australia is located far distant from both the United States and particularly the United Kingdom, thus the cost of travel can play a major role in the choice of Australia as a destination. With respect to the former, whether a particular advertising campaign has been effective is, however, rather difficult to quantify and is beyond the scope of this study.11 Nonetheless, a comparison of growth trends in advertising expenditure and tourist arrivals (holiday) allow United States to make some tentative predictions about the likely effectiveness of advertising on tourism demand.
As Figures 1 to 4 show, where growth trends of tourist arrivals and advertising expenditures are graphed, advertising expenditures on each market continued to increase since 1990. In the Japanese market (Figure 1), the growth of advertising expenditure and tourist arrivals follow a similar path; as advertising expenditure was rising, tourist numbers were also rising. This trend continues until the latter part of 1990, and from 1997, the growth trend reversed, indicating possible market saturation.
11 In tourism research, evaluating the effectiveness of advertising has focused largely on the extent to which a promotional campaign stimulates visits to a particular destination. Among the various approaches such as advertising tracking and various other forms of program evaluation approaches, ‘conversion’ studies has been the most popular approach to assessing the effectiveness of tourism advertising. For a detailed discussion on various approaches see Kim, Hwang & Fesenmaier 2005.

13
Figure 1: Tourist arrivals and advertising expenditure: Japan
In the New Zealand market (Figure 2) level of advertising fluctuated (compared with Japan) with a general trend of increase and the tourist arrivals follow broadly the same path. A similar trend is evident in the United Kingdom (Figure 3), since 1991 as the advertising expenditures were growing tourist numbers were growing as well. However, the United States experience is somewhat different: in the face of rising advertising expenditure, between 1990-1998, holiday tourist numbers stagnated with a general trend of decline (Figure 4). This is indicative that advertising campaign has been less effective in the United States market as a means of stimulating demand and is consistent with the low responsiveness to advertising as reflected in the estimated elasticity coefficients.
Figure 2: Tourist arrivals and advertising expenditure: New Zealand
0
100
200
300
400
500
600
700
800
900
1980
1981
1982
1983
1984
1985
1986
1987
1988
1989
1990
1991
1992
1993
1994
1995
1996
1997
1998
1999
2000
2001
Tour
ist A
rriv
als
(000
s)
0
5
10
15
20
25
Adve
rtisi
ng E
xpen
ditu
re ($
000s
)HolidayTotalAdvertising
0
100
200
300
400
500
600
700
800
900
1980
1981
1982
1983
1984
1985
1986
1987
1988
1989
1990
1991
1992
1993
1994
1995
1996
1997
1998
1999
2000
2001
Tour
ist A
rriv
als
(000
s)
0
0.5
1
1.5
2
2.5
3
3.5
4
4.5Ad
verti
sing
Exp
endi
ture
($00
0s)
HOL
TOTAL
ADTOTAL

14
Figure 3: Tourist arrivals and advertising expenditure: United Kingdom
Figure 4: Tourist arrivals and advertising expenditure: United States
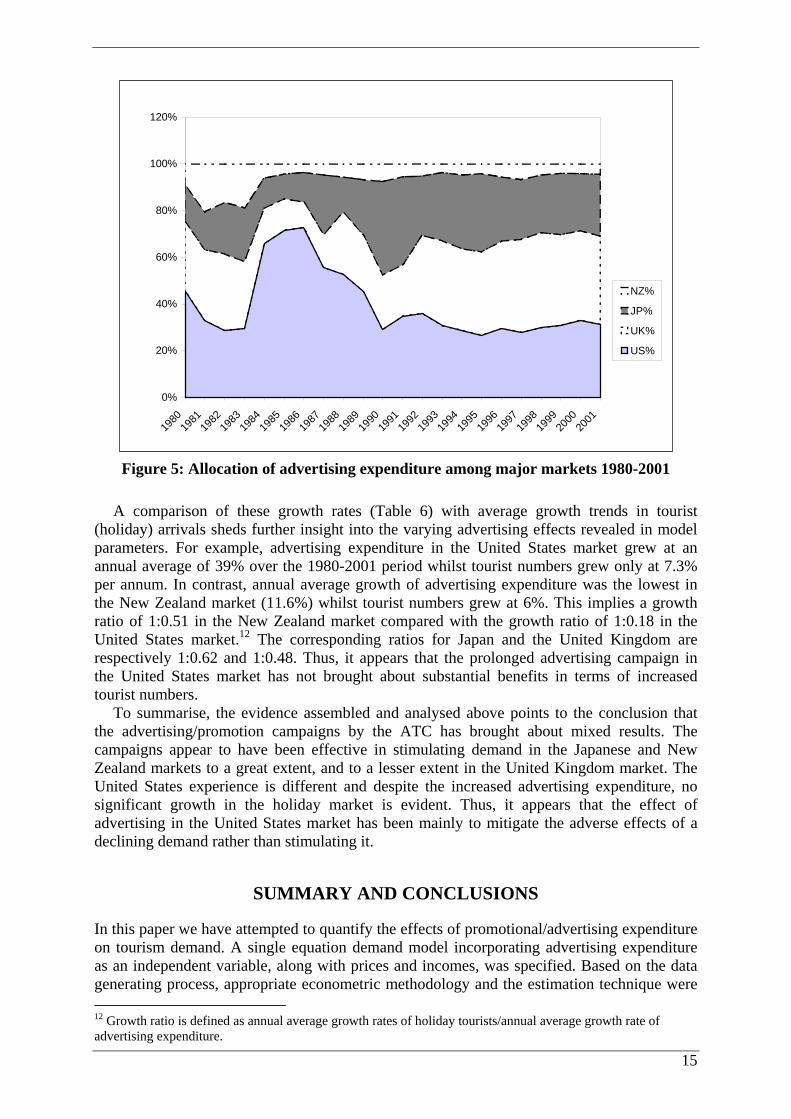
Finally, it is useful to evaluate the effects of advertising from a resource allocation point of view. As can be seen from Figure 5, where the distribution of total ATC advertising expenditure among the four major markets are graphed, a lion share of advertising expenditure has been allocated to the United States (on average 40% of the total over 1980-2001), followed by United Kingdom (29%) and Japan (24%), and only a small fraction has been spent on the New Zealand market (7%). Further, the average annual rate of growth in advertising expenditure was also the highest in the United States market over the period under consideration (39%), followed by Japan and the United Kingdom, with the lowest again being the New Zealand market.
0
100
200
300
400
500
600
700
1980
1981
1982
1983
1984
1985
1986
1987
1988
1989
1990
1991
1992
1993
1994
1995
1996
1997
1998
1999
2000
2001
Tour
ist A
rriva
ls (0
00s)
0
5
10
15
20
25
30
35
Adve
rtisi
ng E
xpen
ditu
re ($
000s
)
HolidayTotalAdvertising
0
100
200
300
400
500
600
1980
1981
1982
1983
1984
1985
1986
1987
1988
1989
1990
1991
1992
1993
1994
1995
1996
1997
1998
1999
2000
2001
Tour
ist A
rriva
ls (0
00s)
0
5
10
15
20
25
Adv
ertis
ing
Exp
endi
ture
($00
0s)
HOLTOTALAdvertising
15
Figure 5: Allocation of advertising expenditure among major markets 1980-2001
A comparison of these growth rates (Table 6) with average growth trends in tourist (holiday) arrivals sheds further insight into the varying advertising effects revealed in model parameters. For example, advertising expenditure in the United States market grew at an annual average of 39% over the 1980-2001 period whilst tourist numbers grew only at 7.3% per annum. In contrast, annual average growth of advertising expenditure was the lowest in the New Zealand market (11.6%) whilst tourist numbers grew at 6%. This implies a growth ratio of 1:0.51 in the New Zealand market compared with the growth ratio of 1:0.18 in the United States market.12 The corresponding ratios for Japan and the United Kingdom are respectively 1:0.62 and 1:0.48. Thus, it appears that the prolonged advertising campaign in the United States market has not brought about substantial benefits in terms of increased tourist numbers.
To summarise, the evidence assembled and analysed above points to the conclusion that the advertising/promotion campaigns by the ATC has brought about mixed results. The campaigns appear to have been effective in stimulating demand in the Japanese and New Zealand markets to a great extent, and to a lesser extent in the United Kingdom market. The United States experience is different and despite the increased advertising expenditure, no significant growth in the holiday market is evident. Thus, it appears that the effect of advertising in the United States market has been mainly to mitigate the adverse effects of a declining demand rather than stimulating it.
SUMMARY AND CONCLUSIONS
In this paper we have attempted to quantify the effects of promotional/advertising expenditure on tourism demand. A single equation demand model incorporating advertising expenditure as an independent variable, along with prices and incomes, was specified. Based on the data generating process, appropriate econometric methodology and the estimation technique were 12 Growth ratio is defined as annual average growth rates of holiday tourists/annual average growth rate of advertising expenditure.
0%
20%
40%
60%
80%
100%
120%
1980
1981
1982
1983
1984
1985
1986
1987
1988
1989
1990
1991
1992
1993
1994
1995
1996
1997
1998
1999
2000
2001
NZ%
JP%
UK%
US%

16
chosen. Overall, the fit of the estimated models was satisfactory; the estimated key economic parameters were statistically significant, theoretically consistent and empirically plausible in magnitudes. One exception is the income elasticity associated with the Japanese demand that appears to be overstated in its quantitative significance.
The empirical results overwhelmingly support the proposition that incomes and prices are the key economic determinants of tourism demand. However, significant variations in the effects of the two determinants were found across the source markets. Tourists from Japan and New Zealand were found to be highly sensitive to prices and incomes whereas the United Kingdom and United States tourists were less sensitive to prices but more to incomes.
The advertising variable was also found to be highly statistically significant in all four models, implying it has some economic effect on demand. The relative strength of advertising as a determinant of tourism demand varies across the major origin markets. Effects of advertising were found to be the greatest in the Japanese market, which is relatively a new source market for Australia that grew in the 1990s compared with, for example, the United Kingdom and the United States which are the traditional sources of tourists to Australia. New Zealand demand was also found to be relatively sensitive to advertising. Responsiveness to advertising was the lowest among the two traditional sources, the United Kingdom and United States, that are located distant from Australia. Despite the fact that a large proportion of advertising expenditure has been invested in these two markets, the low levels of responsiveness implied in elasticity coefficients would suggest that either advertising campaigns in these two markets have been less effective as a means of persuasion and/or that other factors dominate the choice of Australia as a destination by the tourists from these two countries. This is an area that needs further examination and is beyond the scope of this study.

17
REFERENCES
Australian Tourist Commission (2004). Inbound Tourism Trends, Year ended 31st December 2003, Australian Tourist Commission, Sydney.
Bain, J.S. (1956). Barriers to New Competition, Harvard University Press, Cambridge, MA.
Barry, K. and O’Hagan, J. (1972). ‘An econometric study of British tourist expenditure in ireland’, Economic and Social Review, 3(2): 143-61.
Bendixen, M.T. (1993). ‘Advertising effect and effectiveness’, European Journal of Marketing, 27(10): 19-32.
Comanor, W. and Wilson, T. (1974). Advertising and Market Power, Harvard University Press, Cambridge, MA.
Crouch,G.I., Schultz, L. and Valerio, P.(1992). ‘Marketing international tourism to Australia: a regression analysis’, Tourism Management, 13: 196-208.
Divisekera, S. (2003). ‘A model of demand for international tourism’, Annals of Tourism Research, 30: 31-49.
Divisekera, S. (1995). ‘An econometric models of economic determinants of international visitor flows to Australia’, Australian Economic Papers, December: 291-308.
Engle, R.F. and Granger, C.W.J. (1987). ‘Cointegration and error correction: representation, estimation and testing’, Econometrica, 55: 251-276. Granger, C.W.J. and Newbold, P. (1974). ‘Spurious regressions in econometrics’, Journal of Econometrics, 2: 111-120.
Industries Assistance Commission (1989). Travel and Tourism, Report No. 423, Industries Assistance Commission, Canberra.
Kim, D.-Y., Hwang Y.-H. and Fesenmaier, D.R. (2005). ‘Modelling tourism advertising effectiveness’, Journal of Travel Research, 44(1): 42-49. Krishnamurthi, L. and Raj, S.P. (1985). ‘The effect of advertising on consumer price sensitivity’, Journal of Marketing Research, 22(May): 119-129.
Kulendran, N., (1996). ‘Modelling quarterly tourist flows to Australia using cointegration analysis’, Tourism Economics, 2(3): 203-222.
Mitra, A and Lynch, J.G. (1995). ‘Towards a reconciliation of market power and information theories of advertising effects on price elasticity’, Journal of Consumer Research, 21: 664-659.
Moriarty, M. (1983). ‘Feature advertising-price interactions in the retail environment’, Journal of Retailing, 59: 80-98.
Nelson, P.H. (1974). ‘Advertising as information’, Journal of Political Economy, 81: 729-745.
O’Hagan, J.W. and Harrison, M.J. (1984). ‘Market shares of United States tourist expenditure in Europe: an econometric analysis’, Applied Economics, 16: 919-931.

18
Papadopoulos, S. (1987). ‘Strategic marketing techniques in international tourism’, International Marketing Review, Summer: 171-84.
Phillips, P.C.B. and Hansen, B.E. (1990). ‘Statistical inference in instrumental variables regressions with I(I) processes’, Review of Economic Studies, 57(1): 99-125.
Phillips, P.C.B. and Loretan, M. (1991). ‘Estimating long-run economic equilibria’, Review of Economics and Statistics, 58(1): 407-436.
Siegel, W. and Ziff-Levine, W. (1990). ‘Evaluating tourism advertising campaigns: conversions vs. advertising tracking studies’, Journal of Travel Research, 28(3): 51-55.
Stiglar, G (1961). ‘The economics of information’, Journal of Political Economy, 69: 213-225.
Taylor L.D. and Weiserbs, D. (1972). ‘Advertising and the aggregate consumption function’, American Economic Review, 62: 642-655.
Telser, L.G. (1964). ‘Advertising and competition’, Journal of Political Economy, 72: 537-562.
Uysal, M., and Crompton, J. (1984). ‘Determinants of demand for international tourist flows to Turkey’, Tourism Management, 5(4): 288-97.