effects of additive concentrations on cement rheology at
TRANSCRIPT

International Journal of Engineering Works
ISSN-p: 2521-2419 ISSN-e: 2409-2770
Vol. 6, Issue 03, PP. 50-70, March 2019 https://www.ijew.io/
© Authors retain all copyrights 2019 IJEW. This is an open access article distributed under the CC-BY License, which permits
unrestricted use, distribution, and reproduction in any medium, provided the original work is properly cited.
Effects of Additive Concentrations on Cement Rheology at Different
Temperature ConditionsIkpeka Princewill Maduabuchi
1, Odo Jude Emeka
1, Benedict Ugochukwu Wisdom
1, Utojiuba Ifeanyi Davida
1,
Uzuegbu Godson Chizirim2
1Department of Petroleum Engineering, Federal University of Technology, Owerri
2Haliburton Oil Services
Received: 29 December, Revised: 06 January, Accepted: 12 February
Abstract— Cement slurries are designed to achieve zonal isolation; improve rheological properties and displacement efficiency of cementing system. Oil well cement slurries depend on temperature, additive concentrations; quality and quantity, to contribute to the placement and success of cementing operation. This study aims at analysing the effects of cement slurry additive concentration on rheology at different temperature conditions. Three additive concentrations were varied; Retarder, Fluid Loss Additive and Dispersant. Using full factorial design, 27 experiments were carried out to analyse the effect of these additives at different temperatures. Rheological properties like plastic viscosity, yield stress, shear rate and shear stress were experimentally determined at different temperatures and concentrations of additives. A simple cement slurry design which consists of: Dyckerhoff Class G, Fluid Loss Additive, Retarder, Dispersant, Defoamer and Drill Water, was used for the laboratory experiments. The slurry was conditioned in accordance with the procedure set out in API RP 10B-2. Linear regression was then used to build models describing the effect of temperature and additive concentration on plastic viscosity and yield point of the cement slurry. Ms-Excel plots were used as a tool in presenting the relationships between Shear Stress and shear rates at varying temperature conditions. Results from the analysis reveal that for a Temperature increase of 125% and Retarder concentration increase of 200%, there were significant decline in Plastic viscosity (-41%) and Yield point (-44%). Whereas increasing the Fluid loss additive by 100% caused a significant increase in Yield point (+51%) and relatively insignificant increase in Plastic Viscosity (+4.4%).
Keywords— Oil Well Cementing, Class G Cement Slurry
design, Cement rheology, Effect of temperature on cement
slurry, Cement additive concentration.
I. INTRODUCTION
In drilling engineering, cement is used for a number of different reasons; cementing protects and seals the wellbore. Most commonly, cementing is used to permanently shut off water penetration into the well. Part of the completion process of a prospective production well, cementing can be used to seal
off annulus after a casing string has been run in the wellbore and it is also used to plug a well to abandon it. Additionally, cementing is used to seal a lost circulation zone or an area where there is a reduction or absence of flow within a well. In directional drilling, cement is used to plug an existing well, in order to run a directional well from that point.
Rheology is the study of flow of matter, primarily in liquid state, the relation of flow/deformation behaviour of fluids with its internal structure, under applied forces which is routinely measured using a rheometer. Rheology describes the relationship between force, deformation and time. Rheology is an extremely important property of drill-in-fluids, workover and completion fluids, cements and specialty fluids. A rheometer is a laboratory device used to measure the flow response of a liquid to applied forces (i.e. it measures the rheological properties of the fluid). A rotational or shear rheometer measures applied shear stress. Mud rheology is measured on a continual basis while drilling and adjusted with additives or dilution to meet the needs of the operation. In water-base fluids, water quality plays an important role in how additives perform.
The particle size distribution (fineness) is an important parameter with respect to cement reactivity and slurry rheology. The development of compressive strength is often dependent on cement surface area; cements with narrow particle size distributions tend to develop higher compressive strength (Michaux et al., 1990). The rheological behaviour of cement depends on different factors such as: water-to-cement ratio, size and shape of cement grains, chemical composition of the cement, type and amount of additive, mixing and testing procedures, temperature and pressure.
Most fluids exhibit a shear-rate dependent viscosity which is non-trivial to characterize, but for fluids such as cement slurries, the viscosity is not only a function of shear rate currently applied, but also of the past shear history. They exhibit a time dependent behaviour which is more difficult to characterize (Nelson and Guillot, 2006).
A sound knowledge of rheology of cement slurry is required for a successful cementing operation for the following reasons;
International Journal of Engineering Works Vol. 6, Issue 03, PP. 50-70, March 2019
www.ijew.io
i. Evaluation of slurry mixability (i.e to understand the
interaction between different ingredients in a material
to get an insight into its structure) and pumpability
(i.e to evaluate the capability of a slurry or paste to
transport large particles (e.g, some lost circulation
materials and fibers).
ii. Determination of appropriate flow regime for
placement of cement slurry (i.e to control the quality
of a raw material by measuring its rheological
properties.
iii. Determination of the displacement rate required to
achieve optimum mud removal.
iv. Determination of pressure versus depth relationship
during and after cement slurry placement.
v. The acceptance/rejection of a product can be
determined based on rheological results.
vi. To evaluate how the temperature profile affects the
placement of slurry.
Temperature can have drastic effect on cement slurry rheology but the extent of this effect is highly dependent on the type of cement and the additives. Water-cement ratio is the ratio of the weight of water to the weight of cement used in a concrete mix. A lower ratio leads to a higher strength and durability but may make the mix difficult to work with and a higher ratio leads to segregation of the sand and aggregate components from the cement paste. Cement hardens/sets as a result of the chemical reaction between cement and water. When Portland cement reacts with water, the system cement plus water undergoes a net volume diminution. This is an absolute volume decrease, and occurs because the absolute density of the hydrated material is greater than that of the initial reactants. Despite the decrease in absolute volume, the external dimensions of the set cement or the bulk volume remain the same or slightly increase (Arnoldus M.A and Ade L., 2016). The water-to-cement ratio required to wet the cement particle and prepare a pumpable slurry is directly related to the surface area. (Shuker et al, 2014).
1.2 Statement of problem In Oil Well drilling, one of the goals of a good well
completion is a successful cementing job. To avoid bad cementing jobs, the cement system must be designed to be pumped under conditions such as can be anticipated within the pressure and temperature conditions of the downhole strata. (Michaux M. et al, 1990). Designing cement slurry can be quite tricky because there are varying elements that can easily alter the cement properties. Modelling cement behaviour is also quite challenging because of the need to simulate down-hole conditions in the laboratory. How do we ascertain the effect of some of these elements on the cement slurry design? Although there are existing models to help achieve good slurry design, these models are built on fundamental relationship between shear rate, shear stress, time, temperature and pressure.
1.3 Aim of study The primary objective of this study is to analyse the
rheology of cement (class G) under various conditions of Temperature and additive concentration. Other objectives include:
i. To study the effect of varying retarder concentration
on overall cement rheology
ii. To study the effect of varying dispersant
concentration on overall cement rheology
iii. To study the effect of varying fluid loss additive
concentration on overall cement rheology
iv. To study the behaviour of the cement slurry with
varying temperatures
1.4 Significance of study This study helps in modelling the flow regime which helps
the cement or mud engineer also known as the mixer to know what proportion of different components to use to understand the rheology of cement. The study also helps to predict cement rheology under various conditions of Temperature and additive concentration..
II. PREVIOUS WORKS ON CEMENT RHEOLOGY
Doherty D.R. et al., (2010), in his research on “pushing Portland cement beyond the norm of extreme high temperature”, designed a high temperature cement that can be applied when extracting energy contained within coal in a process known as Underground Coal Gasification (UGC). Modified Bingham equations were generated that characterised the results obtained from the experiment carried out. The flow regime both in the drill pipe and at the annulus was predicted with densities obtained from the laboratory; therefore, at these different conditions of varying temperature, water-cement ratio and additive concentration, the flow regimes were predicted so as to know at what condition to pump cement downhole.
Olowolagba, K. and Brenneis C. (2010) researched on “Techniques for the study of foamed cement technology”. They presented methods and laboratory equipment that enable a more accurate assessment of foamed cement used to provide zonal isolation in oil and gas wells by analysing rheology-testing results using the “bob and sleeve” conventional rotational viscometer and the Fann Yield Stress Adapter (FYSA). After analysing the viscosity plot, it was noticed that the bob and sleeve viscometer does not accurately measure the viscosities of the foamed cement at the different foam qualities. Also, rheology measured with FYSA showed higher YPs and also higher and stable viscosities at low shear rates compared to the bob and sleeve.
Kelessidis V.C et al., (2014) carried out a research on “Comprehensive assessment of additive and class G cement properties affecting rheology, fluid loss, setting time and long term characteristics of elastic cements”. The aim was to present a comprehensive laboratory assessment of the properties of two different non-foamed cement slurries, by combining initial tests, such as rheology, fluid loss, and thickening time, with strength, ultrasonic and advanced Nuclear Magnetic Resonance (NMR) measurements, at both room and elevated pressure and temperature. To achieve the objective, the cement microstructure was correlated with the mechanical properties of cement at borehole conditions, acquiring critical information for designing better sheath integrity. A very good correlation was found between the microscopic NMR data that probe the evolution of the average pore size and consequently the
International Journal of Engineering Works Vol. 6, Issue 03, PP. 50-70, March 2019
www.ijew.io
kinetics of hydration with macroscopic comprehensive strength data.
Haichuan L. et al., (2015), in a research on “Cement slurries with rheological properties unaffected by temperature”, tend to resolve the problem of varying rheological properties with a change of temperature. Cement slurry with temperature-insensitive viscosity was being prepared by adding a type of thermo-sensitive viscosity controller (TVC). The experiment showed that the cement slurry had relatively temperature-stability rheological properties and shows very little thermal thinning between 20 and 120oC. In addition, the thermally-stable-viscosity cement slurry had good stability and a performance that can meet the demands of well cementing.
Bakirov D.L et al., (2016), in a research on “Cement for temperature range 160-300oC” made a study concerned with thermal resistant cements designed for cementing the casing strings with thermal gas treatment of the formation drilled in the Srende-Nazymkoe Field of the JSC RITEK. Methods were studied to increase thermal resistance of plant-manufactured cements and methods to augment the strength of the cement stone formed at hardening temperatures of up 90oC. Further modifications of the cements ThermoLight-9 (300) and ThermoLight-4 (160), which were resistant to thermal treatment, having the ultimately low thermal conductivity were produced. The parameters of the developed cements were stable and predictable both in atmospheric and barothermal conditions. The developed cements had an increased WOC (48hours) required for the formation of the right crystalline structure.
Okoro O. Nwakpu G., (2017), made a research on “determination of cement rheology and flow regime prediction” to determine the flow parameters of class E and G cement samples, also, created a model that relates the shear stress of cement slurry with its velocity gradient. Modified Bingham equations were generated that characterised the results obtained from the experiment carried out. The flow regime both in the drill pipe and at the annulus were predicted with densities obtained from the laboratory, therefore, at these different conditions of varying temperature, water-cement ratio and additive concentration, the flow regimes were predicted so as to know at what condition to pump cement downhole. It was concluded that additive concentration and temperature have effects on the rheology of cement i.e. the higher the temperature, the higher the plastic viscosity, and the higher the yield point, also, at lower temperature, the yield point was directly proportional to additive concentration and at lower temperature, the yield point was inversely proportional to the concentration of additive. It was stated that Rheology is also dependent on the ratio of water to cement, i.e. at low and high water-cement ratios, the plastic viscosity was high.
III. MATERIAL AND METHOD
Seven (7) different cement slurries were prepared for this study. The first case was assumed to be the base case, whereas the remaining six (6) composed of varying concentrations of the first sample and they were labelled Recipe 1-6. The Cement slurries used for this study consist of:
i. Dyckerhoff Class G
ii. Fluid Loss Additive
iii. Retarder
iv. Dispersant
v. Defoamer
vi. Drill Water
Apparatus used in the laboratory experiments include: sieve, weighing scale, mixing blender, Fann viscometer, atmospheric consistometer and measuring cylinder.
The following are the laid down procedures involved in carrying out the experiment:
i. The cement and additive were sieved and weighed
using a sieve and weighing scale respectively.
Whereas, the volume of water was measured using
the measuring cylinder.
ii. The slurry was formed by mixing the cement, water
and additive to form a homogenous substance, using
the mixing blender.
iii. The slurry (i.e. cement, water and fluid loss additive)
was conditioned, following the correct mixing
procedure (refer to API RP 10B-2).
iv. The slurry was conditioned following the procedure
set out in API RP 10B-2 to ensure that the
atmospheric consistometer is at 80˚F prior to
commencing conditioning.
v. The slurry was conditioned for 30 min ± 30s at test
temperature. In this case 80oF, 130oF and 180oF.
vi. When the slurry was conditioned, the bob, sleeve and
thermo-cup were pre-heated to test temperature.
vii. With the Fann viscometer turning at 3 rpm, the cup
was raised until the liquid level covers the scribed
line on the rotating sleeve.
viii. Then the dial readings were recorded on the
paperwork 10 seconds after continuous rotation.
ix. Immediately the speed was changed and the
remaining dial readings were taken 10 seconds after
each speed change.
x. Also dial readings were read and recorded in
ascending then descending order as shown: 3 – 6 – 30
– 60 – 100 – 200 – 300 - 600 – 300-200 – 100 – 60 –
30 – 6 – 3
3.1 Design of Experiment
The full factorial design was used to determine the number of
experiment to be carried. The number of experiment to be
carried out is given by equation (1):
(1) Where:
L = Level (3 levels: Base Case, Additive Concentration 1, and
Additive Concentration 2)
K = no of factors (Temperature, Concentration)
Thus nine (9) experiments were performed each for each
additive concentration. Since three (3) additive concentrations were studied, a total of 27 experiments were conducted as shown in table 2.
International Journal of Engineering Works Vol. 6, Issue 03, PP. 50-70, March 2019
www.ijew.io
Table 1 - Design of Experiment
S/
N
Temperatu
re Factor
Retarder
Concentrati
on
Fluid Loss
Additive
Concentrati
on
Dispersant
Concentrati
on
1 0 0 0 0
2 1 0 0 0
3 2 0 0 0
4 0 1 1 1
5 1 1 1 1
6 2 1 1 1
7 0 2 2 2
8 1 2 2 2
9 2 2 2 2
IV. RESULTS
Results from the 27 laboratory experiments are presented in
tables 2 to table 8.
Slurry Details;
Density: 15.8ppg
BHCT: 80degF, 130degF and 180degF
Table 2: Base Case
Concentration Material S.G Test
Amount
100%BWOC Dyckerhoff Class G 3.18 781.17g
0.5% BWOC Fluid Loss Additive 1.37 3.91g
0.1% BWOC Retarder 1.16 0.78g
0.05% BWOC Dispersant 0.92 0.39g
0.02 GPS Defoamer 1.28 1.28g
44.69 L/100Kg Drill Water 1.00 348.44g
Rheology Result;
Temp(oF)
600rp
m
300rp
m
200rp
m
100rp
m
6rp
m
3rp
m
80 400 241 181 111 14 9
130 318 192 144 90 12 8
180 280 170 129 81 12 8
Table 3: Recipe 1
Concentration Material S.G Test
Amount
100%BWOC Dyckerhoff Class G 3.18 781.01g
0.5% BWOC Fluid Loss Additive 1.37 3.91g
0.2% BWOC Retarder 1.16 1.56g
0.05% BWOC Dispersant 0.92 0.39g
0.02 GPS Defoamer 1.28 1.28g
44.62 L/100Kg Drill Water 1.00 347.81g
Rheology Result;
Temp(o
F)
600rp
m
300rp
m
200rp
m
100rp
m
6rp
m
3rp
m
80 322 188 136 79 8 6
130 275 158 118 71 8 5
180 240 145 109 67 8 5
Table 4: Recipe 2
Concentration Material S.G Test
Amount
100%BWOC Dyckerhoff Class G 3.18 780.85g
0.5% BWOC Fluid Loss Additive 1.37 3.90g
0.3% BWOC Retarder 1.16 2.34g
0.05% BWOC Dispersant 0.92 0.39g
0.02 GPS Defoamer 1.28 1.28g
44.55 L/100Kg Drill Water 1.00 347.19g
Rheology Result;
Temp(o
F)
600rp
m
300rp
m
200rp
m
100rp
m
6rp
m
3rp
m
80 318 180 131 76 8 5
130 268 156 116 69 8 5
180 234 140 106 67 8 5
Table 5: Recipe 3
Concentration Material S.G Test
Amount
100%BWOC Dyckerhoff Class G 3.18 780.4g
0.75% BWOC Fluid Loss Additive 1.37 5.85g
0.1% BWOC Retarder 1.16 0.78g
0.05% BWOC Dispersant 0.92 0.39g
0.02 GPS Defoamer 1.28 1.27g
44.59 L/100Kg Drill Water 1.00 347.26g
Rheology Result;
Temp(o
F)
600rp
m
300rp
m
200rp
m
100rp
m
6rp
m
3rp
m
80 562 366 279 174 26 17
130 480 320 244 156 25 16
180 456 290 224 143 25 16
Table 6: Recipe 4
Concentration Material S.G Test
Amount
100%BWOC Dyckerhoff Class G 3.18 779.63g
1.0% BWOC Fluid Loss Additive 1.37 7.80g
0.1% BWOC Retarder 1.16 0.78g
0.05% BWOC Dispersant 0.92 0.39g
0.02 GPS Defoamer 1.27 1.27g
44.48 L/100Kg Drill Water 1.00 346.09g
Rheology Result;
Temp(o
F)
600rp
m
300rp
m
200rp
m
100rp
m
6rp
m
3rp
m
80 U2R 514 397 259 41 27
130 U2R 450 350 229 40 27
180 U2R 430 331 211 37 24
N/B: U2R means Unable to Read because the slurry was too
viscous.

International Journal of Engineering Works Vol. 6, Issue 03, PP. 50-70, March 2019
www.ijew.io
Table 7: Recipe 5
Concentration Material S.G Test
Amount
100%BWOC Dyckerhoff Class G 3.18 780.92g
0.5% BWOC Fluid Loss Additive 1.37 3.90g
0.1% BWOC Retarder 1.16 0.78g
0.15% BWOC Dispersant 0.92 1.17g
0.02 GPS Defoamer 1.28 1.28g
44.64 L/100Kg Drill Water 1.00 347.91g
Rheology Result;
Temp(o
F)
600rp
m
300rp
m
200rp
m
100rp
m
6rp
m
3rp
m
80 340 198 144 87 14 10
130 276 172 129 80 14 10
180 240 150 112 72 13 10
Table 8: Recipe 6
Concentration Material S.G Test
Amount
100%BWOC Dyckerhoff Class G 3.18 780.54g
0.5% BWOC Fluid Loss Additive 1.37 3.90g
0.1% BWOC Retarder 1.16 0.78g
0.3% BWOC Dispersant 0.92 2.34g
0.02 GPS Defoamer 1.28 1.28g
44.56 L/100Kg Drill Water 1.00 347.11g
Rheology Result;
Temp(o
F)
600rp
m
300rp
m
200rp
m
100rp
m
6rp
m
3rp
m
80 280 156 110 61 6 4
130 206 118 86 50 6 4
180 186 106 78 46 5 4
V. ANALYSIS AND DISCUSSION
5.1 Effect of Retarder Concentration on Cement Slurry
Rheology at Specified temperatures: 80oF, 130
oF &180
oF
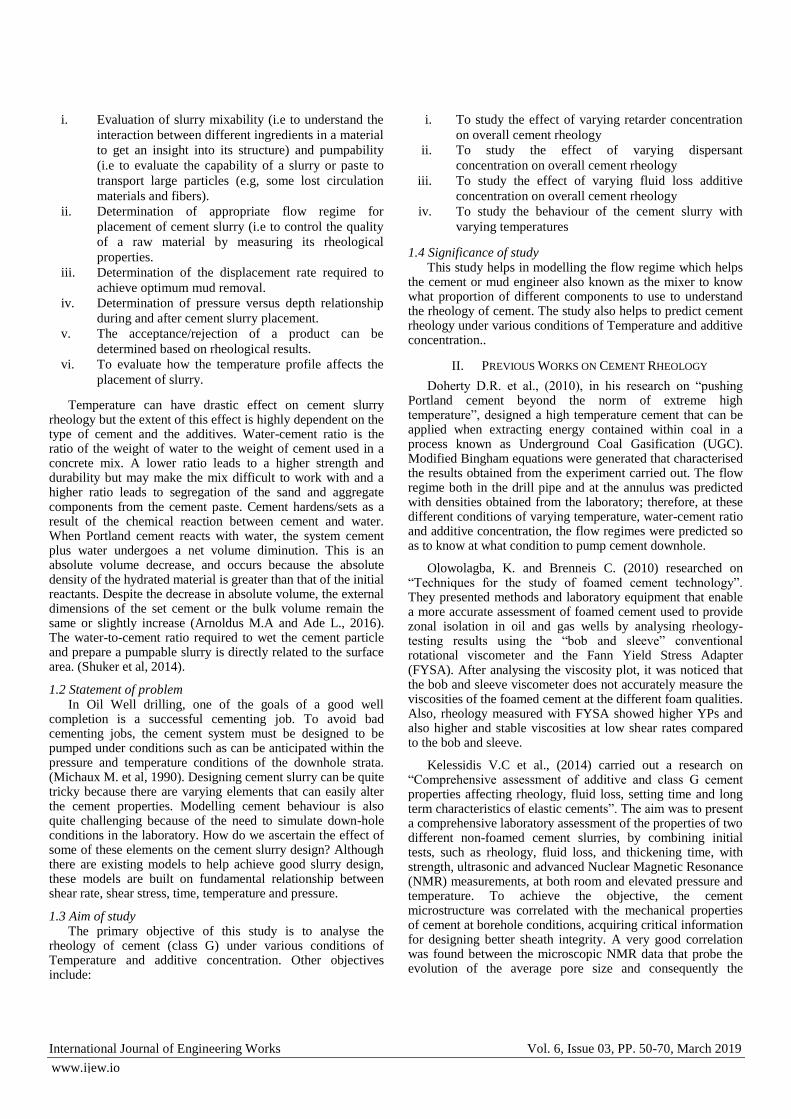
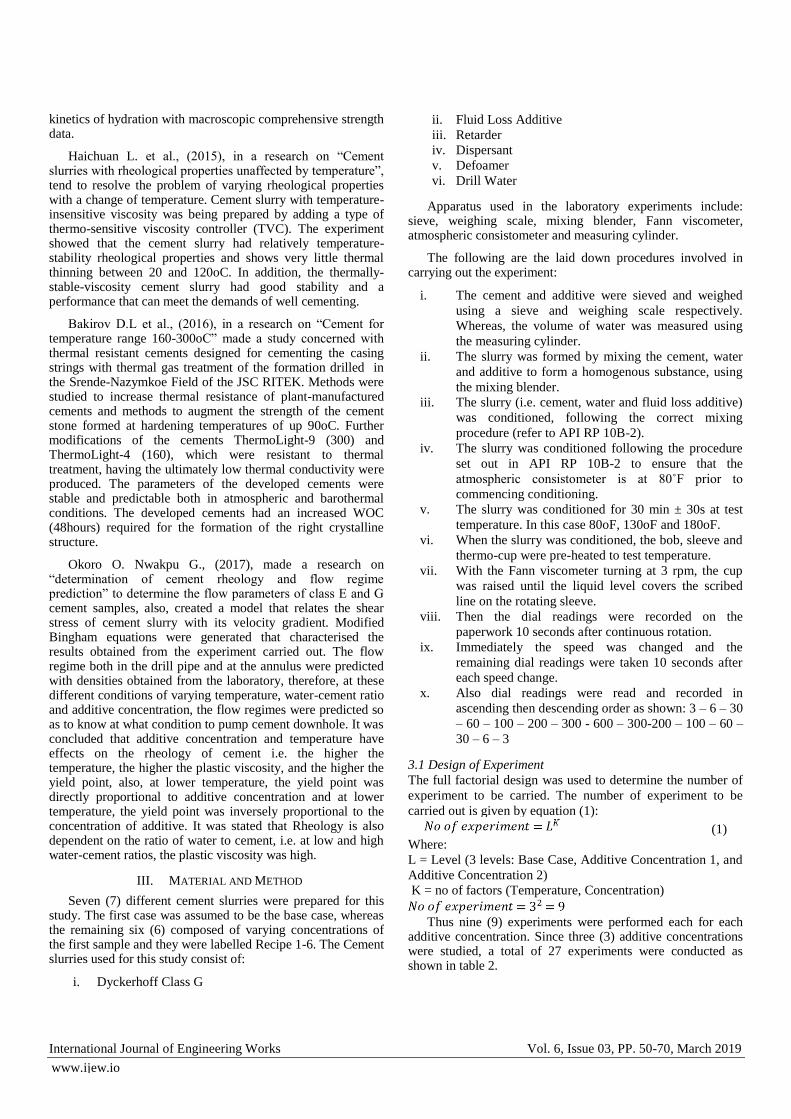
There were significant changes in the shear stress- shear rate plot @ 80oF, 130oF, and 180oF for the base case (Fig 1) compared to recipes 1&2 (Fig A.1 & A.2 in the appendix section). It was observed that increasing the concentration of the additive (retarder) above 0.1% (base case), there will be no significant change in the shear stress- shear rate plot at different temperatures.
Figure 1: Graph of Shear stress against Shear rate for Base case @
80oF, 130o F, & 180oF
However, when the concentration and temperature of the
retarder is increased, there will be a corresponding decrease in shear stress at constant shear-rate.
Figure 2: Graph of Shear stress against Shear rate for base case,
recipe 1 & recipe 2 @ 80oF
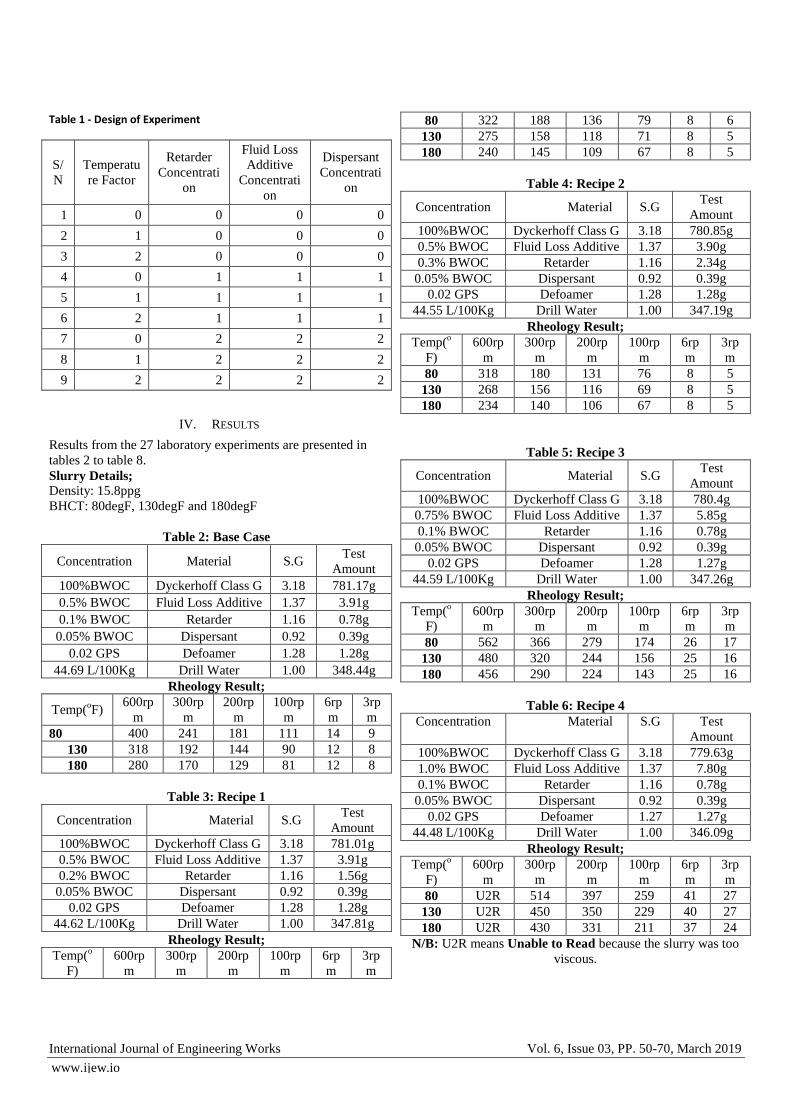
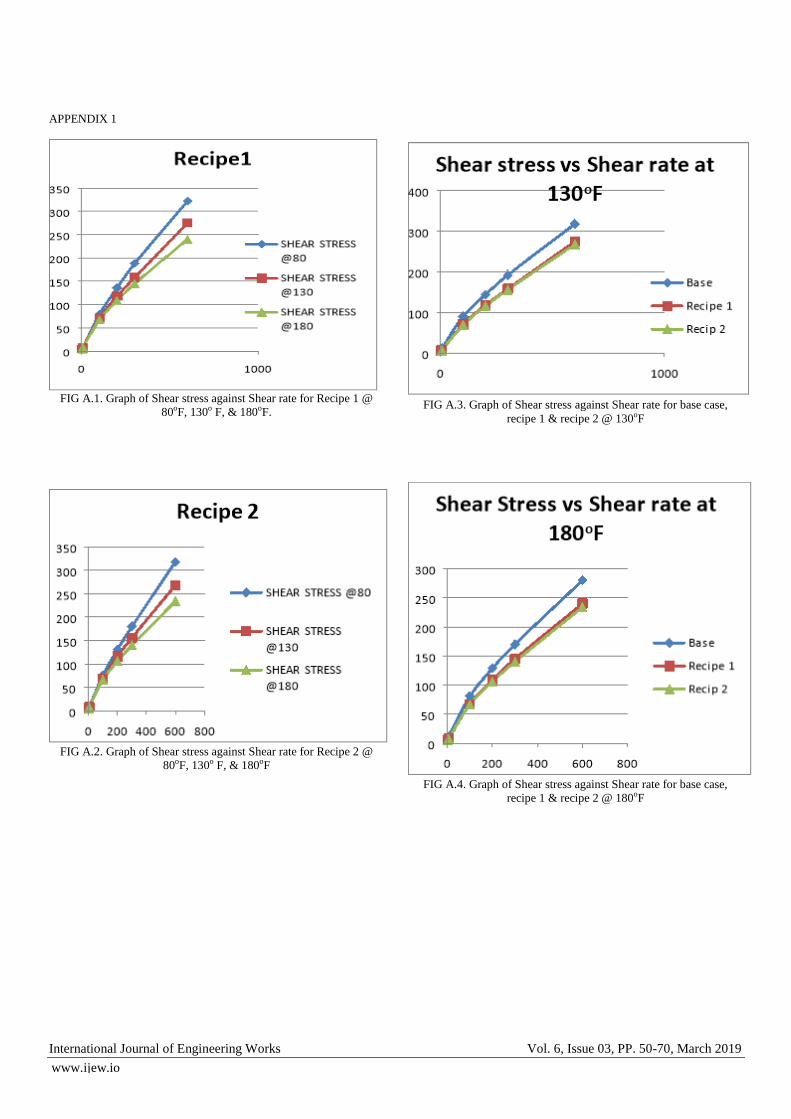
A plot of shear stress vs shear rate as shown in Figure 2
revealed decreasing effect of retarder concentrations on cement rheology. This flow behaviour is consistent even with increase in Temperature as shown in Fig A.3 and A.4 in the appendix section. At each temperature, there was change in shear-stress-shear rate plot in base case, recipe 1& 2 (i.e. increasing the temperature, reduces the shear-stress at constant shear-rate).

International Journal of Engineering Works Vol. 6, Issue 03, PP. 50-70, March 2019
www.ijew.io
Figure 3: Graph of Plastic viscosity against Temperature for base
case, recipe 1 & recipe 2
An increase in temperature will cause a corresponding
decrease in plastic viscosity. As concentration increased 0.1%, there was no significant change between recipe 1&2 compared to the base case, as shown in Figure 3.
Figure 4: Graph of yield point against temperature for base case,
recipe 1 & recipe 2
The plot in Figure 4 represents the relationship between yield point and temperatures at 80oF, 130oF and 180oF for base case, recipe 1 & recipe 2. From the plot, an increase in temperature and concentration will cause a decrease in the yield stress, thereby reducing the force required to cause the cement slurry to flow.
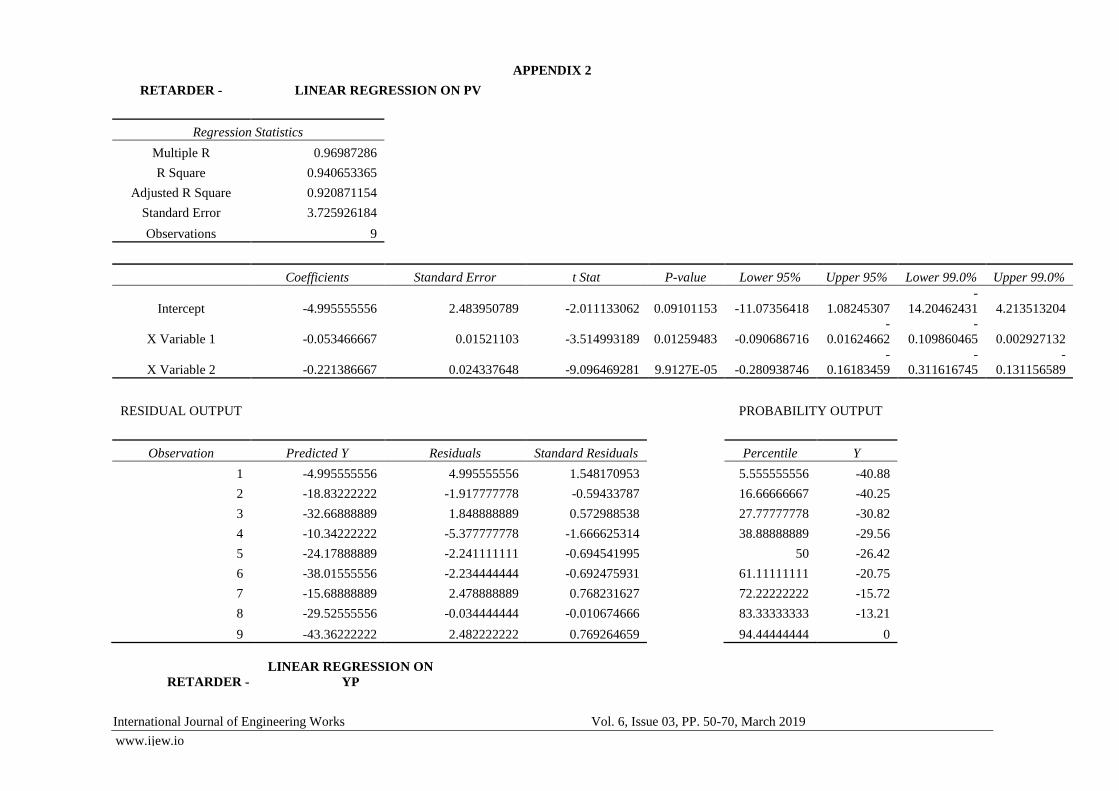
5.1.1 Regression Analysis
Table 9: Factorial design for analyzing effect of retarder concentration
S/
N
Retarder
Concentratio
n (%)
Temperatur
e
Factor (%)
Plastic
Viscosity
(%)
Yield
Point (%)
1 0 0 0 0
2 0 62.5 -20.75 -19.51
3 0 125 -30.82 -26.83
4 100 0 -15.72 -34.15
5 100 62.5 -26.42 -50
6 100 125 -40.25 -39.02
7 200 0 -13.21 -48.78
8 200 62.5 -29.56 -46.34
9 200 125 -40.88 -43.9
(2)
(3)
Where:
PV – Plastic Viscosity
YP – Yield Point
RC – Retarder Concentration
TF – Temperature Factor
5.2 Effect of Fluid Loss Additive Concentration on Cement
Slurry Rheology at Specified temperatures: 80oF, 130
oF
&180oF
Figure 5 Graph of Shear stress against Shear rate for Base case @
80oF, 130o F, & 180oF
From Figure 5 showing the effects of fluid loss additive on
shear stress- shear rate for base case, recipes 3&4 (Fig A.5 and

International Journal of Engineering Works Vol. 6, Issue 03, PP. 50-70, March 2019
www.ijew.io
A.6 in the appendix section), at different temperatures, it can be deduced that an increase in the concentration of fluid loss additive for each case will cause a significant increase in shear stress at constant shear rate thereby making the fluid more viscous to flow at constant temperatures. Moreover, it was observed that the increase in the shear stress curve for each case @ 80oF was significantly higher compared to temperatures at 130oF and 180oF i.e. shear stress will be higher at lower temperature than at higher temperature.
For recipe 4, the fluid was too viscous to flow, as a result, shear stress at 600rpm could not be recorded as well as plastic viscosity and yield point.
Figure 6. Graph of Shear stress against Shear rate for base case,
recipe 3 & recipe 4 @ 180oF
Figure 6, describes the shear stress- shear rate relationship for each case at temperatures of 180oF. There was a noticeable decline in the plot for Recipe 4 at shear rate of 300rpm because the cement slurry at that concentration was too viscous to flow. Decreasing the temperature increases the shear stress for each case. Moreover, increasing the concentration increases the viscosity of the cement slurry. The relationship at 80 oF and 130 oF are shown in Fig A.7 and A.8 in the appendix section.
Figure 7 Graph of Plastic viscosity against Temperature for base
case, recipe 3 & recipe 4
This graph above shows the relationship between plastic
viscosity and temperature for each case. It was observed that plastic viscosity is inversely proportional to the temperature (i.e an increase in temperature will cause a decrease in the plastic viscosity). Plastic viscosity for Recipe 4 was not determined due to the viscometer’s inefficiency to read the value of shear stress at 600rpm because the concentration was too high as well as the viscosity.
Figure 8. Graph of Yield Point against Temperature for base case,
recipe 3 & recipe 4
Figure 8 shows the relationship between yield point and
temperature for each case, yield point also decreases with an increase in temperature.
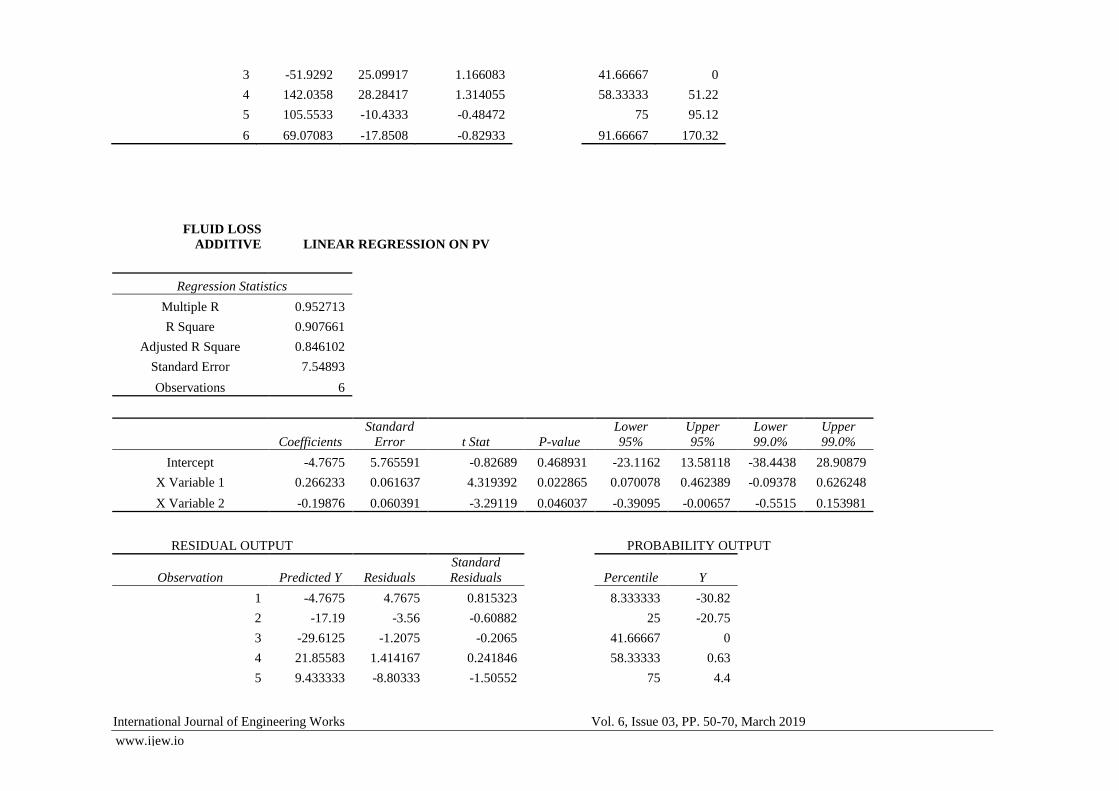
5.2.1 Regression Analysis
Table 10: Factorial design for analyzing effect of Fluid Loss Additive concentration
S/
N
Fluid Loss
Additive
Concentration (%)
Temperatur
e
Factor (%)
Yield
Point
(%)
Plastic
Viscosit
y (%)

International Journal of Engineering Works Vol. 6, Issue 03, PP. 50-70, March 2019
www.ijew.io
1 0 0 0 0
2 0 62.5 -19.51 -20.75
3 0 125 -26.83 -30.82
4 100 0 170.32 23.27
5 100 62.5 95.12 0.63
6 100 125 51.22 4.4
7 200 0 N/A N/A
8 200 62.5 N/A N/A
9 200 125 N/A N/A
(4)
(5)
Where:
PV – Plastic Viscosity
YP – Yield Point
FLAC – Fluid Loss Additive Concentration
TF – Temperature Factor
* N/A – At higher concentrations of Fluid loss Additives the
slurry was too thick to take readings of PV and YP
5.3 Effect of Dispersant Concentration on Cement Slurry
Rheology at Specified temperatures: 80oF, 130
oF &180
oF
Figure 9. Graph of Shear stress against Shear rate for base case @
80oF, 130o F, & 180oF
Figure 10. Graph of Shear stress against Shear rate for Recipe 5 @
80oF, 130o F, & 180oF
Figure 11. Graph of Shear stress against Shear rate for Recipe 6 @
80oF, 130o F, & 180oF
The charts (Figure 9, 10 & 11) show the relationship for
each case at different temperatures. Increasing the concentrations of the additive at constant temperatures, the shear stress decreases as well thereby reducing the viscosity of the cement slurry. From the above, there was a more significant change in the shear stress- shear rate plot between temperature @ 80oF and that @ 130oF and 180oF for recipe 6 compared to other cases.

International Journal of Engineering Works Vol. 6, Issue 03, PP. 50-70, March 2019
www.ijew.io
Figure 12. Graph of Shear stress against Shear rate for base case,
recipe 5 & recipe 6 @ 80oF
Figure 13. Graph of Shear stress against Shear rate for base case,
recipe 5 & recipe 6 @ 130oF
Figure 14 Graph of Shear stress against Shear rate for base case,
recipe 5 & recipe 6 @ 180oF
From the above Figure (Fig 12, 13 and 14), the shear stress
reduces with an increase in concentration and temperature.
Figure 15. Graph of Plastic viscosity against Temperature for base
case, recipe 5 & recipe 6
The above Figure (Fig 15) shows the relationship between
plastic viscosity and temperature. Increase in temperature causes a corresponding decrease in plastic viscosity.

International Journal of Engineering Works Vol. 6, Issue 03, PP. 50-70, March 2019
www.ijew.io
Figure16. Graph of Yield point against Temperature for base case,
recipe 5 & recipe 6
The graph above (Fig 16) shows the relationship between
yield point and temperature for different cases (base case,
Recipe 5 and Recipe 6). For the base case, an increase in
temperature causes a corresponding decrease in yield point,
therefore the resistance to flow will decrease with an increase
in temperature.
For recipe 5, there was an increase in yield point as the
temperature was initially increased @ 130oF. This shows that
maximum stress required for fluid flow was attained at that
temperature and concentration of additive and above that
temperature, yield point was decreased; reducing the
resistance to flow.
For recipe 6, there was a slight decrease in yield point as
temperature was increased.
5.3.1 Regression Analysis
Table 11: Factorial design for analyzing effect of Dispersant
concentration
S/
N
Dispersant
Concentratio
n (%)
Temperatur
e
Factor (%)
Plastic
Viscosity
(%)
Yield
Point (%)
1 0 0 0 0
2 0 62.5 -20.75 -19.51
3 0 125 -30.82 -26.83
4 100 0 -10.69 -31.70
5 100 62.5 -34.59 -17.07
6 100 125 -43.40 -26.83
7 200 0 -22.01 -60.98
8 200 62.5 -44.65 -63.41
9 200 125 -49.69 -68.29
(6)
(7)
Where:
PV – Plastic Viscosity
YP – Yield Point
DC – Dispersant Concentration
TF – Temperature Factor
CONCLUSION
From the above experimental results and analysis in chapter four, it has been demonstrated that the rheological properties of OWC slurries are highly dependent on temperature; both shear stress, yield stress and plastic viscosity increased nonlinearly with corresponding temperature. The following conclusions can be drawn:
i. An increase in the concentration and temperature of
the retarder will cause a corresponding decrease in
shear stress at constant shear-rate.
ii. An increase in temperature will cause a
corresponding decrease in plastic viscosity and yield
stress when retarder is added to the cement slurry.
iii. It can be deduced that an increase in the
concentration of fluid loss additive for each case will
cause a significant increase in shear stress at constant
shear rate thereby making the fluid more viscous to
flow at constant temperatures.
iv. An increase in temperature will cause a
corresponding decrease in the plastic viscosity and
yield point when a fluid loss additive is added to the
slurry.
v. Increasing the concentrations of the dispersant at
constant temperatures, the shear stress decreased;
thereby reducing the viscosity of the cement slurry.
vi. Increase in temperature causes a corresponding
decrease in plastic viscosity and yield point, thereby
decreasing the resistance to flow.
It should be noted that this study and its findings are valid for the oil well cement and the additives used. Other cement/additive combinations can exhibit different characteristics. Even additives from the same category, but different source, could behave differently, and thus need to be investigated separately.
REFERENCES
[1] Michaux M. Nelson EB, Vidik B (1990). Chemistry and Characterization of Portland Cement In Well Cementing. Elsevier Science Publishers Amsterdam 8-25.
[2] Nelson, E. B., and Guillot, D. 2006. Well Cementing, second edition. Schlumberger.
[3] Arnoldus M.A and Ade L. (2016). Compressive and Shear Bond Strength of Oil Well Cement with Calcium Carbonate and Silica Fume. Department of Civil Engineering, Faculty of Engineering.
[4] Shuker MT, Memon KR, Tunio SQ, Memon MK (2014) Laboratory Investigation on Performance of Cement Using Different Additives Schemes to Improve Early Age Compressive Strength Research. Journal of Applied Sciences Engineering and Technology 7: 2298-2305.
[5] API RP 10B-2, Recommended Practice for Testing Well Cements. 2013. Washington, DC: API
[6] Doherty D.R. et al., (2010). Pushing Cement beyond the Norm of Extreme High Temperature. Paper IADC/SPE 134422 Presented at the IADC/SPE Asia Pacific Drilling Technology Conference and Exhibition

International Journal of Engineering Works Vol. 6, Issue 03, PP. 50-70, March 2019
www.ijew.io
held in Hochi Minh City, Vietnam, 1-3 November 2010. https://doi.org/10.2118/134422-MS
[7] Olowolagba K. and Brenneis C. (2010). Techniques for the Study of Foamed Cement Technology. Paper SPE 133050 presented at the SPE production and Operations Conference and Exhibition Held in Tunis, Tunisia, 8-10 June 2010. https://doi.org/10.2118/133050-MS
[8] Kelessidis V.C, Fraim M., Fardis M., Karakosta E., Diamantopoulos G., P. Arkoudeas, S. ElHardalo , L. Lagkaditi, G. Papavassiliou, 2014. Comprehensive Assessment of Additive and Class G cement Properties Affecting Rheology Fluid Loss, Setting Time and Long Term Characteristics of Elastic Cements. Paper SPE 167731 presented at the SPE European Unconventional Conference and Exhibition Held in Vienna, Austria, 25-27 February 2014. https://doi.org/10.2118/167731-MS
[9] Haichuan L., Chengbin X., Yonghui G., Lirong L., Haijin Z., (2016). Cement Slurries with Rheological Properties Unaffected By Temperature. Paper SPE 178922. https://doi.org/10.2118/178922-PA
[10] Bakirov D.L., Burdyga V. A., Svyatukhova S.S., Melekhov A.V., Kafarova I.V., Sledkov V.V., Shadchnev A.N., Shtyfel A.P., Yakunin S.A., Chudinov V.A., (2016). Cement fir Temperature range 160-300o C. Paper SPE -181935-MS Presented at the SPE Russian Petreoleum Technology Conference. https://doi.org/10.2118/181935-RU
[11] Okoro O., Nwakpu G. (2017). Undergraduate Thesis presented to Department of Petroleum Engineering, Federal University of Technology Owerri.
International Journal of Engineering Works Vol. 6, Issue 03, PP. 50-70, March 2019
www.ijew.io
APPENDIX 1
FIG A.1. Graph of Shear stress against Shear rate for Recipe 1 @
80oF, 130o F, & 180oF.
FIG A.2. Graph of Shear stress against Shear rate for Recipe 2 @
80oF, 130o F, & 180oF
FIG A.3. Graph of Shear stress against Shear rate for base case,
recipe 1 & recipe 2 @ 130oF
FIG A.4. Graph of Shear stress against Shear rate for base case,
recipe 1 & recipe 2 @ 180oF

International Journal of Engineering Works Vol. 6, Issue 03, PP. 50-70, March 2019
www.ijew.io
FIG A.5 Graph of Shear stress against Shear rate for Recipe 3 @
80oF, 130o F, & 180oF
FIG A.6. Graph of Shear stress against Shear rate for Recipe 4 @
80oF, 130o F, & 180oF
FIG A.7. Graph of Shear stress against Shear rate for base case,
recipe 3 & recipe 4 @ 80oF
FIG A.8. Graph of Shear stress against Shear rate for base case,
recipe 3 & recipe 4 @ 130oF
International Journal of Engineering Works Vol. 6, Issue 03, PP. 50-70, March 2019
www.ijew.io
APPENDIX 2
RETARDER - LINEAR REGRESSION ON PV
Regression Statistics
Multiple R 0.96987286
R Square 0.940653365
Adjusted R Square 0.920871154
Standard Error 3.725926184
Observations 9
Coefficients Standard Error t Stat P-value Lower 95% Upper 95% Lower 99.0% Upper 99.0%
Intercept -4.995555556 2.483950789 -2.011133062 0.09101153 -11.07356418 1.08245307
-
14.20462431 4.213513204
X Variable 1 -0.053466667 0.01521103 -3.514993189 0.01259483 -0.090686716
-
0.01624662
-
0.109860465 0.002927132
X Variable 2 -0.221386667 0.024337648 -9.096469281 9.9127E-05 -0.280938746
-
0.16183459
-
0.311616745
-
0.131156589
RESIDUAL OUTPUT
PROBABILITY OUTPUT
Observation Predicted Y Residuals Standard Residuals
Percentile Y
1 -4.995555556 4.995555556 1.548170953
5.555555556 -40.88
2 -18.83222222 -1.917777778 -0.59433787
16.66666667 -40.25
3 -32.66888889 1.848888889 0.572988538
27.77777778 -30.82
4 -10.34222222 -5.377777778 -1.666625314
38.88888889 -29.56
5 -24.17888889 -2.241111111 -0.694541995
50 -26.42
6 -38.01555556 -2.234444444 -0.692475931
61.11111111 -20.75
7 -15.68888889 2.478888889 0.768231627
72.22222222 -15.72
8 -29.52555556 -0.034444444 -0.010674666
83.33333333 -13.21
9 -43.36222222 2.482222222 0.769264659
94.44444444 0
RETARDER -
LINEAR REGRESSION ON
YP

International Journal of Engineering Works Vol. 6, Issue 03, PP. 50-70, March 2019
www.ijew.io
Regression Statistics
Multiple R 0.846218653
R Square 0.716086009
Adjusted R Square 0.621448013
Standard Error 10.12531664
Observations 9
Coefficients
Standard
Error t Stat P-value Lower 95% Upper 95%
Lower
99.0% Upper 99.0%
Intercept -14.3644444 6.750211093 -2.127999295 0.077423 -30.88161596 2.15272708 -39.3903662 10.66147731
X Variable 1 -0.15446667 0.041336432 -3.736816626 0.009659 -0.255613272 -0.0533201 -0.30771851 -0.00121482
X Variable 2 -0.07152 0.066138291 -1.081370543 0.321068 -0.233354569 0.09031457 -0.31672295 0.173682955
RESIDUAL OUTPUT
PROBABILITY OUTPUT
Observation Predicted Y Residuals Standard Residuals
Percentile Y
1 -14.3644444 14.36444444 1.638134621
5.555555556 -50
2 -18.8344444 -0.675555556 -0.077040985
16.66666667 -48.78
3 -23.3044444 -3.525555556 -0.402057639
27.77777778 -46.34
4 -29.8111111 -4.338888889 -0.494810929
38.88888889 -43.9
5 -34.2811111 -15.71888889 -1.792596727
50 -39.02
6 -38.7511111 -0.268888889 -0.030664339
61.11111111 -34.15
7 -45.2577778 -3.522222222 -0.401677502
72.22222222 -26.83
8 -49.7277778 3.387777778 0.386345333
83.33333333 -19.51
9 -54.1977778 10.29777778 1.174368167
94.44444444 0
DISPERSANT LINEAR REGRESSION ON PV
Regression Statistics
Multiple R 0.976752
R Square 0.954044
Adjusted R
Square 0.935662
Standard Error 3.954388
Observations 8
Coefficients
Standard
Error t Stat P-value
Lower
95%
Upper
95%
Lower
99.0%
Upper
99.0%
Intercept -0.585 2.887877 -0.20257 0.847455 -8.00852 6.838523 -12.2293 11.05933

International Journal of Engineering Works Vol. 6, Issue 03, PP. 50-70, March 2019
www.ijew.io
X Variable 1 -0.12243 0.018407 -6.65112 0.001159 -0.16974 -0.07511 -0.19664 -0.04821
X Variable 2 -0.26636 0.029451 -9.04427 0.000276 -0.34207 -0.19065 -0.38511 -0.14761
RESIDUAL OUTPUT
PROBABILITY OUTPUT
Observation Predicted Y Residuals
Standard
Residuals
Percentile Y
1 -0.585 0.585 0.175041
6.25 -44.65
2 -17.2325 -3.5175 -1.05249
18.75 -43.4
3 -33.88 3.06 0.915601
31.25 -34.59
4 -12.8275 2.1375 0.639574
43.75 -30.82
5 -29.475 -5.115 -1.53049
56.25 -22.01
6 -46.1225 2.7225 0.814615
68.75 -20.75
7 -25.07 3.06 0.915601
81.25 -10.69
8 -41.7175 -2.9325 -0.87745
93.75 0
DISPERSANT LINEAR REGRESSION ON YP
Regression Statistics
Multiple R 0.872783
R Square 0.76175
Adjusted R
Square 0.66645
Standard Error 12.48488
Observations 8
Coefficients
Standard
Error t Stat P-value
Lower
95%
Upper
95%
Lower
99.0%
Upper
99.0%
Intercept -7.315 9.117664 -0.80229 0.458805 -30.7527 16.1227 -44.0787 29.44872
X Variable 1 -0.23171 0.058114 -3.98714 0.010456 -0.38109 -0.08232 -0.46603 0.002615
X Variable 2 -0.05855 0.092982 -0.62965 0.556568 -0.29757 0.180472 -0.43346 0.316371
RESIDUAL OUTPUT
PROBABILITY OUTPUT

International Journal of Engineering Works Vol. 6, Issue 03, PP. 50-70, March 2019
www.ijew.io
Observation Predicted Y Residuals
Standard
Residuals
Percentile Y
1 -7.315 7.315 0.693257
6.25 -63.41
2 -10.9742 -8.53583 -0.80896
18.75 -60.98
3 -14.6333 -12.1967 -1.1559
31.25 -31.7
4 -30.4858 -1.21417 -0.11507
43.75 -26.83
5 -34.145 17.075 1.618231
56.25 -26.83
6 -37.8042 10.97417 1.040043
68.75 -19.51
7 -53.6567 -7.32333 -0.69405
81.25 -17.07
8 -57.3158 -6.09417 -0.57756
93.75 0
FLUID LOSS
ADDITIVE LINEAR REGRESSION ON YP
Regression Statistics
Multiple R 0.960076
R Square 0.921745
Adjusted R Square 0.869576
Standard Error 27.7878
Observations 6
Coefficients
Standard
Error t Stat P-value
Lower
95%
Upper
95%
Lower
99.0%
Upper
99.0%
Intercept 21.03583 21.22328 0.991168 0.394671 -46.5061 88.5778 -102.927 144.9991
X Variable 1 1.21 0.226886 5.333064 0.012886 0.487946 1.932054 -0.11522 2.535223
X Variable 2 -0.58372 0.222302 -2.62579 0.078609 -1.29119 0.123746 -1.88217 0.714728
RESIDUAL OUTPUT
PROBABILITY OUTPUT
Observation Predicted Y Residuals
Standard
Residuals
Percentile Y
1 21.03583 -21.0358 -0.9773
8.333333 -26.83
2 -15.4467 -4.06333 -0.18878
25 -19.51
International Journal of Engineering Works Vol. 6, Issue 03, PP. 50-70, March 2019
www.ijew.io
3 -51.9292 25.09917 1.166083
41.66667 0
4 142.0358 28.28417 1.314055
58.33333 51.22
5 105.5533 -10.4333 -0.48472
75 95.12
6 69.07083 -17.8508 -0.82933
91.66667 170.32
FLUID LOSS
ADDITIVE LINEAR REGRESSION ON PV
Regression Statistics
Multiple R 0.952713
R Square 0.907661
Adjusted R Square 0.846102
Standard Error 7.54893
Observations 6
Coefficients
Standard
Error t Stat P-value
Lower
95%
Upper
95%
Lower
99.0%
Upper
99.0%
Intercept -4.7675 5.765591 -0.82689 0.468931 -23.1162 13.58118 -38.4438 28.90879
X Variable 1 0.266233 0.061637 4.319392 0.022865 0.070078 0.462389 -0.09378 0.626248
X Variable 2 -0.19876 0.060391 -3.29119 0.046037 -0.39095 -0.00657 -0.5515 0.153981
RESIDUAL OUTPUT
PROBABILITY OUTPUT
Observation Predicted Y Residuals
Standard
Residuals
Percentile Y
1 -4.7675 4.7675 0.815323
8.333333 -30.82
2 -17.19 -3.56 -0.60882
25 -20.75
3 -29.6125 -1.2075 -0.2065
41.66667 0
4 21.85583 1.414167 0.241846
58.33333 0.63
5 9.433333 -8.80333 -1.50552
75 4.4

International Journal of Engineering Works Vol. 6, Issue 03, PP. 50-70, March 2019
www.ijew.io
6 -2.98917 7.389167 1.263672
91.66667 23.27

International Journal of Engineering Works Vol. 6, Issue 03, PP. 50-70, March 2019
www.ijew.io
Authors Bio:
Ikpeka Princewill is a researcher and Lecturer at the department of Petroleum Engineering, Federal University of Technology Owerri. His core
area of research include: Reservoir Characterization for conventional and unconventional systems, Building numerical reservoir models and
assessing field development strategies for various reservoir systems, Drilling Fluid flow modelling, Natural Gas Production Optimization Studies.
He holds a B.Eng and MSc degree in Petroleum Engineering and is currently studing for his PhD.
Odo Jude is a lecturer at the department of Petroleum Engineering, Federal University of Technology owerri. Over the years,he has demonstrated
a range of experience in Natural Gas processes,monitoring,evaluation and measurements,Laboratory Analysis using Dean-Stack Distillation. He
holds a B.Eng and MSc degree in Petroleum Engineering.
Uzuegbu Godson is an experienced Cementer with Haliburton Oil Services. He holds a B.Eng in Petroleum Engineering
Bennedict Ugochukwu and Utojiuba Ifeanyi are graduates of Petroleum Engineering, Federal University of Technology Owerri.