effects of acid adaptation on the survival...
TRANSCRIPT

Department of Food and Nutritional Sciences
University of Reading
Effects of Acid Adaptation on the Survival of
Lactobacillus plantarum NCMIB 8826 in Fruit Juices
A thesis submitted as a partial fulfilment for the degree of Doctor of Philosophy
Pornpoj Srisukchayakul
June 2017

II
ACKNOWLEDGEMENTS
I would like to express the deepest appreciation and give full gratitude to my supervisor, Dr.
Dimitris Charalampopoulos and Dr. Kimon Andreas Karatzas, who gave their
encouragement, guidance, and perseverance which are invaluable for me during my research
and writing up period. Without their persistent help and support this work could not have
been possible. I would like to extend my special gratitude and thanks to my external and
internal examiners, Prof. Paul Ross and Dr. Anne McCartney, for their time and guidance. I
would also like to express my appreciation to Ubi, Lily, Diane, Chris, and other technicians
for their technical support and help during my research. I am also thankful to Peter and
Mathew for their help on Cryo-Scanning Electron Microscopy. I would like to thanks to my
sponsors (MOST and TISTR) for financial support and giving me this precious overseas
education opportunity. Additionally, I would like to thank to my colleagues and friends:
Afroditi, Gurjot, Hanadi, Katerina, Ailing, Roni, Khailu, Samantha, Kate, Natalia, Ivan, Lisa,
Mar, Emma, Charlie, Alex, Kishin, Wesley, Amish, Pounami, Rak, Boom, Doy, P’ Tukta,
P’Amm, P’ Da, Kong, Fon, Aom, Mew, Aneurin, Damien, and Shan Ji Peng. Thank you all
for helping me adapt to a new home, enjoy my life and for all of the quality time and lovely
memories here at University of Reading. Finally, I would like to express my special gratitude
to my mother and father who live in Thailand for their unconditional love and support
throughout my entire academic life until I achieved this degree. Their trust and
encouragements have always helped me to overcome the difficulties to make my dreams
come true.
Pornpoj Srisukchayakul Reading, June 2017

III
Declaration of original authorship
I confirm that this is my own work and the use of all material from other sources has been
properly and fully acknowledged.
Reading, June 2017
(Pornpoj Srisukchayakul)

IV
ABSTRACT
The aims of this work were to study the effect of acid adaptation on the survival of the
stationary phase Lactobacillus plantarum NCMIB 8826 cells, a model potential probiotic
strain, in several highly acidic fruit juices namely cranberry (pH 2.7), pomegranate (pH 3.5),
and lemon & lime juices (pH 2.8) and to investigate the mechanisms involved in cellular
response. The results indicated that exposure of the cells in both acidified solutions (buffers
and de Man, Rogosa and Sharpe medium; MRS) adjusted to pH 6 to 3 by hydrochloric acid
and citric acid for a short period of time significantly improved cell survival in the fruit
juices, although the impact on cell viability was less than 107 CFU/ml for 6 weeks which was
required for probiotic drinks. Furthermore, the prolonged exposure time (1 to 5 h) and low
temperature (10 and 4 οC) were used to enhance the cell viability of Lactobacillus plantarum
NCMIB 8826 but the improvements by these techniques could not make it as a promising
strain for probiotic drinks. Analysis of citric and lactic acids as well as γ-aminobutyric acid
(GABA) indicated that the citrate fermentation pathway and the glutamate decarboxylase
system, which have been implicated in acid response in several lactobacilli, were not
involved in this case while the analysis of the cellular fatty acid content showed that the
cyclopropane fatty acid, cis-11,12-methylene octadecanoic acid (C19cyclow7c), significantly
increased (by ∼1.7 fold) during acid adaptation, which was accompanied by a significant
upregulation of the cyclopropane synthase (cfa) gene (by ∼12 fold), as demonstrated by
reverse transcription polymerase chain reaction. It was likely that these changes led to a
decrease in membrane fluidity and to lower membrane permeability, which prevent the cells
from proton influx during storage in fruit juices. Examination of the cell morphology by
cryo-scanning electron microscopy revealed that the cell surface of acid adapted cells was
rougher and thicker compared to control cells, suggesting that the composition and structure

V
of the peptidoglycan was possibly modified during acid exposure. A significant finding of
this study was the observation that alanine, which represented the most abundant intracellular
amino acid (> 45%), was significantly reduced in the case of acid adapted cells (∼20%)
compared to control cells, which coincided with a significant decrease in the extracellular
alanine (~10%). It seems, therefore, likely that upon acid adaptation the cells utilized the
available alanine to increase in the D-alanylation of wall teichoic acid, resulting in a positive
cell wall with enhanced ability to reduce the influx of protons during storage in fruit juices.
Moreover, proteomic analysis was also performed using 2D-gel electrophoresis, which led to
the identification of eight proteins exhibiting a difference in % volume of at least 1.4 in
expression levels between acid adapted and control cells. Among these, five proteins,
molecular chaperone GroEL, aminopeptidase C, 30S ribosomal protein S1, D-alanine-D-
ligase, and UPF0356 protein Ip_2157 were upregulated, whereas three proteins, 30S
ribosomal protein S2, aspartate semialdehyde dehydrogenase, and the hypothetical protein
HMPREF0531_11643 were downregulated in acid adapted cells compared to control cells.

VI
LIST OF CONTENTS
ACKNOWLEDGEMENTS .................................................................................................... II
DECLARATION OF ORIGINAL AUTHORSHIP ........................................................... III
ABSTRACT ............................................................................................................................ IV
LIST OF CONTENTS ........................................................................................................... VI
LIST OF TABLES ................................................................................................................... X
LIST OF FIGURES ............................................................................................................... XI
LIST OF ABBREVIATIONS ............................................................................................ XIII
CHAPTER 1 .............................................................................................................................. 1
General Introduction ................................................................................................................ 1
1.1. Background .............................................................................................................. 1
1.2. Probiotics ................................................................................................................. 4
1.2.1. History of definition ........................................................................................ 4
1.2.2. Functional properties and health benefits of probiotics .................................. 5
1.2.3. Selection of probiotic strains ......................................................................... 12
1.2.4. Products with probiotics on the market ......................................................... 16
1.2.5. Probiotic-containing fruit juices .................................................................... 19
1.2.6. Genetically modified (GM) probiotics in foods ............................................ 22
1.2.7. Survival of GM-probiotics in the gut ............................................................ 23
1.3. Lactic acid bacteria (LAB) ..................................................................................... 24
1.3.1. The taxonomy of LAB ................................................................................... 24
1.3.2. Overview of stress response in LAB ............................................................. 26
1.3.3. Responses of LAB to acid stress ................................................................... 27

VII
1.4. Aim and objectives................................................................................................. 39
1.5. References .............................................................................................................. 39
CHAPTER 2 ............................................................................................................................ 55
The effect of citric acid adaptation on the subsequent survival of L. plantarum NCIMB
8826 in fruit juices during refrigerated storage ................................................................... 55
2.1. Introduction ............................................................................................................ 55
2.2. Materials and methods ........................................................................................... 60
2.2.1. Bacterial strain ............................................................................................... 60
2.2.2. Fruit juices ..................................................................................................... 60
2.2.3. Growth of L. plantarum NCIMB 8826 .......................................................... 60
2.2.4. Effects of acid adaptation on subsequent cell survival in cranberry juice .... 61
2.2.5. Influence of exposure time in citrate buffer at pH 3 ..................................... 65
2.2.6. Effect of cold adaptation on subsequent cell survival in cranberry juice ...... 65
2.2.7. Effect of combined acid and cold adaptation on subsequent survival of
L. plantarum NCIMB 8826 cells in cranberry juice ...................................... 67
2.2.8. Survival of acid adapted cells in pomegranate, and lemon & lime juices ..... 67
2.3. Results and discussion ........................................................................................... 68
2.3.1. Growth of L. plantarum NCIMB 8826 in MRS ............................................ 68
2.3.2. Effects of acid adaptation on subsequent cell survival in cranberry juice .... 71
2.3.3. Influence of exposure time in citrate buffer at pH 3 ..................................... 76
2.3.4. Effect of cold adaptation on subsequent cell survival in cranberry juice ...... 77
2.3.5. Effect of combined acid and cold adaptation on subsequent survival of
L. plantarum cells in cranberry juice ............................................................. 79
2.3.6. Survival of acid adapted cells in pomegranate and lemon & lime juices ...... 80
2.4. Conclusions ............................................................................................................ 84

VIII
2.5. References .............................................................................................................. 85
CHAPTER 3 ............................................................................................................................ 91
Role of cell membrane during citric acid exposure of L. plantarum NCIMB 8826 in
enhancing subsequent storage in fruit juices........................................................................ 91
3.1. Introduction ............................................................................................................ 91
3.2. Materials and methods ........................................................................................... 93
3.2.1. Determination of citric and lactic acid concentration by high pressure liquid
chromatography (HPLC) .............................................................................. 93
3.2.2. Morphological investigation of the surface of acid adapted and control
cells ................................................................................................................ 95
3.2.3. Determination of cellular fatty acid composition .......................................... 96
3.2.4. Gene expression analysis by reverse transcription-polymerase chain reaction
(RT-PCR) ...................................................................................................... 97
3.3. Results and Discussion......................................................................................... 101
3.3.1. Concentrations of citric and lactic acids after acid adaptation and during
storage in fruit juices ................................................................................... 101
3.3.2. Morphological investigation of the cell surface of acid adapted and control
cells .............................................................................................................. 105
3.3.3. Modification of membrane fluidity by alteration of the cell membrane fatty
acid composition .......................................................................................... 107
3.3.4. Gene expression analysis by reverse transcription-polymerase chain reaction
(RT-PCR) .................................................................................................... 111
3.4. Conclusions .......................................................................................................... 113
3.5. References ............................................................................................................ 114
CHAPTER 4 .......................................................................................................................... 119

IX
Amino acid, GABA, and proteomic analysis of L. plantarum NCIMB 8826 cells in
response to acid adaptation .................................................................................................. 119
4.1. Introduction .......................................................................................................... 119
4.2. Materials and methods ......................................................................................... 122
4.2.1. Amino acid analysis .................................................................................... 122
4.2.2. Quantification of extracellular and intracellular GABA ............................. 124
4.2.3. Proteomic analysis of acid adapted and control cells .................................. 124
4.3. Results and discussion ......................................................................................... 129
4.3.1. Extracellular and intracellular amino acid composition .............................. 129
4.3.2. Extracellular and intracellular GABA content ............................................ 135
4.3.3. Proteomic analysis of acid adapted and control cells .................................. 137
4.4. Conclusion ........................................................................................................... 146
4.5. References ............................................................................................................ 147
CHAPTER 5 .......................................................................................................................... 152
General discussion ................................................................................................................ 152
5.1. General discussion ............................................................................................... 152
5.2. References ............................................................................................................ 157

X
LIST OF TABLES
Table 1.1 Causal relationships between diseases and mechanisms of action of
probiotics ................................................................................................................. 6
Table 1.2 List of microorganisms considered as probiotics ................................................... 16
Table 1.3 List of non-dairy products containing probiotics .................................................... 18
Table 1.4 Survival of probiotic bacteria in various types of fruit juices .................................. 21
Table 3.1 Target genes and primers used in RT-PCR ........................................................... 101
Table 3.2 Extracellular concentrations of citric acid during refrigerated storage at
4 °C in three different juices. .............................................................................. 104
Table 3.3 Relative percentages of cellular fatty acids after incubation of
L. plantarum cells in control MRS (25 °C, pH 6.4, 1 h) and acidified
MRS (25 °C, pH 3, 1 h). ..................................................................................... 108
Table 3.4 Relative percentages of cellular fatty acids after incubation of
L. plantarum cells in acidified citrate buffer (pH 3, 3 h) at 4 and 37 °C. ........... 111
Table 4.1 Intracellular amino acid profiles (expressed as % of total amino acids) in
cells exposed to acidified MRS (pH 3, 25 °C, 1 h) and unmodified
MRS (pH 6.4, 25 °C, 1 h). .................................................................................. 134
Table 4.2 Expressed proteins showing at least a range ratio > 2 between acid
adapted and control cells.. ................................................................................... 139
Table 4.3 Expressed proteins showing at least a range ratio > 1.4 between acid
adapted and control cells. ................................................................................... 142

XI
LIST OF FIGURES
Figure 1.1 Simplified schemes describing the ADI and AgDI pathways in LAB .................. 31
Figure 1.2 Response of the cit operons to acidic stress and the contribution to pH
homeostasis in Lactococcus lactis CRL264 ........................................................... 34
Figure 1.3 Schematic representation of the main steps of the structure of
peptidoglycan ......................................................................................................... 38
Figure 1.4 Teichoic acid polymers located within the Gram-positive cell wall ...................... 38
Figure 2.1 Growth of L. plantarum NCIMB 8826 in MRS incubated at 37 °C for 30 h
and shaken at 200 rpm. (A) The cell concentration was measured by OD600
and viable cell counts; (B) pH of medium during growth of L. plantarum
NCIMB 8826.......................................................................................................... 70
Figure 2.2 Cell concentration (log CFU/ml) of L. plantarum NCIMB 8826 during
refrigerated storage in cranberry juice after pre-treatment in 0.15 M citrate
buffer acidified to different pH using citric acid, and in 0.1 M PBS
acidified to different pH using HCl ........................................................................ 73
Figure 2.3 Survival of L. plantarum NCIMB 8826 during refrigerated storage in
cranberry juice after pre-treatment in MRS acidified to different pH using
citric acid ................................................................................................................ 76
Figure 2.4 Survival of L. plantarum NCIMB 8826 during refrigerated storage in
cranberry juice after pre-treatment in acidified citrate buffer (pH 3, 37 °C)
for different times................................................................................................... 77

XII
Figure 2.5 Survival of L. plantarum NCIMB 8826 during refrigerated storage in
cranberry juice after pre-treatment in PBS (pH 7.3 at 37, 25, 10, and 4 °C)
for both 2.5 and 5 h ................................................................................................ 79
Figure 2.6 Comparison of cell viability between acid adaptation and combination of
acid and cold adaptation stored in cranberry juice at 4 °C .................................... 80
Figure 2.7 Survival of L. plantarum NCIMB 8826 during refrigerated storage in
pomegranate (A), and lemon & lime (B) after pre-treatment in acidified
MRS (pH 3, 25 °C, 1 h) ......................................................................................... 83
Figure 3.1 Conserved pathway for the formation of fatty acid in bacteria. ............................. 98
Figure 3.2 Cryo-SEM images of L. plantarum after incubation in MRS at pH 6.4, 25
°C for 1 h (control cells, A) and MRS at pH 3, 25 °C for 1 h (acid adapted
cells, B). ............................................................................................................... 105
Figure 4.1 Relative amino acid content of MRS media (relative to non-inoculated
MRS) derived from acid adapted cells (acidified MRS, pH 3, 25 °C, 1 h)
and control cells (unmodified MRS, pH 6.4, 25 °C, 1 h)..................................... 132
Figure 4.2 Silver stain gels depicting the total protein spots for L. plantarum NCIMB
8826 after incubation in: (A) MRS at pH 6.4, 25 °C for 1 h (control cells),
and (B) MRS at pH 3, 25 °C for 1 h (acid adapted cells) .................................... 138
Figure 4.3 One of the three Coomassie blue staining gels depicting the total protein
spots for L. plantarum NCIMB 8826 after incubation in: (A) MRS at pH
6.4, 25 °C for 1 h (control cells), and (B) MRS at pH 3, 25 °C for 1 h (acid
adapted cells)........................................................................................................ 141

XIII
LIST OF ABBREVIATIONS
ATP Adenosine triphosphate
AgDI Agmatine deiminase
ANOVA Analysis of variance
ADI Arginine deiminase
Asl Argininosuccinate lyase
Ass Argininosuccinate synthetase
fabH β-ketoacyl-acyl carrier protein synthase III
CPS Capsular exopolysaccharide
CO2 Carbon dioxide
CFU Colony forming unit
CFA Cyclopropane fatty acid
cfa Cyclopropane synthase
CWG Cell wall glycopolymer
MRS de Man, Rogosa and Sharpe medium
DAP Diaminopimelic acid
DSMZ Deutsche Sammlung von Mikroorganismen und Zellkulturen
EU European Union
EPS Exopolysaccharide
FAO Food and agriculture organization of the united nations
GC-MS Gas chromatography-mass spectrometry
GIT Gastrointestinal tract
GRAS Generally recognized as safe
GM Genetically modified

XIV
GAD Glutamate decarboxylase
HPLC High performance liquid chromatography
Ig Immunoglobulin
IBD Inflammatory bowel disease
IL Interleukin
pHi Intracellular pH
IEF Isoelectric focusing
pI Isoelectric point
LAB Lactic acid bacteria
LC-ESI-MS/MS Liquid chromatography-electrospray ionization-tandem mass spectrometry
MAPK Mitogen-activated protein kinase
GlcNAc N-acetylglucosamine
MurNAc N-acetylmuramic acid
NK Natural killer
OD Optical density
PBS Phosphate buffered saline
PMF Proton motive force
RT-PCR Reverse transcription-polymerase chain reaction
SEM Scanning electron microscope
SD Standard deviation
TNF-α Tumour necrosis factor alpha
USA United States of America
WTA Wall teichoic acid
WHO World health organization
GABA γ-aminobutyric

1
CHAPTER 1
General Introduction
1.1. Background
The concept of using microbes to prevent and in some cases cure diseases has
been established for a long time. The initial evidence of the link between consumption
of beneficial microorganisms, such as lactic acid bacteria (LAB), and well-being was
substantiated around 1900, when Nobel Prize-winner, Metchnikoff, revealed the
association between the consumption of fermented dairy products and life expectancy of
Bulgarians (Metchnikoff, 1907). In order to describe this connection, the term
“Probiotic” was introduced by Lilly and Stillwell (1965). The definition of probiotics
has changed considerably over the years, and the most widely accepted definition is the
one by the Food and Agriculture Organization of the United Nations/World Health
Organization (FAO/WHO., 2002) “live microorganisms which confer a health benefit
on the host when supplied in adequate amounts”. A large number of studies have
demonstrated the positive effects of probiotics on human health, which include the
prevention of diarrhoea caused by pathogenic bacteria and viruses (Malaguarnera et al.,
2012), the inhibition of pathogen colonization (Dhanani et al., 2011), the lowering of
cholesterol level (Ooi and Liong, 2010), the stimulation of the immune system (Ashraf
and Shah, 2014), the treatment of inflammatory bowel disease (IBD) (Rogers and
Mousa, 2012), the prevention of intestinal and vaginal infections (Zuccotti et al., 2008),
the reduction of food allergies (Savilahti et al., 2008), the prevention of cancer (Liong,
2008), the prevention of atherosclerosis (Tsai et al., 2009) and the amelioration of
lactose intolerance (Heyman, 2000). These potential health benefits have induced the

2
food industry to develop appropriate methods and technologies for the incorporation of
probiotics into various food products and nutraceutical formulations.
Probiotics have been incorporated mainly into dairy products, such as yoghurt,
as these constitute favourable vehicles due to the acidic pH compared to other probiotic
products; in yoghurt the pH is ~4 whereas in most chesses is >5.0. The development of
non-dairy probiotic products such as fermented meats, cereals, vegetables, and fruit
juices is a challenging task for the food industry in their effort to expand the range of
probiotic containing foods (Luckow and Delahunty, 2004, Champagne et al., 2005).
Fruit juices are a promising vehicle for the delivery of probiotics as they contain
relatively high amount of sugars, essential vitamins and minerals, which could be used
as energy and nutrition sources for the survival of probiotics during storage (Ding and
Shah, 2008) and offer an alternative choice to consumers with lactose intolerance
(Prado et al., 2008). Moreover, the fruit juice market is very large, as fruit juices are
easily consumed by various ages. However, a key for successfully developing new
probiotic products, particularly in the case of fruit juices, is to ensure the survival of the
probiotic strain in the fruit juices during refrigerated storage for up to 6 weeks, which is
the normal storage period for fruit juices. Considering a starting cell concentration in
juices of around 108 to 109 colony forming units (CFU)/ml and the fact that the
recommended minimum probiotic concentration for the efficacy is approximately 107
CFU/ml of product (Corcoran et al., 2007), this suggests that the decrease in cell
concentration during storage should be less than 1 to 2 log CFU/ml. A substantial
amount of work has been conducted where probiotic strains have been incorporated in a
variety of fruit juices, including orange, apple, pineapple, peach, cranberry, strawberry
and pomegranate; the results have demonstrated that cell survival depends on the strain
and juice used but overall in many cases it was rather low due to the high acidity of the
3
juices and the likely presence of antimicrobial compounds, such as polyphenols and
organic acids, at high concentrations (Vinderola et al., 2002, Sheehan et al., 2007a,
Champagne and Gardner, 2008, Tezcan et al., 2009, Nualkaekul and
Charalampopoulos, 2011, Mousavi et al., 2011).
Overall, several approaches have been used to enhance the cell viability of
probiotic strains in acidic conditions, including the development and modification of the
food matrices (Corcoran et al., 2005), microencapsulation (Nualkaekul et al., 2012), and
adaptation of the cells to acid stress (Saarela et al., 2011). Amongst these, encapsulation
has been investigated the most; however, the main issue is that in many cases the size of
the capsules produced by the most scalable method (extrusion) is rather large, normally
between 500 µm and 3 mm, which can affect considerably the organoleptic properties
of the product. In order to achieve microcapsules with size less than 200 µm, an
emulsification based microencapsulation method has to be used, which is difficult to
scale up and also to remove the residual oil from the capsules. A short exposure of
probiotic bacteria to acid prior to their incorporation into fruit juices followed by
subsequent storage at refrigerated temperature (Saarela et al., 2011) seems to be a viable
approach for reducing cell injury and loss of viability during processing, storage, and
potentially during subsequent passage through the gastrointestinal tract (GIT)
(Vinderola et al., 2000, Shah, 2000, Gueimonde et al., 2004). This strategy allows the
cells to activate their defence mechanisms to acid stress, such as maintenance of ∆pH
homeostatic, alteration of cell envelope, and protection and restoration of proteins and
DNA, in order to protect them against the adverse environment of a food matrix, i.e. the
highly acidic environment of fruit juices (Van de Guchte et al., 2002, Spano and Massa,
2006, Lorca and de Valdez, 2009). Based on this concept, several studies have been
conducted using various acids for adapting bacterial cells, including lactic acid (Lorca

4
and de Valdez, 2001), hydrochloric acid (HCl) (Rallu et al., 1996) and malic acid
(Saarela et al., 2011). Interestingly, the study of Pudlik and Lolkema (2011b) also
highlighted the positive effects of citrate in enhancing acid tolerance of Lactococcus
lactis. This study agrees with the results obtained by Nualkaekul and Charalampopoulos
(2011) and Mousavi et al. (2011), who suggested that the high concentration of citric
acid in various fruit juices appeared to improve the survival of Lactobacillus plantarum
during refrigerated storage.
1.2. Probiotics
1.2.1. History of definition
The relationship between the consumption of food products containing microbes
and human health was first discovered by Metchnikoff (1907), a Russian scientist. As a
result of this, he was awarded a Noble prize in 1908. At the same time, Tissier (1906), a
French paediatrician, also suggested the administration of bifidobacteria in children in
order to reduce their suffering from diarrhoea. Subsequently, the diverse positive effects
of certain beneficial microbes to human health were investigated in a number of studies.
For instance, the implantation of non-LAB which can prevent pathogenic bacteria in
intestine was demonstrated by Nissle (1916). Additionally, the important role of the
intestinal bacteria for resistance to disease was verified by Bohnhoff et al. (1954), Freter
(1955) and Collins and Carter (1978). However, it is interesting to notice that the first
use of the word “Probiotic” was introduced by Lilly and Stillwell (1965), whereas
Parker (1974) was the first to use the term probiotic in the sense that it is used today.
The next definition of probiotics as "a live microbial feed supplement which
beneficially affects the host animal by improving its intestinal microbial balance" was
given by Fuller (1989). In 1992, Havenaar and Huis In't Veld extended the definition of

5
probiotics to: “A viable mono- or mixed culture of microorganisms which when applied
to animal or man, beneficially affects the host by improving the properties of the
indigenous microflora” (Havenaar and Huis In’t Veld, 1992). The definition of
probiotics was continually modified by various researchers, including Salminen (1996),
“A live microbial culture or cultured dairy product which beneficially influences the
health and nutrition of the host” and Schaafsma (1996) “Oral probiotics are living
microorganisms which upon ingestion in certain numbers, exert health effects beyond
inherent basic nutrition”. In 2001, Schrezenmeir and de Vrese suggested a new
definition of probiotics, “A preparation of or a product containing viable, defined
microorganisms in sufficient numbers, which alter the microflora (by implantation or
colonization) in a compartment of the host and by that exert beneficial health effects in
this host” (Schrezenmeir and de Vrese, 2001). Finally, probiotics are currently
internationally endorsed as “Live microorganisms which, when administered in
adequate amounts, confer a health benefit on the host”, a definition given by
FAO/WHO. (2002). This last definition is rather broad compared to the previous ones,
and includes both human and animal applications of probiotics, as well as a broad
spectrum of benefits to the host and not just to the gut.
1.2.2. Functional properties and health benefits of probiotics
During the last two decades, probiotics have been widely used for treatment and
prevention of various diseases, such as diarrhoea and acute gastroenteritis, IBD, lactose
intolerance, food allergies, hypercholesterolemia and cardiovascular diseases, and
cancers. However, the causal relationships between their health claims and mechanisms
of action have not been fully elucidated (Marco et al., 2006). In order to understand
how probiotics deliver health benefits to their hosts, the current knowledge relating to

6
the mechanisms of action of probiotics toward human health are summarized in Table
1.1 and discussed throughout this section.
Table 1.1 Causal relationships between diseases and mechanisms of action of probiotics
Diseases Causes Mechanism of actions Diarrhoea Overgrowth of
bacteria and viruses
1. Modulation of gut microbiota
• Production of antimicrobial compounds
• Competition for binding and receptor sites
• Improvement of mucus production
2. Immunomodulation
• Enhancement of production of IgA
• Activation of NK cells
IBD Chronic
inflammation of all
or part of GIT
caused by bacterial
infection
1. Anti-inflammation
• Production of anti-inflammatory cytokines
2. Inhibition of intestinal epithelial apoptosis
• Activation of Akt/protein kinase B
• Inhibition of p38/ MAPK
Lactose intolerance Lactose
maldigestion
1. Production of lactose cleaving enzyme, β-
galactosidase
Food allergies Type-1
hypersensitivity
1. Anti- hypersensitivity and allergy
• Inhibition of IgE
Hypercholesterolemia
and cardiovascular
diseases
High cholesterol
level in the blood
1. Assimilation and binding of dietary cholesterol in
the intestine
2. Hydrolysis of bile acids by production of bile salt
hydrolase
Colon cancer Carcinogens and
mutagens produced
by enteric bacteria
1. Ability to bind and degrade potential carcinogens
2. Production of anti-tumorigenic or anti-mutagenic
compounds
1.2.2.1. 67BTreatment and prevention of disorders associated with GIT
Probiotics have been reported to improve many types of diarrhoea with different
degrees of success. Several probiotic strains, such as Lactobacillus rhamnosus GG and
Bifidobacterium lactis Bb-12 have been used in an attempt to modulate the indigenous
7
intestinal microflora in children who develop diarrhoea (Guandalini, 2011). A number
of positive effects, such as decreasing number of incidents, shortening of duration, and
reducing of viral shedding have been observed after administration of these probiotics
(Tuohy et al., 2003). Although the mechanisms of action behind these beneficial effects
are still unclear, the most impressive evidence in probiotics combating pathogens and
diseases is achieved by modulating the gut microbiota (e.g. the production of
antimicrobial compounds, competition for binding and receptor sites and increased
mucus production) as demonstrated by several in vitro and in vivo studies. For example,
Ogawa et al. (2001) showed that the co-incubation of Lactobacillus casei strain Shirota
or Lactobacillus acidophilus YIT0070 with Escherichia coli O157:H7 strain 89020087
in a batch fermentation system reduced the survival of E. coli due to the production of
lactic acid. Similarly, Corr et al. (2007) demonstrated that the administration of
Lactobacillus salivarius UCC118 in mice enhanced their resistance against invasion of
the foodborne pathogen Listeria monocytogenes due to the production of the broad-
spectrum class II bacteriocin (Abp118). Mack et al. (1999) reported that co-incubation
of L. plantarum 299v and L. rhamnosus GG with HT-29 human intestinal epithelial
cells increased the expression levels of the MUC2 and MUC3 proteins. Upregulation of
these two human intestinal proteins by both bacterial strains enhanced mucus
production in HT-29 human intestinal epithelial cells, which resulted in inhibiting the
attachment of pathogenic E. coli to the cell line. However, it should be noted that the
immunomodulation properties of probiotics are also involved in the treatment of
diarrhoea, especially diarrhoea caused by rotavirus. For instance, L. rhamnosus GG and
Bifidobacterium lactis Bb-12 were shown to enhance immunoglobulin A (IgA)
production in the microfold cells of the Peyer's patches which contributed to the
protection of human host against viruses. Such immunomodulatory effects might be

8
induced by their cell wall components (Majamaa et al., 1995, Fukushima et al., 1998).
Additionally, Takeda et al. (2006) found that L. casei strain Shirota could trigger the
production of interleukin (IL) -12 which elicited the response of natural killer (NK)
cells against pathogen infections.
In addition to the above, the beneficial effects of probiotics in the GIT have also
been reported for the management of IBD, including ulcerative colitis and Crohn’s
disease. In this case, the plausible mechanisms of action seem to involve the anti-
inflammatory properties of probiotics, as the pathogenesis of both Crohn’s disease and
ulcerative colitis is associated with the chronic inflammation of all or part of the GIT.
As probiotics have been proved to reduce inflammatory responses, the administration of
probiotics is used to reduce the expression of proinflammatory cytokines, especially
tumour necrosis factor alpha (TNF-α), IL, interferon, and nuclear factor-kappa B, which
play an important role in cell signalling and regulation of inflammatory responses. For
instance, Kamada et al. (2008) indicated that E. coli strain Nissle 1917 displayed a
direct anti-inflammatory activity on HCT15 intestinal epithelial cells by suppressing the
production of IL-8, a neutrophil chemotactic factor, leading to the reduction of TNF-α;
Hart et al. (2004) showed that a commercial mixture of probiotics, VSL#3, consisting of
four lactobacilli, three bifidobacteria, and one streptococci strain, induced the
production of IL-10, an anti-inflammatory cytokine, after co-incubation with blood cells
and lamina propria dendritic cells in vitro. However, several studies showed that the
beneficial effect of probiotics for the treatment of IBD is not limited only to the
reduction of inflammatory response, but also involves the inhibition of intestinal
epithelial apoptosis; as this mechanism has been proved to enhance the survival of cells
during development of IBD. Yan and Polk (2002) suggested that a co-culture of
L. rhamnosus GG with either young adult mouse colon cells or HT-29 human intestinal

9
epithelial cells can activate anti-apoptotic factor Akt/protein kinase B and inhibit pro-
apoptotic p38/mitogen-activated protein kinase (MAPK) in epithelial cells, resulting in
the reduction of epithelial apoptosis via a proinflammatory cytokine dependent
mechanism.
1.2.2.2. Relief of lactose intolerance
It is well known that people with lactose intolerance can tolerate lactose in
yoghurt much better than in milk, even though yoghurt and milk have similar amounts
of lactose (Gurr, 1987). This is due to the fact that probiotic strains in yoghurt have the
ability to produce the lactose cleaving enzyme, β-galactosidase, leading to the reduction
of lactose present in the digestive tract (De Vrese et al., 2001). Furthermore, many
studies have also reported the effect of probiotics in the relief of lactose intolerance. For
example, Almeida et al. (2012) showed that four-week consumption of a probiotic
mixture (L. casei strain Shirota and Bifidobacterium breve strain Yakult) improved
lactose intolerance symptoms (e.g. bloating, cramps, and loose stools) in lactose-
intolerant patients. These results indicate that lactose intolerance can be improved by
regularly consuming fermented dairy products due to the production of β-galactosidase
enzyme by the probiotic strains present in them. This mechanism of action is perhaps
the strongest evidence of a health benefit exerted by probiotics and is the only
mechanism currently accepted by the European Food Safety Authority (Hill et al.,
2014).
1.2.2.3. Reduction of food allergies
The idea of alleviating food hypersensitivity and allergy by probiotics is mainly
based on their ability to suppress IgE production, as food hypersensitivity and allergy
generally occur when IgE mistakenly treats harmless food compounds as a threat. This

10
leads to the secretion of vasoactive amines (i.e. histamines) by mast cells and basophils
via type-1 hypersensitivity which then triggers an allergic reaction. Shida et al. (2002)
reported that the administration of L. casei strain Shirota in mice can suppress IgE
production by promoting a dominant Th1-type immune response mediated by IL-12
induction. Dev et al. (2008) also found that the administration of a probiotic mixture
(Bifidobacterium longum and Bifidobacterium infantis) suppressed the increase of
histamine receptor-1 and histidine decarboxylase, an enzyme which synthesizes
histamine from L-histidine, in rat nasal mucosa. Therefore, there is less histamine
production in rat fed with these probiotics. Additionally, Schiffer et al. (2011) showed
that the injection of L. casei into mice inhibited IgE-induced passive systemic
anaphylaxis and mast cell activation. It must be highlighted, however, that the uses of
probiotics for food hypersensitivity and allergy are only able to protect against the
condition rather than cure them.
1.2.2.4. Lowering of cholesterol
There is some evidence showing that probiotics could potentially lower the
levels of plasma cholesterol. This benefit seems to occur through the assimilation of
dietary cholesterol in the intestine by probiotics and through the deconjugation of bile
acids by the bile salt hydrolase enzyme produced by probiotics (Zhuang et al., 2012).
To this end, Liong and Shah (2005) demonstrated that L. acidophilus and L. casei could
remove cholesterol when grown in culture medium under conditions similar to those
found in the human intestine; however, the amount of cholesterol removed from the
media was strain specific. This ability of probiotics was also demonstrated by Lye et al.
(2010) who found that L. acidophilus and L. bulgaricus were able to remove cholesterol
from the media and accumulate it onto their cell surface. These in vitro results

11
demonstrated that probiotics could lower plasma cholesterol through reduction of
available cholesterol in the intestine. Moreover, Jones et al. (2004) found that bile salt
hydrolase produced by L. plantarum was able to hydrolyse conjugated bile acids to
deconjugated bile acids. This leads to substantial loss of bile acids which play an
essential role in fat digestion, as deconjugated bile acids are less soluble and difficult to
reabsorb back through the intestine than their conjugated form. Therefore, serum
cholesterol was used by the liver in order to replenish the bile acids which are lost in
faeces due to hydrolysis by the bile salt hydrolase produced by L. plantarum. However,
the ability of probiotics in lowering cholesterol is still in doubt as some of these studies
have reported a significant effect, while others have not.
1.2.2.5. Prevention of cancer
Although there is some evidence of cancer-preventing properties of probiotics,
which have been reported in animal and human studies, the exact role of probiotics in
the context of anticancer activities and the mechanisms of action have not been clearly
elucidated. However, it has been suggested that a possible mechanism could involve the
binding and degrading of potential carcinogens, the production of anti-tumorigenic or
anti-mutagenic compounds in the colon, and enhancement the host's immune response
(Hirayama and Rafter, 2000). For example, Goldin and Gorbach (1984) reported that
the administration of L. acidophilus NCFM and N-2 reduced the levels of faecal
enzymes (i.e. β-glucuronidase, azoreductase, nitro-reductase and urease) which can
convert procarcinogens to carcinogens in human subjects. Pool Zobel et al. (1996) also
showed that a probiotic mixture (L. acidophilus, Lactobacillus gasseri P79,
Lactobacillus confusus DSM 20196, Streptococcus thermophilus NCIM 50083,
Bifidobacterium breve and Bifidobacterium longum) prevented the induction of DNA

12
damage by N-methy-N'-nitro-N-nitrosoguanidine in colon cells of rats. Overall,
however, the existing amount of evidence is not sufficient to establish a correlation
between probiotic administration and cancer treatment, in human subjects. More studies
are therefore required before such a claim can be made.
1.2.3. Selection of probiotic strains
Probiotics have been recognized as functional food ingredients due to the
advancement of scientific evidence indicating their potential health-promoting effects,
as discussed above. Several microbial strains, mainly Bifidobacterium species and
Lactobacillus species (Table 1.2), have been incorporated into various food products
and claimed as probiotics. The vast amount of strains used seems to lead to skepticism
amongst the general population (i.e. potential customers) regarding the efficacy of
probiotic strains. These issues have been diminished by the guidelines for the evaluation
of probiotics in food, produced by FAO/WHO (2002). These guidelines state that
probiotics need to meet certain requirements before they can be claimed as probiotics.
More specifically, i) genus, species, and strain need to be identified and declared, ii)
positive health benefits need to be tested in vitro and in animal studies, iii) safety
information needs to be presented, iv) clinical trials need to be conducted, and v)
content, dosage, shelf-life, and health claim need to be labelled. These criteria should
ensure that probiotics are regulated and made in a way which is safe for human
consumption and effective. However, recently the concept of what can be defined as
probiotics was revised in 2014 by an expert group of international scientists working on
behalf of FAO/WHO (Hill et al., 2014). The principal concepts were the same as
previous guidelines with the exception of one modification; a core group of well-studied
probiotic species such as Bifidobacterium adolescentis, Bifidobacterium animalis,

13
Bifidobacterium bifidum, Bifidobacterium breve, L. acidophilus, L. casei, L. fermentum,
L. gasseri, L. johnsonii, L. paracasei, L. plantarum, L. rhamnosus, and L. salivarius,
can ascribe the general beneficial effects on gut. Clinical trials are not essential to be
conducted on specific strains belonging to these species in order to claim their general
health effects. However, these guidelines have not explicitly stated the essential
properties that microorganisms should have in order to be considered as probiotics. For
example, Collins et al. (1998) suggested that a good probiotic strain should have some
of the following properties: i) it should originate from humans so that it can adhere to
and colonise the human GIT; ii) it should have a history of being non-pathogenic even
in immunocompromised hosts so that it is safe to use in humans; iii) it should tolerate
the low pH of the gastric juice and high concentrations of both conjugated and
unconjugated bile acids so that it can survive during passage through the upper GIT; iv)
it should exhibit antibacterial properties (e.g. produce lactic acid) so that it can inhibit
the growth of potentially pathogenic bacteria; v) it should stimulate or inhibit immune
response via epithelial cells, dendritic cells, monocytes/macrophage and lymphocytes in
the digestive tract so that it can modulate the host’s immune responses; vi) it should
survive during product manufacturing and storage until the time of consumption so that
it can deliver the desired health benefits to the host. Using these criteria for microbial
selection should increase the possibility for obtaining potential probiotic strains that can
be used in food products. However, it needs to be emphasised that certain of the above
properties are strain specific, thus effective probiotic screening programs are important
for selecting appropriate strains. Additionally, the knowledge derived from human
microbiome research using a range of emerging molecular methods, such as
metagenomics, metatranscriptomics and metabolomics will further enhance our
understanding about the correlations between microbiota and their impact on human

14
health or diseases and also assist in the identification of novel probiotic strains from
indigenous microbial species (Hemarajata and Versalovic, 2012). Finally, it is essential
to note that there were a number of reasons for selecting L. plantarum NCIMB 8826 as
the model potential probiotic strain in this thesis. The strain is of human origin and has a
good safety history in clinical trials (De Vries, 2006). The strain has demonstrated good
survival in vitro and in vivo, e.g. it can survive well in model gastric solutions at pH<3
(Charalampopoulos et al., 2003, Parente et al., 2010), it can persist in the mouse
intestine for 10 days after oral administration (Pavan et al., 2003), and it can resist the
conditions of the human digestive tract (up to ileum) with 7% survival (Vesa et al.,
2000). A number of potential health benefits have been shown (e.g. modulation of gut
microbiota, anti-inflammation, anti-allergic, and immunomodulation) in vitro and in
animal models. For example, the modulation of gut microbiota through competition for
binding and receptor sites was shown by Sánchez et al. (2009) and Hevia et al. (2013).
The serine/threonine-rich proteins which were secreted by L. plantarum NCIMB 8826
displayed an ability to bind to mucin and fibronectin located on human epithelial cells.
From these results, they suggested that the production of these proteins helped in
improving the adhesion and colonization of this bacterium to the human intestinal
mucosa. The anti-inflammatory properties of this strain were reported by Foligné et al.
(2006). They showed that daily gavage administration of L. plantarum NCIMB 8826
with a cell concentration of 108 to 109 CFU helped to reduce colitis induced by
trinitrobenzene sulfonic acid in mice. They demonstrated that this process occurred due
to the production of IL-10, an anti-inflammatory cytokine, by this strain after co-
incubation with human peripheral blood mononuclear cells in vitro (Foligne et al.,
2007). The immunomodulation activity of L. plantarum NCIMB 8826 was
demonstrated by Dong et al. (2012). They showed that this strain was able to induce the

15
production of IL-12 in vitro which helps to promote the development of T-cells and
stimulate the secretion of IFN-γ. These lead to the activation of T-cells and NK cells
which respond to viral infection and tumour formation. The anti-allergic activity of this
strain was also reported by Pochard et al. (2005). They found that this strain could
reduce the effect of mite allergen (Der p 1) on dendritic cells via the reduction of IL-4
which was involved in the development of B-cells, as well as decreased IL-5 which
stimulates B cell growth, and increase immunoglobulin secretion. From these results, it
seems likely that the administration of L. plantarum NCIMB 8826 may have led to
change in IL-4 and IL-5 production/level by host cells which resulting in the lower
production of antibodies in allergic patients after challenge with mite allergen compared
with healthy people.
Certain health benefits have been also demonstrated in human trials. Karczewski
et al. (2010) reported that oral administration of L. plantarum NCIMB 8826 was able to
decrease the epithelial barrier dysfunction in humans by increasing the localization of
zonula occludens-1 and transmembrane proteins, which are the essential proteins for
strengthening the tight junctions, via the toll-like receptor 2 signalling pathway. The
complete genome sequence of this bacterium is available. This information should
allow the molecular investigation of certain genes, (e.g. those responsible for the
synthesis of antimicrobial compounds and exopolysaccharide (EPS) production, and
sugar metabolism) which can affect the adaptability and survival of the cells in foods as
well as in the GIT. L. plantarum NCIMB 8826 can thus be considered a potential
probiotic strain as it meets the requirements underlined in the guidelines for the
evaluation of probiotics by FAO/WHO (2002) and it is also one of most well-defined
probiotic strains which can ascribe the general beneficial effects on gut physiology and
human health of L. plantarum at species level (Hill et al., 2014).

16
Table 1.2 List of microorganisms considered as probiotics adapted from Holzapfel et al. (2001) Lactobacillus species Bifidobacterium species
Lactobacillus acidophilus Lactobacillus amylovorus Lactobacillus brevis Lactobacillus casei Lactobacillus casei subsp. rhamnosus Lactobacillus crispatus Lactobacillus delbrueckii subsp. bulgaricus Lactobacillus fermentum Lactobacillus helveticus Lactobacillus gallinarum Lactobacillus gasseri Lactobacillus johnsonnii Lactobacillus paracasei Lactobacillus plantarum Lactobacillus reuteri Lactobacillus rhamnosus
Bifidobacterium adolescentis Bifidobacterium animalis Bifidobacterium bifidum Bifidobacterium breve Bifidobacterium infantis Bifidobacterium lactis Bifidobacterium longum
Other LAB Non-LAB and yeast
Enterococcus faecalis Enterococcus faecium Lactococcus lactis subsp. cremoriss Lactococcus lactis subsp. lactis Leuconostoc mesenteroides Pediococcus acidilactici Sporolactobacillus inulinus Streptococcus thermophilus
Bacillus cereus var. toyoi Escherichia coli strain Nissle Propionibacterium freudenreichii Saccharomyces cerevisiae Saccharomyces boulardii
1.2.4. Products with probiotics on the market
At present, there are various dairy products supplemented with probiotic bacteria
on the market, e.g. fermented dairy products, cottage cheese, ice cream, frozen dairy
desserts (Shah, 2007), but the top selling product has always been yoghurt. It must be
noted though that the commercial success of yoghurt ultimately depends on its taste,
appearance, price, and in addition to those, to potential health benefits to consumers
(Heller, 2001). From a technical point of view, yoghurt is considered as a very good
probiotic carrier because of the high buffering capacity of milk (Salminen and Playne,

17
2001). Moreover, the pH of yoghurt normally ranges from pH 4.0 to 4.4 (Hamann and
Marth, 1984) which is suitable for long term refrigerated storage of Lactobacillus and
Bifidobacterium species (Rivera-Espinoza and Gallardo-Navarro, 2010).
The development of non-dairy probiotic products, such as fermented meats (e.g.
dry sausages), cereals (e.g. sourdough), vegetables (e.g. sauerkraut) and fruit juices, is a
challenging task for the food industry in its efforts to expand the range of probiotic
containing foods (Luckow and Delahunty, 2004, Champagne et al., 2005). Table 1.3
presents a list of potential non-dairy probiotic products which have been investigated.
According to Luckow and Delahunty (2004), Champagne et al. (2005), and Rivera-
Espinoza and Gallardo-Navarro (2010), a number of factors need to be considered for
the successful development of probiotic products including: i) strain selection, ii)
physiological state of the probiotic strain, iii) physical conditions during processing and
storage, iv) physicochemical parameters of the product, e.g. pH, water activity, carbon,
nitrogen, mineral and oxygen content, and v) organoleptic properties and consumer
acceptability. Considering the above criteria, it can be suggested that fruit juices are
promising vehicles for the delivery of probiotics as they contain relatively high amounts
of sugars, minerals, and vitamins, which could be used as energy and nutrition sources
for the survival of probiotics during storage (Ding and Shah, 2008) and offer an
alternative choice to consumers with lactose intolerance (Prado et al., 2008). Moreover,
fruit juices have sensory profiles which are acceptable to all age groups and are also
perceived by consumers as being healthy and refreshing foods (Rivera-Espinoza and
Gallardo-Navarro, 2010).

18
Table 1.3 List of non-dairy products containing probiotics adapted from Granato et al. (2010)
Category Product Fruit and vegetable based products
- Vegetable-based drinks - Fermented banana pulp - Fermented banana - Beets-based drink - Tomato-based drink - Many dried fruits - Green coconut water - Peanut milk - Cranberry, pineapple, and orange juices - Ginger juice - Grape and passion fruit juices - Cabbage juice - Carrot juice - Noni juice - Onion - Banana puree - Non-fermented fruit juice beverages - Blackcurrant juice
Soy based products - Non-fermented soy-based frozen desserts - Fermented soymilk drink - Soy-based stirred yoghurt -like drinks
Cereal based products - Cereal-based puddings - Rice-based yoghurt - Oat-based drink - Oat-based products - Yosa (oat-bran pudding) - Mahewu (fermented maize beverage) - Maize-based beverage - Wheat, rye, millet, maize, and other cereals fermented
beverages - Malt-based drink - Boza (fermented cereals) - Maize, sorghum, and millet malt fermented beverages - Millet or sorghum flour fermented beverage
Other non-dairy products - Starch-saccharified drink - Cassava-flour product - Meat products - Dosa (rice and chickpea)

19
1.2.5. Probiotic-containing fruit juices
A considerable amount of research has been conducted to address the cell survival
relevant to the incorporation of probiotics in various fruit juices including orange, apple,
kiwi, pineapple, peach, cranberry, cashew apple, strawberry, and pomegranate juices
(Table 1.4). Strain selection is of high importance considering that not all species or
strains can tolerate a highly acidic environment, such as that of fruit juices (pH 2.5 to
3.5). Among the LAB, lactobacilli are considered more robust than other genera, such
as lactococci and streptococci. Besides the intrinsic properties of the strains, the type of
juice used affects cell survival significantly. For example, L. casei, L. rhamnosus and
L. paracasei survived very well in orange and pineapple juice for more than 12 weeks
of refrigerated storage, whereas in cranberry juice they died very quickly (<9 days)
(Sheehan et al., 2007a). Very low survival was also observed for L. delbruekii and
L. plantarum in pomegranate juice after 2 weeks of storage (Mousavi et al., 2011).
Research carried out by our research group demonstrated that the cell viability of
L. plantarum in cranberry juice decreased by more than 8 log CFU/ml within a week of
storage (Nualkaekul and Charalampopoulos, 2011). These results were similar to the
work of Sheehan et al. (2007a), who demonstrated that the cell viability of L. salivarius,
L. casei and Bifidobacterium lactis decreased by more than 4 log CFU/ml while that of
L. rhamnosus and L. paracasei decreased by approximately 3 log CFU/ml after 2 days
of storage in cranberry juice (Sheehan et al., 2007a). The main physicochemical factor
influencing cell survival is the pH of the juice; for example cranberry and pomegranate
juices have a pH between 2.5 and 2.8, whereas the pH of orange, apple and pineapple is
higher, ranging from 3.3 to 4.0. Besides pH, most juices have large amounts of organic
acids, in particular citric and malic acid (Flores et al., 2012), which are likely to have
adverse effects on cell viability in their undissociated form (this happens at a pH higher
20
than their pKa value), as they can easily enter into the cell leading to a decrease in
intracellular pH (pHi) and eventually to cell death (Beales, 2004). Moreover, fruit juices
and in particular juices from berries contain considerable amount of polyphenols, some
of which have antimicrobial activities against LAB, including lactobacilli (Puupponen-
Pimiä et al., 2001).

21
Table 1.4 Survival of probiotic bacteria in various types of fruit juices
Microorganism Fruit juices
Starting
cells
(CFU/ml)
Duration of storage when cell viability was higher
than 106 (CFU/ml)
References
- L. salivarius subsp. salivarius UCC118 - L. salivarius subsp. salivarius UCC500 - B. animalis subsp. lactis Bb-12 - L. paracasei subsp. paracasei NFBC4338 - L. rhamnosus GG - L. casei DN- 114 001
Orange 108 1 week 1 week 6 weeks >12 weeks >12 weeks >12 weeks
(Sheehan et al., 2007a)
- L. salivarius subsp. salivarius UCC118 - L. salivarius subsp. salivarius UCC500 - B. animalis subsp. lactis Bb-12 - L. paracasei subsp. paracasei NFBC4338 - L. rhamnosus GG - L. casei DN- 114 001
Pineapple
108 1 week 1 week 4 weeks >12 weeks >12 weeks >12 weeks
- L. salivarius subsp. salivarius UCC118 - L. salivarius subsp. salivarius UCC500 - B. animalis subsp. lactis Bb-12 - L. paracasei subsp. paracasei NFBC4338 - L. rhamnosus GG - L. casei DN- 114 001
Cranberry 108 <1 week
- L. acidophilus - L. brevis - L. rhamnosus - L. fermentum - L. plantarum - L. reuteri
Blend of pineapple, apple, orange, pear and/or grape, passion fruit, lemon and purees (peach, strawberry, mango and kiwi)
107 4 weeks >11 weeks >11 weeks >11 weeks >11 weeks >11 weeks
(Champagne and Gardner, 2008)
- L. acidophilus DSMZ 20079 - L. paracasei DSMZ 15996 - L. plantarum DSMZ 20174 - L. delbrueckii DSMZ 20006
Pomegranate 107 <1 week <1 week 1 week 1 week
(Mousavi et al., 2011)
- L. acidophilus LA39 - L. casei A4 - L. delbrueckii D7 - L. plantarum C3
Beetroot 106 2 weeks 4 weeks 4 weeks 4 weeks
(Yoon et al., 2005)
- L. casei NRRL B-442 Cashew apple 107 6 weeks (Pereira et al., 2011)
- L. plantarum NCIMB 8826 Orange Grapefruit Blackcurrant Pineapple Lemon Pomegranate Cranberry
108 6 weeks 6 weeks 6 weeks 6 weeks 6 weeks 2 weeks <1 week
(Nualkaekul and Charalampopoulos, 2011)

22
1.2.6. Genetically modified (GM) probiotics in foods
Although a variety of techniques has been developed to generate GM
microorganisms, such as cloning systems, chromosome modification systems and
expression systems, few GM products find their way into the food market because the
food products produced with the aid of GM microorganisms are banned in many
countries (Sybesma et al., 2006). For example, the regulation for GM foods in the
European Union (EU) is very stringent. Any genetic modifications that do not occur
naturally are considered as GM microorganisms which are unacceptable in food
production (Kondo and Johansen, 2002). However, the regulatory standpoint on GM
foods is different from country to country. In the United States of America (USA), the
commercial opportunities for GM foods are more promising for the future than in EU
because the FDA regulation for GM foods, which is known as generally recognized as
safe (GRAS), focuses on the nature of the products, rather than the process in which
they are created (Kondo and Johansen, 2002). This means that the method of deriving
new GM foods is not the primary concern in the evaluation of safety but instead the
safety of the final product is given the highest consideration. As a result many products
produced from GM microorganisms are launched into the food market in USA, such as
cellulase enzyme derived from a GM-Myceliophthora, eicosapentaenoic acid-rich
triglyceride oil derived from a GM-Yarrowia lipolytjca. However, it needs to be noted
that no products with live GM LAB has been released on the market (Sybesma et al.,
2006) or even accepted as GRAS yet. This might be due to the fact that GM LAB do not
have a history of safe use as food ingredient which is the most important aspect of the
GRAS criteria. Moreover, it is not possible to guarantee they are safe for human
consumption based on limited scientific evidence currently available. To achieve this,
the safety of GM microorganisms needs to be demonstrated including genetic stability,

23
potential gene transfer, and the interactions with indigenous microflora (Feord, 2002).
Research in this area is very important as GM probiotics might be able to provide
considerable, technological, functional and health benefits in the future.
1.2.7. Survival of GM-probiotics in the gut
It is well established that the beneficial effects of probiotics can be expected
only when the cells are viable and thus are able to survive in the human gut. However,
many potential probiotics die during passage through the GIT because they are
challenged by many stressful conditions, such as acid stress, bile stress, oxygen stress,
etc. Improving stress responses of probiotic strains by genetic modification might be an
answer for enhancing the survival of probiotics during passage through the human gut.
However, this strategy might not always ensure good survival in the GIT because of
unintended effects occurring during genetic modification (e.g., inhibition of specific
metabolites from the overproduction of certain proteins, toxicity associated with
overexpression of target proteins), which might impact cell survival.
To our knowledge, there is a limited number of studies on the survival of
engineered stress resistant probiotics in the gut. The introduction of betL gene, encoding
for a secondary glycine betaine transport system linked to the salt tolerance of Listeria
monocytogenes, into Bifidobacterium breve UCC2003 was performed to improve the
survival of Bifidobacterium breve UCC2003 in the gut, as this gene has been found to
increase the pressure stress (Smiddy et al., 2004) and viability in certain foods (Sleator
et al., 2003). It was found that the strain after insertion of the betL gene exhibited
significantly increased tolerance to gastric juice and to conditions of elevated osmolarity
mimicking the gut environment when compared to the control strain lacking betL gene
(Sheehan et al., 2007b). Moreover, the strain having the betL gene was able to survive

24
and colonize better in murine intestine than the control strain (Sheehan et al., 2007b).
Similarly, the transformation of bilE genes involved in bile stress response in Listeria
monocytogenes were cloned into Lactococcus lactis NZ9000 and Bifidobacterium breve
UCC2003. The results showed that both strains harbouring bilE genes exhibited 2.5 log
CFU/ml higher survival rate than the wild type strains when grown in porcine bile at
concentrations similar to that found in the intestine. Furthermore, they persisted longer
in the murine GIT and were recovered in higher amounts from murine faeces compared
to the control strains (Watson et al., 2008). Based on these promising results, it seems
likely that a LAB strain engineered to be resistant to a variety of stresses could possibly
be able to survive in the human gut better than wild type strains. This is a line of
research worth exploring in an effort to improve the technological and functional
properties of probiotics.
1.3. 9BLAB
1.3.1. 36BThe taxonomy of LAB
As mentioned above, LAB are the bacteria that are most commonly used as
probiotics. Species of the genera Carnobacterium, Enterococcus, Lactobacillus,
Lactococcus, Leuconostoc, Oenococcus, Pediococcus, Streptococcus, Tetragenococcus,
Vagococcus and Weissella are typical LAB associated with foods (Vandamme et al.,
1996). The term LAB was introduced because these bacteria have the ability to ferment
and coagulate milk and form lactic acid as a major end product. In 1919, Orla Jensen
classified LAB based on their morphological and physiological characteristics. For
several decades, the taxonomy of LAB was based on classical approaches. On account
of the advances in molecular techniques, polyphasic approaches including
chemotaxonomic and phylogenetic studies have become key criteria for the

25
classification of LAB. With the application of new bacterial systematics, LAB are
recognized as a part of Gram-positive bacteria with low G+C content in DNA (≤55
mol%) and belong to the phylum Firmicutes, class Bacilli, and order Lactobacillales
(Garrity and Holt, 2001). They are represented as a group of bacteria distributed in six
families: Aerococcaceae (7 genera), Carnobacteriaceae (16 genera), Enterococcaceae
(17 genera), Lactobacillaceae (3 genera), Leuconostoccaeae (4 genera) and
Streptococcaceae (3 genera) (Tsakalidou and Papadimitriou, 2011). In total, more than
40 genera of LAB have been established; the largest genus is Lactobacillus which was
first proposed by Beijerinck in 1901 (Versalovic and Wilson, 2008). Lactobacilli are
Gram-positive bacteria, usually non-motile, non-spore forming rods and lack
cytochromes as well as porphyrins. They are catalase negative, aerotolerant anaerobes,
fastidious, acid-tolerant, and strictly fermentative. Their optimum growth temperature
and pH range between 30 and 40 °C and from 5.5 to 6.2, respectively (Axelsson, 2004).
At the time of writing, this genus comprised 214 recognized species. However, some
species of the Lactobacillus genus have not been confirmed, as the phylogenetic
relationship alone is not enough to elucidate the taxonomy. In order to resolve this
issue, Claesson et al. (2008) used an array of whole-genome and single-marker
phylogenetic approaches to establish four sub-generic groups, namely, Group A
(L. acidophilus, L. helveticus, L. delbrueckii subsp. bulgaricus, L. johnsonii, and
L. gasseri), Group B (L. salivarius, L. plantarum, L. reuteri, L. brevis, and Pediococcus
pentosaceus), Group C (L. sakei and L. casei), and Group D (Leuconostoc
mesenteroides and Oenococcus oeni).

26
1.3.2. Overview of stress response in LAB
The LAB is a highly heterogeneous group, as these bacteria can be isolated from
various environments, which reflects the diverse properties of this group. For example,
Lactobacillus suebicus is able to grow at pH 2.8, Enterococcus faecium is able to
survive to pH as high as 9.6, Carnobacterium viridans tolerates up to approximately
26 % NaCl, Leuconostoc gelidum can survive at low temperature (0 to 2 °C), and
L. delbrueckii subsp. delbrueckii can endure high temperatures (55 °C) (Tsakalidou and
Papadimitriou, 2011). The reason that LAB can survive in adverse environments is that
they have developed stress-sensing systems and defence mechanisms (Hartke et al.,
1996, Van de Guchte et al., 2002, Spano and Massa, 2006, Lorca and de Valdez, 2009).
Like most other living organisms, LAB have genes/regulators responsible for each
stress; the activation of defence mechanisms against a specific stress is commonly
induced by the expression of several gene clusters resulting in a series of changes in
their global regulatory network (VanBogelen et al., 1999, Van de Guchte et al., 2002,
De Angelis and Gobbetti, 2004). For example: i) Heat shock induces the synthesis of a
specific set of proteins known as heat shock proteins which are controlled by several
regulators (Class I: HrcA, Class II: sigma factor, Class III: CtsR, and Class IV:
unknown regulators). These proteins protect the cells by reducing the degradation and
aggregation of proteins caused by high temperature. ii) Cold stress induces the synthesis
of another set of proteins called cold shock proteins for which the control regulator is
not clear. These proteins are synthesized in order to maintain membrane fluidity by
increasing the degree of unsaturated fatty acids and increase the rate of transcription as
well as translation by declining the coiling of a DNA strand. iii) Acid stress induces the
synthesis of several proteins that are related to various stress response systems, such as
F-ATPase, arginine/agmatine deiminase (ADI/AgDI), decarboxylases, cell membrane

27
and cell envelope biosynthesis. These proteins are produced to control ∆pH
homeostasis, protect proton influx and repair damage of other proteins in response to
acid stress. Moreover, the time required to initiate a stress response depends on the type
of stress. For example, the response to acid, heat and osmotic shock requires less time
(min), with acid stress requiring less than 20 min for the majority of changes to take
place in the cell membrane, whereas the response to cold shock requires more time (h)
(Fozo and Quivey Jr, 2004, Tsakalidou and Papadimitriou, 2011).
1.3.3. Responses of LAB to acid stress
Acid stress response has been previously reported in several LAB, e.g.
Lactococcus lactis (Budin‐Verneuil et al., 2005), L. bulgaricus (Fernandez et al., 2008),
L. reuteri (Rollan et al., 2003), L. delbrueckii subsp. bulgaricus (Zhai et al., 2014),
L. casei (Wu et al., 2012b), L. rhamnosus (Koponen et al., 2012), L. acidophilus (Lorca
and de Valdez, 2001), L. helveticus (Guerzoni et al., 2001), L. plantarum (Pieterse et
al., 2005) and L. sanfranciscensis (De Angelis et al., 2001). According to these studies,
multiple systems have been proposed as the systems used by LAB to maintain their
viability in low pH environments; the main ones include ∆pH homeostasis and
alkalization of the external environment, and cell envelope alteration.
The main biochemical pathways involved in ∆pH homeostasis and the
alkalization of the external environment include: increased H+-ATPase or F-ATPase
activities (Kullen and Klaenhammer, 1999), the ADI and AgDI pathway (De Angelis et
al., 2002, Lucas et al., 2007), glutamate decarboxylase (GAD) (Sanders et al., 1998, Su
et al., 2011) and the citrate fermentation pathway (Martín et al., 2004). H+-ATPase or
F-ATPase enzymes pump protons outside the cell via adenosine triphosphate (ATP)
hydrolysis. This activity increases as the pH decreases and it has been demonstrated that

28
it is essential for cell viability at low pH (Kobayashi et al., 1984, Kobayashi et al.,
1986, Nannen and Hutkins, 1991, Yokota et al., 1995, Miwa et al., 1997). The ADI
pathway converts arginine to ammonia, ornithine/putrescine and carbon dioxide (CO2).
Ammonia production contributes to survival at low pH through the neutralization of the
medium (Poolman et al., 1987). GAD converts glutamate to γ-aminobutyric (GABA)
and CO2, a proton consuming reaction, which also contributes towards the reduction of
pHi (Sanders et al., 1998, Azcarate-Peril et al., 2004, Feehily and Karatzas, 2013). The
citrate fermentation pathway involves the release of lactate from the cytoplasm out of
the cells through the exchange with divalent citrate present in the media. This system
generates a proton motive force (PMF) which can be used for ATP synthesis in order to
pump protons out of the cells (Pudlik and Lolkema, 2011a).
The second system of acid stress in LAB involves structural changes of the cell
envelope. The aim of these changes is to decrease the influx of protons into the cells.
More specifically, in order to decrease proton permeability into the cell, LAB can
change the fatty acid composition of the cell membrane, in particular the ratio of
unsaturated and saturated fatty acids as well as the concentration of cyclopropane fatty
acid (CFA) (Guerzoni et al., 2001, Streit et al., 2008, Montanari et al., 2010, Wu et al.,
2012b). Additionally, there are suggestions of an association between peptidoglycan
synthesis and teichoic acid in the cell wall, which is responsible for binding of cations
(Swoboda et al., 2010), and sensing environmental stress (Jordan et al., 2008).
1.3.3.1. The role of F-ATPase in acid stress response
A number of studies have established that the membrane bound F-ATPase is
involved in enhancing the survival of bacteria such as Salmonella typhimurium
(Kobayashi et al., 1984, Kobayashi et al., 1986), Listeria monocytogenes (Cotter et al.,

29
2000), Lactococcus lactis and L. casei (Nannen and Hutkins, 1991, Yokota et al., 1995)
when challenged by acidic conditions. The main function of F-ATPase is to remove
protons from the cytoplasm by pumping them through the membrane-bound subunit, at
the expense of the ATP which is produced during glycolysis. The result is a cytoplasm
that is more alkaline than the external environment. Amplification of the proton-
translocating ATPase was shown to be involved in the regulation of cytoplasmic pH in
Enterococcus hirae (Kobayashi et al., 1984). Subsequent studies showed that the
differences in proton movement were directly attributed to the amount of F-ATPase
being produced (Bender et al., 1986, Belli and Marquis, 1991). Correspondingly,
Nannen and Hutkins (1991) demonstrated that the specific activity of F-ATPase from
LAB increases as the extracellular pH moves from neutral to acidic. The F-ATPase
structure was first established in E. coli by Walker et al. (1984) and consists of eight
subunits. Five subunits (α, β, γ, δ, and ε) constitute a globular structure F1, which is an
extrinsic membrane domain, while the remainders (a, b, and c) form an intrinsic
membrane-bound subunit, F0. The F-ATPase in E. coli is encoded by the apt operon
containing nine corresponding genes which are designated as A, B, C, D, E, F, G, H,
and I (atpIEBFHAGDC), whereas F-ATPase in L. acidophilus is organized somewhat
differently. It contains only eight corresponding genes, atpBEFHAGDC, in which the
atpI, an unknown function gene, is absent (Kullen and Klaenhammer, 1999). The
atpBEF gene encodes the membrane-bound element of the enzyme while the
atpHAGDC establishes the catalytic site for ATP hydrolysis. Overall, the role of
F-ATPase in the survival of LAB during acid stress is not clearly elucidated. However,
in a previous study, Yokota et al. (1995) compared the survival of a Lactococcus lactis
strain with that of its mutants, which were lacking F-ATPase, under growth conditions
at pH 6 and 4. The parent strain showed significantly better survival in acidic conditions

30
than the mutant strains, indicating that membrane-bound ATPase is essential for this
microorganism to survive at low pH, probably through its function of proton pumping
for maintaining cytoplasmic pH levels. This confirmed previous work, which showed an
upregulation of genes related to F-ATPase in LAB at low pH. For example, Kullen and
Klaenhammer (1999) showed a significant upregulation of the atpBEF genes in
L. acidophilus when incubated in de Man, Rogosa and Sharpe medium (MRS) at pH 3.5
compared to pH 5.6, whereas Ventura et al. (2004) demonstrated a rapid 15 fold
increase in the expression of the atpD gene in Bifidobacterium lactis after exposure to
MRS at pH 3.5 compared to pH 6.0. Duary et al. (2010) also demonstrated that
increased transcription of the atpD gene following incubation of L. plantarum in MRS
at different pH (pH 2.5, 3.5, 4.5 and 6.5) was correlated with increased acidity of the
medium.
1.3.3.2. The role of ADI/AgDI pathway in acid stress response
The production of ammonia, which helps to raise the pHi, appears to be one of
the key mechanisms of acid resistance in LAB (Rollan et al., 2003, Wu et al., 2012a,
Zhang et al., 2012). Ammonia can be produced through the fermentation of arginine
and the less abundant amino acid agmatine. Some genera of LAB, including lactococci,
streptococci, and lactobacilli can utilize the ADI pathway to survive in acidic
environments. The ADI system converts arginine to ornithine, ammonia and CO2, while
concomitantly generating one mole of ATP, as shown in figure 1.1. The generation of
ammonia increases the pHi through the alkalization of the cytoplasm. This system is
repressed by carbohydrates and is induced by arginine, but it is not clear whether
induction is influenced by environmental pH (Poolman et al., 1987, Curran et al., 1995).
The genetic organization of this system (arcABCTD) has been examined and consists of

31
arcA (encoding arginine deiminase), arcB (encoding ornithine transcarbamylase), arcC
(encoding carbamate kinase), arcT (encoding putative transaminase), and arcD
(encoding putative arginine/ornithine antiporter) (Zuniga et al., 1998). In addition to the
ADI system, some LAB such as Streptococcus mutans (Griswold et al., 2004) and
Lactobacillus brevis (Lucas et al., 2007) utilize agmatine as a substrate through the
AgDI pathway to produce ammonia resulting in acid protection. The biochemical
pathway is similar to that of the ADI system; in this case agmatine is converted to
putrescine (Figure. 1.1). The genetic organization of the AgDI pathway operon in
Lactobacillus brevis is aguRBDAC (Lucas et al., 2007). The role of ADI pathway in
response to acid stress was confirmed by Wu et al. (2012a) and Zhang et al. (2012) who
reported that the cell survival of L. casei in acidified MRS using lactic acid at pH 3.3
was improved (by ∼1.4 to ∼3.4 times) after adding 50 mM of aspartate or arginine into
the media. More specifically, added aspartate can be absorbed and converted to arginine
by argininosuccinate synthetase (Ass) and argininosuccinate lyase (Asl), while added
arginine can be directly utilized leading to the production of ammonia via the ADI
pathway in order to reduce the pHi.
Figure 1.1 Simplified schemes describing the ADI and AgDI pathways in LAB (Griswold et al., 2009).

32
1.3.3.3. The role of decarboxylation reaction in acid stress response
Although several systems are utilized by LAB to withstand low pH, the GAD
system is deemed to be one of the most important systems for acid resistance. GAD is
present in many bacteria, but it varies across species. Lactobacilli seem to possess only
one decarboxylase and one antiporter, which are gadB and gadC, respectively (Feehily
and Karatzas, 2013). The GAD, gadB, converts internalized glutamate to GABA
through the consumption of a proton with the concomitant production of a molecule of
CO2, while the putative membrane protein, gadC, is suggested to be involved in the
antiporter of glutamate and GABA. The net result of the combined action of gadCB is
the removal of a proton from the cytosol, which leads to an increase in the internal pH.
However, this system requires the presence of glutamate and Cl- ions (Sanders et al.,
1998). Chloride-dependent activation of gadCB is controlled by gadR, a regulatory gene
located just upstream of gadCB. Overall, a putative GAD system has been shown to
confer acid resistance to LAB in media supplemented with glutamate (Komatsuzaki et
al., 2005, Su et al., 2011). Although there are no published work confirming whether
the GAD system can enhance the survival of LAB, it is interesting to note that L. reuteri
wild type cells incubated in phosphate buffer with 10 mM glutamate (pH 2.5 using HCl,
37 °C, 24 h) were able to produce and secrete GABA out of the cells but this was not
the case of the mutant strain which lacked gadB (Su et al., 2011).
1.3.3.4. The role of the citrate fermentation pathway in acid stress response
The citrate fermentation pathway has been implicated in the acid adaptation of
LAB and has been studied in detail, primarily in Lactococcus lactis (García-Quintáns et
al., 1998). This pathway involves the uptake of citrate into the cell by exchange of
lactate produced from the glycolysis pathway. Once citrate is inside the cell, it is

33
converted to pyruvate; for this to be done three enzymes are required, i.e. citrate
permease, citrate lyase and oxaloacetate decarboxylase (Hugenholtz, 1993). The first
step is the conversion of citrate to acetate and oxaloacetate by citrate lyase. Then,
oxaloacetate is converted to pyruvate and CO2 by consuming a proton which is
catalyzed by oxaloacetate decarboxylase as shown in figure 1.2. It has been suggested
that the presence of citrate in the growth medium induced the activity of citrate lyase
(Bekal-Si Ali et al., 1999, Bott, 1997, Martín et al., 2000). The genetic organization for
citrate fermentation in Lactococcus lactis (citM-citCDEFXG) has been examined and
consists of citM (encoding malic enzyme), citCXG (encoding accessory genes required
for the synthesis of an active citrate lyase complex), and citFED (encoding the α, β, and
γ subunits of citrate lyase (Martín et al., 2004). According to Martı́n et al. (1999) and
Pudlik and Lolkema (2011a) the citrate fermentation pathway also generates a PMF
through the electrogenic membrane exchange of divalent citrate and monovalent lactate,
which is catalyzed by citrate permease (citP). The expression of this gene is induced at
a transcriptional level by the acidification of the medium (García-Quintáns et al., 1998,
Martı́n et al., 1999, Martín et al., 2004). The citrate fermentation pathway is utilized by
LAB, including members of the genera Lactoccocus, Lactobacillus, Leuconostoc and
Pediococcus (Poolman et al., 1991). In contrast, the malolactic fermentation pathway
uses the PMF generated from the exchange of malate instead of citrate to secrete lactic
acid out of the cytoplasm in order to help the cells survive in acidified conditions
(Sheng and Marquis, 2007). Although there is no information currently demonstrating
an improvement of cell viability after acid stress and the potential role of the citrate
fermentation pathway, it must be noted that citric acid has been shown to support
L. plantarum DSM 20174 growth under acidic conditions (pH 4 to 5) when used in
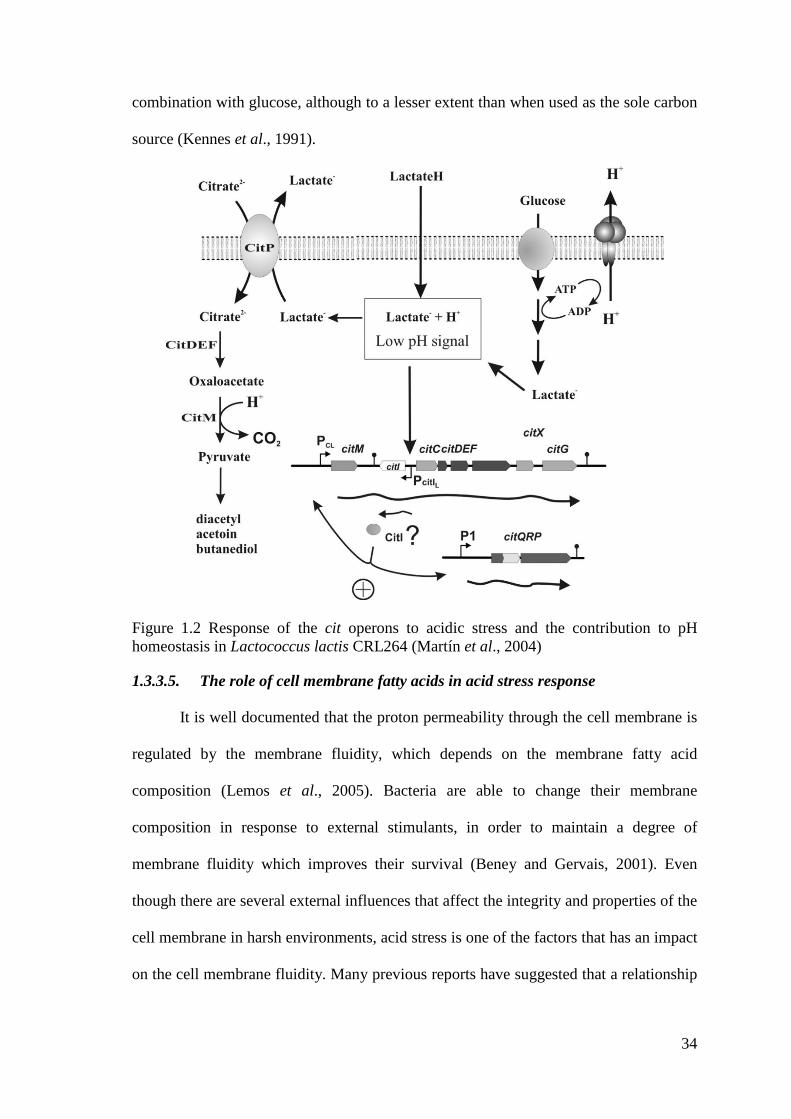
34
combination with glucose, although to a lesser extent than when used as the sole carbon
source (Kennes et al., 1991).
Figure 1.2 Response of the cit operons to acidic stress and the contribution to pH homeostasis in Lactococcus lactis CRL264 (Martín et al., 2004)
1.3.3.5. The role of cell membrane fatty acids in acid stress response
It is well documented that the proton permeability through the cell membrane is
regulated by the membrane fluidity, which depends on the membrane fatty acid
composition (Lemos et al., 2005). Bacteria are able to change their membrane
composition in response to external stimulants, in order to maintain a degree of
membrane fluidity which improves their survival (Beney and Gervais, 2001). Even
though there are several external influences that affect the integrity and properties of the
cell membrane in harsh environments, acid stress is one of the factors that has an impact
on the cell membrane fluidity. Many previous reports have suggested that a relationship

35
exists between acid stress and change in membrane fluidity (Lemos et al., 2005, Zhang
and Rock, 2008). At low pH, the cellular adaptive mechanisms induce a decrease in the
unsaturated membrane fatty acid content, which leads to an increase in the fluid-to-solid
phase transition and to a decrease in membrane fluidity; this phenomenon which is
known as homeoviscous adaptation has been reported for a number of LAB. Broadbent
et al. (2010) reported that acid adaptation of L. casei cells at low pH, using MRS
acidified with HCl at different pH (pH 3 to 5, 37 °C, 10 to 20 min), led to a decrease in
the proportion of the unsaturated to saturated fatty acid and to an increase in the amount
of CFA when the cell were exposed to MRS acidified with HCl (pH 2, 37 °C, 140 min).
These changes led to a decline in membrane fluidity. A similar change in cyclopropane
composition during acid stress, as the means for maintaining their membrane fluidity,
was also reported for L. helveticus (Montanari et al., 2010). Moreover, Wu et al.
(2012b) demonstrated that a L. casei mutant strain, which was obtained by serial sub-
culturing the cells in MRS medium (pH 4.3) for 70 days, showed better survival in
acidified solutions (pH 2.5 and 3.0) than the parent strain. They attributed this partly to
the higher amount of cyclopropane (octadecanoic acid, C19cyclo) in the mutant strains
(3 % higher cyclopropane than the parent strain initially (i.e. 0) and 9 % higher
cyclopropane after 60 min in acidified solutions). The overexpression of the
cyclopropane synthase (cfa) gene in L. plantarum during acid stress was reported (Seme
et al., 2015), although fatty acid analysis was not done in that study. Overall, the above
indicate that during acid stress, changes in the membrane fatty acids composition,
particularly increases in the degree of saturated fatty acids and the levels of
cyclopropane, most likely affect to membrane fluidity and thus the influx of protons,
and consequently could possibly play an important role in the survival of L. plantarum
at low pH.

36
1.3.3.6. The role of cell wall peptidoglycan in acid stress response
Peptidoglycan is a major component of the Gram positive cell wall and its role is
to maintain the cell shape and structure, which are important features influencing cell
viability (Tiyanont et al., 2006). Peptidoglycan consists of sugars and amino acids; the
sugar components are made of alternating N-acetylglucosamine (GlcNAc) and
N-acetylmuramic acid (MurNAc) linked by β-1,4 bonds, whereas amino acids, or
peptide chains containing 3 to 5 amino acids, are covalently linked through the
MurNAc. These peptide chains have diverse amino acid composition, depending on the
different species, and can be cross-linked directly or indirectly by an interpeptide cross-
bridge, i.e. a short chain of one or more amino acids (Figure 1.3). Typically, the stem
peptide sequence in LAB is L-Alanine-γ-D-Glutamate-X-D-Alanine, where the third
amino acid (X) is L-lysine in Lactococcus lactis and most lactobacilli; however it can
also be diaminopimelic acid (DAP) in L. plantarum or L-ornithine in L. fermentum
(Chapot-Chartier and Kulakauskas, 2014).
An important group of molecules found within the cell wall of Gram positive
bacteria, including lactobacilli such as L. plantarum, is wall teichoic acids (WTA) (Bron
et al., 2012, Tomita et al., 2012). WTA are covalently attached to peptidoglycan by a
disaccharide as shown in the figure 1.4. Recent studies have reported the binding of
D-alanine to WTA, which can reduce the negative charge of the cell envelope (Giaouris
et al., 2008, Swoboda et al., 2010, Brown et al., 2013), which might have potential
implications in acid stress response of bacteria with potential effects on how WTA bind
to D-alanine via a process known as D-alanylation or teichoic acid alanylation. The
phosphodiester linkage between the D-alanyl ester residue and the sn glycerol
1-phosphate of teichoic acids, which is controlled by dltABCD operon (Weidenmaier
and Peschel, 2008, Brown et al., 2013), can reduce the negative charge of the cell

37
envelope; this can be attributed to the protonated amino group of the D-alanyl ester
residue, which acts as a counter ion to the negatively charged phosphate group of the
glycerol 1-phosphate unit of teichoic acid (Neuhaus and Baddiley, 2003). It seems
likely that the higher the D-alanine content, the more positively charged the cell
envelope. Moreover, proteomic analysis of acid treated L. casei indicated that the
MurA, MurG and Ddl enzymes, which are involved in peptidoglycan biosynthesis, were
overexpressed during acid stress at pH 3.5 compared to pH 6.5 (Wu et al., 2012a)
indicating a potential link between peptidoglycan biosynthesis and acid stress response.
To our knowledge, the potential involvement of teichoic acid in response to acid stress
has not been investigated for LAB. The hypothesis investigated in this thesis is that the
changes occurring in the configuration of teichoic acid due to D-alanylation, which
should reduce the overall negative charge, are responsible for controlling the influx of
protons inside the cytoplasm and hence contribute to acid tolerance of cells.

38
Figure 1.3 Schematic representation of the main aspects of the structure of peptidoglycan (Chapot-Chartier and Kulakauskas, 2014).
Figure 1.4 Teichoic acid polymers located within the Gram-positive cell wall (Brown et al., 2013).
N-acytylglucosamine (Glc) N-acytylmuramic acid (Mur) L-Alanine (L-Ala) D-Glutamic (D-Glu) L-Lysine (L-Lys) D-Aspartic acid (D-Asp) O-acetylation (O-Ac)

39
1.4. Aims and objectives
The aims of this study were to evaluate the potential of using an acid adaptation
method to enhance the survival of a model potential probiotic strain (L. plantarum
NCIMB 8826) during storage in various fruit juices, and to investigate the possible
mechanisms involved. The main objectives were:
1. To study the effects of acid adaptation on subsequent cell survival during storage
in fruit juices and optimize the conditions for acid adaptation (e.g. acid type, acid
solution, time).
2. To investigate the mechanisms leading to potential improvement in the survival of
acid adapted cells in fruit juices using complementary approaches, including cell
morphology analysis, extracellular and intracellular compounds analysis (e.g.
organic acids, GABA, amino acids), and proteomic analysis.
1.5. References
ALMEIDA, C. C., LORENA, S. L. S., PAVAN, C. R., AKASAKA, H. M. I. & MESQUITA, M. A. 2012. Beneficial effects of long-term consumption of a probiotic combination of Lactobacillus casei Shirota and Bifidobacterium breve Yakult may persist after suspension of therapy in lactose-intolerant patients. Nutrition in Clinical Practice, 27, 247-251. ASHRAF, R. & SHAH, N. P. 2014. Immune system stimulation by probiotic microorganisms. Critical Reviews in Food Science and Nutrition, 54, 938-956. AXELSSON, L. 2004. Lactic Acid Bacteria: Classification and Physiology. In: SALMINEN, S. & WRIGHT, A. V. (eds.) Lactic Acid Bacteria: Microbiological and Functional Aspects. 3rd ed. New York: CRC Press, 1-66. AZCARATE-PERIL, M. A., ALTERMANN, E., HOOVER-FITZULA, R. L., CANO, R. J. & KLAENHAMMER, T. R. 2004. Identification and inactivation of genetic loci involved with Lactobacillus acidophilus acid tolerance. Applied and Environmental Microbiology, 70, 5315-5322. BEALES, N. 2004. Adaptation of microorganisms to cold temperatures, weak acid preservatives, low pH, and osmotic stress: a review. Comprehensive Reviews in Food Science and Food Safety, 3, 1-20.

40
BEKAL-SI ALI, S., DIVIÈS, C. & PRÉVOST, H. 1999. Genetic organization of the citCDEF locus and identification of mae and clyR genes from Leuconostoc mesenteroides. Journal of Bacteriology, 181, 4411-4416. BELLI, W. A. & MARQUIS, R. E. 1991. Adaptation of Streptococcus mutans and Enterococcus hirae to acid stress in continuous culture. Applied and Environmental Microbiology, 57, 1134-1138. BENDER, G. R., SUTTON, S. & MARQUIS, R. E. 1986. Acid tolerance, proton permeabilities, and membrane ATPases of oral streptococci. Infection and Immunity, 53, 331-338. BENEY, L. & GERVAIS, P. 2001. Influence of the fluidity of the membrane on the response of microorganisms to environmental stresses. Applied Microbiology and Biotechnology, 57, 34-42. BOHNHOFF, M., DRAKE, B. L. & MILLER, C. P. 1954. Effect of streptomycin on susceptibility of intestinal tract to experimental Salmonella infection. Proceedings of the Society for Experimental Biology and Medicine, 86, 132-137. BOTT, M. 1997. Anaerobic citrate metabolism and its regulation in enterobacteria. Archives of Microbiology, 167, 78-88. BROADBENT, J. R., LARSEN, R. L., DEIBEL, V. & STEELE, J. L. 2010. Physiological and transcriptional response of Lactobacillus casei ATCC 334 to acid stress. Journal of Bacteriology, 192, 2445-2458. BRON, P. A., TOMITA, S., VAN SWAM, I. I., REMUS, D. M., MEIJERINK, M., WELS, M., OKADA, S., WELLS, J. M. & KLEEREBEZEM, M. 2012. Lactobacillus plantarum possesses the capability for wall teichoic acid backbone alditol switching. Microbial Cell Factories, 11, 123. BROWN, S., SANTA MARIA JR, J. P. & WALKER, S. 2013. Wall teichoic acids of gram-positive bacteria. Annual Review of Microbiology, 67, 313-336. BUDIN‐VERNEUIL, A., PICHEREAU, V., AUFFRAY, Y., EHRLICH, D. S. & MAGUIN, E. 2005. Proteomic characterization of the acid tolerance response in Lactococcus lactis MG1363. Proteomics, 5, 4794-4807. CHAMPAGNE, C. P. & GARDNER, N. J. 2008. Effect of storage in a fruit drink on subsequent survival of probiotic lactobacilli to gastro-intestinal stresses. Food Research International, 41, 539-543. CHAMPAGNE, C. P., GARDNER, N. J. & ROY, D. 2005. Challenges in the addition of probiotic cultures to foods. Critical Reviews in Food Science and Nutrition, 45, 61-84. CHAPOT-CHARTIER, M. P. & KULAKAUSKAS, S. 2014. Cell wall structure and function in lactic acid bacteria. Microbial Cell Factories, 13 Suppl 1, 9.

41
CHARALAMPOPOULOS, D., PANDIELLA, S. S. & WEBB, C. 2003. Evaluation of the effect of malt, wheat and barley extracts on the viability of potentially probiotic lactic acid bacteria under acidic conditions. International Journal of Food Microbiology, 82, 133-141. CLAESSON, M. J., VAN SINDEREN, D. & O'TOOLE, P. W. 2008. Lactobacillus phylogenomics–towards a reclassification of the genus. International Journal of Systematic and Evolutionary Microbiology, 58, 2945-2954. COLLINS, F. M. & CARTER, P. B. 1978. Growth of salmonellae in orally infected germfree mice. Infection and Immunity, 21, 41-47. COLLINS, J. K., THORNTON, G. & SULLIVAN, G. O. 1998. Selection of probiotic strains for human applications. International Dairy Journal, 8, 487-490. CORCORAN, B. M., STANTON, C., FITZGERALD, G. F. & ROSS, R. P. 2005. Survival of probiotic lactobacilli in acidic environments is enhanced in the presence of metabolizable sugars. Applied and Environmental Microbiology, 71, 3060-3067. CORCORAN, B. M., STANTON, C., FITZGERALD, G. F. & ROSS, R. P. 2007. Growth of probiotic lactobacilli in the presence of oleic acid enhances subsequent survival in gastric juice. Microbiology, 153, 291-299. CORR, S. C., LI, Y., RIEDEL, C. U., O'TOOLE, P. W., HILL, C. & GAHAN, C. G. 2007. Bacteriocin production as a mechanism for the antiinfective activity of Lactobacillus salivarius UCC118. Proceedings of the National Academy of Sciences, 104, 7617-7621. COTTER, P. D., GAHAN, C. G. & HILL, C. 2000. Analysis of the role of the Listeria monocytogenes F0 F1-ATPase operon in the acid tolerance response. International Journal of Food Microbiology, 60, 137-146. DE ANGELIS, M., BINI, L., PALLINI, V., COCCONCELLI, P. S. & GOBBETTI, M. 2001. The acid-stress response in Lactobacillus sanfranciscensis CB1. Microbiology, 147, 1863-1873. DE ANGELIS, M. & GOBBETTI, M. 2004. Environmental stress responses in Lactobacillus: a review. Proteomics, 4, 106-122. DE ANGELIS, M., MARIOTTI, L., ROSSI, J., SERVILI, M., FOX, P. F., ROLLÁN, G. & GOBBETTI, M. 2002. Arginine catabolism by sourdough lactic acid bacteria: purification and characterization of the arginine deiminase pathway enzymes from Lactobacillus sanfranciscensis CB1. Applied and Environmental Microbiology, 68, 6193-6201. DE VRESE, M., STEGELMANN, A., RICHTER, B., FENSELAU, S., LAUE, C. & SCHREZENMEIR, J. 2001. Probiotics-compensation for lactase insufficiency. American Journal of Clinical Nutrition, 73, 421-429.

42
DE VRIES, M. C. 2006. Analyzing global gene expression of Lactobacillus plantarum in the human gastro-intestinal tract. PhD thesis, Wageningen University. DEV, S., MIZUGUCHI, H., DAS, A. K., MATSUSHITA, C., MAEYAMA, K., UMEHARA, H., OHTOSHI, T., KOJIMA, J., NISHIDA, K. & TAKAHASHI, K. 2008. Suppression of histamine signaling by probiotic Lac-B: a possible mechanism of its anti-allergic effect. Journal of Pharmacological Sciences, 107, 159-166. DHANANI, A. S., GAUDANA, S. B. & BAGCHI, T. 2011. The ability of Lactobacillus adhesin EF-Tu to interfere with pathogen adhesion. European Food Research and Technology, 232, 777-785. DING, W. K. & SHAH, N. P. 2008. Survival of free and microencapsulated probiotic bacteria in orange and apple juices. International Food Research Journal, 15, 219-232. DONG, H., ROWLAND, I. & YAQOOB, P. 2012. Comparative effects of six probiotic strains on immune function in vitro. British Journal of Nutrition, 108, 459-470. DUARY, R. K., BATISH, V. K. & GROVER, S. 2010. Expression of the atpD gene in probiotic Lactobacillus plantarum strains under in vitro acidic conditions using RT-qPCR. Research in Microbiology, 161, 399-405 FAO/WHO. 2002. Guidelines for the evaluation of probiotics in food: Report of a Joint FAO/WHO Working Group on Drafting Guidelines for the Evaluation of Probiotics in Food. Ontario, Canada FEEHILY, C. & KARATZAS, K. A. 2013. Role of glutamate metabolism in bacterial responses towards acid and other stresses. Journal of Applied Microbiology 114, 11-24. FEORD, J. 2002. Lactic acid bacteria in a changing legislative environment. Antonie van Leeuwenhoek, 82, 353-360. FERNANDEZ, A., OGAWA, J., PENAUD, S., BOUDEBBOUZE, S., EHRLICH, D., VAN DE GUCHTE, M. & MAGUIN, E. 2008. Rerouting of pyruvate metabolism during acid adaptation in Lactobacillus bulgaricus. Proteomics, 8, 3154-3163. FLORES, P., HELLÍN, P. & FENOLL, J. 2012. Determination of organic acids in fruits and vegetables by liquid chromatography with tandem-mass spectrometry. Food Chemistry, 132, 1049-1054. FOLIGNE, B., NUTTEN, S., GRANGETTE, C., DENNIN, V., GOUDERCOURT, D., POIRET, S., DEWULF, J., BRASSART, D., MERCENIER, A. & POT, B. 2007. Correlation between in vitro and in vivo immunomodulatory properties of lactic acid bacteria. World Journal of Gastroenterology, 13, 236-243. FOLIGNÉ, B., NUTTEN, S., STEIDLER, L., DENNIN, V., GOUDERCOURT, D., MERCENIER, A. & POT, B. 2006. Recommendations for improved use of the murine TNBS-induced colitis model in evaluating anti-inflammatory properties of lactic acid bacteria: technical and microbiological aspects. Digestive Diseases and Sciences, 51, 390-400.

43
FOZO, E. M. & QUIVEY JR, R. G. 2004. Shifts in the membrane fatty acid profile of Streptococcus mutans enhance survival in acidic environments. Applied and Environmental Microbiology, 70, 929-936. FRETER, R. 1955. The fatal enteric cholera infection in the guinea pig, achieved by inhibition of normal enteric flora. Journal of Infectious Diseases, 97, 57-65. FUKUSHIMA, Y., KAWATA, Y., HARA, H., TERADA, A. & MITSUOKA, T. 1998. Effect of a probiotic formula on intestinal immunoglobulin A production in healthy children. International Journal of Food Microbiology, 42, 39-44. FULLER, R. 1989. Probiotics in man and animals. Journal of Applied Bacteriology, 66, 365-378. GARCÍA-QUINTÁNS, N., MAGNI, C., DE MENDOZA, D. & LÓPEZ, P. 1998. The citrate transport system of Lactococcus lactis subsp. lactis biovar diacetylactis is induced by acid stress. Applied and Environmental Microbiology, 64, 850-857. GARRITY, G. M. & HOLT, J. G. 2001. The road map to the manual. In: GARRITY, G., BOONE, D. R. & CASTENHOLZ, R. W. (eds.) Bergey’s Manual of Systematic Bacteriology. New York: Springer, 119-166. GIAOURIS, E., BRIANDET, R., MEYRAND, M., COURTIN, P. & CHAPOT-CHARTIER, M. P. 2008. Variations in the degree of D-Alanylation of teichoic acids in Lactococcus lactis alter resistance to cationic antimicrobials but have no effect on bacterial surface hydrophobicity and charge. Applied and Environmental Microbiology, 74, 4764-4767. GOLDIN, B. R. & GORBACH, S. L. 1984. The effect of milk and lactobacillus feeding on human intestinal bacterial enzyme activity. American Journal of Clinical Nutrition, 39, 756-761. GRANATO, D., BRANCO, G. F., NAZZARO, F., CRUZ, A. G. & FARIA, J. A. F. 2010. Functional foods and nondairy probiotic food development: trends, concepts, and products. Comprehensive Reviews in Food Science and Food Safety, 9, 292-302. GRISWOLD, A. R., CHEN, Y. Y. M. & BURNE, R. A. 2004. Analysis of an agmatine deiminase gene cluster in Streptococcus mutans UA159. Journal of Bacteriology, 186, 1902-1904. GRISWOLD, A. R., NASCIMENTO, M. M. & BURNE, R. A. 2009. Distribution, regulation and role of the agmatine deiminase system in mutans streptococci. Oral Microbiology and Immunology, 24, 79-82. GUANDALINI, S. 2011. Probiotics for prevention and treatment of diarrhea. Journal of Clinical Gastroenterology, 45, 149-153. GUEIMONDE, M., DELGADO, S., MAYO, B., RUAS-MADIEDO, P., MARGOLLES, A. & DE LOS REYES-GAVILÁN, C. G. 2004. Viability and diversity

44
of probiotic Lactobacillus and Bifidobacterium populations included in commercial fermented milks. Food Research International, 37, 839-850. GUERZONI, M. E., LANCIOTTI, R. & COCCONCELLI, P. S. 2001. Alteration in cellular fatty acid composition as a response to salt, acid, oxidative and thermal stresses in Lactobacillus helveticus. Microbiology, 147, 2255-2264. GURR, M. 1987. Nutritional aspects of fermented milk products. FEMS Microbiology Reviews, 3, 337-342. HAMANN, W. T. & MARTH, E. H. 1984. Survival of Streptococcus thermophiles and Lactobacillus bulgaricus in commercial and experimental yogurts. Journal of Food Protection, 47, 781-786. HART, A., LAMMERS, K., BRIGIDI, P., VITALI, B., RIZZELLO, F., GIONCHETTI, P., CAMPIERI, M., KAMM, M., KNIGHT, S. & STAGG, A. 2004. Modulation of human dendritic cell phenotype and function by probiotic bacteria. Gut, 53, 1602-1609. HARTKE, A., BOUCHÉ, S., GIARD, J. C., BENACHOUR, A., BOUTIBONNES, P. & AUFFRAY, Y. 1996. The lactic acid stress response of Lactococcus lactis subsp. lactis. Current Microbiology, 33, 194-199. HAVENAAR, R. & HUIS IN’T VELD, J. J. 1992. Probiotics: a general view. In: WOOD, B. J. W. (ed.) The Lactic Acid Bacteria Volume 1:The Lactic Acid Bacteria in Health and Disease. London: Springer, 151-170. HELLER, K. J. 2001. Probiotic bacteria in fermented foods: product characteristics and starter organisms. American Journal of Clinical Nutrition, 73, 374-379. HEMARAJATA, P. & VERSALOVIC, J. 2012. Effects of probiotics on gut microbiota: mechanisms of intestinal immunomodulation and neuromodulation. Therapeutic Advances in Gastroenterology, 6, 39-51. HEVIA, A., MARTÍNEZ, N., LADERO, V., ÁLVAREZ, M. A., MARGOLLES, A. & SÁNCHEZ, B. 2013. An extracellular Serine/Threonine-rich protein from Lactobacillus plantarum NCIMB 8826 is a novel aggregation-promoting factor with affinity to mucin. Applied and Environmental Microbiology, 79, 6059-6066. HEYMAN, M. 2000. Effect of lactic acid bacteria on diarrheal diseases. Journal of the American College of Nutrition, 19, 137-146. HILL, C., GUARNER, F., REID, G., GIBSON, G. R., MERENSTEIN, D. J., POT, B., MORELLI, L., CANANI, R. B., FLINT, H. J., SALMINEN, S., CALDER, P. C. & SANDERS, M. E. 2014. Expert consensus document. The International Scientific Association for Probiotics and Prebiotics consensus statement on the scope and appropriate use of the term probiotic. Nature Reviews Gastroenterology & Hepatology, 11, 506-514.

45
HIRAYAMA, K. & RAFTER, J. 2000. The role of probiotic bacteria in cancer prevention. Microbes and Infection, 2, 681-686. HOLZAPFEL, W. H., HABERER, P., GEISEN, R., BJÖRKROTH, J. & SCHILLINGER, U. 2001. Taxonomy and important features of probiotic microorganisms in food and nutrition. American Journal of Clinical Nutrition, 73, 365-373. HUGENHOLTZ, J. 1993. Citrate metabolism in lactic acid bacteria. FEMS Microbiology Reviews, 12, 165-178. JONES, M. L., CHEN, H., OUYANG, W., METZ, T. & PRAKASH, S. 2004. Microencapsulated genetically engineered Lactobacillus plantarum 80 (pCBH1) for bile acid deconjugation and its implication in lowering cholesterol. Journal of Biomedicine and Biotechnology, 2004, 61-69. JORDAN, S., HUTCHINGS, M. I. & MASCHER, T. 2008. Cell envelope stress response in Gram-positive bacteria. FEMS Microbiology Reviews, 32, 107-146. KAMADA, N., MAEDA, K., INOUE, N., HISAMATSU, T., OKAMOTO, S., HONG, K. S., YAMADA, T., WATANABE, N., TSUCHIMOTO, K. & OGATA, H. 2008. Nonpathogenic Escherichia coli strain Nissle 1917 inhibits signal transduction in intestinal epithelial cells. Infection and Immunity, 76, 214-220. KARCZEWSKI, J., TROOST, F. J., KONINGS, I., DEKKER, J., KLEEREBEZEM, M., BRUMMER, R.-J. M. & WELLS, J. M. 2010. Regulation of human epithelial tight junction proteins by Lactobacillus plantarum in vivo and protective effects on the epithelial barrier. American Journal of Physiology-Gastrointestinal and Liver Physiology, 298, 851-859. KENNES, C., DUBOURGULER, H. C., ALBAGNAC, G. & NYNS, E. J. 1991. Citrate metabolism by Lactobacillus plantarum isolated from orange juice. Journal of Applied Bacteriology, 70, 380-384. KOBAYASHI, H., SUZUKI, T., KINOSHITA, N. & UNEMOTO, T. 1984. Amplification of the Streptococcus faecalis proton-translocating ATPase by a decrease in cytoplasmic pH. Journal of Bacteriology, 158, 1157-1160. KOBAYASHI, H., SUZUKI, T. & UNEMOTO, T. 1986. Streptococcal cytoplasmic pH is regulated by changes in amount and activity of a proton-translocating ATPase. Journal of Biological Chemistry, 261, 627-630. KOMATSUZAKI, N., SHIMA, J., KAWAMOTO, S., MOMOSE, H. & KIMURA, T. 2005. Production of gamma-aminobutyric acid (GABA) by Lactobacillus paracasei isolated from traditional fermented foods. Food Microbiology, 22, 497-504. KONDO, J. K. & JOHANSEN, E. 2002. Product development strategies for foods in the era of molecular biotechnology. Antonie van Leeuwenhoek, 82, 291-302.

46
KOPONEN, J., LAAKSO, K., KOSKENNIEMI, K., KANKAINEN, M., SAVIJOKI, K., NYMAN, T. A., DE VOS, W. M., TYNKKYNEN, S., KALKKINEN, N. & VARMANEN, P. 2012. Effect of acid stress on protein expression and phosphorylation in Lactobacillus rhamnosus GG. Journal of Proteomics, 75, 1357-1374. KULLEN, M. J. & KLAENHAMMER, T. R. 1999. Identification of the pH-inducible, proton-translocating F1F0-ATPase (atpBEFHAGDC) operon of Lactobacillus acidophilus by differential display: gene structure, cloning and characterization. Molecular Microbiology, 33, 1152-1161. LEMOS, J. A. C., ABRANCHES, J. & BURNE, R. A. 2005. Responses of cariogenic streptococci to environmental stresses. Current Issues in Molecular Biology, 7, 95-108. LILLY, D. M. & STILLWELL, R. H. 1965. Probiotics: growth-promoting factors produced by microorganism. Science, 147, 747-748. LIONG, M. T. & SHAH, N. P. 2005. Acid and bile tolerance and cholesterol removal ability of lactobacilli strains. Journal of Dairy Science, 88, 55-66. LORCA, G. & DE VALDEZ, G. F. 2001. A low-pH-inducible, stationary-phase acid tolerance response in Lactobacillus acidophilus CRL 639. Current Microbiology, 42, 21-25. LORCA, G. L. & DE VALDEZ, G. F. 2009. Lactobacillus Stress Responses. In: LJUNGH, Å. & TORKEL, W. (eds.) Lactobacillus Molecular Biology: From Genomics to Probiotics. United Kingdom: Calister Academic Press, 115-137. LUCAS, P. M., BLANCATO, V. S., CLAISSE, O., MAGNI, C., LOLKEMA, J. S. & LONVAUD-FUNEL, A. 2007. Agmatine deiminase pathway genes in Lactobacillus brevis are linked to the tyrosine decarboxylation operon in a putative acid resistance locus. Microbiology, 153, 2221-2230. LUCKOW, T. & DELAHUNTY, C. 2004. Which juice is ‘healthier’? A consumer study of probiotic non-dairy juice drinks. Food Quality and Preference, 15, 751-759. LYE, H. S., RAHMAT-ALI, G. R. & LIONG, M. T. 2010. Mechanisms of cholesterol removal by lactobacilli under conditions that mimic the human gastrointestinal tract. International Dairy Journal, 20, 169-175. MACK, D. R., MICHAIL, S., WEI, S., MCDOUGALL, L. & HOLLINGSWORTH, M. A. 1999. Probiotics inhibit enteropathogenic Esherichia coli adherence in vitro by inducing intestinal mucin gene expression. American Journal of Physiology-Gastrointestinal and Liver Physiology, 276, 941-950. MAJAMAA, H., ISOLAURI, E., SAXELIN, M. & VESIKARI, T. 1995. Lactic acid bacteria in the treatment of acute rotavirus gastroenteritis. Journal of Pediatric Gastroenterology and Nutrition, 20, 333-338. MALAGUARNERA, G., LEGGIO, F., VACANTE, M., MOTTA, M., GIORDANO, M., BIONDI, A., BASILE, F., MASTROJENI, S., MISTRETTA, A. &

47
MALAGUARNERA, M. 2012. Probiotics in the gastrointestinal diseases of the elderly. Journal of Nutrition, Health & Aging, 16, 402-410. MARCO, M. L., PAVAN, S. & KLEEREBEZEM, M. 2006. Towards understanding molecular modes of probiotic action. Current Opinion in Biotechnology, 17, 204-210. MARTı́N, M., CORRALES, M. A., MENDOZA, D., LÓPEZ, P. & MAGNI, C. 1999. Cloning and molecular characterization of the citrate utilization citMCDEFGRP cluster of Leuconostoc paramesenteroides. FEMS Microbiology Letters, 174, 231-238. MARTÍN, M., MAGNI, C., LÓPEZ, P. & DE MENDOZA, D. 2000. Transcriptional control of the citrate-inducible citMCDEFGRP operon, encoding genes involved in citrate fermentation in Leuconostoc paramesenteroides. Journal of Bacteriology, 182, 3904-3912. MARTÍN, M. G., SENDER, P. D., PEIRÚ, S., DE MENDOZA, D. & MAGNI, C. 2004. Acid-inducible transcription of the operon encoding the citrate lyase complex of Lactococcus lactis biovar diacetylactis CRL264. Journal of Bacteriology, 186, 5649-5660. METCHNIKOFF, E. 1907. The prolongation of life: Optimistic studies London William Heinemann MIWA, T., ESAKI, H., UMEMORI, J. & HINO, T. 1997. Activity of H (+)-ATPase in ruminal bacteria with special reference to acid tolerance. Applied and Environmental Microbiology, 63, 2155-2158. MONTANARI, C., SADO KAMDEM, S. L., SERRAZANETTI, D. I., ETOA, F. X. & GUERZONI, M. E. 2010. Synthesis of cyclopropane fatty acids in Lactobacillus helveticus and Lactobacillus sanfranciscensis and their cellular fatty acids changes following short term acid and cold stresses. Food Microbiology, 27, 493-502. MOUSAVI, Z., MOUSAVI, S., RAZAVI, S., EMAM-DJOMEH, Z. & KIANI, H. 2011. Fermentation of pomegranate juice by probiotic lactic acid bacteria. World Journal of Microbiology and Biotechnology, 27, 123-128. NANNEN, N. L. & HUTKINS, R. W. 1991. Proton-translocating adenosine triphosphatase activity in lactic acid bacterial. Journal of Dairy Science, 74, 747-751. NEUHAUS, F. C. & BADDILEY, J. 2003. A continuum of anionic charge: structures and functions of D-alanyl-teichoic acids in Gram-positive bacteria. Microbiology and Molecular Biology Reviews, 67, 686-723. NISSLE, A. 1916. Ueber die Grundlagen einer neuen ursaechlichen Bekaempfung der pathologischen Darmflora. (Fundamentals of a new causal control of the pathologic intestinal flora.) Deutsche Medizinische Wochenschrift, 42, 1181–1184.

48
NUALKAEKUL, S. & CHARALAMPOPOULOS, D. 2011. Survival of Lactobacillus plantarum in model solutions and fruit juices. International Journal of Food Microbiology, 146, 111-117. NUALKAEKUL, S., LENTON, D., COOK, M. T., KHUTORYANSKIY, V. V. & CHARALAMPOPOULOS, D. 2012. Chitosan coated alginate beads for the survival of microencapsulated Lactobacillus plantarum in pomegranate juice. Carbohydrate Polymers, 90, 1281-1287. OGAWA, M., SHIMIZU, K., NOMOTO, K., TANAKA, R., HAMABATA, T., YAMASAKI, S., TAKEDA, T. & TAKEDA, Y. 2001. Inhibition of in vitro growth of Shiga toxin-producing Escherichia coli O157: H7 by probiotic Lactobacillus strains due to production of lactic acid. International Journal of Food Microbiology, 68, 135-140. OOI, L. G. & LIONG, M. T. 2010. Cholesterol-lowering effects of probiotics and prebiotics: a review of in vivo and in vitro findings. International Journal of Molecular Sciences, 11, 2499-2522. PARENTE, E., CIOCIA, F., RICCIARDI, A., ZOTTA, T., FELIS, G. E. & TORRIANI, S. 2010. Diversity of stress tolerance in Lactobacillus plantarum, Lactobacillus pentosus and Lactobacillus paraplantarum: A multivariate screening study. International Journal of Food Microbiology, 144, 270-279. PARKER, R. 1974. Probiotics, the other half of the antibiotic story. Animal Nutrition Health, 29. PAVAN, S., DESREUMAUX, P. & MERCENIER, A. 2003. Use of mouse models to evaluate the persistence, safety, and immune modulation capacities of lactic acid bacteria. Clinical and Diagnostic Laboratory Immunology, 10, 696-701. PEREIRA, A. L. F., MACIEL, T. C. & RODRIGUES, S. 2011. Probiotic beverage from cashew apple juice fermented with Lactobacillus casei. Food Research International, 44, 1276-1283. PIETERSE, B., LEER, R. J., SCHUREN, F. H. & VAN DER WERF, M. J. 2005. Unravelling the multiple effects of lactic acid stress on Lactobacillus plantarum by transcription profiling. Microbiology, 151, 3881-3894. POCHARD, P., HAMMAD, H., RATAJCZAK, C., CHARBONNIER-HATZFELD, A. S., JUST, N., TONNEL, A. B. & PESTEL, J. 2005. Direct regulatory immune activity of lactic acid bacteria on Der p 1-pulsed dendritic cells from allergic patients. Journal of Allergy and Clinical Immunology, 116, 198-204. POOL ZOBEL, B. L., NEUDECKER, C., DOMIZLAFF, I., JI, S., SCHILLINGER, U., RUMNEY, C., MORETT, M., VILARINI, I., SCASSELLATI-SFORZOLINI, R. & ROWLAND, I. 1996. Lactobacillus-and bifidobacterium-mediated antigenotoxicity in the colon of rats. Nutrition and Cancer, 26, 365-380.

49
POOLMAN, B., DRIESSEN, A. J. & KONINGS, W. N. 1987. Regulation of arginine-ornithine exchange and the arginine deiminase pathway in Streptococcus lactis. Journal of Bacteriology, 169, 5597-5604. POOLMAN, B., MOLENAAR, D., SMID, E. J., UBBINK, T., ABEE, T., RENAULT, P. P. & KONINGS, W. N. 1991. Malolactic fermentation: electrogenic malate uptake and malate/lactate antiport generate metabolic energy. Journal of Bacteriology, 173, 6030-6037. PRADO, F. C., PARADA, J. L., PANDEY, A. & SOCCOL, C. R. 2008. Trends in non-dairy probiotic beverages. Food Research International, 41, 111-123. PUDLIK, A. M. & LOLKEMA, J. S. 2011a. Citrate uptake in exchange with intermediates in the citrate metabolic pathway in Lactococcus lactis IL1403. Journal of Bacteriology, 193, 706-714. PUDLIK, A. M. & LOLKEMA, J. S. 2011b. Mechanism of citrate metabolism by an oxaloacetate decarboxylase-deficient mutant of Lactococcus lactis IL1403. Journal of Bacteriology, 193, 4049-4056. PUUPPONEN-PIMIÄ, R., NOHYNEK, L., MEIER, C., KÄHKÖNEN, M., HEINONEN, M., HOPIA, A. & OKSMAN-CALDENTEY, K. M. 2001. Antimicrobial properties of phenolic compounds from berries. Journal of Applied Microbiology, 90, 494-507. RALLU, F., GRUSS, A. & MAGUIN, E. 1996. Lactococcus lactis and stress. Antonie van Leeuwenhoek, 70, 243-251. RIVERA-ESPINOZA, Y. & GALLARDO-NAVARRO, Y. 2010. Non-dairy probiotic products. Food Microbiology, 27, 1-11. ROGERS, N. J. & MOUSA, S. A. 2012. The shortcomings of clinical trials assessing the efficacy of probiotics in irritable bowel syndrome. Journal of Alternative and Complementary Medicine, 18, 112-119. ROLLAN, G., LORCA, G. L. & DE VALDEZ, G. F. 2003. Arginine catabolism and acid tolerance response in Lactobacillus reuteri isolated from sourdough. Food Microbiology, 20, 313-319. SAARELA, M., ALAKOMI, H. L., MÄTTÖ, J., AHONEN, A. M. & TYNKKYNEN, S. 2011. Acid tolerant mutants of Bifidobacterium animalis subsp. lactis with improved stability in fruit juice. LWT-Food Science and Technology, 44, 1012-1018. SAARELA, M., RANTALA, M., HALLAMAA, K., NOHYNEK, L., VIRKAJÄRVI, I. & MÄTTÖ, J. 2004. Stationary-phase acid and heat treatments for improvement of the viability of probiotic lactobacilli and bifidobacteria. Journal of Applied Microbiology, 96, 1205-1214.

50
SALMINEN, S. 1996. Uniqueness of probiotic strains. International Dairy Federation Nutrition Newsletter, 5, 16-18. SALMINEN, S. & PLAYNE, N. 2001. Probiotics. The world of food ingredients, January, 33-35. SÁNCHEZ, B., SCHMITTER, J.-M. & URDACI, M. C. 2009. Identification of novel proteins secreted by Lactobacillus plantarum that bind to mucin and fibronectin. Journal of Molecular Microbiology and Biotechnology, 17, 158-162. SANDERS, J. W., LEENHOUTS, K., BURGHOORN, J., BRANDS, J. R., VENEMA, G. & KOK, J. 1998. A chloride-inducible acid resistance mechanism in Lactococcus lactis and its regulation. Molecular Microbiology, 27, 299-310. SAVILAHTI, E., KUITUNEN, M. & VAARALA, O. 2008. Pre and probiotics in the prevention and treatment of food allergy. Current Opinion in Allergy and Clinical Immunology, 8, 243-248. SCHAAFSMA, G. 1996. State of the art concerning probiotic strains in milk products. International Dairy Federation Nutrition Newsletter, 5, 23-24. SCHIFFER, C., LALANNE, A. I., CASSARD, L., MANCARDI, D. A., MALBEC, O., BRUHNS, P., DIF, F. & DAËRON, M. 2011. A strain of Lactobacillus casei inhibits the effector phase of immune inflammation. Journal of Immunology, 187, 2646-2655. SCHREZENMEIR, J. & DE VRESE, M. 2001. Probiotics, prebiotics, and synbiotics-approaching a definition. American Journal of Clinical Nutrition, 73, 361-364. SEME, H., GJURACIC, K., KOS, B., FUJS, S., STEMPELJ, M., PETKOVIC, H., SUSKOVIC, J., BOGOVIC MATIJASIC, B. & KOSEC, G. 2015. Acid resistance and response to pH-induced stress in two Lactobacillus plantarum strains with probiotic potential. Beneficial Microbes, 6, 369-379. SHAH, N. P. 2000. Probiotic bacteria: Selective enumeration and survival in dairy foods. Journal of Dairy Science, 83, 894-907. SHAH, N. P. 2007. Functional cultures and health benefits. International Dairy Journal, 17, 1262-1277. SHEEHAN, V. M., ROSS, P. & FITZGERALD, G. F. 2007a. Assessing the acid tolerance and the technological robustness of probiotic cultures for fortification in fruit juices. Innovative Food Science & Emerging Technologies, 8, 279-284. SHEEHAN, V. M., SLEATOR, R. D., HILL, C. & FITZGERALD, G. F. 2007b. Improving gastric transit, gastrointestinal persistence and therapeutic efficacy of the probiotic strain Bifidobacterium breve UCC2003. Microbiology, 153, 3563-3571. SHENG, J. & MARQUIS, R. E. 2007. Malolactic fermentation by Streptococcus mutans. FEMS Microbiology Letters, 272, 196-201.

51
SHIDA, K., TAKAHASHI, R., IWADATE, E., TAKAMIZAWA, K., YASUI, H., SATO, T., HABU, S., HACHIMURA, S. & KAMINOGAWA, S. 2002. Lactobacillus casei strain Shirota suppresses serum immunoglobulin E and immunoglobulin G1 responses and systemic anaphylaxis in a food allergy model. Clinical & Experimental Allergy, 32, 563-570. SLEATOR, R. D., FRANCIS, G. A., O'BEIRNE, D., GAHAN, C. G. M. & HILL, C. 2003. Betaine and carnitine uptake systems in Listeria monocytogenes affect growth and survival in foods and during infection. Journal of Applied Microbiology, 95, 839-846. SMIDDY, M., SLEATOR, R. D., PATTERSON, M. F., HILL, C. & KELLY, A. L. 2004. Role for compatible solutes glycine betaine and L-carnitine in listerial barotolerance. Applied and Environmental Microbiology, 70, 7555-7557. SPANO, G. & MASSA, S. 2006. Environmental stress response in wine lactic acid bacteria: beyond Bacillus subtilis. Critical Reviews in Microbiology, 32, 77-86. STREIT, F., DELETTRE, J., CORRIEU, G. & BEAL, C. 2008. Acid adaptation of Lactobacillus delbrueckii subsp. bulgaricus induces physiological responses at membrane and cytosolic levels that improves cryotolerance. Journal of Applied Microbiology, 105, 1071-1080. SU, M. S., SCHLICHT, S. & GANZLE, M. G. 2011. Contribution of glutamate decarboxylase in Lactobacillus reuteri to acid resistance and persistence in sourdough fermentation. Microbial Cell Factories, 10 Suppl 1, 8. SWOBODA, J. G., CAMPBELL, J., MEREDITH, T. C. & WALKER, S. 2010. Wall teichoic acid function, biosynthesis, and inhibition. ChemBioChem, 11, 35-45. SYBESMA, W., HUGENHOLTZ, J., DE VOS, W. M. & SMID, E. J. 2006. Safe use of genetically modified lactic acid bacteria in food: Bridging the gap between consumers, green groups, and industry. Electronic Journal of Biotechnology, 9, 1-25. TAKEDA, K., SUZUKI, T., SHIMADA, S. I., SHIDA, K., NANNO, M. & OKUMURA, K. 2006. Interleukin-12 is involved in the enhancement of human natural killer cell activity by Lactobacillus casei Shirota. Clinical & Experimental Immunology, 146, 109-115. TEUSINK, B., VAN ENCKEVORT, F. H., FRANCKE, C., WIERSMA, A., WEGKAMP, A., SMID, E. J. & SIEZEN, R. J. 2005. In silico reconstruction of the metabolic pathways of Lactobacillus plantarum: comparing predictions of nutrient requirements with those from growth experiments. Applied and Environmental Microbiology, 71, 7253-7262. TEZCAN, F., GÜLTEKIN-ÖZGÜVEN, M., DIKEN, T., ÖZÇELIK, B. & ERIM, F. B. 2009. Antioxidant activity and total phenolic, organic acid and sugar content in commercial pomegranate juices. Food Chemistry, 115, 873-877.

52
TISSIER, H. 1906. Traitement des infections intestinales par la méthode de la flore bactérienne de l’intestin. Comptes Rendus des Séances et Mémoires de la Société de Biologie, 60, 359-361. TIYANONT, K., DOAN, T., LAZARUS, M. B., FANG, X., RUDNER, D. Z. & WALKER, S. 2006. Imaging peptidoglycan biosynthesis in Bacillus subtilis with fluorescent antibiotics. Proceedings of the National Academy of Sciences, 103, 11033-11038. TOMITA, S., FURIHATA, K., TANAKA, N., SATOH, E., NUKADA, T. & OKADA, S. 2012. Determination of strain-specific wall teichoic acid structures in Lactobacillus plantarum reveals diverse α-d-glucosyl substitutions and high structural uniformity of the repeating units. Microbiology, 158, 2712-2723. TSAI, T.-Y., CHU, L.-H., LEE, C.-L. & PAN, T.-M. 2009. Atherosclerosis-preventing activity of lactic acid bacteria-fermented milk−soymilk supplemented with Momordica charantia. Journal of Agricultural and Food Chemistry, 57, 2065-2071. TSAKALIDOU, E. & PAPADIMITRIOU, K. 2011. Stress responses of lactic acid bacteria, New York, Springer. TUOHY, K. M., PROBERT, H. M., SMEJKAL, C. W. & GIBSON, G. R. 2003. Using probiotics and prebiotics to improve gut health. Drug Discovery Today, 8, 692-700. VAN DE GUCHTE, M., SERROR, P., CHERVAUX, C., SMOKVINA, T., EHRLICH, S. D. & MAGUIN, E. 2002. Stress responses in lactic acid bacteria. Antonie van Leeuwenhoek, 82, 187-216. VANBOGELEN, R. A., GREIS, K. D., BLUMENTHAL, R. M., TANI, T. H. & MATTHEWS, R. G. 1999. Mapping regulatory networks in microbial cells. Trends in Microbiology, 7, 320-328. VANDAMME, P., POT, B., GILLIS, M., DE VOS, P., KERSTERS, K. & SWINGS, J. 1996. Polyphasic taxonomy, a consensus approach to bacterial systematics. Microbiological Reviews, 60, 407-438. VENTURA, M., CANCHAYA, C., VAN SINDEREN, D., FITZGERALD, G. F. & ZINK, R. 2004. Bifidobacterium lactis DSM 10140: identification of the atp (atpBEFHAGDC) operon and analysis of its genetic structure, characteristics, and phylogeny. Applied and Environmental Microbiology, 70, 3110-3121. VERSALOVIC, J. & WILSON, M. 2008. Therapeutic microbiology: probiotics and related strategies, Washington DC, American Society for Microbiology Press. VINDEROLA, C. G., BAILO, N. & REINHEIMER, J. A. 2000. Survival of probiotic microflora in Argentinian yoghurts during refrigerated storage. Food Research International, 33, 97-102.

53
WALKER, J. E., SARASTE, M. & GAY, N. J. 1984. The unc operon. Nucleotide sequence, regulation and structure of ATP-synthase. Biochimica et Biophysica Acta: Protein Structure and Molecular Enzymology, 768, 164-200. WATSON, D., SLEATOR, R. D., HILL, C. & GAHAN, C. G. M. 2008. Enhancing bile tolerance improves survival and persistence of Bifidobacterium and Lactococcus in the murine gastrointestinal tract. BMC Microbiology, 8, 1-10. WEIDENMAIER, C. & PESCHEL, A. 2008. Teichoic acids and related cell-wall glycopolymers in Gram-positive physiology and host interactions. Nature Reviews Microbiology, 6, 276-287. WU, C., ZHANG, J., CHEN, W., WANG, M., DU, G. & CHEN, J. 2012a. A combined physiological and proteomic approach to reveal lactic-acid-induced alterations in Lactobacillus casei Zhang and its mutant with enhanced lactic acid tolerance. Applied Microbiology and Biotechnology, 93, 707-722. WU, C., ZHANG, J., WANG, M., DU, G. & CHEN, J. 2012b. Lactobacillus casei combats acid stress by maintaining cell membrane functionality. Journal of Industrial Microbiology and Biotechnology, 39, 1031-1039. YAN, F. & POLK, D. B. 2002. Probiotic bacterium prevents cytokine-induced apoptosis in intestinal epithelial cells. Journal of Biological Chemistry, 277, 50959-50965. YOKOTA, A., AMACHI, S., ISHII, S. & TOMITA, F. 1995. Acid sensitivity of a mutant of Lactococcus lactis subsp. lactis C2 with reduced membrane-bound ATPase activity. Bioscience, Biotechnology, and Biochemistry, 59, 2004-2007. YOON, K. Y., WOODAMS, E. E. & HANG, Y. D. 2005. Fermentation of beet juice by beneficial lactic acid bacteria. LWT-Food Science and Technology, 38, 73-75. ZHAI, Z., DOUILLARD, F. P., AN, H., WANG, G., GUO, X., LUO, Y. & HAO, Y. 2014. Proteomic characterization of the acid tolerance response in Lactobacillus delbrueckii subsp. bulgaricus CAUH1 and functional identification of a novel acid stress-related transcriptional regulator Ldb0677. Environmental Microbiology, 16, 1524-1537. ZHANG, J., WU, C., DU, G. & CHEN, J. 2012. Enhanced acid tolerance in Lactobacillus casei by adaptive evolution and compared stress response during acid stress. Biotechnology and Bioprocess Engineering, 17, 283-289. ZHANG, Y.-M. & ROCK, C. O. 2008. Membrane lipid homeostasis in bacteria. Nature Reviews Microbiology, 6, 222-233. ZHUANG, G., LIU, X.-M., ZHANG, Q.-X., TIAN, F.-W., ZHANG, H., ZHANG, H.-P. & CHEN, W. 2012. Research advances with regards to clinical outcome and potential mechanisms of the cholesterol-lowering effects of probiotics. Clinical Lipidology, 7, 501-507.

54
ZUCCOTTI, G. V., MENEGHIN, F., RAIMONDI, C., DILILLO, D., AGOSTONI, C., RIVA, E. & IOVANNINI, M. 2008. Probiotics in clinical practice: an overview. Journal of International Medical Research, 36, 1-53. ZUNIGA, M., CHAMPOMIER-VERGES, M., ZAGOREC, M. & PÉREZ-MARTÍNEZ, G. 1998. Structural and functional analysis of the gene cluster encoding the enzymes of the arginine deiminase pathway of Lactobacillus sake. Journal of Bacteriology, 180, 4154-4159.
55
CHAPTER 2
The effect of citric acid adaptation on the subsequent survival
of L. plantarum NCIMB 8826 in fruit juices during
refrigerated storage
2.1. Introduction
The development of new products is an essential part of a successful business
strategy to ensure that business is productive and competitive within the global market.
In this respect, the development of non-dairy products, such as fermented meats, cereal-
based beverages and fruit juices containing probiotics is a challenging task with high
potential for commercialization by the food industry (Luckow and Delahunty, 2004,
Champagne et al., 2005). Fruit juices are suitable vehicles for the delivery of probiotics
as they contain high amounts of sugar, minerals and vitamins which could be used as
energy and nutrition sources for the survival of probiotics during storage (Ding and
Shah, 2008). Moreover, they not only are consumed frequently and loyally by
consumers but also are an alternative choice for lactose intolerant individuals who are
looking for non-dairy functional products to include in their daily diet (Prado et al.,
2008).
The survival of probiotics within any carrier food matrix is a major issue for new
product development, as a large number of cells die during processing and storage and
also during passage through the GIT following ingestion (Vinderola et al., 2000, Shah,
2000, Gueimonde et al., 2004). In the case of fruit juices, their low pH (ranging
between 2.5 and 3.8) has an adverse effect on bacterial survival (Champagne et al.,
2005, Sheehan et al., 2007). In order to convey their health benefits, the minimal dose
required for efficacy is suggested to be over 107 CFU/g or ml of product (Corcoran et

56
al., 2007). However, the cell concentration might vary between different probiotic
products (e.g. 109 CFU/serving is recommended by FAO/WHO; Hill et al., 2014) as the
beneficial effects of probiotics are influenced by various factors, including the intrinsic
properties of the strain used, the type of product and storage conditions, as well as the
target site in the GIT. Therefore, the minimal dose required for a probiotic product to
exert a beneficial health effect needs to be established ideally by clinical trials before
making a potential claim. To meet the minimal dose requirements for probiotic
applications, many approaches have been used to ensure probiotic survival during food
production, storage, and in the GIT, including selecting suitable food systems (Corcoran
et al., 2005), microencapsulation (Nualkaekul et al., 2012), and stress adaptation
(Saarela et al., 2011). Among these, the ability of bacterial cells to adapt to
unfavourable environments through the induction of various stress responses prior to
their incorporation into the food matrix seems to be a promising approach, as it would
require less process alterations, capital investment and product re-design compared to
other approaches, such as encapsulation.
For many LAB species a short acid adaptation period, before transferring them
to harsh acidic environments often results in cells which are able to survive longer
compared to those with non-adapted cells. This strategy allows the cells to activate their
defence mechanisms for protecting themselves before passing through adverse
conditions. Such mechanisms include the upregulation of stress response proteins,
particularly chaperone proteins which play an important role in protein homeostasis
(Hartke et al., 1996, Lim et al., 2000, Wu et al., 2014) and the reduction of membrane
fluidity through the alteration of cell membrane fatty acids which can protect against the
influx (Montanari et al., 2010, Wu et al., 2012). As a result, acid adaptation has been
used to improve cell survival of LAB in acidic conditions in many studies. For instance,

57
exposure of L. acidophilus cells for 15 to 60 min in MRS acidified to different pH
values (pH 3.8 to 6.0) resulted in an increase in their acid tolerance during subsequent
incubation in MRS at pH 3 (Lorca et al., 1998). Similarly, 16 h exposure of
Bifidobacterium longum in MRS supplemented with 0.05% L-cysteine, acidified at pH
4 and 5 resulted in more resistant cells which survived well in artificial gastric solution
(pH 2) (Sanchez et al., 2007). Exposure of L. casei to MRS at pH 4.5 for 1 h was able to
enhance its survival in acidified MRS at pH 3.5 compared to 1 h exposure in MRS at
pH 5 and 6 (Wu et al., 2014). Moreover, 30 min exposure of L. plantarum in acidified
MRS (pH 4.5 and 5.0 using HCl), extensively increased its tolerance in acidified MRS
(pH 2) for up to 90 min compared to the control, (30 min in MRS at pH 7) (Seme et al.,
2015). Based on this concept, exposure of probiotic cells to acid prior to their
incorporation into fruit juices seems to be a promising approach for reducing cell injury
and loss of viability during storage in juices, caused by the high acidity of the juices.
Although this has been shown previously by Saarela et al. (2011) with Bifidobacterium
animalis subsp. lactis, the improvement in cell viability obtained in their study was not
enough for the method to be translated into a commercial application. In order to
develop a suitable acid adaptation method, a number of factors should be investigated
including the physiological state of the cells at the time of exposure to the acid
solutions, the types of acid used, the time of exposure, and the intrinsic properties of the
probiotic strains.
It is well known that stationary phase cells are more robust to various types of
stresses than exponential phase cells (Lee et al., 1994, Storz and Hengge, 2011),
because bacterial cells enter the stationary phase of growth when the environment is not
appropriate for them to grow; due to the depletion of nutrients and/or the accumulation
of waste products. In order to survive in such conditions, the cells need to change their

58
physiology and morphology (e.g. upregulation of genes) enabling them to rapidly adapt
to those stresses (Bačun-Družina et al., 2011). Consequently, only cells which can adapt
remain viable during a prolonged stationary phase. This means that the viable cells
obtained from this stage of cell growth should be more robust toward stresses than those
derived from exponential phase which have not been exposed to considerable stresses.
For these reasons, studies on the long-term survival of cells in acidic food formulations
(e.g. acidified milks, juices) often employ stationary phase cells. For example, treatment
of stationary phase Lactobacillus cells with acid has been shown to increase the
tolerance of the cells to low pH during subsequent storage in acidic solutions and media
(Bâati et al., 2000, Lorca and de Valdez, 2001, Saarela et al., 2004, Seme et al., 2015).
Regarding the acid type, many studies have been conducted using different acids for
bacterial adaptation, including lactic acid (Lorca and de Valdez, 2001), HCl (Rallu et
al., 1996) and malic acid (Saarela et al., 2011), but none have compared the degree of
acid tolerance caused by the different types of acid. Using different types of acid for cell
adaptation could lead to different levels of acid adaptation and therefore cell survival.
Moreover, Beales (2004) suggested the occurrence of synergistic effects between pH
and the undissociated form of a weak acid on cell survival, leading to increased acid
tolerance than when using a strong acid. Interestingly, the study of García-Quintáns et
al. (1998) highlighted the positive effect of citrate adaptation in improving the acid
tolerance of Lactococcus lactis grown in M17 medium with no pH control. This finding
relates to the results by Nualkaekul and Charalampopoulos (2011) and Mousavi et al.
(2011) who suggested that the high concentration of citric acid in fruit juices improved
the survival of L. plantarum during refrigerated storage. However, the exact role of
citric acid adaptation in the survival of LAB during storage is not understood.

59
Following on from their work, in this study citric acid was one of the acids used to
adapt stationary phase L. plantarum cells in order to elucidate its mode of action.
Besides acid exposure, cold adaptation has also been suggested as a suitable
strategy for enhancing the shelf life of probiotics during refrigerated storage (Panoff et
al., 1994, Kim and Dunn, 1997). Some reports have demonstrated that an acid
adaptation can also improve the cryotolerance of L. reuteri (Palmfeldt and Hahn-
Hägerdal, 2000), L. acidophilus (Wang et al., 2005) and L. delbrueckii (Streit et al.,
2008). From these studies, it seems likely that there is a link between acid and cold
adaptation. To this end, combinations of acid and cold adaptation were investigated in
this study as the means for enhancing cell survival during subsequent storage in fruit
juices at 4 °C.
Various studies have been conducted to identify the potential use of fruit juices as
carrier food vehicles for probiotics, including orange, apple, kiwi, pineapple, peach,
cranberry, pomegranate and strawberry juices (Vinderola et al., 2002, Sheehan et al.,
2007, Mousavi et al., 2011). Some fruit juices displayed very low cell viability during
refrigerated storage, particularly cranberry juice (no viable cells after 1 week of
refrigerated storage) most likely due to its low pH (~2.5) and high phenolic compound
content (Sheehan et al., 2007, Nualkaekul and Charalampopoulos, 2011).
L. plantarum NCIMB 8826 has been selected for this thesis as it meets several
criteria proposed in the FAO/WHO guidelines (2002) for the evaluation of probiotics in
foods and it is one of the core groups of well-studied probiotic species that can claim
the general beneficial effects on gut physiology and health at species level without
conducting clinical trials (Hill et al., 2014). More specifically, this strain has been
isolated from human saliva (Hols et al., 1997), has a good safety record (De Vries,
2006), has been shown to survive well in model gastric solutions at pH < 3

60
(Charalampopoulos et al., 2003, Parente et al., 2010) and in conditions of the upper
human digestive tract (mouth to ileum) (Vesa et al., 2000), and has been shown to exert
immune (Pochard et al., 2005) as well as anti-inflammatory activities in vitro (Foligne
et al., 2007) and in animal studies (Foligné et al., 2006). Moreover, it has been shown
that it can decrease the epithelial barrier dysfunction in human subjects (Karczewski et
al., 2010).
2.2. Materials and methods
2.2.1. Bacterial strain
L. plantarum NCIMB 8826 (National Collection of Industrial and Marine
Bacteria, UK) was used throughout this study. The stock culture was stored at -80 °C in
MRS (Oxoid, UK) containing 10% (v/v) glycerol (Sigma-Aldrich, UK).
2.2.2. Fruit juices
Three commercial fruit juices, namely cranberry (OceansprayTM), pomegranate
(PureplusTM) and lemon & lime (This water®), available on the UK market, were used
in this study. The cranberry juice consisted of water (83%), cranberry juice from
concentrate (27%), sugar (11 g/100 ml), and vitamin C (32 mg/100 ml). The
pomegranate juice consisted of water (68%), pomegranate juice from concentrate
(32%), sugar (11.7 g/100 ml), protein (0.2 g/100 ml) and fat (0.2 g/100 ml). The lemon
& lime juice consisted of fresh lemon and lime juice (100%). All fruit juices used in this
experiment had no preservatives or additives.
2.2.3. Growth of L. plantarum NCIMB 8826
Initially, the growth of L. plantarum NCIMB 8826 was monitored every 3 h in
MRS broth incubated at 37 °C for 30 h in order to identify the early stationary phase of

61
the cell growth and thus the optimum harvest time for the cell adaptation experiments.
To prepare the inoculum, a two-step propagation procedure was used; the cells were
thawed from a cryovial and transferred onto MRS agar by streak plating. After
incubation (3 days, 37 °C), a single colony was inoculated into 25 ml of MRS broth and
grew overnight for 18 h at 37 °C. The growth of the bacterial culture was measured
using a spectrophotometer (Biomate 3, Thermo Scientific, UK) at 600 nm. It needs to be
noted that the cell culture was serially diluted with fresh MRS before measuring the
optical density (OD). The final OD600 value was calculated back to the original
concentration by multiplying with dilution factor. Then, an appropriate volume of the
overnight culture (18 h) was calculated and inoculated into fresh 250 ml of MRS broth
to obtain a starting OD600 of ~0.2. The new culture was incubated at 37 °C in an orbital
shaker (KS 501 digital, IKA, Germany) set at 200 rpm for 30 h. A 15 ml aliquot of this
culture was collected every 3 h and the pH was immediately measured using a pH meter
(S20 SevenEasyTM, METTLER TOLEDO, UK), while the cell viability was determined
by the spread plate method on MRS agar, incubated at 37 °C for 3 days. The colonies
were counted using a colony counter (Colony counter SC5, StuatTM, UK). The results
were expressed as CFU/ml. Biological triplicate comprising technical triplicate were
conducted for this experiment. The data shown are expressed throughout as mean ±
standard deviation (SD).
2.2.4. Effects of acid adaptation on subsequent cell survival in cranberry juice
2.2.4.1. Adaptation of cells in buffered solutions at various pH
In the first set of adaptation experiments, the role of pH and types of acid (weak
acid versus strong acid) on the survival of early stationary phase cells of L. plantarum
NCIMB 8826 were evaluated. To this end, the cells were incubated at 37 °C for 1 h in
62
two different buffers, phosphate and citrate buffer, with the pH adjusted to pH 2, 3, 4, 5
and 6 using HCl (Sigma-Aldrich, UK) in the case of the phosphate buffer, and citric
acid (Sigma-Aldrich, UK) as well as sodium citrate (Sigma-Aldrich, UK) in the case of
the citrate buffer. Cells incubated in 0.1 M phosphate buffered saline (PBS, Oxoid, UK)
with a pH of 7.3 were used as the control.
2.2.4.1.1. Preparation of stationary phase cells
As discussed previously, late stationary phase cells are more robust to various
stresses compared to other cell stages. The reason for selecting early stationary phase
cells instead of late stationary phase cells was that the latter is generally more stressed
due to the lack of nutrients and the accumulation of toxic waste products. Based on the
growth pattern of L. plantarum NCIMB 8826 observed in the section 2.3.1, the cells
needed to be cultured for at least 15 h before reaching early stationary phase. To this
end, a single colony prepared as described in section 2.2.3 was inoculated into 10 ml of
MRS broth and grown overnight for 18 h at 37 °C. The OD600 of the cell culture was
measured by a spectrophotometer and then an appropriate volume of the cell culture
was calculated and added into fresh 100 ml of MRS broth in order to obtain a starting
OD600 of ~0.2. The cells were then incubated at 37 °C on an orbital shaker set at 200
rpm for 15 h; at which point, the concentration of the early stationary phase cells was
∼1010 CFU/ml.
2.2.4.1.2. Preparation of citric acid and HCl exposed cells
Early stationary phase cells, prepared as mentioned above, were harvested from
50 ml of culture by centrifugation 3,500 g for 15 min; (Heraeus™ Multifuge™ X3
Centrifuge, Thermo Scientific, UK). The pellets were washed twice with 0.1 M PBS
(pH 7.3) and resuspended in 5 ml of 0.1 M PBS (pH 7.3), resulting in a 10-fold

63
concentration of bacterial cells; this way a cell concentration of ∼1011 CFU/ml was
obtained. The cell suspension (250 µl) were then added into two types of filter sterilised
(0.2 µm, Minisart, Sartorius AG, Germany).acidified buffers (pH 2, 3, 4, 5, 6), namely
0.1 M PBS (25 ml) and 0.15 M citrate buffer (25 ml), as well as a control solution (pH
7.3), namely 0.1 M PBS (25 ml).The cell concentration in the acidified solution was
∼109 CFU/ml in all cases; the cells were incubated at 37 °C for 1 h.
2.2.4.1.3. Addition of 1 h acid adapted cells into cranberry juice
After incubation, the cells were collected from each acidified solution by
centrifugation at 3,500 g for 15 min. The pellets were washed twice with 0.1 M PBS
(pH 7.3), harvested by centrifugation at 3,500 g for 15 min and resuspended in 2.5 ml of
cranberry juice. An aliquot (250 µl) of this cell suspension was used to inoculate 25 ml
of cranberry juice contained in 50 ml sterile plastic container. Consequently, the initial
cell concentration in the juices was approximately ∼108 CFU/ml. The juice was stored
at 4 °C. Based on previous work by Nualkaekul and Charalampopoulos (2011), it was
known that L. plantarum NCIMB 8826 was able to survive in cranberry juice for less
than a week; therefore, the cell survival in cranberry juice in this particular experiment
was monitored immediately upon inoculation of the juices and then every day until cell
death. The cell viability was measured by the same method described in section 2.2.3.
Biological triplicate comprising technical triplicate were conducted for each pH. The
effects of acid adaptation on the survival of L. plantarum in cranberry juice were
analysed using one-way analysis of variance (ANOVA) and Tukey’s post-hoc test at
95% confidence level.

64
2.2.4.2. Adaptation of cells in MRS at various pH
A second set of adaptation experiments using acidified MRS instead of acidified
buffers was performed in order to evaluate whether MRS, which contains glucose,
peptone and yeast extract, can serve as a nutrient and an energy source for the cells
during acid adaptation. This might be important for enhancing the survival of the cells
and avoid starvation which might be taking place when the cells were adapted in the
acidified buffers. Moreover, from an industrial point of view, it would be more efficient
and economically viable to adapt the cells in the fermentation medium at the end of the
fermentation process rather than harvesting, washing and re-suspending the cells in a
buffer. To this end, the control and citric adapted cells were prepared and cultured as
mentioned in section 2.2.4.1.2 but instead of using acidified buffers the cells were
incubated for 1 h at 25 °C in 25 ml of MRS acidified to pH 3, 4, 5 and 6 with citric acid,
while unmodified MRS with a pH of 6.4 was used as the control. It must be noted that
acid adaptation at pH 2 was excluded from this experimental set as MRS became cloudy
when it was acidified to pH 2. Moreover, the incubation temperature during acid
adaptation in the case of MRS (25 °C) was lower than that used for the buffers (37 °C)
in order to prevent cell growth. After incubation, the cells collected from each solution
were added into 25 ml of cranberry juice following the method in section 2.2.4.1.3. Cell
viability was measured immediately upon inoculation of the juices and then after 1, 2,
and 3 days of storage using the spread plate method, as described in section 2.2.3.
Biological triplicate comprising technical triplicate were conducted for each pH. The
effects of acid adaptation on the survival of L. plantarum NCIMB 8826 in cranberry
juice were analysed using one-way ANOVA and Tukey’s post-hoc test at 95%
confidence level.

65
2.2.5. Influence of exposure time in citrate buffer at pH 3
In the third set of adaptation experiments, the aim was to evaluate the effect of
exposure time on acid adaptation. It should be noted that citrate buffer acidified to pH 3
was used in this experiment, because these cells showed the greatest survival during
storage in cranberry juice (section 2.3.2.1). Although the cells exposed with MRS
acidified to pH 3 showed the same results (section 2.3.2.2), the acidified citrate buffer
was more appropriate as it avoided cell growth at 37 °C during acid adaptation process.
To this end, the control and citrate exposed cells were prepared and cultured as
mentioned in section 2.2.4.1.2; however, the cell cultures were incubated only in citrate
buffer acidified to pH 3 at 37 °C for various periods of time (1, 2, 3, 4, and 5 h). After
incubation, the collected cells from each solution were added into 25 ml of cranberry
juice using the methods stated in section 2.2.4.1.3. Cell viability was measured
immediately after inoculation of the juice and then after 1, 2, and 3 days of storage, by
the spread plate method as described in section 2.2.3. Biological triplicate comprising
technical triplicate were conducted. The effects of exposure time on the survival of
L. plantarum in cranberry juice were analysed using one-way ANOVA and Tukey’s
post-hoc test at 95% confidence level.
2.2.6. Effect of cold adaptation on subsequent cell survival in cranberry juice
In the fourth set of adaptation experiments, the effect of temperature on the
survival of cells in cranberry juice was investigated. More specifically, L. plantarum
NCIMB 8826 cells were incubated at various temperatures, including 4, 10, 25, and
37 οC for 2.5 and 5 h (pH 7.3) to evaluate whether cold adaptation can improve
subsequent cell survival in acidic condition. It must be noted that 0.1 M PBS (pH 7.3)
was selected as the incubation solution rather than unmodified MRS in order to

66
minimise the influence of pH and nutrients during cell adaptation, which would skew
the results. Moreover, the reason for selecting 10 οC and 2.5 and 5 h incubation times
was based on Kim and Dunn’s findings that cell viability of Lactococcus lactis subsp.
lactis was significantly improved, by 25 % to 37 %, during 24 h storage at -20 °C
following cold shock at 10 °C for 2.5 h (Kim and Dunn, 1997). Cell viability further
increased when the incubation time was extended to 5 h. Refrigerated temperature of 4
°C was also examined due to the fact that it is the temperature generally used to
preserve fruit juices.
2.2.6.1. Preparation of control and cold adapted cells
Early stationary phase cells were prepared as previously (2.2.2.4.1.2). Aliquot
(250 µl) of cell suspension were added into 25 ml of 0.1 M PBS (pH 7.3) in 50 ml
conical centrifuge tubes (VWR international, UK) and then incubated at 4, 10, 25, and
37 οC, respectively. One set of cell suspensions at each temperature was incubated for
2.5 h and a second set was incubated for 5 h. After incubation, the collected cells were
added into 25 ml of cranberry juice following the methods stated in section 2.2.4.1.3.
The cell viability was measured immediately after inoculation of the juices and then
after 1, 2, and 3 days of storage by the spread plate method as described in section 2.2.3.
Biological triplicate comprising technical triplicate were conducted for each treatment.
The effects of temperatures and exposure time on the survival of L. plantarum NCIMB
8826 in the cranberry juice were analysed using two-way ANOVA and Tukey’s post-
hoc test at 95% confidence level.

67
2.2.7. Effect of combined acid and cold adaptation on subsequent survival of
L. plantarum NCIMB 8826 cells in cranberry juice
In the fifth set of adaptation experiments, L. plantarum NCIMB 8826 cells were
incubated in citrate buffer acidified to pH 3 at 4 °C for 3 h (versus 37 °C as the control)
to investigate the potential synergistic effect of pH and temperature during cell
adaptation. The pH, type of acid, and exposure time used in this experiment were
selected based on the results from the experiments described in sections 2.3.2 (acid
adaptation) and 2.3.3 (exposure time) whereas the temperature was obtained from
section 2.3.4 (cold adaptation). More specifically, the adapted cells in acidified citrate
buffer (pH 3) for 3 h showed the greatest cell survival in cranberry juice (72 h) while
the adapted cells in 4 °C for both 2.5 and 5 h displayed the greatest cell survival in
cranberry juice (24 and 48 h). For this reason the conditions selected for the combined
acid and cold adaptation were pH 3 at 4 °C for 3 h; 37 °C was the set temperature for
the control. The control and citrate exposed cells were prepared and cultured as
described in section 2.2.4.1.2. After adaptation for 3 h, the collected cells were
incorporated into 25 ml of cranberry juice following the methods stated in section
2.2.4.1.3. The cell viability was measured immediately after inoculation and then after
1, 2, and 3 days of storage by the spread plate method, as described in section 2.2.3.
Three sets of biological replicate experiments were conducted for each treatment. The
synergistic effects of acid and cold adaptation on the survival of L. plantarum NCIMB
8826 in cranberry juice were analysed using paired t-test at 95% confidence level.
2.2.8. Survival of acid adapted cells in pomegranate, and lemon & lime juices
In the sixth set of adaptation experiments, the aim was to evaluate whether the
improvement in cell survival due to acid adaptation, which was seen in some cases in

68
cranberry juice, would be sustained during longer storage periods or in other juices.
MRS was used in this case to adapt the cells based on the rationale that it might provide
nutrients and energy sources for the cells which would help them to adapt during acid
adaptation, although the effect of media was not seen in this study (section 2.3.2.2).
Pomegranate and lemon & lime juices were selected as previous work had shown they
supported relatively good cell survival during refrigerated storage. The cells were
exposed to MRS acidified to pH 3 at 25 °C for 1 h and then transferred to pomegranate
and lemon & lime juices following the methods described in section 2.2.4.2. Cell
viability in this experiment was measured every week for up to 6 weeks in pomegranate,
and lemon & lime juices based on the findings from a previous study (Nualkaekul and
Charalampopoulos, 2011).
2.3. Results and discussion
2.3.1. Growth of L. plantarum NCIMB 8826 in MRS
The growth of L. plantarum NCIMB 8826 measured by OD600 and viable cell
counts followed the typical sigmoidal curve obtained for most bacteria (Figure 2.1A).
No lag phase was observed during the growth of cells. The cell concentration observed
by viable cell counts increased from ∼107 to ∼1010 CFU/ml within approximately 15 h,
after which the slope became stable. The curve of OD600 started from ∼0.2 and rose to
∼8 after approximately 18 h, after which it remained stable. Although 3 h deviation
between two methods was observed, the 15 h time point was selected as the point of
harvest, as the cells at that point were entering the early stationary phase based on the
viable cell count. It must be noted that the spectrophotometric method does not
distinguish between live and dead cells, while in addition to this, any morphological

69
changes commonly taking place during the end of growth (e.g. cells becoming longer
and bigger) would overestimate the result.
In terms of pH, the graph exhibited a downward sigmoidal curve (Figure 2.1B) as
expected, since the cells produce lactic acid during growth and the pH of the MRS broth
was not controlled in this study. The pH decreased from pH 7.0 to a pH of 4.6 after 15
h, the time when the cells reached the early stationary phase, and decreased further
down to 4.3 after 24 h. It must be noted though that the early stationary phase cells
obtained at 15 h, were already acid exposed at pH between 5.0 and 4.6 for at least 6 h
before conducting the acid adaptation experiments. Nevertheless, the effect of further
acid exposure (in buffers or MRS) can still be evaluated when compared with the
control cells (no subsequent acid exposure).

70
Figure 2.1 Growth of L. plantarum NCIMB 8826 in MRS incubated at 37 °C for 30 h and shaken at 200 rpm. (A) The cell concentration was measured by OD600 and viable cell counts; and (B) pH of medium during growth of L. plantarum NCIMB 8826. Data are expressed in mean ± SD (n=3)
0.00
1.00
2.00
3.00
4.00
5.00
6.00
7.00
8.00
9.00
7.0
7.5
8.0
8.5
9.0
9.5
10.0
10.5
11.0
0 3 6 9 12 15 18 21 24 27 30 33
OD
at 6
00 n
m
Via
ble
cell
Cou
nts (
logC
FU/m
l)
Time (h)
Viable cell count
OD600
4.04.34.54.85.05.35.55.86.06.36.56.87.0
0 3 6 9 12 15 18 21 24 27 30 33
pH
Time (h)

71
2.3.2. Effects of acid adaptation on subsequent cell survival in cranberry juice
2.3.2.1. Adaptation of cells in buffered solutions at various pH
Exposure of the cells for 1 h in both acidic solutions (HCl and citric acid), even at
a pH as low as 2, did not significantly impact on cell viability (0 h) compared to the
PBS control (pH 7.3) (Figure 2.2). This might be due to the short period of time used
for acid adaptation (1 h) in this experiment. Overall, the results indicated that acid
adaptation of cells collected at 15 h of culture (MRS, pH 4.6) in both acidic solutions at
pH values higher than 2 significantly improved subsequent cell survival in cranberry
juice (24 to 48 h) compared to the control cells (PBS, pH 7.3); the greatest results were
obtained after adapting the cells in pH 3, followed by pH 4, 5 and 6. Acid adaptation at
pH 2 was detrimental towards the survival of the cells in cranberry juice as the viable
cells were below the detection limit (100 CFU/ml) after only one day of storage.
Although the results were promising, acid adaptation was not able to improve
sufficiently the survival of this particular strain during storage in cranberry juice, as the
viable cell counts were below those required for probiotic application (>107 CFU/ml).
This effect of pH has been observed in the previous work (Seme et al.,2015),
although a different strain, L. plantarum KR6, and different experimental set up were
used. Non-acid stressed cells of L. plantarum KR6 exposed to acidified MRS (pH 4.5
using HCl) for 30 min, increased survival in acidified MRS (at pH 2) by about 100
times compared to the control (cells exposed to MRS at pH 7 for 30 min). The
researchers suggested that this behaviour might relate to the upregulation of genes
involved in membrane fatty acid biosynthesis, and in particular cfa, as determined by
qPCR analysis. To this end, the higher survival rates of L. plantarum NCIMB 8826 in
cranberry juice (24 to 48 h) after 1 h acid adaptation (pH 6, 5, 4 and 3) might be

72
associated with changes in the composition of the membrane fatty acids which is used
as a mechanism by the cells in order to regulate the proton permeability through their
cell membrane (Lemos et al., 2005, Zhang and Rock, 2008). This hypothesis will be
investigated later in chapter 3. It is interesting to note that compared to the control cells
(PBS, pH 7.3) some improvements in cell survival were observed in the case of cells
adapted at pH 5 and 6; i.e. values higher than the pH at which the cells were collected at
the 15 h time point (pH ~ 4.6). This indicates that any changes in pH, even from an acid
to a more alkaline environmental could affect the response of the cells during
subsequent exposure to the acidic environment of fruit juices.
Similar viability profiles of L. plantarum NCIMB 8826 were seen during the first
2 days storage in cranberry juice for adapted cells irrespective of type of acid used to
acidify the buffers (HCl versus citric acid) (Figure 2.2). However, the adapted cells in
acidified citrate buffer (pH 3 and 4) were able to survive in cranberry juice beyond 2
days of storage, albeit at low concentrations (∼103 and ∼102 CFU/ml, respectively),
indicating that changes caused by citric acid have more positive effect on cell survival
in cranberry juice than that by HCl.

73
Figure 2.2 Cell concentration (log CFU/ml) of L. plantarum NCIMB 8826 during refrigerated storage in cranberry juice after pre-treatment in 0.15 M citrate buffer acidified to different pH using citric acid, and in 0.1 M PBS acidified to different pH using HCl. Results are expressed in mean ± SD (n=3). Significant differences between different pH within each group at a specific time point were determined by one-way Anova and Tukey’s post-hoc tests. *indicates a significant difference determined by one-way Anova (at least one difference in each group means significant difference) while a, b, c, different lettering indicates significant differences between each pH determined by Tukey’s post-hoc tests.
This phenomenon could be explained on the basis of the study of Pieterse et al.
(2005), who investigated the effect of the dissociated and undissociated forms of lactic
acid and that of hydrogen ions alone on L. plantarum WCFS1. The levels of
gene/operon expression were measured during continuous steady state experiments, in
which the pH was controlled by automatic titration with 10 M sodium hydroxide. The
degree of undissociation/dissociation was varied by adding 300 mM of sodium lactate at
the two different pH values, at pH 6.0 (lactate effect; dissociated>undissociated form)

74
and pH 4.8 (undissociated lactic acid effect; undissociated>dissociated form). Gene
expression analysis indicated that during acid stress a small number of genes/operons
were differentially expressed in response to the hydrogen ions and the dissociated form
of lactic acid. On the other hand, stressing the cells with the undissociated form of lactic
acid resulted in the overexpression of several genes/operons in L. plantarum WCFS1.
More specifically, 18 genes or operons which are involved in multiple cell surface
proteins were overexpressed. Such overexpression of these key proteins might have
taken place in the case of the experiment in the present study, in which another weak
organic acid was used, i.e. citric acid instead of lactic acid.
Another potential mechanism responsible for the improved survival of citric acid
treated cells compared to the HCl treated cells, could have involved the transportation
of citrate inside the cells, as part of the citrate fermentation pathway, which has been
reported to be more active in Lactococcus lactis MG 1363 at pH 4.5 compared to that at
pH 6.5 (García-Quintáns et al., 1998). The transport of citrate in exchange of lactate
which is catalyzed by citrate permease (citP) results in a considerable increase in the
membrane potential, a difference in the electric charge across the membrane, a
transmembrane pH gradient, and a difference in the concentration of ions across the
membrane (García-Quintáns et al., 1998, Pudlik and Lolkema, 2011). Both the
membrane potential and the transmembrane pH gradient are known as PMF. More
specifically, the uptake of citrate into the cell not only generates energy due to the
electric potential but also drives a proton into the cell due to the pH gradient. Once
inside the cell, the energy from the PMF can be used for ATP production by ATP
synthase in order to pump protons outside the cell, while the proton can be used for
citrate metabolism to produce pyruvate and CO2 by oxaloacetate decarboxylase (Pudlik
and Lolkema, 2011). The above indicates that the citrate fermentation pathway is a

75
likely mechanism used to protect the cells during acid stress. Although the increase in
the transportation of citric acid at low pH was reported in Lactococcus lactis CRL 264
(Magni et al., 1999) and in Leuconostoc paramesenteroides J1 (Martı́n et al., 1999), this
is a mechanism that can possibly occur in other lactic acid bacteria, as the existence of
the citrate fermentation pathway was reported in growth experiments with Leuconostoc
mesenteroides 19D (Marty-Teysset et al., 1995), Lactococcus lactis CRL 264 (Magni et
al., 1999), Lactobacillus rhamnosus ATCC 7469 (de Figueroa et al., 1996) and
L. plantarum DSMZ 20174 (Kennes et al., 1991).
2.3.2.2. Adaptation of cells in MRS at various pH
The adapted cells in acidified MRS with citric acid (Figure 2.3) displayed a
similar survival profile as that observed in acidified citrate buffer (Figure 2.2), although
some differences were observed e.g. improvement in cell survival after 72 h of storage
(by ∼1 log CFU/ml) for pH 3 and 4, and extension of protection time (from 24 to 48 h)
for pH 6. Overall however, the use of acidified MRS, which contains nutrients and
energy sources for cells, was not able to improve considerably the survival of
L. plantarum NCIMB 8826 in cranberry juice, compared to the use of acidified buffers.
It seems likely that the response of the cells as a result of the acid adaptation process
was primarily influenced by the pH of acidified solutions (pH 3 to 6) and type of acids
(weak versus strong acids) rather than by the presence of nutrients and energy sources
in the medium.

76
Figure 2.3 Survival of L. plantarum NCIMB 8826 during refrigerated storage in cranberry juice after pre-treatment in MRS acidified to different pH using citric acid. Results are expressed in mean±SD (n=3). Significant differences between different pH within its group at a specific time point were determined by one-way Anova and Tukey’s post-hoc tests. *indicates significant difference determined by one-way Anova while a, b, c, different lettering indicates significant differences between each pH determined by Tukey’s post-hoc tests.
2.3.3. 49BInfluence of exposure time in citrate buffer at pH 3
Increasing the exposure time of the cells in acidified citrate buffer (pH 3) from 1
h up to 5 h has an effect on cell survival in cranberry juice (Figure 2.4). Exposure of the
cells in acidified citrate buffer (pH 3) for 2 and 3 h resulted in the highest survival in
cranberry juice (48 h), followed by 1, 4, 5 h exposure. It seems likely that an incubation
time of less than 1 h would not be enough to impact protection to the cells, whereas
incubation for more than 3 h imparted negative effects on cell survival. This negative
effect might be associated with cell injury or damage during prolonged acid adaptation
caused by the antimicrobial effects of the undissociated form of citric acid (Beales,
2004). However, this hypothesis cannot be confirmed without the examination of the
surface cell morphology under scanning electron microscope (SEM) at different

77
exposure times. Overall, the results suggest that the cells should be incubated for at least
2 to 3 h in order to gain maximum protection from further acid exposure.
Figure 2.4 Survival of L. plantarum NCIMB 8826 during refrigerated storage in cranberry juice after pre-treatment in acidified citrate buffer (pH 3, 37 °C) for different times. Results are expressed in mean±SD (n=3). Significant differences between different pH within its group at a specific time point were determined by one-way Anova and Tukey’s post-hoc tests. *indicates significant difference determined by one-way Anova while a, b, different lettering indicates significant differences between each exposure time determined by Tukey’s post-hoc tests.
2.3.4. 50BEffect of cold adaptation on subsequent cell survival in cranberry juice
There were no significant differences between the 2.5 and 5 h incubation time for
all temperatures (Figure 2.5), while exposure of the cells to 4 and 10 °C significantly
improved the cell viability in cranberry juice (24 and 48 h) compared to exposure to 25
and 37 °C (∼1 to ∼3 log CFU/ml). This suggests that exposure time did not affect cell
survival in cranberry juice like temperatures (4 and 10 °C). However, no viable cells
were observed at 72 h of refrigerated storage in cranberry juice (Figure 2.5), in contrast
to the results with the cells in acidified citrate buffer (pH 3 and 4) (Figure 2.2). This

78
indicates that cold adaptation was less effective than acid adaptation in protecting the
cells in cranberry juice. Taking into account the results from two studies including, i)
the increase in the C16:0 and C18:2 membrane fatty acids in L. acidophilus CRL 640 when
grown at 25 °C compared to 37 °C (Murga et al., 2000), and ii) the increase in C18:1
fatty acid content in L. plantarum when the cells were grown at 10 °C compared to 30
and 40 °C (Russell et al., 1995), the improvement in cell survival in cranberry juice (24
to 48 h) by cold adaptation (4 and 10 °C) might be associated with changes in the cell
membrane fatty acid composition which is the same process as in acid adaptation.
Additionally, it has been suggested that cellular adaptation to cold stress not only results
in the alteration of the cell membrane fatty acid composition, but may also be related to
the expression of certain heat shock proteins which are involved in acid tolerance, such
as, DnaK and GroEL (Salotra et al., 1995). To understand better the possible influence
of cold stress exposure towards acid tolerance, the cellular fatty acid composition was
determined, and the results are reported and discussed in chapter 3.

79
Figure 2.5 Survival of L. plantarum NCIMB 8826 during refrigerated storage in cranberry juice after pre-treatment in PBS (pH 7.3 at 37, 25, 10, and 4 °C) for both 2.5 and 5 h. Results are expressed in mean±SD (n=3). Significant differences for temperature and exposure time within each group at a specific time point were determined by two-way Anova and Tukey’s post-hoc tests. *indicates significant difference determined by two-way Anova (at least one difference in its group means significant difference) while a, different lettering indicates significant differences between each treatment determined by Tukey’s post-hoc tests
2.3.5. 51BEffect of combined acid and cold adaptation on subsequent survival of
L. plantarum cells in cranberry juice
There were no significant differences in terms of cell viability between the cells
adapted in acidified citrate buffer (pH 3) at 37 and 4°C during storage in cranberry juice
from 24 to 72 h (Figure 2.6). This indicates that a synergistic effect of pH and
temperature did not occur during cell adaptation, although both pH (pH 3) and
temperature (4°C) had separate positive effects on the survival of L. plantarum NCIMB
8826 during storage in cranberry juice as previously discussed. There are two possible
explanations for this; either the cellular mechanism in the case of temperature (4°C)
might not be functional when the cells are exposed to acidic environment (pH 3) or a

80
similar mechanism was used in the case of cold and acid adaptation. This hypothesis
will be investigated and discussed in chapter 3.
Figure 2.6 Comparison of cell viability between acid adaptation and combination of acid and cold adaptation stored in cranberry juice at 4 °C. Results are expressed in mean±SD (n=3). Significant differences at specific time point were determined by paired t-test. *indicates significant difference.
2.3.6. 52BSurvival of acid adapted cells in pomegranate and lemon & lime juices
Acid adaptation (MRS, pH 3) for 1 h improved cell survival in pomegranate and
lemon & lime juices compared to the control (MRS, pH 6.4) as previously seen in
cranberry juice, although different degrees of cell protection were observed (Figure
2.7). More specifically, the adapted cells exhibited better survival, by more than 1 log
CFU/ml for the first and second week compared to the control cells; however, no
significant differences were observed for the third week and beyond in both juices.
These results indicate that acid adaptation had a positive effect on cell survival in
pomegranate and lemon & lime juices but only for the initial stages of storage,
suggesting that the alteration process by acid adaptation was not permanent.

81
The significant loss in the cell viability of L. plantarum NCIMB 8826 observed in
all fruit juices used in this study during storage, is most likely due to the low pH of the
juices as the pH, which for most juices ranges between 2.5 and 3.8, has an adverse
effect on bacterial survival (Champagne et al., 2005, Sheehan et al., 2007). More
specifically, the pH of cranberry, pomegranate and lemon & lime juices were 2.7, 3.5,
and 2.8, respectively. Interestingly, although the pH values of cranberry and lemon &
lime juice were very similar, the survival rates were considerably different; the cells
died within the first week of storage in cranberry juice whereas in lemon & lime juice
they were viable until week 5. This most likely indicates that other compounds present
in cranberry juice might have negative effects on cell survival. Considering the high
levels of total phenolic compounds (1.5 g/l) that have been reported for the same
cranberry juice product (Nualkaekul and Charalampopoulos, 2011), these could be
certain phenolic compounds which have strong antimicrobial effects such as benzoic
acid (Sheehan et al., 2007) and coumaric acid (Landete et al., 2007). Moreover, the
presence of phenolic compounds in the fruit juices used in this study might also explain
why the cells died quicker in pomegranate juice compared to lemon & lime juice (4
weeks versus 5 weeks) despite the fact that the pH in the former was higher. However,
this cannot be confirmed as the phenolic compounds were not determined for all juices.
Considering the average shelf life of refrigerated fruit juices (∼6 weeks) (Esteve
and Frígola, 2007) and the concentration of viable cells required for probiotics
application (∼107 CFU/ml) (Corcoran et al., 2007), the cell concentrations of
L. plantarum NCIMB 8826 in each fruit juice should be higher than ∼107 CFU/ml after
6 weeks in order to exert its beneficial effects upon consumption. However, the viable
cells higher than ∼107 CFU/ml were only observed at week 2 and 3 in pomegranate and
lemon & lime juices, respectively. These results suggest that the improvement in cell

82
survival after acid adaptation was not significant enough to make these particular fruit
juices suitable commercial products for the delivery of L. plantarum NCIMB 8826.
However, the pomegranate and lemon & lime juices still have the potential for being
used as probiotic carriers as they provide a relatively mild environment for the cells,
compared to the harsh environment of cranberry juice. To this end, new strategies that
could prolong probiotic survival in these fruit juices, such as use of microencapsulation
techniques to encapsulate the cells within polymeric matrices that can protect the cells
from acid or use of other bacteria strains that are more robust to acidic environments
than L. plantarum NCIMB 8826 or using other mild fruit juices should be considered
before conducting a new experiment in the future.

83
Figure 2.7 Survival of L. plantarum NCIMB 8826 during refrigerated storage in pomegranate (A), and lemon & lime (B) after pre-treatment in acidified MRS (pH 3, 25 °C, 1 h). Results are expressed in mean±SD (n=3). Significant differences at specific time point were determined by paired t-test. * indicates significant difference.

84
2.4. Conclusions
The results from this study demonstrated that acid adaptation for 1 h in different
acidic solutions (HCl versus citric acid) with pH higher than 2 improved cell survival
during subsequent storage in cranberry juice, while adaptation at pH 2 the cells died
within just one day storage in cranberry juice. The presence of nutrients in the MRS
medium did not improve cell survival in contrast to expectations. Exposure time
between 1 and 3 h in acidified citrate buffer (pH 3) was the most suitable time for
adapting the cells, while incubation for more than 3 h had negative effects on cell
viability. Moreover, the use of weak acid (citric acid) resulted in better cell survival in
cranberry juice (pH 3 and 4, 72 h) compared to strong acid (HCl). This is most likely
due to the combined effect of the undissociated form and the pH in the case of weak
acid, while strong acid exerts only a pH effect. Besides pH, temperatures of 4 and 10 °C
were able to enhance cell survival in cranberry juice compared to higher temperatures
(25 and 37 °C), although the improvement was less than that observed after acid
adaptation (pH 3). The cell survival data obtained indicate that acid adaptation
improved the survival of L. plantarum NCIMB 8826 during storage in the three fruit
juices; however, the protection was not significant enough to meet the requirements for
probiotic applications (∼107 CFU/ml for 6 weeks). To this end, new approaches, such as
improving acid tolerance cells by other techniques (e.g. serial subculturing of cells after
storage in these fruit juices, varying the types of acid used for acid adaptation, changing
the type of fruit juice) could be used in future experiments to prolong the survival of
L. plantarum NCIMB 8826.

85
2.5. References
BâATI, L., FABRE-GEA, C., AURIOL, D. & BLANC, P. J. 2000. Study of the cryotolerance of Lactobacillus acidophilus: effect of culture and freezing conditions on the viability and cellular protein levels. International Journal of Food Microbiology, 59, 241-247. BAČUN-DRUŽINA, V., BUTORAC, A., MRVČIĆ, J., LANDEKA DRAGIČEVIĆ, T. & STEHLIK-TOMAS, V. 2011. Bacterial stationary-phase evolution. Food Technology and Biotechnology, 49, 13-23. BEALES, N. 2004. Adaptation of microorganisms to cold temperatures, weak acid preservatives, low pH, and osmotic stress: a review. Comprehensive Reviews in Food Science and Food Safety, 3, 1-20. CHAMPAGNE, C. P., GARDNER, N. J. & ROY, D. 2005. Challenges in the addition of probiotic cultures to foods. Critical Reviews in Food Science and Nutrition, 45, 61-84. CHARALAMPOPOULOS, D., PANDIELLA, S. S. & WEBB, C. 2003. Evaluation of the effect of malt, wheat and barley extracts on the viability of potentially probiotic lactic acid bacteria under acidic conditions. International Journal of Food Microbiology, 82, 133-141. CORCORAN, B. M., STANTON, C., FITZGERALD, G. F. & ROSS, R. P. 2005. Survival of probiotic lactobacilli in acidic environments is enhanced in the presence of metabolizable sugars. Applied and Environmental Microbiology, 71, 3060-3067. CORCORAN, B. M., STANTON, C., FITZGERALD, G. F. & ROSS, R. P. 2007. Growth of probiotic lactobacilli in the presence of oleic acid enhances subsequent survival in gastric juice. Microbiology, 153, 291-299. DE FIGUEROA, R. M., BENITO DE CARDENAS, I. L., SESMA, F., ALVAREZ, F., DE RUIZ HOLGADO, A. P. & OLIVER, G. 1996. Inducible transport of citrate in Lactobacillus rhamnosus ATCC 7469. Journal of Applied Bacteriology, 81, 348-354. DE VRIES, M. C. 2006. Analyzing global gene expression of Lactobacillus plantarum in the human gastro-intestinal tract. PhD thesis, Wageningen University. DING, W. K. & SHAH, N. P. 2008. Survival of free and microencapsulated probiotic bacteria in orange and apple juices. International Food Research Journal, 15, 219-232. ESTEVE, M. J. & FRíGOLA, A. 2007. Refrigerated fruit juices: quality and safety issues. Advances in food and nutrition research, 52, 103-139. FAO/WHO. 2002. Guidelines for the evaluation of probiotics in food: Report of a Joint FAO/WHO Working Group on Drafting Guidelines for the Evaluation of Probiotics in Food. Ontario, Canada
86
FOLIGNE, B., NUTTEN, S., GRANGETTE, C., DENNIN, V., GOUDERCOURT, D., POIRET, S., DEWULF, J., BRASSART, D., MERCENIER, A. & POT, B. 2007. Correlation between in vitro and in vivo immunomodulatory properties of lactic acid bacteria. World Journal of Gastroenterology, 13, 236-243. FOLIGNé, B., NUTTEN, S., STEIDLER, L., DENNIN, V., GOUDERCOURT, D., MERCENIER, A. & POT, B. 2006. Recommendations for improved use of the murine TNBS-induced colitis model in evaluating anti-inflammatory properties of lactic acid bacteria: technical and microbiological aspects. Digestive Diseases and Sciences, 51, 390-400. GARCíA-QUINTáNS, N., MAGNI, C., DE MENDOZA, D. & LóPEZ, P. 1998. The citrate transport system of Lactococcus lactis subsp. lactis biovar diacetylactis is induced by acid stress. Applied and Environmental Microbiology, 64, 850-857. GUEIMONDE, M., DELGADO, S., MAYO, B., RUAS-MADIEDO, P., MARGOLLES, A. & DE LOS REYES-GAVILáN, C. G. 2004. Viability and diversity of probiotic Lactobacillus and Bifidobacterium populations included in commercial fermented milks. Food Research International, 37, 839-850. HARTKE, A., BOUCHé, S., GIARD, J. C., BENACHOUR, A., BOUTIBONNES, P. & AUFFRAY, Y. 1996. The lactic acid stress response of Lactococcus lactis subsp. lactis. Current Microbiology, 33, 194-199. HILL, C., GUARNER, F., REID, G., GIBSON, G. R., MERENSTEIN, D. J., POT, B., MORELLI, L., CANANI, R. B., FLINT, H. J., SALMINEN, S., CALDER, P. C. & SANDERS, M. E. 2014. Expert consensus document. The International Scientific Association for Probiotics and Prebiotics consensus statement on the scope and appropriate use of the term probiotic. Nature Reviews Gastroenterology & Hepatology, 11, 506-514. HOLS, P., SLOS, P., DUTOT, P., REYMUND, J., CHABOT, P., DELPLACE, B., DELCOUR, J. & MERCENIER, A. 1997. Efficient secretion of the model antigen M6-gp41E in Lactobacillus plantarum NCIMB 8826. Microbiology, 143, 2733-2741. KARCZEWSKI, J., TROOST, F. J., KONINGS, I., DEKKER, J., KLEEREBEZEM, M., BRUMMER, R.-J. M. & WELLS, J. M. 2010. Regulation of human epithelial tight junction proteins by Lactobacillus plantarum in vivo and protective effects on the epithelial barrier. American Journal of Physiology-Gastrointestinal and Liver Physiology, 298, 851-859. KENNES, C., DUBOURGULER, H. C., ALBAGNAC, G. & NYNS, E. J. 1991. Citrate metabolism by Lactobacillus plantarum isolated from orange juice. Journal of Applied Bacteriology, 70, 380-384. KIM, W. S. & DUNN, N. W. 1997. Identification of a cold shock gene in lactic acid bacteria and the effect of cold shock on cryotolerance. Current Microbiology, 35, 59-63.

87
LANDETE, J. M., RODRIGUEZ, H., DE LAS RIVAS, B. & MUNOZ, R. 2007. High-added-value antioxidants obtained from the degradation of wine phenolics by Lactobacillus plantarum. Journal of Food Protection, 70, 2670-2675. LEE, I., SLONCZEWSKI, J. & FOSTER, J. 1994. A low-pH-inducible, stationary-phase acid tolerance response in Salmonella typhimurium. Journal of Bacteriology, 176, 1422-1426. LEMOS, J. A. C., ABRANCHES, J. & BURNE, R. A. 2005. Responses of cariogenic streptococci to environmental stresses. Current Issues in Molecular Biology, 7, 95-108. LIM, E. M., EHRLICH, S. D. & MAGUIN, E. 2000. Identification of stress-inducible proteins in Lactobacillus delbrueckii subsp. bulgaricus. Electrophoresis, 21, 2557-2561. LORCA, G. & DE VALDEZ, G. F. 2001. A low-pH-inducible, stationary-phase acid tolerance response in Lactobacillus acidophilus CRL 639. Current Microbiology, 42, 21-25. LORCA, G., RAYA, R., TARANTO, M. & DE VALDEZ, G. 1998. Adaptive acid tolerance response in Lactobacillus acidophilus. Biotechnology Letters, 20, 239-241. LUCKOW, T. & DELAHUNTY, C. 2004. Which juice is ‘healthier’? A consumer study of probiotic non-dairy juice drinks. Food Quality and Preference, 15, 751-759. MAGNI, C., DE MENDOZA, D., KONINGS, W. N. & LOLKEMA, J. S. 1999. Mechanism of citrate metabolism in Lactococcus lactis: resistance against lactate toxicity at low pH. Journal of Bacteriology, 181, 1451-1457. MARTı́N, M., CORRALES, M. A., MENDOZA, D., LóPEZ, P. & MAGNI, C. 1999. Cloning and molecular characterization of the citrate utilization citMCDEFGRP cluster of Leuconostoc paramesenteroides. FEMS Microbiology Letters, 174, 231-238. MARTY-TEYSSET, C., LOLKEMA, J. S., SCHMITT, P., DIVIES, C. & KONINGS, W. N. 1995. Membrane potential-generating transport of citrate and malate catalyzed by CitP of Leuconostoc mesenteroides. Journal of Biological Chemistry, 270, 25370-25376. MONTANARI, C., SADO KAMDEM, S. L., SERRAZANETTI, D. I., ETOA, F. X. & GUERZONI, M. E. 2010. Synthesis of cyclopropane fatty acids in Lactobacillus helveticus and Lactobacillus sanfranciscensis and their cellular fatty acids changes following short term acid and cold stresses. Food Microbiology, 27, 493-502. MOUSAVI, Z., MOUSAVI, S., RAZAVI, S., EMAM-DJOMEH, Z. & KIANI, H. 2011. Fermentation of pomegranate juice by probiotic lactic acid bacteria. World Journal of Microbiology and Biotechnology, 27, 123-128. MURGA, M., CABRERA, G., DE VALDEZ, G., DISALVO, A. & SELDES, A. 2000. Influence of growth temperature on cryotolerance and lipid composition of Lactobacillus acidophilus. Journal of Applied Microbiology, 88, 342-348.

88
NUALKAEKUL, S. & CHARALAMPOPOULOS, D. 2011. Survival of Lactobacillus plantarum in model solutions and fruit juices. International Journal of Food Microbiology, 146, 111-117. NUALKAEKUL, S., LENTON, D., COOK, M. T., KHUTORYANSKIY, V. V. & CHARALAMPOPOULOS, D. 2012. Chitosan coated alginate beads for the survival of microencapsulated Lactobacillus plantarum in pomegranate juice. Carbohydrate Polymers, 90, 1281-1287. PALMFELDT, J. & HAHN-HäGERDAL, B. 2000. Influence of culture pH on survival of Lactobacillus reuteri subjected to freeze-drying. International Journal of Food Microbiology, 55, 235-238. PANOFF, J. M., LEGRAND, S., THAMMAVONGS, B. & BOUTIBONNES, P. 1994. The cold shock response in Lactococcus lactis subsp. lactis. Current Microbiology, 29, 213-216. PARENTE, E., CIOCIA, F., RICCIARDI, A., ZOTTA, T., FELIS, G. E. & TORRIANI, S. 2010. Diversity of stress tolerance in Lactobacillus plantarum, Lactobacillus pentosus and Lactobacillus paraplantarum: A multivariate screening study. International Journal of Food Microbiology, 144, 270-279. PIETERSE, B., LEER, R. J., SCHUREN, F. H. & VAN DER WERF, M. J. 2005. Unravelling the multiple effects of lactic acid stress on Lactobacillus plantarum by transcription profiling. Microbiology, 151, 3881-3894. POCHARD, P., HAMMAD, H., RATAJCZAK, C., CHARBONNIER-HATZFELD, A. S., JUST, N., TONNEL, A. B. & PESTEL, J. 2005. Direct regulatory immune activity of lactic acid bacteria on Der p 1-pulsed dendritic cells from allergic patients. Journal of Allergy and Clinical Immunology, 116, 198-204. PRADO, F. C., PARADA, J. L., PANDEY, A. & SOCCOL, C. R. 2008. Trends in non-dairy probiotic beverages. Food Research International, 41, 111-123. PUDLIK, A. M. & LOLKEMA, J. S. 2011. Citrate uptake in exchange with intermediates in the citrate metabolic pathway in Lactococcus lactis IL1403. Journal of Bacteriology, 193, 706-714. RALLU, F., GRUSS, A. & MAGUIN, E. 1996. Lactococcus lactis and stress. Antonie van Leeuwenhoek, 70, 243-251. RUSSELL, N., EVANS, R., TER STEEG, P., HELLEMONS, J., VERHEUL, A. & ABEE, T. 1995. Membranes as a target for stress adaptation. International Journal of Food Microbiology, 28, 255-261. SAARELA, M., ALAKOMI, H. L., MäTTö, J., AHONEN, A. M. & TYNKKYNEN, S. 2011. Acid tolerant mutants of Bifidobacterium animalis subsp. lactis with improved stability in fruit juice. LWT-Food Science and Technology, 44, 1012-1018.

89
SAARELA, M., RANTALA, M., HALLAMAA, K., NOHYNEK, L., VIRKAJäRVI, I. & MäTTö, J. 2004. Stationary-phase acid and heat treatments for improvement of the viability of probiotic lactobacilli and bifidobacteria. Journal of Applied Microbiology, 96, 1205-1214. SALOTRA, P., SINGH, D. K., SEAL, K. P., KRISHNA, N., JAFFE, H. & BHATNAGAR, R. 1995. Expression of DnaK and GroEL homologs in Leuconostoc esenteroides in response to heat shock, cold shock or chemical stress. FEMS Microbiology Letters, 131, 57-62. SANCHEZ, B., CHAMPOMIER-VERGES, M. C., COLLADO MDEL, C., ANGLADE, P., BARAIGE, F., SANZ, Y., DE LOS REYES-GAVILAN, C. G., MARGOLLES, A. & ZAGOREC, M. 2007. Low-pH adaptation and the acid tolerance response of Bifidobacterium longum biotype longum. Applied and Environmental Microbiology, 73, 6450-6459. SEME, H., GJURACIC, K., KOS, B., FUJS, S., STEMPELJ, M., PETKOVIC, H., SUSKOVIC, J., BOGOVIC MATIJASIC, B. & KOSEC, G. 2015. Acid resistance and response to pH-induced stress in two Lactobacillus plantarum strains with probiotic potential. Beneficial Microbes, 6, 369-379. SHAH, N. P. 2000. Probiotic bacteria: Selective enumeration and survival in dairy foods. Journal of Dairy Science, 83, 894-907. SHEEHAN, V. M., ROSS, P. & FITZGERALD, G. F. 2007. Assessing the acid tolerance and the technological robustness of probiotic cultures for fortification in fruit juices. Innovative Food Science & Emerging Technologies, 8, 279-284. STORZ, G. & HENGGE, R. 2011. Bacterial stress responses, Washington DC, American Society for Microbiology press. STREIT, F., DELETTRE, J., CORRIEU, G. & BEAL, C. 2008. Acid adaptation of Lactobacillus delbrueckii subsp. bulgaricus induces physiological responses at membrane and cytosolic levels that improves cryotolerance. Journal of Applied Microbiology, 105, 1071-1080. VESA, T., POCHART, P. & MARTEAU, P. 2000. Pharmacokinetics of Lactobacillus plantarum NCIMB 8826, Lactobacillus fermentum KLD, and Lactococcus lactis MG 1363 in the human gastrointestinal tract. Alimentary Pharmacology & Therapeutics, 14, 823-828. VINDEROLA, C., COSTA, G., REGENHARDT, S. & REINHEIMER, J. 2002. Influence of compounds associated with fermented dairy products on the growth of lactic acid starter and probiotic bacteria. International Dairy Journal, 12, 579-589. VINDEROLA, C. G., BAILO, N. & REINHEIMER, J. A. 2000. Survival of probiotic microflora in Argentinian yoghurts during refrigerated storage. Food Research International, 33, 97-102.

90
WANG, Y., CORRIEU, G. & BéAL, C. 2005. Fermentation pH and Temperature Influence the Cryotolerance of Lactobacillus acidophilus RD758. Journal of Dairy Science, 88, 21-29. WU, C., HE, G. & ZHANG, J. 2014. Physiological and proteomic analysis of Lactobacillus casei in response to acid adaptation. Journal of Industrial Microbiology & Biotechnology, 41, 1533-1540. WU, C., ZHANG, J., WANG, M., DU, G. & CHEN, J. 2012. Lactobacillus casei combats acid stress by maintaining cell membrane functionality. Journal of Industrial Microbiology and Biotechnology, 39, 1031-1039. ZHANG, Y.-M. & ROCK, C. O. 2008. Membrane lipid homeostasis in bacteria. Nature Reviews Microbiology, 6, 222-233.

91
CHAPTER 3
Role of cell membrane during citric acid exposure of
L. plantarum NCIMB 8826 in enhancing subsequent storage
in fruit juices
3.1. Introduction
From the previous chapter, it was found that adaptation of L. plantarum NCIMB
8826 cells in acidic solutions (HCl & citric acid) at different pH, particularly pH 3 and
4, resulted in better survival during refrigerated storage in fruit juices compared to the
control cells. This improved survival is most likely associated with the fact that LAB,
including lactobacilli, have developed a variety of mechanisms to withstand harsh
conditions, such as low pH. These include the maintenance of ∆pH homeostasis
possibly through the citrate fermentation pathway, the alteration of membrane integrity
and functionality, and the upregulation of proteins relevant to acid adaptation (Wu et
al., 2014). This chapter aims to examine the potential mechanisms of acid exposure on
subsequent cell survival in low pH environments, namely the citrate fermentation
pathway and the compositional and structural changes of the cell membrane.
The citrate fermentation pathway involves the transportation of monovalent
lactate out of the cells by exchanging it with divalent citrate during acid exposure. This
system protects the cell by generating a PMF which can be used for ATP production to
pump protons out of the cell (Pudlik and Lolkema, 2011). Moreover, there is evidence
indicating an increase in citric acid consumption, most likely due to induction of cit
genes including citrate lyase and citrate transporter genes, which has been shown to take
place during growth of Lactococcus lactis under acidic conditions (M17 medium, pH
4.5) (García-Quintáns et al., 1998, Magni et al., 1999, Martı́n et al., 1999, Martín et al.,

92
2004). Although the citrate fermentation pathway has never been reported in
L. plantarum NCIMB 8826, citric acid has been shown to support L. plantarum DSM
20174 growth under acidic conditions (pH 4 to 5) when used in combination with
glucose; though to a lesser extent when used as the sole carbon source (Kennes et al.,
1991). However, the likelihood of the citrate fermentation pathway taking place by
stationary phase cells during highly acidic conditions and its potential link to acid
resistance have not been investigated.
The second potential mechanism involves the overexpression during acid stress of
several genes/operons encoding multiple cell surface proteins; this for example has been
shown to occur during growth of L. plantarum WCFS1 in MRS at pH 4.8 (Pieterse et
al., 2005). Moreover, the striking morphological differences at the surface of acid
stressed and non-stressed L. plantarum WCFS1 cells were observed under SEM by
Ingham et al. (2008). However, the relationship between acid tolerance and surface
proteins has not been investigated in depth.
A third potential mechanism is the alteration of the cell membrane integrity and
functionality, as the basic function of the cell membrane is to protect the cell from the
environment. It is well documented that proton permeability through the cell membrane
is regulated by the membrane fluidity, which depends on the composition of membrane
fatty acids (Lemos et al., 2005, Zhang and Rock, 2008). As the cell membrane of
Lactobacillus species typically consists of saturated, unsaturated and cyclopropane fatty
acids (Johnsson et al., 1995), changes in the ratios of these fatty acids caused by
external stimulants, especially acid stress, could potentially improve cell survival in
adverse conditions including highly acidic environments (Beney and Gervais, 2001).
More specifically, it is well known that upon acid stress LAB decrease their membrane
fluidity by increasing the degree of saturation, the level of cyclopropane formation, and

93
the carbon chain length, and by changing the branching position as well as cis/trans
isomerization of the membrane fatty acids (Montanari et al., 2010). Although these
changes have been observed in many LAB and can be regarded as a universal response
to acid stress, the regulation of the genes involved in membrane homeostasis of fatty
acid biosynthesis, which is the main controlling system in response to acid stress, is not
well characterized. To this end, the upregulation of only a small number of specific
genes has been investigated in LAB. Two studies have shown the overexpression during
acid stress of the cfa gene in L. plantarum KR6 (Seme et al., 2015) and of the
β-ketoacyl-acyl carrier protein synthase III (fabH) gene in L. bulgaricus (Fernandez et
al., 2008). The cfa gene stimulates the conversion of monounsaturated fatty acids to
their cyclopropane derivatives and the fabH gene is a key enzyme in controlling the
synthesis of saturated fatty acids. Accordingly, these target genes were examined in this
study, with the aim of understanding their role toward cell membrane fatty acid
biosynthesis in L. plantarum NCIMB 8826.
3.2. Materials and methods
3.2.1. Determination of citric and lactic acid concentration by high performance
liquid chromatography (HPLC)
In order to investigate whether the citrate fermentation pathway could have been
activated during acid adaptation or storage in fruit juices, HPLC method was used to
analyse the citric and lactic acid concentrations in three groups of samples including: i)
in acidified solutions (citrate buffer and MRS medium) before and after adding the
cells, ii) in three fruit juices (cranberry, pomegranate, and lemon & lime) upon
inoculation of the cells and at the end of the storage period, and iii) inside acid adapted
and control cells (both from acidified solutions & fruit juices).

94
3.2.1.1. Citric and lactic acid determination in acidified solutions and in juices
The citric and lactic acid concentrations were determined in the acidified
solutions used for cell adaptation and also in the supernatants from the fruit juices
(prepared as described in section 2.2.4.1.2 and 2.2.4.1.3, respectively) before and after
adding the cells. More specifically, the citric and lactic acid concentrations were
determined in acidified citrate buffer (pH 3, 37 °C, 1 h) and acidified MRS with citric
acid (pH 3, 25 °C, 1 h) before and after adding the cells; 0.1 M PBS (pH 7.3, 37 °C, 1 h)
and unmodified MRS (pH 6.4, 25 °C, 1 h) were used as the controls. Additionally, both
citric and lactic acid were determined in the fruit juices before and after adding the
cells, and then after 72 h of storage for cranberry juice, 5 weeks for pomegranate juice
and 6 weeks for lemon & lime juice. The concentrations of citric and lactic acid were
analysed using an Agilent 1100 HPLC system with a ultraviolet detector (Agilent
technologies, UK) according to a previous method (Nualkaekul and Charalampopoulos,
2011). The separation was carried out using a 250 mm x 4.6 mm x 5 μm organic acid
column (PrevailTM, Alltech, UK). A solution of 25 mM potassium dihydrogen
phosphate (KH2PO4) at pH 2.5 was used as the mobile phase and the flow rate was set
at 1 ml/min. The organic acids were detected at 210 nm. Samples were analysed in
triplicate. A calibration curve was constructed for each organic acid using standards
with different concentrations (5 to 300 mM for each organic acid).
3.2.1.2. Determination of intracellular citric and lactic acid concentrations
The intracellular citric and lactic acid concentrations of the acid adapted and
control cells and of the cells in the fruit juices were determined. The cells were
collected by centrifugation at 3,500 g for 15 min, washed twice with 0.1 M PBS (pH
7.3), and then rapidly quenched with 25 ml of pre-chilled 0.5 mM tricine in 60% (v/v)

95
methanol (Sigma Aldrich, UK) in dry ice. Next, the pellets were collected by
centrifugation at 3,500 g for 15 min and were resuspended in 2.5 ml of sterile distilled
water. Acid-washed 106-mm-diameter glass beads (Sigma Aldrich, UK) were added to
fill about 1/3 of a 2 ml microtube before 1 ml of the cell suspension was added into the
microtube. The samples were disrupted thrice using a Mini-Beadbeater (Biospec, UK)
for 1 min and cooled for 1 min on ice during the breaking process. After cell disruption,
the samples were centrifuged for 10 min at 15,000 g at 4 °C. The supernatants were
transferred to a new sterile 1.5 ml microtube and analysed by HPLC based on the
method described in section 3.2.1.1
3.2.2. Morphological investigation of the surface of acid adapted and control cells
The surface of L. plantarum NCIMB 8826 cells was examined by cryo-SEM in
order to visualize possible changes on the cell surface caused by acid adaptation. To this
end, 25 ml of early stationary phase cells with a concentration of ∼1010 CFU/ml as
described in section 2.2.4.1.1 was incubated in acidified MRS (pH 3, 25 °C, 1 h); the
cells incubated in unmodified MRS (pH 6.4, 25 °C, 1 h) were used as a control. After
1 h incubation, the pellets were harvested by centrifugation at 3,500 g for 15 min,
washed twice with 0.1 M PBS (pH 7.3), and transferred into a microtube. The pellets
were mounted onto a copper holder with colloidal graphite and plunged into liquid
nitrogen. The frozen specimens were then loaded into a transfer chamber where they
were fractured with a cold scalpel blade. The specimens were etched at -90 °C for
10 min and coated by sputtered argon. They were then transferred under vacuum onto
the cold stage and imaged using a high vacuum field emission SEM (QUANTA 600F,
FEI, USA). The images were captured and analysed by the xT microscope control
software.

96
3.2.3. Determination of cellular fatty acid composition
In order to evaluate the potential effect of the acid adaptation and the combinatory
effect of acid and cold adaptation on the membrane composition, the concentrations of
intracellular fatty acids in the adapted and control cells at different pH (pH 3.0 and 6.4)
and temperatures (4 and 37 °C) were determined by gas chromatography using a
mixture of fatty acids from 9 to 20 carbons in length and five hydroxyl acids as external
standards (Sherlock MIS System, MIDI Inc, USA). To this end, 50 ml of early
stationary phase cells with a concentration of ∼1010 CFU/ml, obtained as described in
section 2.2.4.1.1, were incubated in MRS (pH 3.0 and pH 6.4, 1 h at 25 °C) and
acidified citrate buffer (pH 3, 3 h at 4 and 37 °C); in all cases citric acid was used to
acidify the solutions. After incubation, the pellets were harvested by centrifugation at
3,500 g for 15 min, washed twice with 0.1 M PBS (pH 7.3), and frozen at -80 οC
overnight before freeze drying (VirTis BenchTop™ K Series, SP Scientific, UK).
Finally, the freeze-dried samples were sent to the Deutsche Sammlung von
Mikroorganismen und Zellkulturen (DSMZ) in Braunschweig, Germany fatty acid
analysis. At DSMZ, the fatty acids were extracted from 20 mg of each freeze-dried
sample according to a standard protocol for fatty acid analysis (Miller, 1982,
Kuykendall et al., 1988). The mixtures of fatty acid methyl esters produced were
analysed using the Hewlett-Packard 5898A microbial identification system (Microbial
ID Inc, USA) equipped with a gas chromatography system (Hewlett-Packard model
5980), a flame ionization detector (Hewlett-Packard models 3392), and an autosampler
(Hewlett-Packard models 7673). The detection was performed using a 25 m x 0.2 mm
5% phenylmethyl silicone capillary column. All peaks were automatically integrated
and the percentages of each fatty acid were calculated.

97
3.2.4. Gene expression analysis by reverse transcription-polymerase chain
reaction (RT-PCR)
In an effort to support the results obtained from the intracellular fatty acid
analysis, the level of gene expression between adapted (pH 3) and control cells (pH 6.4)
during citric acid adaptation was evaluated by RT-PCR. cfa and fabH were selected as
the target genes while the 16S rRNA gene was used as the reference gene in this study
because it is one of the housekeeping genes (5 gene copies) which exhibit constant
RNA transcription in L. plantarum NCIMB 8826 cells (Lee et al., 2008). It needs to be
noted that cfa was selected to evaluate the level of cyclopropanation, as it catalyzes the
conversion of the cis-double bond of unsaturated fatty acids to the cyclic ring of their
cyclopropane derivatives; for example oleic acid (C18:1w9c) and cis-vaccenic acid
(C18:1w7c) are converted to dihydrosterculic acid (C19cyclow9c) and lactobacillic acid
(C19cyclow9c), respectively (Johnsson et al., 1995). fabH was selected to evaluate the
synthesis of straight chain fatty acids as this enzyme plays an important role in the first
step of the elongation process of fatty acids. Consequently, the upregulation of this gene
reflects the amount of saturated fatty acids being produced, as depicted in figure 3.1.

98
Figure 3.1 Conserved pathway for the formation of fatty acid in bacteria. a) The first step in fatty acid synthesis is the conversion of acetyl-CoA to malonyl-CoA by acetyl-CoA carboxylase (ACC). Next, the malonyl group is transferred to acyl carrier protein (ACP) by malonyl transacylase (FabD). Then, condensation is initiated by FabH to form the first β‑ketoacyl-ACP intermediate. b) The second step, chain elongation, is continued and repeated by serial enzymatic reactions using; i) β-ketoacyl-ACP reductase (FabG), ii) β‑hydroxyacyl-ACP dehydrase (FabA or FabZ), iii) enoyl-ACP reductase (FabI) until the long chain ACP end product is obtained. c) The long chain ACP end product is finally inserted into the membrane phospholipid by acyl transferase via the PlsX–PlsY pathway (Zhang and Rock, 2008).

99
3.2.4.1. Design of primers for RT-PCR
Primer-BLAST, a free primer designing tool (http://www.ncbi.nlm.nih.gov/
tools/primer-blast/), was used to design the specific primers for the targeted genes. After
obtaining the results, each pair of designed primers was checked for their specificity
toward the genome of L. plantarum WCFS1 using NCBI Blastn
(http://blast.ncbi.nlm.nih.gov/Blast.cgi). Furthermore, the primer dimer and hairpin
structure were calculated by OligoEvaluator (http://www.oligoevaluator.com/Login.jsp)
before the PCR experiments were performed.
3.2.4.2. Preparation of samples for RNA extraction
The pellets of adapted (pH 3, 25 °C, 1 h) and control cells (pH 6.4, 25 °C, 1 h)
prepared as described in section 3.2.3 were used for RNA extraction. Importantly, prior
to RNA extraction, these cell pellets needed to be treated with 25 ml of RNA
stabilization reagent (RNAlater, Qiagen, UK) in order to prevent RNA degradation, as
gene expression studies require high quantity of RNA. The stabilized cells were
collected by centrifugation at 3,500 g for 15 min. They were then resuspended in 2.5 ml
nuclease free water (Qiagen, UK) and then 1 ml of this cell suspension was transferred
into a 2 ml microtube containing acid-washed 106-mm-diameter glass beads. The
samples were disrupted thrice by a Mini-Beadbeater following the method described in
section 3.2.2. After cell breaking, the aqueous phase was collected by centrifugation for
10 min at 15,000 g (4 °C) and transferred into a new sterile 1.5 ml microtube. The RNA
of each sample was isolated using RNeasy Mini Kit (Qiagen, UK) according to the
manufacturer’s instructions. All RNA preparations were treated with RNase-free DNase
for 20 min at 37 °C during mRNA extraction. Finally, the RNA pellet was dissolved in
20 µl of nuclease-free water and stored at -20 °C until use. The concentration and purity

100
of each RNA sample were determined using NanoDrop ND-1000 (Thermo Scientific,
UK).
3.2.4.3. RT-PCR quantification
By real time RT-PCR, the genes of interest including the reference gene (Table
3.1) were amplified using QuantiFast SYBR Green RT-PCR Kit (Qiagen, UK). Three
concentrations of mRNA (1:10, 1:100, and 1:1000 dilutions) were used as the template
for each set of primers. The amplification was run in triplicate for each sample in white
96 well plates (Roche Applied Science) using the LightCycler® 480 RT- PCR system.
Before the RT-PCR products were analysed, preliminary RT-PCR experiments were
conducted by making a 10 fold serial dilution of the extracted mRNA to set up the
optimum reaction for amplifying the target genes. Reactions were carried out in a total
volume of 25 µl, containing 2 µl of mRNA, 1 µl of each primer (0.01 nM), 12.5 µl of
2X QuantiFast SYBR Green RT-PCR Master Mix, 0.25 µl of QuantiFast RT Mix and
8.25 µl of RNase free water. A non-template control was included in each run to
identify possible DNA contamination. The RT-PCR cycler conditions were set as
follows: Reverse transcription at 50 °C for 10 min, PCR initial activation step at 95 °C
for 5 min, followed by 35 cycles of denaturation at 95 °C for 10 sec, annealing at 60 °C
for 30 sec, and elongation with measurement of fluorescence at 72 °C for 30 sec. The
cycles were followed by a melting curve analysis at 95 °C for 1 min, 55 °C for 30 sec,
and a slow increase to 95 °C with continuous fluorescence acquisition. The relative
expression ratio of each candidate gene was determined by comparison with the
expression levels of the reference gene. The RT-PCR efficiency (E) for each pair of
primers was calculated by using serial 1:10 dilutions of mRNA of the LightCycler®480
RT- PCR System.
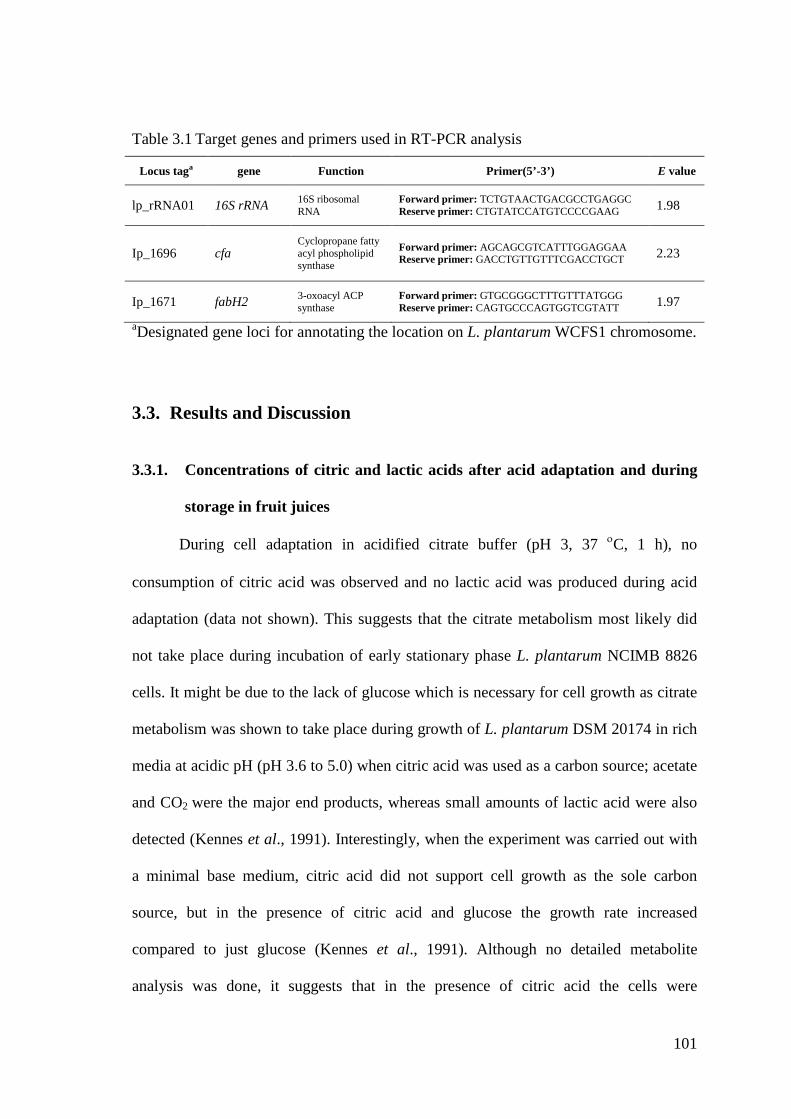
101
Table 3.1 Target genes and primers used in RT-PCR analysis
Locus taga gene Function Primer(5’-3’) E value
lp_rRNA01 16S rRNA 16S ribosomal RNA
Forward primer: TCTGTAACTGACGCCTGAGGC Reserve primer: CTGTATCCATGTCCCCGAAG 1.98
Ip_1696 cfa Cyclopropane fatty acyl phospholipid synthase
Forward primer: AGCAGCGTCATTTGGAGGAA Reserve primer: GACCTGTTGTTTCGACCTGCT 2.23
Ip_1671 fabH2 3-oxoacyl ACP synthase
Forward primer: GTGCGGGCTTTGTTTATGGG Reserve primer: CAGTGCCCAGTGGTCGTATT 1.97
aDesignated gene loci for annotating the location on L. plantarum WCFS1 chromosome.
3.3. 19BResults and Discussion
3.3.1. 57BConcentrations of citric and lactic acids after acid adaptation and during
storage in fruit juices
During cell adaptation in acidified citrate buffer (pH 3, 37 οC, 1 h), no
consumption of citric acid was observed and no lactic acid was produced during acid
adaptation (data not shown). This suggests that the citrate metabolism most likely did
not take place during incubation of early stationary phase L. plantarum NCIMB 8826
cells. It might be due to the lack of glucose which is necessary for cell growth as citrate
metabolism was shown to take place during growth of L. plantarum DSM 20174 in rich
media at acidic pH (pH 3.6 to 5.0) when citric acid was used as a carbon source; acetate
and CO2 were the major end products, whereas small amounts of lactic acid were also
detected (Kennes et al., 1991). Interestingly, when the experiment was carried out with
a minimal base medium, citric acid did not support cell growth as the sole carbon
source, but in the presence of citric acid and glucose the growth rate increased
compared to just glucose (Kennes et al., 1991). Although no detailed metabolite
analysis was done, it suggests that in the presence of citric acid the cells were

102
potentially able through the citrate fermentation pathway to expel the lactic acid
(produced through glycolysis) faster, thus increasing growth rate; this was shown to
take place following a similar experiment with Lactococcus lactis CRL 264 (Magni et
al., 1999). Taking the above into account and the citrate and lactate results from the acid
adaptation experiment, in which the buffer used did not contain additional carbon rich
nutrients, it can be deduced that acid adaptation alone is insufficient to activate citrate
fermentation pathway, but growth under acidic condition in presence of citric acid
maybe required. That is, early stationary phase cells did not use the citrate fermentation
pathway as no lactic acid was being produced, and the citrate fermentation pathway is a
PMF-generating pathway associated specifically with lactic acid toxicity (Magni et al.,
1999).
To evaluate whether using a rich medium to carry out the acid adaptation would
induce the citrate fermentation pathway, the cells were exposed to acidified MRS (pH 3,
25 οC, 1 h), containing substantial levels of carbon sources (20 g/l glucose) and nitrogen
(10 g/l peptone; 8 g/l Lab-Lemco’ powder, 4 g/l yeast extract). The results show that
there were no significant differences in citric and lactic acid concentration between the
different MRS samples (MRS with no cells at pH 6.4 versus MRS with cells at pH 6.4
versus MRS with cells at pH 3.0) (data not shown); this indicated that citrate
fermentation was not activated even in the case of MRS, which contained glucose.
Overall, the two sets of experiments presented above demonstrated that the citrate
fermentation did not take place during acid adaptation and therefore this mechanism did
not contribute toward acid tolerance in L. plantarum NCIMB 8826 cells.
In the case of fruit juices, no significant change in the concentration of citric
acid was observed during storage, whereas lactic acid was not detected in any of the
samples (Table 3.2), indicating that citrate fermentation most likely did not take place

103
during storage in fruit juices as well. In order to confirm this, the concentrations of citric
and lactic acid were also measured inside the cells, primarily to evaluate whether small
amounts of citric acid were transported inside the cells and whether glycolysis was
taking place, which potentially could have resulted in the intracellular production of
lactic acid. No citric and lactic acid were detected inside the cells, although a number of
additional unknown peaks were detected in the case of acid adapted cells (data not
shown), suggesting that the cells could have responded to acid adaptation through the
accumulation of some small organic compounds. These were most likely not formic
acid, butyric acid, caproic acid, oxalic acid and malic acid as the retention times of the
unknown peaks were different to the retention times expected for these compounds with
this particular column. It was not possible however to identify the compounds with the
existing HPLC system. Liquid chromatography mass spectrometry would be required
for identification, which was not available. Nevertheless, based on qualitative analysis
of the chromatograms and comparisons of the retention times with the literature, it is
likely that one of these compounds was pyruvic acid, which suggests that possibly some
low metabolic activity was taking place during storage of the cells.
The analysis of the citric acid content of the three juices indicated that the lemon
& lime juice contained the highest amount of citric acid (~30 mM) followed by
pomegranate (~29 mM) and then cranberry juice (~15 mM) (Table. 3.2), while no lactic
acid was detected in all cases (data not shown). Besides citric acid, other organic acids
are likely to be present, such as malic and ascorbic acid, as shown by previous analysis
of the same fruit juices including cranberry and pomegranate (Nualkaekul and
Charalampopoulos, 2011). Previous work by Nualkaekul and Charalampopoulos (2011)
demonstrated that increasing the concentration of citric acid in the synthetic media
enhanced the survival of L. plantarum NCIMB 8826 during storage, although other

104
factors played a role as well, such as the pH and the sugar concentration. It is interesting
to note that the citric acid concentration did not decrease during storage in those
experiments either. Taking into account the survival data from the three juices, it seems
that the higher the citric acid concentration in the juice the better the cell survival. This
suggests a protective effect of citric acid which is even more evident when comparing
the cell survival in cranberry and lemon & lime juices, as both juices had similar pH
(~ 2.5) yet distinctly different citric acid concentration.
In summary, the citrate fermentation pathway was not implicated in the acid
tolerance of L. plantarum NCIMB 8826 cells, as no changes were observed in the
concentrations of lactic and citric acids after adapting the cells with either acidified
solution. Nonetheless, high amounts of citric acid in fruit juices help improve the
survival of L. plantarum NCIMB 8826 during storage in fruit juices, which is in
accordance with the literature, indicating that citric acid plays a role in enhancing the
acid tolerance of the cells; however, currently there is limited understanding of the
mechanism.
Table 3.2 Extracellular concentrations of citric acid during refrigerated storage at 4 °C in three different juices. Results are expressed in mean ± SD (n=3). Significant differences of citric concentration among each fruit juice were determined by one-way Anova and Tukey’s post-hoc tests. *indicates significant differences among fruit juices.
Juices Time
Extracellular citric acid concentration (mM)
Without cells With control cells
With adapted cells
Cranberry* 0 h 15.23±0.27 15.09±0.25 15.02±0.20 72 h 14.84±0.23 15.33±0.34 15.22±0.15
Pomegranate* Week 0 28.84±0.16 28.53±0.18 28.76±0.17 Week 5 28.75±0.13 28.71±0.15 28.69±0.11
Lemon & lime* Week 0 30.30±0.31 30.41±0.17 30.34±0.36 Week 6 30.42±0.16 30.37±0.08 30.34±0.07

105
3.3.2. Morphological investigation of the cell surface of acid adapted and control
cells
After acid adaptation in acidified MRS (pH 3, 25 οC, 1 h), the surface of adapted
cells became rougher and thicker while the control cells exhibited a smooth surface
(Figure 3.2).
Figure 3.2 Cryo-SEM images of L. plantarum after incubation in MRS at pH 6.4, 25 °C for 1 h (control cells, A) and MRS at pH 3, 25 °C for 1 h (acid adapted cells, B).
Interestingly, the rough surface of L. plantarum WCFS1 due to acid stress were
previously reported in the studies of Pieterse et al. (2005) and Ingham et al. (2008),
which showed that after lactic acid stress, the surface of L. plantarum WCFS1 became
rougher. In the case of the former study, acid stress was performed using steady state
cells obtained during a continuous fermentation set up; the medium used was MRS (pH
4.8, 37 °C) and the dilution rate was 0.3/h. In the latter study the acid adapted cells were
obtained from microcolonies after transferring mid-log phase cells from liquid broth at
pH 5 to MRS gel (pH 3, 37 °C, 3 days). Based on Pieterse et al. (2005), the rough
surface observed in acid stressed cells was associtated with the upregulation of three
operons/genes encoding for cell surface proteins but their functions were not identified.
A B

106
Although the functions of these cell surface proteins are unknown, the majority of them
are likely to be attached to the cell wall surfaces, i.e. as s-layer, peptidoglycan, and cell
membrane, through several mechanisms (Siezen et al., 2006). These include: i) covalent
binding to amino- or carboxyl-terminus membrane-spanning anchors, ii) covalent
binding to the LPxTG motif (Leucine-Proline-any-Threonine-Glycine), iii) covalent
binding to lipid-bound anchors and iv) non-covalently bound to a variety of domains
linked to peptidoglycan, teichoic acids, s-layer, surface polysaccharides and cell
membrane. From all the mechanisms mentioned above, the non-covalent binding to cell
wall glycopolymer (CWG), particularly wall teichoic acid, seems to be a likely
mechanism leading to acid protection as teichoic acid plays an essential role in
controlling the influx of positively-charged substances through the complex
peptidoglycan network (Kovacs et al., 2006, Perea Velez et al., 2007, Giaouris et al.,
2008, Weidenmaier and Peschel, 2008, Swoboda et al., 2010) and it also controls cell
morphogenesis and particularly surface roughness, as shown for L. plantarum (Andre et
al., 2011).
According to the image of the acid adapted cells (Figure 3.2 B) a rough coat-like
structure is visible; besides surface proteins, this might be an EPS, particularly a
capsular exopolysaccharide (CPS) which is secreted outside the cells but is able to form
a tightly adherent cohesive layer surrounding the cell surface. According to Ruas-
Madiedo et al. (2002) and Nwodo et al. (2012), EPS and CPS can potentially protect the
cells against a variety of harsh environments such as desiccation, influx of antibiotics
and toxins, and osmotic stress. Although there are several reports about EPS production
by L. plantarum (Desai et al., 2006, Mostafa et al., 2006, Nagata et al., 2009, Tsuda et
al., 2008, Wang et al., 2010), none of these have investigated their function against acid
stress. However, it is important to note that despite the visible effects of citric acid on

107
the cell surface, no membrane injury or damage was observed due to citric acid
adaptation. In contrast, this was reported for the cell membrane of L. casei strain Zhang,
which became thinner and impaired after exposure of the cells to lactic acid at pH 3.5
for 1 h (Wu et al., 2012).
A possible hypothesis for the improved survival of acid adapted cells in fruit
juices is that their thicker surface, potentially as a result of the binding of overexpressed
surface proteins at the cell wall and particularly the teichoic acid component or due to
the production of EPS and CPS, decreased the influx of hydrogen protons inside the
cells. This may also explain why in the case of prolonged storage (after 3 weeks in
pomegranate and lemon & lime juices) the survival profile was similar between acid
adapted and control cells, indicating that the change in morphology of the cell surface
was not permanent. This could be due to the fact that the binding of the surface proteins
to the wall was becoming less strong or that the EPS and CPS were eroded and released
into the juices. However, microscopic analysis of the cell surface during storage in the
juices was not conducted and therefore this cannot be confirmed. Overall, more work,
including compositional analysis of the cell surface, e.g. by X-ray photoelectron
spectroscopy, nuclear magnetic resonance and X-ray crystallography, are needed to
elucidate the potential changes at the surface of the cells and establish the link with acid
resistance.
3.3.3. Modification of membrane fluidity by alteration of the cell membrane fatty
acid composition
The total amount of saturated fatty acid increased by ~2.3% (cyclopropane is not
included in the calculations) after acid adaptation whereas the unsaturated fatty acids
decreased by ~1.3% (Table 3.3). However, these changes were not statistically

108
significant leading to the conclusion that the degree of saturation/unsaturation of
membrane fatty acids did not change during acid adaptation and therefore did not
influence the survival of L. plantarum NCIMB 8826 during storage in fruit juices.
Table 3.3 Relative percentages of cellular fatty acids after incubation of L. plantarum cells in control MRS (25 °C, pH 6.4, 1 h)a and acidified MRS (25 °C, pH 3, 1 h)b.
Systematic nomenclature Lipid number
Percentage of cellular fatty acids
Control cellsa
Acid adapted cellsb
Tetradecanoic acid methyl ester 14:0 4.82±0.62 3.63±0.02 cis-9-Hexadecenoic acid methyl ester 16:1w7c 8.10±1.31 6.33±0.10 Hexadecanoic acid methyl ester 16:0 25.86±1.39 24.74±0.58 cis-9-Heptadecenoic acid methyl ester 17:1w8c 0.83±0.06 0.71±0.01 cis-9-Octadecenoic acid methyl ester 18:1w9c 11.40±1.32 11.06±0.11 cis-11-Octadecenoic acid methyl ester 18:1w7c 15.46±2.43 13.73±0.01 Octadecanoic acid methyl ester 18:0 1.24±0.51 1.26±0.14 cis-13-Nonadecenoic acid methyl ester 19:1 w6c 25.65±0.21 27.32±1.06 cis-11,12-Methylene octadecanoic acid methyl ester 19:0 cycw7c 6.39±0.41 10.22±0.69*
*indicates significant difference to control cells (p<0.05)
The major fatty acids of L. plantarum NCIMB 8826 were myristic acid (C14:0),
palmitic acid (C16:0), palmitoleic acid (C16:1w7c), oleic acid (C18:1w9c), cis-vaccenic acid
(C18:1w7c) and nonadecenoic acid (C19:1). These acids constituted about 90% of the total
fatty acids content, which is similar to the fatty acid composition previously reported for
L. plantarum 2004, with the main exception being the presence of nonadecenoic acid
(C19:1) (Johnsson et al., 1995). The role of membrane fatty acid composition of LAB in
acid stress response has been the subject of a number of studies; however, the results
have been contradictory. The general hypothesis is that by modifying their membrane
fatty acid composition the cells are able to adjust their membrane viscosity to respond to
environmental stimuli (Guerzoni et al., 2001, Streit et al., 2008, Montanari et al., 2010,
Wu et al., 2012). More specifically, in the case of acid stress, the cells should reduce

109
their membrane fluidity to protect the cytoplasm from the influx of hydrogen protons by
either increasing the degree of saturation or decreasing the degree of unsaturation of the
membrane fatty acids. The reasoning is that saturated fatty acids are linear and tightly
pack together resulting in the production of a bilayer which has a high phase transition
and low permeability, while the cis-double bond unsaturated fatty acids introduce a
twist in the chain, which disrupts the order of the bilayer and leads to lower transition
temperatures and higher permeability (Zhang and Rock, 2008). However, as mentioned
above, the expected changes in the membrane fatty acid composition were not observed
in this study (although a trend was observed suggesting an increase in the total saturated
and a decrease in the total unsaturated fatty acids). The discrepancies observed in the
published work could be attributed to differences in the intrinsic properties of the strains
used, low accuracy and reproducibility in fatty acid analysis, as well as considerable
differences in the experimental designs. For example some studies carried out acid
stress experiments under growth conditions (at low pH or non-controlled pH), whereas
others under non growth conditions in buffer solutions or media.
Interestingly, the fatty acid analysis indicates that the relative concentration of
the cyclopropane fatty acid, cis-11,12-methylene octadecanoic acid (C19cyclow7c) which
was generally known as lactobacillic acid, significantly increased (from ~ 6% to ~ 10%)
in the acid adapted cells compared to the control cells (Table 3.3). Although there are
two cyclopropane fatty acids, dehydrosterculic acid (cis-9,10-methylene octadecanoic
acid, C19cyclow9c) and lactobacillic acid, which are normally found at high percentages in
LAB after acid stress and cold stress (Montanari et al., 2010), only lactobacillic acid
was detected in this study. According to Broadbent et al. (2010) and Wu et al. (2014),
cyclopropane fatty acids are very important in controlling the biophysical properties of
the cell membrane. An increase in cyclopropane due to acid stress was also observed

110
previously in L. casei strain Zhang (Wu et al., 2012). More specifically, the survival of
L. casei strain Zhang was compared with mutants (obtained by serial sub-culturing the
L. casei strain Zhang cells in MRS medium at pH of 4.3 for 70 days) in MRS acidified
with HCl (pH 3), MRS acidified with lactic acid (pH 3.5), and simulated gastric juice
(pH 2.5) for 0 to 2.5 h. The mutant strains showed better survival in the acidified
solutions than the parental strain due to a higher amount of cyclopropane (octadecanoic
acid, C19cyclo) (3% to 9% higher at pH 3.5, from 0 to 1 h). Considering the results of this
study in conjunction with the previous work with lactobacilli, it can be assumed that the
increase in cyclopropane fatty acid in L. plantarum NCIMB 8826 improved cell
survival during storage in the fruit juices by lowering the cell membrane fluidity which
helps reducing the proton influx into the cells. Moreover, an increase in the
cyclopropane content of L. plantarum DSM 10492 during growth at pH 5.5 in the
presence of some phenolic compounds, such as caffeic acid, ferulic acid and tannin in
the growth medium was observed in previous work (Rozes and Peres, 1998). It is
possible to deduce that the increased levels of cyclopropane in the cell membrane not
only reduce proton influx but also protect the cells from the phenolic compounds
present in the fruit juices.
In the case of the combined acid and cold adaptation, the content of unsaturated
and saturated fatty acids between the two treatments was very similar (Table 3.4), with
the exception of a statistically significant increase in cyclopropane (lactobacillic acid,
C19cyclow9c) for acid adapted cells at 4 °C, although the absolute values were similar
(9.8% versus 10.1%). A likely hypothesis that has been suggested to explain the
influence of temperature is that in order for the cell membrane to function efficiently at
low temperatures, the cells can potentially decrease the membrane fluidity by increasing
the amount of unsaturated fatty acids (Aguilar et al., 1998, Deshnium et al., 2000). On

111
the other hand, it was seen in this and other studies that in acidic conditions, the cells
can reduce the membrane fluidity by increasing the levels of saturated fatty acids and
cyclopropane, in order to circumvent the influx of hydrogen protons inside the cells
(Streit et al., 2008, Álvarez-Ordóñez et al., 2008, Alonso-Hernando et al., 2010). It
appears that under highly acidic conditions, as those used in this study, the acid
adaptation response is more important than cold adaptation, as overall the fatty acid
compositions of acid adapted cells at 4 and 37 °C were very similar. This is consistent
with the results presented in section 2.3.5 showing the survival of acid adapted cells (at
the two temperatures) in fruit juices with similar patterns.
Table 3.4 Relative percentages of cellular fatty acids after incubation of L. plantarum cells in acidified citrate buffer (pH 3, 3 h) at 4 and 37 °C.
Systematic nomenclature Lipid numbers
Percentage of cellular fatty acids
Acid adapted cells at 37 °C
Acid adapted cells
at 4 °C
Tetradecanoic acid methyl ester 14:0 3.03±0.01 3.06±0.04 cis-9-Hexadecenoic acid methyl ester 16:1w7c 5.39±0.14 5.53±0.12 Hexadecanoic acid methyl ester 16:0 24.02±0.07 24.04±0.43 cis-9-Heptadecenoic acid methyl ester 17:1w8c 0.55±0.01 0.58±0.12 cis-9-Octadecenoic acid methyl ester 18:1w9c 8.36±0.02 8.48±0.02
cis-11-Octadecenoic acid methyl ester 18:1w7c 15.90±0.15 15.60±0.26 Octadecanoic acid methyl ester 18:0 1.52±0.01 1.45±0.02 cis-13-Nonadecenoic acid methyl ester 19:1 w6c 28.76±0.42 28.52±0.08 cis-11,12-Methylene octadecanoic acid methyl ester 19:0 cycw7c 9.76±0.03 10.05±0.03*
*indicates significant difference to control cells (p<0.05)
3.3.4. Gene expression analysis by RT-PCR
The cfa mRNA expression levels increased by approximately 12 fold after the
cells were adapted in acidified MRS (pH 3, 25 °C, 1 h), relative to the control MRS (pH
6.4, 25 °C, 1 h). This increase in cfa mRNA is consistent with the results in table 3.3,
which showed that in the acid adapted cells the concentration of cis-11,12-

112
methyleneoctadecanoic acid methyl ester (lactobacillic acid) increased from 6.4% to
10.2% and that of cis-11-octadecenoic acid methyl ester (cis-vaccenic acid) decreased
from 15.46% to 13.73% compared with the control cells. These results demonstrate the
significant role of cfa in the process of acid adaptation. The induction of the cfa gene
under low pH was also observed in previous work with Lactococcus lactis MG 1363
(Budin-Verneuil et al., 2005) and L. plantarum KR6 (Seme et al., 2015), although a
different experimental set up was used. More specifically, the amount of cfa mRNA in
Lactococcus lactis MG 1363 determined by Northern blot analysis was higher when the
cells were grown in HCl acidified M17 medium (pH 5, 30 min) compared to cells
grown in control M17 medium (pH 7, 30 min). Upregulation of the cfa gene was shown
for L. plantarum KR6 cells exposed to HCl acidified MRS (pH 4.5 and 2.5, 30 min)
compared to control MRS (pH 7, 30 min).
In respect to the fabH gene, it was found that the levels of fabH mRNA
increased 6 fold after acid adaptation, although this difference was not statistically
significant. This increase is in accordance to the study by Fernandez et al. (2008), who
reported that the level of fabH in L. bulgaricus cells increased 15 fold after being
exposed to MRS acidified with lactic acid to pH 3.8, and subsequently incubated in
MRS (pH 4.9 with lactic acid, 40 min). These suggest that an increase in straight chain
saturated fatty acids should take place during acid adaptation in lactobacilli; however,
the upregulation of fabH gene did not coincide with the saturated fatty acid profiles data
between acid adapted and control cells (Table 3.3) as no significant differences were
observed. This discrepancy might be due to the overexpression of cfa gene which
utilised newly synthesised unsaturated fatty acids for cyclopropane production as
mentioned above. Overall, the straight chain saturated fatty acids were synthesized in

113
L. plantarum NCIMB 8826 during acid adaptation but were converted to cyclopropane
by cfa gene.
3.4. Conclusions
In summary, the results from this part of the work indicate that the response of
L. plantarum NCIMB 8826 cells to short acid adaptation with citric acid did not involve
the citrate fermentation pathway, which has been reported for Lactococcus lactis, as the
citric acid was not metabolized and no lactic acid production was observed. In terms of
cell morphology, the cell surface became rougher and thicker after exposure to acidic
conditions, which indicates a possible overexpression of surface proteins or the
production of EPS at the cell surface, resulting in a stronger cell wall with increased
ability to inhibit the influx of hydrogen protons inside the cells during storage in fruit
juices. Membrane fatty acid analysis indicated that the cyclopropane fatty acid cis-
11,12-methylene octadecanoic acid (C19cycw7c) content (expressed as percentage of total
fatty acids) increased significantly (p<0.05) by about 1.67 fold during acid adaptation;
this coincided with a significant upregulation (12 fold) of the cfa gene. No statistically
significant (p>0.05) change in the degree saturation/unsaturation of the membrane fatty
acids was observed in response to acid adaptation, although a trend showing an increase
in total saturated fatty acids and a decrease in total unsaturated fatty acids was noted.
Considering these results, it is likely that changes in the membrane fatty acid
composition, particularly the increase in cyclopropane, in combination with changes in
the call wall structure (potentially linked to the overexpression of surface proteins)
enhanced the survival of acid adapted cells in the fruit juices. In order to investigate
further the possible contribution of these mechanisms to the acid tolerance of the cells,
proteomic analysis conducted by 2D-gel electrophoresis and mass spectrometry, as well

114
as intracellular analysis of amino acids was conducted. These experiments are presented
and discussed in chapter 4.
3.5. References
AGUILAR, P. S., CRONAN, J. E. & DE MENDOZA, D. 1998. A Bacillus subtilis gene induced by cold shock encodes a membrane phospholipid desaturase. Journal of Bacteriology, 180, 2194-2200. ALONSO-HERNANDO, A., ALONSO-CALLEJA, C. & CAPITA, R. 2010. Effects of exposure to poultry chemical decontaminants on the membrane fluidity of Listeria monocytogenes and Salmonella enterica strains. International Journal of Food Microbiology, 137, 130-136. ÁLVAREZ-ORDóñEZ, A., FERNáNDEZ, A., LóPEZ, M., ARENAS, R. & BERNARDO, A. 2008. Modifications in membrane fatty acid composition of Salmonella typhimurium in response to growth conditions and their effect on heat resistance. International Journal of Food Microbiology, 123, 212-219. ANDRE, G., DEGHORAIN, M., BRON, P. A., VAN SWAM, I. I., KLEEREBEZEM, M., HOLS, P. & DUFRêNE, Y. F. 2011. Fluorescence and atomic force microscopy imaging of wall teichoic acids in Lactobacillus plantarum. ACS Chemical Biology, 6, 366-376. BENEY, L. & GERVAIS, P. 2001. Influence of the fluidity of the membrane on the response of microorganisms to environmental stresses. Applied Microbiology and Biotechnology, 57, 34-42. BROADBENT, J. R., LARSEN, R. L., DEIBEL, V. & STEELE, J. L. 2010. Physiological and transcriptional response of Lactobacillus casei ATCC 334 to acid stress. Journal of Bacteriology, 192, 2445-2458. BUDIN-VERNEUIL, A., MAGUIN, E., AUFFRAY, Y., EHRLICH, S. D. & PICHEREAU, V. 2005. Transcriptional analysis of the cyclopropane fatty acid synthase gene of Lactococcus lactis MG1363 at low pH. FEMS Microbiology Letters, 250, 189-194. DESAI, K., AKOLKAR, S., BADHE, Y., TAMBE, S. & LELE, S. 2006. Optimization of fermentation media for exopolysaccharide production from Lactobacillus plantarum using artificial intelligence-based techniques. Process Biochemistry, 41, 1842-1848. DESHNIUM, P., PAITHOONRANGSARID, K., SUPHATRAKUL, A., MEESAPYODSUK, D., TANTICHAROEN, M. & CHEEVADHANARAK, S. 2000. Temperature-independent and -dependent expression of desaturase genes in filamentous cyanobacterium Spirulina platensis strain C1 (Arthrospira sp. PCC 9438). FEMS Microbiology Letters, 184, 207-213.

115
FERNANDEZ, A., OGAWA, J., PENAUD, S., BOUDEBBOUZE, S., EHRLICH, D., VAN DE GUCHTE, M. & MAGUIN, E. 2008. Rerouting of pyruvate metabolism during acid adaptation in Lactobacillus bulgaricus. Proteomics, 8, 3154-3163. GARCíA-QUINTáNS, N., MAGNI, C., DE MENDOZA, D. & LóPEZ, P. 1998. The citrate transport system of Lactococcus lactis subsp. lactis biovar diacetylactis is induced by acid stress. Applied and Environmental Microbiology, 64, 850-857. GIAOURIS, E., BRIANDET, R., MEYRAND, M., COURTIN, P. & CHAPOT-CHARTIER, M. P. 2008. Variations in the degree of D-Alanylation of teichoic acids in Lactococcus lactis alter resistance to cationic antimicrobials but have no effect on bacterial surface hydrophobicity and charge. Applied and Environmental Microbiology, 74, 4764-4767. GUERZONI, M. E., LANCIOTTI, R. & COCCONCELLI, P. S. 2001. Alteration in cellular fatty acid composition as a response to salt, acid, oxidative and thermal stresses in Lactobacillus helveticus. Microbiology, 147, 2255-2264. INGHAM, C. J., BEERTHUYZEN, M. & VAN HYLCKAMA VLIEG, J. 2008. Population heterogeneity of Lactobacillus plantarum WCFS1 microcolonies in response to and recovery from acid stress. Applied and Environmental Microbiology, 74, 7750-7758. JOHNSSON, T., NIKKILA, P., TOIVONEN, L., ROSENQVIST, H. & LAAKSO, S. 1995. Cellular fatty acid profiles of lactobacillus and lactococcus strains in relation to the oleic acid content of the cultivation medium. Applied and Environmental Microbiology, 61, 4497-4499. KENNES, C., DUBOURGULER, H. C., ALBAGNAC, G. & NYNS, E. J. 1991. Citrate metabolism by Lactobacillus plantarum isolated from orange juice. Journal of Applied Bacteriology, 70, 380-384. KOVACS, M., HALFMANN, A., FEDTKE, I., HEINTZ, M., PESCHEL, A., VOLLMER, W., HAKENBECK, R. & BRUCKNER, R. 2006. A functional dlt operon, encoding proteins required for incorporation of D-alanine in teichoic acids in gram-positive bacteria, confers resistance to cationic antimicrobial peptides in Streptococcus pneumoniae. Journal of Bacteriology, 188, 5797-5805. KUYKENDALL, L. D., ROY, M. A., O'NEILL, J. J. & DEVINE, T. E. 1988. Fatty acids, antibiotic resistance, and deoxyribonucleic acid homology groups of Bradyrhizobium japonicum. International Journal of Systematic Bacteriology, 38, 358-361. LEE, C. M., SIEO, C. C., ABDULLAH, N. & HO, Y. W. 2008. Estimation of 16S rRNA gene copy number in several probiotic Lactobacillus strains isolated from the gastrointestinal tract of chicken. FEMS Microbiology Letters, 287, 136-141. LEMOS, J. A. C., ABRANCHES, J. & BURNE, R. A. 2005. Responses of cariogenic streptococci to environmental stresses. Current Issues in Molecular Biology, 7, 95-108.

116
MAGNI, C., DE MENDOZA, D., KONINGS, W. N. & LOLKEMA, J. S. 1999. Mechanism of citrate metabolism in Lactococcus lactis: resistance against lactate toxicity at low pH. Journal of Bacteriology, 181, 1451-1457. MARTı́N, M., CORRALES, M. A., MENDOZA, D., LóPEZ, P. & MAGNI, C. 1999. Cloning and molecular characterization of the citrate utilization citMCDEFGRP cluster of Leuconostoc paramesenteroides. FEMS Microbiology Letters, 174, 231-238. MARTíN, M. G., SENDER, P. D., PEIRú, S., DE MENDOZA, D. & MAGNI, C. 2004. Acid-inducible transcription of the operon encoding the citrate lyase complex of Lactococcus lactis biovar diacetylactis CRL264. Journal of Bacteriology, 186, 5649-5660. MILLER, L. T. 1982. Single derivatization method for routine analysis of bacterial whole-cell fatty acid methyl esters, including hydroxy acids. Journal of Clinical Microbiology, 16, 584-586. MONTANARI, C., SADO KAMDEM, S. L., SERRAZANETTI, D. I., ETOA, F. X. & GUERZONI, M. E. 2010. Synthesis of cyclopropane fatty acids in Lactobacillus helveticus and Lactobacillus sanfranciscensis and their cellular fatty acids changes following short term acid and cold stresses. Food Microbiology, 27, 493-502. MOSTAFA, H., DABA, A. & EL-MEZAWY, A. 2006. Screening of potential lactobacilli protein-bound exopolysaccharides. Deutsche Lebensmittel-Rundschau, 102, 62-66. NAGATA, Y., HASHIGUCHI, K., KAMIMURA, Y., YOSHIDA, M. & GOMYO, T. 2009. The gastrointestinal transit tolerance of Lactobacillus plantarum strain no. 14 depended on the carbon source. Bioscience, Biotechnology, and Biochemistry, 73, 2650-2655. NUALKAEKUL, S. & CHARALAMPOPOULOS, D. 2011. Survival of Lactobacillus plantarum in model solutions and fruit juices. International Journal of Food Microbiology, 146, 111-117. NWODO, U. U., GREEN, E. & OKOH, A. I. 2012. Bacterial exopolysaccharides: functionality and prospects. International Journal of Molecular Sciences, 13, 14002-14015. PEREA VELEZ, M., VERHOEVEN, T. L., DRAING, C., VON AULOCK, S., PFITZENMAIER, M., GEYER, A., LAMBRICHTS, I., GRANGETTE, C., POT, B., VANDERLEYDEN, J. & DE KEERSMAECKER, S. C. 2007. Functional analysis of D-alanylation of lipoteichoic acid in the probiotic strain Lactobacillus rhamnosus GG. Applied and Environmental Microbiology, 73, 3595-3604. PIETERSE, B., LEER, R. J., SCHUREN, F. H. & VAN DER WERF, M. J. 2005. Unravelling the multiple effects of lactic acid stress on Lactobacillus plantarum by transcription profiling. Microbiology, 151, 3881-3894.

117
PUDLIK, A. M. & LOLKEMA, J. S. 2011. Citrate uptake in exchange with intermediates in the citrate metabolic pathway in Lactococcus lactis IL1403. Journal of Bacteriology, 193, 706-714. RUAS-MADIEDO, P., HUGENHOLTZ, J. & ZOON, P. 2002. An overview of the functionality of exopolysaccharides produced by lactic acid bacteria. International Dairy Journal, 12, 163-171. ROZES, N. & PERES, C. 1998. Effects of phenolic compounds on the growth and the fatty acid composition of Lactobacillus plantarum. Applied Microbiology and Biotechnology, 49, 108-111. SEME, H., GJURACIC, K., KOS, B., FUJS, S., STEMPELJ, M., PETKOVIC, H., SUSKOVIC, J., BOGOVIC MATIJASIC, B. & KOSEC, G. 2015. Acid resistance and response to pH-induced stress in two Lactobacillus plantarum strains with probiotic potential. Beneficial Microbes, 6, 369-379. SIEZEN, R., BOEKHORST, J., MUSCARIELLO, L., MOLENAAR, D., RENCKENS, B. & KLEEREBEZEM, M. 2006. Lactobacillus plantarum gene clusters encoding putative cell-surface protein complexes for carbohydrate utilization are conserved in specific Gram-positive bacteria. BMC Genomics, 7, 126. STREIT, F., DELETTRE, J., CORRIEU, G. & BEAL, C. 2008. Acid adaptation of Lactobacillus delbrueckii subsp. bulgaricus induces physiological responses at membrane and cytosolic levels that improves cryotolerance. Journal of Applied Microbiology, 105, 1071-1080. SWOBODA, J. G., CAMPBELL, J., MEREDITH, T. C. & WALKER, S. 2010. Wall teichoic acid function, biosynthesis, and inhibition. ChemBioChem, 11, 35-45. TSUDA, H., HARA, K. & MIYAMOTO, T. 2008. Binding of mutagens to exopolysaccharide produced by Lactobacillus plantarum mutant strain 301102S. Journal of Dairy Science, 91, 2960-2966. WANG, Y., LI, C., LIU, P., AHMED, Z., XIAO, P. & BAI, X. 2010. Physical characterization of exopolysaccharide produced by Lactobacillus plantarum KF5 isolated from Tibet Kefir. Carbohydrate Polymers, 82, 895-903. WEIDENMAIER, C. & PESCHEL, A. 2008. Teichoic acids and related cell-wall glycopolymers in Gram-positive physiology and host interactions. Nature Reviews Microbiology, 6, 276-287. WU, C., HUANG, J. & ZHOU, R. 2014. Progress in engineering acid stress resistance of lactic acid bacteria. Applied Microbiology and Biotechnology, 98, 1055-1063. WU, C., ZHANG, J., WANG, M., DU, G. & CHEN, J. 2012. Lactobacillus casei combats acid stress by maintaining cell membrane functionality. Journal of Industrial Microbiology and Biotechnology, 39, 1031-1039.

118
ZHANG, Y.-M. & ROCK, C. O. 2008. Membrane lipid homeostasis in bacteria. Nature Reviews Microbiology, 6, 222-233.

119
CHAPTER 4
Amino acid, GABA, and proteomic analysis of L. plantarum
NCIMB 8826 cells in response to acid adaptation
4.1. Introduction
It has been demonstrated that amino acid metabolism is involved in the ∆pH
homeostasis systems used by LAB during acid stress. For example, the accumulation of
a basic amino acid, such as histidine, intracellularly was reported to protect L. casei
ATCC 334 during acid stress (Broadbent et al., 2010), whereas L. casei strain Zhang
accumulated aspartate and arginine intracellularly during acid stress and metabolised
these to ammonia via the ADI system; this resulted in the generation of ammonia and
thus the alkalization of the cytoplasm that led to enhanced survival at pH 3.5 for 3 h
compared to unstressed cells (Wu et al., 2012, Wu et al., 2013). Moreover, the
conversion of intracellular L-glutamate to GABA, with the concomitant consumption of
a proton via the GAD system has been shown to contribute to the protection of a
number of bacterial cells during acid stress including E. coli (Lin et al., 1995, Castanie-
Cornet et al., 1999), Listeria monocytogenes (Cotter et al., 2001), Lactococcus lactis
(Sanders et al., 1998) and L. reuteri (Su et al., 2011). In order to evaluate the potential
involvement of amino acids and/or GABA in acid adaptation in this study, the
intracellular and extracellular amino acid composition and the concentration of GABA
after acid adaptation were analysed.
Proteomics is a powerful tool that can be used to monitor the overall changes of
proteins throughout the cellular protein network during acid adaptation, including
proteins involved in carbohydrate, lipid and protein metabolisms and stress responses.
Based on 2D-gel electrophoresis, many studies have reported changes in the level of

120
expression of various proteins in lactobacilli during acid stress conditions including
L. acidophilus (Lorca and de Valdez, 2001), L. sanfranciscensis (De Angelis et al.,
2001), L. casei (Wu et al., 2011), L. reuteri (Lee et al., 2008) and L. rhamnosus
(Koponen et al., 2012), although to our knowledge no such studies have been conducted
with L. plantarum. The above proteomic studies have identified a large number of
proteins changing during acid stress including molecular chaperone proteins or stress
proteins, and proteins involved in fatty acid biosynthesis, nucleotide and amino acid
biosynthesis, and peptidoglycan biosynthesis. Among these, the most commonly
identified proteins are stress proteins, particularly the 70-kDa family (DnaK) and the
60-kDa family (GroEL) which play an important role in the folding and/or assembly of
proteins (Hartke et al., 1996, Lim et al., 2000, Wu et al., 2014). On the other hand,
MurA, MurD, and MurG, which are involved in the formation of the peptidoglycan
backbone GlcNAc and MurNAc, and D-alanine-D-ligase which catalysed the assembly
of D-alanyl-D-alanine dipeptide, have been recently reported by Wu et al. (2012)
and Koponen et al. (2012) to be overexpressed in L. casei and L. rhamnosus,
respectively.
As the cell walls of Gram-positive bacteria lack the outer membrane structure of
Gram-negative bacteria, the thick layer of peptidoglycan in Gram positive bacteria,
which contains CWGs, is essential for stabilizing and protecting the cell membrane
from harsh environments (Chapot-Chartier and Kulakauskas, 2014). The major
component of CWGs is a group of molecules called teichoic acids which can be sub-
classified into two groups: WTA which is covalently linked to peptidoglycan, and
lipoteichoic acid (LTA) which is anchored to the cytoplasmic membrane (Swoboda et
al., 2010). More specifically, WTA is covalently linked to the MurNAc component of
peptidoglycan by a disaccharide, while LTA is anchored to the cytoplasmic membrane
121
by a glycolipid. Besides binding to peptidoglycan and cytoplasmic membrane through
these binding methods, the glycerol-phosphate chain structure of both teichoic acids can
also bind to D-alanine via teichoic acid alanylation or D-alanylation, which is catalysed
by the dltABCD operon (Weidenmaier and Peschel, 2008, Brown et al., 2013). The
phosphodiester linkage between the D-alanyl ester residue and sn glycerol 1-phosphate
of teichoic acid results in reducing the negative charge of glycerol 1-phosphate (PO32-)
in the cell envelope, as the protonated amino group of the D-alanyl ester residue can
serve as counterions to the negatively charged phosphate group of the glycerol 1-
phosphate unit of teichoic acid (Neuhaus and Baddiley, 2003). It seems likely that the
more D-alanine is added the more positive charge the cell envelope has. Many cellular
functional roles have been previously suggested for teichoic acid, such as maintenance
cation homeostasis, transportation of ions, nutrients, proteins, and antibiotics, as shown
for Bacillus subtilis (Neuhaus and Baddiley, 2003), control of divalent cation binding
(Mg2+ and Ca2+), as shown for L. buchneri and L. plantarum (Baddiley et al., 1973,
Neuhaus and Baddiley, 2003), regulation of bacterial autolysis by preventing cationic
autolysins binding on the bacterial surface, as shown for Staphylococcus aureus (Schlag
et al., 2010), control of cell morphogenesis, particularly surface roughness, as shown for
L. plantarum (Andre et al., 2011), and adhesion of abiotic surfaces and biofilm
formation via surface-exposed polysaccharide of CWGs as shown L. rhamnosus
(Lebeer et al., 2009). However, the most important function during acid stress is
probably its control of cation binding, as this might help to protect the cells from the
influx of high concentrations of protons. More specifically, this could be attributed to
the binding between D-alanine and teichoic acid, which has been shown in a number of
bacteria (such as Bacillus subtilis, Staphylococcus aureus, L. buchneri, L. plantarum
and L. rhamnosus) to play an essential role in controlling the influx of positively

122
charged substances through the complicated peptidoglycan network (Kovacs et al.,
2006, Perea Velez et al., 2007, Giaouris et al., 2008, Swoboda et al., 2010). The aim of
this chapter was to evaluate the occurrence and potential contribution of the above
mentioned mechanisms toward acid resistance of L. plantarum NCIMB 8826 following
acid adaptation.
4.2. Materials and methods
4.2.1. Amino acid analysis
In order to investigate the potential role of amino acids in protecting the cells
against acidic environment, the concentration of extracellular and intracellular amino
acids were evaluated using the EZ faast™ amino acid analysis kit (Phenomenex, USA)
which does not require any additional treatment for removing the interfering compounds
(as traditional methods do). This method consists of a solid phase extraction step
followed by derivatization and liquid/liquid extraction. After that, the derivatized amino
acids were analysed by Gas Chromatography-Mass Spectrometry (GC-MS).
4.2.1.1. Amino acid analysis of supernatant samples
The supernatants of the adapted (pH 3, 25 οC, 1 h) and control cells (pH 6.4, 25
οC, 1 h) prepared as described in section 3.2.3 were collected for GC-MS analysis.
A 100 µl aliquot of each supernatant including non-inoculated MRS was mixed with
200 µl of solution 2 (sodium carbonate). A 25 µl aliquot of the mixed samples and a 25
µl aliquot of an amino acid standard solution provided with the kit (over 50 amino
acids) were separately loaded into a sample preparation vial and then 100 µl of 200
nM/ml norvaline was added into each sample as an internal standard. For solid-phase
extraction, the samples were slowly filled up and passed through sorbent tips. After that,

123
the samples were washed with 200 µl of HPLC grade water and eluted with 200 µl of
eluting solution (sodium hydroxide and N-propanol; ratio: 3:2). Then, the derivatized
amino acids were extracted by 150 µl of isooctane/chloroform (ratio 1:2) and analysed
by a Clarus 500 GC-MS system (Perkin Elmer, USA). An aliquot (2 µl) of the
derivatized amino acid solution was injected at 250 °C in split mode (5:1) onto a 0.25
mm x 10 m Zebron ZB-AAA capillary column (Phenomenex, USA). The oven
temperature was 110 °C for 1 min, then increased at 30 °C/min to 320 °C, and was then
held at 320 °C for 2 min. The transfer line was held at 320 °C and the carrier gas flow
rate was kept constant throughout the run at 1.1 ml/min. The ion source was maintained
at 220 °C. Samples and mixtures of amino acid standards were analysed in triplicate. A
calibration curve was plotted for each amino acid and used to calculate the amount of
the amino acids in the samples. In order to confirm the accuracy of the results, a specific
mass spectrum fragment ion for each amino acid described in the manual was selected.
The area of the fragment ion of each amino acid was computed relative to the area of
the fragment ion (158 m/z) of the internal standard (norvaline) to obtain the amount of
each amino acid in the sample.
4.2.1.2. Intracellular amino acid analysis
The adapted and control cells derived from section 4.2.1.1 were rapidly
quenched with 40 ml of pre-chilled 0.5 mM tricine in 60% (v/v) methanol (Sigma
Aldrich, UK) in dry ice. The cell pellets were then collected by centrifugation at 12,000
g for 5 min, re-suspended in 4 ml of sterile distilled water, and disrupted with a Mini-
Beadbeater as described in section 3.2.2. A 100 µl aliquot of a 1:10 dilution of the
extract was loaded into a sample preparation vial and the amino acid composition was
analysed as described in section 4.2.1.1.

124
4.2.2. Quantification of extracellular and intracellular GABA
In order to evaluate the effect of GAD system toward acid adaptation in
L. plantarum NCIMB 8826, the concentrations of extracellular and intracellular GABA
of acid adapted (pH 3) and control cells (pH 6.4) were determined according to the
method of Tsukatani et al. (2005) following the modifications suggested by O'Byrne et
al. (2011). Samples (90 µl) of reaction mixture containing 80 mM of Tris–HCl buffer
(pH 9), 750 mM of sodium sulfate, 10 mM of dithiothreitol, 1.4 mM of NADP+, 2 mM
of α-ketoglutarate, and 30 µg of GABase (Sigma-Aldrich, UK) were added into a 96-
well microplate. Subsequently, 10 µl of the supernatants prepared as described in
section 4.2.1.1 and 10 µl of disrupted cells prepared as described in section 4.2.1.2 were
added into the 96-well microplate. The reactions were monitored for 3 h at 30 °C; non-
inoculated MRS was used as a control. The formation of Nicotinamide adenine
dinucleotide phosphate was measured as the absorbance at 340 nm using a microplate
reader (Sunrise™, Tecan, UK). The concentration of GABA in the samples was
calculated from a calibration curve using standard solutions. All samples and standards
were analysed in triplicate.
4.2.3. Proteomic analysis of acid adapted and control cells
The expression of proteins in acid adapted and control cells was analysed by 2-D
gel electrophoresis in order to monitor the overall changes in the proteome during acid
adaptation. This method separates proteins based on their isoelectric points (pI) and
their molecular weights. Differences between the adapted and control cells were
identified taking into account the pI, size, and volume of the spots on the gels. Selected
protein spots were digested using the in-gel trypsin digestion method and identified by
Liquid Chromatography-Electrospray Ionization-Tandem Mass Spectrometry (LC-ESI-

125
MS/MS). All proteomic analyses were performed at the Faculty of Medical Technology,
Mahidol University, Thailand, while the differential protein expression analysis and
spot selection (described in section 4.2.3.3) were carried out at the University of
Reading.
4.2.3.1. Protein extraction
The pellets of acid adapted and control cells prepared as described in section
3.2.3 were collected and resuspended in 1 ml of lysis buffer consisting of 8 M urea
(Sigma-Aldrich, UK) and 2% (v/v) CHAPS (GE Healthcare, UK) plus 10 µl/ml of
protease inhibitor (GE Healthcare, UK). The cells were disrupted thrice by a Mini-
Beadbeater as described in section 3.2.2. The supernatants were transferred to sterile 1.5
ml microtubes and stored at -80 °C until further analysis. The protein concentration in
the supernatant was measured by the Bradford assay using Bradford solution (Sigma-
Aldrich, UK). Bovine serum albumin (Sigma-Aldrich, UK), at various concentrations (0
to 1 mg/ml), was used to construct the calibration curve.
4.2.3.2. Protein separation
A 100 µl aliquot of extracted proteins were cleaned up using the 2-D Clean-Up
Kit (GE Healthcare, Thailand). A 300 μl aliquot of precipitant solution was added into a
microtube containing 100 µl of extracted proteins. The sample was mixed by inversion
and incubated on ice for 15 min. A 300 μl aliquot of co-precipitant solution was then
added into the mixture. After mixing for 5 sec by vortex mixer (vortex genie 2,
Scientific Industries, USA), the mixture was centrifuged at 12,000 g for 5 min
(Eppendorf Minispin Plus Microcentrifuge, GE Healthcare, Thailand). The supernatant
was removed by pipetting prior to adding 40 μl of co-precipitant solution on top of the
pellet. The sample was kept on ice for 5 min prior to centrifugation (as above) and the
126
supernatant removed. A 25 μl aliquot of distilled water was added to cover the pellet.
The sample was vortexed for 5 sec, followed by addition of 1 ml of pre-chilled wash
buffer (-20 °C) and 5 μl of wash additive. The mixture was vortexed until the pellet was
fully dispersed, then incubated at -20 °C for 30 min, and centrifuged at 8,000 g for 10
min. The pellet was collected, allowed to air dry for 5 min, and resuspended in 5 µl of
rehydration buffer which consisted of 7 M urea, 2 M thiourea, 4% (w/v) CHAPS, 0.5%
(v/v) IPG buffer with pH range 3–10 (GE Healthcare, Thailand), 0.002% (w/v)
bromophenol blue and 12 µl/ml of DeStreak reagent (GE Healthcare, Thailand), with
the aim to obtain a high enough protein concentration for first-dimension isoelectric
focusing (IEF). An 18 cm Immobiline DryStrip precast gel (nonlinear gradient from pH
3 to 10) was rehydrated with 350 µl of the same rehydration buffer overnight on a
reswelling tray, as recommended by the manufacturer (GE Healthcare, Thailand). A
total amount of 80 μg (silver stain gel) and 300 μg (Coommasie blue gel) of each
extracted protein was loaded into Immobiline DryStrip gel ran on the Ettan IPGphor 3
isoelectric focusing system equipped with a cup with a manifold loading system (GE
Healthcare, Thailand). Additionally, pre-stained molecular weight markers (NEB, New
England Biolabs Inc., Thailand) were loaded onto the gel. During the gel run, the
voltage was increased from 500 to 1,000 V during the first 2 h and then increased to
8,000 V and kept at that value for 8 h. The temperature was maintained at 20 °C. After
IEF, the strips were frozen at -80 °C for at least 1 day, thawed at room temperature and
placed in the equilibration solution, consisting of 50 mM Tris-HCl, pH 8.8, 6 M urea,
30% (v/v) glycerol, 2% (w/v) SDS, and 0.002% (w/v) bromophenol blue, twice for 15
min, first in the presence of 10 mg/ml dithioreitol (Sigma-Aldrich, Thailand) and then in
the presence of 25 mg/ml iodoacetamide (Sigma-Aldrich, Thailand). The second-
dimension gel was performed using ExcelGel SDS Homogeneous 12.5 precast gels. For

127
the gel loaded with 80 μg of extracted protein the proteins were stained with silver
strain (PlusOne Silver Staining Kit, GE Healthcare Biosciences, Thailand), while the
gel loaded with 300 μg of extracted protein was stained by Coomassie blue (PlusOne
Coomassie Tablets, PhastGel Blue R-350, GE Healthcare, Thailand).
4.2.3.3. Differential protein expression analysis
After staining, the gel images were digitized using an Image scanner III (GE
Healthcare, Thailand). Two-dimensional gel analysis was performed by the
ImageMaster 2D-platinum version 7.0 (GE Healthcare, Thailand) software tool. Images
acquired from 6 independent gels were grouped in two classes according to the two
treatments (acid adaptation and control). Each class contained 3 reference gels from the
same environmental condition. After spot detection and landmark registration, each
protein spot on the first set (control cells) were matched with its corresponding spot on
the second set (acid adapted cells). Mismatches were checked and edited. The
differential protein expression levels on the gels were quantified and computed by pixel
intensity, area, and volume of the spots. A Student t-test was applied to validate the
significance of the detected differences between the spot shapes and sizes. Only spots
with Student t-values higher than 1.4 (P value set at <0.01) and relative expression ratio
higher than 2 were selected and analysed by LC-ESI-MS/MS.
4.2.3.4. In-gel trypsin digestion for protein identification
The selected spots were manually excised from the gel and stored in 1.5 ml
microtubes at −80 °C until further use. The proteins of interest were in-gel digested
using the trypsin digestion method. Initially, the gel pieces were washed twice with 100
µl of 25 mM ammonium bicarbonate (Sigma-Aldrich, Thailand) in 50% (v/v)
acetonitrile (Merck, Thailand) at room temperature for 30 min. Once the solvent was
128
removed, 50 µl of 100% acetonitrile were added and kept until the gel became white.
After that, the acetonitrile was discarded and 10 µl of 0.01 mg/ml trypsin (Promega,
Thailand) in 25 mM ammonium bicarbonate were added into each tube. The reaction
was carried out at 37 °C for 24 h and the supernatant was centrifuged and collected into
a new 1.5 ml microtube. This extraction process was repeated twice using 15 µl solution
of 50% (v/v) acetonitrile and 5% (v/v) trifluoroacetic acid (Sigmal-Aldrich, Thailand)
for 15 min in order to obtain high amounts of peptides inside the gel piece. All
supernatants from the extraction processes were pooled together in the same microtube.
Finally, the extracted peptides were dried in a vacuum centrifuge concentrator
(CentriVap Benchtop Vacuum Concentrator, Labconco, USA) and reconstituted in 15
µl of 0.1% (v/v) formic acid (Sigma-Aldrich, Thailand) prior to analysis by LC-ESI-
MS/MS.
4.2.3.5. LC-ESI-MS/MS analysis of extracted peptides
The extracted peptides were analysed by a LC-ESI-MS/MS system consisting of
a liquid chromatography system (Dionex Ultimate 3000, Thermo Scientific, Thailand)
in combination with an electrospray ionization (ESI) and Quadrupole ion trap mass
spectrometer (Model amazon SL, Bruker, Germany). The peptide separation was
performed on a 50 x 0.5 mm x 5 μm C18 reversed phase column (Hypersil GOLD,
Thermo Scientific, Thailand) protected by a 30 x 0.5 mm x 5 μm C18 guard column
(Hypersil GOLD, Thermo Scientific, Thailand). 0.1% (v/v) formic acid was used as
mobile phase A and 100% (v/v) acetonitrile as mobile phase B. The flow rate was
eluted at 100 μl/min under a gradient condition ranging from 5% B to 80% B in 50 min.
Mass spectral data from 300 to 1500 m/z were collected in the positive ionization mode.

129
4.2.3.6. Protein identification
For the identification of proteins, all the MS/MS spectra recorded on the tryptic
peptides present in the obtained gel spots were searched against the protein sequences
from the NCBI and SwissProt databases using the MASCOT search program
(www.matrixscience.com). The searching criteria were the following: complete
carbamidomethylation of cysteine and partial methionine oxidation; an initial mass
tolerance of ± 200 ppm was applied for all searches; the number of missed cleavage
sites was allowed up to 1. The MASCOT search scores that were greater than 67 were
considered to be significantly different (p<0.05) to decrease the possibility of false
matches between the peptide sequences from the experimental data and the reference
databases. Moreover, the similarity of the experimental pI and molecular weight data of
the identified proteins compared to the theoretical ones, obtained from reference
databases, were also taken into account.
4.3. Results and discussion
4.3.1. Extracellular and intracellular amino acid composition
All amino acids in acidified MRS (pH 3) and unmodified MRS (pH 6.4)
decreased after adding the cells for 1 h at 25 οC compared to non-inoculated MRS (pH
6.4) (Figure 4.1). The levels of decrease ranged from 5% to around 75% depending on
the amino acid. The greatest decreases were observed for glutamic acid, phenylalanine,
lysine and proline (all between 60% and 75% decreases) for both acid adapted and
control cells. It is interesting to note that glutamic acid is one of the essential amino
acids along with valine, leucine, isoleucine, methionine, phenylalanine and tryptophan,
and as such is required for the growth of L. plantarum WCFS1; lack of these amino
acids in the media significantly affects its growth (Teusink et al., 2005). Moreover,

130
these amino acids can be used by the bacterial cells for ATP generation through the
tricarboxylic acid cycle; for example lysine can be converted to the acetyl-coA while
proline and glutamic acid can be converted to α-ketoglutarate. It is therefore likely that
the decrease that was observed for these particular amino acids might be associated with
cell maintenance activities rather than acid resistance. On the other hand, a significant
decrease in certain extracellular amino acids, in particular alanine (~10% difference),
glycine (~20% difference), leucine (~15% difference), aspartic acid (~10% difference)
and tryptophan (~5% difference), was observed between acid adapted and control cells,
suggesting that these amino acids might be involved in acid adaptation. The particular
case of alanine and its potential contribution is discussed later on in this chapter in
detail.
Alanine was the most abundant intracellular amino acid found in both acid
adapted and control cells (~47% and ~67%, respectively, of the total amino acid
content) followed by glycine, glutamic acid, ornithine, and lysine (Table 4.1). In
response to acid adaptation, only alanine was significantly reduced (by around 1.4
times), whereas the other amino acids tended to increase in most cases, except for
aspartic acid and ornithine. Although there is no previous study investigating the
changes in intracellular amino acid profile of L. plantarum due to acidic environments,
the role of amino acids in response of acid stress has been previously reported for L.
casei (Broadbent et al., 2010, Wu et al., 2012, Wu et al., 2013). These studies have
indicated that the intracellular accumulation of basic amino acids, particularly histidine,
protected L. casei ATCC 334 during acid stress (Broadbent et al., 2010), whereas the
accumulation of arginine (a basic amino acid) and to a lesser extent aspartate during
acid stress of L. casei strain Zhang was able to enhance survival at pH 3.5 for 3 h (Wu
et al., 2012, Wu et al., 2013). More specifically, intracellular aspartate can be converted

131
to arginine by Ass and Asl at the expense of one molecule of ATP, resulting in the
intracellular accumulation of arginine. Arginine can be then used to reduce the pHi due
to the production of ammonia by the ADI pathway. In addition to the above amino acids
the conversion of intracellular L-glutamate to GABA by the GAD system can lead to
protection from acid stress in many bacteria (Lin et al., 1995, Sanders et al., 1998,
Castanie-Cornet et al., 1999, Cotter et al., 2001, Su et al., 2011).

132
Figure 4.1 Relative amino acid content of MRS media (relative to non-inoculated MRS) derived from acid adapted cells (acidified MRS, pH 3, 25 °C, 1 h) and control cells (unmodified MRS, pH 6.4, 25 °C, 1 h). * indicates significant differences for each amino acid between acid adapted and control cells determined by paired t-test.

133
Histidine and arginine, both basic amino acids, were not observed in either acid
adapted or control cells whereas the % intracellular aspartate was not significantly
different between acid adapted and control cells (Table 4.1), indicating that the ADI
pathway was most likely not involved in enhancing the acid tolerance of the cells.
Among the other basic amino acids, lysine significantly increased in acid adapted cells,
although the increase was relatively low (~1.6%). The above suggested that
L. plantarum NCIMB 8826 most likely did not accumulate significant amounts of basic
amino acids as the means for increasing its pHi.
The intracellular glutamic acid increased significantly in acid adapted cells
compared to control cells (~7.5%), which also coincided with the high consumption of
extracellular glutamic acid. This suggests that a possible mechanism for the cells to
maintain their pHi in the case of acid stress is through the conversion of intracellular
L-glutamate to GABA, with the concomitant consumption of a proton, via the GAD
system. To test this hypothesis the concentration of GABA produced by the GAD
system was examined (see next section).
It is very interesting to note that alanine, which represented the most abundant
intracellular amino acid, was significantly reduced in the case of acid adapted cells by
∼20% (Table 4.1); this coincided with a significant decrease in extracellular alanine
(~10%) (Figure 4.1). These decreases suggest that alanine might be utilised by the cells
as a response to acid adaptation. Furthermore, it has been previously suggested that
increased D-alanylation of teichoic acid (an esterification reaction), which in the case of
LAB is covalently linked to peptidoglycan, can potentially protect the cells from the
influx of hydrogen protons and cationic antimicrobials (e.g. nisin), although the
mechanisms have not been elucidated (Weidenmaier and Peschel, 2008, Giaouris et al.,
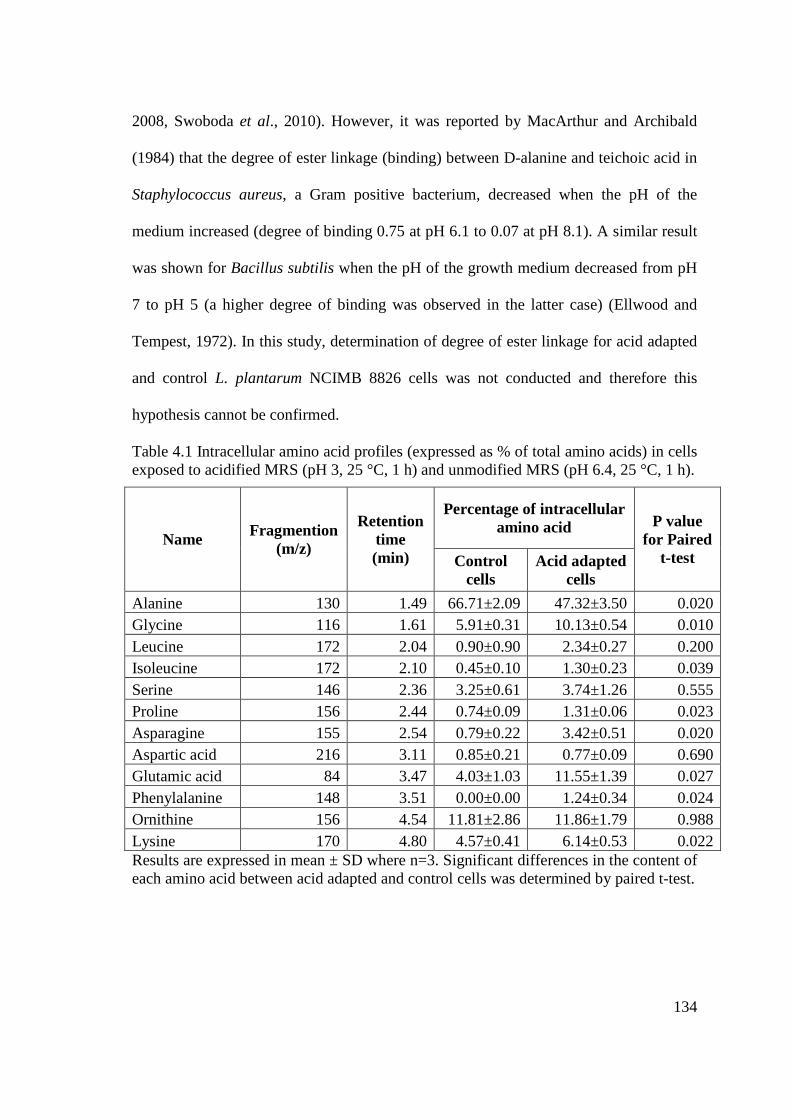
134
2008, Swoboda et al., 2010). However, it was reported by MacArthur and Archibald
(1984) that the degree of ester linkage (binding) between D-alanine and teichoic acid in
Staphylococcus aureus, a Gram positive bacterium, decreased when the pH of the
medium increased (degree of binding 0.75 at pH 6.1 to 0.07 at pH 8.1). A similar result
was shown for Bacillus subtilis when the pH of the growth medium decreased from pH
7 to pH 5 (a higher degree of binding was observed in the latter case) (Ellwood and
Tempest, 1972). In this study, determination of degree of ester linkage for acid adapted
and control L. plantarum NCIMB 8826 cells was not conducted and therefore this
hypothesis cannot be confirmed.
Table 4.1 Intracellular amino acid profiles (expressed as % of total amino acids) in cells exposed to acidified MRS (pH 3, 25 °C, 1 h) and unmodified MRS (pH 6.4, 25 °C, 1 h).
Name Fragmention (m/z)
Retention time (min)
Percentage of intracellular amino acid P value
for Paired t-test Control
cells Acid adapted
cells Alanine 130 1.49 66.71±2.09 47.32±3.50 0.020 Glycine 116 1.61 5.91±0.31 10.13±0.54 0.010 Leucine 172 2.04 0.90±0.90 2.34±0.27 0.200 Isoleucine 172 2.10 0.45±0.10 1.30±0.23 0.039 Serine 146 2.36 3.25±0.61 3.74±1.26 0.555 Proline 156 2.44 0.74±0.09 1.31±0.06 0.023 Asparagine 155 2.54 0.79±0.22 3.42±0.51 0.020 Aspartic acid 216 3.11 0.85±0.21 0.77±0.09 0.690 Glutamic acid 84 3.47 4.03±1.03 11.55±1.39 0.027 Phenylalanine 148 3.51 0.00±0.00 1.24±0.34 0.024 Ornithine 156 4.54 11.81±2.86 11.86±1.79 0.988 Lysine 170 4.80 4.57±0.41 6.14±0.53 0.022 Results are expressed in mean ± SD where n=3. Significant differences in the content of each amino acid between acid adapted and control cells was determined by paired t-test.

135
4.3.2. Extracellular and intracellular GABA content
Extracellular GABA increased significantly from 1.5 mM in non-inoculated
MRS to 2.4 mM in unmodified MRS (supernatant from control cells), but no GABA
was detected in acidified MRS (supernatant from acid adapted cells). This suggests that
for acid adapted cells GABA were reduced to zero whereas for control cells it was
produced to about 0.9 mM. This was an unexpected finding, particularly for LAB as
previous research has shown that the wild type of L. reuteri 100-23 produced GABA
when incubated for 24 h in acidified phosphate buffer containing 10 mM glutamate (pH
2.5 using HCl, 37 °C), whereas a gadB mutant strain did not (Su et al., 2011). The
mechanism proposed in that study was that cellular response to acid stress induced
GAD which catalysed the conversion of L-glutamate by consumption of a proton, thus
yielding CO2 and GABA; the latter was secreted out of the cells via its antiporter in
order to avoid significant drop in pHi. However, the absence of GABA in acid adapted
L. plantarum NCIMB 8826 cells in this study might be due to pH 3 which is most likely
lower than the optimum pH for GAD activity. The optimum pH reported for GAD
activity was various depending on the LAB species, e.g. a pH of ~ 4.2 has been reported
for L. brevis (Ueno et al., 1997) and a pH of ~ 5.0 for L. sakei (Sa et al., 2015).
Additionally, the production of extracellular GABA by L. paracasei grown in MRS
containing 500 mM glutamate at 37 °C for 5 days, was considerably lower at pH 4
compared to pH 5 and 6 (Komatsuzaki et al., 2005) indicating a negative effect of low
pH on GAD activity. Furthermore, glutamate is potentially more beneficial for the cells
than converting it to GABA, as it has a higher buffering capacity than GABA at pH
values lower than 3 (due to the differences in the pKa of their α-carboxyl groups

136
[glutamate pKa =2.1, GABA pKa =4.2]; (Feehily and Karatzas, 2013), which may also
explain the absence of GABA in acid adapted cells.
Taking the above into account, it would be expected that after acid adaptation
GABA would be similar to non-inoculated MRS (~ 1.5 mM). The fact that no GABA
was detected indicates that acid adapted cells most likely used GABA as substrate for
other metabolic activities; more techniques such as Phenotype MicroArrays (Biolog) is
needed in order to identify the potential biochemical reactions involved or changed.
Furthermore, as no GABA was produced, and considering the significant decrease in
glutamic acid (∼70% decrease) in acid adapted cells (Figure 4.1), a major substrate for
GAD, this raises the question on the fate of glutamic acid. The proposed hypothesis is
that in the case of acid adapted cells glutamic acid was used as a component for
peptidoglycan biosynthesis; this will be evaluated based on the results from the
proteomic analysis and discussed in the following section of this chapter. On the other
hand, in the case of control cells, glutamic acid seemed to be partly used for the
production of GABA by GAD as normally found in LAB at pH around 5 to 6.
No GABA was detected intracellularly for either acid adapted cells or control
cells. This was expected for acid adapted cells as there was no production of GABA as
shown and discussed above, but not for the control cells. Interestingly, this result is in
agreement with the study of Komatsuzaki et al. (2005) who demonstrated that the
intracellular GABA of L. plantarum, L. brevis and L. paracasei grown in MRS (pH 6.5,
30 °C, 6 days) was extremely low compared with the extracellular concentration,
indicating that the GABA produced by control cells was rapidly secreted after its
synthesis inside the cells. Overall, the results from this part of the study indicated that
the GAD system did not contribute toward the enhanced survival of acid adapted

137
L. plantarum NCIMB 8826 cells in fruit juices but it seems likely that the glutamic acid
present in acidified MRS was used for peptidoglycan biosynthesis rather than in ADI
pathway in order to protect the cells from the low pH of the fruit juices during storage.
4.3.3. Proteomic analysis of acid adapted and control cells
Proteomic analysis of L. plantarum NCIMB 8826 cells in acidified MRS (pH 3,
25°C 1 h) and unmodified MRS (pH 6.4, 25°C, 1 h) was conducted and the obtained
protein profiles were compared. In the initial experiments, silver stain was used to stain
the gels (Figure 4.2). Approximately 1,500 protein spots were detected after acid
adaptation. Most proteins were located between pH 4 to 7 in the gradient gel, which
ranged from pH 3 to 10. Upon analysis of the data set using the ImageMaster
2D-platinum software, 18 proteins were selected which had at least 2 fold difference
(range ratio > 2) in % volume of spots between acid adapted and control cells; these are
listed in table 4.2 and are pinpointed in figure 4.2. More specifically, after acid
adaptation at pH 3 for 1 h, 2 proteins were upregulated, 12 proteins were
downregulated, and 4 proteins were only found in the gel of the control cells. Overall,
from this initial analysis it was demonstrated that short exposure to citric acid affected
the expression of several proteins with a pH ranging between 4 and 7. However, these
proteins were unable to be identified as silver stained proteins were difficult to be
further analysed with the available identification system. Therefore, Coomassie blue
staining was thereafter used to analyse and evaluate the expression of proteins in acid
adapted and control cells.

138
Figure 4.2 Silver stain gels depicting the total protein spots for L. plantarum NCIMB 8826 after incubation in: (A) MRS at pH 6.4, 25 °C for 1 h (control cells), and (B) acidified MRS at pH 3, 25 °C for 1 h (acid adapted cells). The arrows pinpoint the spots which were significant differences in shapes and sizes between acid adapted and control cells.

139
Table 4.2 Expressed proteins showing at least a range ratio > 2 between acid adapted and control cells. The gel was stained with silver stain and analysed using the ImageMaster 2D-platinum software. The Match/Spot ID refer to figure 4.2.
Match/Spot ID Range Ratio
%Volume of Control cells
spot
%Volume of acid adapted
cells spot
14 17.16 0.006 0.098 72 -10.16 0.055 0.005 159 -5.74 0.020 0.004 192 -3.93 0.079 0.020 261 -3.76 0.055 0.015 120 -3.60 0.024 0.007 347 -3.01 0.022 0.007 66 -2.83 0.043 0.015 219 -2.74 0.026 0.010 141 -2.65 0.033 0.013 364 -2.63 0.137 0.052 681 2.61 0.068 0.177 167 -2.37 0.013 0.005 239 -2.24 0.046 0.020 1022 - 0.01 - 1609 - 0.01 - 1191 - 0.02 - 1167 - 0.03 -
The expression level was determined by the relative volume of each spot in the gel and expressed as %Volume (%Vol = spot volume/Σvolumes of all spots resolved in the gel). The range ratio was calculated as the ratio of average values of %Vol between non-stressed and acid stressed cells. Only spots with a range ratio greater than 2 (with significance set at 2-fold change, p<0.05) in the ImageMaster 2D-platinum report were considered relevant. (– indicates downregulation)
With Coomassie blue staining, approximately 750 protein spots were detected in
each gel (Figure 4.3). Out of these, 8 proteins were selected, as their % volume of spots
changed by about 1.4 fold (range ratio > 1.4) or more; they were then identified by mass
spectrometry and were compared with the reference proteins obtained by the MASCOT
search programme. The proteins and their predicted properties and functions are listed
in table 4.3; they include molecular chaperone GroEL, aminopeptidase C, 30S
ribosomal protein S1 and S2, aspartate semialdehyde dehydrogenase, D-alanine-D-

140
ligase, and two proteins with unknown function which were UPF0356 protein Ip_2157
and the hypothetical protein HMPREF0531_11643. It needs to be noted that cfa, a ∼45
kDa protein with a pI of 6.03, was not one of the selected proteins even though it was
upregulated (12 fold) during acid adaptation as previously discussed. This might be due
to the fact that a wide range IPG strip (pH 3 to 10) was used in this study, which might
not be suitable for separating this particular protein; cfa from several L. plantarum
strains (LC56, LC804, and 299V) was identified using a middle range IPG strip (pH 4
to 7) in the study of Hamon et al. (2011). In summary, 5 proteins were upregulated and
3 proteins were downregulated in the case of acid adapted cells compared to control
cells.
The molecular chaperones GroEL is a part of the two main groups of molecular
chaperones which consist of the DnaK chaperone family (DnaK, DnaJ and GrpE) and
the GroEL chaperone family (GroEL and GroES) (De Angelis et al., 2004). These
proteins play an important role in the folding and/or assembly of proteins under normal
and stress conditions (Georgopoulos and Welch, 1993, Ryabova et al., 2013). Desmond
et al. (2004) indicated that overexpression of GroEL in stress-adapted cells (e.g. heat,
salt, solvent) had the potential to improve the survival of L. plantarum NFBC 338 under
stress conditions compared with non-adapted cells. Moreover, this protein was
previously shown to be upregulated in Lactococcus lactis and L. bulgaricus during acid
stress along with other related acid shock proteins including GroES, GrpE and DnaK
(Champomier-Verges et al., 2002). Overall, GroEL was found to be upregulated in
several lactobacilli due to acid adaptation but there is no proposed mechanism how
GroEL improves cell viability under acidic conditions. It is likely that the

141
overexpression of GroEL in acid adapted cells might help to prevent the denaturation of
cellular proteins and to repair them.
Figure 4.3 One of the three Coomassie blue staining gels depicting the total protein spots for L. plantarum NCIMB 8826 after incubation in: (A) MRS at pH 6.4, 25 °C for 1 h (control cells), and (B) MRS at pH 3, 25 °C for 1 h (acid adapted cells). The arrows pinpoint the spots which were significant differences in shapes and sizes between acid adapted and control cells. 1) Molecular chaperone GroEL, 2) Aminopeptidase C, 3) 30S ribosomal protein S1, 4) 30S ribosomal protein S2, 5) Aspartate semialdehyde dehydrogenase, 6) D-alanine-D-ligase, 7) UPF0356 protein Ip_2157, and 8) Hypothetical protein HMPREF0531_11643.

142
Table 4.3 Expressed proteins showing at least a range ratio > 1.4 between acid adapted and control cells. The gel was stained with Coomassie blue and analysed using the ImageMaster 2D-platinum software. The spot number refers to figure 4.3.
Spot No Database
Accession no.
Putative function Gene Mass
(Da)
pI Protein
score
Fold
change
Acid stress
1 gi|489736891 Molecular chaperone
GroEL
groEL 57402 4.69 329 1.55
Protein degradation
2 gi|489739850 Aminopeptidase C pepC 50413 4.89 136 1.60
Protein synthesis
3 gi|489736494 30S ribosomal protein S1 rpsA 47131 4.79 330 1.46
4 gi|489734874 30S ribosomal protein S2 rpsB 30208 5.15 157 -1.51
Amino acid biosynthesis
5 gi|334880771 Aspartate semialdehyde
dehydrogenase
asd 38422 5.48 91 -1.40
Peptidoglycan biosynthesis
6 DDL_LACPL D-alanine-D-ligase ddl 41378 4.86 297 1.52
Unknown function
7 Y2157_LACPL UPF0356 protein
Ip_2157
- 8713 4.49 88 1.47
8 gi|300494317 Hypothetical protein
HMPREF0531_11643
- 15898 5.33 103 -4.45
Protein score: the probability whether an observed match between experimental data and peptide sequences found in a reference database has occurred by change.

143
Aminopeptidase C is one of the enzymes that catalyze the cleavage of amino
acids from the amino terminus (N-terminus) of proteins or peptides. The specificity of
aminopeptidase C has been studied in many LAB using a variety of synthesized amino
acid β-naphthilamide as substrates, and the results have shown that this peptidase acts
on specific basic amino acids (arginine, histidine lysine), acidic amino acids (glutamic
acid and aspartic acid), hydrophobic/uncharged amino acids (alanine and leucine) and
the aromatic amino acid (phenylalanine) (Christensen et al., 1999). Wu et al. (2011)
demonstrated that several peptidases, namely, aminopeptidase P, aminopeptidase N,
endopeptidase, dipeptidase and tripeptidase were induced after acid stress of L. casei
strain Zhang. However, L. plantarum WCFS1 is known to contain more than 19
peptidases (Kleerebezem et al., 2003), but only aminopeptidase C was overexpressed in
this experiment with L. plantarum NCIMB 8826 during acid adaptation compared to the
control conditions. It is likely that the overexpression of aminopeptidase C provided
specific amino acids to the cells, particularly alanine, lysine, and glutamic acid, which
were accumulated inside the cells after acid adaptation (Table 4.1). The hypothesis that
the overexpression of aminopeptidase C might improve the survival of L. plantarum
NCIMB 8826 in acidic condition will be discussed further below.
The expression of the ribosomal protein S1 increased by about 1.5 fold while
ribosomal protein S2 decreased by about 1.5 fold after acid adaptation. This result is
contradictory with the fact that ribosomal proteins S1 and S2 contribute toward the
translation of mRNA by stimulating the binding of the 30S ribosomal subunit to the
ribosomal binding site of mRNA, the Shine-Dalgarno sequence (Nikolay et al., 2015);
therefore, the expression patterns of both proteins should be in same direction. There is
no clear explanation for this phenomenon; however, it is interesting to note that it has

144
been previously suggested that the overexpression of protein S1 resulted in the
inhibition of general protein synthesis in E. coli (McGinness and Sauer, 2004). Based
on this, it is likely that the translation of proteins from mRNA might have decreased
instead of increased during acid adaptation, which is in accordance with the observed
decrease in the total protein concentration, measured by Bradford’s method, of acid
adapted cells compared with control cells (data not shown).
Aspartate semialdehyde dehydrogenase generally catalyses the conversion of
β-aspartyl phosphate to aspartate β-semialdehyde, which is an important intermediate in
the biosynthesis of some amino acids including lysine, methionine, leucine and
isoleucine from aspartate (Biellmann et al., 1980). It is also involved in the production
of DAP, an essential component for peptidoglycan synthesis of Gram-positive bacterial
cell walls (Pavelka and Jacobs, 1996). The downregulation of this protein might have
led to the accumulation of β-aspartyl phosphate or aspartic acid. In that case, aspartic
acid might have been used to alkalinize the cytoplasm due to ammonia produced via the
ADI pathway as reported for L. casei strain Zhang during acid stress (Wu et al., 2013)
and discussed previously in section 4.3.1. However, the % of intracellular aspartic acid
of acid adapted cells (0.77%) was not significantly different to that of control cells
(0.85%) (Table 4.1), and therefore it is difficult to pinpoint the potential role, if any, of
aspartate semialdehyde dehydrogenase towards the acid tolerance of L. plantarum
NCIMB 8826 cells.
D-alanine-D-ligase is an enzyme participating in D-alanine metabolism and
peptidoglycan biosynthesis by catalysing the ligation of two D-alanine molecules to
form the D-alanyl-D-alanine dipeptide, a key building block in peptidoglycan
biosynthesis (Bruning et al., 2011). This role of D-alanine-D-ligase is in accordance

145
with the observed significant reduction in the % of intracellular alanine of acid adapted
cells compared to control cells (Table 4.1) and the decrease in the extracellular alanine
observed for acid adapted cells (Figure 4.1). Based on these changes, it is likely that
acid adapted cells utilised alanine to increase the thickness the peptidoglycan or modify
its structure, for example through increased bonding of alanine and WTA leading to
tighter cell wall, which was also indicated by electron microscopy in chapter 3. As
discussed previously, teichoic acid has been shown to play an essential role in
controlling the influx of positively-charged substances through the peptidoglycan
network (Kovacs et al., 2006, Perea Velez et al., 2007, Giaouris et al., 2008, Swoboda
et al., 2010). However, it must be noted that D-alanine-D-ligase might compete for
alanine which, as discussed previously, is likely to be used during acid adaptation for
D-alanylation reactions, catalysed by the dltABCD operon. Interestingly, the
upregulation of D-alanine-D-ligase gene and other genes involved in peptidoglycan
biosynthesis were also previously reported in L. casei strain Zhang during acid stress at
pH 3.5 (Wu et al., 2012). In order to synthesize peptidoglycan, not only D-alanine is
required but other amino acids are also needed, such as glutamic acid, lysine and
ornithine (Chapot-Chartier and Kulakauskas, 2014). More specifically, the sugar
component of bacterial peptidoglycan consists of alternating residues of GlcNAc and
MurNAc linked by β-(1,4) glycosidic bonds, while the amino acid component, a peptide
chain containing 3 to 5 amino acids, is attached to MurNAc. Typically, L-alanine is
bound to MurNAc, followed by D-glutamic acid, which is linked by an interpeptide
cross-bridge using lysine, ornithine or DAP, depending on the bacterial species. Finally,
the D-alanyl-D-alanine dipeptide is attached to this bridge (Chapot-Chartier and
Kulakauskas, 2014). However, in contrast to alanine, in the case of glutamic acid and
146
lysine an increase in their intracellular content (expressed as % of total amino acids)
was observed for acid adapted cells compared to control cells (Table 4.1), which
contradicts the above hypothesis. This might be explained by the higher ratio of alanine
used typically for peptidoglycan biosynthesis and binding to teichoic acid, the likely
rerouting of GABA by GAD system as discussed in section 4.3.2, the likelihood that the
interpeptide cross-bridge was replaced by other amino acids such as DAP, and the
possibility that lysine and glutamic acid were accumulated as a result of the hydrolytic
activity of aminopeptidase C, which was upregulated as discussed previously. In
summary, the observed changes in the proteome and the amino acid composition taking
place during acid adaptation of L. plantarum NCIMB 8826 cells suggest that the
enhanced survival of acid adapted cells in fruit juices was associated with the
modification of the peptidoglycan matrix during acid adaptation, and highlighted the
key role of D-alanine in this change.
4.4. Conclusion
The results from the analysis of amino acid and GABA after acid stress indicated
that the response of L. plantarum cells to acid adaptation did not involve the ADI
pathway as indicated by the fact that aspartic acid and arginine did not accumulate
inside the cells. Moreover GAD, which has been reported to be active in LAB under
growth conditions at pH between 4.2 and 5.0, most likely was not involved during acid
adaptation as GABA was not produced. Proteomics analysis of acid adapted and control
cells demonstrated that: i) the overexpression of molecular chaperone GroEL, which
plays an important role in the folding and/or assembly of proteins, most likely has an
active role toward acid tolerance which helps to improve the survival of L. plantarum
NCIMB 8826 in fruit juices although the exact mechanism cannot be elucidated without

147
further investigation; ii) the upregulation of D-alanine D-ligase and the considerable
reduction in intracellular and extracellular alanine indicate that structural and
compositional modifications of the peptidoglycan took place during acid adaptation.
These most likely resulted to the formation of a thicker and rougher cell wall, as
observed by SEM, potentially through increased bonding of alanine and cell wall
teichoic acid, thus protecting the cells from the influx of hydrogen protons and
enhancing their survival during subsequent storage in the fruit juices.
4.5. References
ANDRE, G., DEGHORAIN, M., BRON, P. A., VAN SWAM, I. I., KLEEREBEZEM, M., HOLS, P. & DUFRêNE, Y. F. 2011. Fluorescence and atomic force microscopy imaging of wall teichoic acids in Lactobacillus plantarum. ACS Chemical Biology, 6, 366-376. BADDILEY, J., HANCOCK, I. C. & SHERWOOD, P. M. A. 1973. X-ray photoelectron studies of magnesium ions bound to the cell walls of Gram-positive bacteria. Nature, 243, 43-45. BIELLMANN, J. F., EID, P., HIRTH, C. & JORNVALL, H. 1980. Aspartate-beta-semialdehyde dehydrogenase from Escherichia coli. Purification and general properties. European Journal of Biochemistry, 104, 53-58. BROADBENT, J. R., LARSEN, R. L., DEIBEL, V. & STEELE, J. L. 2010. Physiological and transcriptional response of Lactobacillus casei ATCC 334 to acid stress. Journal of Bacteriology, 192, 2445-2458. BROWN, S., SANTA MARIA JR, J. P. & WALKER, S. 2013. Wall teichoic acids of Gram-positive bacteria. Annual Review of Microbiology, 67, 313-336. BRUNING, J. B., MURILLO, A. C., CHACON, O., BARLETTA, R. G. & SACCHETTINI, J. C. 2011. Structure of the Mycobacterium tuberculosis D-alanine:D-alanine ligase, a target of the antituberculosis drug D-cycloserine. Antimicrobial Agents and Chemotherapy, 55, 291-301. CASTANIE-CORNET, M. P., PENFOUND, T. A., SMITH, D., ELLIOTT, J. F. & FOSTER, J. W. 1999. Control of acid resistance in Escherichia coli. Journal of Bacteriology, 181, 3525-3535.

148
CHAMPOMIER-VERGES, M. C., MAGUIN, E., MISTOU, M. Y., ANGLADE, P. & CHICH, J. F. 2002. Lactic acid bacteria and proteomics: current knowledge and perspectives. Journal of Chromatography B, 771, 329-342. CHAPOT-CHARTIER, M. P. & KULAKAUSKAS, S. 2014. Cell wall structure and function in lactic acid bacteria. Microbial Cell Factories, 13 Suppl 1, 9. CHRISTENSEN, J. E., DUDLEY, E. G., PEDERSON, J. A. & STEELE, J. L. 1999. Peptidases and amino acid catabolism in lactic acid bacteria. Antonie Van Leeuwenhoek, 76, 217-246. COTTER, P. D., GAHAN, C. G. & HILL, C. 2001. A glutamate decarboxylase system protects Listeria monocytogenes in gastric fluid. Molecular Microbiology, 40, 465-475. DE ANGELIS, M., BINI, L., PALLINI, V., COCCONCELLI, P. S. & GOBBETTI, M. 2001. The acid-stress response in Lactobacillus sanfranciscensis CB1. Microbiology, 147, 1863-1873. DE ANGELIS, M., DI CAGNO, R., HUET, C., CRECCHIO, C., FOX, P. F. & GOBBETTI, M. 2004. Heat shock response in Lactobacillus plantarum. Applied and Environmental Microbiology, 70, 1336-1346. DESMOND, C., FITZGERALD, G., STANTON, C. & ROSS, R. 2004. Improved stress tolerance of GroESL-overproducing Lactococcus lactis and probiotic Lactobacillus paracasei NFBC 338. Applied and Environmental Microbiology, 70, 5929-5936. ELLWOOD, D. & TEMPEST, D. 1972. Influence of culture pH on the content and composition of teichoic acids in the walls of Bacillus subtilis. Journal of General Microbiology, 73, 395-402. FEEHILY, C. & KARATZAS, K. A. 2013. Role of glutamate metabolism in bacterial responses towards acid and other stresses. Journal of Applied Microbiology, 114, 11-24. GEORGOPOULOS, C. & WELCH, W. 1993. Role of the major heat shock proteins as molecular chaperones. Annual Review of Cell Biology, 9, 601-634. GIAOURIS, E., BRIANDET, R., MEYRAND, M., COURTIN, P. & CHAPOT-CHARTIER, M. P. 2008. Variations in the degree of D-Alanylation of teichoic acids in Lactococcus lactis alter resistance to cationic antimicrobials but have no effect on bacterial surface hydrophobicity and charge. Applied and Environmental Microbiology, 74, 4764-4767. HAMON, E., HORVATOVICH, P., IZQUIERDO, E., BRINGEL, F., MARCHIONI, E., AOUDé-WERNER, D. & ENNAHAR, S. 2011. Comparative proteomic analysis of Lactobacillus plantarum for the identification of key proteins in bile tolerance. BMC Microbiology, 11, 1.

149
HARTKE, A., BOUCHé, S., GIARD, J. C., BENACHOUR, A., BOUTIBONNES, P. & AUFFRAY, Y. 1996. The lactic acid stress response of Lactococcus lactis subsp. lactis. Current Microbiology, 33, 194-199. KLEEREBEZEM, M., BOEKHORST, J., VAN KRANENBURG, R., MOLENAAR, D., KUIPERS, O. P., LEER, R., TARCHINI, R., PETERS, S. A., SANDBRINK, H. M. & FIERS, M. W. 2003. Complete genome sequence of Lactobacillus plantarum WCFS1. Proceedings of the National Academy of Sciences, 100, 1990-1995. KOMATSUZAKI, N., SHIMA, J., KAWAMOTO, S., MOMOSE, H. & KIMURA, T. 2005. Production of gamma-aminobutyric acid (GABA) by Lactobacillus paracasei isolated from traditional fermented foods. Food Microbiology, 22, 497-504. KOPONEN, J., LAAKSO, K., KOSKENNIEMI, K., KANKAINEN, M., SAVIJOKI, K., NYMAN, T. A., DE VOS, W. M., TYNKKYNEN, S., KALKKINEN, N. & VARMANEN, P. 2012. Effect of acid stress on protein expression and phosphorylation in Lactobacillus rhamnosus GG. Journal of Proteomics, 75, 1357-1374. KOVACS, M., HALFMANN, A., FEDTKE, I., HEINTZ, M., PESCHEL, A., VOLLMER, W., HAKENBECK, R. & BRUCKNER, R. 2006. A functional dlt operon, encoding proteins required for incorporation of D-alanine in teichoic acids in gram-positive bacteria, confers resistance to cationic antimicrobial peptides in Streptococcus pneumoniae. Journal of Bacteriology, 188, 5797-5805. LEBEER, S., VERHOEVEN, T. L., FRANCIUS, G., SCHOOFS, G., LAMBRICHTS, I., DUFRêNE, Y., VANDERLEYDEN, J. & DE KEERSMAECKER, S. C. 2009. Identification of a gene cluster for the biosynthesis of a long, galactose-rich exopolysaccharide in Lactobacillus rhamnosus GG and functional analysis of the priming glycosyltransferase. Applied and Environmental Microbiology, 75, 3554-3563. LEE, K., LEE, H. G., PI, K. & CHOI, Y. J. 2008. The effect of low pH on protein expression by the probiotic bacterium Lactobacillus reuteri. Proteomics, 8, 1624-1630. LIM, E. M., EHRLICH, S. D. & MAGUIN, E. 2000. Identification of stress-inducible proteins in Lactobacillus delbrueckii subsp. bulgaricus. Electrophoresis, 21, 2557-2561. LIN, J., LEE, I. S., FREY, J., SLONCZEWSKI, J. L. & FOSTER, J. W. 1995. Comparative analysis of extreme acid survival in Salmonella typhimurium, Shigella flexneri, and Escherichia coli. Journal of Bacteriology, 177, 4097-4104. LORCA, G. & DE VALDEZ, G. F. 2001. A low-pH-inducible, stationary-phase acid tolerance response in Lactobacillus acidophilus CRL 639. Current Microbiology, 42, 21-25. MCGINNESS, K. E. & SAUER, R. T. 2004. Ribosomal protein S1 binds mRNA and tmRNA similarly but plays distinct roles in translation of these molecules. Proceedings of the National Academy of Sciences, 101, 13454-13459.

150
NEUHAUS, F. C. & BADDILEY, J. 2003. A continuum of anionic charge: structures and functions of D-alanyl-teichoic acids in Gram-positive bacteria. Microbiology and Molecular Biology Reviews, 67, 686-723. NIKOLAY, R., VAN DEN BRUCK, D., ACHENBACH, J. & NIERHAUS, K. H. 2015. Ribosomal Proteins: Role in Ribosomal Functions, Chichester, John Wiley & Sons, Ltd. O'BYRNE, C. P., FEEHILY, C., HAM, R. & KARATZAS, K. A. G. 2011. A modified rapid enzymatic microtiter plate assay for the quantification of intracellular γ-aminobutyric acid and succinate semialdehyde in bacterial cells. Journal of Microbiological Methods, 84, 137-139. PAVELKA, M. S., JR. & JACOBS, W. R., JR. 1996. Biosynthesis of diaminopimelate, the precursor of lysine and a component of peptidoglycan, is an essential function of Mycobacterium smegmatis. Journal of Bacteriology, 178, 6496-6507. PEREA VELEZ, M., VERHOEVEN, T. L., DRAING, C., VON AULOCK, S., PFITZENMAIER, M., GEYER, A., LAMBRICHTS, I., GRANGETTE, C., POT, B., VANDERLEYDEN, J. & DE KEERSMAECKER, S. C. 2007. Functional analysis of D-alanylation of lipoteichoic acid in the probiotic strain Lactobacillus rhamnosus GG. Applied and Environmental Microbiology, 73, 3595-3604. RYABOVA, N. A., MARCHENKOV, V. V., MARCHENKOVA, S. Y., KOTOVA, N. V. & SEMISOTNOV, G. V. 2013. Molecular chaperone GroEL/ES: Unfolding and refolding processes. Biochemistry (Moscow), 78, 1405-1414. SA, H. D., PARK, J. Y., JEONG, S. J., LEE, K. W. & KIM, J. H. 2015. Characterization of glutamate decarboxylase (GAD) from Lactobacillus sakei A156 isolated from Jeot-gal. Journal of Microbiology and Biotechnology, 25, 696-703. SANDERS, J. W., LEENHOUTS, K., BURGHOORN, J., BRANDS, J. R., VENEMA, G. & KOK, J. 1998. A chloride-inducible acid resistance mechanism in Lactococcus lactis and its regulation. Molecular Microbiology, 27, 299-310. SCHLAG, M., BISWAS, R., KRISMER, B., KOHLER, T., ZOLL, S., YU, W., SCHWARZ, H., PESCHEL, A. & GöTZ, F. 2010. Role of staphylococcal wall teichoic acid in targeting the major autolysin Atl. Molecular Microbiology, 75, 864-873. SU, M. S., SCHLICHT, S. & GANZLE, M. G. 2011. Contribution of glutamate decarboxylase in Lactobacillus reuteri to acid resistance and persistence in sourdough fermentation. Microbial Cell Factories, 10 Suppl 1, 8. SWOBODA, J. G., CAMPBELL, J., MEREDITH, T. C. & WALKER, S. 2010. Wall teichoic acid function, biosynthesis, and inhibition. ChemBioChem, 11, 35-45. TEUSINK, B., VAN ENCKEVORT, F. H., FRANCKE, C., WIERSMA, A., WEGKAMP, A., SMID, E. J. & SIEZEN, R. J. 2005. In silico reconstruction of the

151
metabolic pathways of Lactobacillus plantarum: comparing predictions of nutrient requirements with those from growth experiments. Applied and Environmental Microbiology, 71, 7253-7262. TSUKATANI, T., HIGUCHI, T. & MATSUMOTO, K. 2005. Enzyme-based microtiter plate assay for γ-aminobutyric acid: Application to the screening of γ-aminobutyric acid-producing lactic acid bacteria. Analytica Chimica Acta, 540, 293-297. UENO, Y., HAYAKAWA, K., TAKAHASHI, S. & ODA, K. 1997. Purification and characterization of glutamate decarboxylase from Lactobadllus brevis IFO 12005. Bioscience, Biotechnology, and Biochemistry, 61, 1168-1171. WEIDENMAIER, C. & PESCHEL, A. 2008. Teichoic acids and related cell-wall glycopolymers in Gram-positive physiology and host interactions. Nature Reviews Microbiology, 6, 276-287. WU, C., HE, G. & ZHANG, J. 2014. Physiological and proteomic analysis of Lactobacillus casei in response to acid adaptation. Journal of Industrial Microbiology & Biotechnology, 41, 1533-1540. WU, C., ZHANG, J., CHEN, W., WANG, M., DU, G. & CHEN, J. 2012. A combined physiological and proteomic approach to reveal lactic-acid-induced alterations in Lactobacillus casei Zhang and its mutant with enhanced lactic acid tolerance. Applied Microbiology and Biotechnology, 93, 707-722. WU, C., ZHANG, J., DU, G. & CHEN, J. 2013. Aspartate protects Lactobacillus casei against acid stress. Applied Microbiology and Biotechnology, 97, 4083-4093. WU, R., ZHANG, W., SUN, T., WU, J., YUE, X., MENG, H. & ZHANG, H. 2011. Proteomic analysis of responses of a new probiotic bacterium Lactobacillus casei Zhang to low acid stress. International Journal of Food Microbiology, 147, 181-187.

152
CHAPTER 5
General discussion
5.1. General discussion
The extensive demand for new probiotic products encourages the development of
novel non-dairy products containing probiotics, particularly fruit juices because they are
perceived by consumers as being healthy and refreshing foods; have sensory profiles
which are acceptable to all age groups; and are suitable for people with lactose
intolerance (Luckow and Delahunty, 2004). However, from a new product development
point of view, it is necessary that the probiotic strain has to survive well during storage,
in order to ensure that at the time of consumption a high concentration of viable cells is
present in the food product; this is required for its efficacy in the GIT. Previous research
studies have shown that cell survival during storage is significantly affected by the type
of juice, in particular, some very acidic juices (Champagne et al., 2005, Sheehan et al.,
2007, Mousavi et al., 2011, Nualkaekul and Charalampopoulos, 2011). The aim of this
work was to evaluate whether exposing early stationary phase L. plantarum NCMIB
8826 cells (a potential probiotic strain) to acid for a short period of time would improve
their subsequent survival during refrigerated storage in fruit juices. Although using the
probiotic strains that are able to maintain their viability and activity during production
(fermentation) and selecting the suitable secondary processing (e.g. drying, dried
storage, food processing and storage) are very important parts of probiotic product
development, implementing an acid adaptation step at some point in the manufacturing
process (e.g. after harvesting of the probiotic cells from the fermenter before subsequent

153
drying or incorporation into fruit juices) could potentially increase the robustness of the
strains and lead to the development of a range of low pH fruit juice products containing
probiotics. The rationale for this work was that such a strategy, if successful, could be
relatively easy to transfer to a commercial process without a need for extensive capital
investment. It can also be used in combination with other technologies, such as
encapsulation in order to increase probiotic survival during processing and storage. A
considerable number of foods containing probiotic bacteria are acidic foods, and
therefore if developed, such technology could find significant applications within the
food industry and possibly other sectors as well, such as industrial and environmental
biotechnology.
The results of the present study demonstrated that when L. plantarum NCMIB
8826 cells were adapted for a short period of time in acidic solutions (HCl or citric acid)
at various pH, particularly pH 3 and 4, their subsequent survival during refrigerated
storage in three fruit juices including cranberry (pH 2.7), pomegranate (pH 3.5), and
lemon & lime juices (pH 2.8) were improved. However, even under the best acid
adaptation conditions, (i.e. incubation of up to 3 h at 25 °C in MRS pH 3 and 4 °C in
citrate pH 3), the survival of L. plantarum NCMIB 8826 cells in cranberry juice
increased by only 1 to 2 days compared to control cells. Whilst, in pomegranate and
lemon & lime juices, the rate of cell death was significantly decreased for weeks;
however, after prolonged storage no significant differences were observed between acid
adapted and control cells indicating that the alteration process by acid adaptation was
not permanent. These findings indicate that acid adaptation is most likely not a suitable
commercialisation strategy to be used on its own for ensuring that a sufficient number
of viable probiotic cells (more specifically for L. plantarum NCMIB 8826 cells),

154
necessary to exert their beneficial health effects in vivo (> 107 CFU/ml) (Corcoran et al.,
2007), is maintained during refrigerated storage of fruit juices for 6 weeks. However,
given the positive effects that were observed on cell survival, it is possible that this
strategy can be used in conjunction with other technologies, such as encapsulation.
Moreover, in order to improve the cell survival of L. plantarum NCMIB 8826 in these
particular fruit juices, it would be possible to investigate whether increasing the pH of
the fruit juices could have a positive effect. A previous study using this approach
showed that the cell viability of L. paracasei NFBC43338 (measured after 9 days of
storage) was significantly improved (by about 8 logs) when the pH of cranberry juice
was increased from 2.5 to 5.5 (Sheehan et al., 2007). Serial sub-culturing of
L. plantarum NCMIB 8826 cells in acidic growth media (e.g. MRS supplemented with
fruit juices) might be another approach to develop an appropriately adapted which has
the ability to withstand the harsh environment of these fruit juices as shown in the study
by Wu et al. (2012). Serial sub-culturing of L. casei strain Zhang in MRS at pH of 4.3
for 70 days led to cells that had increased in acid tolerance. It is important to note that a
mutant strain obtained by such a method is not considered a genetically modified
microorganism because it is a phenotypic change which can occur naturally while other
genetic engineering techniques, in particular gene cloning, are unacceptable to be
recently used for food-grade microorganisms. The investigation into the mechanisms for
enhancing acid tolerance of L. plantarum NCMIB 8826 cells, revealed three potential
mechanisms likely to be involved: i) modification of the membrane fatty acid
composition, particularly that of CFA (lactobacillic acid) which increased significantly
during acid adaptation leading to decreased membrane fluidity; ii) modification of the
peptidoglycan by either D-alanylation or EPS production leading to a thicker/denser cell

155
wall which was able to inhibit the influx of protons; and iii) upregulation of molecular
chaperone GroEL leading to the prevention of protein denaturation from low pH
environment. A key finding of this study was the observation that the intracellular
alanine, which represented the most abundant amino acid (> 45%), was significantly
reduced in the case of acid adapted cells (by ∼20%) compared with control cells, which
coincided with a significant decrease in the extracellular alanine (~10%). The extensive
utilization of intracellular and extracellular alanine seems to support the hypothesis of a
denser and thicker peptidoglycan cell wall in the case of acid adapted cells, which could
possibly be due to the binding between D-alanine and wall teichoic acid; this process is
called D-alanylation and has been shown previously to reduce the negative charge of the
cell envelope and the influx of positively-charged molecules into the cells (Neuhaus and
Baddiley, 2003, Giaouris et al., 2008, Weidenmaier and Peschel, 2008, Swoboda et al.,
2010). It seems likely ,therefore, that acid adaptation leads to cells utilising the available
alanine to increase the D-alanylation of the wall teichoic acid, resulting in a cell wall
with enhanced ability to reduce the influx of hydrogen protons during subsequent
storage in fruit juices; and hence to better cell survival. Biochemical analysis of the cell
wall composition or other type of analysis such as fluorescence imaging was not
conducted in this study to confirm the above hypothesis. However, the work of Ellwood
and Tempest (1972) has shown that the degree of D-alanylation in Bacillus subtilis was
increased when the pH of the growth medium was decreased from pH 7 to pH 5. To our
knowledge there is no information on such aspects for lactobacilli. An understanding on
the potential mechanisms utilized by the cells to increase their acid resistance is
important for identifying new probiotic strains which have the ability to survive in harsh
acidic conditions. For instance, a probiotic strain which has a high content of

156
cyclopropane or the ability to produce EPS could be selected specifically for
incorporation in selected low pH food products. Moreover, the information generated
from this research contributes considerably to the growing body of knowledge on the
possible acid adaptation mechanisms employed by lactobacilli, in particular
L. plantarum NCMIB 8826.
One limitation of this work was that the cells used for the adaptation
experiments were already pre-exposed to acidic pH as they were grown with MRS in
flasks, with no pH control. As a result, the pH of the medium, when the early stationary
phase cells were harvested, was ~4.6. One way to partly circumvent this would be to
grow the cells in a bioreactor under controlled pH conditions, although even in that case
the cells would be stressed due to the high amounts of lactate being produced. For
future work, in an effort to obtain non-stressed cells as control cells, it is recommended
to use steady state cells from continuous culture at pH ∼6 which is (optimal pH for
culturing L. plantarum NCMIB 8826). This approach has not been explored for these
types of experiments and could potentially provide more accurate information on the
physiology of non-stressed cells.
Finally, comparative analysis of L. plantarum NCMIB 8826 genes and proteins
of acid adapted and control cells should be further investigated by DNA microarray and
2D-liquid chromatography-mass spectrometry to complement the results generated from
this work. Such techniques are more powerful than the techniques used in this study and
will help to clearly elucidate the genes and proteins involved in acid adaptation of
L. plantarum NCMIB 8826.

157
5.2. References
CHAMPAGNE, C. P., GARDNER, N. J. & ROY, D. 2005. Challenges in the addition of probiotic cultures to foods. Critical Reviews in Food Science and Nutrition, 45, 61-84. CORCORAN, B. M., STANTON, C., FITZGERALD, G. F. & ROSS, R. P. 2007. Growth of probiotic lactobacilli in the presence of oleic acid enhances subsequent survival in gastric juice. Microbiology, 153, 291-299. ELLWOOD, D. & TEMPEST, D. 1972. Influence of culture pH on the content and composition of teichoic acids in the walls of Bacillus subtilis. Journal of General Microbiology, 73, 395-402. GIAOURIS, E., BRIANDET, R., MEYRAND, M., COURTIN, P. & CHAPOT-CHARTIER, M. P. 2008. Variations in the degree of D-Alanylation of teichoic acids in Lactococcus lactis alter resistance to cationic antimicrobials but have no effect on bacterial surface hydrophobicity and charge. Applied and Environmental Microbiology, 74, 4764-4767. LUCKOW, T. & DELAHUNTY, C. 2004. Which juice is ‘healthier’? A consumer study of probiotic non-dairy juice drinks. Food Quality and Preference, 15, 751-759. MOUSAVI, Z., MOUSAVI, S., RAZAVI, S., EMAM-DJOMEH, Z. & KIANI, H. 2011. Fermentation of pomegranate juice by probiotic lactic acid bacteria. World Journal of Microbiology and Biotechnology, 27, 123-128. NEUHAUS, F. C. & BADDILEY, J. 2003. A continuum of anionic charge: structures and functions of D-alanyl-teichoic acids in Gram-positive bacteria. Microbiology and Molecular Biology Reviews, 67, 686-723. NUALKAEKUL, S. & CHARALAMPOPOULOS, D. 2011. Survival of Lactobacillus plantarum in model solutions and fruit juices. International Journal of Food Microbiology, 146, 111-117. SHEEHAN, V. M., ROSS, P. & FITZGERALD, G. F. 2007. Assessing the acid tolerance and the technological robustness of probiotic cultures for fortification in fruit juices. Innovative Food Science & Emerging Technologies, 8, 279-284. SWOBODA, J. G., CAMPBELL, J., MEREDITH, T. C. & WALKER, S. 2010. Wall teichoic acid function, biosynthesis, and inhibition. ChemBioChem, 11, 35-45. WEIDENMAIER, C. & PESCHEL, A. 2008. Teichoic acids and related cell-wall glycopolymers in Gram-positive physiology and host interactions. Nature Reviews Microbiology, 6, 276-287.

158
WU, C., ZHANG, J., WANG, M., DU, G. & CHEN, J. 2012. Lactobacillus casei combats acid stress by maintaining cell membrane functionality. Journal of Industrial Microbiology and Biotechnology, 39, 1031-1039.