effects of 2d geometric transformations on visual memory€¦ · *email: {hllam, rensink,...
TRANSCRIPT

____________________________________
*email: {hllam, rensink, tmm}@cs.ubc.ca
Effects of 2D Geometric Transformations on Visual Memory
Heidi Lam* Ronald A. Rensink* Tamara Munzner*
University of British Columbia
AbstractIn order to provide well-grounded guidelines for interface design,we systematically examined the effects of 2D geometrictransformations and background grids on visual memory. Westudied scaling, rotation, rectangular fisheye, and polar fisheyetransformations. Based on response time and accuracy results, wefound a no-cost zone for each transformation type within whichperformance is unaffected. Results indicated that scaling had noeffect down to at least 20% reduction. Rotation had a no-costzone of up to 45 degrees, after which the response time increasedto 5.4 s from the 3.4 s baseline without significant drop inaccuracy. Interestingly, polar fisheye transformations had lesseffect on accuracy than their rectangular counterparts. Thepresence of grids extended these zones and significantly improvedaccuracy in all but the fisheye polar transformations. Our resultstherefore provided guidance on the types and levels of nonlineartransformations that could be used without affecting performance,and provided insights into the roles of transformations and gridson visual memory.
CR Categories: H.1.2[Models and Principles]: User/MachineSystems—Human information processing; H.5.2[InformationInterfaces and Presentation]: User Interfaces—Evaluation/method-ology
Keywords: Information visualization, visual memory, geometrictransformations
1 IntroductionGeometric transformations are widely used in interface design,particularly in visualization systems where the amount ofinformation to display exceeds available screen resolution, and insituations that require navigation through a two- or three-dimensional scene. For example, rotation has been used tonavigate in network graphs displayed using a radial layout [Yee etal. 2001]. Likewise, scaling is extremely popular; for example,thumbnails are widely used as icons. Unfortunately, scaling onlyworks to a certain extent: When the size of an image is reducedtoo far, its details become indiscernible. One possible remedy isto selectively scale it such that readability is preserved for the partof the image relevant to the user, while the rest remains availablein a reduced form to serve as context. The class of Focus+Contexttechniques does so by providing both an unscaled focus and ascaled-down context in a single integrated image [Leung andApperley 1994; Skopik and Gutwin 2005]. Focus+Context can berealized using a nonlinear transformation called a f isheye
transformation, which has two main variants: rectangular andpolar [Leung and Apperley 1994; Sarkar and Brown 1992]. Thereexists a large body of work using the fisheye transformation,including the Fisheye menu for text lists [Bederson 2000],calendar on small-screens [Bederson et al. 2004] and 2D graphdisplay for large information spaces [Bartram et al. 1995].
While scaling, rotation and fisheye transformations can providebenefits in visualizing information, there is a danger that thetransformed image may be too distorted to remain recognizable.This issue is a serious usability concern, since users need to beable to retain, or at least compensate for, their orientation in thevisualization after the transformation. They also need to be able toassociate the components in the display before and after thetransformation to equate the two views as the same, or at leastholding the same information.
Unfortunately, the effects of these transformations on performanceare largely unknown. Several rules of thumb have been suggestedto transform images with minimal disruption. These include:
• Maintain orthogonal ordering (left-right, up-down ordering),proximity (distance relationships between objects) and topology(inside-outside relationships) of the original image [Misue et al.1995];
• Use visual cues to support the user's comprehension ofgeometric distortion [Carpendale et al. 1997]. Background gridshave been suggested as the most effective of these [Zanella etal. 2002], as used in EPT [Carpendale et al. 1997].
• Use animation to retain the relationships among componentsdisplayed during transformation, and to avoid reassimilating thenew display [Robertson et al. 1989]. Many visualizationsinvolving geometric transformation follow this principle, withearlier adopters being Pad++ [Bederson and Hollan 1994] andTable Lens [Rao and Card 1994].
While these guidelines may provide designers with some hints forhandling geometric transformations, they are based mostly oncasual experience, and are not detailed or quantitative enough foractual implementation. Clearly, different types of geometrictransformations and different degrees of transformation incurdifferent amounts of perceptual cost. Knowing these costs wouldhelp designers gauge cost-benefit tradeoffs in their applications.Quantifying the effectiveness of various techniques suggested bythese guidelines to mitigate transformation costs would be alsohelpful. For example, since smooth animation may impose aheavy computational load, it would be useful to determine thelargest transformation “jump” we can perceptually tolerate. Also,the presence of grids may create visual noise instead of beingbeneficial.
Extending our earlier study on geometric transformations andvisual search [Rensink 2004; Lau et al. 2004], the goal of thiswork is to better understand and quantify the effects of 2Dgeometric transformations on visual memory (VM) to guideinterface and visualization design. In this paper, we present thefirst measurements of the effects of four types of geometrictransformation on VM: scaling, rotation, rectangular fisheye, andpolar fisheye transformations. These transformations were applied
to automatically generated abstract images consisting of dots andconnecting lines. We also investigated whether the commonpractice of using background grids helps performance [Zanella etal. 2002], or whether it impairs performance by introducing visualclutter.
2 Related WorkPrevious work has looked at the perceptual costs of geometrictransformations in visual search tasks using abstract images.Rensink [2004] found no cost for translational shifts up to at least2 degrees of visual angle, or 2 cm at a viewing distance of 55 cm.Performance was not significantly affected for rotations up to 17degrees, but degraded sharply beyond that. Scaling was found tobe invariant at a reduction factor of 2, but created a measurablecost at 4. In another series of experiments involving visual searchand nonlinear polar fisheye transformation, Lau et al. [2004] foundthat this transformation had a significant time cost, with perform-ance slowed by a factor of almost 3 under large distortions.Interestingly, they did not find any benefits in adding grids to theirimages. In fact, grids caused performance to slow down,suggesting that they only added to the perceptual noise.
Several studies have examined the use of visual memory ininterface design. An example is Robertson et al.’s work on DataMountain [1998]. However, relatively little appears to be knownabout on the effects of geometric transformations on visualmemory. Skopik and Gutwin [2005] looked at the effects ofrectangular fisheye transformation and found that distortionsincreased the time required to remember and find target nodes, butwithout affecting task accuracy.
3 ExperimentsWe conducted 10 original and 2 extended experiments toinvestigate the effects of geometric transformations on VM. Allexperiments used a within-subject design. In each experiment, weconsidered only a single factor, the transformation type, looking atfive levels of transformation degree. Each transformation levelwas blocked, with levels counterbalanced across participants. Eachlevel was tested using two phases, each with 8 trials. In thelearning phase, participants were presented with 8 stimuli insequence. In the recognition phase, they were shown another setof 8 stimuli, 50% of which were shown in learning phase. Foreach stimulus, participants were asked to determine whether it hadbeen shown in the learning phase. Baseline performance wasmeasured in terms of response time and accuracy obtained usinguntransformed test stimuli. This baseline was then compared withresults of the transformed trials.
3.1 TransformationsWe investigated four types of transformations to abstract imagesconsisting of dots connected by lines: scaling, rotation, rectangularfisheye, and polar fisheye. We also examined the effects of gridpresence and grid type. Ten initial experiments were carried out:
• Scaling (1, 0.5, 0.33, 0.25, 0.2x reduction factor)Exp 1. no gridExp 2. rectangular grid
• Rotation (0, 30, 45, 60, 90 degrees clockwise rotation)Exp 3. no gridExp 4. rectangular grid
• Rectangular fisheye (0, 0.5, 1, 2, 3 transformation factor)Exp 5. no gridExp 6. rectangular gridExp 7. polar grid
• Polar fisheye (0, 0.5, 1, 2, 3 transformation factor)
Exp 8. no gridExp 9. rectangular gridExp 10. polar grid
The choice of transformation ranges was based on twoconsiderations. For scaling, there was a limit to which we couldreduce stimuli size without severely compromisingly perceivabledetail. Otherwise, we used pilot results to determine the start ofperformance degradation induced by the transformations.
Based on our results, we extended two of the experiments: (1)experiment 4-ext: rotation with a rectangular-grid to study a widerrange of rotations: 0, 90, 120, 150, 180, and (2) experiment 10-ext:polar fisheye with a polar grid to study the effects of transformingthe sizes of the dot, and drawing the connecting lines in variouscoordinate systems. We did not include the translation transfor-mation as it had previously been found to be robust in visualsearch tasks to at least 2 degrees of visual angle [Rensink 2004].
3.2 StimuliAll experimental stimuli were randomly generated abstract imagesconsisting of dots connected by lines. We chose to use abstractrather than photorealistic images in part to avoid semantic effects,such as the verbal effect found by Goldstein and Chance [1971],where recognition accuracy was considerably lower for objectsdifficult to name. Moreover, in the domain of informationvisualization, data is typically represented in abstract form. Ourstimuli were similar to 2D network graphs, but we believe theseresults generalize to many different encodings of information.
All original stimuli had a resolution of 300x300 pixels to ensurethat all levels of transformations would fit onto the display screen.In the grid experiments, we filled the entire screen with thecorresponding grid. We used a different set of images for eachexperiment. All images were generated in the same manner forconsistency. Each consisted of 15 dots connected by lines. Thenumber of dots was determined in pilot studies to optimize imagememorability. The locations of the dots were randomly generated.The algorithm only guaranteed non-collision but not constantdensity of the dots.
Pilot studies showed that the task was too difficult if we onlyprovided the dots. Lines were therefore added to link the dots toenhance stimuli memorability, similar to lines drawn between starsin astronomical constellations. The algorithm that added the linesdid not guarantee that all the dots were joined as a single unit, butit did ensure all of the dots were connected to at least one otherdot, namely, its nearest neighbour. The algorithm minimized linecrossing, but did not control the number of topological features,for example loops.
When grids were added to the images, the thickness of theconnecting lines was increased to 2 pixels to better distinguish thedot-line foreground from the grid background.
For the fisheye transformation experiments, we used a transforma-tion function, taken from Leung and Apperley [1994]:
)1()1(
)( ++
= dxxd
xT (1)
where T(x) is the transformed value given input x, and d is thetransformation factor. A larger d value leads to a higher degree ofdistortion.
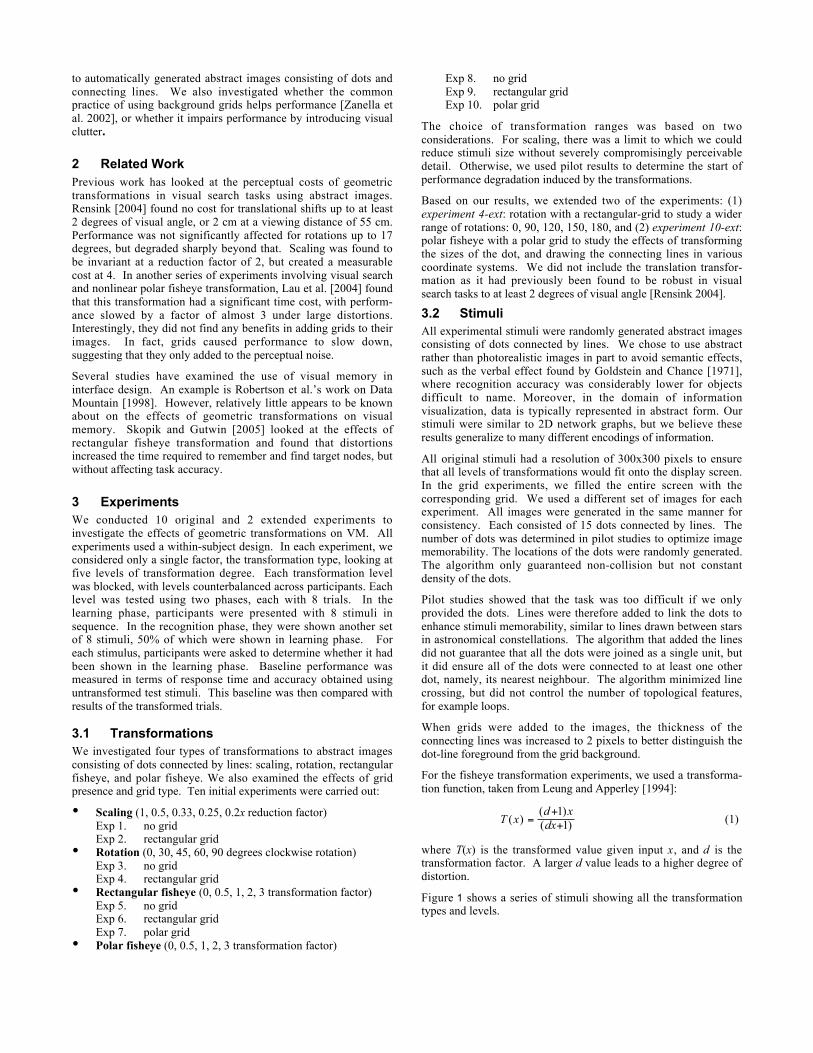
Figure 1 shows a series of stimuli showing all the transformationtypes and levels.

Figure 1: Sample stimuli showing transformation types and levels used in the 10 original and 2 extended experiments. The first row shows themaximally distorted stimuli used in the no-grid experiments (expts. 1, 3, 5, 8). The next 3 rows show all the distortion levels of the rectangular-grid experiments for scaling (expt. 2) and rotation (expt. 4; 4-ext). The fifth row shows all the distortion levels for rectangular-grid fisheyerectangular experiment (expt 6), along with the maximally distorted image for the polar-grid variety (expt 7). The last two rows contain thepolar fisheye stimuli (polar-grid: expt 10 + rectangular-grid: expt 9; 10-ext).

3.3 ProtocolFor each of the 12 experiments, all 20 participants completed trialson all five levels of the test transformation, and the order ofappearance of the levels was counterbalanced between theparticipants. The stimulus was randomly selected from a pool of50 and each only appeared once in the entire experiment to avoidlearning effects. Prior to the actual experiment, participants wereshown samples of original and transformed images to help themunderstand the transformation.
Each transformation-level session consisted of two phases:learning and recognition. In the learning phase, participants wereasked to study 8 untransformed images; each was displayed for 12seconds and followed by a 2.5-second blank screen before the nextimage appeared. Participants were told they would need torecognize those images later on in the experiment, and that someof these images might be transformed in a manner similar to theimages shown prior to the experiment. In the recognition phase, 8transformed images were shown to the participants in sequence.Half of these had been shown in the learning phase in theiroriginal form. The participants' task was therefore to indicatewhether they had seen the images in the learning phase.
Prior to the experiment, participants were trained on the task usinguntransformed images in both the learning and the recognitionphase. They were required to obtain at least 80% accuracy beforestarting the actual study.
The entire experiment typically took 30 minutes. Participants werecompensated for their time with five dollars. In order to do well onthe tasks, participants needed to pay close attention to the testimages during the learning phase. As an added incentive, weinformed the participants that high-accuracy scores would result inadditional five-dollar bonuses.
3.4 ParticipantsA different group of 20 participants was tested in each of the 12experiments. All were university students with normal orcorrected-to-normal vision. Their ages ranged from 18 to 34years.
3.5 Results and Data AnalysisWe recorded two performance measures: response time andaccuracy. Response time was defined as the period from whichthe image was shown during the recognition phase, to the timewhen a response was made. Accuracy was the percentage ofanswers that correctly identified whether the images had beenshown in the learning phase. Blind guessing would lead to 50%accuracy, since half of the images shown in the recognition phasewere present in the learning phase.
For the analysis of response times, we used a repeated measuresingle-factor Analysis of Variance (ANOVA) with transformationtype as the factor for each experiment. We used the Greenhouse-Geisser adjustment and marked the results as adjusted if thesphericity assumptions were violated. Post-hoc analyses wereperformed for statistically significant results with Bonferronicorrection and marked as corrected. For the accuracy results, weused the Friedman test for the initial analyses, and the Mann-Whitney test for post-hoc analyses. Only significant results werereported for the post-hoc analyses.
For each experiment, we mapped out a no-cost zone beyond whichthe performance began to degrade, as indicated by significantlyhigher response times and lower accuracy rates when compared toperformance on untransformed images.
Due to the large number of experiments, we summarize our resultsin Table 1. For cases where boundaries were not established bystatistical analyses, we provided estimates based on result trends,and marked them by a ‘?’. Table 2 lists the results immediatelyoutside of the identified no-cost zones. Corresponding baselinevalues were provided in parentheses for comparison.
As the tables indicate, VM was robust against many forms oftransformations to a large extent. Scaling did not impactperformance down to a reduction factor of at least 0.2x. Rotationdid not seem to affect performance up to 45 degrees, and bothfisheye transformations had little effect on time or accuracy up tod = 1. The presence of grids generally extended these boundaries.
Table 1. Summary of experimental results: no-cost zones. A no-cost zone is the largest degree of transformation that can becompensated for without incurring a cost in performance. Thecombined result is the minimum of the time and accuracy results.
No-cost zoneExperiment Time Accuracy Combined
1. Scaling: no-grid2. Scaling: rect-grid
≥0.2x≥0.2x
≥0.2x≥0.2x
≥0.2x≥0.2x
3. Rotation: no-grid4-ext. Rotation: rect-grid
45°60°
45°?60°
45°60°
5. Rect Fisheye: no-grid6. Rect Fisheye: rect-grid7. Rect Fisheye: polar-grid
d = 1d = 2d = 2?
d = 1d = 2d = 2
d = 1d = 2d = 2
8. Polar Fisheye: no-grid9. Polar Fisheye: rect-grid10. Polar Fisheye: polar-grid
d = 1?d = 2d = 2
d = 1d = 2d = 2?
d = 1d = 2d = 2
Table 2. Summary of experimental results: performance cost at thetransformation levels just outside the no-cost zones, as shown inthe Tx Level column. Baseline values are in parentheses forcomparison. Italicized results were cases where the boundarieswere estimated based on observed trends instead of statisticalanalyses.
Performance CostExperiment Tx Level Time (s) Accuracy (%)
1. Scaling: no-grid2. Scaling: rect-grid
nonenone
nonenone
nonenone
3. Rotation: no-grid4-ext. Rotation: rect-grid
60°90°
5.4 (3.4)5.9 (4.1)
69 (88)75 (88)
5. Rect Fisheye: no-grid6. Rect Fisheye: rect-grid7. Rect Fisheye: polar-grid
d = 2d = 3d = 3
5.2 (4.6)3.9 (2.8)5.5 (3.5)
50 (88)75 (88)75 (94)
8. Polar Fisheye: no-grid9. Polar Fisheye: rect-grid10. Polar Fisheye: polar-grid
d = 2d = 3d = 3
4.7 (3.7)5.6 (3.5)5.6 (3.8)
75 (94)75 (88)75 (88)
Detailed Results and StatisticsWe now provide the detailed experimental results and dataanalyses for each of the four transformation types.
3.5.1 Transformation Type 1: ScalingResults showed no significant differences between the five levels,with or without adding grids to the images: time/no-grid: F(2.3,43.2) = 0.67, p = .54, adjusted; accuracy/no-grid: χ2(4, N=20) =2.01; time/rect-grid: F(4, 76) = .60, p = .67; accuracy/rect-grid:χ2(4, N=20) = 3.15, p = .53. Consequently, scaling over theranges studied did not impact performance.

3.5.2 Transformation Type 2: RotationFigure 2 shows the results. For the no-grid experiment, we founda marginal main effect in response time (F(1.9, 35.8) = 2.92, p =.070). Post-hoc analysis indicated that performance began todegrade at 60 degrees, at which participants took 5.4 s comparedto the 3.4 s baseline. We also found a marginal main effect inaccuracy (χ2(4, N=20) = 8.75, p = .070) but could not identify aclear no-cost boundary.
For the rectangular-grid experiment, we failed to find a maineffect in both time (F(2.6, 49.7) = 1.33; p = .27, adjusted) andaccuracy (χ2(4, N=20) = 7.16, p = .13), thus we were unable tolocate no-cost zone boundaries based on these results.
Since we found relatively little performance degradation in therectangular-grid results, we extended the range of rotation to cover0, 90, 120, 150 and 180 degrees (experiment 4-ext). The resultsare shown in Figure 2 as “Rectangular Grid Ext”. Here, we founda main effect in response time (F(4, 76) = 5.05, p = .001). Post-hoc analysis indicated both the 90-degree and the 180-degreerotation trials were significantly slower at 5.9 s compared to the4.1 s baseline. We also found a main effect in accuracy (χ2(4,N=20) = 14.95, p = .005). Post-hoc analysis indicated thetransformed trials were 14% less accurate than baseline. Theseresults therefore suggested a no-cost boundary of 60 degrees. Todetermine the improvement provided by the rectangular grid, wecompared the accuracy between the non-grid and grid trials from30 to 90 degrees Accuracy for the grid results were higher thantheir non-grid counterpart by 10% (two-tailed Mann Whitney test,p = .03). This increase in accuracy was not accompanied by anincrease in time, thus ruling out any time-accuracy tradeoff.
3.5.3 Transformation Type 3: Rectangular FisheyeFigure 3 shows the results. For the no-grid experiment, we founda marginal main effect in response time (F(1.9, 36.2) = 2.83, p =.074, adjusted). It took 0.6 s longer for d = 2 and d = 3 trials thanthe 4.6 s baseline. We also found a main effect in accuracy (χ2(4,N=20) = 43.80, p < .001) and the d = 2 and d = 3 trials were 33%less accurate than the rest of the trials. Using the one-sample z-test, we found that the accuracy for the d = 2 and d = 3 trials wereat chance (Z(N=40) = 1.44; p = .15). These results indicated aclear no-cost zone boundary at d = 1.
For the rectangular-grid experiment, we found a marginal maineffect in time (F(2.78, 52.9) = 2.63; p = .063, adjusted). Post-hocanalysis indicated that d = 3 trials were slower at 3.9 s whencompared to the 2.8 s baseline, indicating a no-cost time boundaryat d = 2. There was a strong effect in accuracy (χ2(4, N=20) =18.34, p = .001), with baseline and d = 1 trials being 15% moreaccurate than for d = 3, indicating a no-cost accuracy boundary atd = 2.
For the polar-grid experiment, the main effect in time was alsomarginal (F(4, 68) = 3.32; p = .051, adjusted), with a marginaltime degradation at d = 3 (p = .077, corrected). While the taskaccuracy main effect remained, it was much smaller (χ2(4, N=19)= 10.4, p = .034), with a no-cost accuracy boundary at d = 2.
3.5.4 Transformation Type 4: Polar FisheyeFigure 4 shows the results. We failed to find a main effect in timefor the no-grid experiment (F(1.82, 34.5)=2.3; p = .12, adjusted).There was, however, a main effect in accuracy (χ2(4, N=20) =17.16, p = .002), with d = 2 and d = 3 trials being 20% lessaccurate than baseline, thus indicating a no-cost accuracyboundary at d = 1. A one-sample z-test analysis indicated that
Figure 2. Results for the rotation experiments. Response time datapoints are averages with 95% confidence interval bars. Accuracyresults are medians with quartiles.
0
2
4
6
8
0 0.5 1 2 3Fisheye tranformation d factor
Tim
e (s
)
No GridRectangular GridPolar Grid
0
20
40
60
80
100
0 0.5 1 2 3
Fisheye transformation d factor
Acc
ura
cy (
%)
No GridRectangular GridPolar GridChance
Figure 3. Results for the rectangular fisheye experiments.Response time data points are averages with 95% confidenceinterval bars. Accuracy results are medians with quartiles.
0
2
4
6
8
0 30 45 60 90 120 150 180
Degrees of Clockwise Rotation
Tim
e (s
)
No GridRectangular GridRectangular Grid Ext
0
20
40
60
80
100
0 30 45 60 90 120 150 180Degrees of clockwise rotation
Acc
ura
cy (
%)
No GridRectangular GridRectangular Grid ExtChance

performance at d = 2 and d = 3 had not degraded to chance(Z(N=40) = 8.23; p < .001).
For the polar-grid experiment, we found a main effect in time(F(4, 76) = 6.08, p = <.001). Post-hoc analysis indicated d = 3trials were 1.7 s slower than baseline and d = 1 trials, which took 4s on average. This indicated a time no-cost zone boundary at d =2. We failed to find a main effect in accuracy (χ2(4, N=20) =6.92, p = .14).
For the rectangular-grid experiment, we found a main effect intime (F(4, 76) = 4.32, p = .003). Post-hoc analysis indicated d = 3trials were slower by 1.8 s than the 3.8 s baseline and d = 1 trials,thus indicating a no-cost time boundary at d = 2. We also foundan accuracy main effect (χ2(4, N=20) = 11.27, p = .024). Post-hoc analysis indicated d = 3 trials were 12% less accurate thanbaseline, thus indicating a no-cost accuracy boundary at d = 2.
Despite extending the no-cost boundaries from d = 1 to 2, thepresence of either polar or rectangular grids on polar fisheyetransformed images did not substantially improve accuracy. Thispattern was in stark contrast to that found in the rectangularfisheye experiments, and suggests that there is something unusualabout the polar fisheye transformation.
One possibility involves the shape of the lines connecting the dots.In our previous experiments, these lines were straight. If straightlines are less natural in the polar transformed images than in theirrectangular counterparts, then this unnaturalness may havecontributed to the lack of benefit of grids in the polar trials.
To test our hypothesis, we extended the polar fisheye experimentto look at line shape (experiment 10-ext), where the straight linesin the original images were drawn based on either a polarcoordinate system (polar-line), a rectangular coordinate system(rect-line), or a mirror image of the ones drawn in the polarcoordinate system (antipolar-line). The last case was included totease out any potentially adverse effects induced by an unnaturaltransformation on the lines. Theoretically, transformation can beapplied globally to the surrounding space, or locally to the objectsin the space. Our earlier experiments assumed that space wastransformed without affecting the sizes or shapes of the dots andthe lines, as if they were pinned on the surface instead ofcompletely adhered to the surface of transformation. The onlyexception was in scaling, where we had to transform the dot sizeto avoid collision. To determine if this might account for the polarfisheye results, we also included a case where we transformed thesize of the dots and keeping the lines in the rectangular coordinatesystem (scaled-dot)
We failed to find a main effect in time (F(2.4, 45.5) = 2.09, p =.13), but did find a main effect in accuracy (χ2(4, N=20) = 15.7, p= .003). Post-hoc analysis indicated that our participants madesignificantly more errors in the polar-line trials than base-line, andthe accuracy was at chance (Z(N=20) = 1.45; p = .15).
Examples of these transformations are shown in the last row ofFigure 1, and Figure 5 shows the results. In essence, the patternfound for the polar fisheye results does not appear to be due to thescaling of the dots, nor the shape of the lines connecting them.Instead, it appears to be that the polar fisheye transformation maysimply be better suited to visual memory.
4 DiscussionOur results mapped out clear no-cost zones in all thetransformation types studied. We also found significant benefitsof grids in all transformation types except for polar fisheye.
0
2
4
6
8
0 0.5 1 2 3Fisheye transformation d factor
Tim
e (s
)
No GridRectangular GridPolar Grid
0
20
40
60
80
100
0 0.5 1 2 3
Fisheye tranformation d factorA
ccu
racy
(%
)
No GridRectangular GridPolar GridChance
Figure 4. Results for the polar fisheye experiments (d effect). Timedata points are averages with 95% confidence interval bars.Accuracy results are medians with quartiles.
0
20
40
60
80
100
orig scaled-dot antipolar-line polar-line rect-line
Acc
ura
cy (
%)
0
2
4
6
8
10
Tim
e (s
)
AccuracyTime
Figure 5. Results for the extended polar fisheye experiment. Timedata points are averages with 95% confidence interval bars.Accuracy results are medians with quartiles. orig = original image;scaled-dot = dot sizes transformed; antipolar-line = lines drawn asthe mirror image in the polar coordinate system; polar-line = linesdrawn in the polar coordinate system; rect-line = lines drawn in therectangular coordinate system.
4.1 Effects of Image TransformationsThis work is part of a series of investigations to map out the extentto which users can cope with geometric transformations in visualinterfaces. Our current results and those reported previouslysuggested that invariance was possible for all geometrictransformations for up to a point. Interestingly, this invarianceappeared to be more extensive in recognition than search tasks.For example, search task performance degraded after a 50%reduction, while memory task performance remained unaffectedeven at 20% of the original size. Participants could also tolerate a

larger distortion in rotation (memory: 45°; search: 17°), and polarfisheye transformation (memory: d = 1; search: d = 0.5)*.
While we applied the transformations to dot locations in most ofour experiments, we found interesting results when we applied thepolar fisheye transformation to dot sizes, and drew the connectinglines based on different coordinate systems. Contrary to our intui-tion, trials using images with lines drawn based on the polarcoordinate system were the least accurate, equivalent to blindguessing, while corresponding trials with supposedly unnaturalmirror images of these lines exhibit better performance. Theseresults suggest that distinctive local structure, rather than globalconsistency, was a more important factor in memorability. Atlarge distortions, the lines in the polar-line images formedsimilarly rounded shapes, while corresponding antipolar-lineimages produced figures with enough acute angles to remaindistinguishable, despite their blatant incongruity with theunderlying transformation and with the coordinate system.
Our finding that local structure is more important than globalconsistency may be a memory for the location of several itemsrather than a memory for a single coherent object. However, it isconsistent with the strategy reported by Christou et al. [2003] ofusing distinctive features for 3D object recognition. The visualmemory studied here is likely to be more closely related to thismemory for object recognition than to the rather different systemstudied by Hartley et al. [2004], where visual memory ofmovement in 3D space was found to depend on absolute size aswell as size ratio.
4.2 Effects of GridsAdding grids to the images appeared to help in two ways:
1. No-cost zone extension: The presence of either rectangular orpolar grid generally pushed the no-cost zone boundaries tohigher levels. For example, the combined no-cost zoneboundary for the fisheye transformations were increased fromd = 1 to d = 2, and the rotation boundary was pushed from 45to 60 degrees.
2. Accuracy improvement: Grids were found to improveaccuracy. For rotation, participants were 10% more accuratein grid trials without spending extra time in the task, thusruling out potential time-accuracy tradeoffs. In the case ofrectangular fisheye transformation, we found that partici-pants’ accuracy improved from chance to baseline at d = 2,and to 75% at d = 3, again without time compensation.Interestingly, we failed to observe substantial improvementby adding grids to polar fisheye transformed images. Here,the grids appeared to simply elevate response times slightly,echoing the results for visual search [Lau et al. 2004].
To understand the apparent lack of performance improvement inpolar trials, and to obtain further insights to the differenttransformation types and their interactions with grids, we revisitedthe design guidelines described in Section 1.
4.3 Revisiting design guidelinesMisue et al. [1995] suggested that horizontal/vertical ordering,proximity and topology should be maintained to minimizedisruptions incurred by image transformations. Scaling preservesall three; the limit of this transformation seems to be how far can
one reduce the image before the details can no longer beperceived. This finding is consistent with the common interfacedesign practice of using scaled-down versions of images torepresent full-resolution file contents, especially when the filecontent is visually salient, as in the cases of most image files andgraphically intense web pages. Indeed, various forms ofthumbnails have been suggested for small-screen devices to avoidthe laborious reauthoring of desktop-sized web pages for smallscreens [Woodruff et al. 2001; Wobbrock et al. 2002].
The rotation transformation violates horizontal/vertical orderingbut maintains proximity and topology. Interestingly, rectangulargrids fail to improve performance starting at a 90-degree rotation.Since our images did not have a clear up-down axis, this limit maybe due to our inability to recognize the main vertical axis and theup direction in the image. Having a rectangular grid may help re-orientation, but only if the information provided by the grid isunambiguous. For example, the grid looked the same for 0, 90 or180-degree rotations, and similarly for 30 or 120-degree and 60 or150-degree rotations. Taken together, our results suggested arefinement to Misue et al.’s guideline on maintaining orthogonalordering: transformation should preserve an orthogonalrelationship between principal axes with a clear up and down.
For both fisheye transformations, proximity is violated whilepreserving horizontal/vertical ordering and topology. In that case,the perceptual challenge is to discern the relative distance betweenobjects in the image. The polar fisheye transformation seemed tobe much better tolerated than its rectangular counterpart, asaccuracy was maintained at 75% even outside the no-cost zone inthe polar case while corresponding rectangular trials showedchance performance. This result was not expected, as the polartransformation’s rounded appearance does not look natural on arectangular screen [Leung and Apperley 1994]; among otherthings, it bends horizontal and vertical lines. Nonetheless, thepolar fisheye transformation is generally preferred over itsrectangular counterpart in map applications, since the distortionmay be perceived as consistent with the effect of distorting aplanar map onto a hemisphere, and the transformation preservesthe angle of the original image [Sarkar and Brown 1992; Churcheret al. 1997]. The polar fisheye transformation may also be morefamiliar than rectangular, as the effect resembles that produced bythe ultra-wide angle fisheye lens used in photography.
The number of transformation parameters and their degree ofintegration may further explain the smaller degree of degradationobserved in our polar fisheye trials. In the rectangular case, thewidth and height are transformed separately. Rectangles that arethe same distance from the focus point may not have the same sizeand shape. Objects may thus be distorted with different aspectratios based on their horizontal and vertical distances, which mayimpose a higher mental load [Bartram et al. 1995]. In contrast,the polar fisheye transformation only distorts radial distances, andmay not incur the same problem as the rectangular case.
This issue may also explain the different effects we observed inour fisheye transformation trials. In the rectangular fisheye trials,adding a polar or rectangular grid improved accuracy from chanceto 75% without time compensation. In contrast, neither arectangular nor a polar grid improved performance in thecorresponding polar fisheye trials. One possibility is that the grid,provided a powerful visual cue encoding standard distances intransformed images that helped to offset the difficulty in distanceestimation when the image was distorted, as in the rectangularfisheye case. Since distance transformation is integrated in polarfisheye transformations, distance estimation may not be asdifficult as in the rectangular case, thus nullifying potentialbenefits brought about by adding a grid.
*The Lau et al. [2004] experiments used a different fisheye polartransformation function with a transformation factor c . A c value of 1.2can be roughly translated to our d = 0.5.

Smooth animation is another technique believed to alleviate thedisruptive effects of image transformations [Robertson et al. 1989;Bederson and Boltman 1999]. Similar to our earlier work onvisual search [Rensink 2004; Lau et al. 2004], our current resultssuggest that the visual system could compensate for relativelylarge jumps in transformations. Both visual search and visualmemory have thus been ruled out as valid reasons for requiringsmooth animation. Nevertheless, the need for such animation mayarise from some other considerations, and so further investigationsare needed before advocating relaxing that design guideline.
5 ConclusionsWe examined the effects of four different types of transformationson visual memory: scaling, rotation, rectangular fisheye, and polarfisheye. We found no-cost zones in all of the transformation typesthat exceed those found in our earlier work on visual search. Wealso found substantial benefits in applying grids to images for allof our transformation types except for polar fisheye. Our worktherefore quantified the limits of our visual memory in copingwith geometric transformations, and validated the use of grids as avisual cue to aid recognition of images.
In this work we adopted the view that geometric transformationsimply affected the location of objects within a space. An equallyvalid view is to consider the transformation on the space itself,including the objects embedded within it. That view correspondsto transforming dot sizes and line shapes in addition to dotlocations, so visual cues providing more information about howthe space has transformed could improve performance. We brieflystudied this issue in our extended study on the polartransformation, where we looked at the effects of transforming dotsizes, and drawing the connecting lines in various coordinatesystems. Our results suggest that memorability may depend moreupon local image structure than on global consistency with theunderlying transformation and coordinate system. Furtherinvestigations are needed to establish this conclusion more firmly.
Our experiments looked at how a single and uniformtransformation affects visual memory. In real-life situations,images may transform by parts and independently. It would beinteresting to compare our results with those obtained usingmultiple transformations on a single image. We suspect theperceptual limits for multiple transformations will be muchsmaller than those established in our current set of experiments.We decided on a small number of dots in the stimuli to create anacceptable level of task difficulty, but scalability is of interest. Itwould be interesting to see if the total number of dots in thestimuli would impact visual memory in similar ways if the stimulicontain local features that are individually salient and memorable.
6 AcknowledgmentsWe would like to thank NSERC for funding, Minjung Kim andRaman Singh for their assistance in running the experiments, andMelanie Tory, Daniel Archambault, Peter McLachlan and JamesSlack for providing feedback on paper draft.
7 ReferencesBARTRAM, L., HO, A., DILL, J., AND HENIGMAN, F. 1995. The Continuous
Zoom: A Constrained Fisheye Technique for Viewing and NavigatingLarge Information Space. In Proc ACM UIST, 207-215.
BEDERSON, B.B., HOLLAN, J.D. 1994. Pad++: A Zooming GraphicalInterface for Exploring Alternate Interface Physics. In Proc ACM UIST,17-26.
BEDERSON, B., AND BOLTMAN, A. 1999. Does animation help users buildmental maps of spatial information. In Proc IEEE InfoVis, 28-35.
BEDERSON, B. 2000. Fisheye Menus. In Proc ACM UIST, 217-225.
BEDERSON, B., CLAMAGE, A. CZERWINSKI, M., ROBERTSON, G.G. 2004.DateLens: A fisheye calendar interface for PDAs. ACM ToCHI, 11(1),90-119.
CARPENDALE, M.S.T., COWPERTHWAITE, D.J. AND FRACCHIA, F.D. 1997.Making distortions comprehensible. In Proc IEEE Symposium on VisualLanguages, 36-45.
CHRISTOU, C.G., TJAN, B.S., BÜLTHOFF, H.H., 2003. Extrinsic cues aidshape recognition from novel viewpoints. Journal of Vision (3) 3, 183-198.
CHURCHER N., PR A C H U A B M O H , P. AND C H U R C H E R, C. 1997.Visualization techniques for collaborative GIS browsers. InternationalConference on GeoComputation.
GOLDSTEIN, A.G. AND CHANCE, J.E. 1971. Visual Recognition Memoryfor Complex Configurations. Perception and Psychophysics 9(2), 237-241.
HARTLEY, T., TRINKLER, I., BURGESS, N. 2004. Geometric Determinantsof Human Spatial Memory. Cognition 94(1), 39-75.
LAU, K., RENSINK, R.A., AND MUNZNER, T. 2004. Perceptual Invarianceof Nonlinear Focus+Context Transformations. In Proc ACM APGV, 65-72.
LEUNG, Y.K. AND APPERLEY, M.D. 1994. A Review and Taxonomy ofDistortion-Oriented Presentation Techniques. ACM ToCHI, 1(2), 126-160.
M ISUE, K., & EADES, P., & LAI, W. & SUGIYAMA, K. 1995. Layoutadjustment and the mental map. Journal of Visual Languages andComputing, 6(2) 183-210.
RAO, R. AND CARD, S. 1994. Table lens: Merging graphical and symbolicrepresentations in an interactive focus plus context visualization fortabular information. In Proc ACM CHI, 318-322.
RENSINK, R.A. 2004. The Invariance of Visual Search to GeometricTransformation. Journal of Vision 4.
ROBERTSON, G.G., C A R D , S.K., AND MACKINLAY, J.D. 1989. Thecognitive coprocessor architecture for interactive user interfaces. InProc. ACM UIST, 10-18.
ROBERTSON, G., CZERWINSKI, M., LARSON, K., ROBBINS, D., THIEL, D.,AND VAN DANTZICH, M. 1998. Data Mountain: using spatial memoryfor document management. In Proc ACM UIST, 153-162.
SARKAR, M. AND BROWN, M.H. 1992. Graphical fisheye views of graphs.In Proc ACM CHI, 83-91.
SKOPIK, A., AND GUTWIN, C. 2005. Improving revisitation in fisheyeviews with visit wear. In Proc ACM CHI, 771-780.
WOODRUFF, A., FAULRING, A., ROSENHOLTZ, R., MORRISON, J., A N D
PIROLLI, P. 2001. Using Thumbnails to Search the Web. In Proc ACMCHI, 198-205.
W OBBROCK, J., FORLIZZI, J., HUDSON, S., MYERS, B. WebThumb:Interaction Techniques for Small-Screen Browsers. 2002. In Proc ACMUIST, 205-208.
YEE, K.P., FISHER, D., DHAMIJA, R., HEARST, M. 2001. AnimatedExploration of Graphs with Radial Layout. In Proc IEEE InfoVis, 45-50.
ZANELLA, A., CARPENDALE, M. S. T., ROUNDING, M. 2002. On the effectsof viewing cues in comprehending distortions. In Proc ACM CHI, 119-128.