effector triggered immune response in arabidopsis thaliana ... · (macho and zipfel, 2015). plant...
TRANSCRIPT

1
Effector triggered immune response in Arabidopsis thaliana is a quantitative trait
Michail Iakovidis,* Paulo J. P. L. Teixeira,* Moises Exposito-Alonso,† Matthew G. Cowper,*
Theresa F. Law,‡ Qingli Liu,* Minh Chau Vu,* Troy Minh Dang,* Jason A. Corwin,* Detlef
Weigel,† Jeffery L. Dangl,*,‡,§ and Sarah R. Grant*,§,1
* Department of Biology, University of North Carolina, Chapel Hill, NC, 27599
† Department of Molecular Biology, Max Planck Institute for Developmental Biology, Tübingen,
Baden-Württemberg, Germany, 72076
‡ Howard Hughes Medical Institute, University of North Carolina, Chapel Hill, NC, 27599
§ Curriculum in Genetics and Molecular Biology, University of North Carolina, Chapel Hill, NC,
27599
Corresponding Author
1 4258 Genome Sciences Building, 250 Bell Tower Drive, Department of Biology, CB#3280,
University of North Carolina at Chapel Hill, Chapel Hill, NC, 27599
Phone number: +1 (919) 962-4470
Email: [email protected]
Genetics: Early Online, published on July 13, 2016 as 10.1534/genetics.116.190678
Copyright 2016.

2
ABSTRACT
We identified loci responsible for natural variation in Arabidopsis thaliana (Arabidopsis) responses
to a bacterial pathogen virulence factor, HopAM1. HopAM1 is a type III effector protein secreted
by the virulent Pseudomonas syringae strain Pto DC3000. Delivery of HopAM1 from disarmed
Pseudomonas strains leads to local cell death, meristem chlorosis, or both, with varying intensities
in different Arabidopsis accessions. These phenotypes are not associated with differences in
bacterial growth restriction. We treated the two phenotypes as quantitative traits to identify host
loci controlling responses to HopAM1. Genome Wide Association (GWA) of 64 Arabidopsis
accessions identified independent variants highly correlated with response to each phenotype.
Quantitative Trait Locus (QTL) mapping in a recombinant inbred population between Bur-0 and
Col-0 accessions revealed genetic linkage to regions distinct from the top GWA hits. Two major
QTL associated with HopAM1-induced cell death were also associated with HopAM1-induced
chlorosis. HopAM1-induced changes in Arabidopsis gene expression showed that rapid HopAM1-
dependent cell death in Bur-0 is correlated with effector-triggered immune responses. Studies of
the effect of mutations in known plant immune system genes showed, surprisingly, that both cell
death and chlorosis phenotypes are enhanced by loss of EDS1, a regulatory hub in the plant
immune signaling network. Our results reveal complex genetic architecture for response to this
particular type III virulence effector, in contrast to the typical monogenic control of cell death and
disease resistance triggered by most type III effectors.
INTRODUCTION
Plant pathogens have evolved complex strategies to circumvent the host innate immune response
and enhance virulence, including the use of effector proteins to disrupt host immune signaling
(Macho and Zipfel, 2015). Plant immunity functions through extra-and intra-cellular receptor
systems. Cell surface pattern recognition receptors (PRR) respond to pathogen molecules such
as flagellin by activation of a complex defense signaling cascade called MTI (or PTI) for microbe
(pathogen)-triggered immunity. MTI leads to production of reactive oxygen, secretion of
pathotoxins and reinforcement of cell walls at the infection site, which collectively protect the plant
from infection. Successful pathogens introduce into host cells effector proteins that interact with
components of the MTI response to dampen it, allowing the pathogen to evade host immunity. In
response, the plant immune system evolved an intracellular class of highly polymorphic immune
receptors, termed NLR proteins (Nucleotide binding Leucine-rich Repeat proteins; (Bonardi and
3
Dangl, 2012)). There are two classes distinguished by their N-terminal domains, TIR-NLR’s which
require the function of the defense protein EDS1 and CC-NLRs which are generally independent
of EDS1 (Feys et al., 2001; Wiermer et al., 2005). These proteins can associate with targets of
pathogen effectors that are presumably components of the MTI response, or decoys thereof
(Dangl and Jones, 2001; Dodds and Rathjen, 2010; Kroj et al., 2016; van der Hoorn and Kamoun,
2008). When the targets are perturbed by a pathogen effector, an associated NLR can be
activated, leading to an effector triggered immune response (ETI). ETI is often thought of as an
amplified MTI response (Jones and Dangl, 2006; Tao et al., 2003), commonly resulting in rapid
cellular desiccation and death at the site of attempted infection (Wright and Beattie, 2004). This
hypersensitive cell death response (HR) can isolate microbial pathogens and halt their
proliferation. Because effectors are required to suppress MTI, but can trigger ETI, successful
pathogens are under evolutionary pressure to continuously ‘re-sort’ their effector collections to
suppress MTI while avoiding NLR receptor activation. This evolutionary tug of war has led to
bacterial pathogens with diverse collections of effectors that often function through unusual
chemistries or via convergent evolution to mimic eukaryotic enzymatic functions (Cheong et al.,
2014; Fu et al., 2007; Zhang et al., 2007).
MTI and ETI are accompanied by dramatic changes in host hormone signaling and altered
expression of thousands of host genes (Howard et al., 2013; Lewis et al., 2015; Zipfel et al., 2006;
Zipfel et al., 2004). Pathogen effector proteins interact with specific host targets that potentially
influence only a sector or branch of this host immune output. Identification of host targets of
pathogen effectors has been a useful method to define and study subsets of the immune system
and to understand how they contribute to immunity (Deslandes and Rivas, 2012; Macho and Zipfel,
2015). Here, we investigated the genetics of natural variation in plant responses to toxic effects
of the Pseudomonas syringae type III secretion system effector HopAM1. P. syringae pv. tomato
DC3000 (Pto DC3000), a Gram-negative bacterium virulent on tomato and on Arabidopsis, is an
extensively studied model pathogen for plant-microbe interactions (Chang et al., 2005; Cunnac
et al., 2011; Lewis et al., 2015; Schechter et al., 2006; Xin and He, 2013). Pto DC3000 has at
least 30 type III effector genes including two nucleotide sequence-identical copies of hopAM1,
one in the genome (PSPTO_1022) and one in the plasmid (PSPTO_A0005) (Buell et al., 2003).
The hopAM1 gene is sporadically dispersed among phylogenetically diverse P. syringae isolates
(Arnold et al., 2001; Baltrus et al., 2011) and other Gram-negative plant pathogen groups, such
as Ralstonia, Xanthomonas and Pantoea (Integrated Microbial Genomes, http://img.jgi.doe.gov/)
(Nordberg et al., 2014). HopAM1 was originally identified from P. syingae pv. pisi via its ability to

4
trigger a presumably NLR-mediated ETI response on some pea cultivars (Cournoyer et al., 1995).
Addition of hopAM1 to the effector complement of the weakly pathogenic strain P. syringae pv.
maculicola (Pma M6CdE) conferred a growth advantage on Arabidopsis (Goel et al., 2008).
Furthermore, hopAM1 was one of eight type III effector genes that collectively restored nearly full
virulence when added back to a completely growth-defective derivative of Pto DC3000 from which
the 28 most strongly expressed type III effector genes had been removed by sequential deletion,
Pto DC3000D28E (Cunnac et al., 2011). Like many other type III effectors, HopAM1 has toxic
effects when over-expressed from a transgene in plants (Goel et al., 2008) and even in yeast
(Munkvold et al., 2008). This latter phenotype has hampered approaches to define the
biochemical function of HopAM1.
HopAM1 induces two unusual responses on Arabidopsis which are both variable across
Arabidopsis accessions. HopAM1 can induce meristem chlorosis on many accessions; noted as
emergence of chlorotic leaves 5 to 10 days after onset of HopAM1 expression when expressed
from a conditionally induced transgene in Arabidopsis or following inoculation of plant leaves with
disarmed Pseudomonas strains designed to deliver HopAM1 by type III secretion. The effect
appears to be systemic since it was not possible to recover any of the inoculated bacterial strain
from the chlorotic leaves that emerged following hand inoculation of more mature leaves (Goel et
al., 2008). Disarmed Pseudomonas strains expressing hopAM1 can also induce local cell death
in leaves at the infiltration site and the timing of onset is variable across inbred Arabidopsis
accessions. We exploited this natural variation in Arabidopsis responses to HopAM1 to define
host loci that control them. Using linkage analyses in both experimental crosses and the global
population to describe the genetic architecture of the response to HopAM1, we identified multiple
loci associated with differential response to HopAM1 for both cell death and meristem chlorosis.
MATERIALS AND METHODS
Arabidopsis thaliana germplasm, propagation and growth conditions: Seeds were
germinated on a mix of potting soil (13:6:3 Metro-Mix 360 : baked sand : Perlite; 1.4 gr of Peters
20-20-20 “All Purpose Fertilizer” and 0.85 ml of Marathon per liter of soil mix), stratified 5 days at
4 °, transferred to growth chambers and grown for 9 hours under light (5900 lux) and 15 hours in
dark at 21 ° (day) and 18 ° (night), 45-50% relative humidity. For propagation, plants were
transferred to a long day (15 hours light) greenhouse with similar conditions. Plants for HopAM1-
induced meristem chlorosis were prepared differently as described below. Col-0 x Bur-0

5
Recombinant Inbred Line (RIL) population was obtained from Christine Camilleri (INRA, France)
(Simon et al., 2008). A. thaliana accessions, mutant and transgenic CS_ and SALK_ lines were
obtained from ABRC (Ohio State University, USA). The eds1-2 line is a null mutant introgressed
from a mutant in the accession Ler-0 into the Col-0 background (Bartsch et al., 2006). Mutant
lines axr2-1, abi1-1 and aba2 were obtained from Jason Reed (UNC-Chapel Hill, USA) (Nagpal
et al., 2000), ein2-5 and ein2-50 from Joseph Kieber (UNC Chapel Hill, USA) (Wang et al., 2007),
the global DELLA quintuple mutant from Salomé Prat (Centro Nacional de Biotecnologia, Madrid,
Spain) (Cheng et al., 2004), and the triple TOC64 mutant from Úrsula Flores Pérez (Oxford
University, Oxford, UK) (Aronsson et al., 2007).
Bacterial strains and growth assay: A list with strains and phenotypes assayed can be found
in Table S1. Bacterial strains were maintained and grown as described (Chung et al., 2011) and
in planta growth assays were done as described (Chang et al., 2005). Bacterial strains were grown
in King’s B (KB) liquid media at 28 ° with shaking overnight. Antibiotic concentrations used for P.
syringae, P. fluorescens and P. maculicola were: 50 μg/ml rifampicin, 50 μg/ml kanamycin, 10
μg/ml spectinomycin, 5 μg/ml tetracyclin. Weighted ANOVA was used to compare bacterial
growth differences between strains from multiple experiments in Col-0 and Bur-0. Comparisons
among the groups were done using Tukey’s post-hoc test.
DNA extraction and PCR conditions for genotyping: We modified the protocol from (Klimyuk
et al., 1993) as follows. Plant material (1-2 young leaves) was harvested and placed in a well
(Deepwell plate 96/2000 μl; Eppendorf) along with a 4mm borosilicate glass ball and 400 μl 0.25
M NaOH. Samples were then homogenized at 1200 strokes/min for 1 min (2000 GENO/GRINDER,
Spex-CentriPrep). Plates were centrifuged for 1 min at 1000 rpm to precipitate plant tissue. 50 μl
of supernatant were transferred into a 96-well PCR plate (Non-Skirted, MultiMax) and heated at
96° for 30 sec in a Peltier Thermal Cycler (BIO-RAD, DNA-Engine) with open lid. 50 μl of 0.25 M
HCl were added to neutralize the sample, and 25 μl of alkaline lysis buffer (0.5 M Tris-HCl pH 8.0,
0.25% v/v IGEPAL CA-630) were added immediately after, mixing the samples by pipetting. The
PCR plate was heated again at 96° for 120 sec and left to cool at room temperature for 5 min. 1-
2 μl of DNA sample were used for PCR for genotyping. PCRs were set for a 7 min “Hot-Start”
step at 95°, followed by 35 cycles of 30 sec 95° denaturation, 30 sec X (primer-specific)°
annealing and 60 sec 72° extension, concluding with a 5 min 72° final extension. Optimized 10x
PCR buffer was used for genotyping (0.11 M KCl, 0.11 M (NH4)2SO4, 0.24 M Tris-HCl (pH 8.3),

6
0.022 M MgCl2, 0.6% v/v Triton X-100, 1.6% v/v Tween 20, 1.2% v/v NP-40, 1.5% v/v formamide,
0.1 mg/ml BSA, 10% v/v glycerol, 0.02 M TMAC).
HopAM1-induced cell death assay: Cell death symptoms induced by bacteria were scored
following trypan blue staining (Boyes et al., 1998) at various time intervals. 5-6 week old plants
were hand inoculated with bacteria. Inocula with Pto-derived strains were adjusted to OD600 0.1
(~5 x 10⁷), and with Pfo or Pma strains to OD600 0.2 (~1 x 10⁸ cfu/ml) in 10 mM MgCl2. For
phenotyping, 3-4 leaves of 5-week old plants were marked with a Sharpie felt pen on the axial
side and the abaxial side was hand inoculated with Pto DC3000D28E(hopAM1) (see Table S1),
and scored for cell death response at 24, 26, 32, 48, 72, and 96 hours post inoculation (hpi)
(Figure 1C). Quantitative scoring of cell death symptoms ranged from “5” (apparent by 24 hpi) to
“0” (not apparent by 96 hpi) based on the time point that symptoms were first observed.
HopAM1-induced meristem chlorosis assay: Tissue culture plates (6-well; #353046 Falcon)
were filled with sifted soil mix (prepared as described (Boyes et al., 1998; Holt et al., 2002). Each
plate was then covered with nylon mesh and fastened with 4 wide rubber bands. Four plastic head
pins were placed inside the corners of each plate to provide aeration during germination and
support during vacuum infiltration. Five to ten seeds were sown on each soil mount; plate lids
were then placed on the pins and plates were moved to 4 ° for 4-5 days. Seedlings were thinned
to a single plant in the middle of each mount. Three 4-week old plants per line were vacuum
infiltrated with Pto DC3000D28E(hopAM1) and scored for chlorotic rosette phenotype at 10 days
post inoculation (dpi): Plates were placed inverted in a rectangular plastic container filled with
bacterial inoculum (OD600 0.05 (~2.5 x 10⁷ cfu/ml), 10 μM MgCl2, 60 μl/l Silwet L-77 surfactant), 4
cm deep and vacuum was applied for 100-120 seconds. Plants were transferred into growth
rooms. Phenotypic scores were assigned based on visible chlorosis in rosettes at 10 dpi. The
phenotype was recorded as “any response” (1) or “no response” (0).
QTL analysis: Cell death. Three F8 plants each of 342 lines from a Col-0 x Bur-0 RIL mapping
population (Simon et al., 2008) were scored for HopAM1-induced cell death, following hand
inoculation with Pto DC3000D28E(hopAM1). Initial QTL analysis on the 89 markers spanning 5
chromosomes of A. thaliana was performed by CIM using WinQTL Cartographer 2.5.011 (Wang
et al., 2012). After the detection of several QTL, the entire RIL population was reannotated using
60 additional markers to provide extra resolution for CIM. New markers were selected proximally
and distally for each marker within the QTL regions detected. Mapping distances were
7
recalculated using MapMaker 3.0 (Lincoln et al., 1992). For detecting QTL, a LOD score of 3.2
was chosen based on 1000 permutations at p≤0.01 for CIM. Walking speed was 0.5 cM and
window size 10 cM. Epistatic interactions between the QTL identified in CIM were investigated in
detail using a general linear model structure (Brady et al., 2015), which provides more power than
traditional pairwise t-tests in factorial interaction studies, by using the ANOVA framework.
Meristem chlorosis. Three plants per Col-0 x Bur-0 RIL (Simon et al., 2008) were scored for
HopAM1-induced meristem chlorosis at 10 and 14 dpi, following vacuum infiltration with Pto
DC3000D28E(hopAM1). CIM was performed again on the original genotyping data (89 markers)
and the reannotated data (89+60 markers). For detecting QTL, a LOD score of 3.2 was chosen
based on 1000 permutations at p≤0.01 for CIM. Walking speed was 0.5 cM and window size 10
cM. Other parameters were set at default. The model for corrected means that was used before
for HopAM1-induced cell death (see Table S2) was not suitable for the binary nature of
phenotypes for HopAM1-induced meristem chlorosis and was not included in the model.
Phenotypic scores for all 342 RILs were assigned as observed (with at least one responsive
replicate resulting in a score of “1”). Symptoms similar to HopAM1-induced cell death and
meristem chlorosis have not been observed before in untreated Col-0 x Bur-0 RILs (Chavigneau
et al., 2012; Gery et al., 2011; Simon et al., 2008).
GWA analysis: To obtain a species-wide view of HopAM1-induced cell death and meristem
chlorosis, we assayed 98 A. thaliana accessions (ABRC). For most of our accessions (n=64),
whole-genome sequences were available (http://1001genomes.org). (1001 Genomes Consortium,
2016). We used 4,004,754 SNPs with 0.98 genotyping rate and Minor Allele Frequency > 5% to
perform GWA analyses, using a linear mixed model to correct for population structure,
implemented in the Efficient Mixed-Model Association eXpedited (EMMAX) package (Kang et al.,
2010), as this has been proven to be efficient for Arabidopsis (Atwell et al., 2010). This model fits
an additive genetic variance factor using a kinship matrix, which allows calculation of narrow
sense heritability for the GWA population. To test the significance of the genetic variance factor,
we used a likelihood ratio test comparing the fit of the full model against the null model without
the kinship matrix. Allele effect sizes were reported as standardized regression coefficients or
“beta”. They are interpreted as the difference between genotypes carrying the minor allele
frequency (MAF) allele to those with the reference allele, and are expressed in standard
deviations of the phenotype. Enrichment of top SNPs in QTL peaks was tested using a Fisher’s
exact test with 2X2 tables of counts as follows:

8
Top GWA SNPs inside QTL range: Total SNPs inside QTL range/
Top GWA SNPS in the chromosome of the QTL: Total SNPs in the chromosome of the QTL.
Confocal Microscopy: Small leaves (5 mm diameter) were collected 14 days after vacuum
infiltration with Pto DC3000(hopAM1). The abaxial side of Col-0 and Bur-0 leaves was observed
using a C-Apochromat 40X/NA1.2 water immersion lens on a Zeiss LSM710 confocal laser
scanning microscope. Autofluorescence was observed using a 560 nm diode laser line for
excitation and the PMT (photomultiplier tube detector) collected emission bandwidth set at 568-
740 nm. The confocal images were edited with ZEN 2009 software.
RNA sequencing: We used RNA-seq to investigate HopAM1-associated changes in the
transcriptome of infected Arabidopsis leaves. Five-week-old plants grown under short days were
hand-infiltrated (OD600 = 0.1, ~2.5x10⁷ cfu/ml) with the control strain Pto DC3000D28E
transformed with the empty vector pJC531; or with Pto DC3000D28E(hopAM1) (Goel et al., 2008).
The accessions Col-0 and Bur-0 were used in the experiment. Samples were harvested
immediately before (T = 0 hours) and 2, 4, 6, 8, 10 and 12 hrs after bacteria infiltration. Three
biological replicates were analyzed per condition, each consisting of three 7 mm discs collected
from the inoculated leaf of one individual plant. Samples were frozen in liquid nitrogen and ground
using glass beads and the Tissue Lyser II system (Qiagen). Total RNA was extracted using TRIzol
(Invitrogen), DNase treated (Ambion Turbo DNase), and purified using the RNeasy Mini kit
(Qiagen). 1 µg was used to prepare Illumina-based mRNA-seq libraries. Quality control and
quantification of the final libraries were performed using the 2100 Bioanalyzer (Agilent) and the
Quant-iT PicoGreen dsDNA Reagent (Invitrogen). Barcoded libraries were combined into a single
pool and sequenced in two lanes of an Illumina HiSeq2500, resulting in an average of 2.1 million
50 bp single-end reads per library.
RNA-seq reads were mapped using TopHat (Trapnell et al., 2009), allowing only one mismatch
and discarding any read that mapped to multiple positions. The TAIR10 assembly was used as
the reference genome for Col-0, whereas the assembly available at
http://mus.well.ox.ac.uk/19genomes/ was used as the reference for Bur-0 (Schneeberger et al.,
2011). Approximately 90% of reads could be mapped to the Arabidopsis genome. Reads mapped
to nuclear protein-coding genes were counted using HTSeq (Anders et al., 2015) and the package
edgeR (Robinson et al., 2010) was used to define differentially expressed genes between plants
infiltrated with Pto DC3000D28E(hopAM1) and Pto DC3000D28E(EV) at each time point. Genes

9
with FDR lower than 0.05 and a fold-change variation greater than 2 were considered differentially
expressed between conditions. All nuclear protein-coding genes were tested for differential
expression without the adoption of thresholds to filter out weakly expressed genes. Gene
Ontology (GO) enrichment analyses were performed with the PlantGSEA platform (Yi et al., 2013)
using the sets of differentially expressed genes. Transcriptional activation of chosen gene sets
was represented as the median z-score transformed expression values (in RPKM - Reads Per
Kilobase of transcript per Million mapped reads).
Data availability: Bacterial strains are available upon request. All data necessary for reproducing
QTL results and complete edgeR results for RNA-seq data can be found as Supplemental
Materials. Raw RNA sequencing data are available at the NCBI Sequence Read Archive under
the accession number SRP075162.
RESULTS
The quantitative nature of HopAM1-induced cell death. Previously, we cloned 93 type III
secretion system effectors from Pseudomonas syringae isolates (Baltrus et al., 2011) and
transferred them individually into an engineered strain of the non-pathogenic P. fluorescens
bacterium carrying a heterologous type III secretion system apparatus (Thomas et al., 2009).
Disease resistance responses are often qualitative, and we hoped to identify several such host
responses across this survey. HopAM1 induced obvious cell death in some accessions. To better
define the distribution of phenotypes across the host species and to identify accessions that would
be suitable for mapping in experimental crosses, we re-screened a collection of 98 accessions
delivering HopAM1 by infection with the disarmed bacterial strain Pto DC3000D28E (Cunnac et
al., 2011) bearing a plasmid with the hopAM1 gene with a C-terminal HA tag expressed from its
own promoter (Goel et al., 2008). Although its virulence is severely reduced, Pto DC3000D28E
stimulates MTI effectively and is at least as effective as P. fluorescens for delivery of type III
effectors. Following hand inoculation of leaves with Pto DC3000D28E(hopAM1), we observed a
range of cell death responses at the site of inoculations that varied between Arabidopsis
accessions in the timing of onset of cell collapse (see Figure S1, Table S3). Bur-0 showed strong
cell death symptoms at 24 hpi; and Col-0 did not suffer from any symptoms, not even microscopic
lesions visible with Trypan blue staining (see Figure S2), until 6 dpi (~144 hpi) (Figure 1 A-B).
Analysis of an F2 population (468 plants) of Bur-0 x Col-0 demonstrated non-Mendelian

10
segregation of HopAM1-induced cell death (see Table S4). Therefore, we followed the timing of
appearance of cell death symptoms after inoculation to derive a quantitative cell death score
(Figure 1C).
Screening and reannotation of Bur-0 x Col-0 RILs: We explored the genetic architecture
driving HopAM1-induced cell death using an established Bur-0 x Col-0 F8 recombinant inbred line
(RIL) population (Simon et al., 2008) screened with Pto DC3000D28E(hopAM1). Cell death
symptoms developed continuously over time after inoculation (see Figure S2) in the RIL
population and phenotyping was performed following the numerical scoring system illustrated in
Figure 1C. Two individual plants from each RIL were infiltrated with Pto DC3000D28E(hopAM1)
and tissue was harvested from both for genotyping (see Table S5). The distribution of phenotypic
scores among the RILs was similar (see Figure S3) to the distribution of the 98 A. thaliana
accessions screened previously, where most lines presented with intermediate cell death
phenotypes (see Figure S1) (Kolmogorov-Smirnov Test for similarity between distributions; D =
0.18, p-value = 0.014). The parental accessions Col-0 and Bur-0 had the most extreme
phenotypes, and there was no transgressive segregation among RILs. To evaluate the heritability
of the cell death response in the RILs, a second screen of the RIL population was performed, and
the initial phenotypic scores were adjusted to control for environmental effects using a general
linear model (Brady et al., 2015; Chan et al., 2011) (see Table S2). The broad sense heritability
(H2) within the RILs for HopAM1-induced cell death was high (H2=95.4%, p-value < 2e-16), with a
very low amount of phenotypic variation being controlled by combined experimental factors
(H2=0.06%) (see Table S2).
Five Arabidopsis loci additively control HopAM1-dependent cell death in the Bur-0 x Col-0
cross: Composite Interval Mapping (CIM) performed among the RILs identified five loci on
chromosomes 1 (QTL1 = 0.0 – 8.4 Mb), 2 (QTL2 = 8.7 – 11.1 Mb), 4 (QTL4 = 0.0 – 5.79 Mb), and
5 (QTL5A = 16.3 – 21.3 Mb; QTL5B = 25.9 – 26.9 Mb) (Figure 1D, Table S6) (Wang et al., 2012).
We screened putative HIFs (Heterozygous Inbred Families) derived from the RIL population for
segregation at QTL4, QTL5A and QTL5B to fine map the loci controlling HopAM1-induced cell
death in the Bur-0 x Col-0 background. We progeny tested several RILs with a heterozygous
haplotype for the QTL region of interest to identify segregating lines and then chose a few lines
for subsequent fine mapping of each QTL (see Figure S4). QTL4 was delimited within the
centromeric region of chromosome 4 (in Col-0 containing many genes of unknown function,
several cysteine rich receptor-like kinases, and one TIR-NLR, (At4g04110)). However, due to low

11
recombination near the centromere, we could not reduce the size of the associated interval further.
Thus, we focused our fine mapping efforts on QTL5A and QTL5B. QTL5A was delimited within
296 kb (18.682 – 18.978 Mb) (containing genes of various function, including many TIR-NLR
genes and the plasma membrane localized receptor kinase protein FLS2 (At5g46330) which
recognizes bacterial flagellin peptides that stimulate MTI responses (Zipfel et al., 2004). QTL5B
was delimited to within 110 kb (26.639 – 26.749 Mb) (containing 30 genes, including MAPKK
kinases and CC-NLR genes). The Col-0 gene annotations for the regions in QTL4, 5A and 5B are
listed in Table S7. We found only additive effects between the QTLs using an ANOVA for each
QTL pair from the initial CIM mapping to identify pairwise epistasis contributing to the HopAM1-
induced cell death response (see Figure S5, Table S8) (Brady et al., 2015). However, our
population sizes may be too small to effectively evaluate higher order epistasis (Joseph et al.,
2013; Taylor and Ehrenreich, 2014).
HopAM1-induced cell death is affected by EDS1, HSP90.2 and SGT1B: To assess if HopAM1-
induced cell death is affected by genes known to be required for disease resistance, we made
several crosses between the Bur-0 accession and Col-0 loss of function mutants in defense-
related genes: sid2-1 (Wildermuth et al., 2001), sgt1b (Austin et al., 2002), rar1-21 (Tornero et
al., 2002), ndr1-1 (Century et al., 1995), eds1-2 (Bartsch et al., 2006), hsp90.2-3 (Hubert et al.,
2003), pad4-1 (Glazebrook et al., 1996) and adr1-1 (Grant et al., 2003). A total of 96 F2 progeny
from each cross were genotyped and plants homozygous at markers flanking each Col-0-derived
mutation in the respective crosses were selected for cell death phenotyping. As a comparative
control, 96 plants from a Bur-0 x Col-0 F2 progeny were screened for cell death and subsequently
genotyped with the same markers used for the specific mutation in each cross. In Figure 1E, the
phenotypes of the F2 plants homozygous for a Col-0-derived mutant allele from the Col-0 mutant
x Bur-0 cross are presented next to the phenotypes of plants from the subset of control Bur-0 x
Col-0 F2s which were homozygous for the wild type Col-0 allele for the relevant gene. Our results
indicated that eds1-2, hsp90.2-3 and sgt1b affect HopAM1-induced cell death symptoms from
Bur-0 (Figure 1E). Homozygosity for either the hsp90.2 (hsp90.2Col-0) or sgt1b mutant allele
(sgt1bCol-0) in Bur-0 x Col-0 background attenuated HopAM1-induced cell death symptoms
compared to their respective Bur-0 x Col-0 control populations. Because HSP90.2 and SGT1b
are part of a steady state NLR chaperone complex required for NLR ETI receptor activation (Holt
et al., 2005; Hubert et al., 2003; Shirasu, 2009), this is consistent with the hypothesis that at least
one of the cell death QTL loci (Figure 1D) contains a functionally relevant NLR gene. The eds1-2
mutation in the Bur-0 x Col-0 background enhanced the onset of HopAM1-induced cell death

12
symptoms (Figure 1E) which was unexpected because EDS1 is required for the function of TIR-
NLR proteins (Feys et al., 2001). The other defense mutations we tested had no effect.
Genome wide association reveals additional loci associated with HopAM1 cell death. A
disadvantage of QTL experiments is that the identified loci may represent rare, deleterious alleles
compared to the entire population surveyed. Genome Wide Association (GWA) screens can
complement QTL studies by identification of loci that do not have segregating alleles in the two
RIL founder populations (Gibson, 2012; Weigel and Nordborg, 2015). We used 64 of the 98
accessions we had screened previously for a GWA study (see Table S3) because whole-genome
resequencing data were available for them (http://1001genomes.org) (1001 Genomes
Consortium, 2016). The most significantly associated SNPs did not overlap with the intervals
defined by the Bur-0 x Col-0 QTL analysis (Figure 2) but we found enrichment in the QTL regions
when we considered the 50 (or more) most significantly associated SNPs in same chromosome
as the QTL (Table 1). The narrow sense heritability calculated for this study was h2=34.5%,
(Likelihood Ratio Test, p=0.430) and the allele frequencies of the SNPs with the strongest allele
effects were generally shifted towards low minor allele frequency (see Figure S6A), consistent
with a polygenic architecture for the trait according to an infinitesimal model (Gibson, 2012). The
SNPs most significantly associated with variation in HopAM1-induced local cell death were two
peaks with multiple significantly associated single nucleotide polymorphisms (SNP) on
chromosome 2, and single SNPs on chromosomes 1 and 2 (Figure 2). Five out of the 10 most
significant SNPs fell within a 154 bp non-coding region between At1g50420, encoding the
SCARECROW-LIKE 3 transcription factor (SCL3), a positive regulator of gibberellic acid signaling
(Zhang et al., 2011) and At1g50430 (STEROL DELTA-7 REDUCTASE), which encodes a sterol
reductase involved in brassinosteroid synthesis (Lecain et al., 1996) (see Table S9). The most
significantly associated SNP was on chromosome 2 in the 4th exon of CYCLOPHILIN40
(At2g15790) which encodes a protein isomerase that functions in maturation of the AGO1-
containing RISC complex important to epigenetic gene regulation (Iki et al., 2012; Romano et al.,
2004; Smith et al., 2009). Aligning the haplotypes available from the 1001 Genomes Project that
were used in our GWA over a 30 kb region spanning the CYCLOPHILIN40 gene showed a
correlation between haplotype and the HopAM1-dependent cell death phenotype (see Figure S7).
Other biparental populations have HopAM1-induced cell death QTLs that overlap with Bur-
0 x Col-0 QTL5A: To explore the differential genetic architecture driving HopAM1-induced cell
death among the accessions, we screened three different biparental mapping populations to

13
investigate whether HopAM1-induced cell death is also a quantitative trait in other accessions.
We scored plants from three other populations with parents divergent in their cell death
phenotypes, but not as divergent as Bur-0 x Col-0: a Ler-0 x Col-4 RIL population (CS1899), a
Sha x Col-0 F2 population, and a Ws-2 x Col-0 F2 population for HopAM1-induced cell death (see
Table S10). Ler-0 and Ws-2 had cell death scores of 2 and the Sha score was 4 (see Table S3).
All three populations exhibited a continuous phenotypic response similar to the Bur-0 x Col-0
background, but with weaker phenotypes. We again observed no transgressive segregation. We
performed a CIM analysis to identify the loci controlling the trait in all three backgrounds and to
search for overlap with the loci identified in the Bur-0 x Col-0 background (see Figure S8). In the
Ler-0 x Col-4 background, two QTL were identified on chromosome 1 (16.1 – 22.2 Mb) and
chromosome 5 (15.4 – 20.9 Mb), and in the Ws-2 x Col-0 and Sha x Col-0 backgrounds, one QTL
was identified that was solely responsible for the HopAM1-induced cell death (chromosome 5,
14.7 – 23.8 Mb for Ws-2 x Col-0; 8.4 – 20.1 Mb for Sha x Col-0). The QTL identified on
chromosome 5 for all three mapping populations (Ler-0 x Col-4, Ws-2 x Col-0, Sha x Col-0)
overlapped with QTL5A from the Bur-0 x Col-0 RIL population (16.3 – 21.3 Mb), possibly
suggesting that the common parent, Col-0/Col-4, carries an unusual allele at this locus.
HopAM1-induced cell death and chlorosis are not associated with bacterial growth
restriction in both Col-0 and Bur-0: HopAM1 induces obvious phenotypes, but it is unclear how
these might be related to the restriction of pathogen growth, the effect most relevant to the host.
HopAM1 enhances the growth of a weakly virulent P. syringae strain Pma (M6CdE) in the Ws-2
accession, but not in several other accessions tested (Goel et al., 2008). Thus, HopAM1 is a weak
virulence factor, at least on Ws-2. To determine if the different cell death responses of Bur-0 and
Col-0 to HopAM1 were correlated with differences in the ability to restrict pathogen growth via
recognition of HopAM1, we infected Bur-0 and Col-0 with Pto DC3000. This strain grew to levels
associated with disease in both accessions (Figure 3), with slightly higher titers in Bur-0. To
determine if the endogenous hopAM1 genes affect the growth of Pto DC3000 in these accessions,
we infected Col-0 and Bur-0 with a Pto DC3000 derivative, Pto JB206, which lacks both the
chromosomal (PSPTO_1022) (Boch et al., 2002) and plasmid borne (PSPTO_A0005) (Landgraf
et al., 2006) copies of hopAM1. We found a small, statistically significant, growth advantage of
Pto JB206 over Pto DC3000 in both Bur-0 and Col-0 (Figure 3). This growth advantage
disappeared from both accessions when Pto JB206 was complemented with the plasmid carrying
hopAM1 (Figure 3). Thus, HopAM1 is recognized by both accessions, at least to an extent
sufficient to trigger growth restriction and there is no genetic difference between Bur-0 and Col-0

14
for this pathogen growth restriction. We infer that both accessions recognize and respond to
HopAM1 at levels sufficient to trigger weak ETI; however only in Bur-0 does the signal delivered
by HopAM1 result in ETI-associated cell death.
Overlapping and distinct QTL for HopAM1-induced meristem chlorosis and cell death:
HopAM1 induces a chlorotic phenotype in newly developed leaves when delivered by a bacterial
strain (Pma M6CdE) via hand infiltration or following transgenic expression of hopAM1 in
Arabidopsis (Goel et al., 2008). An improved vacuum infiltration assay was devised using Pto
DC3000D28E(hopAM1) (see Materials and Methods). All 64 accessions used in our GWA for
HopAM1-induced cell death response (see Table S2) were rescreened for HopAM1-induced
meristem chlorosis. While most of the accessions exhibited meristem chlorosis at 7 dpi, twelve
remained non-chlorotic (see Table S11). In fact, Col-0 exhibited strong meristem chlorosis and
Bur-0 was non-responsive, highlighting the contrasting underlying genetics of these two
accessions in response to HopAM1 (Figure 4A). Of the three accessions that exhibited the highest
cell death scores (Bur-0, Hov-4, and Wil-2; see Table S11), only Bur-0 did not exhibit HopAM1-
induced meristem chlorosis. Hence, HopAM1 cell death and meristem chlorosis inducing activities
are not mutually exclusive. Confocal laser microscopy of Col-0 and Bur-0 newly emerged chlorotic
leaves at 14 days after infection revealed that the chloroplasts in Col-0 were smaller, deformed,
and exhibited a much weaker fluorescence signal, while the chloroplasts in the corresponding
leaves in Bur-0 appeared normal (Figure 4B). Furthermore, Col-0 chlorotic leaf tissue had smaller,
round-shaped mesophyll cells, while Bur-0 had wild-type cell morphology (Figure 4B). We used
the Bur-0 x Col-0 RIL population (Simon et al., 2008) again to identify loci controlling the HopAM1-
induced meristem chlorosis. To assess the heritability of the meristem chlorosis trait in the RILs,
we performed a second screen of a subset of the RIL population (162 lines with the highest
number of recombination events were chosen). We tested the influence of environmental effects
on our meristem chlorosis phenotype scores using a general linear model as before (Chan et al.,
2011) (see Table S12). The broad sense heritability of the HopAM1-induced meristem chlorosis
trait was H2 = 60.7%, p-value < 2e-16. Using the reannotated Bur-0 x Col-0 RILs, we performed a
CIM that revealed three loci on chromosomes 4 (QTL4c1 = 0.9 – 5.2 Mb, QTL4c2 = 6.9 – 15.7
Mb) and 5 (QTL5c = 18.3 – 24.1 Mb) (Figure 4C, Table S13). The genomic regions of QTL4c1
and QTL5c overlap with the HopAM1-induced cell death QTL4 (0.0 – 5.79 Mb) and QTL5A (16.3
– 21.3 Mb), but the most significant chlorosis locus, QTL4c2, was distinct from all QTL identified
for HopAM1-induced cell death.

15
HopAM1-induced cell death and meristem chlorosis traits are independent among wild
accessions: We also performed GWA mapping for HopAM1-induced meristem chlorosis among
the 64 accessions that we had screened for HopAM1-induced cell death (see Table S11). The
narrow sense heritability for the GWA study was h2=20.9% (Likelihood Ratio Test, p=0.625) and
the most significant SNPs tended to have low minor allele frequencies (see Figure S6B). There
was an enrichment of the most significantly associated SNPs with QTL4C2 (Table 2). However,
the only peak above the stringent Bonferroni significance level was outside of the QTL intervals
(Figure 5). This SNP and three more of the 10 most significant meristem chlorosis SNPs
(FDR≤0.05; including the top hit) fell within a 235 bp region between the 3rd and 4th exon of
TOC64-III (At3g17970) which encodes a protein of the chloroplast outer envelope membrane
transport complex (Sommer et al., 2013) (see Table S14). In total, 27 out of 50 top hits fell within
a 2 kb region of TOC64-III (3rd to 9th exon). Alignment of all the 1001 Genomes haplotypes that
were used in the GWA study across a 30 kb region spanning the top SNP indicated a correlation
between TOC64-III haplotype and HopAM1-induced meristem chlorosis response (see Figure
S9). Single toc64-III mutants, and a toc64 triple mutant (Materials and Methods) were tested in
the background of the meristem chlorosis-responsive accession Col-0. All toc64 mutants,
including the triple mutant, were responsive for HopAM1-induced meristem chlorosis,
indicating that lack of TOC64 is not sufficient to prevent the effect.
We also screened additional Arabidopsis mutants for lack of HopAM1-induced meristem chlorosis
(see Table S15). The double mutant rbohd rbohf (CS68522) (Torres et al., 2002) was not
responsive, suggesting that superoxide derived from this NADPH oxidase complex is required for
the phenotype. Both eds1-2 and an ein2-1 pad4-1 sid2-2 (CS66006) triple mutant enhanced the
meristem chlorosis by extending the duration of time in which plants produced chlorotic leaves
compared to controls (see Figure S10). Neither the ein2-1 sid2-2 double mutant nor pad4-1
exhibited this enhanced chlorosis. EDS1 and PAD4 proteins interact and potentiate accumulation
of salicylic acid (SA) in pathogen infected tissues, potentially through regulation of TIR-NLR action
(Feys et al., 2001; Rietz et al., 2011; Wagner et al., 2013). SID2 encodes isochorismate synthase
(ICS1) required for production of SA (Wildermuth et al., 2001). The extended chlorosis response
of these two mutant lines suggests HopAM1 chlorosis is limited in timing through EDS1 function.
All other Col-0 background mutant lines were similar to the parental Col-0 accession.
Host transcriptional signatures indicate that HopAM1 suppresses MTI but also induces ETI
in Bur-0: To further investigate how HopAM1 interferes with host cellular functions, we performed

16
genome-wide transcriptome analysis of infected plants. Five week-old Col-0 and Bur-0 plants
were hand-inoculated with Pto DC3000D28E(EV) or Pto DC3000D28E(hopAM1). RNA-seq
libraries were prepared from plants harvested immediately before infiltration and at six time-points
post-infiltration spanning a 12 hour period (Methods and Materials). The number of differentially
expressed genes between plants inoculated with Pto DC3000D28E(EV) and Pto
DC3000D28E(hopAM1) was relatively low at 2 hpi, a time point just preceding delivery of type III
effectors (de Torres Zabala et al., 2009), for both accessions (306 in Col-0 and only 4 in Bur-0;
Figure 6A). The number of differentially expressed genes greatly increased over the remainder of
the infection time course, ranging from 1432 to 2981 in Col-0 and from 522 to 5762 in Bur-0
(Figure 6A). The complete edgeR results are presented in Table S16. HopAM1-dependent
differential expression was minimal for the ten most highly associated loci identified in each GWA
study. The HopAM1 chlorosis QTL regions still include hundreds of genes and many of them
showed HopAM1-dependent transcriptional responses at some time points. The more narrowly
defined cell death related QTLs, QTL4, QTL5A and QTL5B also included multiple genes with
differential expression in response to HopAM1 (see Table S7).
Gene Ontology (GO) enrichment analyses showed that HopAM1 down-regulated defense-related
genes at most time points in Col-0, and at the early time points in Bur-0 (see Figure S11; Tables
S17, S18, S19, S20, S21). We determined if the changes in expression of defense-responsive
genes were related to MTI or ETI by focusing on the expression of 1418 genes induced by the
well characterized MAMP flg22 (Rallapalli et al., 2014) for MTI and for ETI, on expression profiles
of a set of 747 markers corresponding to genes up-regulated in a comparison of Col-0 plants
infected with ETI–inducing Pto DC3000(avrRps4) (triggering the RPS4 TIR-NLR) versus plants
infected with virulent Pto DC3000 (Howard et al., 2013). The average expression profile of the
flg22-induced genes after infection with Pto DC3000(hopAM1) compared to Pto DC3000(EV) is
consistent with HopAM1 suppressing MTI in both accessions at early time points. At 10-12 hpi
ETI-induced genes were up regulated by HopAM1 in Bur-0 but not in Col-0 (Figure 6B). Specific
genes associated with typical immune responses such as GSL5 (At4g03550), RBOHD
(At5g47910), SAG101 (At5g14930), NDR1 (At3g20600), and SID2 (At1g74710) were up-
regulated in Bur-0 from 10 hpi onwards, but not in Col-0 (see Figure S12). Our gene expression
profiling indicates that HopAM1 induces an ETI response in the Bur-0 accession, which supports
rapid HopAM1-induced cell death, but not in Col-0, which does not. Notably, this difference in ETI
response is not correlated with restriction of bacterial growth in Bur-0 compared to Col-0 (Figure
3).

17
P. syringae type III effectors suppress MTI transcriptional responses in the host plant (Lewis et
al., 2015; Truman et al., 2007). Since HopAM1 is delivered to host plants by Pto DC3000 along
with the rest of its suite of type III effectors, we expected that the transcriptional response to
infection with Pto DC3000 should overlap with the response to Pto DC3000D28E(hopAM1). Lewis
and colleagues, (Lewis et al., 2015) identified a set of 2325 Arabidopsis genes that were
differentially expressed (769 down-regulated; 1556 up-regulated) during the infection with Pto
DC3000, but not with the mutant Pto DC3000hrpA. Since the hrpA mutant does not deliver
effectors into the host cells, the differential gene expression was dependent on the bacterial
effectors of Pto DC3000. 213 of the 769 Pto DC3000 effector down-regulated genes (28%) were
also down-regulated by HopAM1. These genes were enriched in biological processes related to
nucleosome organization and chromatin assembly (FDR < 0.001; see Table S22). Furthermore,
510 of the 1556 genes (33%) activated by Pto DC3000 effectors were also up-regulated by
HopAM1 in our experiment. These genes were enriched in biological processes related to
autophagy and photoperiodism (FDR < 0.001; see Table S22). MAMP perception has been shown
to trigger large-scale suppression of genes for chloroplast-localized proteins in Arabidopsis, but
that suppression was attenuated in plants infected with Pto DC3000, due to the combined
functions of its collection of type III effectors (de Torres Zabala et al., 2015). When compared to
Pto DC3000D28E(EV), infection with Pto DC3000D28E(hopAM1) resulted in higher expression
of genes encoding chloroplast-localized proteins in both Col-0 and Bur-0 at 4 and 6 hpi, followed
by reduced expression in both accessions by 12 hpi (see Figure S13), indicating that HopAM1
may affect chloroplast responses to MTI (Figure 4B) in both accessions even though Bur-0 does
not suffer from meristem chlorosis.
DISCUSSION
HopAM1-induced local cell death is associated with HopAM1-induction of ETI response.
Using RNA-seq, we compared gene expression changes induced by Pto DC3000D28E(hopAM1)
to changes induced by Pto DC3000D28E(EV). We found that HopAM1 repressed gene sets
related to MTI immune responses in both Col-0 and Bur-0 at early time points (Figure 6B). Our
results are consistent with our previous report that HopAM1 suppresses basal defense responses
(Goel et al., 2008). Genes suppressed by HopAM1 overlapped with genes suppressed by Pto
DC3000 delivering its full suite of type III effectors that includes HopAM1 (de Torres Zabala et al.,
2015; Lewis et al., 2015; Truman et al., 2007). However, at 10-12 hpi, we defined a Bur-0-specific

18
induction of genes previously associated with RPS4-dependent ETI (Howard et al., 2013) (Figure
6C; see Figure S11). As expected if the early onset cell death seen in Bur-0 is the result of
induced ETI, it is attenuated in F2 plants from crosses of Bur-0 with Col-0 derived mutants which
were homozygous for loss of function mutations in HSP90.2 and SGT1b (Figure 1E) required for
NLR receptor activation (Holt et al., 2005; Hubert et al., 2003; Shirasu, 2009).
Our QTL analysis for HopAM1-induced cell death on the Bur-0 x Col-0 RIL population revealed
multiple loci contributing additively to the timing of onset of cell death (Figure 1D). The three loci
that account for most of the variation (QTL4, QTL5A and QTL5B) each contain genes encoding
NLR proteins, ETI receptors that are often highly variable in Arabidopsis (Cui et al., 2015; Shen
et al., 2006) (see Tables S3 and S7). Additional fine mapping and mutation analysis of individual
candidates will be necessary to confirm candidate genes as responsible for the QTL traits.
Specific alleles at each of the cell death QTL loci contribute additively to induce cell death earlier
in Bur-0 than in other accessions as if each locus has an independent ETI function and the timing
of cell death depends on the accumulation of effects from each locus. This is unlike the well-
characterized ETI responses to pathogen effector proteins that present as gene-for-gene
resistance scenarios, where one NLR gene is sufficient to mount an effective ETI response when
its product recognizes the action of one type III effector (Dangl and Jones, 2001).
GWA studies complement QTL mapping in biparental populations. Since they work at the
population level, GWA studies have maximal power to detect associations with common allele
variants and might give additional clues to understand species-wide adaptation patterns. GWA
studies can identify loci even when they have relatively low power (Atwell et al., 2010) or when
heritability is apparently low (Fournier-Level et al., 2011), and provide much higher mapping
resolution with fewer individuals than QTL analysis (Balasubramanian et al., 2009). Successful
examples are GWA studies of plant fitness in field experiments in which a myriad of causal loci
with environmental-dependent effects lowered heritability estimates below 50%, usually closer to
zero, but loci underlying relevant ecological traits were still found (Fournier-Level et al., 2011;
Fournier-Level et al., 2013). In humans, GWA with polygenic and complex disease traits such as
human height or schizophrenia keep providing new gene candidates and promote advances in
quantitative genetic theory (Eichler et al., 2010; Lee et al., 2014; Visscher et al., 2010; Yang et
al., 2010). The most significant candidate genes from our HopAM1-induced cell death GWA have
functions consistent with affecting an ETI response. The most significantly associated SNPs were
in the gene for cyclophilin 40, involved in gene epigenetic gene regulation, which is important to

19
most cellular functions and certainly relevant to mounting effective ETI responses (Navarro et al.,
2006; Shivaprasad et al., 2012; Zhai et al., 2011). Other significant cell death SNPs were located
between a gene for brassinosteroid synthesis (STEROL DELTA-7 REDUCTASE) and a gene for
regulation of gibberellic acid signaling (SCL3). Both hormones contribute to the interplay of plant
hormones that balances plant growth and defense (Bari and Jones, 2009; Lozano-Duran and
Zipfel, 2015).
Local cell death is associated with activation of ETI responses even though it is not linked
to changes in pathogen growth. The HopAM1-induced ETI response does not result in less
growth of Pto DC3000 in Bur-0 than in Col-0 (Figure 3). Thus, while there is a clear ETI
transcriptional signature from HopAM1 in Bur-0 that is cell death related, this ETI signature is
decoupled from growth restriction itself. There are several examples of NLR-mediated ETI in
which cell death and pathogen growth are uncoupled (reviewed in (Coll et al., 2011)) such as the
extreme resistance to potato virus X by the Rx NLR protein (Bendahmane et al., 1999). Some
ecotypes of Arabidopsis are resistant to P. syringae encoding the type III effectors AvrRps4 or
HopA1 without developing obvious local lesions (Gassmann, 2005; Kim et al., 2009). Uncoupling
of effector-triggered cell death and pathogen growth restriction has also been observed for a
number of Arabidopsis mutants such as cyclic nucleotide gated ion channel mutants dnd1
(Clough et al., 2000) hlm1 (Balague et al., 2003) and dnd2 (Jurkowski et al., 2004) and
metacaspase 1 (Coll et al., 2010). The extent of cell death can also vary depending on
physiological conditions, such as light (Bruggeman et al., 2015; Zeier et al., 2004) and
temperature (Menna et al., 2015) without loss of bacterial growth restriction.
A further hint that HopAM1 targets NLR-dependent downstream pathways comes from results
showing that EDS1 plays a role both in HopAM1-induced cell death (Figure 1E) and meristem
chlorosis (see Figure S10). In most examples eds1 loss-of-function mutants cause reduction in
pathogen- or stress-induced TIR-NLR mediated ETI and cell death responses (Bartsch et al.,
2006; Bhattacharjee et al., 2011; Ochsenbein et al., 2006). Interestingly, HopAM1 induced a
constant transcriptional upregulation in Col-0 and Bur-0 from 6 hpi of both EDS1 (At3g48090) and
PAD4 (At3g52430) (see Table S16). However, if HopAM1-mediated cell death is the
consequence of ETI activation of a TIR-NLR, a loss of function mutant like eds1-2 is expected to
be unable to mount the ETI response. Instead, homozygosity for the eds1-2 allele enhanced cell
death in our F2 plants (Figure 1E). Such a counterintuitive observation of a loss-of-function eds1
mutation resulting in stronger NLR-mediated cell death has been observed before: the eds1-2

20
mutation has been shown to enhance the immune response of an autoactive mutant derived from
the CC-NLR gene ADR1 (Roberts et al., 2013). In this regard, our finding of a cluster of CC-NLR
genes in QTL5B, which we reduced to an interval of 100 kb containing only 30 genes, may
suggest that one or more of these genes is causally related to HopAM1-induced cell death in Bur-
0. Further fine-mapping will address this possibility.
HopAM1 may reduce MTI responses through changes in chloroplast metabolism. Reactive
oxygen, specifically superoxide, is required for HopAM1-induced meristem chlorosis since the
double mutant of RBOHD and RBOHF did not support it (see Figure S10). Reactive oxygen
species (ROS) accumulation is an integral part of MTI and ETI responses and high levels of ROS
damage chloroplasts (Kim et al., 2012; Wagner et al., 2004). Chloroplasts play a key role in
defense by producing ROS (Shapiguzov et al., 2012) and balancing hormone levels (Robert-
Seilaniantz et al., 2011), thus constituting a target of preference for pathogens. Pto DC3000
effectors can suppress the expression of nuclear-encoded chloroplast genes in Arabidopsis and
target the chloroplast (de Torres Zabala et al., 2015). Our expression analyses demonstrate that
HopAM1 modifies the transcription of genes for chloroplast-localized proteins (see Figure S13).
Our GWA study identified TOC64III, as significantly associated with variation in chlorosis
phenotype (Figure 4, Table S14). TOC64III encodes a chloroplast TOC transporter accessory
protein (Aronsson et al., 2007; Sohrt and Soll, 2000) which modulates the translocation efficiency
of proteins into the chloroplast (Sommer et al., 2013). TOC64 protein is not essential for
chloroplast function; no detrimental phenotype is observed under standard growth conditions for
Arabidopsis insertion mutants defective in TOC64III. (Aronsson et al., 2007). Likewise, TOC64
protein is not necessary for response to HopAM1 although allelic variation is associated with
different chlorotic responses to HopAM1. We suggest that allelic variation in TOC64 could render
chloroplasts more or less resistant to damage caused by ROS induced during MTI defense
responses.
Do meristem chlorosis and HopAM1 local cell death share a common mechanism?
HopAM1 induced local cell death and meristem chlorosis are not mutually exclusive. Both early
cell death and chlorosis were observed in the Hov-4 and Wil-2 accessions (see Figure S7).
Nevertheless, two of the three QTL loci related to meristem chlorosis from the Bur-0 X Col-0 RIL
population overlap. Until the genes responsible for each phenotype have been identified, it is
possible that independent genes and independent processes are responsible for chlorosis or cell
death. However, the fact that eds1-2 mutants both enhance cell death and meristem chlorosis

21
suggests that EDS1 is a negative regulator of both HopAM1 responses. EDS1 regulates cell death
by balancing phytohormone levels that lead to enhanced ROS production, likely involving
modulation of TIR-NLR activation (Kim et al., 2012; Muhlenbock et al., 2008; Ochsenbein et al.,
2006; Wiermer et al., 2005). Although our QTL and GWA analysis showed that HopAM1-induced
chlorosis and cell death require distinct loci, EDS1 appears to play an integral role in a critical
biochemical junction where these two responses converge.
CONCLUSION
Pathogen effectors interact with and alter components of protein complexes important to plant
immunity (Macho and Zipfel, 2015; Mukhtar et al., 2011; Weßling et al., 2014). Therefore,
individual pathogen effector proteins can serve as probes to identify interacting partners in
immune complexes. To our knowledge, this is the first time that responses to a single pathogen
effector have generated quantitative trait responses in the host. Previously defined ETI-related
gene transcriptional alterations were also not associated with HopAM1-dependent bacterial
growth restriction, which challenges the concept of what constitutes an ETI response, and more
importantly, what is required to halt pathogen proliferation. Our study demonstrates that dissection
of natural variation of host plants for quantitative responses to individual effectors, such as
HopAM1, can reveal multiple genes involved in plant immune responses and help to dissect the
quantitative features of what is often assumed to be a qualitative response.
ACKNOWLEDGEMENTS
We would thank Marc Nishimura for immeasurable assistance with materials and advice. We
would also like to thank Farid El Kasmi, Eui-Hwan Chung, Freddy Monteiro, Scott Yourstone, and
Sur Herrera-Paredes for general assistance and advice; Joseph Kieber, Jason Reed, Li Yang,
Christine Camilleri, Salome Prat, and Úrsula Flores Pérez for providing various mutant lines used
in this study. MI, MGC, C-M V, TD and SRG were supported by NSF grant IOS-1022286. Work
at the Max Planck Institute was supported by ERC Advanced Grant IMMUNEMESIS. JLD is an
Investigator of the Howard Hughes Medical Institute, supported by the HHMI and the Gordon and
Betty Moore Foundation (GBMF3030) and was also supported by NSF grant IOS-1257373.
PJPLT was supported by a fellowship from the Pew Latin American Fellows Program in the
Biomedical Sciences.

22

23
LITERATURE CITED
1001 Genomes Project Consortium (2016) 1,135 Genomes reveal the global pattern of
polymorphism in Arabidopsis thaliana. Cell 165, online release
http://www.cell.com/cell/abstract/S0092-8674(16)30667-5
Anders, S., Pyl, P.T., and Huber, W. (2015). HTSeq—a Python framework to work with high-
throughput sequencing data. Bioinformatics 31, 166-169.
Arnold, D.L., Jackson, R.W., Fillingham, A.J., Goss, S.C., Taylor, J.D., Mansfield, J.W., and
Vivian, A. (2001). Highly conserved sequences flank avirulence genes: isolation of novel
avirulence genes from Pseudomonas syringae pv. pisi. Microbiology 147, 1171-1182.
Aronsson, H., Boij, P., Patel, R., Wardle, A., Töpel, M., and Jarvis, P. (2007). Toc64/OEP64 is
not essential for the efficient import of proteins into chloroplasts in Arabidopsis thaliana.
The Plant Journal 52, 53-68.
Atwell, S., Huang, Y.S., Vilhjálmsson, B.J., Willems, G., Horton, M., Li, Y., Meng, D., Platt, A.,
Tarone, A.M., Hu, T.T., et al. (2010). Genome-wide association study of 107 phenotypes
in a common set of Arabidopsis thaliana inbred lines. Nature 465, 627-631.
Austin, M.J., Muskett, P., Kahn, K., Feys, B.J., Jones, J.D.G., and Parker, J.E. (2002).
Regulatory Role of SGT1 in Early R Gene-Mediated Plant Defenses. Science 295, 2077-
2080.
Balague, C., Lin, B., Alcon, C., Flottes, G., Malmstrom, S., Kohler, C., Neuhaus, G., Pelletier,
G., Gaymard, F., and Roby, D. (2003). HLM1, an essential signaling component in the
hypersensitive response, is a member of the cyclic nucleotide-gated channel ion channel
family. The Plant cell 15, 365-379.
Balasubramanian, S., Schwartz, C., Singh, A., Warthmann, N., Kim, M.C., Maloof, J.N., Loudet,
O., Trainer, G.T., Dabi, T., Borevitz, J.O., et al. (2009). QTL mapping in new Arabidopsis
thaliana advanced intercross-recombinant inbred lines. PLoS ONE 4, e4318.
Baltrus, D.A., Nishimura, M.T., Romanchuk, A., Chang, J.H., Mukhtar, M.S., Cherkis, K., Roach,
J., Grant, S.R., Jones, C.D., and Dangl, J.L. (2011). Dynamic evolution of pathogenicity
revealed by sequencing and comparative genomics of 19 Pseudomonas syringae
isolates. PLoS Pathog 7, e1002132.
Bari, R., and Jones, J.D. (2009). Role of plant hormones in plant defence responses. Plant
molecular biology 69, 473-488.
Bartsch, M., Gobbato, E., Bednarek, P., Debey, S., Schultze, J.L., Bautor, J., and Parker, J.E.
(2006). Salicylic Acid–Independent ENHANCED DISEASE SUSCEPTIBILITY1 Signaling

24
in Arabidopsis Immunity and Cell Death Is Regulated by the Monooxygenase FMO1 and
the Nudix Hydrolase NUDT7. The Plant cell 18, 1038-1051.
Bendahmane, A., Kanyuka, K., and Baulcombe, D.C. (1999). The Rx gene from potato controls
separate virus resistance and cell death responses. The Plant cell 11, 781-792.
Bhattacharjee, S., Halane, M.K., Kim, S.H., and Gassmann, W. (2011). Pathogen
effectors target Arabidopsis EDS1 and alter its interactions with immune regulators.
Science 334, 1405-1408.
Boch, J., Joardar, V., Gao, L., Robertson, T.L., Lim, M., and Kunkel, B.N. (2002). Identification
of Pseudomonas syringae pv. tomato genes induced during infection of Arabidopsis
thaliana. Molecular Microbiology 44, 73-88.
Bonardi, V., and Dangl, J.L. (2012). How complex are intracellular immune receptor signaling
complexes? Frontiers in plant science 3, 237-246.
Boyes, D.C., Nam, J., and Dangl, J.L. (1998). The Arabidopsis thaliana RPM1 disease
resistance gene product is a peripheral plasma membrane protein that is degraded
coincident with the hypersensitive response. Proceedings of the National Academy of
Sciences of the United States of America 95, 15849-15854.
Brady, S.M., Burow, M., Busch, W., Carlborg, Ö., Denby, K.J., Glazebrook, J., Hamilton, E.S.,
Harmer, S.L., Haswell, E.S., Maloof, J.N., et al. (2015). Reassess the t Test: Interact
with All Your Data via ANOVA. The Plant cell 27, 2088–2094.
Bruggeman, Q., Raynaud, C., Benhamed, M., and Delarue, M. (2015). To die or not to die?
Lessons from lesion mimic mutants. Frontiers in plant science 6, 24-46.
Buell, C.R., Joardar, V., Lindeberg, M., Selengut, J., Paulsen, I.T., Gwinn, M.L., Dodson, R.J.,
Deboy, R.T., Durkin, A.S., Kolonay, J.F., et al. (2003). The complete genome sequence
of the Arabidopsis and tomato pathogen Pseudomonas syringae pv. tomato DC3000.
Proceedings of the National Academy of Sciences 100, 10181-10186.
Century, K.S., Holub, E.B., and Staskawicz, B.J. (1995). NDR1, a locus of Arabidopsis thaliana
that is required for disease resistance to both a bacterial and a fungal pathogen.
Proceedings of the National Academy of Sciences 92, 6597-6601.
Chan, E.K.F., Rowe, H.C., Corwin, J.A., Joseph, B., and Kliebenstein, D.J. (2011). Combining
Genome-Wide Association Mapping and Transcriptional Networks to Identify Novel
Genes Controlling Glucosinolates in Arabidopsis thaliana. PLoS biology 9, e1001125.
Chang, J.H., Urbach, J.M., Law, T.F., Arnold, L.W., Hu, A., Gombar, S., Grant, S.R., Ausubel,
F.M., and Dangl, J.L. (2005). A high-throughput, near-saturating screen for type III
25
effector genes from Pseudomonas syringae. Proceedings of the National Academy of
Sciences of the United States of America 102, 2549-2554.
Chavigneau, H., Goue, N., Delaunay, S., Courtial, A., Jouanin, L., Reymond, M., Michin, V.,
and Barriere, Y. (2012). QTL for floral stem lignin content and degradability in three
recombinant inbred line (RIL) progenies of Arabidopsis thaliana and search for candidate
genes involved in cell wall biosynthesis and degradability. Open Journal of Genetics
Vol.02No.01, 24.
Cheng, H., Qin, L., Lee, S., Fu, X., Richards, D.E., Cao, D., Luo, D., Harberd, N.P., and Peng, J.
(2004). Gibberellin regulates Arabidopsis floral development via suppression of DELLA
protein function. Development 131, 1055-1064.
Cheong, M.S., Kirik, A., Kim, J.-G., Frame, K., Kirik, V., and Mudgett, M.B. (2014). AvrBsT
acetylates Arabidopsis ACIP1, a protein that associates with microtubules and is
required for immunity. PLoS Pathog 10, e1003952.
Chung, E.-H., da Cunha, L., Wu, A.-J., Gao, Z., Cherkis, K., Afzal, A.J., Mackey, D., and Dangl,
J.L. (2011). Specific threonine phosphorylation of a host target by two unrelated type III
effectors activates a host innate immune receptor in plants. Cell host & microbe 9, 125-
136.
Clough, S.J., Fengler, K.A., Yu, I.C., Lippok, B., Smith, R.K., Jr., and Bent, A.F. (2000). The
Arabidopsis dnd1 "defense, no death" gene encodes a mutated cyclic nucleotide-gated
ion channel. Proceedings of the National Academy of Sciences of the United States of
America 97, 9323-9328.
Coll, N.S., Epple, P., and Dangl, J.L. (2011). Programmed cell death in the plant immune
system. Cell death and differentiation 18, 1247-1256.
Coll, N.S., Vercammen, D., Smidler, A., Clover, C., Van Breusegem, F., Dangl, J.L., and Epple,
P. (2010). Arabidopsis Type I Metacaspases Control Cell Death. Science 330, 1393-
1397.
Cournoyer, B., Sharp, J.D., Astuto, A., Gibbon, M.J., Taylor, J.D., and Vivian, A. (1995).
Molecular characterization of the Pseudomonas syringae pv. pisi plasmid-borne
avirulence gene avrPpiB which matches the R3 resistance locus in pea. Molecular plant-
microbe interactions 8, 700-708.
Cui, H., Tsuda, K., and Parker, J.E. (2015). Effector-triggered immunity: from pathogen
perception to robust defense. Annu Rev Plant Biol 66, 487-511.
Cunnac, S., Chakravarthy, S., Kvitko, B.H., Russell, A.B., Martin, G.B., and Collmer, A. (2011).
Genetic disassembly and combinatorial reassembly identify a minimal functional

26
repertoire of type III effectors in Pseudomonas syringae. Proceedings of the National
Academy of Sciences 108, 2975-2980.
Dangl, J.L., and Jones, J.D.G. (2001). Plant pathogens and integrated defence responses to
infection. Nature 411, 826-833.
de Torres Zabala, M., Bennett, M.H., Truman, W.H., and Grant, M.R. (2009). Antagonism
between salicylic and abscisic acid reflects early host–pathogen conflict and moulds
plant defence responses. The Plant Journal 59, 375-386.
de Torres Zabala, M., Littlejohn, G., Jayaraman, S., Studholme, D., Bailey, T., Lawson, T.,
Tillich, M., Licht, D., Bölter, B., and Delfino, L. (2015). Chloroplasts play a central role in
plant defence and are targeted by pathogen effectors. Nature Plants 1, 15074.
Deslandes, L., and Rivas, S. (2012). Catch me if you can: bacterial effectors and plant targets.
Trends in Plant Science 17, 644-655.
Dodds, P.N., and Rathjen, J.P. (2010). Plant immunity: towards an integrated view of plant–
pathogen interactions. Nature reviews Genetics 11, 539-548.
Eichler, E.E., Flint, J., Gibson, G., Kong, A., Leal, S.M., Moore, J.H., and Nadeau, J.H. (2010).
Missing heritability and strategies for finding the underlying causes of complex disease.
Nature reviews Genetics 11, 446-450.
Feys, B.J., Moisan, L.J., Newman, M.-A., and Parker, J.E. (2001). Direct interaction between the
Arabidopsis disease resistance signaling proteins, EDS1 and PAD4. The EMBO Journal
20, 5400-5411.
Fournier-Level, A., Korte, A., Cooper, M.D., Nordborg, M., Schmitt, J., and Wilczek, A.M. (2011).
A map of local adaptation in Arabidopsis thaliana. Science 334, 86-89.
Fournier-Level, A., Wilczek, A.M., Cooper, M.D., Roe, J.L., Anderson, J., Eaton, D.,
Moyers, B.T., Petipas, R.H., Schaeffer, R.N., Pieper, B., et al. (2013). Paths to
selection on life history loci in different natural environments across the native range of
Arabidopsis thaliana. Mol Ecol 22, 3552–3566.
Fu, Z.Q., Guo, M., Jeong, B.-r., Tian, F., Elthon, T.E., Cerny, R.L., Staiger, D., and Alfano, J.R.
(2007). A type III effector ADP-ribosylates RNA-binding proteins and quells plant
immunity. Nature 447, 284-288.
Gassmann, W. (2005). Natural variation in the Arabidopsis response to the avirulence gene
hopPsyA uncouples the hypersensitive response from disease resistance. Molecular
plant-microbe interactions 18, 1054-1060.
Gery, C., Zuther, E., Schulz, E., Legoupi, J., Chauveau, A., McKhann, H., Hincha, D.K., and
Téoulé, E. (2011). Natural variation in the freezing tolerance of Arabidopsis thaliana:

27
Effects of RNAi-induced CBF depletion and QTL localisation vary among accessions.
Plant Science 180, 12-23.
Gibson, G. (2012). Rare and common variants: twenty arguments. Nature reviews Genetics 13,
135-145.
Glazebrook, J., Rogers, E.E., and Ausubel, F.M. (1996). Isolation of Arabidopsis Mutants with
Enhanced Disease Susceptibility by Direct Screening. Genetics 143, 973-982.
Goel, A.K., Lundberg, D., Torres, M.A., Matthews, R., Akimoto-Tomiyama, C., Farmer, L.,
Dangl, J.L., and Grant, S.R. (2008). The Pseudomonas syringae type III effector
HopAM1 enhances virulence on water-stressed plants. Molecular Plant-Microbe
Interactions 21, 361-370.
Grant, J.J., Chini, A., Basu, D., and Loake, G.J. (2003). Targeted activation tagging of the
Arabidopsis NBS-LRR gene, ADR1, conveys resistance to virulent pathogens.
Molecular Plant-Microbe Interactions 16, 669-680.
Holt, B.F., 3rd, Belkhadir, Y., and Dangl, J.L. (2005). Antagonistic control of disease resistance
protein stability in the plant immune system. Science 309, 929-932.
Holt III, B.F., Boyes, D.C., Ellerström, M., Siefers, N., Wiig, A., Kauffman, S., Grant, M.R., and
Dangl, J.L. (2002). An evolutionarily conserved mediator of plant disease resistance
gene function is required for normal Arabidopsis development. Developmental Cell 2,
807-817.
Howard, B.E., Hu, Q., Babaoglu, A.C., Chandra, M., Borghi, M., Tan, X., He, L., Winter-
Sederoff, H., Gassmann, W., Veronese, P., et al. (2013). High-throughput RNA
sequencing of Pseudomonas-infected Arabidopsis reveals hidden transcriptome
complexity and novel splice variants. PLoS ONE 8, e74183.
Hubert, D.A., Tornero, P., Belkhadir, Y., Krishna, P., Takahashi, A., Shirasu, K., and Dangl, J.L.
(2003). Cytosolic HSP90 associates with and modulates the Arabidopsis RPM1 disease
resistance protein. The EMBO Journal 22, 5679-5689.
Iki, T., Yoshikawa, M., Meshi, T., and Ishikawa, M. (2012). Cyclophilin 40 facilitates HSP90-
mediated RISC assembly in plants. Embo j 31, 267-278.
Jones, J.D.G., and Dangl, J.L. (2006). The plant immune system. Nature 444, 323-329.
Joseph, B., Corwin, J.A., Li, B., Atwell, S., and Kliebenstein, D.J. (2013). Cytoplasmic genetic
variation and extensive cytonuclear interactions influence natural variation in the
metabolome. eLife 2, e00776.
Jurkowski, G.I., Smith, R.K., Jr., Yu, I.C., Ham, J.H., Sharma, S.B., Klessig, D.F., Fengler, K.A.,
and Bent, A.F. (2004). Arabidopsis DND2, a second cyclic nucleotide-gated ion channel

28
gene for which mutation causes the "defense, no death" phenotype. Molecular plant-
microbe interactions : MPMI 17, 511-520.
Kang, H.M., Sul, J.H., Service, S.K., Zaitlen, N.A., Kong, S.-y., Freimer, N.B., Sabatti, C., and
Eskin, E. (2010). Variance component model to account for sample structure in genome-
wide association studies. Nature genetics 42, 348-354.
Kim, C., Meskauskiene, R., Zhang, S., Lee, K.P., Lakshmanan Ashok, M., Blajecka, K.,
Herrfurth, C., Feussner, I., and Apel, K. (2012). Chloroplasts of Arabidopsis are the
source and a primary target of a plant-specific programmed cell death signaling
pathway. The Plant cell 24, 3026-3039.
Kim, S.H., Kwon, S.I., Saha, D., Anyanwu, N.C., and Gassmann, W. (2009). Resistance to the
Pseudomonas syringae effector HopA1 is governed by the TIR-NBS-LRR protein RPS6
and is enhanced by mutations in SRFR1. Plant physiology 150, 1723-1732.
Klimyuk, V.I., Carroll, B.J., Thomas, C.M., and Jones, J.D.G. (1993). Alkali treatment for rapid
preparation of plant material for reliable PCR analysis. The Plant Journal 3, 493-494.
Kroj, T., Chanclud, E., Michel-Romiti, C., Grand, X., and Morel, J.B. (2016). Integration of decoy
domains derived from protein targets of pathogen effectors into plant immune receptors
is widespread. The New phytologist 210, 618-626.
Landgraf, A., Weingart, H., Tsiamis, G., and Boch, J. (2006). Different versions of
Pseudomonas syringae pv. tomato DC3000 exist due to the activity of an effector
transposon. Molecular plant pathology 7, 355-364.
Lecain, E., Chenivesse, X., Spagnoli, R., and Pompon, D. (1996). Cloning by metabolic
interference in yeast and enzymatic characterization of Arabidopsis thaliana Sterol 7-
Reductase. Journal of Biological Chemistry 271, 10866-10873.
Lee, S., Abecasis, G.R., Boehnke, M., and Lin, X. (2014). Rare-variant association analysis:
study designs and statistical tests. American journal of human genetics 95, 5-23.
Lewis, L.A., Polanski, K., de Torres-Zabala, M., Jayaraman, S., Bowden, L., Moore, J., Penfold,
C.A., Jenkins, D.J., Hill, C., Baxter, L., et al. (2015). Transcriptional dynamics driving
MAMP-triggered immunity and pathogen effector-mediated immunosuppression in
Arabidopsis leaves following infection with Pseudomonas syringae pv tomato DC3000.
The Plant cell 27, 3038-3064.
Lincoln, S., Daly, M., and Lander, E. (1992). Constructing genetic maps with MAPMAKER/EXP
3.0. Whitehead Technical Institute, Cambridge MA.
Lozano-Duran, R., and Zipfel, C. (2015). Trade-off between growth and immunity: role of
brassinosteroids. Trends Plant Sci 20, 12-19.

29
Macho, A.P., and Zipfel, C. (2015). Targeting of plant pattern recognition receptor-triggered
immunity by bacterial type-III secretion system effectors. Current Opinion in Microbiology
23, 14-22.
Menna, A., Nguyen, D., Guttman, D.S., and Desveaux, D. (2015). Elevated temperature
differentially influences effector-triggered immunity outputs in Arabidopsis. Frontiers in
plant science 6, 995.
Muhlenbock, P., Szechynska-Hebda, M., Plaszczyca, M., Baudo, M., Mateo, A., Mullineaux,
P.M., Parker, J.E., Karpinska, B., and Karpinski, S. (2008). Chloroplast signaling and
LESION SIMULATING DISEASE1 regulate crosstalk between light acclimation and
immunity in Arabidopsis. The Plant cell 20, 2339-2356.
Mukhtar, M.S., Carvunis, A.R., Dreze, M., Epple, P., Steinbrenner, J., Moore, J., Tasan, M.,
Galli, M., Hao, T., Nishimura, M.T., et al. (2011). Independently evolved virulence
effectors converge onto hubs in a plant immune system network. Science 333, 596-601.
Munkvold, K.R., Martin, M.E., Bronstein, P.A., and Collmer, A. (2008). A survey of the
Pseudomonas syringae pv. tomato DC3000 type III secretion system effector
repertoire reveals several effectors that are deleterious when expressed in
Saccharomyces cerevisiae. Molecular Plant-Microbe Interactions 21, 490-502.
Nagpal, P., Walker, L.M., Young, J.C., Sonawala, A., Timpte, C., Estelle, M., and Reed, J.W.
(2000). AXR2 encodes a member of the Aux/IAA protein family. Plant physiology 123,
563-574.
Navarro, L., Dunoyer, P., Jay, F., Arnold, B., Dharmasiri, N., Estelle, M., Voinnet, O., and Jones,
J.D. (2006). A plant miRNA contributes to antibacterial resistance by repressing auxin
signaling. Science 312, 436-439.
Nordberg, H., Cantor, M., Dusheyko, S., Hua, S., Poliakov, A., Shabalov, I., Smirnova, T.,
Grigoriev, I.V., and Dubchak, I. (2014). The genome portal of the Department of Energy
Joint Genome Institute: 2014 updates. Nucleic Acids Res 42, D26-31.
Ochsenbein, C., Przybyla, D., Danon, A., Landgraf, F., Gobel, C., Imboden, A., Feussner, I.,
and Apel, K. (2006). The role of EDS1 (enhanced disease susceptibility) during singlet
oxygen-mediated stress responses of Arabidopsis. The Plant journal : for cell and
molecular biology 47, 445-456.
Rallapalli, G., Kemen, E.M., Robert-Seilaniantz, A., Segonzac, C., Etherington, G.J., Sohn,
K.H., MacLean, D., and Jones, J.D.G. (2014). EXPRSS: an Illumina based high-
throughput expression-profiling method to reveal transcriptional dynamics. BMC
Genomics 15, 1-18.

30
Rietz, S., Stamm, A., Malonek, S., Wagner, S., Becker, D., Medina-Escobar, N., Vlot, A.C.,
Feys, B.J., Niefind, K., and Parker, J.E. (2011). Different roles of Enhanced Disease
Susceptibility1 (EDS1) bound to and dissociated from Phytoalexin Deficient4 (PAD4) in
Arabidopsis immunity. The New phytologist 191, 107-119.
Robert-Seilaniantz, A., Grant, M., and Jones, J.D. (2011). Hormone crosstalk in plant disease
and defense: more than just jasmonate-salicylate antagonism. Annu Rev Phytopathol
49, 317-343.
Roberts, M., Tang, S., Stallmann, A., Dangl, J.L., and Bonardi, V. (2013). Genetic Requirements
for Signaling from an Autoactive Plant NB-LRR Intracellular Innate Immune Receptor.
PLoS genetics 9, e1003465.
Robinson, M.D., McCarthy, D.J., and Smyth, G.K. (2010). edgeR: a Bioconductor package for
differential expression analysis of digital gene expression data. Bioinformatics 26, 139-
140.
Romano, P., He, Z., and Luan, S. (2004). Introducing immunophilins. From organ
transplantation to plant biology. Plant physiology 134, 1241-1243.
Schechter, L.M., Vencato, M., Jordan, K.L., Schneider, S.E., Schneider, D.J., and Collmer, A.
(2006). Multiple approaches to a complete inventory of Pseudomonas syringae pv.
Tomato DC3000 type III secretion system effector proteins. Molecular Plant-Microbe
Interactions 19, 1180-1192.
Schneeberger, K., Ossowski, S., Ott, F., Klein, J.D., Wang, X., Lanz, C., Smith, L.M., Cao, J.,
Fitz, J., Warthmann, N., et al. (2011). Reference-guided assembly of four diverse
Arabidopsis thaliana genomes. Proceedings of the National Academy of Sciences 108,
10249-10254.
Shapiguzov, A., Vainonen, J.P., Wrzaczek, M., and Kangasjarvi, J. (2012). ROS-talk - how the
apoplast, the chloroplast, and the nucleus get the message through. Frontiers in plant
science 3, 292-301.
Shen, J., Araki, H., Chen, L., Chen, J.-Q., and Tian, D. (2006). Unique evolutionary mechanism
in R-Genes under the presence/absence polymorphism in Arabidopsis thaliana.
Genetics 172, 1243-1250.
Shirasu, K. (2009). The HSP90-SGT1 Chaperone complex for NLR immune sensors. Annual
Review of Plant Biology 60, 139-164.
Shivaprasad, P.V., Chen, H.M., Patel, K., Bond, D.M., Santos, B.A., and Baulcombe, D.C.
(2012). A microRNA superfamily regulates nucleotide binding site-leucine-rich repeats
and other mRNAs. The Plant cell 24, 859-874.

31
Simon, M., Loudet, O., Durand, S., Bérard, A., Brunel, D., Sennesal, F.-X., Durand-Tardif, M.,
Pelletier, G., and Camilleri, C. (2008). Quantitative trait loci mapping in five new large
recombinant inbred line populations of Arabidopsis thaliana genotyped with
consensus single-nucleotide polymorphism markers. Genetics 178, 2253-2264.
Smith, M.R., Willmann, M.R., Wu, G., Berardini, T.Z., Möller, B., Weijers, D., and Poethig, R.S.
(2009). Cyclophilin 40 is required for microRNA activity in Arabidopsis. Proceedings of
the National Academy of Sciences 106, 5424-5429.
Sohrt, K., and Soll, J. (2000). Toc64, a New Component of the Protein Translocon of
Chloroplasts. The Journal of Cell Biology 148, 1213-1222.
Sommer, M., Rudolf, M., Tillmann, B., Tripp, J., Sommer, M.S., and Schleiff, E. (2013). Toc33
and Toc64-III cooperate in precursor protein import into the chloroplasts of Arabidopsis
thaliana. Plant, Cell & Environment 36, 970-983.
Tao, Y., Xie, Z., Chen, W., Glazebrook, J., Chang, H.S., Han, B., Zhu, T., Zou, G., and Katagiri,
F. (2003). Quantitative nature of Arabidopsis responses during compatible and
incompatible interactions with the bacterial pathogen Pseudomonas syringae. The Plant
cell 15, 317-330.
Taylor, M.B., and Ehrenreich, I.M. (2014). Genetic interactions involving five or more genes
contribute to a complex trait in yeast. PLoS genetics 10, e1004324.
Thomas, W.J., Thireault, C.A., Kimbrel, J.A., and Chang, J.H. (2009). Recombineering and
stable integration of the Pseudomonas syringae pv. syringae 61 hrp/hrc cluster into the
genome of the soil bacterium Pseudomonas fluorescens Pf0-1. The Plant Journal 60,
919-928.
Tornero, P., Merritt, P., Sadanandom, A., Shirasu, K., Innes, R.W., and Dangl, J.L. (2002).
RAR1 and NDR1 contribute quantitatively to disease resistance in Arabidopsis, and their
relative contributions are dependent on the R gene assayed. The Plant cell 14, 1005-
1015.
Torres, M.A., Dangl, J.L., and Jones, J.D.G. (2002). Arabidopsis gp91phox homologues
AtrbohD and AtrbohF are required for accumulation of reactive oxygen intermediates in
the plant defense response. Proceedings of the National Academy of Sciences 99, 517-
522.
Trapnell, C., Pachter, L., and Salzberg, S.L. (2009). TopHat: discovering splice junctions with
RNA-Seq. Bioinformatics 25, 1105-1111.
Truman, W., Bennett, M.H., Kubigsteltig, I., Turnbull, C., and Grant, M. (2007). Arabidopsis
systemic immunity uses conserved defense signaling pathways and is mediated by
32
jasmonates. Proceedings of the National Academy of Sciences of the United States of
America 104, 1075-1080.
van der Hoorn, R.A.L., and Kamoun, S. (2008). From guard to decoy: a new model for
perception of plant pathogen effectors. The Plant cell 20, 2009-2017.
Visscher, P.M., McEvoy, B., and Yang, J. (2010). From Galton to GWAS: quantitative genetics
of human height. Genet Res 92, 371-379.
Wagner, D., Przybyla, D., Op den Camp, R., Kim, C., Landgraf, F., Lee, K.P., Wursch, M., Laloi,
C., Nater, M., Hideg, E., et al. (2004). The genetic basis of singlet oxygen-induced stress
responses of Arabidopsis thaliana. Science 306, 1183-1185.
Wagner, S., Stuttmann, J., Rietz, S., Guerois, R., Brunstein, E., Bautor, J., Niefind, K., and
Parker, J.E. (2013). Structural basis for signaling by exclusive EDS1 heteromeric
complexes with SAG101 or PAD4 in plant innate immunity. Cell host & microbe 14, 619-
630.
Wang, S., Basten, C.J., and Zeng, Z.B. (2012). Windows QTL Cartographer 2.5 (Department of
Statistics, North Carolina State University, Raleigh, NC).
(http://statgen.ncsu.edu/qtlcart/WQTLCart.htm)
Wang, Y., Liu, C., Li, K., Sun, F., Hu, H., Li, X., Zhao, Y., Han, C., Zhang, W., Duan, Y., et al.
(2007). Arabidopsis EIN2 modulates stress response through abscisic acid response
pathway. Plant molecular biology 64, 633-644.
Weigel, D., and Nordborg, M. (2015). Population genomics for understanding adaptation in
wild plant species. Annual Review of Genetics 49, 315-338.
Weßling, R., Epple, P., Altmann, S., He, Y., Yang, L., Henz, Stefan R., McDonald, N., Wiley, K.,
Bader, Kai C., Gläßer, C., et al. (2014). Convergent targeting of a common host
protein-network by pathogen effectors from three kingdoms of life. Cell host &
microbe 16, 364-375.
Wiermer, M., Feys, B.J., and Parker, J.E. (2005). Plant immunity: the EDS1 regulatory node.
Current opinion in plant biology 8, 383-389.
Wildermuth, M.C., Dewdney, J., Wu, G., and Ausubel, F.M. (2001). Isochorismate synthase is
required to synthesize salicylic acid for plant defence. Nature 414, 562-565.
Wright, C.A., and Beattie, G.A. (2004). Pseudomonas syringae pv. tomato cells encounter
inhibitory levels of water stress during the hypersensitive response of Arabidopsis
thaliana. Proceedings of the National Academy of Sciences of the United States of
America 101, 3269-3274.

33
Xin, X.-F., and He, S.Y. (2013). Pseudomonas syringae pv. tomato DC3000: a model pathogen
for probing disease susceptibility and hormone signaling in plants. Annual review of
phytopathology 51, 473-498.
Yang, J., Benyamin, B., McEvoy, B.P., Gordon, S., Henders, A.K., Nyholt, D.R., Madden, P.A.,
Heath, A.C., Martin, N.G., Montgomery, G.W., et al. (2010). Common SNPs explain a
large proportion of the heritability for human height. Nature genetics 42, 565-569.
Yi, X., Du, Z., and Su, Z. (2013). PlantGSEA: a gene set enrichment analysis toolkit for plant
community. Nucleic Acids Research 41, W98-W103.
Zeier, J., Pink, B., Mueller, M.J., and Berger, S. (2004). Light conditions influence specific
defence responses in incompatible plant-pathogen interactions: uncoupling systemic
resistance from salicylic acid and PR-1 accumulation. Planta 219, 673-683.
Zhai, J., Jeong, D.-H., De Paoli, E., Park, S., Rosen, B.D., Li, Y., González, A.J., Yan, Z., Kitto,
S.L., Grusak, M.A., et al. (2011). MicroRNAs as master regulators of the plant NB-LRR
defense gene family via the production of phased, trans-acting siRNAs. Genes &
Development 25, 2540-2553.
Zhang, J., Shao, F., Li, Y., Cui, H., Chen, L., Li, H., Zou, Y., Long, C., Lan, L., Chai, J., et al.
(2007). A Pseudomonas syringae Effector Inactivates MAPKs to Suppress PAMP-
Induced Immunity in Plants. Cell host & microbe 1, 175-185.
Zhang, Z.-L., Ogawa, M., Fleet, C.M., Zentella, R., Hu, J., Heo, J.-O., Lim, J., Kamiya, Y.,
Yamaguchi, S., and Sun, T.-p. (2011). SCARECROW-LIKE 3 promotes gibberellin
signaling by antagonizing master growth repressor DELLA in Arabidopsis. Proceedings
of the National Academy of Sciences 108, 2160-2165.
Zipfel, C., Kunze, G., Chinchilla, D., Caniard, A., Jones, J.D., Boller, T., and Felix, G. (2006).
Perception of the bacterial PAMP EF-Tu by the receptor EFR restricts Agrobacterium-
mediated transformation. Cell 125, 749-760.
Zipfel, C., Robatzek, S., Navarro, L., Oakeley, E.J., Jones, J.D.G., Felix, G., and Boller, T.
(2004). Bacterial disease resistance in Arabidopsis through flagellin perception. Nature
428, 764-767.

34
Number of top SNPS
10 50 100 500 1000 10000
QTL1 0.489 0.995 0.579 0.643 0.909 1
QTL2 0.818 1 1 1 1 1
QTL4 0.0906 0.0278 3.10E‐13 2.88E‐46 2.14E‐66 1.52E‐08
QTL5A 0.537 0.0434 1.55E‐06 0.00942 0.0088 3.73E‐07
QTL5B 1 1 1 7.04E‐06 0.00021 0.00021
Table 1. p-values of enrichment tests of increasing numbers of most significant SNPs for each HopAM1-
induced cell death QTL calculated using a Fisher’s exact test with a 2 X 2 test table design.
Number of top SNPS
10 50 100 500 1000 10000
QTL4C1 1 0.982 0.959 0.93 0.502 0.993
QTL4C2 0.114 0.0253 0.0145 0.0006 0.0002 0.0002
QTL5C 0.898 0.999 1 7.93E-01 1 1
Table 2. p-values of enrichment tests of increasing numbers of most significant SNPs for each HopAM1-
induced chlorosis QTL calculated as in Table 1.

35
FIGURES
Figure 1 | HopAM1 induces variable, cell death symptoms of multigenic inheritance in A.
thaliana accessions. (A) HopAM1-induced cell death in Bur-0, Col-0 and F1 progeny at 48 hpi
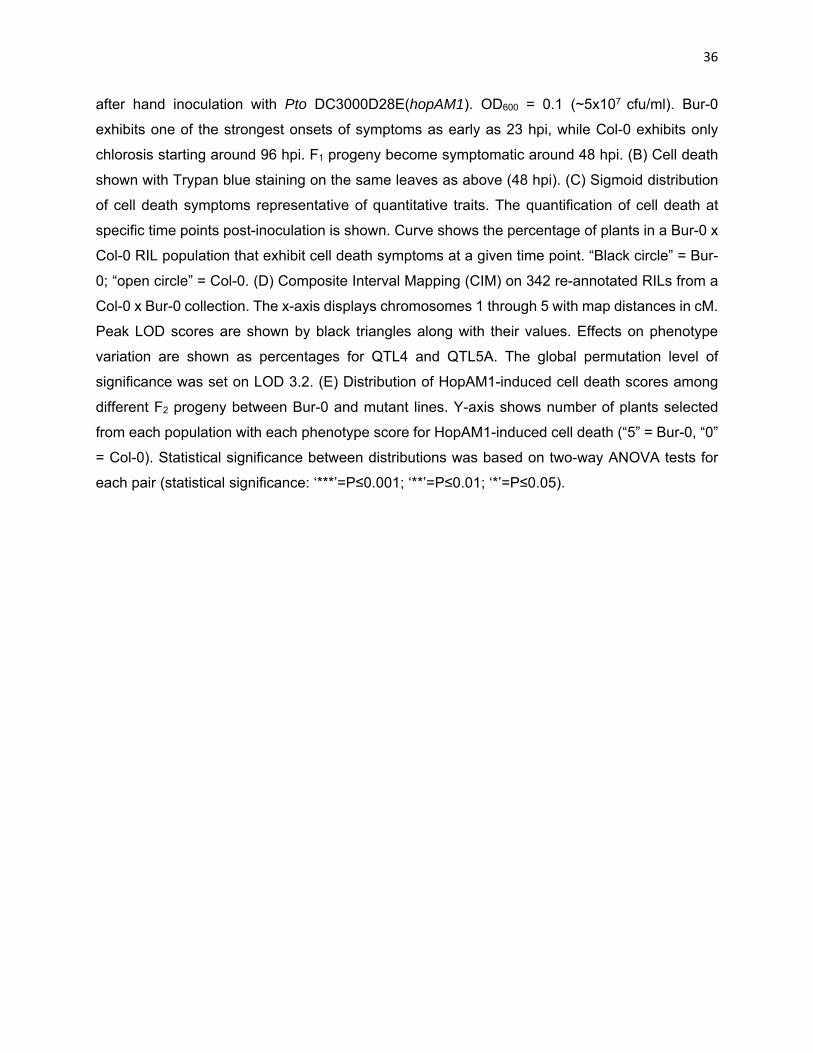
36
after hand inoculation with Pto DC3000D28E(hopAM1). OD600 = 0.1 (~5x10⁷ cfu/ml). Bur-0
exhibits one of the strongest onsets of symptoms as early as 23 hpi, while Col-0 exhibits only
chlorosis starting around 96 hpi. F1 progeny become symptomatic around 48 hpi. (B) Cell death
shown with Trypan blue staining on the same leaves as above (48 hpi). (C) Sigmoid distribution
of cell death symptoms representative of quantitative traits. The quantification of cell death at
specific time points post-inoculation is shown. Curve shows the percentage of plants in a Bur-0 x
Col-0 RIL population that exhibit cell death symptoms at a given time point. “Black circle” = Bur-
0; “open circle” = Col-0. (D) Composite Interval Mapping (CIM) on 342 re-annotated RILs from a
Col-0 x Bur-0 collection. The x-axis displays chromosomes 1 through 5 with map distances in cM.
Peak LOD scores are shown by black triangles along with their values. Effects on phenotype
variation are shown as percentages for QTL4 and QTL5A. The global permutation level of
significance was set on LOD 3.2. (E) Distribution of HopAM1-induced cell death scores among
different F2 progeny between Bur-0 and mutant lines. Y-axis shows number of plants selected
from each population with each phenotype score for HopAM1-induced cell death (“5” = Bur-0, “0”
= Col-0). Statistical significance between distributions was based on two-way ANOVA tests for
each pair (statistical significance: ‘***’=P≤0.001; ‘**’=P≤0.01; ‘*’=P≤0.05).

37
Figure 2 | The genetic architecture of HopAM1 cell death response defined by GWA
depends on several loci with strong to moderate effects. HopAM1-induced cell death
response was scored in a collection of 64 Arabidopsis accessions. EMMAX was used for genome-
wide association mapping based on whole genome sequence data of over 4 million SNPs. The
Manhattan plot shows the association of each SNP and its p-value across the five Arabidopsis
chromosomes (1 through 5 from left to right, separated by vertical lines). The dotted line
designates the significance threshold for Bonferroni correction (p ≤ 1.2 x 10⁻⁸). All SNPs over the
FDR threshold are highlighted with a circle. Grey outline reprises the QTL regions identified in
Figure 1D in the Bur-0 x Col-0 background (cM converted to Mb only for each genetic marker’s
coordinates on the genome and shows LOD score at that specific location; not identical, but very
similar to peak LOD scores shown in previous QTL analysis in Figure 1D). Right y-axis: LOD
score; yellow-dotted line: significance threshold for CIM.
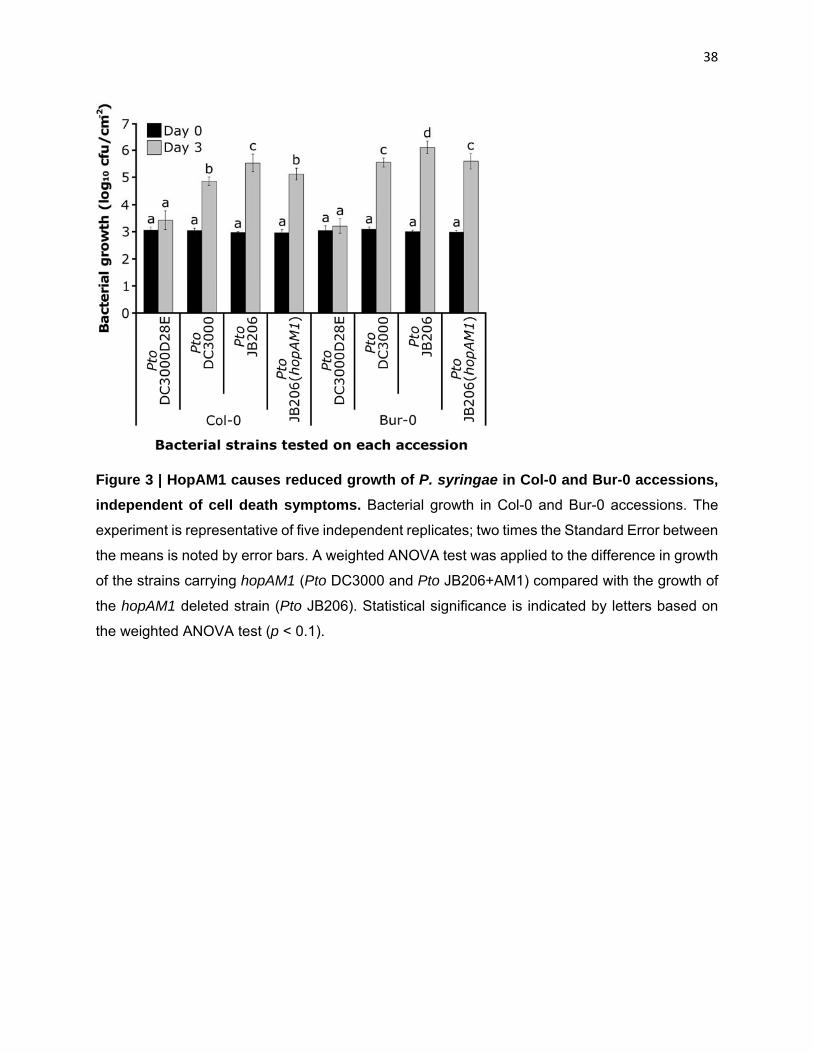
38
Figure 3 | HopAM1 causes reduced growth of P. syringae in Col-0 and Bur-0 accessions,
independent of cell death symptoms. Bacterial growth in Col-0 and Bur-0 accessions. The
experiment is representative of five independent replicates; two times the Standard Error between
the means is noted by error bars. A weighted ANOVA test was applied to the difference in growth
of the strains carrying hopAM1 (Pto DC3000 and Pto JB206+AM1) compared with the growth of
the hopAM1 deleted strain (Pto JB206). Statistical significance is indicated by letters based on
the weighted ANOVA test (p < 0.1).

39

40
Figure 4 | HopAM1 induces rosette chlorosis affecting chloroplast development and cell
morphology controlled by three QTLs in Col-0 x Bur-0. A) Meristem chlorosis response
following bacterial vacuum infiltration with Pto DC3000D28E(hopAM1). Col-0 exhibits strong
chlorosis symptoms, while Bur-0 does not. F1 progeny exhibit mild symptoms. Chlorosis appears
in newly emerging leaf and meristem in Col-0 at 10 dpi following vacuum infiltration. Chlorosis
can be observed up to 21 dpi. B) Confocal laser scanning microscopy of Arabidopsis accessions
Col-0 and Bur-0 leaf tissue, harvested 14 dpi following vacuum infiltration with Pto
DC3000D28E(hopAM1). Chlorophyll autofluorescence (enlarged and brightened sections with
white dotted outline shown on the top left corner of respective pane) (red channel), plant cell
shape (black dotted outline of cells) (green channel), and merged channels are shown for each
accession. Scale bar = 10 μm. Upper and lower panels taken at equal light intensity. C) CIM on
342 reannotated RILs from a Col-0 x Bur-0 collection. The x-axis displays chromosomes 1 through
5 with map distances in cM. Peak LOD scores are shown by black triangles along with their values.
Effects on phenotype variation are shown as percentages for all three QTLs. The global
permutation level of significance was set on LOD 3.2.

41
Figure 5 | The genetic architecture of the HopAM1 chlorosis response defined by GWA is
associated with a single locus on chromosome 3. HopAM1-induced chlorosis was scored in
a collection of 64 Arabidopsis accessions as for Figure 2. Nearly all top 10 hits were inside genes.
Grey outline reprises the QTL regions identified in Figure 4C in the Bur-0 x Col-0 background (cM
converted to Mb only for each genetic marker’s coordinates on the genome and shows LOD score
at that specific location; not identical, but very similar to peak LOD scores shown in previous QTL
analysis in Figure 4C). Right y-axis: LOD score; yellow-dotted line: significance threshold for CIM.

42
Figure 6 | HopAM1 induces intense transcriptional reprogramming for thousands of genes
in Col-0 and Bur-0, results in initial suppression of MTI in both ecotypes and later induction
43
of ETI in Bur-0 only. (A) Number of genes (y-axis) differentially expressed as a result of HopAM1
delivery in Col-0 and Bur-0 every two hours (x-axis) in the first 12 hours post infiltration. Red bar
– down-regulated; blue bar – up-regulated. (B) (upper lane) Average expression profile of flg22-
induced genes within the same time period in Col-0 and Bur-0; (lower lane) average expression
profile of genes up-regulated by ETI induced upon recognition of the avrRps4 avirulence factor
by the NLR protein Rps4 in Col-0. Gene expression is shown as the median z-scored transformed
RPKM values of the 1418 and 718 marker genes for MTI and ETI respectively. (C) Overlap
between genes differentially expressed by Pto DC3000D28E(hopAM1) infection and those
specifically misregulated by Pto DC3000 effectors. A total of 5610 genes that were differentially
expressed in Col-0 in at least one time-point of our experiment were included in the analysis. A
set of 517 genes showing ambiguous regulation (i.e. both up- and down-regulation at different
time points) was discarded. (D) Venn diagrams showing number of genes up-regulated and down-
regulated at 12 hpi for both Bur-0 and Col-0. Gene Ontologies for the top five sets are shown for
each group.
SUPPLEMENTAL TABLES
Table S1 | List of bacterial strains and plasmid used in this study.
Table S2 | ANOVA tests and adjusted means of phenotypic scores for HopAM1-induced cell death
response per RIL.
Table S3 | HopAM1-dependent cell death response is variable in Arabidopsis thaliana germplasm.
Table S4 | Bur-0 x Col-0 F2 segregation ratios for HopAM1-induced cell death.
Table S5 | Reannotated Bur-0 x Col-0 RIL population.
Table S6 | Composite Interval Mapping result data for HopAM1-induced cell death on a Bur-0 x
Col-0 RIL population
Table S7 | edgeR results (infected vs mock in Bur-0 and Col-0) for the differential expression of
genes in the cell death QTL intervals QTL4, QTL5A and QTL5B.
Table S8 | ANOVA tables for pairwise interactions between QTLs for HopAM1-induced cell death.
Table S9 | Lists of top SNP hits for HopAM1-induced cell death.
Table S10 | Segregation ratios for HopAM1-induced cell death in three different mapping
populations.
Table S11 | HopAM1-induced rosette chlorosis response in Arabidopsis thaliana germplasm.
Table S12 | ANOVA tests for HopAM1-induced chlorosis response per RIL.

44
Table S13 | Composite Interval Mapping result data for HopAM1-induced chlorosis on a Bur-0 x
Col-0 RIL population
Table S14 | List of top SNP hits for HopAM1-induced chlorosis.
Table S15 | List of mutant lines screened for HopAM1-induced chlorosis.
Table S16 | Complete edgeR results for the differential expression analysis (infected vs mock) in
Bur-0 and Col-0 for all time points.
Table S17 | List of differentially regulated gene sets identified by ontology enrichment analysis at
4 hpi following inoculation with Pto DC3000D28E(hopAM1).
Table S18 | List of differentially regulated gene sets identified by ontology enrichment analysis at
6 hpi following inoculation with Pto DC3000D28E(hopAM1).
Table S19 | List of differentially regulated gene sets identified by ontology enrichment analysis at
8 hpi following inoculation with Pto DC3000D28E(hopAM1).
Table S20 | List of differentially regulated gene sets identified by ontology enrichment analysis at
10 hpi following inoculation with Pto DC3000D28E(hopAM1).
Table S21 | List of differentially regulated gene sets identified by ontology enrichment analysis at
12 hpi following inoculation with Pto DC3000D28E(hopAM1).
Table S22 | List of genes up-regulated and down-regulated by either Pto DC3000 effectors or
HopAM1 alone in Col-0 at 12 hpi.
