effectiveness of regulatory governance of electricity power sector of pakistan · effectiveness of...
TRANSCRIPT

Effectiveness of Regulatory Governance of Electricity Power Sector of Pakistan
Abstract
This study attempts to evaluate one of the important dimensions of regulation
(i.e. regulatory governance) of National Electric Power Regulatory Authority
(NEPRA). For this purpose, the study considers some of major input attributes
of regulatory governance (i.e. capacity, integrity, participation, and
predictability) and output attributes of regulatory governance (i.e. legitimacy
and credibility). To carry out this evaluation, a survey was conducted and
questionnaire based was filled by 102 professionals (dealing with regulatory
affairs) of the main players of power sector of Pakistan. The data analysis
involved inferential statistics using SPSS (Statistical Program for Social
Sciences) software. The Pearson‘s product moment correlation coefficient or
simply correlation technique is used to investigate the strength and direction of
relationship between the variable mentioned in hypothesis,
The findings indicated that the legitimacy of NEPRA has significant positive
correlation with the capacity, integrity and participation. Whereas credibility
of NEPRA has significant negative association with integrity. However,
credibility has strong positive association with predictability. The results of
this study can be helpful for strengthening the regulatory governance of
NEPRA and developing confidence to the stakeholders of power sector of
Pakistan.
Keywords: Regulatory System; Regulatory Substance; Regulatory Governance
Introduction
Electricity is considered as a major driver for economic development of any country. Energy
plays key role in economic productivity, growth of industry and is vital for operation of any
modern economy (Asghar, 2008). In the modern economy, energy plays at least fifty (50)
percent role in industrial growth while representing less than one tenth of the cost of
production. Electricity or electric power is considered to be most sophisticated form of
energy and is a critical infrastructure for economic growth (Kalita and Medhi, 2011).
The electric power sector of Pakistan is suffering from severe electricity crisis. The main
reason of the crises is the existing and increasing gap between demand of electricity and
generating capacity which is available to meet/cater this demand. The electricity shortage has
become a main political issue, and big suffering for individual consumers and industrial
concerns. This issue stress the social fabric of the country and imposes threats to weaken the
government's credibility and legitimacy (Kessides, 2013).
The deterioration of power infra-structure and other factors including monopoly, subsidized
sector prices, governance failure, Financial and resource constraint and lower energy access
rate provided the rationale for the reform of the energy sector (Bhattacharyya, 2011).
Economic, social, and administrative regulations have been used to align the interest of
public and private sectors. Regarding regulatory intervention, market failure and equity
considerations are the two most common arguments (Kemal, 2015).
According to (Radaelli and Fritsch, 2012) performance of regulators play a key role in
encouraging advancement in the economy and enhancing growth in production, through on

time processes approval, flexible ways to approach to arising problems and focusing the
services. In high performing nations, existence of conducive regulatory environment provides
important foundation and plays great role in making these make their country a great place to
work and live and to protect their environment. Outcomes of good regulation depend on rules
and regulations which effectively formulated. Good regulators, having efficient regulatory
exercises, are required for enforcement of regulations. It is evident that over the time
regulatory practices are improved proper arrangement of governance and strengthening of the
regulatory governance re-enforce legitimacy of the regulations. Good regulatory governance
is helpful in maintaining the trust and confidence of all the stakeholders.
National Electric Power Regulatory Authority (NEPRA) being a sole Regulator of the
electricity sector of the country has remarkable contribution to the power sector but it still
lacks many of the qualities of a good regulator. Its performance is always questioned making
it responsible for deterioration of the power sector without considering the non-regulatory
factors badly affecting the sector outcomes. Sector outcomes must be the ultimate benchmark
for judging regulatory performance.” However, sector outcomes are also driven by other
events beyond the regulatory system and outside the control of the regulator. External factors
include “macroeconomic conditions, currency fluctuations, and interest rates, global
conditions of the regulated market, natural disasters, and investor perception of overall
country risk etc (Jarvis and Sovacool, 2011). This paper will discuss and evaluate the
regulatory governance of NEPRA in the current scenario assuming different attributes, as the
same plays a vital role in making a quality and performing Regulator.
The outcomes of this study will be useful for the whole power sector of the country in general
and to the Regulator, Policy makers and investors in particular.
Problem Statement
The power sector Regulator, performs very difficult tasks which are of national importance.
The decisions of the regulator play major roles in the development of the country. However,
due to lack of autonomy, transparency, required capacity, participation of public,
accountability, credibility, legitimacy and predictability etc. it is very hard for the regulator to
make merit based decision and to play prominent role in development of the sector.
Research objectives
The objectives of this study are:
(a). To measure the extent to which different regulatory governance attributes
affect the governance of NEPRA;
(b). To formulate suitable recommendation and suggestion to government and
NEPRA regarding formulation of policies and Regulations on basis of
findings of this study.
Significance of the study
Like any other regulatory system, NEPRA also has two main dimensions which are
regulatory governance and regulatory substance. Therefore to improve the performance of
NEPRA, the understanding and evaluation of these dimensions of its regulatory system is
essential. The emphasis of this study is on the regulatory governance only. Most of the
literature on the subject are descriptive studies whereas empirical analysis has applied to
limited (2 or 3) attributes of governance. This paper will empirically analyze all the known
attributes of governance thus giving clearer picture of the matter and will focus the regulatory

governance of NEPRA which has not been evaluated (specifically) earlier. For this purpose,
the paper uses the conceptual framework (Jarvis and Sovacool, 2011) regarding
conceptualization and evaluation best practices of regulatory governance in electricity and
water sector. Further, this study will use empirical technique to find out impact of different
attributes on the regulatory governance of NEPRA and Pearson's coefficient of Correlation &
Regression analysis between attributes of the regulatory governance.
Literature Review
Before restructuring power sector of Pakistan was consisting of WAPDA and K-Electric
Limited, previously Karachi Electricity Supply Company (KESC), which were two separate
vertically integrated entities. WAPDA was established in 1958 as a semi-autonomous entity
for development of the water and power sectors. K-Electric was registered under the Indian
Companies Act, 1882 on September 13, 1913. Until the early 1980s, the performance of
WAPDA and K-Electric remained satisfactory. Afterwards the situation started deteriorating
(Malik, 2007; Kessides, 2013).
No one coherent government strategy is the reason behind the history of regulation and
reforms. Rather regulation emerged in response to the altering objectives and needs in
different economies, industries, and contexts of policies. The scale and scope of regulation
captured rapid growth in twentieth century and the rapid growth in regulatory interventions
resulted big shift in the economic environment (Malyshev, 2002).
In Pakistan, the poor performance of the power sector provided basis for restructuring of the
sector. In 1992 the cabinet committee approved the strategic plan which envisaged
reorganization of the whole power sector in the country. Government of Pakistan took policy
decision to de-regulate the power sector, to promote IPPs, restructure WAPDA and to
privatize other main entities. A one window facilitator was established in 1994 in the name of
PPIB to promote participation of private sector in the power sector of the country. The key
functions of PPIB include providing facilitation to investors to establish private power
projects and other related infrastructure, execution of implementation agreement with
project's sponsors and issuance of guarantees on behalf of the Government.
The power wing of WAPDA which was vertically integrated was disintegrated into ten
separate distribution companies (DISCOs), one transmission company (NTDC) and four
generation companies (GENCOs). The development and operation of hydropower plants
remained with WAPDA. In order to restructure and preparation for privatization of the newly
created GENCOs and DISCOs, PEPCO was created as a separate company in the name of
PEPCO was created. In other words, PEPCO was made custodian of GENCOs, DISCOs and
NTDC. Two public sector entities K-Electric and KAPCO were privatized. In order to
oversight the power sector, to promote competition and to protect the rights of stakeholders,
the power sector regulator i.e. NEPRA was established in December 1997 (Malik, 2012).
The market structure of generation segment of power sector of Pakistan is semi-private /semi-
public. Initially, WAPDA, K-Electric or and Pakistan Atomic Energy Commission (PAEC)
have been dominating the power sector of the country. After 1994, Independent Power
Producers (IPPs) have also entered the market with considerable volume (Kessides, 2013).
K-Electric at the same time generates, transmits and distributes electricity in the entire
metropolitan area of Karachi where as responsibilities of PAEC inter alia include operation
the nuclear power plants of the country. The major portion of generation is covered by

thermal IPPs. Further, several renewable energy based IPPs, CPPs and SPPs are also
imparting their shares in electricity supply of the country (Report, 2015).
According to NEPRA State of Industry Report 2015, the gross installed generation capacity
of the country was 24,823MW. The contribution of thermal power generation in the total
installed capacity was composed of 16,814 MW (67.74%) whereas hydropower contributed
7,116MW (i.e. 28. 67%). In addition, nuclear power generation and wind power plants
contributed 787 MW (3.14%) and 106 MW (0.43%) respectively.
The system wise installed capacity is segregated as PEPCO system 22,360 MW (90.08%) and
E-Electric System, 2,463 MW (9.92%). In the system of PEPCO, GENCOs provide 5,762
MW of the installed capacity whereas the share of thermal IPPs is 8,726 MW and that of
renewable energy projects/wind power plants is 106 MW. In the K-Electric system, K-
Electric owns 1,874MW of installed capacity, 252MW is accounted for thermal IPPs
connected with K-Electric and the remaining 200 MW is supplied by other power plants
connected to K-Electric. The major portion of the hydropower generation (i.e. 6902 MW out
of 7116MW) is captured by WAPDA’s hydel stations and the balance of 214 MW hydel
power generation is counted for IPPs (Kessides, 2013; Report, 2015).
NTDC and K-Electric are the main players in the power transmission sector of Pakistan.
NTDC is the national transmission company which is exclusively responsible to cater the
requirement of transmission, planning, coordination, and overall reliability of electric power
in the entire country except for the area served by K-Electric. K-Electric is an entity which is
integrated vertically, and covers the metropolitan area of Karachi. In addition to NTDC and
K-Electric, special purpose transmission licences have also been granted to Fatima
Transmission Company Limited and Sindh Transmission Company (Pvt.) Limited. Further a
+ 660 KV 878 km long HVDC transmission line from Matiari to Lahore is also underway for
which tariff has been determined by NEPRA (NEPRA, 2016).
In the distribution segment there are ten public DISCOs. Eight of the DISCOs including
(FESCO, HESCO, GEPCO, IESCO, LESCO MEPCO PESCO and QESCO were created as a
by unbundling the WAPDA's power wing. Later on SEPCO and TESCO were created by
bifurcation of HESCO and PESCO respectively. These DISCOs serve end consumers in all
Pakistan and FATA except the area of Karachi and its suburbs where K-Electric provides
distribution services under a its distribution license issued by NEPRA. Further, NEPRA has
issued nine distribution licences to small power producers and one distribution licence to a
captive power plant for selling electricity to designated bulk power consumers. Further, one
distribution licence has also been granted to Bahria Town Islamabad, in the category of
housing colonies distribution (Kessides, 2013; NEPRA, 2011; NEPRA, 2013).
The power sector of Pakistan transformed from exclusive centralized model to single buyer
model by introduction of NTDC by unbundling of power wing of WAPDA. NTDC acted as
national grid and as single buyer for major power producers through Central power
Purchasing Agency. Further, some of the generation companies have direct supply contracts
with DISCOs and Bulk Power Consumers (BPCs). Lately, in 2015 the function of purchase
of power from producers has been entrusted to newly created Central Power Purchasing
Agency (Guarantee) Limited (CPPA-G). Now CPPA-G is acting as market operator and
NTDC holds the wired transmission business and acts as national grid. The proposed future
model/configuration of power sector of Pakistan encompasses the attributes of open access
and retail competition.

The creation of NEPRA was aimed to have an autonomous regulator to improve the
performance of power sector, enhance competition and to deregulate the part of electric
sector where competition existed. It further aimed to protect the interests of all the
stakeholders of power sector. At the beginning of its establishment, NEPRA was attached
with Ministry of Water & Power and Ministry of Law and Justice. Later on in 2000, NEPRA
was attached with the Cabinet Division. Since then it is working in that setup (NEPRA,
2013). The top management or the Authority of NEPRA consists of a Chairman and four
members (representatives of each province). The chairman is directly appointed by Federal
Government. Whereas the members are also appointed by the Federal Government after
considering the recommendation of the respective provincial governments. One amongst the
members is appointed as a Vice-Chairman of the Authority, for one year period, by rotation.
In order to streamline different activities and address different issues of power sector,
NEPRA has formulated various Rules, Regulations and Guidelines (GOP, 1997).
Regulatory Governance and Performance
According to (Stern, 2010) in general, recent studies confirm that due to good regulation
investments and productivity performance of telecoms and electricity sector of developing
countries are improving day by day. The quality of regulatory decision-making is improved
by higher quality regulatory governance and hence, other things equal, the outcomes of
regulated industries (Brown et al., 2006). Higher economic growth and promotion of
international business in any country is associated with good regulation in that country
(Jalilian, Parker and Wilson, 2003). The foundation of regulatory system is based on the
elements of clarity of its roles, independence, and procedure for ensuring accountability.
Similarly, predictability, participation of stakeholders and transparency of regulatory process
will enhance the credibility of the agency (Berg, 2000).
Evaluation of Regulatory Governance
Performance of regulating entities can be evaluated by applying cost benefit analysis and
other standard methods for evaluation of economics. For evaluation of governance, a
relatively standard method has been developed which uses a hierarchy of three ‘Meta-
Principles’, ten ‘Principles’, and fifteen ‘Critical Standards’ (Stern, 2010).
If a regulatory system is compliant with three basic meta or higher-order principles of
governance (i.e. Credibility, Legitimacy and Transparency) then it is an effective regulatory
system, regardless of organizational forms of the regulatory governance systems. The higher-
order or Meta-Principles are deemed to be applicable to all regulatory entities (Brown et al.,
2006).
The ten principles or ten key principles which include accountability, independence,
transparency, participation of public, role clarity, predictability, clarity and completeness in
rules, application scale , appropriate institutional characteristics, requisite powers and
integrity of conduct are relatively standard and similar to other specifications of regulatory
entities principles Whereas the critical standards are a new departure and are specify the
appropriate method to achieve the principles in practice by regulatory bodies, which have
regulatory ‘independence to some extent (Robert, Martin and Martin, 2015).
(Jarvis and Sovacool, 2011) present a conceptual framework that can be used for evaluation
of regulatory systems of water and electricity sectors. It proposes an integrated framework
which combines the metrics of two main dimension of regulatory system (i.e. regulatory
substance and regulatory governance) to evaluate regulatory effectiveness with reference to
performance based outcomes in the provision of water and energy related services. For
effective governance, this study has identified eight structural based elements and two output

attributes. The frameworks come across at regulatory outcomes and governance at all levels
(i.e. industry level, provincial level and national level).
To implement regulatory policies, different institutional arrangements have been in place, a
separate agency from the government with sound levels of independence and technical
capability has emerged as the paradigm of a regulatory institution (Guasch, 2007).
Since 1980s, different countries of Latin America have started reforms in the
telecommunications sector for the creation regulatory environments for encouragement of
private investment, with special focus on foreign investment. The trends of reforms of 25
Caribbean and Latin American countries during 1980–2001 provide an index based on
autonomy, transparency, accountability, participation, clarity of objectives and the legal
power that are necessary for creating a regulatory body. The index clearly provides that
generally, well-built regulatory reforms have been achieved by most of the countries by
following the recommendations of practitioners and experts (Gutiérrez, 2003).
In Pakistan power sector, effectiveness of regulatory structure has been presented by (Malik,
2007) wherein regulatory environment in the electric power sector of Pakistan has been
discussed. NEPRA was created in 1997 to guarantee an efficient and competitive
environment for the distribution and generation companies, look after consumer interests in
the regarding provision of electric power. But NEPRA has failed to achieve its target so far.
The organizational weaknesses, less efficient electricity tariff, high line losses and prevailing
corruption are still affecting the power sector of the country. Lack of autonomy has weakened
the regulatory governance of NEPRA which resulted in overall institutional inability of
NEPRA to perform its functions in effective and desired manner. Further, NEPRA has failed
develop the professional expertise which are required for effective supervision and control of
power sector. In addition, NEPRA has also failed to set up a rational and equitable pricing
regime.
The process of creation of regulator and competitive environment has been evaluated by
(Cook, 1999) by reviewing case studies from developing countries and the outcomes were
that the regulatory culture development is constrained due to the lack of capacity of
government to enforce regulatory rules and monitoring contracts. Further, fostering
conditions that encourage competition and lessen anti-competitive behavior is a beneficial but
slow process. (Dubash, 2005) has reviewed the institutional arrangement and structure of
governance of the regulatory agencies in Indonesia, Philippines, India and Thailand and the
main findings were that capacity of institution systematic features of the sector in the country
need proper consideration and need to be addressed while designing the reforms.
In their study "Electricity Sector Reform in Developing Countries" (Zhang et. al, 2008) have
carried out an econometric assessment of the effects of regulation model, privatization, and
competition . Methodology used was using panel data for fifty one developing countries to
assess the effects of regulation, privatization and competition on the performance of electric
power generation companies. The main findings were that competition plays effective role in
motivating performance improvements, regardless of changes in regulation or ownership.
In a survey of selected transition and developing economies (Zhang et. al, 2009) have found
that regulatory reform is critical for better governance. The results showed that regulatory
reform in developing countries has not adopted systematic approach for promotion and
enhancement of regulatory governance. The paper suggests focusing the regulatory policies,

tools and institutions, and that centralized and concerted efforts are needed to integrate the
elements, for improvement of the regulatory governance.
(Steiner, 2000) empirically evaluates the effect on performance of electricity generation
industry in OECD caused by liberalization and privatization. The main findings were that
privatization, unbundling of generation, open access to transmission networks, and the
introduction of electricity markets have significant impact of on the performance and create
favourable conditions for international expansion of business.
The Impact of regulation on growth of economy in developing countries has been
demonstrated by (Jalilian, Parker and Wilson, 2003) . The study has used an econometric
model and explores the effect of regulatory governance on economic outcomes. The main
findings showed that there is well established link between economic performance and
regulatory quality. The study further find out that impact of reforms are constrained/limited
due to weakness in public policy.
Electricity and Telecommunication Regulation in Small and Developing Countries has been
presented by (Stern, 2000). Methodology used was the survey of evidence from telecom and
electricity industries in Asia, Latin America and Sub Saharan Africa. The main findings were
that the creation of effective and independent regulatory agencies plays an important in the
success and sustainability of the reform process. Further, regulatory agencies can be
strengthened by better educational infrastructure.
Utilities regulation in Ghana Centre on Regulation and Competition (CRC) has been
evaluated in by (Aryeetey and Ahene, 2005). In this study the methodology used was case
study of telecommunication, electricity and water utilities (i.e. three main public utilities in
Ghana). It has been concluded that regulatory reform process are hampered by insufficient
regulatory expertise; non-cooperative attitude by some key industry actors; and lack of
sufficient funding hampered the.
To determine the performance of a regulatory framework in Asian developing countries a set
of six elements as criteria has been developed by Stern and Holder in 1999.This set of criteria
consist formal and informal aspects. The formal aspect mainly relates to institutional design
and includes clarity of roles, autonomy and accountability while the informal aspect relates to
regulatory practices and processes. The informal aspect consists of participation, transparency
and predictability (Zeb, Haider and Shaheen, 2015).
According to (Kemal, 2015) various regulatory authorities have been established in Pakistan
for regulating utilities. Although, regulators are created to protect the right of consumers as
well as investors, but over a period of time where the regulators degenerate into protecting
the organizations which they are supposed to regulate. Therefore, accountability of regulatory
bodies must be in place to avoid corrupt persons in key positions in regulatory bodies. The
professionals of regulators must be of competent and well-versed with the latest regulatory
measures.
The study of (Zeb, Haider and Shaheen, 2015) reveals that there is inconsistency of
regulations between the energy sector regulators of Pakistan (i.e. NEPRA and OGRA) and
the same conveys a confused message to investors. This kind of inconsistency causes
disharmony in pricing strategies in the energy sectors and displays lack of autonomy and
clarity of roles in NEPRA and OGRA.

(Tsaplin, 2001) empirically tested the Ukrainian energy regulatory system to check its
compliance with requirements of good regulation and found major deficiencies in the
regulatory system. The main reasons were that the specifications of legislative frame work
were improper and incomplete. The process of compliance with requirement of regulations is
also affected by lack of coordination between administrative & regulatory reform and the
development of constitution.
(Thomas, 2016) argues that the introduction of incentive regulation was main element in the
UK reform process. The main findings of this study were that to avoid the abuse of market
power, regulatory interventions is necessary. With transformed market mechanism, the UK
generation market is competitive, but it remains to be seen whether this will be sufficient to
make generation truly competitive.
Based on the literature of institutional economics and incentive regulation , study has been
carried out to construct an empirical model to investigate the impact on the degree of best
practice regulation by industry size, political and economic institutions.. The outcomes of the
study prima facie recommend that for best practice regulation, the most important
institutional determinant is the existence and experience of an autonomous regulator (Haney
and Pollitt, 2011).
Much of the work in UK, the European Union and the USA has been on infrastructure
regulation in developing countries. The paper discusses the evaluation issues involved and
covers the use of case studies, econometric techniques and, briefly, randomized experiments.
The paper also discusses the origin, contents and lessons from the 2006 World Bank
Handbook on evaluating infrastructure regulatory frameworks. The conclusion of the paper
contents some general comments on the role of evaluation both for establishing the
accountability of regulatory arrangements as well as for providing a process by which they
and others can systematically learn from experience (Stern, 2010).
A regulatory system can be termed as effective only if three basic meta- or higher-order
principles of credibility, legitimacy and transparency are satisfied y that system (Stern, 2010).
(Trillas and Montoya, 2013) finds that once de facto issues and endogeneity are taken into
account, the autonomy of regulator has a significantly positive but modest impact on network
penetration. The survey of new empirical evidence plus the literature on de facto autonomy. It
is argued that a utility regulatory institute is effective if it provides transparency and
predictability (Stern and Holder, 1999a).
(Cubbin and Stern, 2005) assess whether superior electricity outcomes are significantly
associated with the existence of a regulatory law and higher quality regulatory governance.
The study uses theoretical and empirical work on the impact of independent central banks and
telecommunications regulators of twenty eight developing countries over the period 1980-
2001. The results of the empirical analysis conclude that higher per capita generation capacity
levels have significant positive association with regulatory law and higher quality
governance.
Levels of Evaluation of Regulatory Governance
According to (Robert, Martin, and Martin, 2015), the evaluation of Regulatory governance
has three levels i.e. short or basic evaluation, mid-level evaluation and in-depth evaluation.
The short evaluation uses a structured questionnaire and is taken as a diagnostic check on the

IV DV
basic characteristics of the sector. The short level evaluation reports the issues of regulatory
governance and industry structure in excellent manner, while it has relatively little emphasis
on outcomes. The mid-level evaluation also uses questionnaire and interviews and intends
deeper exploration of regulatory governance issues. In the mid-level evaluation outcomes of
regulatory systems are also taken into consideration. The in-depth evaluation is essentially
the mid-level evaluation but with much more probing and a wider remit.(Brown et al., 2006)
and (Stern, 2010).
In Pakistan, when the government felt that the required expansion and efficiency in the
power generation and capacity to transmit the same cannot be achieved without the
involvement of private sector, a strategic plan was framed in 1992, for the privatization of the
power sector. Further, in order to introduce a transparent and judicious economic regulation
to the power sector, it was decided to create an autonomous regulatory agency. Accordingly,
NEPRA was created in December 1997 as an independent regulatory body (Kemal, 2015).
Research Methodology
This section describes the research methodology of the study including instrument
development/selection, methods of sampling, data collection, data processing, data analysis
technique, variables and their measures, reliability and validity of data.
Conceptual Framework/Research Model
Figure-1 Dimensions of Regulatory Effectiveness (DRE)
Figure-2 Conceptual Framework
Regulatory Substance
(R.S)
Regulatory Governance
(R.G)
Capacity
Predictability
Participation
Integrity
Credibility
Legitimacy
D.R.E
H1
H2 H5
H3
H4

Research Methodology/Design
The research method used to conduct this study is a field survey research. The nature of data
of this research is cross-sectional primary data which was obtained from power sector
professionals of Pakistan mainly dealing with regulatory affairs, through a close-ended
questionnaire. There are three main types of research methods i.e. qualitative research,
quantitative research, and a mixed research method, which is the combination of both
qualitative and quantitative methods (Johnson and Larry, 2003). For the purpose of this study,
quantitative techniques are used to measure all the independent and dependent variables. The
data was empirically tested using IBM SPSS 23.00. The hypothesis testing of this study
consider the impacts of independent variables on the dependant variable.
Population frame
The population is composed of main players of power sector of Pakistan. The population
frame consist of NEPRA, Ministry of Water & Power (MoW&P), Private Power and
Infrastructure Board (PPIB), Alternative Energy Development Board (AEDB), Ministry of
Planning, Development and Reforms (MoPDR), Distribution Companies (DISCOs),
Transmission Companies, Generation Companies, Energy Departments, Power & Legal
Consultants dealing with the Regulator and individual experts of the field. The targeted
respondents were the middle and upper level management and employees of these
organizations dealing with policy and regulatory affairs.
Sample Design
The study is in the form of cross sectional in which data will be collected once across a
population through the purposive (non-probability) sampling technique. The reason for
selecting purposive sampling is that regulatory governance is a specialized field and choosing
the respondents randomly would not serve the purpose. Therefore, participants having sound
knowledge of power sector and dealing with regulatory affairs were included in the sample.
These participants were middle or upper level management. The sample frame consist of two
transmission companies, three distribution companies, ten generation companies, three
energy departments, existing and ex-professionals of regulator, seven power sector
consultants, MoW&P, PPIB, AEDB energy wing of planning commission and senior faculty
members of energy management. In Purposive sampling the sample size is usually small,
often fewer than 30 cases (Onwuegbuzie and Collins, 2007). The questionnaire was
distributed to a total of one hundred and twenty (120) participants/professionals of the above
mentioned organization using the purposive (non-probability) sampling technique. The
sample size has been calculated using Creative Research System and Raosoft online sample
size calculator. The questionnaire was administered personally and via email guidance when
required. Further, a comprehensive questionnaire was also prepared on Google docs and
shared with the respondents. The sample size was restricted due to time and resources
constraints. Total 91 responses were received and the response rate was 75.83%.
Instrument Development/Selection
The Questionnaires for this study was adapted from the study carried out by Jarvis and
Sovacool which provides conceptual framework for evaluation of regulatory systems (Jarvis
and Sovacool, 2011) and study of (Stern and Holder, 1999b).
Variables and their measures
In this study, independent and dependent variables have been used. In this research design,
structural attributes of regulatory governance (i.e. capacity, predictability, integrity,
participation and transparency) are independent variables whereas output attributes of

regulatory governance (i.e. legitimacy and credibility) are dependent variables. To measure
these variables different items are associated with each construct in the questionnaires. This
research is quantitative and questionnaires are commonly used to collect data in a quantitative
research. Advantages of using questionnaire for data collection includes are that it is
economical, relatively simple to administer, straightforward and easier to analyze. The
questionnaire is prepared by using a five point Linkert scale, whereas- 1 = Strongly Disagree,
2 = Disagree, 3 = Neutral, 4 = Agree, 5 = Strongly Agree.
Data collection procedures:
The purposive (non-probability) method of sampling is used in this study. In the purposive
sampling a group is selected from the population frame on the basis of available information
thought. The design of the questionnaire involves close ended questionnaires.
Data analysis techniques
The data analysis involves inferential statistics using SPSS (Statistical Program for Social
Sciences) software. In this study, SPSS 23.0 is used to analyze the data. Correlation design
has been used in this study which determines the relationship among dependent variable and
independent variables (Pearson‘s product moment correlation coefficient and simple
regression). Correlation is used to report the findings as Correlation tells about the strength
and direction of relationship between the variable mentioned in hypothesis. Value of r
(coefficient of correlation) explains relationship between the variables of interest. Positive or
negative sign value of r gives a clear idea that about relationship between the variables of
interest.
Data Screening (missing values, outliers and normality etc.)
Histogram scatter plots were used to compare the data distribution with or without outliers
and to analyze normality of the data. The results show that the data is normal and not skewed
with no outliers.
Validity
The extent of accuracy of the results a the study is referred as validity. The validity can either
be external or internal. The accuracy of the obtained results is referred to as internal validity
whereas external validity refers to the analysis of the results regarding whether they can be
generalized (Ghauri, & Gronhaug, 2005). If measurements are used, then different types of
validity exist the including: face validity, convergent validity and divergent validity. Face
validity explains the degree to which the measure used is reasonably capable of what is due to
measure, convergent validity provides the extent to which the measurement used can bring
similar results if used elsewhere and divergent validity that describes the extent to which one
construct is distinguished from another.
For the purpose of this study, face validity and content validity was checked to confirm the
validity of the collected data and theresearch instrument. The questionnaire was shared and
discussed with senior professionals and potential respondents to check its validity at face
value. However, now significant change or ommission was suggested. To check the validity
of the content, the items of questionnaire were checked with reference to the theoretical
framework. Two questions were deleted to avoid repetition to ensure the validity of the
instrument.
Reliability
Reliability is the stability of the measure used to study the relationships between variables.
The Cronbach’s alpha is most commonly used measure of reliability, which provides a
measure of the internal consistency of a scale. The value of Cronbach’s alpha is expressed as

a number between 0 and 1. The extent to which all the items in a test measure the same
construct is described by internal consistency which is linked to the inter-relatedness of the
items within the test (Tavakol and Dennick, 2011). Cronbach’s Alpha coefficient must be
greater than 0.7 (Nunnally, 1978; Panayides, 2013). According to the thumb rule of George
and Mallery (2003) the value of Cronbach's Alpha: “> 0.9 is Excellent, > 0.8 is Good, > 0.7 is
Acceptable, > 0.6 is Questionable, > 0.5 is Poor, and < 0.5 is Unacceptable (Gliem and
Gliem, 2003).
Data Analysis and Discussion
Following the conceptual framework, research methodology and data analysis techniques as
discussed in the forgoing chapter, this chapter provides descriptive analysis of data, results of
Correlation and Regression and interpretation of these results.
Descriptive Analysis:
Frequency tables and descriptive etc. are covered under this section of the study examining
the variables thoroughly for better understanding and comprehension of the data. The 44
questions in the questionnaire out of which only research question no.1 has been measured
using a different scale in the attempt to understand from which organization the respondents
belong;
1 – Transmission 2 – Distribution 3 – Generation 4 – Energy Department 5 – Regulator 6 – Consultant 7 – Others
According to the frequency table, the minimum responses for question 1 -What is your
organization type, was 1 while maximum responses was 7. Table 1 concludes that most of the
respondents belonged to the Energy Department (22%) and Regulatory body which is
NEPRA (19.8%) while only a few belonged to Transmission (6.6%) and Distribution
companies (5.5%). Table 2: Descriptive Statistics
N Minimum Maximum Mean Std. Deviation
PRDAVG 91 1.00 5.00 2.9863 .83530
INTAVG 91 1.25 5.00 3.5522 .66093
CRDAVG 91 1.00 5.00 2.8938 .87468
LEGAVG 91 2.00 5.00 3.7619 .72741
PARAVG 91 2.00 4.83 3.9469 .60549
CAPAVG 91 2.50 5.00 3.8159 .72153
Valid N (listwise) 91
Predictability
Descriptive statistics for predictability variable show that most of the respondents chose
answers 2 or 3 on the Likert Scale which is why the mean is around 3.
Integrity
On the topic of integrity, the respondents were asked to provide their view regarding the
following aspects:
a. Disclose conflicts of interest by the members of NEPRA;
Table-1 Organization Type
Frequency Percent Valid Percent Cumulative Percent
Valid 1 6 6.6 6.6 6.6
2 5 5.5 5.5 12.1
3 15 16.5 16.5 28.6
4 20 22.0 22.0 50.5
5 18 19.8 19.8 70.3
6 12 13.2 13.2 83.5
7 15 16.5 16.5 100.0
Total 91 100.0 100.0

Credibility
Three items were used to measure the variable, credibility. Out of the three, item 2 got most
of the responses around 2 as the mean is 2.69 while for the other two it is 3.10 and 2.89
which is closer to 3 meaning thereby that the respondents mostly answered neutrally for these
two questions. The overall response for credibility lies on negative side.
Legitimacy
Three important items were added in order to measure legitimacy for this study.
a. NEPRA is considered to be fair in its treatment of stakeholders;
b. NEPRA displays impartiality and even-handedness in its decision making and
rule determination;
c. Multiple stakeholders are engaged with NEPRA to prosecute their concerns
and agenda;
The data shows that most of the respondents chose 3 and 4 for these three items. From the
said results it can be inferred that perception of stakeholders regarding legitimacy of NEPRA
is on positive side.
Participation
The data shows varied results of the respondents according to the mean for the variable,
participation. The questions included for this variable inquired regarding:
a. Placement of proper mechanism and procedures in NEPRA for consultation regarding
major decisions
b. Holding of public meetings/hearings by NEPRA
c. Provision provided by NEPRA to allow written and oral submissions to its decision
making bodies and formal response to these submissions.
b. Appointments of members of the NEPRA;
c. Perception of stakeholders regarding impartiality of NEPRA;
d. Perception of stakeholders regarding adherence of NEPRA to the broader principles
of its mandate.
Capacity
For the variable, capacity most of the responses are on positive side and the mean is around 4
which means that the respondents went for positive answers.
According to the mean, the responses were mainly around 3 which is neutral on the Likert
Scale.
Reliability of the research Instrument
To check the reliability of the research instrument, a pilot test based on thirteen responses
was conducted to analyze the items of the constructs. Based on the pilot testing some items of
the construct were eliminated. In order to test the questionnaire's reliability, IBM SPSS 23.0
software was used to find out Cronbach’s Alpha of all the variables of the study. The
Cronbach’s Alpha coefficients for different variable of this study were fond out to be:
capacity: 0.767, integrity: 0.646, participation: 0.779, predictability: 0.742, legitimacy: 0.740
and credibility: 0.739. As Cronbach’s Alphas of most of the construct are above 0.7 and the
responses and results from this study can be considered reliable.
Further, the data was tested for Reliability of Questionnaire, Multi Co-linearity,
Heteroscedasticity and Normality. The results of the test confirmed that the data is normal,
linear and encompass no heteroscedasticity.
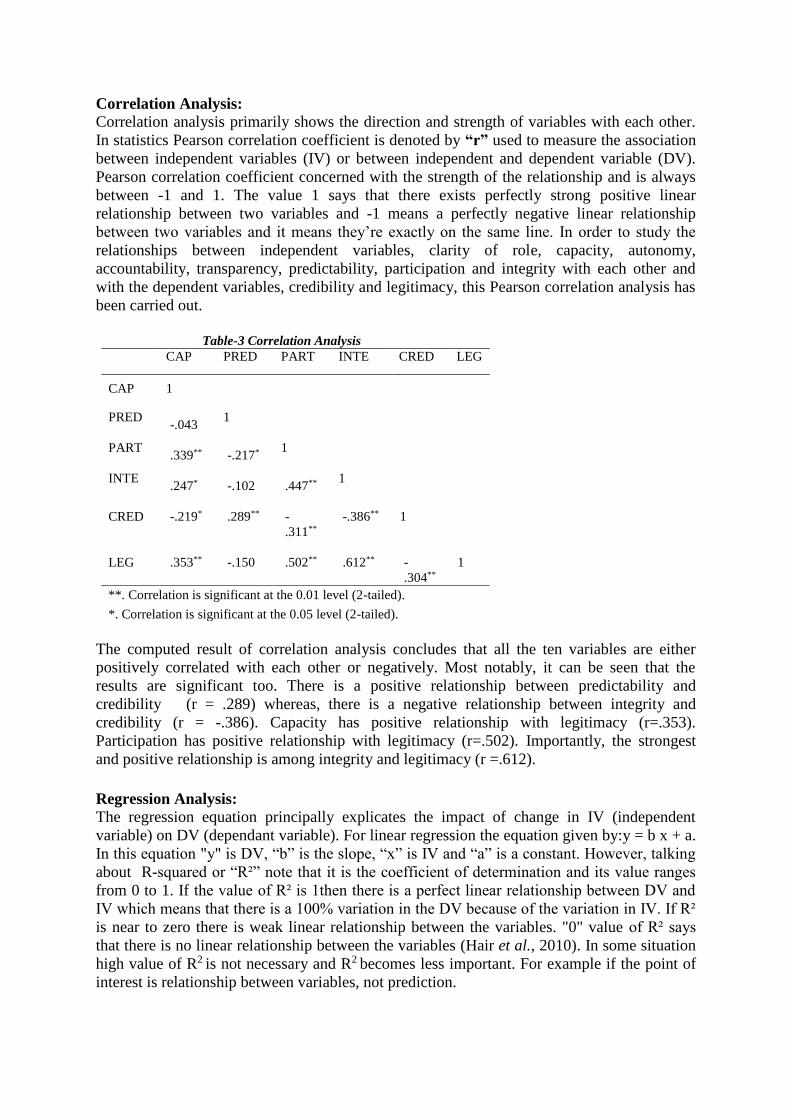
Correlation Analysis:
Correlation analysis primarily shows the direction and strength of variables with each other.
In statistics Pearson correlation coefficient is denoted by “r” used to measure the association
between independent variables (IV) or between independent and dependent variable (DV).
Pearson correlation coefficient concerned with the strength of the relationship and is always
between -1 and 1. The value 1 says that there exists perfectly strong positive linear
relationship between two variables and -1 means a perfectly negative linear relationship
between two variables and it means they’re exactly on the same line. In order to study the
relationships between independent variables, clarity of role, capacity, autonomy,
accountability, transparency, predictability, participation and integrity with each other and
with the dependent variables, credibility and legitimacy, this Pearson correlation analysis has
been carried out.
Table-3 Correlation Analysis
CAP PRED PART INTE CRED LEG
CAP 1
PRED
-.043 1
PART
.339**
-.217* 1
INTE
.247*
-.102
.447** 1
CRED
-.219*
.289**
-
.311**
-.386** 1
LEG
.353**
-.150
.502**
.612**
-
.304**
1
**. Correlation is significant at the 0.01 level (2-tailed).
*. Correlation is significant at the 0.05 level (2-tailed).
The computed result of correlation analysis concludes that all the ten variables are either
positively correlated with each other or negatively. Most notably, it can be seen that the
results are significant too. There is a positive relationship between predictability and
credibility (r = .289) whereas, there is a negative relationship between integrity and
credibility (r = -.386). Capacity has positive relationship with legitimacy (r=.353).
Participation has positive relationship with legitimacy (r=.502). Importantly, the strongest
and positive relationship is among integrity and legitimacy (r =.612).
Regression Analysis:
The regression equation principally explicates the impact of change in IV (independent
variable) on DV (dependant variable). For linear regression the equation given by:y = b x + a.
In this equation "y" is DV, “b” is the slope, “x” is IV and “a” is a constant. However, talking
about R-squared or “R²” note that it is the coefficient of determination and its value ranges
from 0 to 1. If the value of R² is 1then there is a perfect linear relationship between DV and
IV which means that there is a 100% variation in the DV because of the variation in IV. If R²
is near to zero there is weak linear relationship between the variables. "0" value of R² says
that there is no linear relationship between the variables (Hair et al., 2010). In some situation
high value of R2 is not necessary and R2 becomes less important. For example if the point of
interest is relationship between variables, not prediction.
In order to analyze the impact of independent variables; capacity, predictability, participation
and integrity on the dependent variables; credibility and legitimacy, regression analysis was
carried out.
The Regression Model
For the ith observation the linear regression model can be written as
yi = β1 + β2xi2 + ··· + βkxik + ··· + βKxiK + εi
Wherein y: dependent variable, x’s : independent variables, and ε:error in equation,
β2 through βK: parameters that indicate the effect of a given x on y; β1 is the intercept.
For the purpose of the study, the linear regression model can be expressed as
yCRD = β1 + β2xPRD + β3xINT + + εCRD
yLEG = β1 + β2xCAP + β3x PAR + β4xINT + εLEG
In the above equation
YCRD is the Credibility
Dependent Variables
YLEG is Legitimacy
xCAP is Capacity,
xPRD is Predictability Independent Variables
xPAR is Participation and
xINT is Integrity
εLEG and εCRD are the errors in equations. β2 through β7 are parameters that indicate the effect
of a given independent variable xi on dependant variable yi; β1 is the intercept.
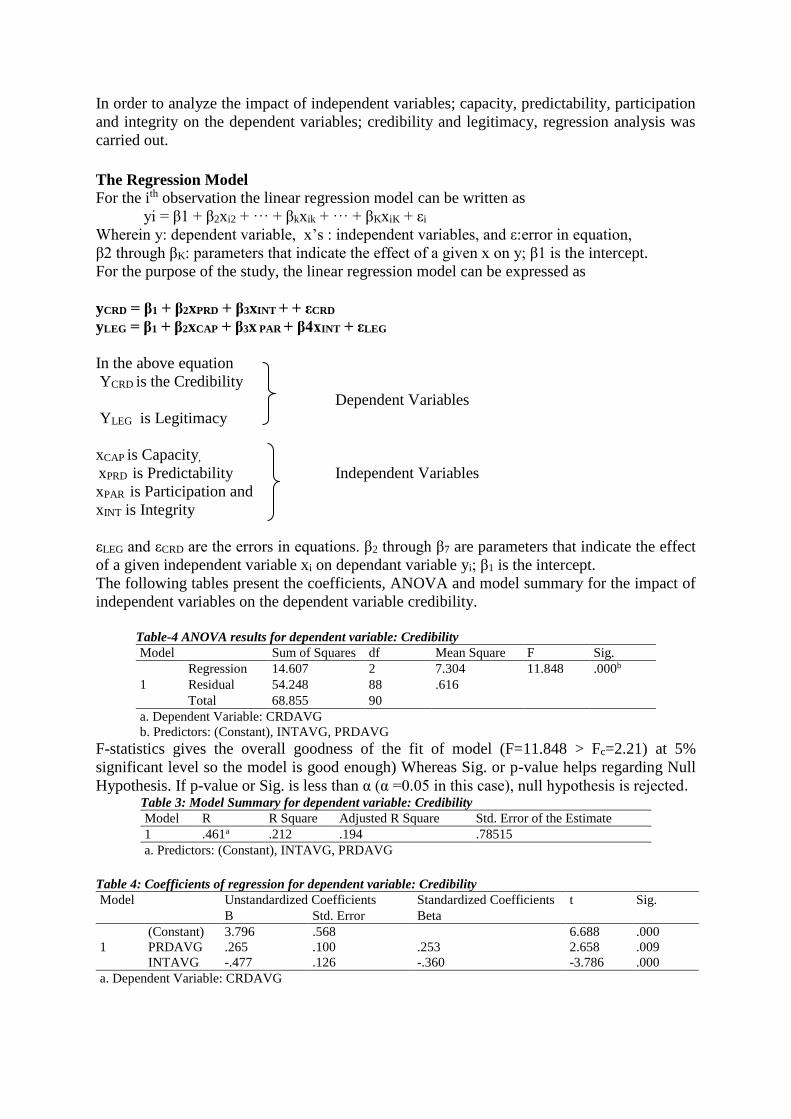
The following tables present the coefficients, ANOVA and model summary for the impact of
independent variables on the dependent variable credibility.
Table-4 ANOVA results for dependent variable: Credibility
Model Sum of Squares df Mean Square F Sig.
1
Regression 14.607 2 7.304 11.848 .000b
Residual 54.248 88 .616
Total 68.855 90
a. Dependent Variable: CRDAVG
b. Predictors: (Constant), INTAVG, PRDAVG
F-statistics gives the overall goodness of the fit of model (F=11.848 > Fc=2.21) at 5%
significant level so the model is good enough) Whereas Sig. or p-value helps regarding Null
Hypothesis. If p-value or Sig. is less than α (α =0.05 in this case), null hypothesis is rejected. Table 3: Model Summary for dependent variable: Credibility
Model R R Square Adjusted R Square Std. Error of the Estimate
1 .461a .212 .194 .78515
a. Predictors: (Constant), INTAVG, PRDAVG
Table 4: Coefficients of regression for dependent variable: Credibility
Model Unstandardized Coefficients Standardized Coefficients t Sig.
B Std. Error Beta
1
(Constant) 3.796 .568 6.688 .000
PRDAVG .265 .100 .253 2.658 .009
INTAVG -.477 .126 -.360 -3.786 .000
a. Dependent Variable: CRDAVG

According to the results, predictability and integrity have a significant impact on credibility
(0.009 and 0.000). There is 0.25 unit and 0.36 unit change in credibility which can be
explained by a unit change in predictability and integrity respectively. According to the value
of R-squared, unit (1%) change in each of the IV in the model explains 0.25 unit (25%)
changes in the DV that is credibility, whereas according to the value adjusted R2 (36%)
change in DV (Credibility) is explained by those IVs which have significant effect on it (i.e.
predictability and integrity). It is to be noted that "R2" assumes that each IV in the model
explains the changes in the DV. It gives the percentage of explained variation as if all IVs in
the model affect the DV, whereas the adjusted R2 provides the percentage of variation
explained by only those IVs that in reality affect the DV (Tabachnick and Fidell, 2007).
The following tables present the coefficients, ANOVA and model summary for the impact of
independent variables on the dependent variable Legitimacy.
Table 5: ANOVA results for dependent variable: Legitimacy
Model Sum of Squares df Mean Square F Sig.
1
Regression 21.973 3 7.324 24.845 .000b
Residual 25.648 87 .295
Total 47.621 90
a. Dependent Variable: LEGAVG
b. Predictors: (Constant), INTAVG, CAPAVG, PARAVG
The model is good as the value of F=24.845 is much greater that Fcritical=2.32, and significant
level is also good, i.e. p-value=0.000<< α =0.05. Table 6: Model Summary for dependent variable: Legitimacy Model R R Square Adjusted R Square Std. Error of the Estimate
1 .679a .461 .443 .54296
a. Predictors: (Constant), INTAVG, CAPAVG, PARAVG
Table 7: Coefficients of regression for dependent variable: Legitimacy
Model Unstandardized Coefficients Standardized Coefficients t Sig.
B Std. Error Beta
1
(Constant) .195 .443 .440 .661
CAPAVG .159 .085 .158 1.877 .064
PARAVG .289 .110 .240 2.632 .010
INTAVG .512 .097 .465 5.260 .000
a. Dependent Variable: LEGAVG
According to the results, capacity, participation and integration have a significant effect on
legitimacy with the R-squared of 0.443 which concludes that there is a 44% variation in the
variable legitimacy due to the above mentioned variables. There is 0.158, 0.240 and 0.465
unit changes in the dependent variable Legitimacy due to unit changes in IVs i.e. Capacity,
Participation and Integrity, respectively.
Hypothesis Testing and Discussion
H1: There is a significant relation between predictability and credibility:
The results show that there is significant relation between predictability and credibility of
NEPRA as found by (Brunetti, Kisunko & Weder, 1997) in their worldwide survey of the
Private Sector regarding Credibility of Rules and Economic Growth.
H2: There is a significant relation between integrity and credibility:
Integrity is corner stone of professionalism and absence of integrity causes loss of credibility
(FEE, 2009).To measure the extent to which reputation and credibility remain intact,
professional integrity is considered to be a good measure. The perception of dishonesty or

lack of integrity undermines the credibility (Medical Protection Society, 2011). The results of
this study also show significant relationship between integrity and credibility of NEPRA.
H3: There is a significant relation between capacity and Legitimacy:
Capacity of an organization is an tool to increase its legitimacy and to achieve reputation
(Five et al., 2011). The results of this study affirm that the capacity of NEPRA has also
positive relationship and play role in enhancing its legitimacy.
H4: There is a significant relation between participation and Legitimacy: The public participation in decision making is meant to improve the legitimacy of decisions
(National Research Council, 2008). The study of Yves Bonzon on "Public Participation and
Legitimacy in the WTO" has mentioned that the legitimacy of the decision-making process of
WTO has always been questioned, and public participation has been advocated as a remedy
(Bonzon, 2014). The results of this study show that public participation has also significant
correlation with legitimacy of NEPRA as provided in the results of this study.
H5: There is a significant relation between integrity and Legitimacy: Integrity is proposed as precondition for gaining legitimacy and a motivation for seeking it
(Kimakowitz, 2012). The sense of integrity of an organization provides positive feelings
regarding its legitimacy (Slim, 2002). In conformity to the said, the outcomes of this study
show a very significant positive relationship between legitimacy and integrity in the case of
NEPRA.

Table-8 Hypothesis results
HYPOTHESIS Results Ho Accepted/Rejected
H1: There is a significant relation between
predictability and credibility.
Significant
relationship exist
Ho Rejected and Alternative
Hypothesis Accepted
H2: There is a significant relation between
Integrity and credibility
Significant
relationship exist
Ho Rejected and Alternative
Hypothesis Accepted
H3: There is a significant relation between
Capacity and legitimacy
Significant
relationship exist
Ho Rejected and Alternative
Hypothesis Accepted
H4: There is a significant relation between
Participation and legitimacy
Significant
relationship exist
Ho Rejected and Alternative
Hypothesis Accepted
H5: There is a significant relation between
Integrity and legitimacy
Significant
relationship exist
Ho Rejected and Alternative
Hypothesis Accepted
Conclusions and Recommendations
The determination and evaluation of the factors which effect the regulatory governance and
in turn the regulatory effectiveness of the power sector regulator was main objective this
study. The literature review provided understanding and identification of these these
determinants. The results show that predictability and integrity have a strong and significant
impact on credibility while capacity, participation and integrity have an effect on legitimacy
of NEPRA.
Being the sole regulator of power sector in Pakistan, NEPRA has main role in development
of the country in general and development of power sector, in particular. Further the
responsibilities of NEPRA are unique and sensitive nature. Although, the regulatory
governance of NEPRA is good, but to carry out its responsibilities in a meaningful and
effective manner and to meet the emerging challenges and evolution in the electricity market,
NEPRA need further improve its regulatory governance by adhering to the well established
attributes of regulatory governance.
Previous study on regulatory effectiveness of NEPRA carried out in 2007 (Malik, 2007)
referring to the outcomes of power sector, the regulatory governance of NEPRA has been
termed as very weak. In this regard it is to be noted that in Pakistan the power sector
outcomes badly affected by non-regulatory factors. Therefore, based on overall sector factors
it cannot be determined that the regulatory governance is weak. Evaluation of regulatory
governance requires specific considerations. Therefore, considering the results of this study
based on responses of the participants regarding different specific attributes of regulatory
governance it can be concluded that over all regulatory governance of NEPRA is quite
acceptable as it fulfils most of the key attributes which are specifically related to the
regulatory governance, which is further clarified in the following Paragraphs.
The observation of respondents regarding the governance attribute of clarity of role in
NEPRA is very positive as Legislation of NEPRA provides clear description of its roles,
responsibilities, objectives and other functions. Further, in the legislation the role of different
regulating entities regarding their functions (i.e. Licensing, Tariff and Monitoring) are well
established.
Capacity of an organization also a part of its regulatory governance the capacity refers to
availability of sufficient human and financial resources which are required to carry out the
organizational responsibilities. With the passage of time, NEPRA has attained good health
and independent revenue stream guaranteeing its operations without any constraints and
enjoys budget stability year by year. Further, professional capacity of NEPRA has also
enhanced. Due to all these reasons, the response of respondents regarding capacity of
NEPRA is on positive site.

NEPRA maintains well established set up and procedures regarding its accounts and
rendering reports to relevant stakeholders. The existence of mechanism of accountability,
dispute resolution and provision for judicial review in case of dispute, depicts that the
attribute of accountability is prevailing in NEPRA.
Similarly, the results have shown good perception in stakeholders regarding transparency of
process, involvement of public and integrity of NEPRA. Further, the decisions/orders of
NEPRA are honoured and accepted by stakeholders, which highlights legitimacy of its
decisions. The respondents have appreciated the adherence of NEPRA to the attributes of
regulatory governance including integrity, capacity, predicibility, participation, credibility
and legitimacy. However, the perception of stakeholders regarding predictability and
credibility of NEPRA is not satisfactory. These two attributes of regulatory governance need
to be focused and improved to build good image and attain the trust of stakeholders.
Recommendations
As per the result of this study, some recommendations are being put forth for regulatory
authority, policy makers and researchers. Although NEPRA has quite acceptable levels of
some of the governance attributes but the same can be further refined by putting little focus
on them. One of the good things is that NEPRA has already developed Standard Operating
Procedures (SOPs) for inspection, examination and provision of copies of documents but it is
out of the eyes of most of the stakeholder. Therefore, NEPRA must highlight these SOPs
while publicizing any major decision to enhance transparency. Further, some of the
stakeholders have shown reservation on interventions of government in the processes of
regulator, therefore the government should not interfere with the mandate of regulator and
need to notify its decisions in true spirit and timely manner. It is recommended that NEPRA
may develop mechanism to bring in consistency, stability and certainty in its rules/regulations
and decisions to enhance its predictability. Further, NEPRA may take measures to ensure the
stakeholders regarding honoring its commitments, agreements and obligations, to enhance its
credibility. This research has been carried out with empirical tests; researchers are advised to
take up the task of carrying out interviews so as to better understand the regulatory
governance in various regulatory bodies across the globe.
Limitations of the study:
This study is specifically related to NEPRA, implying the findings to other regulating
entities, ground realities and other differences in culture and structure must be consisdered.
Although, this study has been carried out in a careful way yet some limitations exist
regarding data as the same was collected only from the professionals of power sector mainly
having offices in Islamabad, Lahore, Peshawar, Karachi and some other cities, using
purposive sampling. Whereas, there are more prospects of acumens to examine and analyze.
Future Research
General review of the literature shows that the structural attributes of governance have
significant positive correlation with credibility whereas, in the case of NEPRA, the results
show that most of the attributes have significant negative correlation with its credibility. This
aspect needs further investigation.
References
Aryeetey, E. and Ahene, A. A. (2005) ‘Centre on Regulation and Competition WORKING
PAPER SERIES UTILITIES REGULATION IN GHANA’.
Asghar, Z. (2008) ‘Applied Econometrics and International Development’,
Econpapers.Repec.Org, 8, p. 44.
Berg, S. (2000) ‘Developments in Best-Practice Regulations’. The Electricity Journal.
Bonzon, Y. (2014) PUBLIC P A R T I C I P A T I O N AND LEGITIMACY IN THE W T O.
Brown, A. C., Stern, J., Tenenbaum, B. and Gencer, D. (2006) Evaluating Infrastructure
Regulatory Systems. doi: 10.1596/978-0-8213-6579-3.
Cook, P. (1999) ‘Privatisation and Utility Regulation in Developing Countries: Lessons So
Far’, Annals of Public and Cooperative Economics. 1999;70,4:549-587.
Cubbin, J. and Stern, J. (2005) Regulatory Effectiveness and The Empirical Impact of
Variations in Regulatory Governance - Electricity Industry Capacity and Efficiency in
Developing Countries. The World Bank (Policy Research Working Papers). doi:
10.1596/1813-9450-3535.
Dubash, N. K. (2005) ‘Regulation as an Arena for Social Policy Examples from Electricity in
Asia’.
FEE (2009) ‘Ethics and Independence Integrity in Professional Ethics A Discussion Paper’,
(September), p. 19.
Five, C., Resultsanalysis, C. S., Six, C., Hpv, S., Justice-, O. S. and Youth, I. (2011) 3Exploring the Dimensions of Organizational Capacity for Local Social Service Delivery
Organizations Using a Multi-Method approach.
Ghauri, P. N. and Grønhaug, K. (2002) Research Methods in Business Studies: A practical
guide. Pearson Education.
Gliem, J. A. and Gliem, R. R. (2003) ‘Calculating, interpreting, and reporting Cronbach’s
alpha reliability coefficient for Likert-type scales’, Midwest Research to Practice Conference
in Adult, Continuing, and Community Education, (1992), pp. 82–88. doi:
10.1109/PROC.1975.9792.
GOP (1997) ‘NEPRA ACT 1997’.
Guasch, J. L. (2007) ‘Assessing the Governance of Electricity Regulatory Agencies in the
Latin American and Caribbean Region : A Benchmarking Analysis’, (November).
Gutiérrez, L. H. (2003) ‘Regulatory governance in the Latin American telecommunications
sector’, Utilities Policy, 11(4), pp. 225–240. doi: 10.1016/S0957-1787(03)00062-6.
Hair, J. F., Black, W. C., Babin, B. J. and Anderson, R. E. (2010) Multivariate Data Analysis.
7th edn, Vectors. 7th edn. doi: 10.1016/j.ijpharm.2011.02.019.

Haney, A. B. and Pollitt, M. G. (2011) ‘Exploring the determinants of “best practice”
benchmarking in electricity network regulation’, Energy Policy. Elsevier, 39(12), pp. 7739–
7746. doi: 10.1016/j.enpol.2011.09.018.
Jalilian, H., Parker, D. and Wilson, F. (2003) ‘Centre on Regulation and Competition’.
Jarvis, D. S. L. and Sovacool, B. K. (2011) ‘Conceptualizing and evaluating best practices in
electricity and water regulatory governance’, Energy. Elsevier Ltd, 36(7), pp. 4340–4352.
doi: 10.1016/j.energy.2011.04.007.
Johnson, B. and Larry, C. (2003) ‘1 Chapter 2 Quantitative, Qualitative, and Mixed Research
This chapter is our introduction to the three research methodology paradigms. A’,
Educational Research: Quantitative, Qualitative, and Mixed Approaches, pp. 1–10.
Kalita, P. C. and Medhi, M. (2011) ‘Importance of Power Sector for Socio-Economic’,
(March 2010), pp. 135–150.
Kemal, A. . (2015) ‘Regulatory Framework in Pakistan’, The Pakistan Development Review,
41:4 Part(Winter), pp. 319–332.
Kessides, I. N. (2013) ‘Chaos in power : Pakistan ’ s electricity crisis $’, Energy Policy.
Elsevier, 55, pp. 271–285. doi: 10.1016/j.enpol.2012.12.005.
Malik, A. (2007) ‘Effectiveness of regulatory structure in the power sector of Pakistan’,
PIDE Working Papers, (25), pp. 1–34.
Malik, A. (2012) ‘Power Crisis in Pakistan : A Crisis in Governance ?’
Malyshev, N. (2002) ‘THE EVOLUTION OF REGULATORY POLICY IN OECD
COUNTRIES’, pp. 1–30.
Medical Protection Society (2011) MPS Guide to Ethics: A map for the moral maze.
NEPRA (2011) ‘LAD-35 SEPCO Determination August 16, 2011.pdf’. NEPRA.
NEPRA (2013) ‘NEPRA Determination: Distribution Licence of TESCO’, (XL), pp. 1–21.
NEPRA (2016) ‘TRF-351 HVDC Tariff’, in. Islamabad.
Nunnally, J. . (1978) Psychometric theory. : McGraw Hill, 1978. 701p. New York: New
York.
Onwuegbuzie, A. J. and Collins, K. M. T. (2007) ‘A Typology of Mixed Methods Sampling
Designs in Social Science Research’, The Qualitative Report Cook & Reichardt Reichardt &
Rallis Tashakkori & Teddlie. Bryman Creswell Newman & Benz Jick McMillan &
Schumacher Onwuegbuzie, 12(2), pp. 281–316.
Panayides, P. (2013) ‘Interpret With Caution’. PsychOpen, a publishing service by Leibniz
Institute for Psychology Information (ZPID), Trier, Germany (www.zpid.de). doi:

10.5964/ejop.v9i4.653.
Radaelli, B. C. and Fritsch, O. (2012) ‘AND PROGRAMMES By Claudio Radaelli and
Oliver Fritsch Expert Paper No . 2 , July 2012’, (2).
Report, I. (2015) ‘State of Industry Report 2015 1’.
Robert, B., Martin, C. and Martin, L. (2015) ‘The Oxford Handbook of Regulation’,
(September), pp. 1–22. doi: 10.1093/oxfordhb/9780199580583.003.0010.
Steiner, F. (2000) ‘Regulation, industry structure and performance in electricity supply
industry’, Most, (144).
Stern, J. (2000) ‘REGUALTION INITIATIVE WORKING PAPER SERIES NUMBER 41
ELECTRICITY AND TELECOMMUNICATIONS REAGULATION IN SMALL AND
DEVELOPING COUNTRIES’.
Stern, J. (2010) ‘The Evaluation of Regulatory Agencies’, The Oxford Handbook of
Regulation, 16(16), pp. 1–31. doi: 10.1093/oxfordhb/9780199560219.003.0011.
Stern, J. and Holder, S. (1999a) ‘Regulatory Goverance: Critieria for Assessing the
Performance of Regulatory Systems. An Application to Infrastructure in the Developing
Countries of Asia’, Utilities Policy, 8, pp. 33–50.
Stern, J. and Holder, S. (1999b) ‘Regulatory Goverance: Critieria for Assessing the
Performance of Regulatory Systems. An Application to Infrastructure in the Developing
Countries of Asia’, Utilities Policy, 8(February), pp. 33–50.
Tabachnick, B. G. and Fidell, L. S. (2007) Using multivariate statistics, Pearson. doi:
10.1037/022267.
Tavakol, M. and Dennick, R. (2011) ‘Making sense of Cronbach’s alpha’, International
Journal of Medical Education, 2, pp. 53–55. doi: 10.5116/ijme.4dfb.8dfd.
Thomas, S. (2016) ‘A perspective on the rise and fall of the energy regulator in Britain’,
Utilities Policy. Elsevier Ltd, 39, pp. 41–49. doi: 10.1016/j.jup.2016.02.004.
Trillas, F. and Montoya, M. A. (2013) ‘Independent regulators: theory, evidence and reform
proposals’, Info, 15(3), pp. 39–53. doi: 10.1108/14636691311327115.
Tsaplin, V. (2001) An Evaluation of the Efficiency of Energy Regulation in Ukraine. Thesis
submitted for Master of Arts in Economics.
Zeb, A., Haider, A. and Shaheen, F. (2015) ‘Improving Energy Regulatory Framework of
Pakistan’, 5(4).
Zhang, Y. and Thomas, M. (2009) ‘REGULATORY REFORM AND GOVERNANCE : A
SURVEY OF SELECTED DEVELOPING AND TRANSITION ECONOMIES’, 339(July),
pp. 330–339. doi: 10.1002/pad.

Zhang, Y.-F., Parker, D. and Kirkpatric, C. (2008) ‘Electricity sector reform in developing
countries: an econometric assessment of the effects of privatisation, competition and
regulation’, Journal of Regulatory Economics, 33(2), pp. 159–178. doi: 10.1007/s11149-007-
9039-7.