effectiveness of polyethylene helical strakes in ... · pdf fileinstallation rafik boubenider,...
TRANSCRIPT

OTC 19289
Effectiveness of Polyethylene Helical Strakes in Suppressing VIV Responses After Sustaining High Roller Load Deformation During S-lay Installation Rafik Boubenider, Ph.D., P.E.,Stress Engineering Services, Inc.; Kaya Alptunaer,Eni Petroleum; Paul Fourchy,Murphy Exploration & Production; Jaap J. de Wilde,Marin
Copyright 2008, Offshore Technology Conference This paper was prepared for presentation at the 2008 Offshore Technology Conference held in Houston, Texas, U.S.A., 5–8 May 2008. This paper was selected for presentation by an OTC program committee following review of information contained in an abstract submitted by the author(s). Contents of the paper have not been reviewed by the Offshore Technology Conference and are subject to correction by the author(s). The material does not necessarily reflect any position of the Offshore Technology Conference, its officers, or members. Electronic reproduction, distribution, or storage of any part of this paper without the written consent of the Offshore Technology Conference is prohibited. Permission to reproduce in print is restricted to an abstract of not more than 300 words; illustrations may not be copied. The abstract must contain conspicuous acknowledgment of OTC copyright.
Abstract Helical strakes are an important Vortex Induced Vibration (VIV) suppression device for Steel Catenary Risers (SCR’s). This paper presents the results of two sets of hydrodynamic tests performed at MARIN, on a 12” pipe fitted with 16D Helical Polyethylene strakes. The first set of tests established the suppression efficiency of the strakes for the Intact Configuration (no deformation). The second set of tests established the performance of the same strakes after undergoing a roller test in which the fins and the body of the strakes have sustained permanent deformations due to a simulated high contact load on the roller of a stinger during an S-lay installation. The type of permanent deformations sustained by the strakes can be described as bulging of the strake body, and permanent folding of the fins. Both configurations of the strakes (Intact and Deformed) were tested at high and low Reynolds numbers (velocities of 2.5 m/s and 0.5 m/s) and at different reduced velocities Vr. The results show that for the Deformed strakes configuration, there was no appreciable decrease in the VIV suppression efficiency of the strakes from a design consideration. The test results indicated that both Intact and Deformed strakes were at least 90% efficient in suppressing VIV. Therefore, based on the tests reported in this paper, the polyethylene strakes were deemed acceptable to use on the SCR’s even when using the S-Lay installation method. INTRODUCTION
As the world energy demand drives Oil companies to seek and to produce oil from offshore fields located in ever deeper water depths, the loads resulting on the Steel Catenary Risers (SCR’s) become ever larger. In this particular case, concerns have been raised by the Thunder Hawk Integrated Project Team (THIPT) with respect to the structural integrity of the VIV suppression device, in this case Helical Strakes, as far as the relatively high contact load on the SCR’s/Strakes during an S-lay installation. Thunder Hawk is a deep water offshore subsea development field with a Semi Submersible as a dedicated Floating Production Unit (FPU) in 6,060 ft of water depth. The S-lay installation contractor estimated that the maximum contact load on the SCR’s/Strakes is 110 kips per roller box as the SCR goes over the stinger. Two types of helical strakes material had been considered for the Thunder Hawk SCR’s. The first strake type considered was the Polyurethene strakes which had been previously used on other deep water projects. The Polyurethene strakes are specifically designed for high installation roller loads. They are well suited for deep water S-lay installation methods, since they are designed to sustain little damage and deformations of their fins and sheath as they go over the many roller boxes along the stinger. The second strake type considered was the Polyethylene strakes. Polyethylene strakes have been previously known to perform poorly in terms of their structural integrity when subjected to relatively high contact loads during an S-lay installation. Historically, polyethylene strakes sustained considerable damage as they went over the stinger in deep waters such as, tearing of the fins, deep gouges in the sheath, severe bulging of the sheath, etc. These severe damages raised concerns and doubts as to their long term performance in suppressing Vortex Induced Vibrations (VIV); however, to the authors’ knowledge, the deformed strakes configurations had never been previously subjected to a set of hydrodynamic tests to establish their VIV suppression performance. A strake manufacturer proposed a new Polyethylene strake design for the Thunder Hawk SCR’s that was

2 OTC 19289
specifically formulated to have a superior structural response to the expected high contact load, compared to the regular Polyethylene strake designs. The cost differential between the proposed Polyethylene strakes versus the Polyurethene strakes was large enough that it warranted consideration from the Thunder Hawk Integrated Project Team (THIPT). THIPT came up with a set of requirements for the proposed Polyethylene strakes design. These requirements consisted in the Polyethylene strakes being able to sustain some acceptable damage of the strakes, such as some permanent bending and folding of the fins, however no tearing and no gouges were allowed, with minimal bulging, but most importantly, the Polyethylene strakes would have to be proven that they do have an acceptable level of VIV suppression efficiency after going through the rollers under the maximum expected contact load. Consequently, THIPT designed two sets of tests to establish the suitability of the proposed Polyethylene Strakes. The first test was a mechanical test, ”Roller test”, which simulated the action of the rollers on the Polyethylene strakes. The second test was a hydrodynamic test which was designed to measure the VIV suppression efficiency of the Polyethylene strakes as well as some hydrodynamic coefficients, such as drag, lift, and added mass coefficients. This paper will concentrate on estimating the VIV suppression efficiency factor by reviewing the lift coefficients of the strakes.
DESCRIPTION OF THE POLYETHYLENE STRAKES The Polyethylene strakes chosen for the Thunder Hawk SCR’s have a 16 x D pitch and 0.214 x D fin height, where D is the outer diameter of the pipe including the strake’s sheath thickness. The strakes used for the roller test and hydrodynamic tests were made from an existing 12-Inch VIV strake design. The configuration of strakes and straps had been modified to simulate the final design as close as possible. MECHANICAL ROLLER TEST The S-lay installation of the SCR’s over a stinger will involve thirteen (13) roller boxes. Each roller box contains a set of four (4) V-rollers as shown in Figure-1-. The mechanical “Roller test” of the Polyethylene strakes was performed to simulate the effects of the rollers on a stinger during the installation of the SCR’s.
Figure-1- Roller Box Configuration The V-roller in the test frame had a 120o V-configuration similar to the one on the actual stinger as shown in Figure-1-. The maximum expected contact load for the 12” Export SCR’s over one roller box is 110 kips. This contact load corresponds to the S-lay installation of the 12” Export SCR’s void of any fluids, in a water depth of 6,060 ft, with a dynamic amplification factor equal to 1.3 to account for the additional dynamic loads resulting from the combined effects of the dynamic

OTC 19289 3
heave/pitch/roll motions of the lay vessel. The contact load was assumed not to be uniformly distributed over the four V-rollers for two main reasons. The first reason for the non uniform distribution of the contact load over the V-rollers is the pipe’s curvature over the length of the roller box (11.74 ft), and the second reason is the misalignment of the V-rollers inside the roller box. Since the contact load was assumed not to be uniform over all four V-rollers, then a reasonable assumption was made as far as the maximum contact load per V-roller. It was assumed that the contact load per V-roller is one third the contact load over the whole box, resulting in a test load per V-roller of 37 kips.
kipsPPtest 67.363110
3max === ……………………………….. (1)
The 12” sample steel pipe used for the Roller test was long enough to accommodate one full pitch of the strakes (16D, L=17 ft). The testing of a full pitch length of the strakes was important since a hydrodynamic test was scheduled after the Roller test. The Roller test consisted in twenty five passes with the maximum test load of 37 kips under the rollers in the roller frame. The test was set to include the following passes:
1. Fifteen forwad passes under maximum test load. 2. Five reverse passes under the maximum test load. 3. Five additional forward passes under the maximum test load.
The forward passes were intended to simulate the effects of the SCR’s moving off the lay vessel, and the backwards were supposed to simulate the retrieval of the SCR’s joints, should weld cutouts be warranted.
Figure-2- Test sample fitted with the Polyethylene strakes prior to Roller test.
Figure-2- above shows the test sample fitted with the Polyethylene strakes prior to starting the Roller test program. The test program is started with fifteen forward passes under the V-rollers. Figures 3 and 4 below show the test sample after undergoing fifteen forward passes, five backward passes and five additional forward passes prepared for the forced VIV hydrodynamic tests. Figure 3 shows the overall sample that was tested in the roller test program, and Figure 4 shows the typical strake fin deformations resulting from that test. From these two figures, one can observe that there appears to be some permanent bending out of plane of the helix on the top side of the pipe, where the fins came in contact with the rollers, however, the fins have bounced back to about seventy percent of their original height and are not completely flattened against the pipe’s O.D. There also appears to be some permanent crinkling of the fins at the top of the pipe, but there does not appear to be gross change in fin geometry. There is no apparent tearing at the root of the fins, and there is some bulging observed between the circumferential seams. Furthermore, a few longitudinal connections between the different segments of the strakes came partially undone, and some permanent local deformation of the steel and Inconel straps is observed, however, the overall shape of the helices is maintained.

4 OTC 19289
Figure-3- Test sample from full roller test readied for hydrodynamic testing.
Figure-4- Typical deformed strake fins after full roller test readied for hydrodynamic testing.

OTC 19289 5
CONCLUSIONS AND RECOMMENDATIONS FROM THE ROLLER TEST The mechanical “Roller test” of the Polyethylene strakes shed light on the following six observations and resulted in one recommendation. It should be noted that the improvements of the strake design based on the recommendation from the roller test results have been incorporated in the final design of the Thunder Hawk strakes and that they will be tested through a similar roller test program as well.
The observations are:
-1. No tearing of the Polyethylene material was observed during the roller load test. -2. Some permanent crinkling of the strake fins was observed. -3. Some residual bending of the fins out of the plane of the helices was observed. -4. The fins with the residual bending retained a good percentage of their height. -5. Only a few fins were permanently bent out of the plane of the helix. The overall shape of the helices was
conserved. -6. Some bulging between the bands was observed.
The recommendation was:
-1. For the pin/spigot seam connection, it was observed that it is possible that the seam connection comes undone from underneath the straps. An improved longitudinal seam connection of the strakes was designed for the final product.

6 OTC 19289
HYDRODYNAMIC TESTING Two-dimensional hydrodynamic model tests were carried out to measure the VIV suppression efficiency of the strakes for the intact configuration (no damage) and for the same strakes after undergoing a roller test in which the strakes would have sustained permanent deformation due to simulated high contact loads (deformed case).
DESCRIPTION OF TEST SET-UP The experiments were conducted with the High Reynolds VIV test set-up in MARIN’s 689 × 13 × 13 ft (l × b × h) High Speed towing tank. The tank is equipped with an overhead carriage, capable of a maximum tow speed of 49 ft/s without the test pipe. The 44 kips tonne weight of the carriage provides a solid base for the VIV test apparatus. The 165 kW electric engine of the carriage can deliver a maximum tow force of approximately 2.25 kips at a tow speed of 13 ft/s. The test pipe is suspended from the carriage on two streamlined vertical struts, as depicted in Figure 5. The test pipe is submerged by approximatey 5.6 ft. The carriage can run in forward and backward direction, allowing efficient testing of opposing flow angles. The flow conditions can be considered as uniform and with a low turbulence for both towing directions.
Figure-5- High Reynolds VIV test set-up in High speed towing tank.
The set-up consists of: 1. Vertical struts (2x). 2. Linear bearings (2x). 3. The test pipe. 4. Large circular end plates (2x). 5. Vertical drive shafts (2x). 6. Crank wheels (2x) and gearing. 7. 30 kW electric motor.
The High Reynolds set-up was originally developed in 2001 for the VIVARRAY JIP. A 200 mm smooth cylinder, a 200 mm rough cylinder and a 200 mm straked cylinder were tested in this JIP. In the VIVARRAY JIP, the cylinder was supported by

OTC 19289 7
means of two 2.5 m long horizontal spring blades. In 2004 the 2.5 m long spring blades were replaced by linear bearings [4], [5] and [6].
TESTED PIPE CONFIGURATIONS Three pipe configurations were tested: A 324 mm benchmark pipe with 100 micron Carborundum roughness to mimic the surface roughness of a real SCR The intact configuration of the Polyethylene 16D helical strake (no deformation) The same strakes after undergoing a roller test in which the strakes would have sustained permanent deformation due to
simulated high contact loads (deformed cases).
Figure -6- OD 324 mm bare pipe with 100 micron Carborundum roughness
Figure -7- Intact configuration of the Polyethylene 16D helical strake (no damage)
TYPES OF TESTS Three different types of tests were carried out:
Test type 1: Vertical oscillation in still water (KC and Sarpkaya Beta test) Test type 2: Non oscillating tow test (Drag test) Test type 3: Vertical oscillation while towing (VIV test)

8 OTC 19289
Figure -8- Types of test with the hydrodynamic test set-up
FORCED VIV HYDRODYNAMIC TESTING Test Scope
The VIV testing program was conducted with three sets of pipe samples. The VIV test matrix considered the following cases:
1. Bare pipe test.
i. Non oscillating tow test: 1.64, 3.28, 4.92, 6.56, 8.2 ft/s (Drag Test) ii. Vertical oscillation while towing test. (VIV Test)
2. Intact Strakes test. i. Vertical oscillations in still water. (KC Test)
ii. Non oscillating tow test: 3.28, 4.92, 6.56, 8.2 ft/s (Drag Test) iii. Vertical oscillation while towing test. (VIV Test)
3. Deformed Strakes test. i. Vertical oscillations in still water. (KC Test)
ii. Non oscillating tow test: 3.28, 4.92, 6.56, 8.2 ft/s (Drag Test) iii. Vertical oscillation while towing test. (VIV Test)
The purpose of these forced VIV tests was to estimate the lift, drag and added mass coefficients of the bare and straked
pipes for different reduced velocities (Vr) and amplitude ratios (A/D). Non-Oscillatory Tow Test
The inline drag coefficient is calculated with the following equation:
…….…………………………….. (2)
Where:
⎪⎪⎪⎪
⎩
⎪⎪⎪⎪
⎨
⎧
velocityTowhorizontalVpipetheofLengthL
pipetheofdiameterouterDwaterofmassspecific
forceinlinemeanhorizontalFtcoefficiendraginlinetheisC
x
d
::::::
ρ
It should be noted that the outer diameter (D) considered for the straked pipe included the thickness of the strake’s sheath. The inline drag coefficient for the bare, intact strakes and deformed strakes pipes are shown in Figures 9, 10, and 11 for the non-oscillatory tow tests as a function of Reynolds number. Because the width of the High Reynolds tow tank limited the length of the test sample, the strake length tested did not have a full pitch of the helices for the sample pipe diameter; consequently, the test matrix was performed for both the forward and backward passes. It can be seen from the results that
Test type 1 Vertical oscillation
Test type 2Horizontal tow
Test type 3 Vertical oscillation, Horizontal tow
25.0 VLDFC x
d ρ=

OTC 19289 9
the forward and backward passes yielded essentially similar measured quantities. It can be observed from Figure 9 (bare pipe) that the inline drag coefficient exhibits a drop, Cd = 0.46, for Reynolds number around 300,000 with a Cd of 1.05 in the Sub-critical region (Re < 100,000), and a Cd value of 0.66 in the Super-critical region (Re < 700,000). This inline drag coefficient distribution is typical for bare pipe with slight surface roughness (100 micron surface roughness) [1].
Drag Coefficient for the 12" 100 micron roughness bare pipe
0
0.2
0.4
0.6
0.8
1
1.2
0 100000 200000 300000 400000 500000 600000 700000 800000
Re
Mea
n D
rag
Coe
ffici
ent C
d (N
o os
cilla
tions
)
Cd_ForwardAverage CdCd_Backward
Figure-9-: Drag Coefficient vs. Reynolds number for bare pipe Non-oscillating Tow test
Average Drag Coefficients for the Thunder Hawk 12" Intact Strakes pipeAverage Cd = 1.66
0
0.2
0.4
0.6
0.8
1
1.2
1.4
1.6
1.8
0 100000 200000 300000 400000 500000 600000 700000 800000 900000
Re
Mea
n D
rag
Coe
ffici
ent C
d (N
o os
cilla
tions
)
Cd_ForwardAverage CdCd_Backward
Figure-10-: Drag Coefficient vs. Reynolds number for Intact Strakes Non-oscillating Tow test
10 OTC 19289
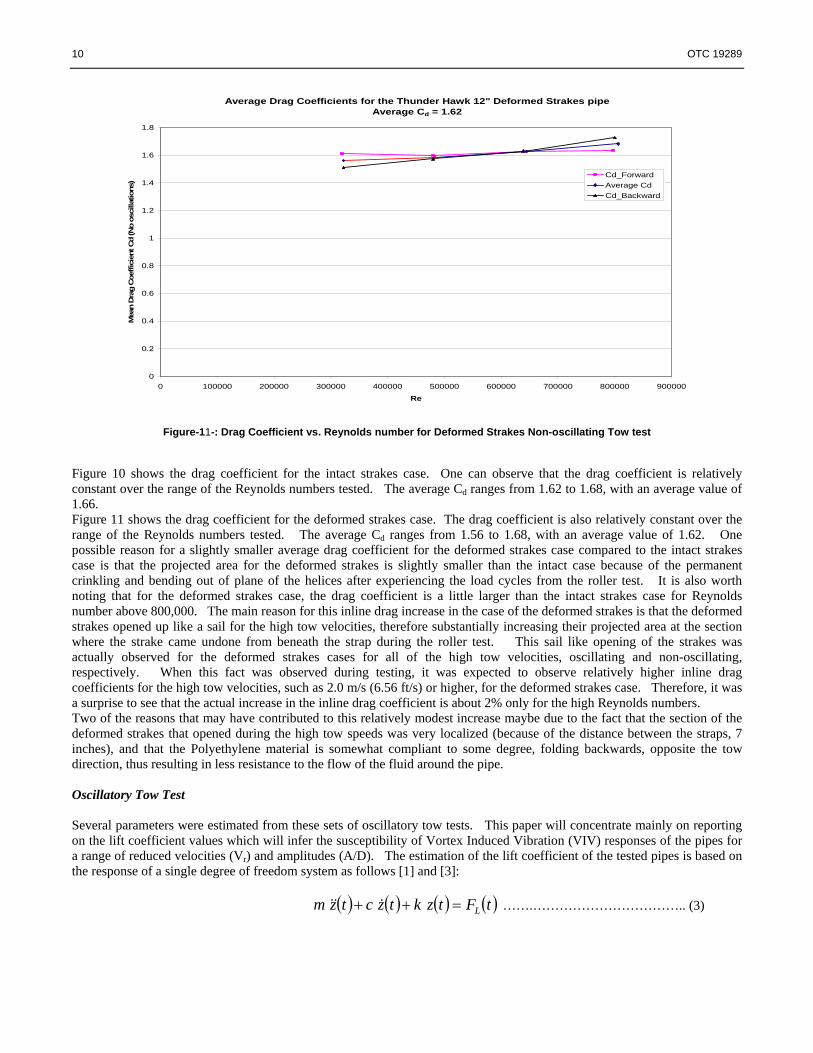
Average Drag Coefficients for the Thunder Hawk 12" Deformed Strakes pipeAverage Cd = 1.62
0
0.2
0.4
0.6
0.8
1
1.2
1.4
1.6
1.8
0 100000 200000 300000 400000 500000 600000 700000 800000 900000
Re
Mea
n D
rag
Coe
ffici
ent C
d (N
o os
cilla
tions
)
Cd_ForwardAverage CdCd_Backward
Figure-11-: Drag Coefficient vs. Reynolds number for Deformed Strakes Non-oscillating Tow test
Figure 10 shows the drag coefficient for the intact strakes case. One can observe that the drag coefficient is relatively constant over the range of the Reynolds numbers tested. The average Cd ranges from 1.62 to 1.68, with an average value of 1.66. Figure 11 shows the drag coefficient for the deformed strakes case. The drag coefficient is also relatively constant over the range of the Reynolds numbers tested. The average Cd ranges from 1.56 to 1.68, with an average value of 1.62. One possible reason for a slightly smaller average drag coefficient for the deformed strakes case compared to the intact strakes case is that the projected area for the deformed strakes is slightly smaller than the intact case because of the permanent crinkling and bending out of plane of the helices after experiencing the load cycles from the roller test. It is also worth noting that for the deformed strakes case, the drag coefficient is a little larger than the intact strakes case for Reynolds number above 800,000. The main reason for this inline drag increase in the case of the deformed strakes is that the deformed strakes opened up like a sail for the high tow velocities, therefore substantially increasing their projected area at the section where the strake came undone from beneath the strap during the roller test. This sail like opening of the strakes was actually observed for the deformed strakes cases for all of the high tow velocities, oscillating and non-oscillating, respectively. When this fact was observed during testing, it was expected to observe relatively higher inline drag coefficients for the high tow velocities, such as 2.0 m/s (6.56 ft/s) or higher, for the deformed strakes case. Therefore, it was a surprise to see that the actual increase in the inline drag coefficient is about 2% only for the high Reynolds numbers. Two of the reasons that may have contributed to this relatively modest increase maybe due to the fact that the section of the deformed strakes that opened during the high tow speeds was very localized (because of the distance between the straps, 7 inches), and that the Polyethylene material is somewhat compliant to some degree, folding backwards, opposite the tow direction, thus resulting in less resistance to the flow of the fluid around the pipe. Oscillatory Tow Test
Several parameters were estimated from these sets of oscillatory tow tests. This paper will concentrate mainly on reporting on the lift coefficient values which will infer the susceptibility of Vortex Induced Vibration (VIV) responses of the pipes for a range of reduced velocities (Vr) and amplitudes (A/D). The estimation of the lift coefficient of the tested pipes is based on the response of a single degree of freedom system as follows [1] and [3]:
( ) ( ) ( ) ( )tFtzktzctzm L=++ &&& …….…………………………….. (3)

OTC 19289 11
Where:
⎪⎪⎪
⎩
⎪⎪⎪
⎨
⎧
pipetheofntdisplacemeVerticalzfunctionForcingF
systemtheofstiffnesskdampingstructuralc
pipetheofmassstructuralm
L
:::::
Here ( )tz& and ( )tz&& represent the vertical velocity and acceleration of the pipe, respectively. The test cylinder is subjected to a harmonic oscillation of known amplitude and frequency (displacement and frequency controlled):
( ) ( )tztz oo ×= ωsin …….………………………………........... (4)
Where: ⎩⎨⎧
noscillatioforcedtheoffrequencyCircularnoscillatioforcedtheofAmplitudez
o
o
::
ω
Where zo and ωo are the amplitude and frequency of the applied sinusoidal motion of the cylinder, respectively. The resulting forcing function is assumed to be harmonic and at to occur at the same frequency as the forced motion.
( ) ( )θω +×= tFtF oLL sin …….………………………...….. (5)
Where: ⎩⎨⎧
anglePhaseforcetheofAmplitudeFL
::
θ
By expanding the expression in equation 5, one obtains:
( ) ( ) ( ) ( ) ( )θωθω sincoscossin tFtFtF oLoLL ×+×= ………..... (6)
The velocity, acceleration of the test cylinder can be calculated with the following equations:
( ) ( )tztz ooo ×= ωω cos& …….……………………………..…….... (7)
( ) ( )tztz ooo ×−= ωω sin2&& …….……………………..……….......... (8) Substituting the velocity and acceleration, equations 7 and 8, and equation 6 in the SDOF motion equation 3, and grouping similar terms, leads to the following equation:
( ) ( ) ( ) ( ) ( ) ( ) ( )tFtFtzctzmk oLoLoooooo ×+×=×+×− ωθωθωωωω cossinsincoscossin2 .... (9)
From equation 9 above, it is possible to identify which part of the forcing function is in phase with the velocity and which part is in phase with the acceleration for the cylinder, leading to the expression for the lift coefficient. The first term on the right handside of equation 9 is in phase with the acceleration of the forced displacement (equation 8), and the second term of equation 9 is in phase with the velocity of the forced displacement (equation 7). The lift coefficient in phase with the velocity is calculated using the following equations:
( )θρ sin21 2
Llv FVLCD = ………………………..……... (10)
Resulting in the expression for the Lift Coefficient:
( )25.0
sinVLD
FC Llv ρ
θ= ………………………..……... (11)
Where θ is the phase angle between the measured lift force and the applied vertical dynamic motion. It is important to note that the measured quantities in the hydrodynamic tests are the amplitude of the lift force, FL, and its phase angle θ.

12 OTC 19289
Furthermore, it is also worth noting at this point that a positive lift coefficient Clv indicates that a Vortex Induced Vibration (VIV) response would be possible to occur, and a negative value of Clv indicates that VIV would not likely occur. The term in phase with the acceleration in equation 9 can be used to estimate the added mass of the oscillating pipe in the fluid.
( ) ( ) ( )tFtFtF lvIL += ………………………..……... (12)
Where ( )tFI and ( )tFlv represent the Inertia and the Lift terms of the lift force.
If one assumes that the inertia part of the force ( )tFL can be expressed in terms of the Foud-Krylov equation, i.e.:
( ) ( ) ( )( )4
2DtzCtaCtF fafMIπρ&&−= ...…..……... (13)
Where:
( )
( )⎪⎪⎩
⎪⎪⎨
⎧
−= 1::::
Ma
M
f
f
CtcoefficienmassAddedCtCoefficienInertiaC
fluidtheofmassSpecificonacceleratifluidta
ρ
Since in the test program, the water is still and not oscillating, then:
( ) 0=ta f ...…..……... (14)
Leading to the following equation:
( ) ( )4
2DtzCtF faIπρ&&−= ...…..……... (15)
Subsituting equation 8 into equation 15, one obtains:
( ) ( )4
sin2
2 DtzCtF foooaIπρωω ×+= ...…..……... (16)
Identifying, then, the part of the forcing function that is in phase with the acceleration in equation 9, one deducts that:
( )4
cos2
2 DzCF fooaLπρωθ += ...…..……... (17)
Leading to the expression for the Added Mass Coefficient:
( )
4
cos2
2 Dz
FCfoo
La πρω
θ= ...…..……... (18)
Figure 12 shows the measured lift coefficient in phase with the velocity as a function of the reduced velocity Vr for the 12”, 100 micron surface roughness, bare pipe. The reduced velocity Vr is defined as follows:

OTC 19289 13
DU
DfUV
or ω
π2== ...…..……... (19)
Where: U is the towing velocity.
Lift force coefficient in-phase with velocity for 12" 100 micron roughness bare pipe
-0.8
-0.6
-0.4
-0.2
0
0.2
0.4
0.6
0.8
1
1.2
1.4
0 2 4 6 8 10 12 14
Reduced Velocity, Vr
Lift
Coe
ffici
ent,
Clv
A/D=0.093,Re= 87568AD=0.494,Re= 87568A/D=0.093,Re=291892A/D=0.494,Re=291892Re= 87568Re=291892
Figure-12-: Lift Coefficient vs. reduced velocity for the 12” bare pipe.
One can observe that as expected, the peak lift coefficients occur for a reduced velocity Vr equal to six (6). This implies that, as expected, Vortex Induced Vibrations lockin occurs at a reduced velocity of six (6) for a bare pipe, which corresponds to a Strouhal number St= 0.167. This result confirms previously published results in the literature [4] for bare pipes, where it has been shown that VIV lockin for bare pipes occur for a Strouhal number ranging from 0.16 to 0.2.
Lift coefficient in phase with the velocity for the Intact Strakes
-1.6
-1.4
-1.2
-1
-0.8
-0.6
-0.4
-0.2
00 2 4 6 8 10 12 14 16 18 20
Reduced velocity, Vr
Clv A/D =0.098, Re=806306, forward
A/D =0.293, Re=806306, forwardA/D =0.098, Re=806306, backwardA/D =0.293, Re=806306, backwardA/D =0.098, Re=161261, forward
Figure-13-: Lift Coefficient vs. reduced velocity for the 12” Intact Strakes Figure 13 shows the lift coefficient for the intact strakes case. One can see that none of the lift coefficient values are positive and that all them are negative for the reduced velocity range tested and for the two amplitude ratios tested, namely A/D of 0.1
14 OTC 19289
and 0.3. These results imply that the intact strakes would successfully suppress VIV for all the A/D ratios, reduced velocities Vr, and Reynolds numbers ranges tested.
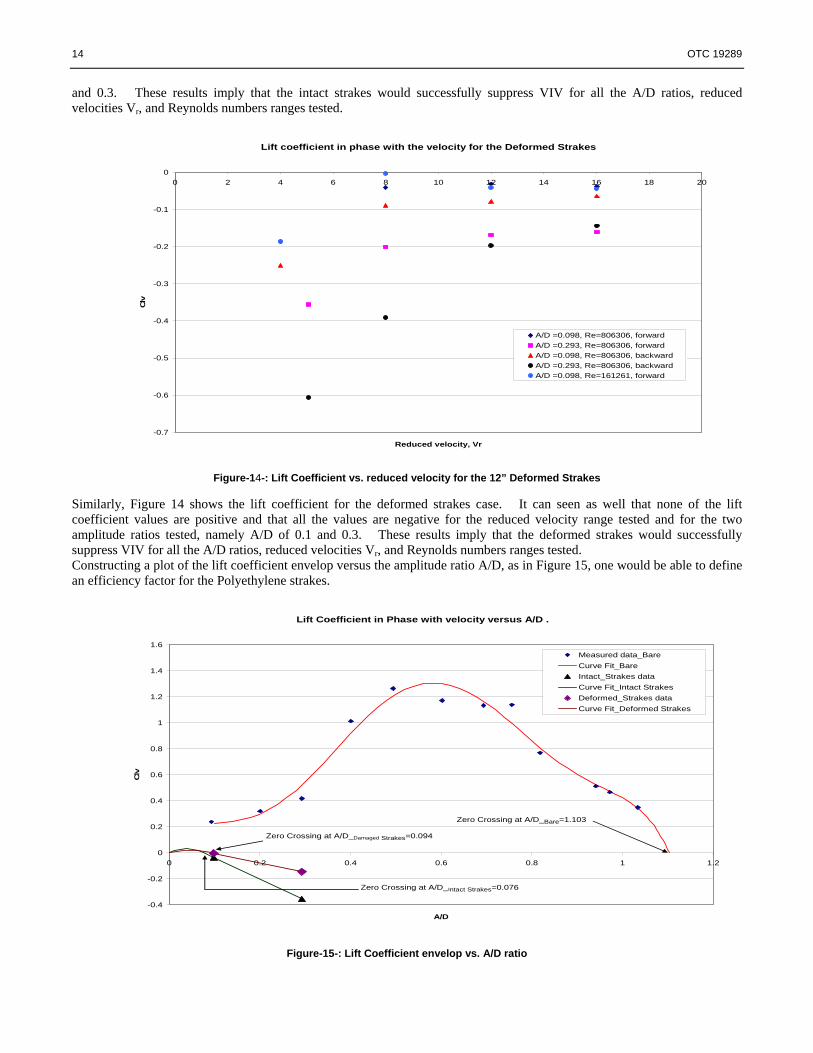
Lift coefficient in phase with the velocity for the Deformed Strakes
-0.7
-0.6
-0.5
-0.4
-0.3
-0.2
-0.1
00 2 4 6 8 10 12 14 16 18 20
Reduced velocity, Vr
Clv
A/D =0.098, Re=806306, forwardA/D =0.293, Re=806306, forwardA/D =0.098, Re=806306, backwardA/D =0.293, Re=806306, backwardA/D =0.098, Re=161261, forward
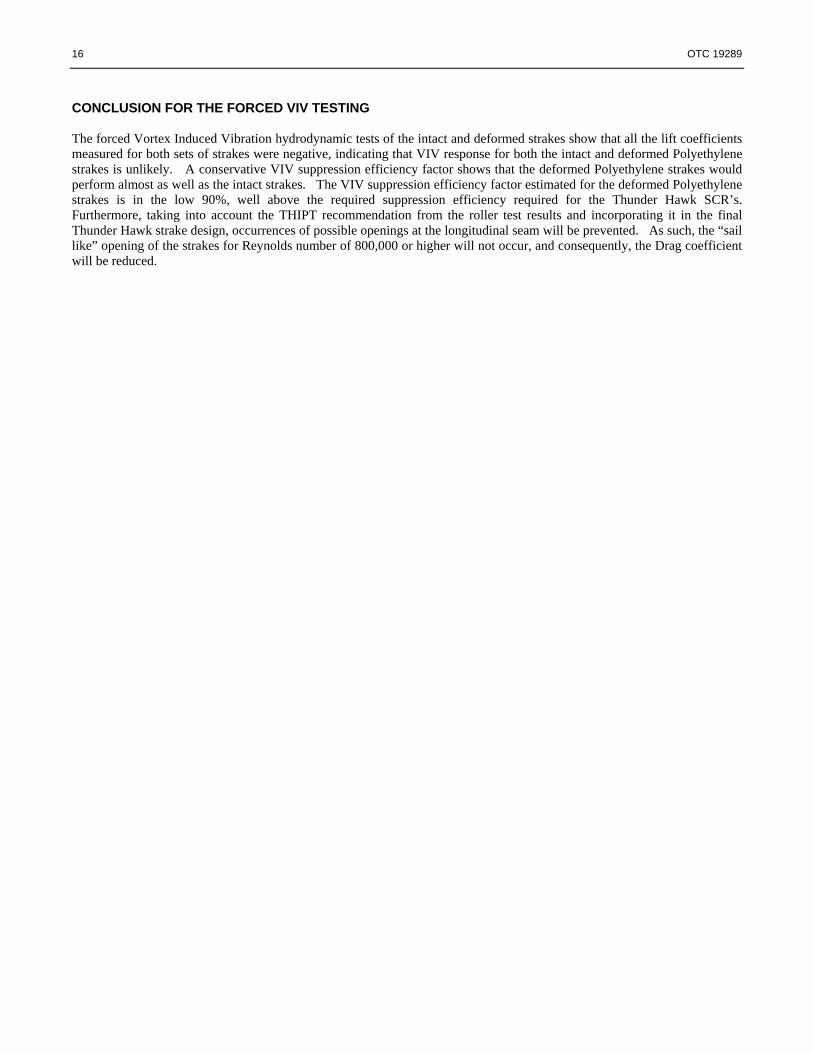
Figure-14-: Lift Coefficient vs. reduced velocity for the 12” Deformed Strakes Similarly, Figure 14 shows the lift coefficient for the deformed strakes case. It can seen as well that none of the lift coefficient values are positive and that all the values are negative for the reduced velocity range tested and for the two amplitude ratios tested, namely A/D of 0.1 and 0.3. These results imply that the deformed strakes would successfully suppress VIV for all the A/D ratios, reduced velocities Vr, and Reynolds numbers ranges tested. Constructing a plot of the lift coefficient envelop versus the amplitude ratio A/D, as in Figure 15, one would be able to define an efficiency factor for the Polyethylene strakes.
Lift Coefficient in Phase with velocity versus A/D .
-0.4
-0.2
0
0.2
0.4
0.6
0.8
1
1.2
1.4
1.6
0 0.2 0.4 0.6 0.8 1 1.2
A/D
Clv
Measured data_BareCurve Fit_BareIntact_Strakes dataCurve Fit_Intact StrakesDeformed_Strakes dataCurve Fit_Deformed Strakes
Zero Crossing at A/D_Bare=1.103
Zero Crossing at A/D_Intact Strakes=0.076
Zero Crossing at A/D_Damaged Strakes=0.094
Figure-15-: Lift Coefficient envelop vs. A/D ratio

OTC 19289 15
Figure 16 is a blow up of figure 15 for the small A/D ratio range, showing the expected lift coefficient envelop for the intact and deformed strakes.
Lift Coefficient in Phase with velocity for Intact and Deformed Strakes
-0.4
-0.35
-0.3
-0.25
-0.2
-0.15
-0.1
-0.05
0
0.05
0.1
0 0.05 0.1 0.15 0.2 0.25 0.3 0.35
A/D
Clv
Intact_Strakes data
Curve Fit_Intact Strakes
Deformed_Strakes data
Curve Fit_Deformed Strakes
Zero Crossing at A/D_Damaged Strakes=0.094
Zero Crossing at A/D_Intact Strakes=0.076
Figure-16-: Zoom of the Lift Coefficient envelop vs. A/D ratio
One should note that the parabolic fit of the lift coefficient envelop does not have actual measured data. The only actual measured data in figures 15 and 16 for the intact and deformed strakes are the two data points definining the straight line portions of the curves; i.e., the blue triangle and square legend points. A Vortex Induced Vibration suppression efficiency factor is a factor that would give a measure of the efficiency of the strakes in reducing the VIV response of the pipe. This VIV suppression efficiency factor would have to be measured against the VIV response of the bare pipe. Therefore, a proposed VIV suppression efficiency factor expression as follows:
( ) ( )( ) %100_
max_
max_max_ ×−
=Bare
StrakesBare
DA
DA
DA
RatioEfficency …..……... (20)
In this study, the maximum expected (A/D) ratio, which corresponds to a zero lift coefficient, for the bare pipe is 1.103, as indicated in figure 15. Similarly, the expected (A/D) ratios that correspond to a zero lift coefficient for the intact and deformed strakes are 0.076 and 0.094, respectively, as seen in figure 16. Therefore, these yield the following VIV suppression efficiency factors:
Intact Strakes: 93.1%. Deformed Strakes: 91.5%.
16 OTC 19289
CONCLUSION FOR THE FORCED VIV TESTING The forced Vortex Induced Vibration hydrodynamic tests of the intact and deformed strakes show that all the lift coefficients measured for both sets of strakes were negative, indicating that VIV response for both the intact and deformed Polyethylene strakes is unlikely. A conservative VIV suppression efficiency factor shows that the deformed Polyethylene strakes would perform almost as well as the intact strakes. The VIV suppression efficiency factor estimated for the deformed Polyethylene strakes is in the low 90%, well above the required suppression efficiency required for the Thunder Hawk SCR’s. Furthermore, taking into account the THIPT recommendation from the roller test results and incorporating it in the final Thunder Hawk strake design, occurrences of possible openings at the longitudinal seam will be prevented. As such, the “sail like” opening of the strakes for Reynolds number of 800,000 or higher will not occur, and consequently, the Drag coefficient will be reduced.
OTC 19289 17
REFERENCES [1] Blevins, R.D., Flow Induced Vibrations, Krieger publishing company, Malabar Florida, Second edition, 2001. [2] Bridge, C. et al; Development of SHEAR7 lift curves for VIV analysis and application to single pipe and bundle
risers, OTC 17533, 2005. [3] Gopalkrishnan, R.; Vortex-induced Forces on Oscillating Bluff Cylinders, D.Sc. thesis, Department of Ocean
Engineering, MIT, USA, 1993. [4] Wilde, J.J. de et al; Cross Section VIV Model Tests for Novel Riser Geometries, DOT 2004 conference, New
Orleans. [5] Wilde, J.J. & Huijsmans, R.H.M., Experiments for High Reynolds Numbers VIV on Risers, ISOPE, Paper 2001-
JSC-285, 2001. [6] Wilde, J.J., Huijsmans, R.H.M. & Triantafyllou, M.S., Experimental Investigation of the Sensitivity to In-line
Motions and Magnus-like Lift Production on Vortex-Induced Vibrations, ISOPE, Paper 2003-JSC-270, 2003.