effective screening of chemical penetration enhancers
TRANSCRIPT
EFFECTIVE SCREENING OF CHEMICAL
PENETRATION ENHANCERS FOR TRANSDERMAL
DRUG DELIVERY
By
VIJAY KRISHNA RACHAKONDA
Bachelor of Technology in Chemical Engineering
Andhra University
Visakhapatnam, Andhra Pradesh, INDIA
2006
Submitted to the Faculty of the Graduate College of the
Oklahoma State University in partial fulfillment of
the requirements for the Degree of
MASTER OF SCIENCE July, 2008
ii
EFFECTIVE SCREENING OF CHEMICAL
PENETRATION ENHANCERS FOR TRANSDERMAL
DRUG DELIVERY
Thesis Approved:
Dr. S. V. Madihally
Thesis Adviser
Dr. R. L. Robinson Jr.
Dr. K. A. M. Gasem
Dr. H. Gappa-Fahlenkamp
Dr. A. Gordon Emslie
Dean of the Graduate College

iii
ACKNOWLEDGMENTS
I thank all the people who have supported me in several ways, since past two
years of my graduate study at Oklahoma State University. Firstly, I would like to express
my appreciation and sincere gratitude to my academic and thesis advisor, Dr. Sundar
Madihally, for his extreme patience and undeterred support. I would also like to
acknowledge, Dr. Khaled Gasem and Dr. Robert Robinson Jr. for their support, guidance
and for supervising my work. I am grateful to Dr. Heather Fahlenkamp for her
constructive and useful comments on my work and for her support as a thesis committee
member.
My sincere gratitude also goes to Dr. William Fasano of Haskell Laboratory for
Health and Environmental Sciences, The DuPont Company, USA for his valuable inputs
about the resistive properties of skin. I thank Dr. Edralin Lucas of Department of
Nutritional Sciences for help with access to histology equipment used in this work.
I would like to thank my group members on this project, Krishna Yerramsetty,
Sharath Golla, Dr. Brian Neely and Eric Whitebay for their help. The cooperation of the
chemical engineering staff is remarkable and unforgettable.
I am also grateful to my first mentor, Professor K. V. Rao for his encouragement,
guidance and support through out my academic and personal life.
Finally, I would like to express my deepest gratitude to my parents and Ms.
Kuheli Chakraborty for their continuous encouragement and support.
iv
TABLE OF CONTENTS
Chapter Page I. INTRODUCTION......................................................................................................1
1.1 Transdermal Drug Delivery (TDD) ...................................................................1 1.2 Chemical Penetration Enhancers (CPEs)...........................................................2 1.3 Scope of the study..............................................................................................3 1.4 Specific aims of the study..................................................................................4 1.5 Thesis organization ............................................................................................5 II. BACKGROUND.......................................................................................................7 2.1 Routes of drug administration............................................................................7 2.2 Structure of skin...............................................................................................10 2.2.1 Epidermis ................................................................................................10 2.2.2 Dermis.....................................................................................................13 2.2.3 Hypodermis.............................................................................................13 2.2.4 Stratum corneum.....................................................................................13 2.3 Different TDD techniques................................................................................15 2.4 Chemical penetration enhancers ......................................................................16 2.5 Skin selection ...................................................................................................17 2.6 Franz diffusion cell (FDC)...............................................................................18 2.7 Electric resistance of skin ................................................................................19 2.7.1 LCR meters .............................................................................................20 2.7.2 Factors effecting the electrical properties of skin ...................................21 2.7.3 Effect of skin exposure area on electrical resistance of skin ..................22 III. MULTI-WELL RESISTANCE CHAMBER ........................................................26 3.1 Introduction......................................................................................................26 3.2 Skin preparation ...............................................................................................26 3.3 Statistical analysis............................................................................................27 3.4 Different configurations of multi-well resistance chamber .............................28 3.4.1 Configuration 1 .......................................................................................28 3.4.2 Configuration 2 .......................................................................................30 3.4.3 Configuration 3 .......................................................................................32 3.4.4 Configuration 4 .......................................................................................37
v
Chapter Page
3.4.5 Configuration 5.......................................................................................... 44 IV. EVALUATION OF CHEMICAL PENETRATION ENAHNCERS..................... 48 4.1 Virtual design of CPEs...................................................................................... 48 4.2 Correlating the RFs with permeability coefficients .......................................... 57 4.2.1 Correlating the RFs with permeability coefficients of melatonin............ 57 4.2.2 Correlating the RFs with permeability coefficients of insulin................. 59 4.3 Histological studies........................................................................................... 60 V. DISCUSSION .......................................................................................................... 66 VI. CONCLUSIONS AND RECOMMENDATIONS................................................. 70 6.1 Conclusions....................................................................................................... 70 6.2 Recommendations............................................................................................. 71 5.1 Future experimental design strategy ........................................................... 71 5.2 Use of multiple CPEs.................................................................................. 72 REFERENCES ............................................................................................................. 74 APPENDIX................................................................................................................... 80

vi
LIST OF TABLES
Table Page 1. Commercially available drugs in the form of transdermal patches ........................1 2. Comparison of biophysical parameters of porcine skin in vitro and human skin in vivo ............................................................................................................18 3. Human skin resistance at different conditions ......................................................24 4. Electrical resistance of epidermal and whole skin membranes of various species measured at a frequency of 100 k Hz ..........................................25 5. Physio-chemical properties of CPEs in the validation set with the RF values .....46 6. CPEs used in the study..........................................................................................50 7. Physio-chemical properties of CPEs with the RF values......................................56 8. Normalized RFs of CPEs and KP values of melatonin in the presence of the respective CPE............................................................................................58 9. Histological evaluation of the CPEs .....................................................................61
vii
LIST OF FIGURES
Figure Page 1. Global sales of different drugs through transdermal patches..................................2 2. Various routes of drug administration through injections ......................................9 3 a). Structure of human skin....................................................................................11 3 b) Histological cross section of porcine abdominal skin .......................................11 4. Various layers of the epidermis ............................................................................12 5. Structure of the stratum corneum..........................................................................14 6. Franz diffusion cell ...............................................................................................19 7. Electrical equivalent of skin..................................................................................20 8. Instek LCR 821 high precision databridge ...........................................................21 9. Effect of in vitro cell exposure area on skin resistance ........................................23 10. Configuration 1 of the resistance chamber .........................................................28 11. Effect of AC frequency on the resistance of porcine skin and 0.5 % porous chitosan membrane .............................................................................................29 12. Change in resistance of porcine skin with time using Configuration 1 of the resistance chamber ..............................................................................................30 13. Configuration 2 of the resistance chamber .........................................................31 14. Electrode set up of Configuration 2 ....................................................................31 15. Change in resistance of porcine skin with time using Configuration 2 of multi-well resistance chamber ............................................................................32 16. Electrode set up of Configuration 3 ....................................................................33 17. Change in resistance of 4 % non porous chitosan membrane with time at different frequencies ...........................................................................................33 18. Comparison of resistance of 4 % non porous chitosan membrane from different experiments ..........................................................................................34 19. Comparison of the change in resistance profiles of Eontex fabrics from four wells of the resistance chamber...................................................................35 20. Resistance profile of porcine skin with Configuration 3 ....................................35 21. Normalized resistance of porcine skin with Configuration 3 .............................37 22. Electrode set up of Configuration 4 ....................................................................37 23. Schematic of the resistance chamber ..................................................................38 24. Normalized resistance of porcine skin with Configuration 4 .............................39 25. Validating the resistance chamber with Franz diffusion cell in the presence of nicotine ...........................................................................................................43 26. Effect of temperature on RF in the presence of decanol in comparison to Franz diffusion cell .......................................................................................................44 27. Schematic of the resistance chamber with constant temperature water bath......45

viii
Figure Page 28 a) Validating the resistance chamber to Franz diffusion cell in the presence of nonanol............................................................................................................46 28 b) Validating the resistance chamber to Franz diffusion cell in the presence of lauric acid........................................................................................................47 28 c) Validating the resistance chamber to Franz diffusion cell in the presence of oleic acid .........................................................................................................47 29. RFs of the CPEs from preliminary set ................................................................50 30. RFs of the CPEs from Generation 1 ...................................................................52 31. RFs of the CPEs from Generation 2 ...................................................................52 32. RFs of the CPEs from Generation 3, 4 and 5......................................................53 33 a) RFs of the CPEs from Library search set ........................................................55 33 b) RFs of the CPEs from Library search set and miscellaneous set ....................55 34. Comparison of RFs and permeation coefficients for melatonin .........................58 35. Comparison of RFs and permeation coefficients for insulin ..............................59 36. Histological cross section of porcine skin exposed to CPEs in validation set ......................................................................................................63 37. Histological cross section of porcine skin exposed to CPEs in preliminary set ....................................................................................................64 38. Histological cross section of porcine skin exposed to CPEs in Generations 1 - 5.................................................................................................65 39. Future experimental design strategy ...................................................................72
1
CHAPTER I
INTRODUCTION
1.1 Transdermal Drug Delivery (TDD)
Transdermal drug delivery (TDD) is gaining prominence over other forms of drug
delivery due to its potential advantages, including minimal trauma induction,
noninvasiveness, increased patient compliance and potential for continuous, controlled
delivery (1, 2). Consequently, in recent years, numerous transdermal products have been
introduced into the market. Current US market for transdermal patches is over $3 billion
(3) and annual sales worldwide are estimated to be $31.5 billion by 2015 (4). Although
there is a potential market for TDD, it has been limited to only few drugs. Table 1 gives
the list of FDA approved drugs administered transdermally with their commercial names
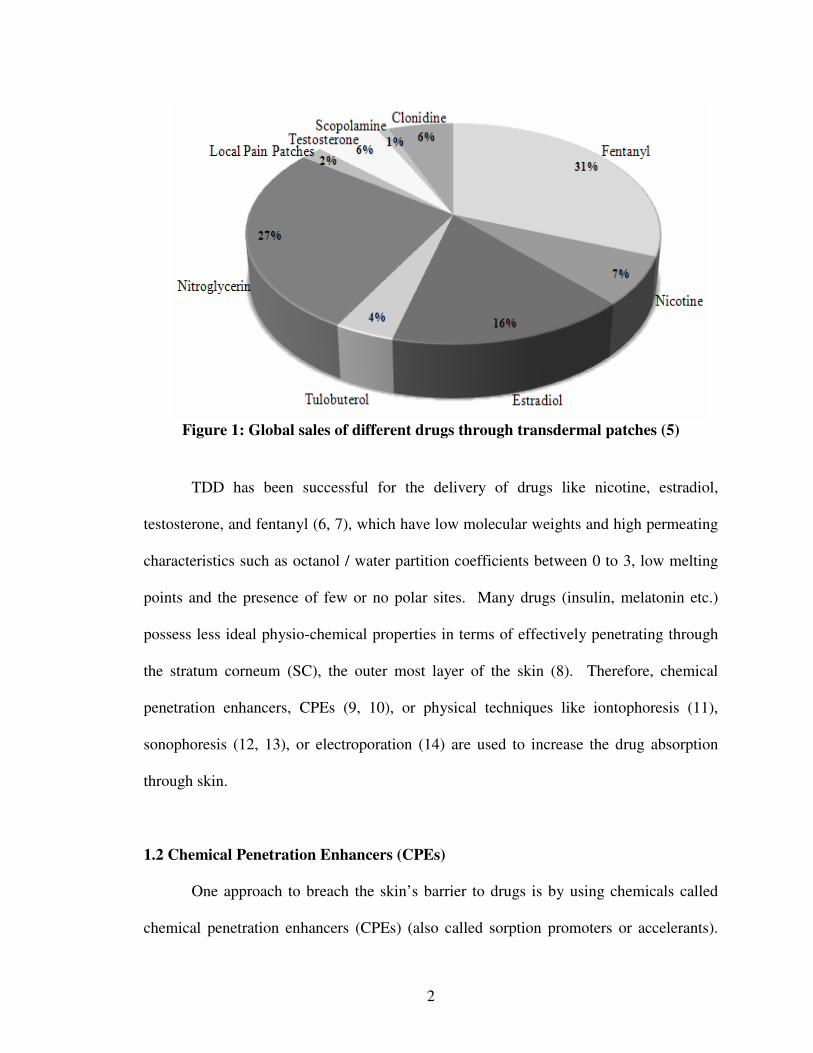
and purpose. Figure 1 shows the percent of global sales of each drug administered
through transdermal patches.
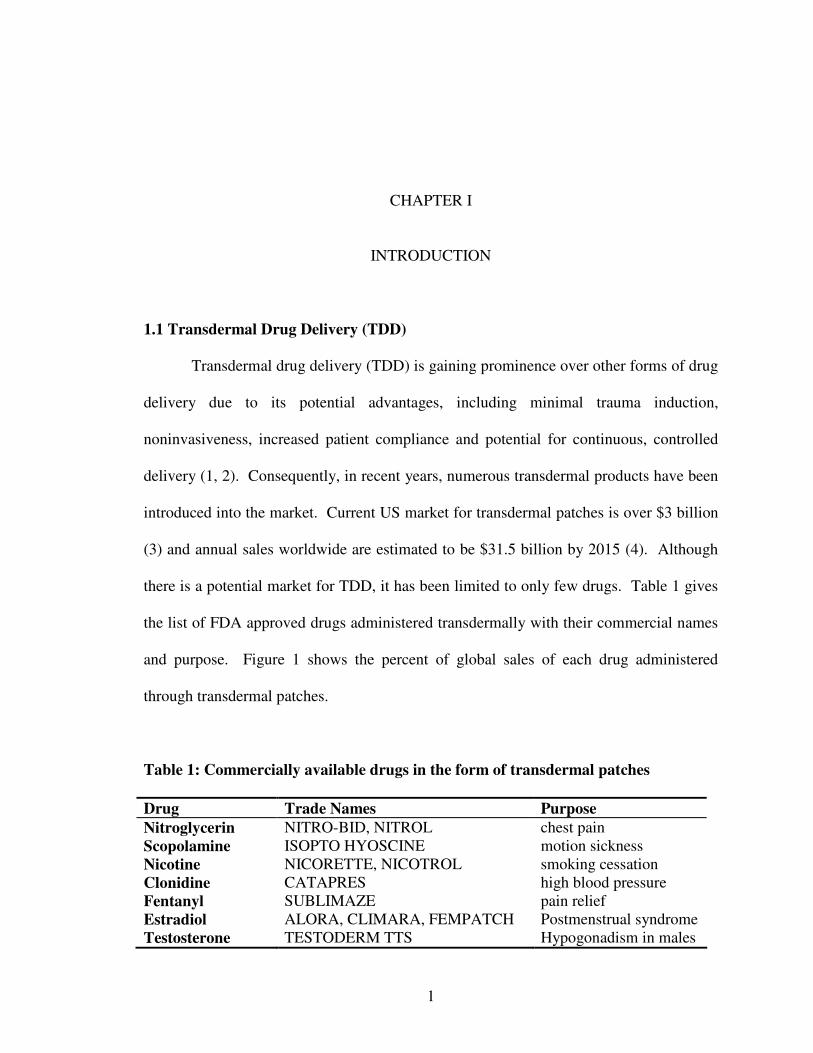
Table 1: Commercially available drugs in the form of transdermal patches
Drug Trade Names Purpose
Nitroglycerin NITRO-BID, NITROL chest pain Scopolamine ISOPTO HYOSCINE motion sickness Nicotine NICORETTE, NICOTROL smoking cessation Clonidine CATAPRES high blood pressure Fentanyl SUBLIMAZE pain relief Estradiol ALORA, CLIMARA, FEMPATCH Postmenstrual syndrome Testosterone TESTODERM TTS Hypogonadism in males
2
Figure 1: Global sales of different drugs through transdermal patches (5)
TDD has been successful for the delivery of drugs like nicotine, estradiol,
testosterone, and fentanyl (6, 7), which have low molecular weights and high permeating
characteristics such as octanol / water partition coefficients between 0 to 3, low melting
points and the presence of few or no polar sites. Many drugs (insulin, melatonin etc.)
possess less ideal physio-chemical properties in terms of effectively penetrating through
the stratum corneum (SC), the outer most layer of the skin (8). Therefore, chemical
penetration enhancers, CPEs (9, 10), or physical techniques like iontophoresis (11),
sonophoresis (12, 13), or electroporation (14) are used to increase the drug absorption
through skin.
1.2 Chemical Penetration Enhancers (CPEs)
One approach to breach the skin’s barrier to drugs is by using chemicals called
chemical penetration enhancers (CPEs) (also called sorption promoters or accelerants).
3
These chemicals reversibly reduce the barrier resistance of SC, thereby enhancing the
diffusion of poorly penetrating drugs through skin. Although the exact mechanisms by
which CPEs function are not completely understood, Barry and Williams (15) introduced
the lipid protein partitioning (LPP) theory, which suggests a chemical can enhance
penetration by one or more of the following mechanisms: (a) disruption of SC lipids, (b)
interaction with intracellular proteins, or (c) increased partitioning of the drug into the SC
(16). Although numerous CPEs for TDD have been identified and reported in the
literature (17), the toxic effects of these CPEs limit their use in transdermal formualtions.
The degree of effectiveness of CPEs is usually accompanied by an increase in their toxic
effects because, potential CPEs are known to irritate and disrupt the organized structure
of the skin (18). Therefore, a careful balance is required between the potency and the
toxic effects of CPEs for TDD.
1.3 Scope of the study
The potency of a CPE in enhancing the permeation of a drug is determined by
measuring the rate at which the drug is permeated through skin in the presence of the
CPE. Typically, these experiments are performed in Franz diffusion cells (FDCs), (9, 19)
and the amount of drug permeated is quantified by using analytical techniques, which
include High Performance Liquid Chromatography (HPLC) (8, 20) or Liquid
Scintillation Counting (LSC) (2, 21). Such measurements are resource and labor
intensive, cost prohibitive and have limited throughput. In addition, these permeation
experiments provide an indirect assessment of the effect of the CPE on the barrier
properties of SC, which includes CPE-drug interactions. Further, there is no rational
4
design criteria for selecting candidate CPEs for study and the trial-and-error
experimentation can be time consuming. Thus, a need exists for a robust, quick alternate
technique that can effectively pre-screen the CPEs for their potency and lead to a better
understanding of the effect of the CPE alone on the skin.
Previously, electrical resistance of the skin was used to assess the integrity of skin
prior to experiments for in vitro dermal testing (22, 23) and evaluating the corrosive
effects of cosmetics on the skin (24). This suggests that the electrical properties of skin,
especially the resistive (or conductive) properties, might be useful in determining the
effect of potential CPEs on the barrier properties of the skin. Recently, electrical
conductance of skin was used as a technique to identify potential CPEs from binary
mixtures of two chemicals at different concentrations (25). However, these experiments
were carried out at room temperature unlike the traditional permeation experiments,
which are performed at physiological body temperature. Further, detailed comparison of
this technique with the traditional FDC measurements has not been done.
1.4 Specific aims of the study
Specific aim 1: Design a more efficient system to pre-screen CPEs for their potency by
using less rigorous techniques.
The pre-screening technique can effectively reduce rigorous sample handling and
analysis, which in turn reduces the time required to perform the permeation experiments
for skin absorption studies. In this study, resistive properties of skin were used to
determine the changes in its barrier properties in the presence of various chemicals. A
high throughput multi-well resistance chamber was designed and constructed, similar to a

5
technique reported recently (26, 27). The multi-well resistance chambers were equipped
to operate at conditions identical to permeation experiments. First, experiments were
performed using CPEs reported in the literature (28), after which measurements were
performed on forty two new potential CPEs, which were identified by a virtual design
algorithm developed by the OSU Thermodynamics Group (29-31). Our results show a
significant agreement between the resistance technique and the standard permeation
experiments; thus, we confirm the efficacy of the resistance technique for screening
potential CPEs.
Specific aim 2: Test the toxic effects of potential CPEs.
Many CPEs, which are potential enhancers, are either toxic or potential irritants to
the skin cells due to their ability to irritate and cause inflammation during the interaction
with the viable epidermis (25, 27). Therefore, histological studies were performed to
observe the morphological changes in the layers of the skin exposed to potent CPEs.
1.5 Thesis Organization
This thesis consists of six chapters. Chapters one and two introduce the topic and
provide a summary of literature review / background for this work. Detailed description
of evolution of the experimentation chamber used in this study is given in Chapter 3.
Chapter 4 deals with evaluation of the CPEs and their toxic effects on skin. Discussion
of results and specific conclusion reached along with the future outlook are given in
chapters five and six. This is a collaborative project with OSU Thermodynamics

6
Research group, consequently, similar documentation can be found else where, in the
manuscripts (32, 33) or the theses’ of members of the group (34, 35).

7
CHAPTER II
BACKGROUND
2.1. Routes of drug administration
Drug delivery is the administration of a pharmaceutical compound into a human /
animal body to achieve therapeutic effect for a particular ailment or disorder. Drugs can
be administered into the body through three main routes:
1. Enteral (drugs administered through gastrointestinal tract)
a. Oral (taken by mouth)
b. Sub-lingual (placed under the tongue)
2. Parenteral (drugs injected into the blood stream) (Figure 2)
a. Intravenous (injected into a vein)
b. Intramuscular (injected into a muscle)
c. Subcutaneous (injected beneath the skin)
3. Others (drugs administered through mucosal membranes, skin or others)
a. Ocular (instilled in the eye)
b. Nasal (absorbed through nasal membranes)
c. Transdermal (delivered through skin by a patch for a systemic effect)
The common routes for administering drugs are either orally or parenterally; oral
is the most preferred as it is convenient, safe and least expensive. However, it has several

8
limitations, which include low bioavailability of many drugs and hepatic first pass
metabolism (19). In oral drug delivery, the drug travels to the liver through the intestinal
wall before it is transported to its target site via the bloodstream. The intestinal wall and
liver may chemically alter (metabolize) many drugs, decreasing the amount of drug
reaching the bloodstream. Some orally administered drugs irritate the digestive tract.
Most other non-steroidal anti-inflammatory drugs can harm the lining of the stomach and
small intestine and can cause or aggravate pre-existing ulcers (36). Many drugs lose their
therapeutic efficiency due to the harsh acidic environment and digestive enzymes in the
stomach, or they are either absorbed poorly or erratically.
Administration of drugs through injections is the next most common route which
includes the intravenous, intramuscular and subcutaneous routes (Figure. 2). For the
subcutaneous route, a needle is inserted into fatty tissue just beneath the skin. The
injected drug moves into small blood vessels (capillaries) and reaches the bloodstream
through the lymphatic vessels. The subcutaneous route is used for administering many
protein drugs because such drugs would be digested in the digestive tract if they were
taken orally. The intramuscular route is preferred to the subcutaneous route when larger
volumes of a drug need to be injected. For the intravenous route, a needle is inserted
directly into a vein. A solution containing the drug may be given in a single dose or by
continuous infusion. Despite the high bioavailability of the drug and ability to deliver a
precise dose quickly and in a controlled manner, needle-based drug administration has
several disadvantages. It has greater risks of adverse effects since high concentrations of
the drug can be attained very rapidly (37). Needle phobia is one of the main offsets,
which can make the drug injection traumatic. Administration through intravenous

9
injections requires experienced or properly trained personnel, because it is difficult to
insert a needle or catheter into a vein. Under chronic diseased conditions, frequent visits
to a physician are necessary, which can be costly.
Figure 2: Various routes of drug administration through injections
In order to overcome the above mentioned problems from conventional routes of
drug delivery, researchers have started exploring alternate routes like eyes (38), mucosal
membranes (39), vagina (40, 41) and skin (42, 43) to deliver therapeutics into the body.
Due to the ease of application and large area of interface, drug delivery through the skin
(TDD) can be very attractive when compared to other routes. In TDD, therapeutics are
delivered through a patch on the skin. Drug, which is present in the patch, is absorbed
into the blood stream through the skin. Many drugs are available as transdermal patches
in the market, as mentioned in Section 1.1.
10
2.2. Structure of skin
Profound knowledge regarding the structure of skin and the impact of this
structure on the delivery of drugs is important for the success of TDD. Skin, the largest
organ of the integumentary system of the human body performs various functions like:
1. Keeping the body and organs intact.
2. Protecting the internal organs from pathogens, chemicals, and other external
threats.
3. Acting as a water resistant barrier and minimizing trans-epidermal water loss
(TEWL).
4. Regulating the temperature of the body by secretion and controlling energy losses
by radiation, convection, and conduction.
5. Acting as a storage center for water and lipids, and helping synthesize vitamin D.
Skin consists of several different and distinct layers, each with its own specialized
function. It is composed of three main layers (Figure 3 a): epidermis, which protects the
body organs from infections and prevents the evaporation of water from the body; the
dermis, which consists of connective tissues and cushions the body from stress and strain;
and hypodermis, which consists of subcutaneous adipose tissues and acts as a thermal
barrier. Figure 3 b shows the histological cross section of porcine skin with various
layers.
2.2.1. Epidermis
Epidermis is the outermost layer of the skin, which consists of stratified squamous
epithelium with an underlying basal lamina (37). It can be sub-divided into five distinct

11
layers (Figure 4), which give barrier resistance to the skin. The five layers of the
epidermis from top to bottom are stratum corneum, stratum lucidum (only in palms of
hands and bottoms of feet), stratum granulosum, stratum spinosum and stratum basale.
Figure 3 a): Structure of human skin
Figure 3 b): Histological cross section of porcine abdominal skin
12
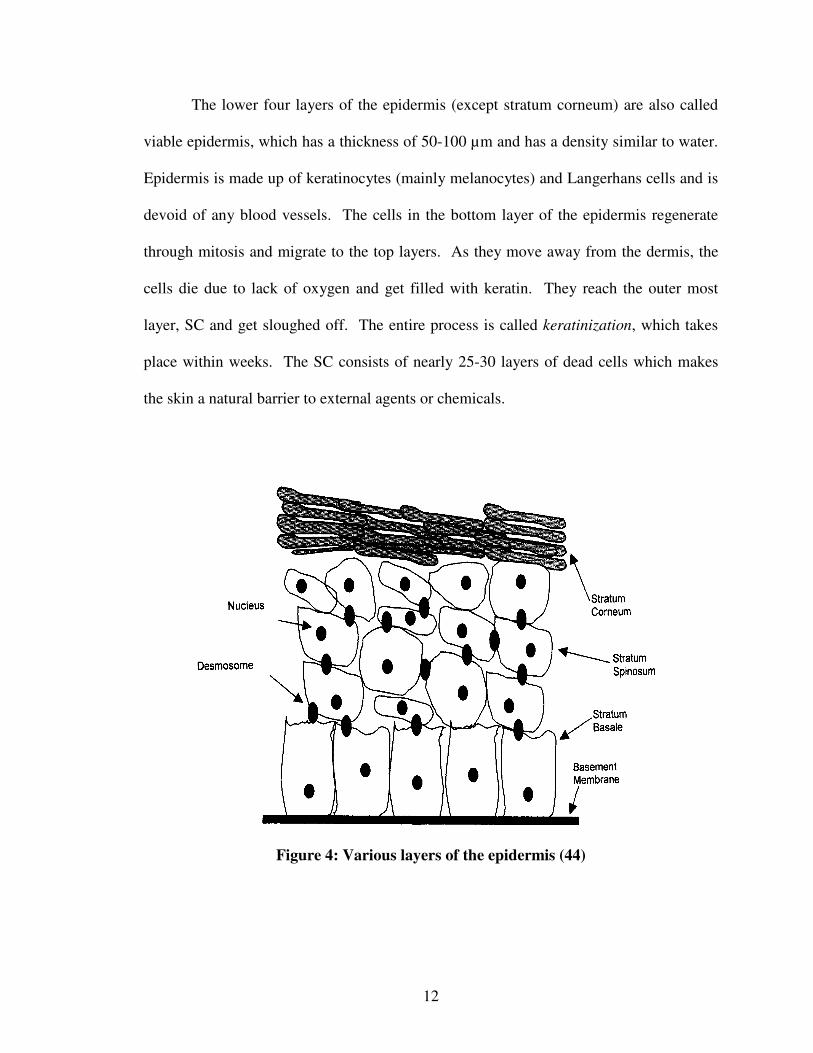
The lower four layers of the epidermis (except stratum corneum) are also called
viable epidermis, which has a thickness of 50-100 µm and has a density similar to water.
Epidermis is made up of keratinocytes (mainly melanocytes) and Langerhans cells and is
devoid of any blood vessels. The cells in the bottom layer of the epidermis regenerate
through mitosis and migrate to the top layers. As they move away from the dermis, the
cells die due to lack of oxygen and get filled with keratin. They reach the outer most
layer, SC and get sloughed off. The entire process is called keratinization, which takes
place within weeks. The SC consists of nearly 25-30 layers of dead cells which makes
the skin a natural barrier to external agents or chemicals.
Figure 4: Various layers of the epidermis (44)

13
2.2.2. Dermis
Dermis is a 2-3 mm thick layer present below the epidermis and it provides
flexible support structure to the skin. It contains hair follicles, sweat glands, sebaceous
glands, apocrine glands, lymphatic vessels and blood vessels. Collagen and elastin are
synthesized in this layer. Dermis is tightly connected to the epidermis by a basement
membrane and regulates temperature, pain and pressure in the body. The sense of touch
and heat to the skin are provided by the nerve endings that are present in this layer.
2.2.3. Hypodermis
Hypodermis is the deepest layer of the skin, also called the subcutaneous tissue.
It consists of adipose tissue (fat cells), connective tissues, macrophages and fibroblasts.
2.2.4 Stratum corneum
The upper strata of the epidermis is called Stratum Corneum (SC), which consists
of corneocytes (dead cells) embedded in a lipid-rich matrix. Sheuplin et al. (45, 46) have
reported that diffusion across SC is 3-5 times lower than dermis for most substances.
Therefore, SC is considered to be the main barrier to the success of TDD. The
corneocytes are comprised of cross linked keratin fibers, which are about 0.2 – 0.4 µm
thick and about 40 µm wide (3). The corneocytes are held together by desmosomes
(Figure 4), which gives structural stability to the SC. The SC lipids are composed
primarily of ceramides, cholesterol and fatty acids assembled into multi-lamellar bi-
layers. This unusual extracellular matrix of lipid bi-layers serves as the primary barrier
of the SC. The layer of lipids immediately adjacent to each corneocyte is bound
14
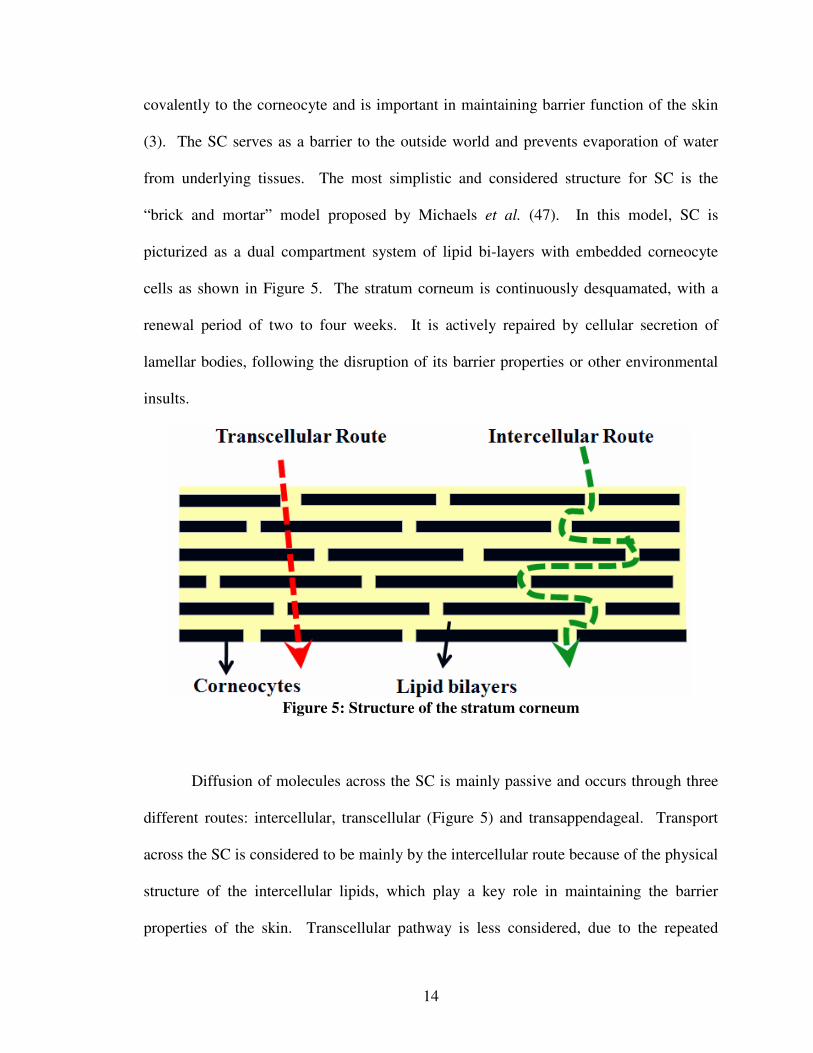
covalently to the corneocyte and is important in maintaining barrier function of the skin
(3). The SC serves as a barrier to the outside world and prevents evaporation of water
from underlying tissues. The most simplistic and considered structure for SC is the
“brick and mortar” model proposed by Michaels et al. (47). In this model, SC is
picturized as a dual compartment system of lipid bi-layers with embedded corneocyte
cells as shown in Figure 5. The stratum corneum is continuously desquamated, with a
renewal period of two to four weeks. It is actively repaired by cellular secretion of
lamellar bodies, following the disruption of its barrier properties or other environmental
insults.
Figure 5: Structure of the stratum corneum
Diffusion of molecules across the SC is mainly passive and occurs through three
different routes: intercellular, transcellular (Figure 5) and transappendageal. Transport
across the SC is considered to be mainly by the intercellular route because of the physical
structure of the intercellular lipids, which play a key role in maintaining the barrier
properties of the skin. Transcellular pathway is less considered, due to the repeated

15
partitioning involved between the lipid bi-layers and impermeable corneocyte cells with
keratin when diffusion occurs. Diffusion through skin appendages like hair follicles,
sebaceous glands or eccrine glands is another route through which transport may occur.
2.3 Different TDD techniques
The barrier properties of the SC can be breached for TDD in several ways (3), by
using physical techniques like iontophoresis (48-51), electroporation (1, 11, 14, 52, 53),
sonophoresis (12, 54), thermal poration, or by using chemicals known as chemical
penetration enhancers (CPE) (10, 19, 26, 28, 55-59), which can increase the permeability
of the SC for drugs.
In iontophoresis, a small electric current is applied to the skin, which provides the
driving force to enable penetration of charged drug molecules into the skin.
Electroporation is the application of short pulses of high voltage current to the skin
producing hydrophilic pores in the intercellular bi-layers due to the momentary
realignment of lipids in the SC. These pores allow the passage of macromolecules or
drugs through skin. Sonophoresis (phonophoresis) uses low frequency ultrasound energy
to fluidize the lipid bi-layer in order to enhance the skin penetration of active substances.
These physical techniques require devices that can produce ultra sound waves or generate
required voltage, which may limit their practical usage and economic feasibility to
enhance the flux of a component through skin.

16
2.4 Chemical penetration enhancers
The use of CPEs over the physical techniques has certain advantages, including
design flexibility of the patch and ease of patch application over a large area (>10 cm2)
(3). An ideal penetration enhancer should reversibly reduce the barrier resistance of the
SC without damaging the skin cells. According to Finnin et al. (59): ideal penetration
enhancers should possess the following properties:
• Pharmacologically inert
• Nontoxic, nonirritating, and non-allergenic
• Rapid onset of action; predictable and suitable duration of action for the drug
used
• Reversible effect of the CPE on the barrier property of SC
• Chemically and physically compatible with the delivery system
• Readily incorporated into the delivery system
• Inexpensive and cosmetically acceptable
Because the skin provides such a formidable barrier to the delivery of most drugs,
a broad range of different chemical additives have been tested to enhance transdermal
penetration during the last two decades. Much of the cited literature is found in patents
(17) as well as pharmaceutical science literature (60). Even though many chemical
entities have been identified, only a few were introduced in the market due to several
limitations, which include their economic feasibility and the toxic effects on skin, which
make them undesirable for developing transdermal patches.
CPEs can be divided into various groups depending on their functional groups.
Enhancers like alcohols, alkyl sulfoxides, and polyols help in increasing the solubility

17
and improving the partition coefficient of the drug (61). Solvents like dimethlysulphate
and ethanol increase the permeability of SC by extracting the lipids. Oleic acid, azone,
and isopropyl myristate enhance the diffusion of a permeant by disrupting the structure of
lipid bi-layers. Transcellular diffusion is favored by ionic surfactants, decylmethyl
sulfoxide and urea, which interact with the keratin in the corneocytes and disrupts its
protein structure (61).
2.5 Skin selection
Human in vivo studies are preferred when performing skin absorption studies in
the presence of various enhancers, but they are limited by ethical considerations and
availability of volunteers (62). The use of human skin to perform in vitro studies is
constrained by the various factors like sex, age, medical condition of the donors, and
mostly the availability of cadaver skin (62, 63). In order to overcome these problems
animal skin from various species like rat (19, 22, 64, 65), snake (6, 66, 67), pig (22, 25,
55, 62, 68, 69), guinea pig (9, 22), rabbit (22, 64), and mouse (22, 64, 70, 71) were
investigated. Skin from pig and rhesus monkey were reported to have permeability
properties closer to human skin (63). Porcine skin can be used as a surrogate to human
skin because it is a well-accepted and readily available model for the human barrier and
is often used to assess topical and transdermal pharmaceutical formulations either in vivo
or in vitro (68). There are significant similarities of certain properties between porcine
and human skin (e.g., epidermal thickness, physiological and morphological
characteristics and lipid composition), and the permeabilities of the membranes to various
compounds are similar (62). Sekkat et al. (68) have reported that the thickness of SC and

18
the biophysical parameters like diffusivity and permeability coefficient of water across
porcine skin in vitro and human skin in vivo are comparable (data shown in Table 2).
This result validates the use of porcine skin in place of human skin for conducting in vitro
studies.
Table 2: Comparison of biophysical parameters of porcine skin in vitro and human
skin in vivo (68).
Skin Source H1 (µm) D
2(cm
2 × s
-1) Kp
3 (cm × h
-1)
Porcine (in vitro) 11.8 ± 4.0 3.2 ± 1.5 5.8 ± 1.1
Human (in vivo) 10.9 ± 3.5 3.0 ± 1.5 6.1 ± 1.4
1H (thickness of SC), 2D (diffusivity of water across SC), 3Kp(permeability coefficient of water across SC)
2.6 Franz diffusion cell (FDC)
In vitro skin absorption studies are generally carried out in vertical or side by side
FDCs, which were popularized by Dr. Thomas Franz (72). Since its introduction, the
FDC has been used in various skin absorption studies, including topical and TDD
formulations, as well as cosmetics, skin care products, and pesticides. According to Food
and Drug Administration (FDA) regulations, it is an ideal tool for quality control for
cosmetic preparations. It has a receptor and a donor chamber, which are filled with
buffer medium and the solute of interest, respectively. The schematic diagram of a
vertical FDC is shown in Figure 6. It consists of a water jacket through which
temperature-controlled water is re-circulated in order to perform the experiments at a
desired temperature. The skin / membrane is sandwiched between the two chambers and
clamped in place tightly (clamp not shown). The donor chamber is filled with a known

19
volume of solute and the permeation of solute through the skin is monitored by periodic
sampling of the solution from the receptor chamber. The samples are analyzed by either
HPLC or LSC. However, these analytical techniques are very labor intensive and cost
prohibitive.
Figure 6: Franz diffusion cell
It has been reported that the measurement of electric resistance of skin provides
an indirect assessment of skin’s permeability properties in the presence of respective
solutes or solvents (27).
2.7 Electric resistance of skin
Skin can be modeled as an electrical resistor and a capacitor in parallel, and much
of the skin's resistance is found to be in the SC (Figure 7) (73). Previously, electrical
resistance of the skin was used to assess the integrity of skin prior to experiments for in

20
vitro dermal testing (12, 22, 23, 74, 75), to access the irritation potential of chemicals in a
test known as Skin Integrity Function Test (SIFT) (76) and to evaluate the corrosive
effects of cosmetics on the skin (24). This suggests that the electrical properties of skin,
especially the resistive (or conductive) properties, can be used to determine the effect of
potential CPEs on the barrier properties of the skin. The skin resistance is usually
measured using a LCR databridge, which generates electric current at different
frequencies.
Figure 7: Electrical equivalent of skin
2.7.1 LCR meters
An LCR meter is an electronic device which is capable of measuring inductance
(L), capacitance (C), resistance (R), impedance (Z) and phase angle (θ) of various
electronic circuits. Due to its ease of operation and ability to measure the barrier
resistance of skin rapidly, it has found its way into in vitro dermal testing. The electric
resistance of skin is an indicator of the condition of the SC, the principal barrier to
diffusion of chemical substances (23). The barrier resistance of SC is greatly reduced by
tape-stripping, exposure to chemicals, or by damaging it (68), which can be quantified by
measuring the electric resistance of the skin.

21
The Instek high precision LCR 821 (Figure 8), which was used in this study, has a
test frequency range of 12 Hz to 200 k Hz, with continuously variable frequencies. It is
most useful in applications that need both high stability and high accuracy. It can
measure the inductance (L), capacitance (C), resistance (R), absolute value of the
impedance (Z), dissipation factor (D), quality factor (Q), and phase angle of impedance
(θ) of a device under test with a measurement accuracy of 0.05%. It has a 240 Χ 128 dot
matrix back light LCD screen with adjustable contrast in order to display the test results
simultaneously on the screen. It can be operated in R/Q, C/D, C/R, L/Q, Z/θ, L/R test
modes in either series or parallel equivalent circuits except in Z/θ mode. The variable
test signal voltage ranges from 5 mV to 1.275 V, with each step voltage of 5 mV. The
internal / external DC bias selection simulates the real operation condition of a device
under test.
Figure 8: Instek LCR 821 high precision databridge
2.7.2 Factors affecting the electrical properties of skin
The optimal electrical conditions for in vitro measurements of the SC properties
which reflect permeability have been well established (77). These conditions are
alternating current (AC) of low frequency (0.1 - 1 k Hz) and low voltage (0.1 – 1 V) (77).

22
Use of AC overcomes the problems of polarization of the skin and electrodes. It also
avoids damage to tissues which can occur when using DC with high current density (78).
At higher AC frequencies, current goes through the capacitive channels readily, which
are not dependent on free ionic movement, and resultant false resistance for the
membrane is measured. Thus, permeability is better represented by the resistive current,
which dominates at lower frequencies. Passage of any electric current at a voltage
greater than 1 - 2 V across skin results in irreversible damage to the barrier properties of
the SC (78). Electrical resistance of the skin is also dependent on its hydration state,
ionic strength of the bathing medium, and current density (50, 79). The resistance of the
skin varied from 250 – 25 kΩ between the ionic strength of the medium (NaCl) between
10 to 1000 mM (79). In the present study, the resistance readings were obtained at a low
voltage (0.2 V) and low frequency AC (0.1 k Hz) current and by maintaining the
concentration of the medium (buffer solution) constant throughout.
2.7.3 Effect of skin exposure area on electrical resistance of skin
Electrical resistance of skin decreases with increase in the cell exposure area.
This reduction in resistance can be due to the increase in pathways of current carrying
ions through the skin. Figure 9 shows the effect of skin exposure area on its electrical
resistance for epidermal membranes of human and rat and full thickness rat skin reported
in the literature (74, 80). The skin resistance was measured using a LCR databridge with
the settings of 1 k Hz and 0.3 V in parallel equivalent circuit mode. The bathing medium
was 0.9 % saline solution. The electrical resistance of human skin reported by various
authors at different conditions is given in Table 3 (74). The huge variation in the

23
resistance of the skin in Table 3 suggests that in vitro skin studies should be performed by
maintaining constant experimentation conditions, which include skin location from the
specimen and exposure area, concentration of bathing medium, electrical conditions
(frequency and voltage) to measure the resistance.
Figure 9: Effect of in vitro cell exposure area on skin resistance
Davies et al. have reported the electrical resistance of epidermal and whole skin
membranes of various species with a LCR databridge at a frequency of 100 k Hz and
using physiological saline as the bathing medium (Table 4). The skin exposure area used
was 2.54 cm2.

24
Table 3: Human skin resistance at different conditions (74)
Skin Location Exposure
area (cm2)
AC/DC
parameters
Bathing
medium
ER
(kΩ)
HEM Thigh 0.64 AC, 300mV
rms. 1000Hz 0.9% NaCl 12-62
HEM Back 0.90 AC, 3mV rms.
1000/10000Hz 3.5 mM NaCl 10/5
HEM Unknown 0.70 DC, 250mV
rms. 100 mM PBS 17
HEM Abdominal/
breast 2.27 AC, 12.5Hz 0.9% NaCl 1-20
HEM unknown 0.70 DC,
125/1000mV 100mM PBS 2-45/4-20
HST Thigh 0.64 AC, +1V,
0.2Hz, +1µA
133 mM
NaCl 260
HST Abdominal 0.79 AC, 100Hz,
+10µA 150 mM PBS 20-60
HST Torso/thigh 0.70 DC, 10µA PBS, 156
mM Na+ 43-192
HFT Abdominal 3.5 AC, 1V rms,
1.5Hz 200mM NaCl 360
HFT Abdominal 1.77 AC, 1V,
100300Hz 0.9%saline 88-882
HFT Abdominal/
breast 0.79 AC
154 mM
MgSO4 10.9-26.8
HS forearm 4.0 AC, 1V rms,
1/1000 0.9% NaCl 148-293/8
HEM, human epidermal membrane; HST, human split-thickness skin; HFT, human full-thickness skin; HS, human skin; AC, alternating current; DC, direct current; V, Volts; ER, electric resistance of skin; PBS, phosphate buffer saline.
Since using higher frequency current (100 k Hz) results in lower skin resistance,
this gives a very narrow range for skin resistance to identify potential CPEs from a large
set of chemicals. As shown in Table 4, porcine skin resistance was just 3 kΩ at a
frequency of 100 k Hz. In our experiments, initial skin resistance was around 150 – 200
kΩ (at a frequency of 0.1 k Hz) and after exposure to a potential CPE, it dropped by 80-

25
fold to 1 - 2 kΩ, which gives a large range to identify CPEs. If the initial resistance was
just 3 kΩ and it drops to 1 kΩ after exposure to a potential CPE, it could be difficult to
distinguish between a potent and a non-potent CPE, due to error associated in biological
experiments. Therefore, lower frequency currents should be used to measure the skin
resistance.
Table 4: Electrical resistance of epidermal and whole skin membranes of various
species measured at a frequency of 100 k Hz (22)
Species Skin type Electrical resistance (kΩ)
Human Epidermis 10.0 ± 1.0
Whole 10.0 ± 0.7
Rat Epidermis 2.5 ± 0.2
Whole 3.0 ± 0.5
Pig Epidermis 3.0 ± 0.3
Whole 4.0 ± 0.3
Mouse Whole 5.0 ± 0.6
Rabbit Whole 0.8 ± 0.1
Guinea pig Whole 5.0 ± 0.7

26
CHAPTER III
MULTI-WELL RESISTANCE CHAMBER
3.1 Introduction
High throughput screening devices for identifying potential CPEs for TDD were
reported in the literature recently (26, 27). However, the utility of these devices in place
of the standard Franz diffusion cells (FDCs) was not justified. If the newly designed
resistance chambers were to replace the FDCs, they should respond in a manner similar
to the FDCs. In this study, a novel resistance chamber was built in-house in order to
increase the throughput of the experiments. The reliability of the resistance chamber was
confirmed by validating it against the FDC using CPEs reported in the literature (28).
The resistance chamber was designed and developed in multiple stages to optimize its
performance. The evolution of the multi-well resistance chamber from Configuration 1
to Configuration 5 is explained in this chapter. The possibility of using polymeric
chitosan membranes in place of porcine skin was also investigated with the goal of
reducing the variability usually associated while performing in vitro studies with animal /
human skin samples.
3.2 Skin preparation
Porcine whole skin from the abdominal region of female Yorkshire pigs was

27
purchased locally (Ralph’s Packing Co., Perkins, OK, USA) prior to steam cleaning.
Skin was washed under cold running water and the hair was clipped using an electric
clipper (Wahl, Series 8900, USA). The exogenous tissues and subcutaneous fatty layers
were removed carefully using scissors. The skin was then used immediately or wrapped
in aluminum foil and stored at - 20 °C for future use. Frozen skin was thawed at room
temperature for about two hours before use. Skin membrane integrity was checked
before starting the experiment by measuring resistance at a frequency and voltage of 0.1
k Hz and 0.2 V, respectively, using a LCR Databridge (Instek, CA, USA) operated in
parallel mode. Samples with an initial resistivity of 20 kΩ cm2 or above with Phosphate
Buffer Saline (PBS, pH – 7.4, phosphate and sodium chloride concentrations of 0.001 M
and 0.137 M, respectively) were used in the experiments (12, 56, 81). Any skin samples
with a lower resistivity than the above values were discarded. Quality of the prepared
tissue was also assessed by performing histology on randomly chosen samples.
3.3 Statistical analysis
All experiments were performed at least three times. The coefficient of variation,
CV, was calculated by the ratio of the standard deviation to the mean of multiple
experiments in order to validate our resistance technique, with reported literature data
(76) using sodium dodecyl sulphate. Single factor one-way analysis of variance
(ANOVA) with a 95 % confidence interval was used to determine the significant
difference between the RFs of the candidate CPEs tested. A difference was considered
statistically significant when the associated P value for RF was less than 0.05 between
the CPE and the control.

28
3.4 Different configurations of multi-well resistance chamber
3.4.1 Configuration 1
Figure 10 shows the Configuration 1, the initial configuration, of the resistance
chamber. It consists of two half-inch thick Teflon plates. A hole with a diameter of 1’’
was drilled into each Teflon plate. Porcine skin or polymeric chitosan membrane was
placed between the plates, and the plates were clamped together tightly. Resistance
readings were taken using 0.25’’ stainless steel metal dowel pins (MSC Direct, USA) and
the LCR databridge. The effect of AC frequency on the resistance of porcine skin and
porous chitosan membrane was investigated.
Figure 10: Configuration 1 of the resistance chamber
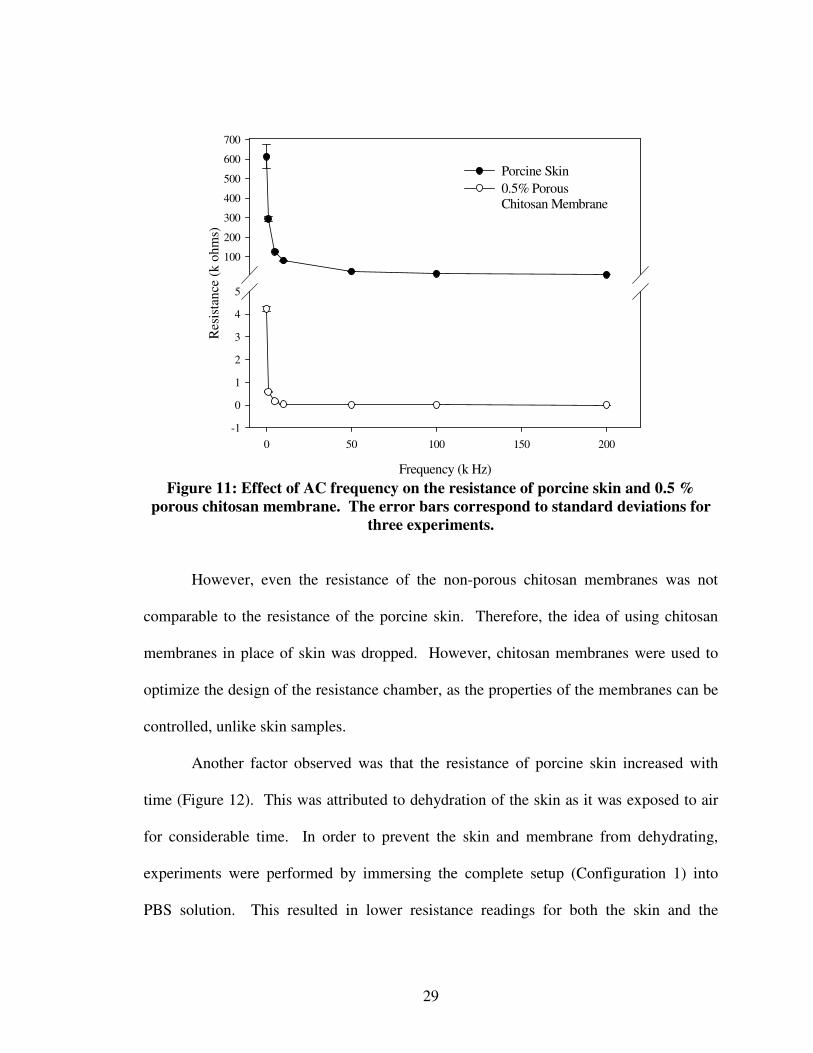
Resistance of the porcine skin and chitosan membrane decreased exponentially as
the frequency of the AC current was increased (Figure 11) and the resistance of the
chitosan membrane was significantly lower than porcine skin at the same frequency.
This suggests that the polymeric chitosan membrane used in this study was highly
conductive, compared to the porcine skin, which is undesirable. In order to increase the
resistive properties of chitosan membrane, porous 0.5 % chitosan membranes were
replaced with 4 % non porous membranes.
29
Figure 11: Effect of AC frequency on the resistance of porcine skin and 0.5 %
porous chitosan membrane. The error bars correspond to standard deviations for
three experiments.
However, even the resistance of the non-porous chitosan membranes was not
comparable to the resistance of the porcine skin. Therefore, the idea of using chitosan
membranes in place of skin was dropped. However, chitosan membranes were used to
optimize the design of the resistance chamber, as the properties of the membranes can be
controlled, unlike skin samples.
Another factor observed was that the resistance of porcine skin increased with
time (Figure 12). This was attributed to dehydration of the skin as it was exposed to air
for considerable time. In order to prevent the skin and membrane from dehydrating,
experiments were performed by immersing the complete setup (Configuration 1) into
PBS solution. This resulted in lower resistance readings for both the skin and the
Frequency (k Hz)
0 50 100 150 200
Res
ista
nce
(k
ohm
s)
-1
0
1
2
3
4
5
100
200
300
400
500
600
700
Porcine Skin
0.5% Porous Chitosan Membrane

30
chitosan membrane, which is due to PBS short circuiting the system. To avoid the
problems of dehydration and shorting, Configuration 1 was modified.
Figure 12: Change in resistance of porcine skin with time using
Configuration 1 of the resistance chamber. Error bars correspond to standard
deviations for three experiments.
3.4.2 Configuration 2
The single well experimental set-up was modified into a four well setup and fixed
to a Teflon Petri dish. Figure 13 shows the schematic of Configuration 2 of the multi-
well resistance chamber. It consists of two half-inch thick Teflon plates fixed to a Teflon
Petri dish. Four holes with a diameter of 5/16’’ were drilled into each Teflon plates. The
holes in the top plate serve as donor chambers, and the holes in the bottom plate serve as
receiver chambers, as in FDCs. Porcine skin was placed between the receiver and donor
plates with the SC facing the donor wells, and the two plates were clamped together
tightly. The petri dish was filled with PBS such that the receiver chambers were
Time (h)
0 2 4 6 8 10
Res
ista
nce
(k
oh
ms)
0
200
400
600
800
1000
1200

31
completely filled with PBS, which was assured by checking the skin resistance; presence
of air pockets between the skin and the receiver chambers showed very high resistance
values since air has low conductivity. Resistance readings were taken using four pairs of
stainless steel electrodes fixed to the petri dish and the electrode holder, as shown in
Figure 13. The electrode setup of Configuration 2 is shown in Figure 14.
Figure 13: Configuration 2 of resistance chamber
Figure 14: Electrode setup of Configuration 2
Figure 15 shows the resistance of porcine skin measured at different times using
Configuration 2 of the resistance chamber. As the skin was exposed to PBS throughout
the experiment in Configuration 2, the resistance of the skin reduced with time. This can

32
be due to the dilated pores in the skin membrane caused by prolonged exposure to PBS,
which increases the conducting pathways through the skin. The problem of dehydration
was fixed, but the error from the experiments was significant (~30%), which shows a low
reproducibility for the measurements.
Figure 15: Change in resistance of porcine skin with time using
Configuration 2 of multi-well resistance chamber. Error bars correspond to
standard deviations for three experiments.
3.4.3 Configuration 3
In order to improve the reproducibility from the experiments, the four well setup
was changed to five well (Figure 16) and fixed to a Petri dish. Now there is a common
electrode instead of individual electrode for each well in the bottom, which was fixed to
the petri dish and the resistance readings were taken by sequentially changing the top
electrode.
Time (h)
0 2 4 6 8 10 12
Res
ista
nce
(k
ohm
s)
0
50
100
150
200
250

33
Figure 16: Electrode Setup of Configuration 3
The variation of the resistance measurements of a polymeric non-porous chitosan
membrane among the four wells of the resistance chamber was studied at frequencies of
0.1, 10 and 100 k Hz (Figure 17). The difference in the resistance of chitosan membrane
was ~17 % among the four wells of the resistance chamber at all the frequencies tested.
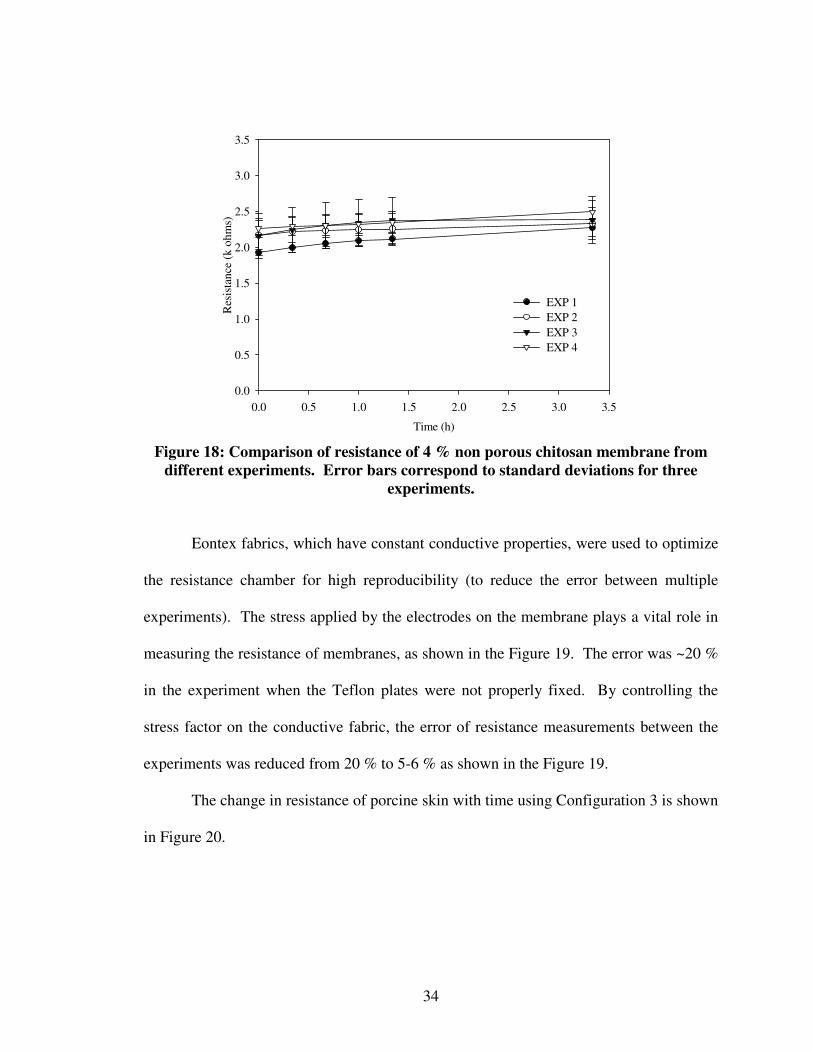
The reproducibility of the data from the resistance chamber was checked by comparing
resistance readings of four different chitosan membranes (Figure 18), and the error was
found to be ~20%. This error in the above experiments can be due to the stress applied
by the electrodes on the membrane.
Figure 17: Change in resistance of 4 % non porous chitosan with time at different
frequencies. Error bars represent the standard deviations for three experiments.
Time (h)
0.0 0.2 0.4 0.6 0.8 1.0 1.2 1.4
Res
ista
nce
(k
ohm
s)
0.0
0.5
1.0
1.5
2.0
2.5
3.0
3.5
0.1 KHz
10 KHz
100 KHz
34
Time (h)
0.0 0.5 1.0 1.5 2.0 2.5 3.0 3.5
Res
ista
nce
(k
oh
ms)
0.0
0.5
1.0
1.5
2.0
2.5
3.0
3.5
EXP 1
EXP 2
EXP 3
EXP 4
Figure 18: Comparison of resistance of 4 % non porous chitosan membrane from
different experiments. Error bars correspond to standard deviations for three
experiments.
Eontex fabrics, which have constant conductive properties, were used to optimize
the resistance chamber for high reproducibility (to reduce the error between multiple
experiments). The stress applied by the electrodes on the membrane plays a vital role in
measuring the resistance of membranes, as shown in the Figure 19. The error was ~20 %
in the experiment when the Teflon plates were not properly fixed. By controlling the
stress factor on the conductive fabric, the error of resistance measurements between the
experiments was reduced from 20 % to 5-6 % as shown in the Figure 19.
The change in resistance of porcine skin with time using Configuration 3 is shown
in Figure 20.

35
Figure 19: Comparison of the change in the resistance profiles of Eontex Fabrics
from four wells of the resistance chamber. Error bars correspond to standard
deviations for three experiments.
Figure 20: Resistance profile of porcine skin with Configuration 3. Error
bars correspond to standard deviations for three experiments
Tim e (m )
0 5 10 15 20 25 30 35
Res
ista
nce
(k
oh
ms)
0.0
0.5
1.0
1.5
2.0
2.5
3.0
T eflon plates not fixed tightly
1: C onfiguration 3
2: C onfiguration 3
3: C onfiguration 3
4: C onfiguration 3
Time (h)
0 2 4 6 8 10 12
Res
ista
nce
(k
oh
ms)
50
100
150
200
250

36
Still there is no good reproducibility from the experiments, error in the resistance
measurement with the porcine skin was still significant (~ 30%) (Figure 20). This can be
due to variable skin thickness and the conductive properties of the skin, which cannot be
controlled from experiment to experiment. Therefore, the resistance measurements
obtained from each well were normalized to its initial value as shown in equation 1 to
reduce the uncertainty associated with biological experiments.
0
t
RRF =
R (1)
Even after using normalized resistance values the error between experiments was
significantly higher (Figure 21), which can be due to fact that the electrodes were tightly
fixed to the skin in the donor wells. Fixing the electrodes tightly to the skin can result in
a decrease in the surface area where the PBS / chemical formulation interacts with the
skin, leaving no space for the PBS / chemical to act at the site of the electrode. In order
to fix this problem the electrode set up of Configuration 3 was again modified.

37
Figure 21: Normalized resistance of porcine skin with Configuration 3.
Error bars correspond to standard deviations for three experiments.
3.4.4 Configuration 4
The only difference between Configuration 3 and 4 is that the electrodes are held
at a constant distance both in the PBS in the common well at the bottom and in the
chemical in the donor wells (Figure 22) rather than fixing them tightly. A full schematic
of the resistance chamber with the modified electrode set up is shown in Figure 23.
Figure 22: Electrode Setup of Configuration 4
Time (h)
0 2 4 6 8 10 12
RF
0.0
0.5
1.0
1.5
2.0
2.5

38
Figure 23: Schematic of the resistance chamber
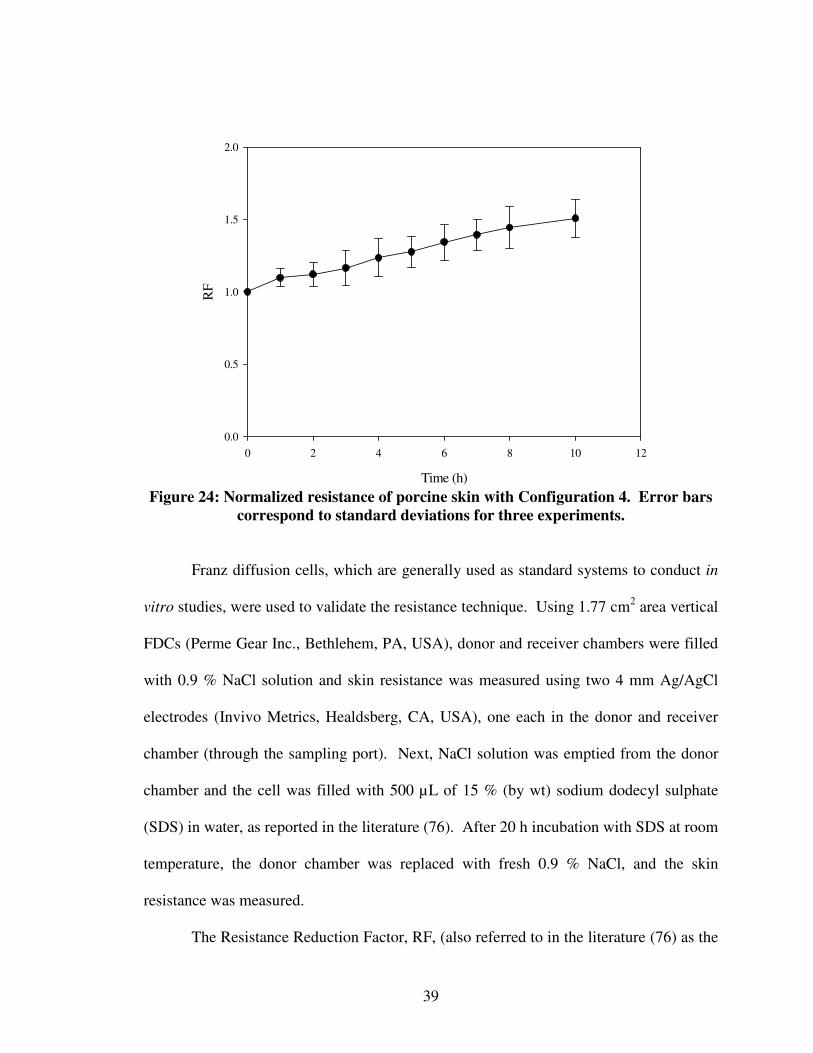
Figure 24 shows the normalized resistance values of porcine skin with
Configuration 4 of resistance chamber. The error from multiple experiments had
significantly reduced from 30 % to 15 % using the resistance chamber with Configuration
4.
39
Figure 24: Normalized resistance of porcine skin with Configuration 4. Error bars
correspond to standard deviations for three experiments.
Franz diffusion cells, which are generally used as standard systems to conduct in
vitro studies, were used to validate the resistance technique. Using 1.77 cm2 area vertical
FDCs (Perme Gear Inc., Bethlehem, PA, USA), donor and receiver chambers were filled
with 0.9 % NaCl solution and skin resistance was measured using two 4 mm Ag/AgCl
electrodes (Invivo Metrics, Healdsberg, CA, USA), one each in the donor and receiver
chamber (through the sampling port). Next, NaCl solution was emptied from the donor
chamber and the cell was filled with 500 µL of 15 % (by wt) sodium dodecyl sulphate
(SDS) in water, as reported in the literature (76). After 20 h incubation with SDS at room
temperature, the donor chamber was replaced with fresh 0.9 % NaCl, and the skin
resistance was measured.
The Resistance Reduction Factor, RF, (also referred to in the literature (76) as the
Time (h)
0 2 4 6 8 10 12
RF
0.0
0.5
1.0
1.5
2.0

40
damage ratio) was calculated. It is defined as the ratio of the initial resistance value at
time 0 to the resistance value of the sample obtained at time t, or:
0
t
RRF =
R
The initial resistance reading, R0, was taken after incubating the skin with the chemical
for at least 10 - 15 minutes to reduce the variability in the measurements acquired.
The results showed that the RF was 10 (CV = 0.15) after 20 h. This was
comparable to the reported literature value of 11.3 (76). Moreover, the CV was
significantly lower than the reported value of 1. The reduction in variation was achieved
by
i) Using skin samples which had similar initial resistance value in all the
experiments,
ii) Using porcine abdominal skin instead of the dorsal skin as it has less variation
in thickness and hair density, and
iii) Importantly, not washing the skin with detergent and allowing it to dry prior to
final resistance reading as reported by Heylings et al. (76); SDS solution was wiped off
using tissue paper. Washing with soap may result in accumulation of surfactants, which
may give false resistance values by interacting with the NaCl solution. Allowing the skin
to dry before taking the resistance readings may damage its integrity.
The initial resistance of the skin with the saline solution was always greater than
50 kΩ, which is an indicator of good intact barrier of the SC in the SDS experiments.
The resistance of the skin sample had dropped 10-fold after the treatment with SDS while
it had dropped by only 1.6-fold when distilled water is used in place of SDS. This
indicates that the chemical had caused some damage to the skin. The chemical might

41
have reduced the barrier resistance of SC by increasing the partitioning into the skin or by
fluidizing the crystalline structure of SC and causing dissolution of SC lipids.
The reliability of the multi-well resistance chamber had significantly improved
from Configuration 1 to Configuration 4, as mentioned earlier. Now, we have a better
system, which is capable of making relatively fast, repeatable, accurate measurements of
the skin resistance for screening potential CPEs.
In order to validate the use of the multi-well resistance chamber in place of FDCs,
the results from the resistance chamber using porcine skin in vitro were compared to
results from the FDC experiments (described below) using:
i) Nicotine as the drug, at a concentration of 100 mg / mL in PBS. Nicotine was
selected because it is a low molecular weight, highly permeating chemical (82). The
experiments with nicotine were performed at room temperature in the both multi-well
resistance chamber and the FDCs.
ii) Decanol, nonanol, oleic acid and lauric acid as the CPEs, each at a
concentration of 5 % (wt / v) in 1:1 PBS and ethanol solution. All four chemicals were
reported in the literature (8, 28) as good penetration enhancers.
Vertical FDCs with an exposure area of 0.64 cm2 were used for validating the
multi-well resistance chamber measurements. Receiver chambers of the diffusion cells
and the resistance chambers were filled with PBS. Donor chambers were filled with 5 %
(wt / v) of decanol, nonanol, oleic acid or lauric acid in 1:1 PBS and ethanol solution.
Experiments were conducted by maintaining the receiver chamber of the diffusion cells at
37 ± 1 oC by a re-circulating water jacket around it. Skin resistance was measured from
the resistance chamber and the FDCs at different time intervals and the RF was

42
determined as mentioned earlier.
In all the above experiments, a donor chamber filled with 1:1 PBS and ethanol
solution alone served as a control. RF values were calculated at different time intervals
(0, 3, 6, 12 and 24 h).
A linear increase in the RF with time was observed in the multi-well resistance
chamber in the presence of nicotine (Figure 25). However, there was no significant
change in RF of the control. RF values from FDCs showed identical behavior. This
suggested that there is no influence of the adjacent wells on skin resistance; thus, the
possibility exists for using the multi-well resistance chamber to perform multiple
experiments simultaneously.
Next, the effect of the CPE was assessed using decanol by performing
experiments in the multi-well chamber and FDC.

43
Figure 25: Validating the resistance chamber with Franz cell in the presence of
nicotine. The error bars correspond to standard deviation. (n=3). FC – Franz
diffusion cell, RC – multi-well resistance chamber.
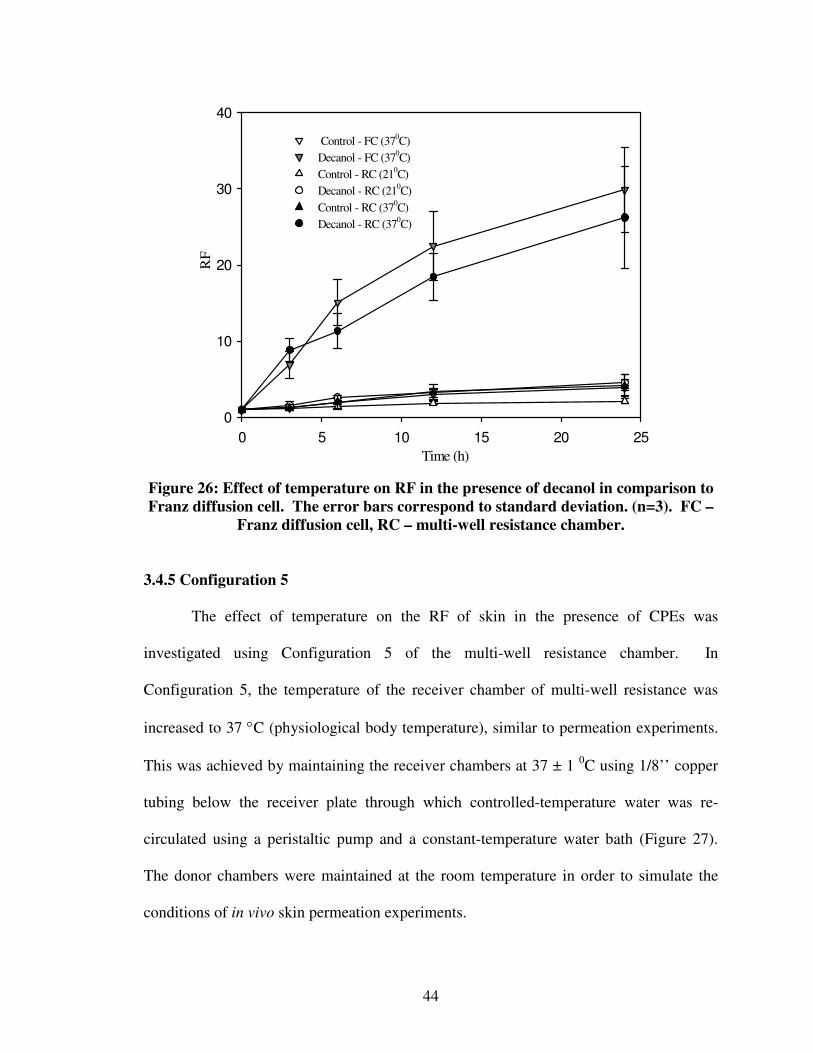
Interestingly, no significant change (Figure 26, RF in the resistance chamber and
FDC in the presence of decanol at 21 °C) was observed in RFs between decanol and
control even after 48 h. Since these experiments were performed at room temperature
(21°C) unlike the permeation experiments, we questioned whether the temperature of the
receiver chamber could affect the permeability or the RFs value of the skin.
Time (h)
0 5 10 15 20 25
RF
0
1
2
3
4
Nicotine - FC
Nicotine - RC
Control - FC
Control - RC
44
Figure 26: Effect of temperature on RF in the presence of decanol in comparison to
Franz diffusion cell. The error bars correspond to standard deviation. (n=3). FC –
Franz diffusion cell, RC – multi-well resistance chamber.
3.4.5 Configuration 5
The effect of temperature on the RF of skin in the presence of CPEs was
investigated using Configuration 5 of the multi-well resistance chamber. In
Configuration 5, the temperature of the receiver chamber of multi-well resistance was
increased to 37 °C (physiological body temperature), similar to permeation experiments.
This was achieved by maintaining the receiver chambers at 37 ± 1 0C using 1/8’’ copper
tubing below the receiver plate through which controlled-temperature water was re-
circulated using a peristaltic pump and a constant-temperature water bath (Figure 27).
The donor chambers were maintained at the room temperature in order to simulate the
conditions of in vivo skin permeation experiments.
Time (h)
0 5 10 15 20 25
RF
0
10
20
30
40
Control - FC (370C)
Decanol - FC (370C)
Control - RC (210C)
Decanol - RC (210C)
Control - RC (370C)
Decanol - RC (370C)

45
Figure 27: Schematic of the resistance chamber with constant temperature water
bath
The RF in the presence of decanol at 37 °C was significantly higher than the
control value. In order to check for the consistency of the results from the resistance
chamber at 37 °C, the results were compared with Franz diffusion cell measurements.
The RFs obtained in multi-well chambers in the presence of decanol and control at 37 °C
was comparable to that obtained using FDC (Figure 26). Further, no increase in RF was
observed when experiments were performed by maintaining the receiver chamber at 21°C
in FDCs. This suggests that the temperature of the receiver chamber significantly
influences RF values. At lower temperatures, (less than 37 ºC) skin resistance might be
higher due to increased rigidity of the lipid bi-layers. At higher temperatures, the
individual lipid molecules may have more vibrational energy, which makes the lipid bi-
layers more fluidic and may offer less resistance. All subsequent experiments were
performed by maintaining the receiver chamber at 37 °C. Experiments were performed
using nonanol, oleic acid and lauric acid to validate the results from the resistance
chamber to the standard FDC. As shown in Figure 28 a, b and c, the results from the
resistance chamber were consistent with the FDCs for all the three CPEs. This final set
up of the multi-well resistance chamber was used to identify potential CPEs using the
46
Time (h)
0 5 10 15 20 25
RF
0
20
40
60
80
100
Control (FC)
Control (RC)
Nonanol (FC)
Nonanol (RC)
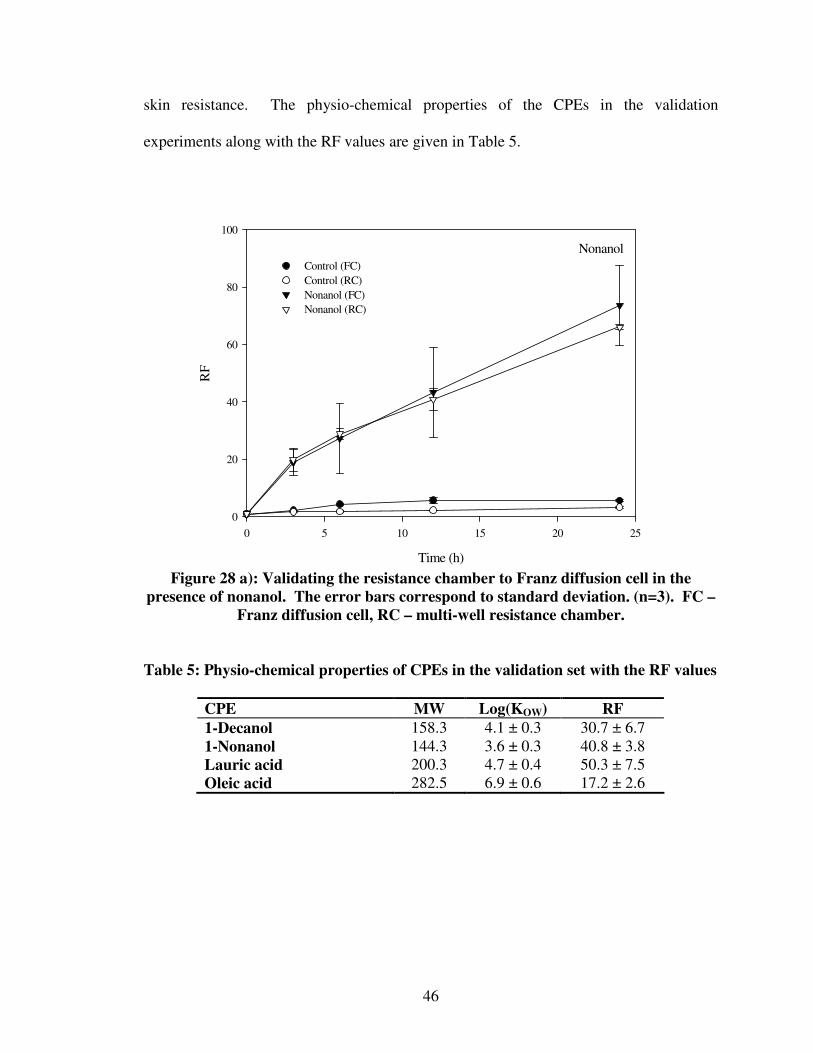
Nonanol
skin resistance. The physio-chemical properties of the CPEs in the validation
experiments along with the RF values are given in Table 5.
Figure 28 a): Validating the resistance chamber to Franz diffusion cell in the
presence of nonanol. The error bars correspond to standard deviation. (n=3). FC –
Franz diffusion cell, RC – multi-well resistance chamber.
Table 5: Physio-chemical properties of CPEs in the validation set with the RF values
CPE MW Log(KOW) RF
1-Decanol 158.3 4.1 ± 0.3 30.7 ± 6.7 1-Nonanol 144.3 3.6 ± 0.3 40.8 ± 3.8 Lauric acid 200.3 4.7 ± 0.4 50.3 ± 7.5 Oleic acid 282.5 6.9 ± 0.6 17.2 ± 2.6

47
Time (h)
0 5 10 15 20 25
RF
0
20
40
60
80
Control (FC)
Control (RC)
Lauric Acid (FC)
Lauric Acid (RC)
Lauric Acid
Figure 28 b): Validating the resistance chamber to Franz diffusion cell in the
presence of lauric acid. The error bars correspond to standard deviation. (n=3). FC
– Franz diffusion cell, RC – multi-well resistance chamber.
Figure 28 c): Validating the resistance chamber to Franz diffusion cell in the
presence of oleic acid. The error bars correspond to standard deviation. (n=3). FC
– Franz diffusion cell, RC – multi-well resistance chamber.
Oleic Acid
Time (h)
0 5 10 15 20 25
RF
0
20
40
60
80
Control (FC)
Control (RC)
Oleic Acid (FC)
Oleic Acid (RC)

48
CHAPTER IV
EVALUATION OF CHEMICAL PENETRATION ENHANCERS
4.1 Virtual Design of CPEs
In order to expedite the process of identifying potential CPEs, researchers have
resorted to computer aided techniques, such as computer-aided molecular design
(CAMD) (83), for a rational design to select candidate CPEs for experimentation.
Potential CPEs were virtually generated using computer aided molecular design
techniques (34) in which molecular generation of the CPEs was done using robust genetic
algorithms and physio-chemical properties such as skin penetration coefficient, octanol-
water partition coefficient, melting point (29), and skin sensitization using quantitative
structure property relationships. Forty two potential CPEs were virtually generated by
OSU Thermodynamics Group, which were divided into three groups according to their
hierarchy and source. These groups include:
Preliminary set: This set consists of CPEs which were generated using genetic
algorithms by Godavarthy (84-86). Seven potential CPEs were virtually generated using
reliable models, which were developed and validated for properties including (a) octanol-
water partition coefficient, (b) melting point, (c) aqueous solubility, (d) skin permeation
and (e) skin irritation of the molecules.
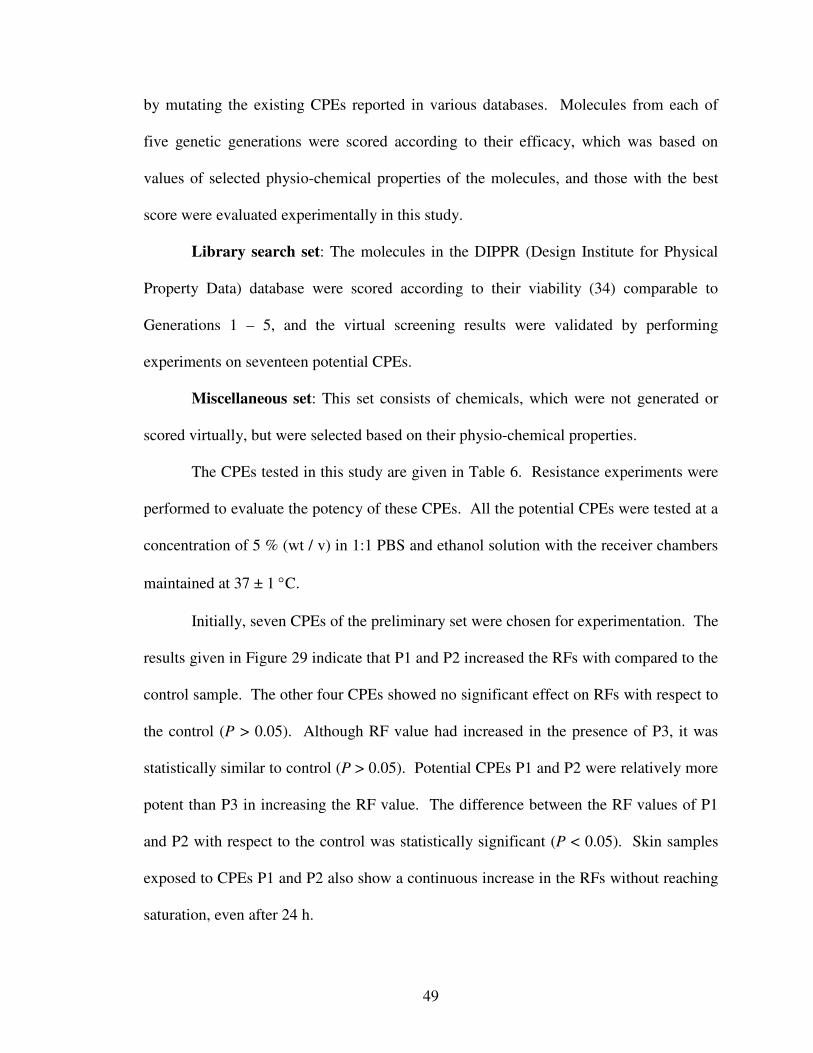
Generations 1 - 5: CPEs in these groups were virtually generated by Golla (34),
49
by mutating the existing CPEs reported in various databases. Molecules from each of
five genetic generations were scored according to their efficacy, which was based on
values of selected physio-chemical properties of the molecules, and those with the best
score were evaluated experimentally in this study.
Library search set: The molecules in the DIPPR (Design Institute for Physical
Property Data) database were scored according to their viability (34) comparable to
Generations 1 – 5, and the virtual screening results were validated by performing
experiments on seventeen potential CPEs.
Miscellaneous set: This set consists of chemicals, which were not generated or
scored virtually, but were selected based on their physio-chemical properties.
The CPEs tested in this study are given in Table 6. Resistance experiments were
performed to evaluate the potency of these CPEs. All the potential CPEs were tested at a
concentration of 5 % (wt / v) in 1:1 PBS and ethanol solution with the receiver chambers
maintained at 37 ± 1 °C.
Initially, seven CPEs of the preliminary set were chosen for experimentation. The
results given in Figure 29 indicate that P1 and P2 increased the RFs with compared to the
control sample. The other four CPEs showed no significant effect on RFs with respect to
the control (P > 0.05). Although RF value had increased in the presence of P3, it was
statistically similar to control (P > 0.05). Potential CPEs P1 and P2 were relatively more
potent than P3 in increasing the RF value. The difference between the RF values of P1
and P2 with respect to the control was statistically significant (P < 0.05). Skin samples
exposed to CPEs P1 and P2 also show a continuous increase in the RFs without reaching
saturation, even after 24 h.

50
Table 6: CPEs used in this study
Group CPE Group CPE
Preliminary Set P1 Generation 4 OSU16 P2 OSU17
P3 Generation 5 OSU18
P4 Library Search OSU19 P5 Set OSU21 P6 OSU22 P7 OSU23
Generation 1 OSU1 OSU24 OSU2 OSU25 OSU3 OSU26 OSU4 OSU27 OSU5 OSU28 OSU6 OSU29 OSU7 OSU30 OSU9 OSU31
Generation 2 OSU10 OSU32 OSU11 OSU33 OSU12 OSU34
Generation 3 OSU13 Miscellaneous OSU35
OSU14 OSU36 OSU15 OSU37
Figure 29: RFs of the CPEs from preliminary set. The error bars correspond
to standard deviation. (n=3).
Time (h)
0 5 10 15 20 25
RF
0
10
20
30
Control
P1
P2
P3
P4
P5
P6
P7

51
The current experiments also indicate that the testing time can be reduced from 24
h to 6 h without a significant change in the outcome. Using a reduced experimentation
time (6 h), chemicals P1 and P2 showed significant increase in RFs (RFs of P1 and P2
were three times greater than the control value even at 6 h) with respect to the control.
This permits more experiments to be performed in a given time period, thus leading to a
higher throughput. Therefore, the experimentation time was reduced to six hours for all
the subsequent experiments.
Next, the CPEs from the Generation 1 were tested for their potency. Figure 30
shows the results from the experiments. From the eight CPEs tested four (OSU2, OSU3,
OSU6 and OSU7) showed some potential, of which two (OSU1 and OSU2) were very
promising in increasing the RF as compared with the control. Moreover, the RF values
from CPEs OSU1 and OSU2 were more statistically significant (P < 0.05) than the CPEs
OSU6 and OSU7 relative to control.
OSU10 and OSU12 have shown more significant potential (P < 0.05, for the three
CPEs relative to control) than OSU11 (P > 0.05, with respect to control) in Generation 2
(Figure 31). The RFs of the CPEs OSU10 and OSU12 were ~55 in 6 h, which was
approximately 15 times better than the control. This shows that both CPEs have reduced
the barrier resistance of the SC nearly 15 times more than the control; thus, they can play
a potential role in increasing the penetration of a drug through skin.
A significant jump in the RF value was observed between 3 h and 4 h with the
skin sample exposed to OSU10 (Figure 31). This phenomenon may be attributed to the
dissolution of SC lipid by the CPE resulting in greater drug permeation through skin. In
this case, OSU10 might have slowly dissolved the SC lipids in the first three hours, and

52
Figure 30: RFs of the CPEs from Generation 1. The error bars correspond to
standard deviation. (n=3).
Figure 31: RFs of the CPEs from Generation 2. The error bars correspond to
standard deviation. (n=3).
Time (h)
0 1 2 3 4 5 6 7
RF
0
10
20
30
40
Control
OSU 1
OSU 2
OSU 3
OSU 4
OSU 5
OSU 6
OSU 7
OSU 9
Time (h)
0 1 2 3 4 5 6 7
RF
0
10
20
30
40
50
60
70
Control
OSU 10
OSU 11
OSU 12

53
after finding significant pathways through the tortuous lipid layers, it might have
enhanced the movement of current ions through skin. Hence, a significant drop in skin
resistance was observed between 3 h and 4 h with OSU10, which resulted in a raise in the
RF value. After this marked increase, the RF value remained nearly constant for the
remainder of the test period, which shows that the effect of the CPE had reached
saturation.
Among all the CPEs in Generations 2 - 5, only OSU15 showed a significant
increase in the RF with relative to control (P < 0.05). In fact, OSU15 yielded the highest
RF value (~ 80), as shown in Figure 32. OSU14 also showed a slight increase in the RF
with respect to the control.
Figure 32: RFs of the CPEs from Generations 3, 4 and 5. The error bars
correspond to standard deviation. (n=3).
Time (h)
0 1 2 3 4 5 6 7
RF
0
20
40
60
80
100
Control
OSU13
OSU14
OSU15
OSU16
OSU17
OSU18

54
The RF values for CPEs from the Library search group and the Miscellaneous set
are shown in Figures 33 a and 33 b. The results indicate that ten CPEs (OSU25, OSU26,
OSU28, OSU29, OSU30, OSU33, OSU34, OSU35, OSU36 and OSU37) had effectively
increased the RF values relative to the control sample. The RFs of the ten CPEs were
statistically significant (P < 0.05) with respect to the control. The other eight CPEs
showed no significant effect or little effect in reducing the barrier resistance of the skin
with respect to the control (P > 0.05). There was a significant raise in the RF of the skin
sample exposed to OSU34 after 3 h. This phenomenon can be explained by the SC lipid
dissolution mechanism, described earlier dealing with OSU10 of Generation 1. However,
in this case, there was a continuous increase in the RF value throughout the test period.
The continuous increase in the RF of skin with OSU34 after 3 h supports the hypothesis
that a CPE can enhance drug permeation in many ways, as explained by Barry and
Williams (15). OSU34 should be promoting the movement of current through skin by
two mechanisms, which include dissolving the SC lipids and softening the impermeable
layers of SC.
There was a rapid increase in the RF in the presence of OSU30 for three hours,
which can be due to the dissolution of SC lipids (Figure 33 b). A rapid reduction in RF
was observed after three hours. This can be due to the hindered free movement of the
current ions through skin due to the CPE.
Table 7 shows the RFs of all the CPEs investigated in this study with their physio-
chemical properties.

55
Figure 33 a): RFs of the CPEs from Library search set. The error bars correspond
to standard deviation. (n=3).
Figure 33 b): RFs of the CPEs from Library search set and miscellaneous set.
The error bars correspond to standard deviation. (n=3).
Time (h)
0 1 2 3 4 5 6 7
RF
0
5
10
15
20
Control
OSU 19
OSU 21
OSU 22
OSU 23
OSU 24
OSU 25
OSU 26
OSU 27
OSU 29
Time (h)
0 1 2 3 4 5 6 7
RF
0
20
40
60
80
100
120
Control
OSU 28
OSU 30
OSU 31
OSU 32
OSU 33
OSU 34
OSU 35
OSU 36
OSU 37
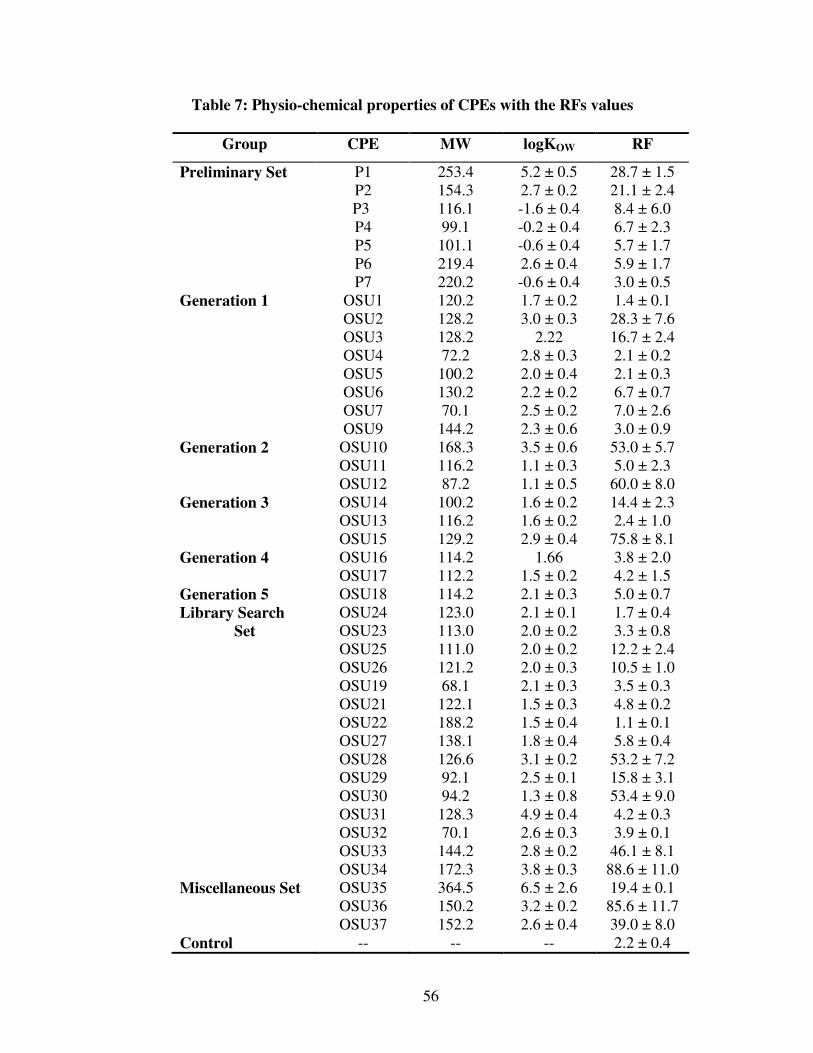
56
Table 7: Physio-chemical properties of CPEs with the RFs values
Group CPE MW logKOW RF
Preliminary Set P1 253.4 5.2 ± 0.5 28.7 ± 1.5 P2 154.3 2.7 ± 0.2 21.1 ± 2.4 P3 116.1 -1.6 ± 0.4 8.4 ± 6.0 P4 99.1 -0.2 ± 0.4 6.7 ± 2.3 P5 101.1 -0.6 ± 0.4 5.7 ± 1.7 P6 219.4 2.6 ± 0.4 5.9 ± 1.7 P7 220.2 -0.6 ± 0.4 3.0 ± 0.5 Generation 1 OSU1 120.2 1.7 ± 0.2 1.4 ± 0.1 OSU2 128.2 3.0 ± 0.3 28.3 ± 7.6 OSU3 128.2 2.22 16.7 ± 2.4 OSU4 72.2 2.8 ± 0.3 2.1 ± 0.2 OSU5 100.2 2.0 ± 0.4 2.1 ± 0.3 OSU6 130.2 2.2 ± 0.2 6.7 ± 0.7 OSU7 70.1 2.5 ± 0.2 7.0 ± 2.6 OSU9 144.2 2.3 ± 0.6 3.0 ± 0.9 Generation 2 OSU10 168.3 3.5 ± 0.6 53.0 ± 5.7 OSU11 116.2 1.1 ± 0.3 5.0 ± 2.3 OSU12 87.2 1.1 ± 0.5 60.0 ± 8.0 Generation 3 OSU14 100.2 1.6 ± 0.2 14.4 ± 2.3 OSU13 116.2 1.6 ± 0.2 2.4 ± 1.0 OSU15 129.2 2.9 ± 0.4 75.8 ± 8.1 Generation 4 OSU16 114.2 1.66 3.8 ± 2.0 OSU17 112.2 1.5 ± 0.2 4.2 ± 1.5 Generation 5 OSU18 114.2 2.1 ± 0.3 5.0 ± 0.7 Library Search OSU24 123.0 2.1 ± 0.1 1.7 ± 0.4
Set OSU23 113.0 2.0 ± 0.2 3.3 ± 0.8 OSU25 111.0 2.0 ± 0.2 12.2 ± 2.4 OSU26 121.2 2.0 ± 0.3 10.5 ± 1.0 OSU19 68.1 2.1 ± 0.3 3.5 ± 0.3 OSU21 122.1 1.5 ± 0.3 4.8 ± 0.2 OSU22 188.2 1.5 ± 0.4 1.1 ± 0.1 OSU27 138.1 1.8 ± 0.4 5.8 ± 0.4 OSU28 126.6 3.1 ± 0.2 53.2 ± 7.2 OSU29 92.1 2.5 ± 0.1 15.8 ± 3.1 OSU30 94.2 1.3 ± 0.8 53.4 ± 9.0 OSU31 128.3 4.9 ± 0.4 4.2 ± 0.3 OSU32 70.1 2.6 ± 0.3 3.9 ± 0.1 OSU33 144.2 2.8 ± 0.2 46.1 ± 8.1 OSU34 172.3 3.8 ± 0.3 88.6 ± 11.0 Miscellaneous Set OSU35 364.5 6.5 ± 2.6 19.4 ± 0.1 OSU36 150.2 3.2 ± 0.2 85.6 ± 11.7 OSU37 152.2 2.6 ± 0.4 39.0 ± 8.0 Control -- -- -- 2.2 ± 0.4

57
4.2 Correlating the RFs with permeability coefficients
Although potential CPEs can be identified by using the resistance technique,
drugs with a range of lipophilic characteristics and molecular weights have to be
considered for validating the technique. Therefore, the RF values of few CPEs were
correlated with the permeability coefficients of two drugs, melatonin and insulin in the
presence of the respective CPE reported in the literature. Melatonin and insulin were
used for this study because they belong to two different classes of drugs, one being
hydrophobic and the other hydrophilic with a significant difference between their
molecular weights.
4.2.1 Correlating the RFs with permeability coefficients of melatonin
Melatonin is a weakly hydrophobic drug molecule with octanol / water partition
coefficient, log(KOW) of 1.2 and molecular weight of 232.28 Da (87). The KP values of
melatonin through porcine skin in vitro were obtained from the literature (10, 33, 88).
The permeability factor, defined as the ratio of the permeability coefficient obtained from
the potential enhancer to that of the control, was calculated as follows:
(Control)P
CPE)P(
K
KFactorty Permeabili =
Then the permeability factors of the CPEs considered were compared to the RFs
obtained from the resistance chamber. The normalized RFs and permeability factors of
melatonin in the presence of the respective CPE were given in Table 8. RF values
obtained from the resistance chamber after 24 h were plotted against the permeability
factors for the selected CPEs. A regression line was drawn through all the points. The
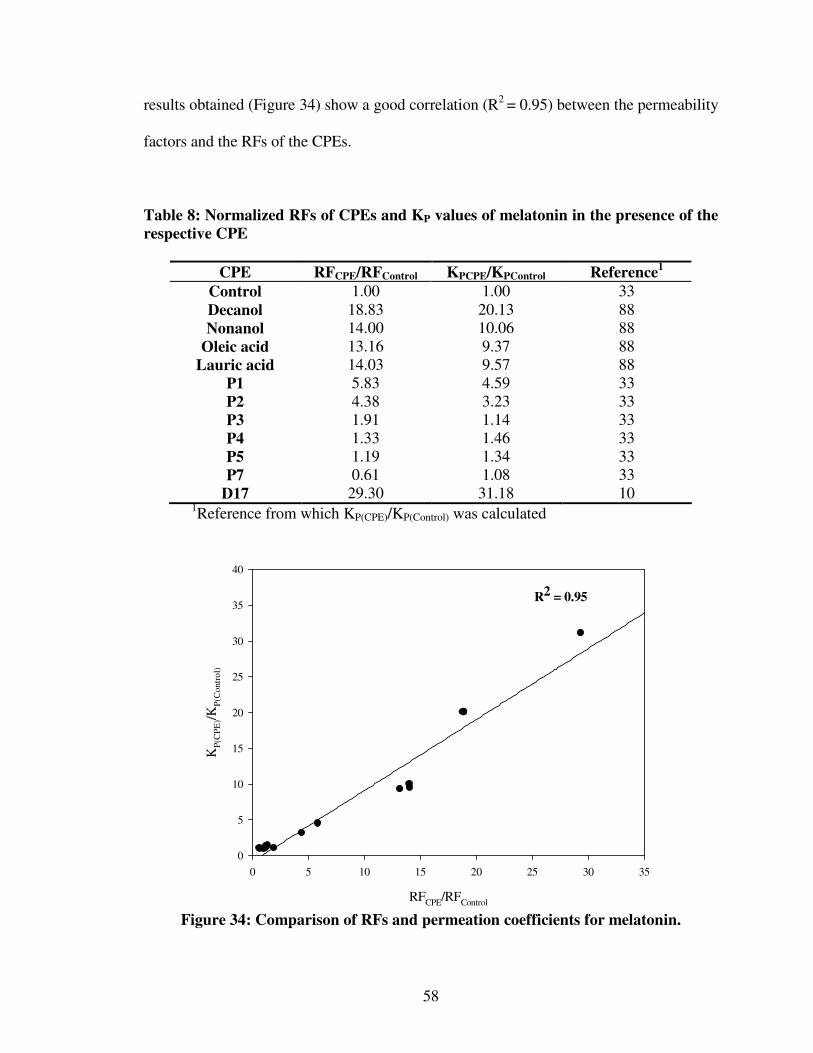
58
results obtained (Figure 34) show a good correlation (R2 = 0.95) between the permeability
factors and the RFs of the CPEs.
Table 8: Normalized RFs of CPEs and KP values of melatonin in the presence of the
respective CPE
CPE RFCPE/RFControl KPCPE/KPControl Reference1
Control 1.00 1.00 33 Decanol 18.83 20.13 88 Nonanol 14.00 10.06 88
Oleic acid 13.16 9.37 88 Lauric acid 14.03 9.57 88
P1 5.83 4.59 33 P2 4.38 3.23 33 P3 1.91 1.14 33 P4 1.33 1.46 33 P5 1.19 1.34 33 P7 0.61 1.08 33
D17 29.30 31.18 10 1Reference from which KP(CPE)/KP(Control) was calculated
Figure 34: Comparison of RFs and permeation coefficients for melatonin.
RFCPE
/RFControl
0 5 10 15 20 25 30 35
KP
(CP
E)/K
P(C
ontr
ol)
0
5
10
15
20
25
30
35
40
R2 = 0.95

59
4.2.2 Correlating the RFs with permeability coefficients of insulin
Insulin is a strongly hydrophilic drug molecule with octanol / water partition
coefficient, log (KOW) of –1.76 and molecular weight of 5808 Da. The KP values of
insulin through porcine skin in vitro were obtained from Yerramsetty (32, 35) of the OSU
Thermodynamics Research Group. Then the permeability factors of insulin in the
presence of the CPEs considered were compared to the RFs obtained from the resistance
chamber.
Although, there is no exact linear relation between the RF and Kp values of each
enhancer from the resistance technique and the permeation experiments respectively (R2
=0.075, Figure 35), all the CPEs which had a RF value greater than three times the
control value had enhanced the permeation of insulin through skin.
Figure 35: Comparison of RFs and permeation coefficients for insulin. The
error bars correspond to standard deviations for three experiments
RFCPE
/ RFControl
0 10 20 30 40 50
KP
(CP
E) /
KP
(Co
ntr
ol)
0
10
20
30
40
R2 = 0.075

60
The horizontal and vertical lines in the Figure 35 are the threshold values for
permeability factor and resistance reduction factor respectively. The threshold value for
resistance reduction factor wrt control was set at 3, which suggests that the CPEs which
cross this threshold value were able to reduce the barrier resistance of skin three times
better than the control. A value of 2 was set for the threshold value of permeability
factor, which suggests that the CPEs which cross this threshold value were twice as better
as the control, in enhancing the permeation of the drug through skin. All the CPEs,
which have a RFCPE / RFControl higher than the threshold value, had a permeability factor
of at least twice the control.
4.3 Histological studies
The use of potent CPEs is generally limited by their toxicity. Therefore,
histological assessments were performed using potent CPEs from preliminary set and the
Generations 1 – 5, to test the toxic effects of the CPEs on skin.
Porcine skin samples were exposed to 5 % (wt / V) of the CPE on the SC side and
with PBS on the dermis side for 48 h. The dermis was maintained at 37 °C and the SC at
room temperature (21 °C) as in resistance experiments. The skin samples were fixed in
1.5 % buffered formalin at room temperature, dehydrated in graded ethanol and then
embedded in paraffin. The embedded samples were cut into 6 µm sections using
microtome. These sections were then stained with Hemotoxylin and Eosin and digital
photomicrographs were taken at representative regions using a Nicon E800 microscope.
Morphological changes in the skin (especially in the epidermal layers) after
treating the skin samples with the CPEs were observed visually and graded into four

61
classes from A - D, similar to a procedure reported recently (87) on rat epidermal
keratinocyte organotypic cultures: Class A – non toxic (when the morphology of the
sample looks essentially identical to the control). Class B – slightly toxic (when the
morphology looks very similar to the control sample with minor differences). Class C –
toxic (when there is partial epidermal degradation with nuclei bleeding into the dermal
layers). Class D – severely toxic (when there is severe epidermal degradation with cell
death). Table 9 shows the CPEs graded according to their effect on the morphology of
the skin. Figures 36, 37 and 38 show the histological skin sections exposed to CPEs.
The grades of the CPEs can be seen on the right hand botton of each skin sample.
Table 9: Histological evaluation of the CPEs
CPE Grade CPE Grade
Decanol B P4 B
Nonanol B P5 C
Oleic acid A OSU2 A
Lauric acid B OSU3 B
P1 A OSU10 B
P2 D OSU12 C
P3 A OSU14 A
Nonanol had slightly disrupted the epidermal papilla, which can be clearly seen
from Figure. 36. The nuclei of the cells from the epidermis are slightly bleeding in to the
dermis, inferring that nonanol might be slightly harmful to the skin at the concentration
used. The morphology of the skin samples exposed to oleic acid looks almost like the
control sample indicating that it is a non-toxic enhancer. No damage is done to the skin

62
cells by this CPE. There were some disruptions in the epidermal layer in the skin section
exposed to lauric acid, indicating that it might be slightly harmful to the skin as shown in
Figure 36.
Figure 37 shows the histological skin sections of the porcine skin exposed to
CPEs from the preliminary set. CPEs P1, P3 and P4 did not alter the structure of the
epidermal layers, indicating their non-toxicity. But partial epidermal degradation was
found with the nuclei bleeding in to the dermis from skin sample exposed to P5, which
indicates its moderate toxicity on skin cells. There was severe epidermal degradation
with complete cell death with skin exposed to P2, which makes it a very toxic enhancer.
CPEs OSU2 and OSU14 were nontoxic as there were no significant changes in
the morphology of the skin samples (Figure 39). OSU10 was moderately toxic with
nuclei from the epidermis slightly bleeding in to the dermis. Dispersed and degraded
epidermal layers were found in the skin samples exposed to OSU12, which makes it a
toxic enhancer.

63
Figure 36: Histological cross section of porcine skin exposed to CPEs in
validation set

64
Figure 37: Histological cross section of porcine skin exposed to CPEs in
preliminary set
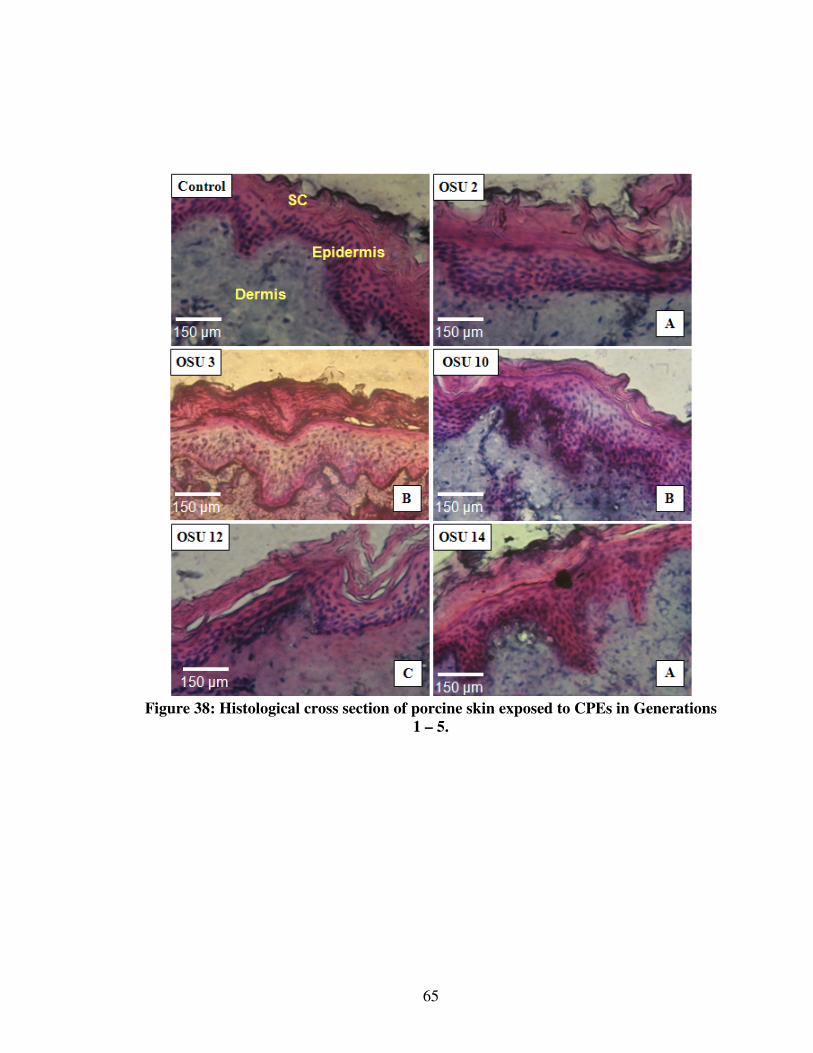
65
Figure 38: Histological cross section of porcine skin exposed to CPEs in Generations
1 – 5.

66
CHAPTER V
DISCUSSION
In this study, the utility of the electrical resistance of skin in a novel multi-well
resistance chamber was investigated to identify potential CPEs and to increase the rate at
which data can be obtained. First, the highly permeating, well investigated nicotine (82)
was used to compare the RF values from the multi-well resistance chamber and a FDC.
There was a good agreement between the two. The results also demonstrated that there is
no influence of the adjacent wells on the resistance measurements. Also, a higher
difference could be observed in the RFs of control and nicotine at 37 ºC than at room
temperature.
To investigate the effect of temperature on RF values, experiments were
performed on decanol while maintaining the receiver chambers at 37 ºC and 21 ºC. As
shown in Figure 27, a significant difference in the RF values was observed for 37 ºC and
21 ºC. Although others have reported the utility of resistance technique in screening the
CPEs (26, 27), they did not compare with the traditional FDC experiments and they did
not maintain the receiver chamber at 37 ºC, similar to the permeation experiments.
Our findings support similar observations in the literature (89) that temperature
plays a significant role in assessing the barrier characteristics of skin in the presence of
CPEs. Therefore, experiments designed to identify potential CPEs should be performed
67
at temperature conditions consistent with those of permeation experiments. The electrode
set-up reported in the literature (26) to measure the electrical properties may introduce
significant variability since the common electrode was inserted into the dermis of the
skin. The length of insertion, as well as the path length of electrical conductivity, could
vary from well to well. Thus, this type of electrode set-up could have significant
influence on the resistance measurements. The potential problem was avoided in our
study by inserting the common electrode in an electrolyte bath, ensuring that length of
current travel is equal in all the wells.
Using the multi-well resistance chamber, nineteen potential CPEs were identified
from the forty two tested. The results from the pre-screening technique were confirmed
by comparing them with the permeation data of the drugs, melatonin and insulin. There
was a good correlation between the RFs of the CPEs and the permeability coefficients of
melatonin in the presence of the respective CPEs. However, more data distributed
uniformly over the correlation range would be required to confirm this finding with the
melatonin.
Although, there is no exact linear relation between the RF values and permeation
data of insulin, the pre-screening technique was successful in identifying potential
enhancers. These results indicate that, using the resistance technique, potential CPE’s
can be effectively pre-screened from a larger pool of chemicals, thus reducing the time
required to conduct the permeability studies. For example, CPEs which have a RF less
than three times the control value can be avoided during the permeation experiments
since they were not effective at the concentrations used. Actually, a better strategy would
be to examine the behavior of these chemicals at higher concentrations. Also, by using
68
the resistance technique, CPEs can be tested in the absence of the drug considered, which
can be useful in understanding the CPE interactions with the skin.
However, using the resistance technique, we cannot predict the extent to which a
CPE can enhance the permeation of a drug. For example, one can expect that OSU34,
which was identified as most potent CPE using the resistance technique, would also be
the best CPE in terms of enhancing the permeation of a drug through skin. However,
OSU29, which had a lesser RF value, effectively enhanced the permeation of insulin
through porcine skin than OSU34 (32). This can be due to the fact that, using the
resistance technique, we are determining the potency of the CPEs based on the movement
of the current ions through skin, which are very small, when compared to the drug
molecules. And the enhancement abilities of CPEs usually depend on the properties of
the drug such as molecular weight and lipophilic characteristics. Therefore, drugs with a
range of lipophilic behavior and molecular weights should be carefully selected and
experiments should be performed to better understand the utility of resistance technique
with different classes of drugs. Nevertheless, the pre-screening technique was able to
successfully predict the CPEs that would enhance permeation of insulin through skin, and
it can be used as a ‘coarse’ method for quickly identifying CPEs that would significantly
alter the barrier properties of skin.
Experimental variability usually associated with biological experiments was
minimized by storing the skin at −20 ºC instead of −80 ºC and by checking the integrity
of the skin samples prior to each experiment. Porcine skin from the same breed and sex
was maintained throughout the experiments. The experiments were performed in a
saturated environment to avoid the evaporation of the PBS from the Petri dish.

69
The use of the potent CPEs is not only limited by their toxic effects as mentioned
in this study. Skin sensitization, corrosion and irritation are the other factors, which can
limit their use in TDD (90). Skin sensitization generally occurs when skin is exposed to a
toxic substance, which causes allergic reactions like erythema (redness), vesicles,
papules, scaling, and pruritus (itching). If the skin’s exposure to a toxic chemical results
in tissue necrosis, it is termed as corrosion, which is irreversible. Skin corrosion causes
ulcers, bleeding, bloody scabs, and discoloration. Skin irritation is caused when toxic
substances affect the viable epidermis by triggering various inflammatory responses.
Development of rashes, inflammation, swelling, scaling, and abnormal tissue growth are
the clinical signs of skin irritation and this is a reversible process unlike skin corrosion.
Therefore, the problems related to skin sensitization, corrosion and irritation should be
carefully considered and addressed in order to confirm the safety of the CPEs before
using them for TDD.

70
CHAPTER V
CONCLUSIONS AND RECOMMENDATIONS
5.1 Conclusions
1. A rapid high throughput pre-screening technique was explored with success in
order to identify potential CPEs for TDD.
2. A novel multi-well resistance chamber was build and optimized to perform the
experiments at conditions similar to standard permeation experiments.
3. Using the pre-screening technique nineteen potential CPEs were identified out of
the forty two tested.
4. The pre-screening technique was validated by comparing the results with the
permeation data of drugs, melatonin and insulin.
5. Although a linear relation between the resistance and permeation data does not
exist, all the CPEs, which had a RF value greater than three times the control
value, were able to enhance the permeation of insulin through full thickness
porcine skin in vitro.
6. Out of the total potential CPEs in preliminary set and Generations 1 - 5, three of
them were identified as toxic to the skin using histology.

71
5.2 Recommendations
5.2.1 Future experimental design strategy
A systematic approach is necessary when designing the strategy for conducting
experiments in order to identify potential CPEs for TDD. The use of crude trial-and-error
methods results in a time consuming and economically inefficient experimental design
strategy. The resistance technique used in this study can improve the throughput from
the experiments by eliminating the chemicals which are not potent, thereby reducing the
effort to perform the more rigorous permeation experiments in the presence of different
types of solutes. However, resistance experiments should be performed using the
enhancers at different concentrations in order to find the optimum concentration at which
the enhancer is non-toxic and still potent. For instance, the CPEs, which are potent in
this study, may be toxic to the skin cells at the concentration used, but may be non-toxic
at lower concentrations and still be a potent enhancer. The experimental design for
identifying potential CPEs at non-toxic concentrations can be optimized effectively using
the strategy shown in Figure 39.
Initially, the potential CPEs can be generated virtually using computer aided
molecular design techniques as described in the Section 4.1. Next, the resistance
experiments should be performed using the virtually generated CPEs at a concentration of
5 % (wt / v). If the resistance reduction factor, RF of the CPE is greater than three times
the control value, toxicity studies should be performed with the CPE at the respective
concentration. If the CPE is non-toxic, permeation studies should be conducted with
different solutes in the presence of the CPE. If the CPE had enhanced the permeation of
solute through skin, the properties of the CPE should be put into the virtual algorithm,

72
which generates the potential CPEs for the next generation. In this process, if the CPE is
either non-potent (RF < three times the control value) or toxic, an optimum
concentration, COPT should be found at which the CPE is potent and non toxic using the
resistance technique and the toxicity assessments.
Figure 39: Future experimental design strategy
5.2 Use of multiple CPEs
Careful attention is required when using CPEs for TDD. Many CPEs, which are
potent enhancers, are very toxic or known for their irritating effect when in contact with
the viable layers of the skin. For example, surfactants are known to breach the barrier

73
properties of the skin very effectively; however they are very toxic. In this scenario,
combination of enhancers is one of the solutions to the issue. There are reports, which
claim that use of combination of enhancers / vehicles is better than the individual
enhancers (25, 27, 57, 91). The random mixtures, which were formed from the
combination of multiple enhancers, are likely to exhibit the additive properties of their
individual constituents. The potency and irritancy of these mixtures can be the average
of its corresponding single components. For example, if a chemical X is highly potent
and toxic and chemical Y is less potent and non-toxic, then the combination mixture from
these chemicals can be a moderately potent mixture with less toxicity / irritancy, which
might effectively breach the skin’s barrier for few drugs.
Therefore, research should be directed to investigate the effect of multiple CPEs
to increase the performance of CPEs for TDD.

74
REFERENCES
1. S.A. Gallo, A.R. Oseroff, P.G. Johnson, and S.W. Hui. Characterization of electric-pulse-induced permeabilization of porcine skin using surface electrodes. Biophys J. 72:2805-2811 (1997).
2. P. Karande, A. Jain, and S. Mitragotri. Relationships between skin's electrical impedance and permeability in the presence of chemical enhancers. J Control
Release. 110:307-313 (2006). 3. M.R. Prausnitz, S. Mitragotri, and R. Langer. Current status and future potential
of transdermal drug delivery. Nat Rev Drug Discov. 3:115-124 (2004). 4. Transdermal Drug Delivery - Technologies, Markets, and Companies.
http://www.researchandmarkets.com/reports/39074. 5. G. Chopda. Transdermal Drug Delivery Systems : A Review.
http://www.pharmainfo.net/reviews/transdermal-drug-delivery-systems-review (accessed 06/10 2008).
6. T. Pongjanyakul, S. Prakongpan, and A. Priprem. Permeation studies comparing cobra skin with human skin using nicotine transdermal patches. Drug Dev. Ind.
Pharm. 26:635-642 (2000). 7. B.W. Richard, F. Kochinke, and C. Huang. Novel transdermal nicotine patch,
Pharmetrix Corporation (Menlo Park, CA), United States, 1989. 8. S. Andega, N. Kanikkannan, and M. Singh. Comparison of the effect of fatty
alcohols on the permeation of melatonin between porcine and human skin. J
Control Release. 77:17-25 (2001). 9. R. Aboofazeli, H. Zia, and T.E. Needham. Transdermal delivery of nicardipine:
an approach to in vitro permeation enhancement. Drug Deliv. 9:239-247 (2002). 10. N. Kanikkannan, K. Kandimalla, S.S. Lamba, and M. Singh. Structure-activity
relationship of chemical penetration enhancers in transdermal drug delivery. Curr
Med Chem. 7:593-608 (2000). 11. S.K. Rastogi and J. Singh. Passive and iontophoretic transport enhancement of
insulin through porcine epidermis by depilatories: permeability and fourier transform infrared spectroscopy studies. AAPS Pharm. Sci. Tech. 4:E29 (2003).
12. S. Mitragotri, D. Ray, J. Farrell, H. Tang, B. Yu, J. Kost, D. Blankschtein, and R. Langer. Synergistic effect of low-frequency ultrasound and sodium lauryl sulfate on transdermal transport. J Pharm Sci. 89:892-900 (2000).
13. H. Tang, D. Blankschtein, and R. Langer. Effects of low-frequency ultrasound on the transdermal permeation of mannitol: Comparative studies with in vivo and in vitro skin. J Pharm Sci. 91:1776-1794 (2002).

75
14. M.R. Prausnitz, V.G. Bose, R. Langer, and J.C. Weaver. Electroporation of mammalian skin: a mechanism to enhance transdermal drug delivery. Proc. Natl.
Acad. Sci. 90:10504-10508 (1993). 15. B.W. Barry and A.C. Williams. Permeation enhancement through skin. Enc.
Pharm. Tech. :449-493 (1995). 16. C.Y. Goates and K. Knutson. Enhanced permeation of polar compounds through
human epidermis. I. Permeability and membrane structural changes in the presence of short chain alcohols. Biochim Biophys Acta. 1195:169-179 (1994).
17. G.C. Santus and R.W. Baker. Transdermal enhancer patent literature. J Control
Release. 25:1-20 (1993). 18. B.W. Barry. Novel mechanisms and devices to enable successful transdermal
drug delivery. Eur J Pharm. Sci. 14:101-114 (2001). 19. A. Nokhodchi, J. Shokri, A. Dashbolaghi, D. Hassan-Zadeh, T. Ghafourian, and
M. Barzegar-Jalali. The enhancement effect of surfactants on the penetration of lorazepam through rat skin. Int J Pharm. 250:359-369 (2003).
20. L.M. Nolan, J. Corish, O.I. Corrigan, and D. Fitzpatrick. Iontophoretic and chemical enhancement of drug delivery. Part I: across artificial membranes. Int J
Pharm. 257:41-55 (2003). 21. R.E. Baynes, J.D. Brooks, M. Mumtaz, and J.E. Riviere. Effect of chemical
interactions in pentachlorophenol mixtures on skin and membrane transport. Toxicol Sci. 69:295-305 (2002).
22. D.J. Davies, R.J. Ward, and J.R. Heylings. Multi-species assessment of electrical resistance as a skin integrity marker for in vitro percutaneous absorption studies. Toxicol In Vitro. 18:351-358 (2004).
23. W.J. Fasano and P.M. Hinderliter. The Tinsley LCR Databridge Model 6401 and electrical impedance measurements to evaluate skin integrity in vitro. Toxicol In
Vitro. 18:725-729 (2004). 24. J.H. Fentem, G.E.B. Archer, M. Balls, P.A. Botham, R.D. Curren, L.K. Earl, D.J.
Esdaile, H.G. Holzhutter, and M. Liebsch. The ECVAM International Validation Study on In Vitro Tests for Skin Corrosivity. 2. Results and Evaluation by the Management Team. Toxicol In Vitro. 12:483-524 (1998).
25. P. Karande, A. Jain, and S. Mitragotri. Discovery of transdermal penetration enhancers by high-throughput screening. Nat Biotechnol. 22:192-197 (2004).
26. P. Karande and S. Mitragotri. High throughput screening of transdermal formulations. Pharm Res. 19:655-660 (2002).
27. S. Pappinen, S. Tikkinen, S. Pasonen-Seppanen, L. Murtomaki, M. Suhonen, and A. Urtti. Rat epidermal keratinocyte organotypic culture (ROC) compared to human cadaver skin: the effect of skin permeation enhancers. Eur J Pharm Sci. 30:240-250 (2007).
28. K. Kandimalla, N. Kanikkannan, S. Andega, and M. Singh. Effect of Fatty acids on the Permeation of Melatonin across Rat and Pig Skin In-vitro and on the Transepidermal Water Loss in Rats In-vivo. J Pharm Pharmacol. 51:783-790 (1999).
29. S.S. Godavarthy, R.L. Robinson, and K.A.M. Gasem. An improved structure-property model for predicting melting-point temperatures. Ind Eng Chem Res. 45:5117-5126 (2006).

76
30. S.S. Godavarthy, R.L. Robinson, and K.A.M. Gasem. SVRC-QSPR model for predicting saturated vapor pressures of pure fluids. Fluid Phase Equilibria. 246:39-51 (2006).
31. D. Ravindranath, B.J. Neely, R.L. Robinson, and K.A.M. Gasem. QSPR generalization of activity coefficient models for predicting vapor-liquid equilibrium behavior. Fluid Phase Equilibria. 257:53-62 (2007).
32. K.M. Yerramsetty, V.K. Rachakonda, S.V. Madihally, R.L.J. Robinson, and K.A.M. Gasem. Effect of Different Enhancers on the Transdermal Permeation of Lispro. J Pharm Sci. (2008) (Under Preparation).
33. V.K. Rachakonda, K.M. Yerramsetty, S.V. Madihally, R.L.J. Robinson, and K.A.M. Gasem. Screening of Chemical Penetration Enhancers for Transdermal Drug Delivery using Electrical Resistance of Skin. Pharm Res. (2008) (Under Review):.
34. S. Golla. Virtual Design of Chemical Penetration Enhancers, School of Chemical Engineering, Master’s Thesis, Oklahoma State University, Stillwater, 2008.
35. K.M. Yerramsetty. Transdermal Drug Delivery Using Chemical Penetration
Enhancers, School of Chemical Engineering, Master’s Thesis, Oklahoma State University, Stillwater, 2008.
36. M.A.B. Richard, K. Albert, G.D. Braunstein, S. Cohen, L. Emanuel, J. Fawcett, E.P. Frenkel, S.L. Hendrix, M. Jacewicz, B.F. Mandell, G.L. Mandell, J.S. Palfrey, A.A. Rundio, Jr., D.A. Spain, P.H. Tanser. The Merck Manuals for
Health Care professionals, Merck Research Laboratories, 2008. 37. P. Karande. Rational and Combinatorial Design Strategies for Transdermal
Formulation Discovery, Ph.D. Thesis, Chemical Engineering, University of California, Santa Barbara, 2006.
38. I.P. Kaur and R. Smitha. Penetration enhancers and ocular bioadhesives: two new avenues for ophthalmic drug delivery. Drug Dev. Ind. Pharm. 28:353-369 (2002).
39. D.C. Corbo, J.C. Liu, and Y.W. Chien. Drug absorption through mucosal membranes: effect of mucosal route and penetrant hydrophilicity. Pharm. Res. 6:848-852 (1989).
40. K. Barnhart. Vaginal drug delivery. I Drugs. 2:756-759 (1999). 41. A. Hussain and F. Ahsan. The vagina as a route for systemic drug delivery. J
Control Release. 103:301-313 (2005). 42. E.R. Cooper. Increased skin permeability for lipophilic molecules. J. Pharm. Sci.
73:1153-1156 (1984). 43. A.P. Funke, R. Schiller, H.W. Motzkus, C. Gunther, R.H. Muller, and R. Lipp.
Transdermal delivery of highly lipophilic drugs: in vitro fluxes of antiestrogens, permeation enhancers, and solvents from liquid formulations. Pharm Res. 19:661-668 (2002).
44. N. He. Mechanistic Study of Chemical Penetration Enhancers for Transdermal
Drug Delivery, Ph. D Thesis, University of Utah, Salt Lake City, 2004. 45. R.J. Scheuplein. Properties of the skin as a membrane. Adv. Biolog. Skin. 12:125-
152 (1972). 46. R.J. Scheuplein and L.W. Ross. Mechanism of percutaneous absorption. V.
Percutaneous absorption of solvent deposited solids. J. Invest. Dermatol. 62:353-360 (1974).

77
47. A.S. Michaels, S.K. Chandrasekaran, and J.E. Shaw. Drug permeation through human skin. Theory and in vitro experimental measurements. AIChE J. 21:985-996 (1975).
48. L.L. Ferry, G. Argentieri, and D.H. Lochner. The comparative histology of porcine and guinea pig skin with respect to iontophoretic drug delivery. Pharm.
Acta Helv. 70:43-56 (1995). 49. H.D Smyth, G. Becket, and S. Mehta. Effect of permeation enhancer pretreatment
on the iontophoresis of luteinizing hormone releasing hormone (LHRH) through human epidermal membrane (HEM). . J. Pharm. Sci.. 91:1296-1307 (2002).
50. A. Jadoul, J. Bouwstra, and V. Preat. Effects of iontophoresis and electroporation on the stratum corneum: Review of the biophysical studies. Adv Drug Deliv Rev. 35:89-105 (1999).
51. Y.N. Kalia and R.H. Guy. Interaction between penetration enhancers and iontophoresis: effect on human skin impedance in vivo. J Control Release. 44:33-42 (1997).
52. P.G. Johnson, S.A. Gallo, S.W. Hui, and A.R. Oseroff. A pulsed electric field enhances cutaneous delivery of methylene blue in excised full-thickness porcine skin. J Invest Dermatol. 111:457-463 (1998).
53. P.G. Johnson, S.W. Hui, and A.R. Oseroff. Electrically enhanced percutaneous delivery of delta-aminolevulinic acid using electric pulses and a DC potential. Photochem Photobiol. 75:534-540 (2002).
54. S. Mitragotri, J. Farrell, H. Tang, T. Terahara, J. Kost, and R. Langer. Determination of threshold energy dose for ultrasound-induced transdermal drug transport. J Control Release. 63:41-52 (2000).
55. D. van der Merweand J.E. Riviere. Effect of vehicles and sodium lauryl sulphate on xenobiotic permeability and stratum corneum partitioning in porcine skin. Toxicol. 206:325-335 (2005).
56. P.J. Lee, N. Ahmad, R. Langer, S. Mitragotri, and V. Prasad Shastri. Evaluation of chemical enhancers in the transdermal delivery of lidocaine. Int J Pharm. 308:33-39 (2006).
57. P. Karande, A. Jain, K. Ergun, V. Kispersky, and S. Mitragotri. Design principles of chemical penetration enhancers for transdermal drug delivery. Proc Natl Acad
Sci U S A. 102:4688-4693 (2005). 58. T. Akimoto and Y. Nagase. Novel transdermal drug penetration enhancer:
synthesis and enhancing effect of alkyldisiloxane compounds containing glucopyranosyl group. J Control Release. 88:243-252 (2003).
59. B.C. Finnin and T.M. Morgan. Transdermal penetration enhancers: Applications, limitations, and potential. J. Pharm. Sci. 88:955-958 (1999).
60. D.W. Osborne, et al. Skin penetration enhancers cited in the technical literature. Pharm. Tech.. 21:58-66 (1997).
61. R. Daniels. Strategies for Skin Penetration Enhancement. http://www.scf-online.com/english/37_e/skinpenetration37_e.htm (accessed 05/22 2008).
62. S. Songkro, Y. Purwo, G. Becket, and T. Rades. Investigation of newborn pig skin as an in vitro animal model for transdermal drug delivery. STP Pharma Sci. 13:133-139 (2003).
63. I.P. Dick and R.C. Scott. Pig ear skin as an in-vitro model for human skin

78
permeability. J. Pharm. Pharmacol. 44:640-645 (1992). 64. M. Lopez-Cervantes, E. Marquez-Mejia, J. Cazares-Delgadillo, D. Quintanar-
Guerrero, A. Ganem-Quintanar, and E. Angeles-Anguiano. Chemical enhancers for the absorption of substances through the skin: Laurocapram and its derivatives. Drug Develop. Ind. Pharm. 32:267-286 (2006).
65. M.L. Leichtnam, H. Rolland, P. Wuthrich, and R.H. Guy. Identification of penetration enhancers for testosterone transdermal delivery from spray formulations. J Control Release. 113:57-62 (2006).
66. C. Fleeker, O. Wong, and J.H. Rytting. Facilitated transport of basic and acidic drugs in solutions through snakeskin by a new enhancer--dodecyl N,N-dimethylamino acetate. Pharm Res. 6:443-448 (1989).
67. R. Ibuki. Use of snake skin as a model membrane for percutaneous absorption
studies. Behaviour of several penetration enhancers in the system., Ph.D. Thesis, University of Kansas, Lawerence, 1985.
68. N. Sekkat, Y.N. Kalia, and R.H. Guy. Biophysical study of porcine ear skin in vitro and its comparison to human skin in vivo. J Pharm Sci. 91:2376-2381 (2002).
69. A. Femenia-Font, C. Balaguer-Fernandez, V. Merino, V. Rodilla, and A. Lopez-Castellano. Effect of chemical enhancers on the in vitro percutaneous absorption of sumatriptan succinate. Eur J Pharm Biopharm. 61:50-55 (2005).
70. Y. Song, C. Xiao, R. Mendelsohn, T. Zheng, L. Strekowski, and B. Michniak. Investigation of iminosulfuranes as novel transdermal penetration enhancers: enhancement activity and cytotoxicity. Pharm. Res. 22:1918-1925 (2005).
71. N. He, K.S. Warner, D. Chantasart, D.S. Shaker, W.I. Higuchi, and S. Kevin Li. Mechanistic study of chemical skin permeation enhancers with different polar and lipophilic functional groups. J Pharm Sci. 93:1415-1430 (2004).
72. Topical and Transdermal Diffusion Cell Systems. http://www.hansonresearch.com/vert-diffusion-cell.htm (accessed 07/07/ 2008).
73. T. Yamamoto, et al. Electrical properties of the epidermal stratum corneum. Med
Biolog Eng. 14:151-158 (1976). 74. W.J. Fasano, L.A. Manning, and J.W. Green. Rapid integrity assessment of rat
and human epidermal membranes for in vitro dermal regulatory testing: correlation of electrical resistance with tritiated water permeability. Toxicol In
Vitro. 16:731-740 (2002). 75. J.N. Lawrence. Electrical resistance and tritiated water permeability as indicators
of barrier integrity of in vitro human skin. Toxicol. In Vitro. 11:241-249 (1997). 76. J.R. Heylings, H.M. Clowes, and L. Hughes. Comparison of tissue sources for the
skin integrity function test (SIFT). Toxicol In Vitro. 15:597-600 (2001). 77. R.T. Tregear. Chap 2. Physical Functions of Skin, Academic Press, London, 1966. 78. P.H. Dugard and R.J. Scheuplein. Effects of ionic surfactants on the permeability
of human epidermis: an electrometric study. J Invest Dermatol. 60:263-269 (1973).
79. S.Y. Oh, L. Leung, D. Bommannan, R.H. Guy, and R.O. Potts. Effect of current, ionic strength and temperature on the electrical properties of skin. J Control
Release. 27:115-125 (1993). 80. W.J. Fasano and P.M. Hinderliter. The Tinsley LCR Databridge Model 6401 and
79
electrical impedance measurements to evaluate skin integrity in vitro. Toxicol In
Vitro. 18:725-729 (2004). 81. P. Karande and S. Mitragotri. Dependence of skin permeability on contact area.
Pharm Res. 20:257-263 (2003). 82. M.K. Nair, D.J. Chetty, H. Ho, and Y.W. Chien. Biomembrane permeation of
nicotine: mechanistic studies with porcine mucosae and skin. J Pharm Sci. 86:257-262 (1997).
83. J.E. Riviere, et al. Prediction of dermal absorption from complex chemical mixtures: incorporation of vehicle effects and interactions into a QSPR framework. SAR QSAR Environ Res. 18:31-44 (2007).
84. S.S. Godavarthy. Design of Improved Solvents for Extractive Distillation, Ph.D. Thesis, Oklahoma State University, Stillwater, 2004.
85. S.S. Godavarthy, R.L. Robinson, and K.A.M. Gasem. QSPR Approach for Melting Point Prediction., AIChE Spring National Meeting, New Orleans, Louisiana, 2002.
86. B.J. Neely, S.S. Godavarthy, R.L. Robinson, and K.A.M. Gasem. Modeling of Infinite-Dilution Activity Coefficients of Aqueous Systems., Tenth International
Petroleum Environmental Consortium (IPEC) Conference, Houston, TX, 2003. 87. L. Kikwai, N. Kanikkannan, R.J. Babu, and M. Singh. Effect of vehicles on the
transdermal delivery of melatonin across porcine skin in vitro. J Control Release. 83:307-311 (2002).
88. K.M. Yerramsetty, V.K. Rachakonda, S.V. Madihally, R.L.J. Robinson, and K.A.M. Gasem. Influence of Enhancer Characteristics and Drug Hydrophobicity on Permeation Enhancement. J Control Release. (2008) (under review).
89. N. Ohara, K. Takayama, and T. Nagai. Combined effect of d-limonene pretreatment and temperature on the rat skin permeation of lipophilic and hydrophilic drugs. Biolog Pharm Bull. 18:439-442 (1995).
90. J. Ademola and H.I. Maibach. Safety Assessment of Transdermal and Topical Dermotological Products. In Transdermal and Topical Drug Delivery Systems, Informa Healthcare, 1997, pp. 191-210.
91. H. Nomura, et al. Percutaneous absorption of indomethacin from mixtures of fatty alcohol and propylene glycol (FAPG bases) through rat skin: effects of oleic acid added to FAPG base. Chem Pharm Bull 38:1421-1424. (1990).
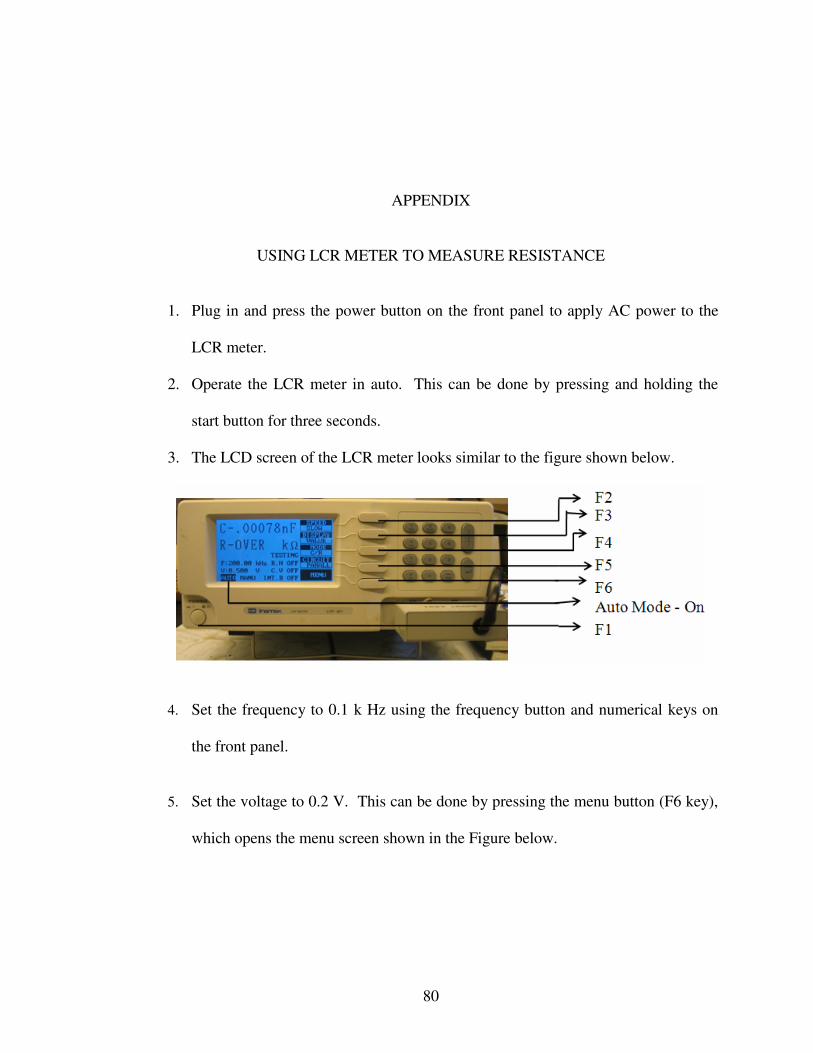
80
APPENDIX
USING LCR METER TO MEASURE RESISTANCE
1. Plug in and press the power button on the front panel to apply AC power to the
LCR meter.
2. Operate the LCR meter in auto. This can be done by pressing and holding the
start button for three seconds.
3. The LCD screen of the LCR meter looks similar to the figure shown below.
4. Set the frequency to 0.1 k Hz using the frequency button and numerical keys on
the front panel.
5. Set the voltage to 0.2 V. This can be done by pressing the menu button (F6 key),
which opens the menu screen shown in the Figure below.

81
6. Press the F3 (settings) key and set the voltage to 0.2 V by using the F2 key and
numerical keys on the next screen.
7. After setting the voltage, press start button and exit the menu screen.
8. Zero the LCR meter using open and short circuit tests to eliminate the strayed
measurements as described in the manual.
In brief open and short circuit tests can be done by following the procedure
mentioned below.
Open circuit test:
i. Press the F6 menu key to open the menu screen.

82
ii. Press the F1 (capacitance, R / L OFFSET) key to open the OFFSET menu,
which is shown below.
iii. Press F1 key to select open circuit zeroing.
iv. If the zeroing process is successful, a message of “OK” can be seen on the
LCD screen as shown below.
v. Repeat the steps from i to iv if the process fails.
Short circuit test:
i. Connect the electrodes of the LCR meter to a clean small metal wire to
short the circuit.
ii. Press the F6 menu key to open the menu screen.

83
iii. Press the F1 (capacitance, R / L OFFSET) key to open the OFFSET menu,
which is shown above.
iv. Press F2 key to select short circuit zeroing.
v. If the zeroing process is successful, a message of “OK” can be seen on the
LCD screen.
vi. Repeat the steps from i to iv if the process fails.
9. After the zeroing is successful select the R / C mode by pressing the mode button.
10. Select the parallel mode by pressing the circuit button.
11. The LCD screen should look similar to the Figure below
12. Finally, connect the LCR meter to electrodes of the resistance chamber as shown
in the Figure below and note the resistance measurements.

VITA
Vijay Krishna Rachakonda
Candidate for the Degree of
Master of Science Thesis: EEFECTIVE SCREENING OF CHEMICAL PENETRATION ENHANCERS
FOR TRANSDERMAL DRUG DELIVERY Major Field: Chemical Engineering Biographical:
Personal Data: Born on 26th October, 1983 in Vijayawada, Andhra Pradesh, INDIA to Veeroji Rao and Leela
Education: Completed Secondary School (2000) and High School (2002) from
Sri Kakatiya High School and Nalanda College respectively, located in Vijayawada, Andhra Pradesh, INDIA. Obtained Bachelor of Technology Degree (2006) in Chemical Engineering from Andhra University, Visakhapatnam, Andhra Pradesh, INDIA. Completed the requirements for the degree of Master of Science in Chemical Engineering at Oklahoma State University, Stillwater, Oklahoma in July, 2008.
Experience: Worked as a teaching assistant for undergraduate level courses in
Chemical Engineering Design I and II, ChE 4224 (Aug 2006 – May 2007) and Introduction to Chemical Process Engineering, ChE 2033 (Jan 2008-May 2008) at Oklahoma State University. Working as a Research Assistant (Aug 2006 – Present) in School of Chemical Engineering, Oklahoma State University, Stillwater, OK.
Professional Memberships:
American Institute of Chemical Engineers 2007 - Present Omega Chi Epsilon 2007 - Present
ADVISER’S APPROVAL: Dr. Sundar Madihally
Name: Vijay Krishna Rachakonda Date of Degree: July, 2008 Institution: Oklahoma State University Location: Stillwater, Oklahoma Title of Study: EFFECTIVE SCREENING OF CHEMICAL PENETRATION
ENHANCERS FOR TRANSDERMAL DRUG DELIVERY Pages in Study: 83 Candidate for the Degree of Master of Science
Major Field: Chemical Engineering Scope and Method of Study: The potency of a CPE in enhancing the permeation of a drug
is usually determined by quantifying the amount of drug permeated through skin in the presence of the CPE. Typically, these experiments are performed in Franz diffusion cells, and the amount of drug permeated is quantified by using rigorous analytical techniques, which are resource and labor intensive, cost prohibitive and have limited throughput. Further, there is no rational design in the criteria for selecting candidate CPEs for study and this trial-and-error method can be time consuming. Therefore, a need exists for a robust, quick alternate technique that can effectively pre-screen the CPEs for their potency. In this study, resistive properties of skin were used to determine the potency of the CPEs. A high throughput multi-well resistance chamber was designed and constructed in order to increase the throughput from the experiments. The multi-well resistance chambers were equipped to perform the experiments at conditions identical to permeation experiments and forty two potential CPEs were evaluated, which were generated by virtual design techniques. Histological studies were also performed to test the toxic effects of selected potent CPEs.
Findings and Conclusions: Using the resistance technique and the multi-well resistance
chamber, nineteen potential CPEs were identified from the forty two tested. Our results show a significant agreement between the resistance technique and the standard permeation experiments; thus, we confirm the efficacy of the resistance technique for screening potential CPEs. In summary, resistance technique can be used to effectively pre-evaluate potential CPEs, thereby reducing the time required to conduct the skin absorption studies.