effective gps spoofing detection utilizing metrics from
TRANSCRIPT

Effective GPS Spoofing Detection Utilizing Metricsfrom Commercial Receivers
Esteban Garbin ManfrediniPolitecnico di Torino
Torino, ItalyEmail: [email protected]
Dennis M. AkosUniversity of Colorado at Boulder
Boulder, CO
Yu-Hsuan ChenSherman LoTodd Walter
Per EngeStanford Univeristy
Palo Alto, CA
ABSTRACT
Spoofing attacks are a major threat to civilian GNSS usage given the powerful impact that they have on a receiver.
Many different anti-spoofing techniques have been developed in past years and best practices algorithms combine
complimentary techniques to generate optimized protection. In this paper we utilize anti-spoofing techniques that make
use of the outputs from commercial off the shelf receivers. It combines the observation of power measurements and
the control of asymmetries in the correlation function. The technique’s nominal behavior is assessed using real datasets
from Wide Area Augmentation System stations and the spoofing detection capabilities are tested by means of the Texas
spoofing test battery. The correlation between various metrics is also observed to lower the false alarm probabilities,
particularly between the power measurement and the carrier to noise density ratio information. A major application of
this observation is the distinction between spoofing attacks and interference events.
I. INTRODUCTION
The use of Global Navigation Satellite Systems (GNSS) is spreading in today’s society. Many electronic components are now
equipped with a GNSS receiver and can readily locate their host device with high precision. Many critical applications rely on
GNSS signals to correctly identify position and timing. In addition, GNSS allows for transportation companies to monitor and
dispatch their vehicles, for fishing regulations to be enforced by geofencing, and for many telecommunication companies and
power grids to use GNSS timing to synchronize all their processes [1]–[3].
Given the low signal power and the open nature of the GNSS civil signals, receivers are vulnerable to different radio frequency
interference (RFI), both unintentional and intentional. Intentional interference sources includes jamming, meaconing, or even the
more malicious spoofing attacks. Many recent publications have highlighted the powerful implications that a spoofing attack
would have if it manages to take control of a GNSS receiver [4]–[8].
A spoofing attack consists of transmitting GNSS-like signals, in order to fool the receiver into tracking the false signals.
Because of this, the spoofer is able to control the position, velocity, and time (PVT) solution that the receiver believes to
be true. Many different types of spoofing attacks can be performed and designed [9]–[11]. With the increased availability of
programmable simulators and software defined radio systems, a spoofing attack is more feasible than ever [12] and no longer
solely in the domain of GNSS experts [13].

In this paper we focus on presenting a spoofing detection algorithm that uses outputs from a commercial off-the-shelf (COTS)
receiver in order to determine if the receiver is under spoofing attack or not. Many different types of spoofing detection techniques
have been presented lately in literature, and different classifications have been made [1], [10], [12].
As stated in [12], combining and merging different complementary techniques provides a better defense against a wider
variety of spoofing attacks. For this article we will focus on two techniques that are self contained inside a GNSS receiver and
do not need additional hardware to work effectively.
The first technique is based on power monitoring (PM), as presented in [14], which is based on the observation of the
automatic gain control (AGC) behavior. It is able to detect if additional signals are present in the frequency band of the receiver.
The technique is powerful for detecting over-powered spoofing attacks, where the spoofing signal power is high with respect to
the satellite signal and additional noise is added to the band with the goal of hiding the true satellite signal under it.
The second complementary technique is known as the Signal Quality Monitoring (SQM) technique. It is based on the
observation of the correlation function and aims at identifying asymmetries. SQM techniques have been widely developed and
presented in many different formats [15]–[19]. The SQM is very powerful in detecting matched-powered spoofing attacks, where
the spoofing signal is broadcast with only a slight power advantage, so the distortion generated at the correlation function between
the signal code and the local code replica is maximal.
Other publications have analyzed the combination of multiple metrics in order to distinguish between spoofing attacks and
other effects, such as multipath and interference [20]–[22], but the contribution of this paper are: 1) the use of simple metrics
obtained from COTS receiver output; 2) the extensive amount of data used to assess the performance of the technique, and 3)
the unique proposal for differentiating RFI events and spoofing attacks.
The receiver used for the paper is a Novatel G-III, deployed at various Wide Area Augmentation System (WAAS) reference
stations in order to assess nominal behaviors. Afterward, in order to asses the quality of the combined technique, we use the
Texas antispoofing test battery (TEXBAT) [23], re-transmitted to the Novatel G-III receiver. The TEXBAT is a series of datasets
published by the University of Texas at Austin, used to assess the quality of the different anti-spoofing techniques.
Within the WAAS station data we observe some RFI that may be mistaken for an over-powered spoofing attack by the AGC
monitoring. We propose leveraging the AGC level and the Carrier to Noise density ratio (C/N0), in order to discriminate between
generic RFI and spoofing.
II. POWER MEASUREMENT MONITORING
Power measurement monitoring was originally presented in [24], [25] as an interference monitoring system and then in [14]
as a spoofing detection method. It is based on the observation of the response of the AGC, in order to detect additional signals
in the receiver that are not normally present.
Normally, the received power of the GNSS signal is below the thermal noise floor, so the incoming power PN will be:
PN = kTABW (1)
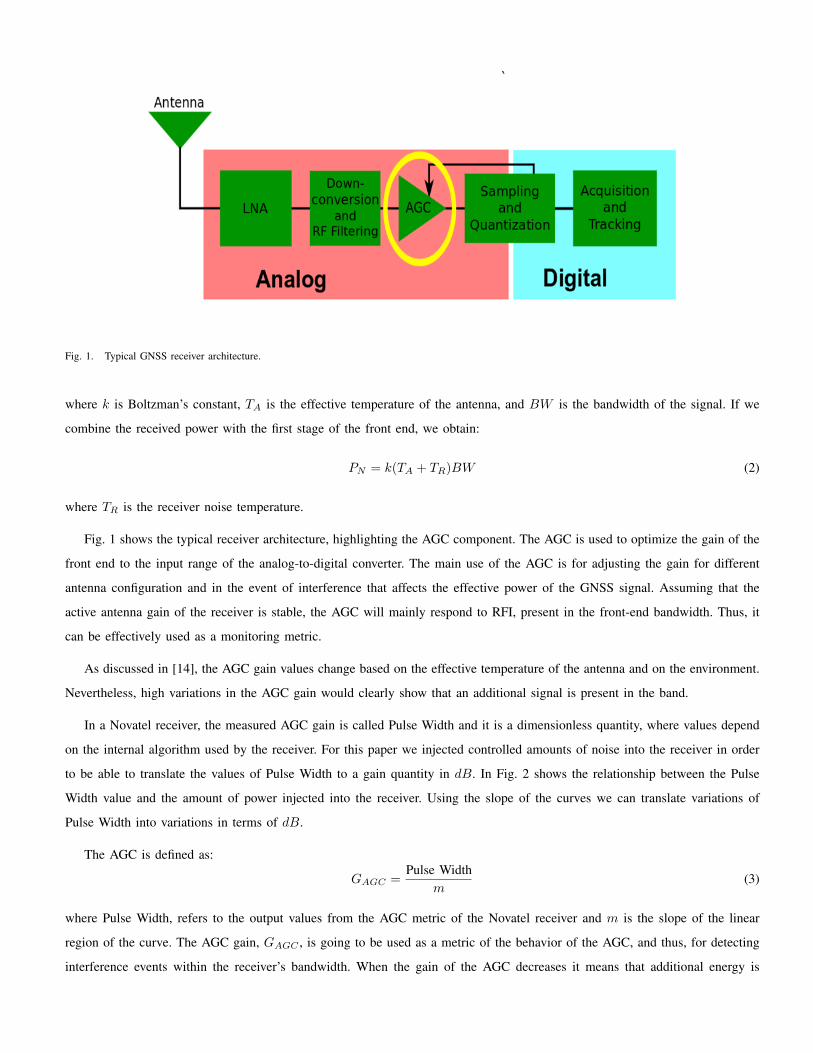
Fig. 1. Typical GNSS receiver architecture.
where k is Boltzman’s constant, TA is the effective temperature of the antenna, and BW is the bandwidth of the signal. If we
combine the received power with the first stage of the front end, we obtain:
PN = k(TA + TR)BW (2)
where TR is the receiver noise temperature.
Fig. 1 shows the typical receiver architecture, highlighting the AGC component. The AGC is used to optimize the gain of the
front end to the input range of the analog-to-digital converter. The main use of the AGC is for adjusting the gain for different
antenna configuration and in the event of interference that affects the effective power of the GNSS signal. Assuming that the
active antenna gain of the receiver is stable, the AGC will mainly respond to RFI, present in the front-end bandwidth. Thus, it
can be effectively used as a monitoring metric.
As discussed in [14], the AGC gain values change based on the effective temperature of the antenna and on the environment.
Nevertheless, high variations in the AGC gain would clearly show that an additional signal is present in the band.
In a Novatel receiver, the measured AGC gain is called Pulse Width and it is a dimensionless quantity, where values depend
on the internal algorithm used by the receiver. For this paper we injected controlled amounts of noise into the receiver in order
to be able to translate the values of Pulse Width to a gain quantity in dB. In Fig. 2 shows the relationship between the Pulse
Width value and the amount of power injected into the receiver. Using the slope of the curves we can translate variations of
Pulse Width into variations in terms of dB.
The AGC is defined as:
GAGC =Pulse Width
m(3)
where Pulse Width, refers to the output values from the AGC metric of the Novatel receiver and m is the slope of the linear
region of the curve. The AGC gain, GAGC , is going to be used as a metric of the behavior of the AGC, and thus, for detecting
interference events within the receiver’s bandwidth. When the gain of the AGC decreases it means that additional energy is

Fig. 2. Pulse Width behavior versus Injected Power for different types of interference. From this figure we can translate the Pulse Width variations into dBs.
Fig. 3. AGC gain example for nominal behavior. Obtained from WAAS station HNL, in Honolulu, Hawaii.
present in the band and an interference event may be present. The metric GAGC can be considered as a static indicator of the
spoofing presence. Along this paper we use the terms static and transient indicators, as a mean to indicate the range of detection
of the technique. A static indicator is always able to detect the spoofing presence from the moment when it is turned on; whereas
a transient indicator is only able to detect the spoofing presence when the spoofing signal is affecting and modifying the signal
parameters of the receiver. As a result, a transient indicator is less desirable, but both are able to detect the spoofing presence
when it is most critical.
In Fig. 3 we can observe the nominal behavior of the gain, obtained from a Novatel G-III receiver, using over 120 hours of
real data from the Honolulu (HNL) station.
Observing the variance of the AGC gain over four different WAAS stations during periods considered free of interference

for more than 480 hours, we obtained the standard deviation σGAGC= 0.25. Using this information we can declare that an
interference event is occurring when:
GAGC < γGAGC(4)
where γPGAGCwill be the lower threshold, that in our case will be defined as γGAGC
= 4 ∗ σGAGC. This threshold has a
probability of false alarm lower than 3 · 10−6, from the real static datasets. Metric GAGC can be effectively used for detecting
spoofing attacks as will be shown in Section IV.
It is important to notice that the AGC gain will have some variations, e.g. those caused by temperature changes in the low
noise amplifier (LNA) of the antenna. These variations change the efficiency of the components of the antenna and front-end.
On WAAS stations, which are designed for their stability, these variations are generally low and work well for assessing nominal
behavior. In other applications, such as aviation or dynamic road scenarios, the thresholds likely need to be reassessed.
The GPS L1 band is classified as the Aeronautical Radionavigation Service (ARNS), so it is forbidden for unauthorized systems
to transmit additional energy in the frequency band. Nevertheless, illegal transmission inside the band have been detected in
several locations. So, it is very important to keep the band clear of interference that could impair critical applications, as well
as enable the AGC as a spoofing detection metric.
III. SIGNAL QUALITY MONITORING
The SQM technique has been proposed in many different papers for detection of distortions in the GPS correlation peak. It
was initially thought of as a multipath detection technique [26], and following, was introduced as an effective spoofing detection
algorithm [15]–[17]. It has also been combined with other measurements in order to distinguish between multipath and spoofing
[18], [19], [21].
Fig. 4 shows an example of the correlation function of the GPS C/A code. We can observe how it presents distortions in the
presence of spoofing signals. The ideal shape of the correlation function for GPS L1 C/A code is symmetric and triangular. On
the other hand, when additional signals are present in the correlation space, the shape is distorted. We can use these distortions
to detect the presence of spoofing signals.
In this article, we will use a simple signal quality metric, that will be called M , which is a linear combination of correlator
values given by the COTS receiver. The receiver that was used for this research is a Novatel G-III, which include multicorrelators
at fixed spacing, given by Table I. The table presents the linear combination used in order to build the metric. It is important to
Fig. 4. GPS L1 typical correlation behavior for nominal and spoofed scenario

TABLE I. NOVATEL G-III CORRELATION SPACING AND LINEAR COMBINATION USED
Spacing -0.1016 -0.0766 -0.0516 -0.025 0 0.025 0.0516 0.0766 0.1016Lin. Comb. -1 -1 -1 -1 0 1 1 1 1
Fig. 5. M behavior for WAAS station HNL, in Honolulu, Hawaii, over 24 hours. The mean and standard deviation are also highlighted, along with a histogramof the distribution
notice that the metric uses eight observations of correlation peak from −0.1016 chips to +0.1016 chips. The metric numerator
is then normalized by the value at zero delay and a metric with mean value close to zero is obtained for the nominal correlation
shape.
So for our case, M will be defined as:
M =Lx − Ex
P0(5)
where Lx = (L0.10 + L0.07 + L0.05 + L0.02) and Ex = (E0.10 + E0.07 + E0.05 + E0.02), representing the linear combination
of the late and early correlators, and P0 is the prompt correlator at zero delay. Given the commercial availability of the existing
receiver hardware, there was no adjustment of the correlator spacing measurements nor any weighting given to those which were
available, to optimize spoofing detection performance. It should be possible, particularly in the case of detection of matched
power attacks, to further optimize the location and weighting of the correlator measurements. The behavior of M for the WAAS
station site HNL over 24 hours can be observed in Fig. 5.
All the correlator outputs can be modeled as random Gaussian variables with the mean value depending on the location of
the correlator and the variance depending on the noise components. The metric M is a ratio of Gaussian random variables, thus
it is not Gaussian. Observing a high number of samples of M , we can obtain a reliable representation of the distribution of the
metric.
Every satellite will provide a metric M , with a specific distribution, which will be dependent on the C/N0 value, thus
requiring computation of thresholds for each of them individually. Another approach could be to bin the satellites inside different

Fig. 6. Probability plot for M with different fits, the normal distribution (red) and student’s t distribution (yellow)
C/N0 ranges and obtain the distributions and thresholds for each separate bin.
In our case, we decided to take a conservative approach and use the mean value of all the available M ’s, thus considering
high and low C/N0 values. The values of M are dependent on C/N0 values of the signal and secondary on the geometry and
visibility of the satellite. Given that the data comes from WAAS stations which inherently have good siting, we further reduce
the dependence over geometry and feel confident averaging over all time. The value used for M will be:
M(t) =1
Nsat
Nsat∑i=1
Mi(t) (6)
where Nsat is the total number of satellites available and Mi is the metric obtained from satellite i.
So, in order to obtain an accurate distribution of M , we collected data from six different WAAS sites, spanning 24 hours
each, with a frequency of 0.2 Hz. From these observations we obtained that M is distributed as a Student’s t, location scale
distribution, with nine degrees of freedom and standard deviation σ = 0.005 as can be observed by Fig. 6.
Knowing the distribution of M , we can define a two hypothesis test. In this case we assume that in the absence of interference,
hypothesis H0, the nominal behavior M will be distributed as Student’s t,
H0 : M ∼ t(µ, υ) (7)
where t represents the Student’s t distribution with mean value µ and υ degrees of freedoms obtained from the WAAS data.
Given this, we can assume that anything that is not likely to belong to this distribution will be a multipath or a spoofing presence.
Using the desired probability of false alarm (Pfa) and based on the distribution of M , we can calculate the threshold γM and
the alternate hypothesis will be defined as:
H1 : M < −γM or M > γM (8)
Extrapolating from the distribution obtained using the data, we can compute the thresholds for the two-tails probability, based

Fig. 7. Histogram of M with threshold plotted for a Probability of False Alarm of 10−6
on the desired Pfa as:
γM = Φ−1(Pfa) − (1 − Φ−1(-Pfa)) (9)
where Φ is the cumulative density function of a t(0, 8) distribution, with variance σ = 0.0046. Finally, we obtainfor Pfa= 10−5 γM = 0.041
for Pfa= 10−6 γM = 0.055
(10)
Figure 7 shows the distribution of the samples with the respective thresholds for Pfa of 10−6. Using these thresholds, in
Section IV, we asses the capabilities of the two metrics M and GAGC to detect spoofing attacks by means of the TEXBAT
datasets.
It is important to mention that the SQM works in a limited region of the correlation function, delimited by the correlator
spacing, such that a spoofer present that is outside these regions is not detected by the metric. This could be classified as a
transient indicator of the spoofer presence. Nevertheless, in the case that we want to create a static indicator, an additional
scanning correlator could be included for each channel in order to look for additional energies throughout the correlation space,
outside of the correlation peak being monitored.
This additional correlator would be scanning different code delays and frequencies and when its value reaches an unexpectedly
high value, it would declare that an additional signal is also present in the correlation space, thus transforming the SQM in a
static indicator. These changes would require modifications to the COTS receiver architecture.
IV. BASELINE RESULTS
After having computed the required threshold for the Novatel G-III, using the WAAS stations datasets described in Table II,
we assess the spoofing detection performance of the two metrics by means of the TEXBAT datasets.
The TEXBAT [23] is a collection of spoofed datasets created by the University of Texas at Austin and are available online.

TABLE II. WAAS REFERENCE STATIONS LOCATIONS AND DURATION OF THE DATASETS
Name Location Dur.for AGC Dur. for SQMHNL Honolulu, HI 120 hrs. 24 hrs.FAI Fairbanks, AK 120 hrs. 24 hrs.
ZMA Miami, FL 120 hrs. 24 hrs.ZSE Auburn, WA 120 hrs. 24 hrs.ZBW Nashua, NH 120 hrs. 24 hrs.ZAU Aurora, IL 120 hrs. 24 hrs.
Fig. 8. Scheme of the replay of Texbat datasets into the Novatel G-III receiver
It was envisioned as a reference for assessing performance of anti-spoofing techniques. The spoofed datasets are based in two
sets of clean recordings, one dynamic and one static. In our case we focus our analysis using the static datasets due to the nature
of the receiver, but a similar procedure can be performed for the dynamic tests.
Based on the clean recordings, different attack types were performed, and the raw data made available. The raw data of
the was re-transmitted into the Novatel G-III receiver, using a cable connection and the configuration shown in Fig. 8. For the
assessment in this paper, the noise source was put to zero. The datasets re-transmitted are described in Table III. Dataset ds0 is the
reference dataset and is used to confirm nominal behavior, while ds2 is an over-powered scenario and ds3 is a matched-powered
one. Both scenarios perform what they called a time push spoofing attack. The time push consists of delaying all the satellites
contemporaneously with the same trend, thus creating a bias in the time calculation of the PVT, but not affecting the user’s
position if all the satellites are controlled by the spoofer.
A. TEXBAT processing
Using the replayed datasets of the TEXBAT, we extracted metrics M and GAGC for each scenario and present the results
hereafter.
In Figs. 9 and 10, we can observe the results for GAGC and M , respectively, for the clean set ds0. As expected, no false
alarms are triggered and the metrics are well between their thresholds.
It is important to remember the conservative approach taken for the threshold calculation of the SQM. Given that the TEXBAT
TABLE III. TEXBAT SCENARIOS REPLAYED INTO NOVATEL G-III RECEIVER
Name Scenario Descriptionds0 Clean datasets Clean recording with no spoofingds2 Static Overpowered Time Push +10 dB of power advantageds3 Static Matched Power Time Push +1.3 dB of power advantage
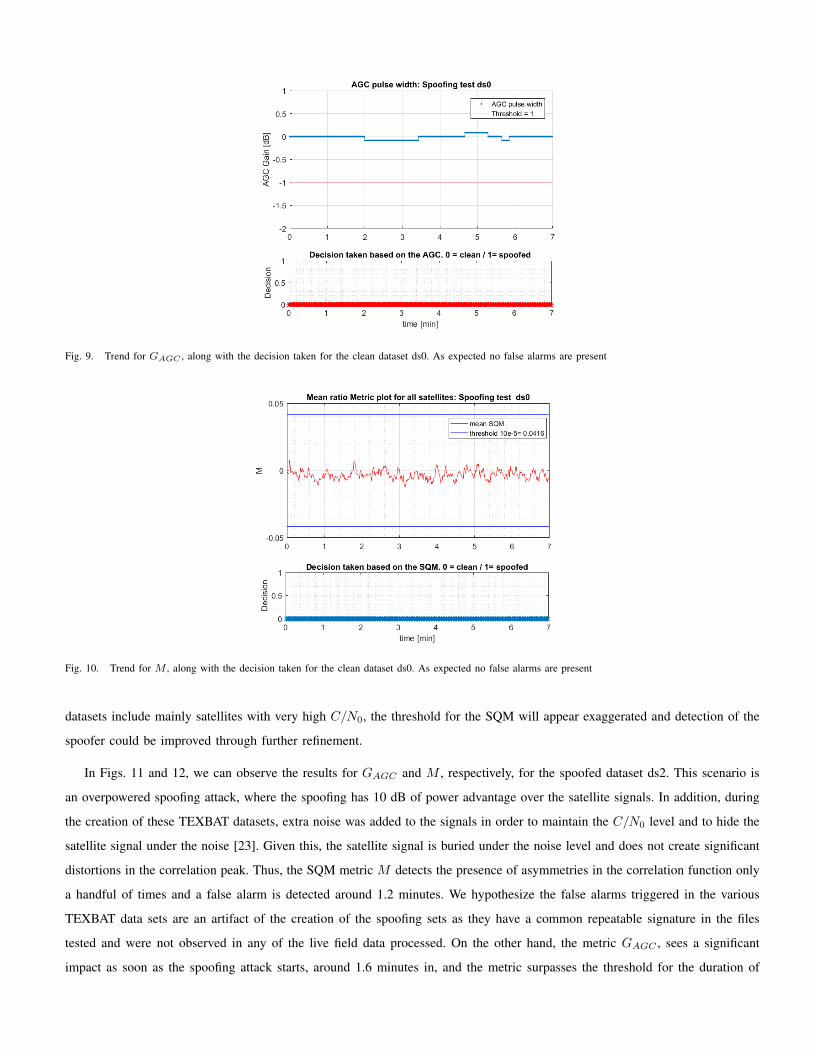
Fig. 9. Trend for GAGC , along with the decision taken for the clean dataset ds0. As expected no false alarms are present
Fig. 10. Trend for M , along with the decision taken for the clean dataset ds0. As expected no false alarms are present
datasets include mainly satellites with very high C/N0, the threshold for the SQM will appear exaggerated and detection of the
spoofer could be improved through further refinement.
In Figs. 11 and 12, we can observe the results for GAGC and M , respectively, for the spoofed dataset ds2. This scenario is
an overpowered spoofing attack, where the spoofing has 10 dB of power advantage over the satellite signals. In addition, during
the creation of these TEXBAT datasets, extra noise was added to the signals in order to maintain the C/N0 level and to hide the
satellite signal under the noise [23]. Given this, the satellite signal is buried under the noise level and does not create significant
distortions in the correlation peak. Thus, the SQM metric M detects the presence of asymmetries in the correlation function only
a handful of times and a false alarm is detected around 1.2 minutes. We hypothesize the false alarms triggered in the various
TEXBAT data sets are an artifact of the creation of the spoofing sets as they have a common repeatable signature in the files
tested and were not observed in any of the live field data processed. On the other hand, the metric GAGC , sees a significant
impact as soon as the spoofing attack starts, around 1.6 minutes in, and the metric surpasses the threshold for the duration of

Fig. 11. Trend for GAGC , along with the decision taken for the dataset ds2. The spoofer is inserted around minute 1.6 and it is clearly detected by the metric.
Fig. 12. Trend for M , along with the decision taken for the dataset ds2. The spoofer is inserted around minute 1.6, and only a couple of asymmetries areobserved under spoofing presence
the test.
Figs. 13 and 14, show the results for GAGC and M , respectively, for the spoofed dataset ds3. Scenario ds3, is a matched-
power spoofing attack, where the spoofer only has a +1.3 dB advantage over the satellite signal. We observe how in this scenario,
metric M is more powerful and it is able to detect the asymmetries formed in the correlation function once the spoofer starts
separating the two signals, between the second and forth minute. After the forth minute, the two signals are completely separated
so the SQM is not able to detect asymmetries anymore, following the expected transient indicator approach. Metric M , presents
a false alarm at time 0.9 minutes, similar to what observed for ds2. For metric GAGC , we see that it also detects the spoofing
perfectly, but the impact is not as significant as observed for ds2. A spoofer with a lower power advantage, and a receiver with
enlarged thresholds, could reduce the impact on the AGC to levels below the threshold. Nevertheless, this would greatly increase

Fig. 13. Trend for GAGC , along with the decision taken for the dataset ds3. The spoofer is inserted around 1.8 minutes into the test, and the metric detectsits presence clearly.
Fig. 14. Trend for M , along with the decision taken for the dataset ds3. The spoofer is inserted around 1.8 minutes into the test, and the metric detects itspresence while it is affecting the region observed by the correlators.
the impact on the SQM metric M .
In this Section we have shown the working principle of the metrics under spoofing attacks. In order to accurately detect
the spoofing event, the receiver would need to define an algorithm for combining these metrics together. For this algorithm, we
envision the spoofing attack will be detected if both GAGC and M trigger, using an AND condition, also making use of time
gating algorithms, where the condition is maintained during a certain time window (e.g. there was a trigger of the M metric in
the last x seconds, and GAGC triggers).
If only the metric M triggers, the receiver could be under matched power spoofing attack or multipath events. An additional
check could be performed by observing additional parameters and continuity over time as was proposed in [19], or by planned

Fig. 15. Trend for GAGC in WAAS station ZMA, in Miami, Florida. The station is affected by RFI interference coming from the surrounding urban areas.
localization of the receiver’s environment, if it is a static position. Finally, if only GAGC triggers, the receiver could be under
an overpowered spoofing attack or under a jamming event. An additional check could be done by using the correlation between
the GAGC and the C/N0 as explained in the following Section.
It is important to flag that the different situations would be characterized by different false alarm probabilities, and each one
needs to be assessed individually, based on the final decision used in the algorithm. The false alarms probabilities used in this
paper are based only on the binary discrimination between clean dataset and the available spoofing scenarios.
B. RFI vs Spoofing
The metrics M and GAGC are very powerful tools that can be used for spoofing detection with success as shown in Section
IV-A. Observing distortions of the correlation shape indicates that another "GNSS-like" signal is present and that the solution
cannot be trusted. The metric M is especially powerful for detecting attacks where the spoofer does not have a significant power
advantage over the satellite signals.
Examining the power measurements via the AGC monitoring and metric GAGC provides hints that additional signals are
present in the receiver bandwidth and that the receiver is being affected by RFI. These RFI can come from intentional sources
like spoofers or jammers or can come from unintentional sources like TV antennas, or some near band spill-over. The impact
that these interference sources have on the AGC is very similar from one source to the other, given that they all add additional
power within the band.
In Fig. 15 we can observe the behavior for the metric GAGC while the WAAS station is affected by RFI. The station ZMA is
in an area in Miami, Florida, next to a major highway. In this case, the interference is likely coming from other radio frequency
sources. Similar trends are observed for stations near major highways, where localized interference may be a problem.
The effects of RFI on the receiver are very similar to the ones generated by an overpowered spoofing attack. They both affect
mainly the metric GAGC , while the SQM metric does not suffer from any considerable distortion and show similar behavior

Fig. 16. Examples for C/N0 difference (in blue) and AGC difference (in brown), for both, a real interference event on WAAS station ZMA (left) and aspoofing attack on TEXBAT scenario ds2 (right)
to the one observed in Fig. 5. In order to lower the false alarms produced by the RFI, in Section IV-C we describe a possible
approach to discriminate between the two events.
C. Observation of the C/N0 and the AGC
In order to discriminate between RFI and spoofing attacks, we could go deeper into the way the interference is generated
and its goal. In the case of a spoofer, the attacker wants to send a counterfeit signal that is aligned with the GNSS satellite’s
signals. This new signal will effectively increase the power of the carrier signal when both the spoofing signal and the satellite’s
signals are overlapped.
During RFI, a signal that is not consistent with the satellite signal is added into the bandwidth. Basically noise is added to
the GPS band, distorting or eliminating GPS processing. Due to the increased power observed in the band, the AGC lowers its
gain value. For RFI events, if we observe the C/N0 value, a drop will be observed due to the increase of the noise floor N0.
On the other hand, during a spoofing attack, due to the addition on the carrier measurement, we will naturally see an increment
in the C/N0 value. This increment is due to the alignment in carrier frequency that the spoofer and satellite signals have.
A smart spoofer may be able to maintain the C/N0 value constant or even decrease it by adding additional noise to the
band and hide the true satellite signal under the noise. Nevertheless, the metric GAGC will detect that larger amounts of power
are being inserted, and the C/N0 is not decreasing with the expected trend. If we identify the AGC vs C/N0 response of the
receiver’s front-end to RFI events, we are able to draw a threshold that will allow us to discriminate between RFI events and
spoofing attacks. It is important to note that the C/N0 values used hereafter, are those estimated by the Novatel receiver, and
are subject to its internal algorithms.
Fig. 16 shows an example of how the GAGC value compares to the C/N0 for both an interference event on the real datasets
(on the left) and the TEXBAT spoofing attack (on the right). Having complete knowledge of the response of the RF front-end
of our receiver, we could use this information for differentiating between the two types of interference.

Fig. 17. Examples for AGC vs C/N0 difference. To the left of the red line we can observe the trends for different WAAS stations, while to the right weobserve the spoofing scenario ds2
In the case that we plot the curve of the AGC variations versus the C/N0 difference, we can distinguish the two effects by
separating the space into two regions as observed in Fig. 17. In this figure we plotted, in small dots, the trend of three different
WAAS stations, two of which contain presumed interference (ZMA and ZBW), while in stars we plotted the trend of ds2.
We can observe how in this example the spoofing scenario fall to the right of the red line, while the jamming cases fall to
the left of it. Given this initial result we wanted to confirm this behavior and we performed controlled interference tests in the
lab in order to assess the thresholds and limitations of the technique. These results are presented in Section V.
V. CONTROLLED ENVIRONMENT INTERFERENCE
In order to assess the feasibility of the technique and the thresholds for distinguishing between spoofing attacks and RFI, we
need to understand the behavior of the receiver when being affected by interference. In order to do this, we injected different
types of interference to the receiver via cable connection in a controlled environment and observe its characteristic response.
We used three different interference sources, each one with different characteristics. One interference is white noise, another is
a continuous wave (CW) pulse centered in the L1 frequency (1575.42 MHz), and the final one is a chirp interference source,
which sweeps the frequency of the continuous wave rapidly within the bandwidth of the source. In Fig. 18, we can observe the
trend of GAGC vs C/N0, for the interference in controlled environment.
Using the results in Fig. 18, we can draw a threshold that contains all interference cases to the left, shown in red in Fig. 18,
and use that threshold to identify the cases of spoofing and interference that were shown previously. In Fig. 19 we can observe
that the threshold obtained is able to distinguish clearly between spoofing and jamming signals.
On the left of the threshold, we observe the results of the two WAAS stations that presented what is assumed to be interference,

Fig. 18. GAGC vs C/N0 trend for the receiver for different types of interference and analytic threshold obtained (in red)
Fig. 19. GAGC vs C/N0 trend for the Novatel OEM628 receiver for different types of interference and analytical threshold obtained (in red)
while on the right of the threshold the dots are corresponding to two overpowered spoofer cases, scenarios ds2 and ds5, re-
transmitted to the receiver. Scenario ds5 is an overpowered case, similar to ds2, but in a dynamic environment.
From the results in Fig. 19 we observe that with the characterization and knowledge of the behavior of the AGC inside the
receiver, we are able to discriminate between interference that aims at disrupting the signal tracking and a spoofing attack that
aims at taking control of the receiver.
It is also worth flagging that a check on temporal dynamics could also be effective when trying to distinguish between the
two phenomena, if we assume that the interference device will only be in range of the station for a few seconds, while the
spoofer would need a significantly longer presence in order to complete its goal.

VI. CONCLUSIONS
In this paper we have implemented an anti-spoofing technique, based on two previously published algorithms, and assessed
the performance with real data and test spoofing scenarios. These algorithms make use of information available from existing
COTS receivers in order to provide accurate warnings in case of spoofing attack events.
The technique is based on the observation of the power measurement via the control of the AGC and the observation of
asymmetries in the correlation function via a SQM technique. The nominal statistics of the metrics were computed using extensive
live datasets from six different WAAS stations, spread across the United States. From these stations, over 24 hours of correlator
data were used for assessment of metric M and over 120 hours of pulse width information were used for the assessment of the
GAGC metric.
Processing of the TEXBAT spoofing database, observing the correlation of the metrics, demonstrates the detection capabilities
of this approach for overpowered and matched power scenarios. Further, correlations between the anti-spoofing metrics and
additional information can reduce the false probability under other events.
In this paper, when observing datasets from ground stations, we encountered false alarms in the GAGC due to likely RFI
interference. These false alarms were addressed by means of the cross-observation of the curve of GAGC vs C/N0. Controlled
simulations were performed in order to identify correctly the behavior of the AGC with respect to the C/N0, and the obtained
thresholds were applied to the spoofing detection algorithm. With the observation of the GAGC vs C/N0 curve we were able to
accurately eliminate the false alarms from the WAAS stations, caused by RFI interference.
Using the different aspects of the receiver, this technique is able to correctly detect and identify spoofing attacks, while
maintaining a low probability of false alarm due to the presence of interference.
ACKNOWLEDGMENT
The authors would like to thank Karl Shallberg and Swen Ericson, from Zeta Associates, for helping with the data collection
system and providing the Novatel G-III receiver and required equipment.
REFERENCES
[1] F. Dovis, Ed., GNSS Interference Threats and Countermeasures, ser. GNSS Technology and Applications. Norwood, MA: Artech House, 2015.
[2] M. Pini, B. Motella, L. Pilos, L. Vesterlund, D. Blanco, F. Lindstrom, and C. Maltoni, “Robust on-board ship equipment: the TRITON project,” in
Proceedings of the 10th International Symposium Information on Ships, Hamburg, Germany, September 2014.
[3] A. Grant and P. Williams, “GNSS Solutions: What is the effect of GPS jamming on maritime safety?” Inside GNSS, vol. 4, no. 1, Jan/Feb 2009.
[4] “Lost in space: How secure is the future of mobile positioning?” 2016, IEEE CTN. [Online]. Available: http://www.comsoc.org/ctn/
lost-space-how-secure-future-mobile-positioning?utm_source=Real%20Magnet&utm_medium=Email&utm_campaign=90099084
[5] “UT Austin Researchers Successfully Spoof an $80 million Yacht at Sea,” 2013, available on line. [Online]. Available: http://www.utexas.edu/news/2013/
07/29/ut-austin-researchers-successfully-spoof-an-80-million-yacht-at-sea/
[6] S. Jones, “Europe’s ports vulnerable as ships sail without oversight,” 2016, financial Times. [Online]. Available: http://www.ft.com/cms/s/2/
4d71dc5e-c8ec-11e5-be0b-b7ece4e953a0.html#axzz3zHHDVwur
[7] GPS World staff, “US Coast Guard issues GPS jamming alert,” 2016, GPS World. [Online]. Available: http://gpsworld.com/
us-coast-guard-issues-gps-jamming-alert/

[8] A. Konovaltsev, M. Cuntz, C. Hättich, and M. Meurer, “Autonomous Spoofing Detection and Mitigation in a GNSS Receiver with an Adaptive Antenna
Array,” in Proc. of the 26th Int. Tech. Meeting of The Satellite Division of the Institute of Navigation (ION GNSS+ 2013). Nashville, TN: The Institute
of Navigation, September 2013.
[9] T. E. Humphreys, B. M. Ledvina, M. L. Psiaki, B. W. O’Hanlon, and K. Jr., “Assessing the spoofing threat: development of a portable GPS civilian
spoofer,” in Proc. of the 21st Int. Tech. Meeting of the Satellite Division of The Institute of Navigation (ION GNSS 2008), Savannah,GA, September 2008.
[10] A. Jafarnia-Jahromi, A. Broumandan, J. Nielsen, and G. Lachapelle, “GPS Vulnerability to Spoofing Threats and a Review of Antispoofing Techniques,”
International Journal of Navigation and Observation, vol. 2012, June 2012.
[11] T. E. Humphreys, B. A. Ledvina, M. L. Psiaki, B. W. O’Hanlon, and J. P. M. Kitner, “Assessing the spoofing threat,” GPS World, vol. 20, no. 1, pp.
28–38, January 2009.
[12] M. L. Psiaki and T. E. Humphreys, “GNSS spoofing and detection,” Proceedings of the IEEE, vol. 104, no. 6, pp. 1258–1270, 2016.
[13] L. Huang and Q. Yang, “GPS spoofing: Low-cost GPS Simulator,” 2015, presented during DEFCON 23rd conference by the Unicorn
Team. [Online]. Available: https://media.defcon.org/DEF%20CON%2023/DEF%20CON%2023%20presentations/Lin%20Huang%20&%20Qing%20Yang/
DEFCON-23-Lin-Huang-Qing-Yang-GPS-Spoofing.pdf
[14] D. M. Akos, “Who’s Afraid of the Spoofer? GPS/GNSS Spoofing Detection via Automatic Gain Control (AGC),” Journal of the Institute of Navigation,
vol. 59, no. 4, Winter 2012.
[15] M. Pini, M. Fantino, A. Cavaleri, S. Ugazio, and L. L. Presti., “Signal quality monitoring applyed to spoofing detection,” in Proc. of the 24th Int. Tech.
Meeting of The Satellite Division of the Institute of Navigation (ION GNSS 2011), Portland, OR, September 2011.
[16] K. D. Wesson, D. P. Shepard, J. A. Bhatti, and T. E. Humphreys, “An Evaluation of the Vestigial Signal Defense for Civil GPS Anti-Spoofing,” in Proc.
of the 24th Int. Tech. Meeting of The Satellite Division of the Institute of Navigation (ION GNSS 2011), Portland, OR, September 2011.
[17] K. Ali, E. G. Manfredini, and F. Dovis, “Vestigial signal defense through signal quality monitoring techniques based on joint use of two metrics,” in
presented at the Position Location and Navigation Symposium 2014 (PLANS), Monterey, CA, May 2014.
[18] E. G. Manfredini, F. Dovis, and B. Motella, “Validation of a signal quality monitoring technique over a set of spoofed scenarios,” in Proceedings of the
7th ESA Workshop on Satellite Navigation Technologies (NAVITEC), ESTEC, Noordwijk, The Netherlands, December 2014.
[19] E. G. Manfredini, F. Dovis, and B. Motella, “Signal quality monitoring for discrimination between spoofing and environmental effects, based on
multidimensional ratio metric tests,” in Proceedings of the 2015 International Technical Meeting of The Institute of Navigation ION GNSS+ 2015.
Tampa, FL: Institute of Navigation, September 2015.
[20] K. D. Wesson, B. L. Evans, and T. E. Humphreys, “A combined symmetric difference and power monitoring GNSS anti-spoofing technique,” in Proceeding
of the 1stIEEE Global Conference on Signal and Information Processing, Austin, TX, December 2013.
[21] A. Broumandan, A. Jafarnia-Jahromi, G. Lachapelle, and R. T. Ioannides, “An approach to discriminate gnss spoofing from multipath fading,” in 2016 8th
ESA Workshop on Satellite Navigation Technologies and European Workshop on GNSS Signals and Signal Processing (NAVITEC), Dec 2016, pp. 1–10.
[22] J. N. Gross and T. E. Humphreys, “GNSS Spoofing, Jamming, and Multipath Interference Classification using a Maximum-Likelihood Multi-Tap Multipath
Estimator,” in Proc. of the 2017 Int. Tech. Meeting of the Institute of Navigation (ITM 2017), Monterey, CA, January 2017, pp. 662–670.
[23] T. E. Humphreys, J. A. Bhatti, D. P. Shepard, and K. D. Wesson, “The Texas Spoofing Test Battery: Toward a Standard for Evaluating GPS Signal
Authentication Techniques,” in Proc. of the 25th Int. Tech. Meeting of The Satellite Division of the Institute of Navigation (ION GNSS 2012), Nashville,
TN, September 2012.
[24] A. Ndili and P. Enge, “GPS receiver autonomous interference detection,” in Position Location and Navigation Symposium, IEEE 1998. IEEE, 1998, pp.
123–130.
[25] F. Bastide, D. Akos, C. Macabiau, and B. Roturier, “Automatic Gain Control (AGC) as an Interference Assessment Tool,” in Proceedings of the 16th
International Technical Meeting of the Satellite Division of The Institute of Navigation (ION GPS/GNSS 2003). Portland, OR: Institute of Navigation,
September 2003.
[26] R. E. Phelts, “Multicorrelator techniques for robust mitigation of threats to GPS signal quality,” Ph.D. dissertation, Stanford University, Palo Alto, CA,
2001.