effective educational strategies that take poverty into consideration
TRANSCRIPT

Effective Educational Strategies That Take Poverty into Consideration
Phuong Lien Palafox, M.S., CCC‐SLPRegion 15 Education Service Center
August 14, 2014

Disclosure Statement:
Phuong Lien Palafox, CCC-SLP is employed by Bilinguistics, Inc.
Disclosure:Financial — Salaried by Bilinguistics, Inc.
Nonfinancial — None

Phuong Lien Palafox, CCC-SLP

Do you need Continuing Education or want to listen to this course live?
Click here to visit the online courses.


Location Data Type
2011 2012 2013
United States
Number 16, 387,000 16, 397, 000 16, 087,000
Percent 23% 23% 22%
Children in Poverty

All of the documents and charts in this presentation can be downloaded from our Free Resource Library.
Click here to visit the Resource Library

Click for Audio‐over‐Powerpoint Presentation

http://datacenter.kidscount.org/


2000‐2010
+ 2 million

+ 1 million


“Officially Poor”Officially Poor

http://aspe.hhs.gov/poverty/13poverty.cfm

1963‐1964 Food was about 1/3 of a family’s budget
Federal Poverty Measure = Food Budget X 3

Modern Families’ Expenses

Today:Food = 1/7thFamily Budget
But Poverty Measure Remains the SAME, only updated annually for inflation.

What does the poverty measure tell
us?
21


12%
38%
9%
37%
Married Single‐Parent
Poverty Differs by Family TypeTexas US
KIDS Count Data Center 2012

2012 American Community Survey (Kids Count Data Center)
4x

Child poverty differs by race
34%
40%
15% 14%
Hispanic Black Asian White not‐Hispanic
2012 American Community Survey, U.S. Census Bureau

Poverty differs by age21.8%
13.7%
9.1%
KidsWorking‐age 65+
2012 U.S. Census Bureau

30% Lack Secure Employment

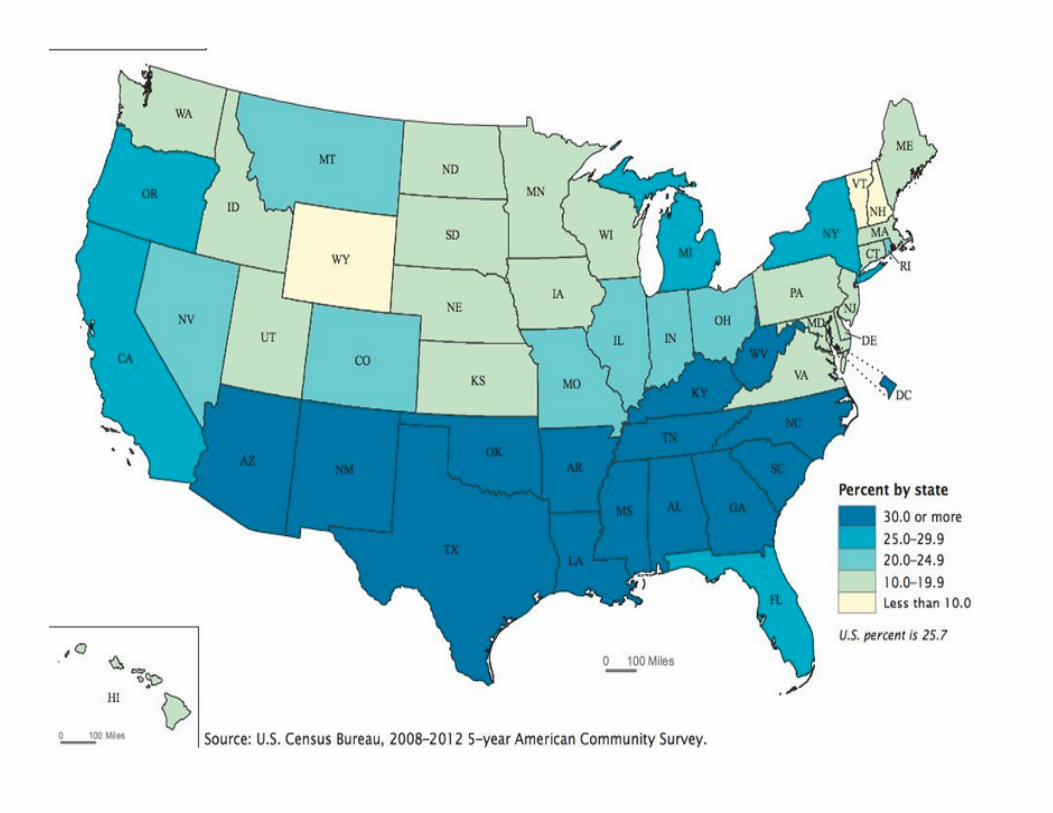
Trends in Education

Source: Annie E. Casey Foundation, National KIDS COUNT Report F. Deviney, 2012


Below Proficient Reading Level
83%
52%
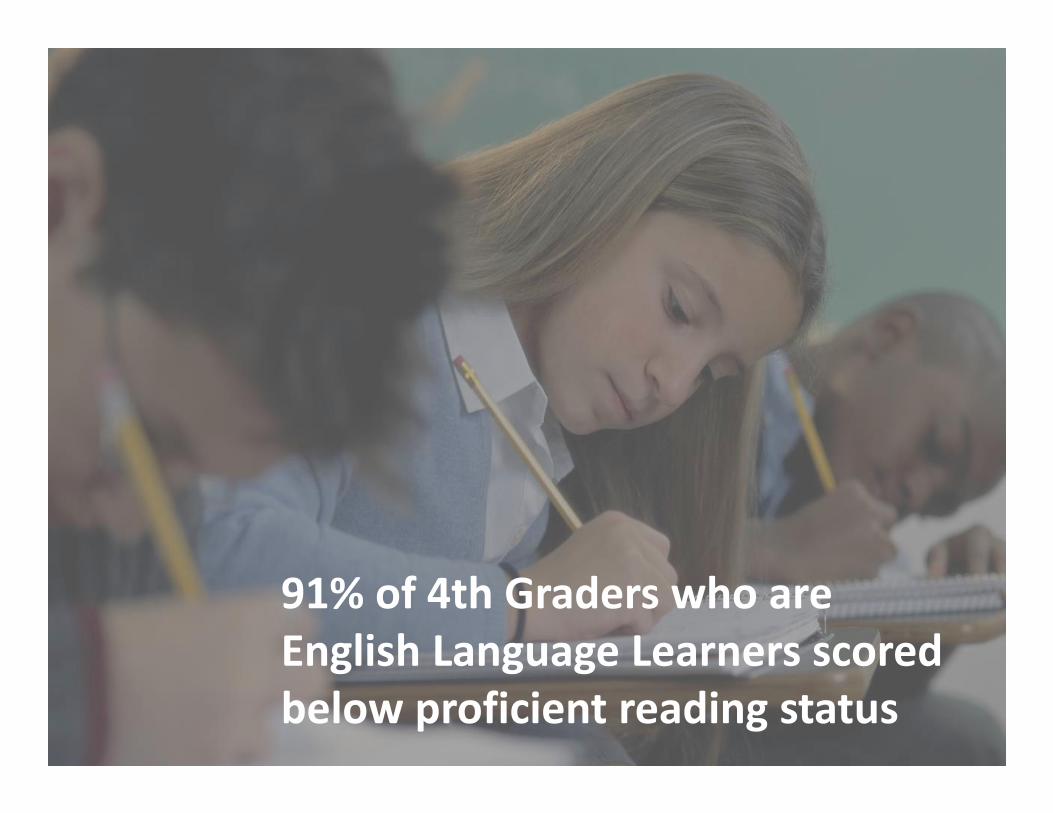
91% of 4th Graders who are English Language Learners scored below proficient reading status

Toddlers from middle and high income families speak MORE than parents from low SES environments when speaking to their own children. ‐ Bracy, 2006

Dropouts only make 36 cents for every dollar earned by college graduates


ERIC
Jensen
TOUR 2014

0
0.1
0.2
0.3
0.4
0.5
0.6
0.7
0.8
0.9
1
Language Working Memory Cognitive Control Reward Processing Memory Spatial Cognition
Effect Sizes
Noble et. Al 2005
Cognitive Functions & Low SES

Emotional & Social
Challenges
Acute & Chronic Stressors
Cognitive Lags
Health & Safety Issues
Four Primary Risk Factors Affecting Families Living in Poverty

Jensen, Eric. (2009). Teaching with Poverty in the Mind. Alexandra, Virginia: ASCD.

Neurogenesis

Merriam‐Webster’s Definition
development of nerves, nervous tissue, or the nervous system

SLP Definition
The brain is GROWINGand getting SMARTER.

Build Vocabulary.Every. Single. Day.

By 3rd grade, children add about 3000 vocabulary words per year.

An average reading program teaches about 400 words per year.

Type I Words: Basic Words (girl, happy, fast)
Montgomery, 2007

Type II Words: High Frequency Words, Across Multiple Domains, Multiple Meanings (measure, sympathy, estimate)
Montgomery, 2007

Type III Words: Low frequency, Subject Specific (Isotope, chasm, warp)
Montgomery, 2007


Relationships Matter

Student Expectations
1.44

Effect Size
.00 or less: Negative Effect.00 ‐.20: Negligible, Unclear Effect.20 ‐.40: Small‐moderate Effects.40 ‐.60: Very Strong Effects.60 ‐ 2.00: Extreme Effects

Teacher Expectations of Student Success
1.03

I work (clap, clap)I work (clap, clap)
I work on telling a story!I work (clap, clap)I work (clap, clap)
I work on opposites.
I work (clap, clap)I work (clap, clap)I work on Thinking
About Others!

Through These Doors Walk
EruditeStudents


Picture Source: Washing ton Post

3X Better with Gestures90% vs 33%After 3 Weeks

Hi FiveLow Five

Working Memory

Let’s ALL tell a story!


OUR

Social Autopsy


Difference or Disorder? Understanding Speech and Language Patterns in Culturally and Linguistically Diverse Students
Rapidly identify speech‐language patterns related to second language acquisition to distinguish difference from disorder.