effect of upflow velocity on the effluent membrane fouling potential in membrane coupled upflow...
TRANSCRIPT

Bioresource Technology 147 (2013) 285–292
Contents lists available at ScienceDirect
Bioresource Technology
journal homepage: www.elsevier .com/locate /bior tech
Effect of upflow velocity on the effluent membrane fouling potentialin membrane coupled upflow anaerobic sludge blanket reactors
0960-8524/$ - see front matter � 2013 Elsevier Ltd. All rights reserved.http://dx.doi.org/10.1016/j.biortech.2013.08.039
⇑ Corresponding author at: Istanbul Technical University, Civil EngineeringFaculty, Environmental Engineering Department, Ayazaga Campus, Maslak, 34469Istanbul, Turkey. Tel.: +31 (0) 15 2784026; fax: +31 (0) 15 2784918.
E-mail addresses: [email protected], [email protected] (H. Ozgun).
Hale Ozgun a,b,⇑, Mustafa Evren Ersahin a,b, Yu Tao a,c, Henri Spanjers a, Jules B. van Lier a
a Department of Watermanagement, Section Sanitary Engineering, Delft University of Technology, PO Box 5048, 2600 GA, Delft, The Netherlandsb Istanbul Technical University, Civil Engineering Faculty, Environmental Engineering Department, Ayazaga Campus, Maslak, 34469 Istanbul, Turkeyc State Key Laboratory of Urban Water Resource and Environment, Harbin Institute of Technology, Harbin 150090, China
h i g h l i g h t s
� Vup is critical for effluent filterability in membrane coupled UASB reactors.� Operation at a higher Vup caused the washout of colloidal particles.� PSD of the effluent varied significantly with variation in Vup.� Effluent characterization results coincide with filterability tests.� Better filterability was obtained with the Vup of 0.6 m/h in comparison to 1.2 m/h.
a r t i c l e i n f o
Article history:Received 6 June 2013Received in revised form 4 August 2013Accepted 6 August 2013Available online 13 August 2013
Keywords:Anaerobic membrane bioreactorMunicipal wastewaterFilterabilityUpflow anaerobic sludge blanket reactorUpflow velocity
a b s t r a c t
This study investigated the effect of upflow velocity (Vup) on biological removal efficiency and effluentfilterability in a laboratory scale upflow anaerobic sludge blanket (UASB) reactor. Upflow velocities of1.2, 0.6 and 1.2 m/h were applied in three successive stages over a total operation period of 116 days. Fil-terability tests were carried out during each stage in order to assess the effect of Vup on subsequent mem-brane performance. Results indicated a significant impact of Vup on both biological performance andphysicochemical effluent characteristics. The observed differences in protein/carbohydrate ratio and par-ticle size distribution (PSD), which play important roles in membrane fouling, lead to the hypothesis thatVup is a critical parameter for effluent filterability in membrane coupled UASB reactors. Results showedthat filterability of the effluent during the operation at 0.6 m/h was better than that during the operationat 1.2 m/h.
� 2013 Elsevier Ltd. All rights reserved.
1. Introduction
The anaerobic membrane bioreactor (AnMBR) is a potential pro-cess for treatment of municipal wastewater (Hu and Stuckey,2007; Vyrides and Stuckey, 2009). Research results indicate thetechnology is feasible, particularly in moderate climate regionswhen high effluent quality and/or agricultural use of treated efflu-ents is required. The performance of AnMBRs is affected by manyfactors including operational parameters, sludge characteristics,membrane location and bioreactor type/configuration (Liao et al.,2006). Possible configurations of AnMBRs include completely stir-red tank reactors (CSTR), UASB and expanded granular sludge bed(EGSB) reactors, etc., coupled with a membrane module (Liao et al.,2006).
Research on AnMBRs, including membrane coupled UASB reac-tors, has received considerable interest recently, leading to severalstudies investigating their potential for the treatment of municipalwastewaters (Kataoka et al., 1992; An et al., 2009; Wu et al., 2009;Zhang et al., 2011; Calderon et al., 2011). Extensive research toinvestigate the microbial communities in the UASB reactors (Quiet al., 2013) and the biofouling layer on membranes (Calderonet al., 2011) has also been conducted and identification of the spe-cies was proposed as an important factor for biofouling control inmembrane coupled UASB systems. Calderon et al. (2011) analyzedthe structure and diversity of the prokaryotic communities in thebiofouling layer of a membrane coupled UASB reactor and pointedout the importance of particular microbial groups such as Sphin-gomonadaceae bacteria and methanogenic Archaea in the occu-rance of biofouling. Due to the resistance of these microbialgroups to standard chemical cleaning, use of alternative antifoulingstrategies was suggested as a promising approach for improvingbiofouling control and prevention.

Table 1Composition of the concentrated synthetic municipal wastewater.
Macronutrient Solution Micronutrient Solution
Compound Unit Value Compound Unit Value
Urea mg/L 1200 FeCl3.6 H2O mg/L 1000NH4Cl mg/L 2000 CoCl2.6H2O mg/L 1000CH3COONa.3 H20 mg/L 7400 MnCl2.4H2O mg/L 250Ovalbumin mg/L 450 CuCl2.2H2O mg/L 15MgSO4.7H2O mg/L 180 ZnCl2 mg/L 25KH2PO4.3H2O mg/L 1400 H3BO3 mg/L 25CaCl2 mg/L 264.9 (NH4)6Mo7O24.4H2O mg/L 45Starch mg/L 6400 Na2SeO3.H2O mg/L 50Milk powder mg/L 1500 NiCl2.6H2O mg/L 25Yeast extract mg/L 600 EDTA mg/L 500Sunflower oil mg/L 1000 HCl 36% mL/L 0.5Micronutrients mL/L 26.6 Resazurin sodium salt mg/L 250
Yeast extract mg/L 1000
286 H. Ozgun et al. / Bioresource Technology 147 (2013) 285–292
In membrane coupled UASB systems, the sludge bed at the bot-tom of the UASB reactor acts as a biofilter prior to the membraneunit by entrapping most of the particulate matter via adsorptionand biodegradation (Seghezzo et al., 1998; Ozgun et al., 2013).Higher fluxes between 10.5–65 L/m2 h could be achieved withUASB reactor coupled systems in comparison to CSTR coupledmembrane systems (Zhang et al., 2010, 2011; Wu et al., 2009; Anet al., 2009). The membrane unit can be located either just abovethe sludge bed in a UASB reactor or in a subsequent stage. In amembrane coupled UASB system, the membrane is only exposedto the supernatant of the sludge bed. Therefore, the fouling propen-sity of the effluent plays a major role in the stable operation of suchreactor systems (Martin-Garcia et al., 2011).
One of the important indicators of the effluent quality formembrane filtration processes is filterability, which determinesthe loss of filtration performance over time due to membrane foul-ing (Janssen et al., 2011). Good filterability, a requirement for goodperformance and a trouble-free operation of AnMBRs, will lead toonly a limited increase in membrane resistance, and thus, a longterm operation at low operational costs. Studies on AnMBRs showhigh variability in filterability (Spagni et al., 2010) because it isinfluenced by many factors including the properties of the feedwater (Kang et al., 2003), membrane material/cake layer (Yunet al., 2006), sludge characteristics (Zhang et al., 2010) andoperational conditions such as shear rate, sludge retention time,temperature, hydraulic retention time, operation mode and Vup
(Drews et al., 2008).For membrane coupled UASB systems, the efficiency of solids
entrapment determines the amount and properties of the solidsleaving the UASB reactor with the effluent. In this context, Vup inmembrane coupled UASB reactors would seem to be the criticalvariable determining the reactor efficiency and effluent foulingpropensity (Mahmoud et al., 2003; Ozgun et al., 2013). The appliedVup can have two opposing effects on the biological removalefficiency in upflow reactors. An increase in Vup may result in anincrease in the biological removal efficiency due to the increasedinteraction between the substrate and the sludge. Conversely, highhydraulic shear force applied at high Vup may also deteriorate theremoval efficiency due to detachment of the captured solids (Mah-moud et al., 2003). Gonçalves et al. (1994) reported that suspendedsolids (SS) removal efficiency decreased from 70% to 51% when Vup
increased from 0.9 to 3.4 m/h in an upflow anaerobic reactor treat-ing sewage. Moreover, total suspended solids (TSS) and volatilesuspended solids (VSS) removal efficiencies were found inverselyproportional to Vup in a UASB reactor treating settled sewage atmoderate temperatures (van Haandel and Lettinga, 1994; Seghezzoet al., 2002; Souza et al., 2006). Since Vup has a significant impacton the stable operation of UASB reactors, an optimum Vup shouldbe applied in UASB reactors enabling the proper distribution ofgas pockets gathered in the sludge bed and providing a good con-tact between substrate and biomass.
Until now, a large number of related scientific studies havefocused on the effect of Vup on solely biological performance ofthe upflow reactors. However, for the cases of membrane coupledUASB systems, there is no information in the literature about itseffect on filterability, a parameter that is closely related to mem-brane fouling potential of the effluent. This study investigatedthe influence of Vup on both effluent filterability and biologicalremoval efficiency in a UASB reactor used for the treatment of mu-nicipal wastewater. In addition to this general objective, the spe-cific aim is to identify the optimum Vup that will result in aneffluent with good filterability values for the case of membranecoupled UASB systems. The effect of Vup on the effluent qualitywas assessed not only on biological based parameters such as or-ganic matter removal but also on physical characteristics. Possiblerelationships between physical characteristics and filterability of
the effluent were determined. The information obtained from thisstudy is valuable for optimizing the hydraulic conditions in mem-brane coupled UASB systems in order to achieve a stable effluentquality and to minimize membrane fouling potential.
2. Methods
2.1. Wastewater source
Synthetic municipal wastewater was used as feed. Macronutri-ent and micronutrient solution compositions were slightly modi-fied from the recipes in the studies of Aiyuk and Verstraete(2004) and Martin et al. (2010), respectively. The feed solutionwas prepared in a concentrated form and stored at 4 �C. It wasalways thoroughly mixed and diluted with tap water before feed-ing into the reactor. The composition of the concentrated substratesolution is presented in Table 1. UASB reactor was fed withwastewater having average total chemical oxygen demand (COD),soluble COD, total nitrogen, ammonium nitrogen (NHþ4 –N), totalphosphorus (TP) and TSS concentrations of 530 ± 30 mg COD/L,159 ± 25 mg COD/L, 54 ± 5.2 mg TN/L, 36 ± 5.5 mg NHþ4 –N/L,12 ± 0.8 mg TP/L and 230 ± 25 mg TSS/L.
2.2. Seed sludge
The reactor was seeded with flocculent anaerobic sludge ob-tained from a pilot scale UASB reactor treating black water (Sneek,the Netherlands). Total solids (TS) and volatile solids (VS) concen-trations of the seed sludge were 22,000 ± 300 mg/L and16,900 ± 235 mg/L, respectively. pH of the sludge was around 7.9.
2.3. Experimental set-up
The experiments were performed using a laboratory scale UASBreactor with an effective volume of 7 L. The system was equippedwith feed, recycle and effluent pumps (Watson Marlow 120U/DV), pH and temperature sensors (Elscolab, M300 ISM), and a gasmeter (Ritter, Milligas Counter MGC-1 PMMA). A three-phase sep-arator was installed at the top part of the reactor to separate thebiogas from the mixed liquor as well as to retain suspended parti-cles in the reactor. The reactor was equipped with sampling portsat different heights for sample withdrawal. During the experi-ments, pH was in the range of 6.8–7.1. The temperature of the jack-eted reactor was controlled at 25 ± 2 �C by a thermostatic waterbath (Tamson Instruments, the Netherlands). The experimentalsystem was connected to a computer running LabView softwarein order to control all pumps and collect pH, temperature andbiogas flow data on-line.
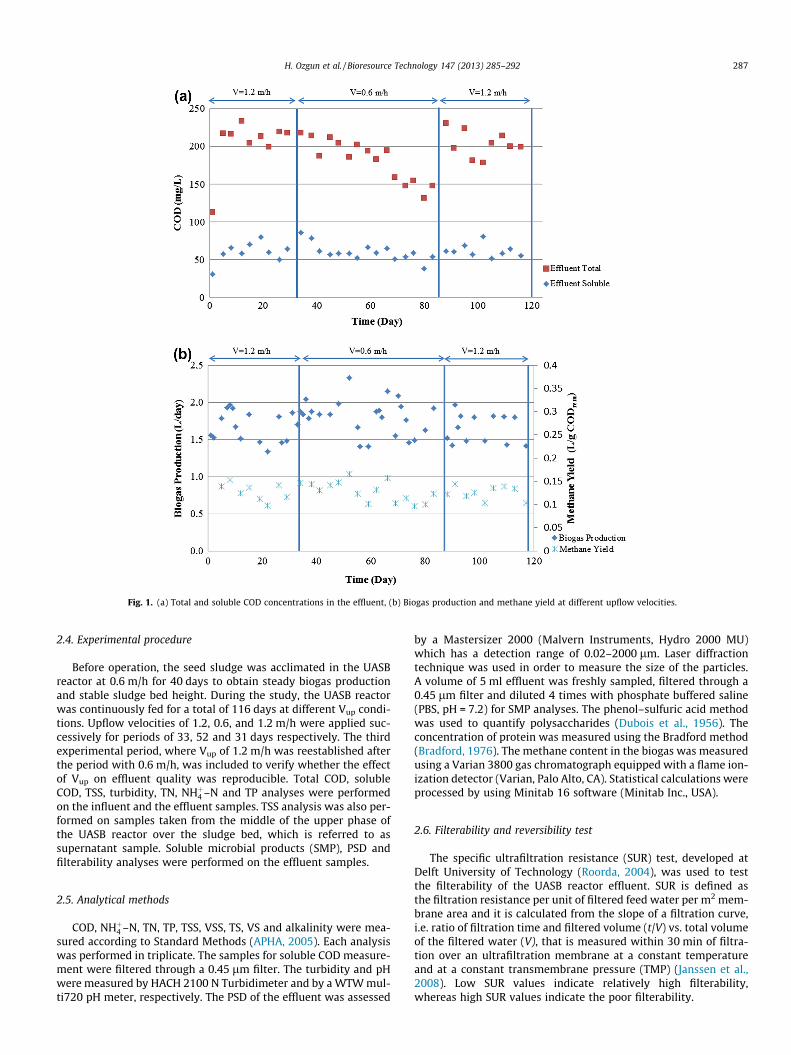
Fig. 1. (a) Total and soluble COD concentrations in the effluent, (b) Biogas production and methane yield at different upflow velocities.
H. Ozgun et al. / Bioresource Technology 147 (2013) 285–292 287
2.4. Experimental procedure
Before operation, the seed sludge was acclimated in the UASBreactor at 0.6 m/h for 40 days to obtain steady biogas productionand stable sludge bed height. During the study, the UASB reactorwas continuously fed for a total of 116 days at different Vup condi-tions. Upflow velocities of 1.2, 0.6, and 1.2 m/h were applied suc-cessively for periods of 33, 52 and 31 days respectively. The thirdexperimental period, where Vup of 1.2 m/h was reestablished afterthe period with 0.6 m/h, was included to verify whether the effectof Vup on effluent quality was reproducible. Total COD, solubleCOD, TSS, turbidity, TN, NHþ4 –N and TP analyses were performedon the influent and the effluent samples. TSS analysis was also per-formed on samples taken from the middle of the upper phase ofthe UASB reactor over the sludge bed, which is referred to assupernatant sample. Soluble microbial products (SMP), PSD andfilterability analyses were performed on the effluent samples.
2.5. Analytical methods
COD, NHþ4 –N, TN, TP, TSS, VSS, TS, VS and alkalinity were mea-sured according to Standard Methods (APHA, 2005). Each analysiswas performed in triplicate. The samples for soluble COD measure-ment were filtered through a 0.45 lm filter. The turbidity and pHwere measured by HACH 2100 N Turbidimeter and by a WTW mul-ti720 pH meter, respectively. The PSD of the effluent was assessed
by a Mastersizer 2000 (Malvern Instruments, Hydro 2000 MU)which has a detection range of 0.02–2000 lm. Laser diffractiontechnique was used in order to measure the size of the particles.A volume of 5 ml effluent was freshly sampled, filtered through a0.45 lm filter and diluted 4 times with phosphate buffered saline(PBS, pH = 7.2) for SMP analyses. The phenol–sulfuric acid methodwas used to quantify polysaccharides (Dubois et al., 1956). Theconcentration of protein was measured using the Bradford method(Bradford, 1976). The methane content in the biogas was measuredusing a Varian 3800 gas chromatograph equipped with a flame ion-ization detector (Varian, Palo Alto, CA). Statistical calculations wereprocessed by using Minitab 16 software (Minitab Inc., USA).
2.6. Filterability and reversibility test
The specific ultrafiltration resistance (SUR) test, developed atDelft University of Technology (Roorda, 2004), was used to testthe filterability of the UASB reactor effluent. SUR is defined asthe filtration resistance per unit of filtered feed water per m2 mem-brane area and it is calculated from the slope of a filtration curve,i.e. ratio of filtration time and filtered volume (t/V) vs. total volumeof the filtered water (V), that is measured within 30 min of filtra-tion over an ultrafiltration membrane at a constant temperatureand at a constant transmembrane pressure (TMP) (Janssen et al.,2008). Low SUR values indicate relatively high filterability,whereas high SUR values indicate the poor filterability.
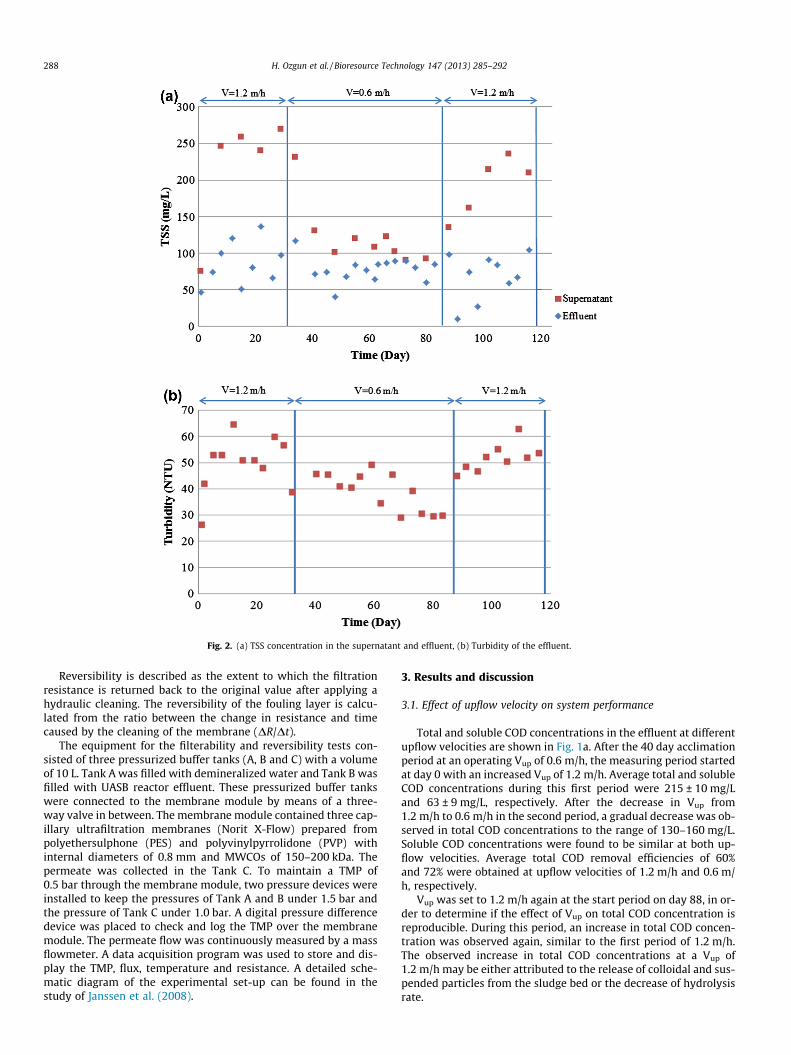
Fig. 2. (a) TSS concentration in the supernatant and effluent, (b) Turbidity of the effluent.
288 H. Ozgun et al. / Bioresource Technology 147 (2013) 285–292
Reversibility is described as the extent to which the filtrationresistance is returned back to the original value after applying ahydraulic cleaning. The reversibility of the fouling layer is calcu-lated from the ratio between the change in resistance and timecaused by the cleaning of the membrane (DR/Dt).
The equipment for the filterability and reversibility tests con-sisted of three pressurized buffer tanks (A, B and C) with a volumeof 10 L. Tank A was filled with demineralized water and Tank B wasfilled with UASB reactor effluent. These pressurized buffer tankswere connected to the membrane module by means of a three-way valve in between. The membrane module contained three cap-illary ultrafiltration membranes (Norit X-Flow) prepared frompolyethersulphone (PES) and polyvinylpyrrolidone (PVP) withinternal diameters of 0.8 mm and MWCOs of 150–200 kDa. Thepermeate was collected in the Tank C. To maintain a TMP of0.5 bar through the membrane module, two pressure devices wereinstalled to keep the pressures of Tank A and B under 1.5 bar andthe pressure of Tank C under 1.0 bar. A digital pressure differencedevice was placed to check and log the TMP over the membranemodule. The permeate flow was continuously measured by a massflowmeter. A data acquisition program was used to store and dis-play the TMP, flux, temperature and resistance. A detailed sche-matic diagram of the experimental set-up can be found in thestudy of Janssen et al. (2008).
3. Results and discussion
3.1. Effect of upflow velocity on system performance
Total and soluble COD concentrations in the effluent at differentupflow velocities are shown in Fig. 1a. After the 40 day acclimationperiod at an operating Vup of 0.6 m/h, the measuring period startedat day 0 with an increased Vup of 1.2 m/h. Average total and solubleCOD concentrations during this first period were 215 ± 10 mg/Land 63 ± 9 mg/L, respectively. After the decrease in Vup from1.2 m/h to 0.6 m/h in the second period, a gradual decrease was ob-served in total COD concentrations to the range of 130–160 mg/L.Soluble COD concentrations were found to be similar at both up-flow velocities. Average total COD removal efficiencies of 60%and 72% were obtained at upflow velocities of 1.2 m/h and 0.6 m/h, respectively.
Vup was set to 1.2 m/h again at the start period on day 88, in or-der to determine if the effect of Vup on total COD concentration isreproducible. During this period, an increase in total COD concen-tration was observed again, similar to the first period of 1.2 m/h.The observed increase in total COD concentrations at a Vup of1.2 m/h may be either attributed to the release of colloidal and sus-pended particles from the sludge bed or the decrease of hydrolysisrate.

Fig. 3. (a)TN and NHþ4 –N concentrations in the effluent, (b) SMP concentrations in the effluent.
H. Ozgun et al. / Bioresource Technology 147 (2013) 285–292 289
The difference in biogas production (Fig. 1b) observed duringeach period with different upflow velocities was found to beinsignificant (p > 0.05). Average methane content of the biogaswas 61 ± 5.7% throughout the study, and methane yields of0.13 ± 0.02 L CH4/g CODremoved and 0.11 ± 0.01 L CH4/g CODremoved
were achieved at upflow velocities of 1.2 m/h and 0.6 m/h, respec-tively. The almost stable biogas production throughout the wholestudy in spite of the larger variations in total COD removal effi-ciency, indicated that Vup influences the release of colloidal andsuspended particles from the sludge bed rather than the biodegra-dation of COD in the reactor.
Operation at a higher Vup may promote the release and washoutof colloidal or particulate organic matter that would reside in thesludge bed at lower Vup. In order to confirm this assumption, TSSand turbidity were measured both in the supernatant and effluentof the UASB reactor. A considerable decrease from the range of230–270 mg/L to 90–110 mg/L was observed in the TSS concentra-tions of the supernatant when Vup was decreased from 1.2 m/h to0.6 m/h. However, there was no significant change (p > 0.05) in TSSconcentrations in the effluent as a result of the Vup change: averageTSS concentrations in the effluent were 91 ± 29 mg/L and81 ± 13 mg/L at 1.2 and 0.6 m/h upflow velocities, respectively(Fig. 2a). This finding may be attributed to the effective separationcapability of the gas–liquid–solids (GLS) separator at the top of theUASB reactor. With the increase in Vup, particles present in thesupernatant will rise to the top but are prevented from rinsingwith the aid of GLS separator. The average turbidity in the effluent
was found to be 55 ± 5 NTU at the Vup of 1.2 m/h, whereas it de-creased to 32 ± 4 at the Vup of 0.6 m/h (Fig. 2b). Variations observedin effluent turbidity (p < 0.05) at different upflow velocities seemcontradictory to TSS results which do not show significant differ-ences between each Vup. Observed results are attributed to thewashout of colloidal particles from the system instead of sus-pended particles as turbidity is an indicator of both suspendedand/or colloidal particles.
NHþ4 –N, TN (Fig. 3a) and TP concentrations were alsomeasured in the UASB reactor effluent at different upflowvelocities. TN mainly i.e., >75% consisted of ammonium. The ra-tio of NHþ4 –N/TN in the effluent was higher at the Vup of 0.6 m/hthan the one obtained at 1.2 m/h, indicating again the washoutof colloidal protein-like materials at higher Vup. TP concentrationwas stable between 10.9 and 12.9 mg/L throughout the wholestudy period.
The presence of SMPs is considered an important factor whichcan play a role in membrane fouling by causing cake or gel layercompacting or even pore clogging (Jarusutthirak and Amy, 2006;Meng et al., 2009; Huang et al., 2011; Zhang et al., 2011). Aquinoet al. (2006) found that SMP was the main contributor of poreclogging in AnMBRs, hence, SMP is likely have a negative impacton the filterability of the UASB effluent. Fouling due to SMP andcolloids may be relatively more important in membrane coupledUASB systems than in membrane coupled CSTR systems becauseof selective accumulation of SMPs on the membrane in the formersystem (Ozgun et al., 2013). In order to investigate the impact of

Fig. 4. PSD at different upflow velocities (a) V = 1.2 m/h, (b) V = 0.6 m/h, (c) V = 1.2 m/h.
290 H. Ozgun et al. / Bioresource Technology 147 (2013) 285–292
SMP carry over at different Vup, the concentrations of protein andpolysaccharide were measured in the effluent (Fig. 3b). The proteinconcentration significantly decreased at the Vup of 0.6 m/h and wasunder the detection limit (2.5 mg/L) in the samples obtained fromday 54 to day 85, indicating that at low Vup protein may be bettermetabolized or retained inside the reactor than at higher Vup. Thiswas supported by the observation that protein concentration againincreased after Vup was raised back to 1.2 m/h. Unlike the effluentprotein concentration, effluent polysaccharide concentration wasalmost unaffected by Vup.
Fig. 5. SUR and DR/Dt values at
Meng et al. (2006) indicated that carbohydrate/protein ratio (C/P) is an important indicator of the fouling potential of an effluentfed to a membrane. They showed that proteins adhere more easilyto a membrane surface and are more likely to induce membranefouling as they are more hydrophobic than carbohydrates.Therefore, a low C/P would indicate the probability of more severemembrane fouling. Huang et al. (2011) also found an inverserelationship between C/P and fouling. Due to the decrease inprotein concentration at lower Vup shown in this study, the C/Pof the effluent increased thus, less fouling may be expected in a
different upflow velocities.

H. Ozgun et al. / Bioresource Technology 147 (2013) 285–292 291
membrane coupled UASB reactor by applying at low Vup in thesludge bed.
Fig. 4 presents PSD curves in the effluent at different upflowvelocities. The effluent at the Vup of 0.6 m/h was more homogenousin terms of PSD showing more unevenly distributed peaks (Fig. 4b),whereas the PSD at Vup of 1.2 m/h was more heterogeneous show-ing more and lower peaks. At a Vup of 1.2 m/h, there was a shift tothe left part of the distribution pattern and an apparent decrease inthe median particle size, D(0.5) was observed, whereas at a Vup of0.6 m/h peaks shifted to the right part of the PSD curve and an in-crease in D(0.5) was observed. From these results, it was concludedthat at the higher upflow velocity, small sized particles werewashed out more vigorously, resulting in an effluent having aD(0.5) of 4.9 lm, whereas a D(0.5) of 108 lm was measured afterthe operation period of 0.6 m/h.
3.2. Filterability and reversibility at different upflow velocities
In order to investigate the relationship between filterability andeffluent characteristics at different upflow velocities, the SUR ofsamples obtained at different upflow velocities was measured(Fig. 5). Fig. 5 shows that the SUR values varied between50 � 1012 and 300 � 1012 m�2 over the whole experimental period.Increased SUR values with an increasing trend were obtained dur-ing the operation at 1.2 m/h, whereas a decreasing trend was ob-served during the operation at 0.6 m/h, which was an indicatorof better filterability at lower Vup. Filterability deterioration at highVup was related to the existence of colloidal material and a heter-ogeneous PSD during the operation at 1.2 m/h. This means thatat the Vup of 0.6 m/h, the average filterability of the UASB effluentwas better and more appropriate for membrane filtration in com-parison to the effluent obtained at 1.2 m/h.
Reversibility of the UASB effluent was also measured at differ-ent upflow velocities in order to determine the extent to which fil-tration resistance is returned back to the original value afterapplying a hydraulic cleaning (Fig. 5). A high value for DR/Dt indi-cates a low reversibility, whereas a high reversibility is indicatedby a low value for DR/Dt. The reversibility and SUR values of theUASB effluent were reciprocally correlated. This relation is also en-dorsed by Roorda (2004). The increase in Vup from 0.6 m/h to1.2 m/h resulted in a decreased reversibility, which can be an indi-cator of unsteady process performance of the membrane unit afterprolonged periods of operation.
4. Conclusion
Vup is an important variable which affects the effluent charac-teristics of a UASB, especially the physical characteristics andPSD. Results suggest that when applying a high sludge bed Vup ina UASB coupled membrane system there will be an increased loadof small particles to the membrane. Effluent characterizationresults coincide with the filterability and reversibility tests. The in-creased effluent particle size seen at the lower Vup was associatedwith a better filterability. Overall the results of this study clearlyindicate that selection of an appropriate Vup plays a major role incontrolling the fouling potential, which is one of the most impor-tant challenges for stable operational process performance ofmembrane coupled UASB reactors.
Acknowledgements
The authors would like to express their gratitude for the PhDFellowship awards provided by the Turkish Academy of Sciences(TUBA) to Hale Ozgun, by HUYGENS Scholarship Programme toM. Evren Ersahin and by the China Scholarship Council to Yu Tao.
This publication is produced as part of the A-Racer project, withPentair, Saxion, TU Delft, Water Board Regge & Dinkel as partners.The project (IWA10007) is partly funded by the Dutch Governmentvia AgentschapNL under the InnoWator program. Authors wouldlike to thank Marisa Buyers-Basso for critically editing the manu-script on style and grammar.
References
Aiyuk, S., Verstraete, W., 2004. Sedimentological evolution in an UASB treatingSYNTHES, a new representative synthetic sewage, at low loading rates.Bioresour. Technol. 93, 269–278.
An, Y.Y., Yang, F.L., Bucciali, B., Wong, F.S., 2009. Municipal wastewater treatmentusing a UASB coupled with cross-flow membrane filtration. J. Environ. Eng. 135,86–91.
APHA, 2005. Standard Methods for Examination of Water and Wastewater, 21st ed.American Public Health Association, Washington, USA.
Aquino, S.F., Hu, A.Y., Akram, A., Stuckey, D.C., 2006. Characterization of dissolvedcompounds in submerged anaerobic membrane bioreactors (SAMBRs). J. Chem.Technol. Biotechnol. 81, 1894–1904.
Bradford, M.M., 1976. A rapid and sensitive method for the quantitation ofmicrogram quantities of protein utilizing the principle of protein-dye binding.Anal. Biochem. 72, 248–254.
Calderon, K., Rodelas, B., Cabirol, N., Gonzales-Lopez, J., Noyola, A., 2011. Analysis ofmicrobial communities developed on the fouling layers of a membrane-coupledanaerobic bioreactor applied to wastewater treatment. Bioresour. Technol. 102,4618–4627.
Drews, A., Vocks, M., Bracklow, U., Iversen, V., Kraume, M., 2008. Does fouling inMBRs depend on SMP? Desalination 231, 141–149.
Dubois, M., Gilles, K.A., Hamilton, J.K., Rebers, P.A., Smith, F., 1956. Colorimetricmethod for determination sugars and related substances. Anal. Chem. 28, 350–356.
Gonçalves, R.F., Cha Lier, A.C., Sammut, F., 1994. Primary fermentation of solubleand particulate organic matter for waste water treatment. Water Sci. Technol.30, 53–62.
Hu, A., Stuckey, D.C., 2007. Activated carbon addition to a submerged anaerobicmembrane bioreactor: effect on performance, transmembrane pressure, andflux. J. Environ. Eng. 133, 73–80.
Huang, Z., Ong, S.L., Ng, H.Y., 2011. Submerged anaerobic membrane bioreactor forlow-strength wastewater treatment: Effect of HRT and SRT on treatmentperformance and membrane fouling. Water Res. 45, 705–713.
Janssen, A.N., van Agtmaal, J., van den Broek, W.B.P., de Koning, J., Menkveld,H.W.H., Schrotter, J.-C., Teeuw, H., van der Graaf, J.H.J.M., 2008. Monitoring ofSUR to control and enhance the performance of dead-end ultrafiltrationinstallations treating wwtp effluent. Desalination 231, 99–107.
Janssen, A., 2011. The Applicability of the SUR Measurement for Ultrafiltration ofWWTP Effluent, PhD thesis. Delft University of Technology, Delft, TheNetherlands.
Jarusutthirak, C., Amy, G., 2006. Role of soluble microbial products (SMP) inmembrane fouling and flux decline. Environ. Sci. Technol. 40, 969–974.
Kang, I.J., Lee, C.H., Kim, K.J., 2003. Characteristics of microfiltration membranes in amembrane coupled sequencing batch reactor system. Water Res. 37, 1192–1197.
Kataoka, N., Tokiwa, Y., Tanaka, Y., Fujiki, K., Taroda, H., Takeda, K., 1992.Examination of bacterial characteristics of anaerobic membrane bioreactors inthree pilot-scale plants for treating low-strength wastewater by application ofthe colony-forming-curve analysis method. Appl. Environ. Microbiol. 58, 2751–2757.
Liao, B.Q., Kraemer, J.T., Bagley, D.M., 2006. Anaerobic membrane bioreactors:applications and research directions. Crit. Rev. Env. Sci. Technol. 36, 489–530.
Mahmoud, N., Zeeman, G., Gijzen, H., Lettinga, G., 2003. Solids removal in upflowanaerobic reactors, a review. Bioresour. Technol. 90, 1–9.
Martin, M.A., De la Rubia, M.A., Martin, A., Borja, R., Montalvo, S., Sanchez, E., 2010.Kinetic evaluation of the psychrophylic anaerobic digestion of syntheticdomestic sewage using an upflow filter. Bioresour. Technol. 101, 131–137.
Martin-Garcia, I., Monsalvo, V., Pidou, M., Le-Clech, P., Judd, S.J., McAdam, E.J.,Jefferson, B., 2011. Impact of membrane configuration on fouling in anaerobicmembrane bioreactors. J. Membr. Sci. 382, 41–49.
Meng, F., Zhang, H., Yang, F., Li, Y., Xiao, J., Zhang, X., 2006. Effect of filamentousbacteria on membrane fouling in submerged membrane bioreactor. J. Membr.Sci. 272, 161–168.
Meng, F.G., Drews, A., Mehrez, R., Iversen, V., Ernst, M., Yang, F.L., Jekel, M., Kraume,M., 2009. Occurrence, source, and fate of dissolved organic matter (DOM) in apilot-scale membrane bioreactor. Environ. Sci. Technol. 43, 8821–8826.
Ozgun, H., Dereli, R.K., Ersahin, M.E., Kinaci, C., Spanjers, H., van Lier, J.B., 2013. Areview of anaerobic membrane bioreactors for municipal wastewatertreatment: integration options, limitations and expectations. Sep. Purif.Technol. 118, 89–104.
Qui, G., Song, Y., Zeng, P., Duan, L., Xiao, S., 2013. Characterization of bacterialcommunities in hybrid upflow anaerobic sludge blanket (UASB)-membranebioreactor (MBR) process for berberine antibiotic wastewater treatment.Bioresour. Technol. 142, 52–62.

292 H. Ozgun et al. / Bioresource Technology 147 (2013) 285–292
Roorda. J.H., 2004. Filtration Characteristics in Dead-End Ultrafiltration of WWTP-Effluent. PhD thesis. Delft University of Technology, Delft, The Netherlands.
Seghezzo, L., Zeeman, G., van Lier, J.B., Hamelers, H.V.M., Lettinga, G., 1998. Areview: The anaerobic treatment of sewage in UASB and EGSB reactors.Bioresour. Technol. 65, 175–190.
Seghezzo, L., Gutierrez, M.A., Trupiano, A.P., Figueroa, M.E., Cuevas, C.M., Zeeman, G.,Lettinga, G., 2002. The effect of sludge discharges and up-flow velocity on theremoval of suspended solids in a UASB reactor treating settled sewage atmoderate temperatures, in: Proceedings of the VII Latin-American Work-Shopand Seminar on Anaerobic Digestion, Merida, Mexico, 22–25 October.
Souza, C.L., Silva, S.Q., Aquino, S.F., Chernicharo, C.A.L., 2006. Production andcharacterization of scum and its role in odour control in UASB reactors treatingdomestic wastewater. Water Sci. Technol. 54, 201–208.
Spagni, A., Casu, S., Crispino, N.A., Farina, R., Mattioli, D., 2010. Filterability in asubmerged anaerobic membrane bioreactor. Desalination 250, 787–792.
Van Haandel, A.C., Lettinga, G., 1994. Anaerobic Sewage Treatment: A PracticalGuide for Regions With A Hot Climate. John Wiley & Sons Ltd., United Kingdom.
Vyrides, I., Stuckey, D.C., 2009. Saline sewage treatment using a submergedanaerobic membrane reactor (SAMBR): Effects of activated carbon addition andbiogas-sparging time. Water Res. 43, 933–942.
Wu, B., An, Y., Li, Y., Wong, F.S., 2009. Effect of adsorption/coagulation on membranefouling in microfiltration process post-treating anaerobic digestion effluent.Desalination 242, 183–192.
Yun, M.A., Yeon, K.M., Park, J.S., Lee, C.H., Chun, J., Lim, D.J., 2006. Characterization ofbiofilm structure and its effect on membrane permeability in MBR for dyewastewater treatment. Water Res. 40, 45–52.
Zhang, X., Wang, Z., Wu, Z., Lu, F., Tong, J., Zang, L., 2010. Formation of dynamicmembrane in an anaerobic membrane bioreactor for municipal wastewatertreatment. Chem. Eng. J. 165, 175–183.
Zhang, X., Wang, Z., Wu, Z., Wei, T., Lu, F., Tonga, J., Mai, S., 2011. Membrane foulingin an anaerobic dynamic membrane bioreactor (AnDMBR) for municipalwastewater treatment: characteristics of membrane foulants and bulk sludge.Process Biochem. 46, 1538–1544.