effect of the chain on thermal conductivity and thermal
TRANSCRIPT

Effect of the chain on thermal conductivity and thermal boundary conductance of long
chain n-alkanes using molecular dynamics and transient plane source techniques
by
Rouzbeh Rastgarkafshgarkolaei
A thesis submitted to the Graduate Faculty of
Auburn University
in partial fulfillment of the
requirements for the Degree of
Master of Science
Auburn, Alabama
August 2, 2014
Keywords: Molecular Dynamics, N-alkanes, Nanoscale Thermal Transport, Phase Change
Materials, Thermal Boundary Conductance, Thermal Conductivity
Copyright 2014 by Rouzbeh Rastgarkafshgarkolaei
Approved by
Jay M. Khodadadi, Chair, Alumni Professor, Department of Mechanical Engineering
Daniel Harris, Associate Professor, Department of Mechanical Engineering
Minseo Park, Professor, Department of Physics

ii
Abstract
The effect of the length of the long chain n-alkane molecules on the nanoscale thermal
transport within various phases of n-alkanes is investigated. The thermal conductivity of the n-
alkanes is determined using both molecular dynamics (MD) simulations and transient
experiments. Molecular dynamics simulations have also been utilized to investigate the thermal
boundary conductance between the layers of perfect crystal n-alkanes.
The thermal conductivity of four (4) n-alkanes including C20H42, C24H50, C26H54 and
C30H62 was determined in the liquid, solid and perfect crystal phases using the non-equilibrium
molecular dynamics (NEMD) method. In the direct NEMD approach, heat flux is imposed over
the sample and the associated temperature profile is obtained after the system reaches the steady
state. Thermal conductivity values for liquid n-alkanes increase as the number of carbon atoms
within the chain is raised which is consistent with the available experimental trend for liquid n-
alkanes. Liquid systems were then cooled down to obtain the solid phase n-alkane structures
whereby randomly oriented molecules in the liquid mode reorganize into crystalline nano-
domain structures. The degree of structural organization is quantified through using the
alignment factor. The more organized solid structures of the solid phase n-alkanes accommodate
higher thermal conductivity values compared to the liquid systems which can be observed in
thermal conductivity results for the solid structures. However, for the case of the solid n-alkanes,
there was no distinct relation between the thermal conductivity and the length of the n-alkane
iii
molecule. The thermal conductivity of C24H50 was higher than the corresponding value for
C20H42. As the number of the carbon atoms within the molecules increase from n=24 to n=26, the
thermal conductivity remained almost unchanged. The thermal conductivity of C30H62 was the
highest among the n-alkanes investigated. In general, there is an increase in the thermal
conductivity of solid n-alkanes as the length of the n-alkane molecules increases. The possible
effect of anisotropy of the thermal conductivity tensor due to the structural organization of the
solid phase was investigated and was shown to be negligible. Perfect crystal n-alkanes serve as
ideal models of structural organization with perfect alignment in a hexagonal lattice. For this
model, all the n-alkane molecules are aligned in the direction of molecular axis which gives the
highest possible thermal conductivity of the n-alkanes. Perfect crystal n-alkanes exhibit a zigzag
trend for the thermal conductivity values as the number of the carbon atoms within n-alkane
molecules increases.
Experiments were carried out to measure the thermal conductivity of three (3) solid n-
alkanes (n = 20, 24 and 26) using the transient plane source (TPS) method. The experimental
thermal conductivity values of C20H42 agreed well with previous measured data of other
researchers. It was shown that the thermal conductivity values of C20H42 and C24H50 are very
close to each other, whereas the thermal conductivity decreased for C26H54.
MD simulations have also been utilized to investigate the thermal interfacial conductance
between the layers of perfect crystal n-alkanes. Both equilibrium and non-equilibrium molecular
dynamics (EMD and NEMD, respectively) methods were used to determine the thermal
boundary conductance. The EMD method uses the Green-Kubo relation for determining the
thermal boundary conductance through relating the power fluctuations across the interfaces to
the thermal boundary resistance. In the NEMD method, the temperature drop/rise across each

iv
interface was related to the thermal boundary conductance between the neighboring layers.
Results from both methods exhibit no dependency of the thermal boundary conductance on the
length of the n-alkane molecules. However, the thermal boundary conductance values obtained
from the EMD simulations are less than the values from the NEMD simulations where this
difference reaches a factor of nearly five (5) in most cases.
v
Acknowledgments
I am grateful to my lovely family for their kind support during the years of my education
and specially my two years of master’s degree in Auburn University where I was away from my
family. My family played the most important role in putting me on the path toward this goal. My
lovely mother always supported me unconditionally and provided me with her mental support.
My father, whose major was economics, got me interested to math and science and his support
helped me through in this way. My brother, who is a mechanical engineer, certainly influenced
me to pursue mechanical engineering. My lovely sisters consistently improved my belief of
achievement. I am extremely appreciative to all of them.
I am grateful to my advisor, Dr. Jay M. Khodadadi, for his great support and advice, who
sparked my interest in nanoscale thermal transport when I just came to Auburn. He was always
advising me to realign myself in the right path for achieving my goals. He always included me in
great scientific experiences that I am grateful for all of them. I am so proud that I have his trust
in my research. More importantly, he opened my eyes on life with his great talks in our spare
times after each meeting. I learned a lot from him and I never forget his lessons.
I would like to thank Mr. Hasan Babaei, my great colleague in Dr. Khodadadi group. He
was the one who helped me through my research and I learned a lot from our great talks on new
topics in this area. Whenever I had got any problem with the simulations, he was there to listen
to me kindly and motivate me to solve the problem. I want to thank Mr. Nabil who helped me to

vi
begin working with my experiments. I would like to thank to my other colleagues Dr. Moeini
Sedeh and Dr. El Hasadi whom I learned a lot by sharing my time with them talking about
different aspects of our research.
I am also grateful to Dr. Minseo Park of the Department of Physics at Auburn University,
who I learned from his lectures in his course, “Solid State Physics”. I am proud that he is serving
as the committee member for my thesis.
I would also like to thank Dr. Daniel Harris of the Department of Mechanical
Engineering, for serving as the committee member and for his informative graduate course that I
have taken during my first semester in Auburn University.
I acknowledge the Department of Mechanical Engineering and the Samuel Ginn College of
Engineering at Auburn University for their support of my graduate fellowship through providing
a teaching assistantship and financial support, respectively.
This thesis is based upon the work partially funded by the United States Department of
Energy under the Award Number DE-SC0002470. This report was prepared as an account of
work sponsored by an agency of the United States Government. Neither the United States
Government nor any agency thereof, nor any of their employees, makes any warranty, express or
implied, or assumes any legal liability or responsibility for the accuracy, completeness, or
usefulness of any information, apparatus, product, or process disclosed, or represents that its use
would not infringe privately owned rights. References herein to any specific commercial product,
process, or service-water by trade name, trademark, manufacturer, or otherwise does not
necessarily constitute or imply its endorsement, recommendation, or favoring by the United

vii
States Government or any agency thereof. The views and opinions of authors expressed herein
do not necessarily state or reflect those of the United States Government or any agency thereof.
Few data in this material are reproduced with permission of Elsevier and Springer.

viii
Table of Contents
Abstract ........................................................................................................................................... ii
Acknowledgments........................................................................................................................... v
List of Tables .................................................................................................................................. x
List of Figures ............................................................................................................................... xii
List of Abbreviations .................................................................................................................... xv
List of Symbols ........................................................................................................................... xvii
1. Chapter One: Introduction ....................................................................................................... 1
1.1 Background and Motivation ............................................................................................. 2
1.2 Objectives and outline of the thesis.................................................................................. 5
2. Chapter Two: Molecular Dynamics Simulations .................................................................. 12
2.1 Overview: ....................................................................................................................... 13
2.2 Integration of the Newton’s equation of motion: ........................................................... 14
2.3 Interatomic Potentials:.................................................................................................... 15
2.4 MD Ensembles: .............................................................................................................. 17
2.5 NEMD Direct Method for Prediction of the Thermal Conductivity and Thermal
Interfacial Conductance............................................................................................................. 17
2.6 Equilibrium Molecular Dynamics Green-Kubo Method ............................................... 19
3. Chapter 3: Thermal Conductivity of n-alkanes ..................................................................... 25
3.1 Introduction .................................................................................................................... 26
3.2 N-alkanes ........................................................................................................................ 27
3.3 Molecular Dynamics Simulations .................................................................................. 28
3.3.1 Review .................................................................................................................... 28
3.3.2 Simulation Methodology ........................................................................................ 31
3.3.3 Model Structures ..................................................................................................... 32
ix
3.3.3.1 Bulk structures..................................................................................................... 32
3.3.3.2 Perfect Crystal ..................................................................................................... 33
3.3.4 Results ..................................................................................................................... 34
3.4 Experimental Measurement............................................................................................ 36
3.4.1 Literature review ..................................................................................................... 36
3.4.2 Sample Preparation ................................................................................................. 37
3.4.3 Experimental Details ............................................................................................... 38
3.4.4 Results ..................................................................................................................... 39
3.5 Comparison between Simulations and Experimental Observations .............................. 40
3.6 Summary ........................................................................................................................ 41
4. Chapter 4: The Thermal Interfacial Conductance between the Layers of N-alkane Molecules
68
4.1 Introduction .................................................................................................................... 69
4.2 Literature Review ........................................................................................................... 70
4.3 Simulation methodology and model structures .............................................................. 71
4.3.1 NEMD simulations ................................................................................................. 71
4.3.1.1 Model structure ................................................................................................... 71
4.3.1.2 Methodology ....................................................................................................... 72
4.3.1.3 Results ................................................................................................................. 73
4.3.2 EMD simulations .................................................................................................... 73
4.3.2.1 Model structure and simulation methodology ..................................................... 73
4.3.2.2 Results ................................................................................................................. 74
4.4 Comparison between the NEMD and EMD results ....................................................... 74
4.5 Summary ........................................................................................................................ 75
5. Chapter Five: Conclusions..................................................................................................... 85
Bibliography ................................................................................................................................. 88
Appendix A: Three Dimensional Fourier’s Law and the Anisotropy Effect ................................ 96

x
List of Tables
Table 1-1: Desired properties of PCM ......................................................................................... 7
Table 1-2: Critical properties of different PCM .......................................................................... 8
Table 1-3: Thermal conductivity values of some common PCM (Data from Mehling and Cabeza,
2008) ............................................................................................................................................. 9
Table 2-1: Summary of mathematical equations for NERD force field .................................... 21
Table 2-2: Parameters of Lennard-Jones model for pair potential ............................................ 22
Table 3-1: MD-determined thermal conductivity values for liquid n-alkanes at T = 360 K and a
comparison between these values with the available data from Rastorguev et al. (1974) .......... 42
Table 3-2: MD-determined thermal conductivity values for solid n-alkanes at T=270 K ........ 43
Table 3-3: MD-determined Thermal conductivity values for perfect crystal n-alkanes at T = 270
K ................................................................................................................................................. 44
Table 3-4: Physical properties of the purchased n-alkanes from ACROS ORGANICS ........... 45
Table 3-5: Thermal conductivity data for solid n-eicosane, n-tetracosane and n-hexacosane
samples at different temperatures using oven solidification method; Data are averaged over five
measurements (maximum standard deviation of 0.5%) ............................................................. 46
Table 3-6: Alignment factors in 3 spatial directions for solid n-alkanes from MD simulations and
the effect of alignment on the thermal conductivity of the solid samples ................................. 47
Table 4-1: Summary of the thermal boundary conductance values obtained from NEMD and
EMD methods ............................................................................................................................ 76

xi
Table 4-2: Summary of the thermal boundary conductance values obtained from the NEMD and
EMD methods ............................................................................................................................. 77
Table A-1: Maximum temperature difference in three directions (x-, y- and z-directions) due to
heat flux in the x-direction for two n-alkanes ............................................................................. 98

xii
List of Figures
Figure 1-1: Schematic diagram of temperature change of PCM during melting and solidification
with possible supercooling during freezing (extracted and reworked from Mehling and Cabeza,
2008) ........................................................................................................................................... 10
Figure 1-2: Groups of materials widely used as PCM with their associated range of melting
temperature and latent storage potential (extracted from Fan, 2011) ......................................... 11
Figure 2-1: Schematic view of the interaction parameters in one n-alkane ............................... 23
Figure 2-2: Schematic view of the position of the heat sink and sources in the system ............ 24
Figure 3-1: N-eicosane (C20H42) molecule (dark grey balls represent carbon atoms and light grey
balls are hydrogen atoms) .......................................................................................................... 48
Figure 3-2: Snapshot of the system in the liquid phase after equilibration for C24H50 molecules
(red balls shown as -CH3 groups and dark balls as -CH2- groups) ............................................ 49
Figure 3-3: Snapshot of the system in the solid phase after equilibration for C24H50 molecules
(red balls shown as -CH3 groups and dark balls as -CH2- groups) ............................................. 50
Figure 3-4: Potential energy change during the melting-solidification cycle for C24H50 .......... 51
Figure 3-5: Snapshot of the perfect crystal model structure before equilibration for the C20H42
molecules ................................................................................................................................... 52
Figure 3-6: Snapshot of the equilibrated system of the C20H42 molecules for the perfect crystal
model .......................................................................................................................................... 53
Figure 3-7: Snapshot of the stacked system of 12 replicas for the perfect crystal of C20H42 .... 54
xiii
Figure 3-8: Temperature profiles in response to the imposed heat flux for liquid phases of (a)
C20H42, (b) C24H50, (c) C26H54 and (d) C30H62 ........................................................................... 55
Figure 3-9: MD-determined thermal conductivity values for liquid n-alkanes at T = 360 K versus
the number of carbon atoms within the chain compared with the data from Rastorguev et al.
(1974) ......................................................................................................................................... 56
Figure 3-10: Inverse of the thermal conductivity in the x-direction versus the inverse of the
length of the stacked layers for different number of replicas for solid (a) C20H42, (b) C24H50, (c)
C26H54 and (d) C30H62 ................................................................................................................ 57
Figure 3-11: MD-determined thermal conductivity values (averaged over all three spatial
directions) for solid n-alkanes at T = 270 K versus the number of carbon atoms within the chain
..................................................................................................................................................... 58
Figure 3-12: Temperature profiles for the case of perfect crystals with six (6) replications in
response to the imposed heat flux for (a) C20H42, (b) C24H50, (c) C26H54 and (d) C30H62 .......... 59
Figure 3-13: Inverse of the thermal conductivity in the x-direction versus inverse of the length of
the stacked layers for different number of replicas for (a) C20H42, (b) C24H50, (c) C26H54 and (d)
C30H62 ......................................................................................................................................... 60
Figure 3-14: Thermal conductivity values for perfect crystal n-alkanes at T = 270 K versus the
number of carbon atoms within the chain .................................................................................. 61
Figure 3-15: Hexacosane (C26H54) solid samples obtained following the oven solidification
process (approximately diameter of 2.5 cm and thickness of 1 cm) .......................................... 62
Figure 3-16: Schematic diagram for preparation of the solid samples ...................................... 63
Figure 3-17: Schematic view of the support set-up for the samples supplied with the TPS 500
instrument (Hot Disk AB, Gothenburg, SWEDEN) .................................................................. 64
Figure 3-18: Experimental thermal conductivity values of the three n-alkanes (n=20, 24 and 26)
as a function of temperature ....................................................................................................... 65
Figure 3-19: Comparison between experimental data of Nabil (2013) and the current
experimentally-determined thermal conductivity values of n-eicosane at different temperatures.
..................................................................................................................................................... 66

xiv
Figure 3-20: Comparison between MD and experiment thermal conductivity values for three n-
alkanes in solid phase (n=20, 24 and 26) ................................................................................... 67
Figure 4-1: Temperature profiles for the case of perfect crystals with six (6) replications in
response to the imposed heat flux for (a) C20H42, (b) C24H50, (c) C26H54 and (d) C30H62 .......... 78
Figure 4-2: Thermal boundary conductance values for n-alkanes (n=20, 24, 26 and 30) utilizing
the NEMD method ..................................................................................................................... 79
Figure 4-3: Snapshot of the system of three stacked n-eicosane (n=20) molecule layers after
equilibration utilizing the EMD method (red balls shown as -CH3 groups and grey balls as -CH2-
groups) ....................................................................................................................................... 80
Figure 4-4: Power auto-correlation function (PACF) for C20H42 molecules as a function of time
..................................................................................................................................................... 81
Figure 4-5: Integration of the PACF for C20H42 molecules as a function of time (red part is the
tail of the graph) ......................................................................................................................... 82
Figure 4-6: Thermal boundary conductance determined by the EMD method vs. the number of
carbon atoms within the n-alkanes molecule chains .................................................................. 83
Figure 4-7: Comparison between the values of the thermal boundary conductance obtained from
the NEMD and EMD methods ................................................................................................... 84
Figure A-1: Temperature profile in the y-direction due to the heat flux in the x-direction for solid
n-C20H42 ...................................................................................................................................... 99
Figure A-2: Temperature profile in the z-direction due to the heat flux in the x-direction for solid
n-C20H42 .................................................................................................................................... 100
Figure A-3: Temperature profile in the y-direction due to the heat flux in the x-direction for solid
n-C30H62 .................................................................................................................................... 101
Figure A-4: Temperature profile in the z-direction due to the heat flux in the x-direction for solid
n-C30H62 .................................................................................................................................... 102

xv
List of Abbreviations
AMM Acoustic Mismatch Model
AUA Anisotropic United Atom
DMM Diffusive Mismatch Model
EMD Equilibrium Molecular Dynamics
HCACF Heat Current Auto-Correlation Function
LAMMPS Large-scale Atomic/Molecular Massively Parallel Simulator
MD Molecular Dynamics
N-alkane Normal Alkane
NePCM Nano Enhanced Phase Change Materials
NEMD Non-Equilibrium Molecular Dynamics
NERD Nath, Escobedo and de Pablo-Revised
OPLS Optimized Potentials for Liquid Simulations
PACF Power Auto-Correlation Function
PCM Phase Change Materials
R Phase Rotator Phase

xvi
SKS Smit, Karaborni and Siepmann
TPS Transient Plane Source
TraPPE Transferable potentials for phase equilibria
UA United Atom

xvii
List of Symbols
Nomenclature
A Cross Section Area, m2
C Parameter Related to Phonon Properties, m2K/W
E Internal Energy, J
F (i) Force acting on the particle i, N
Gk Thermal Boundary Conductance, W/m2K
Ji(t) Heat Current, W
k Thermal Conductivity, W/mK
kB Boltzmann Constant, m2 kg/ s2k
L Length of the Simulation Box, m
m (i) Mass of the Particle i, kg
p (i) Momentum of the Particle i, N s
P(t) Heat Power, W
q Heat Flux, W/m2

xviii
r (i) Position of the Particle i , m
s Orientation Factor
T Temperature, K
t Time Instant, s
U System Potential Energy, J
V Potential Energy, J
V Volume of the Simulation Box, m3
X, Y, Z Distance, m
Greek Symbols
𝜃 Angle between the end-to-end vector a molecule and an axis
𝜃 Bond Angle
𝜎 Van Der Waals Radius (length scale), A
𝜓 Torsional Angle
𝜖 Potential Well Depth, J

xix
Subscripts
∞ Infinity, introduced in equation (2.7)
B Boltzmann
eq Equilibrium
i Index for a Particle, introduced in equation (2.3)
i x, y or z
k Kapitza, introduced in equation (2.8)
LJ Lennard-Jones
r Radius
𝜃 Angle

1
1. Chapter One: Introduction

2
1.1 Background and Motivation
The rapid growth of technology over the last two centuries has led to a very high rate of increase
of demand for energy. Even though fossil fuels are cheap and generally easy to access, the
growing consumption of such fuels is of great concern due to environmental pollution issues.
Therefore, scientists/engineers are greatly interested to replace the fossil fuels with environment-
friendly renewable sources of energy, including solar, wind and wave energy. However,
renewable sources of energy have a major drawback having to do with their unpredictable
availability. Thus, energy storage has been identified as the critical bottleneck to the widespread
adoption and utilization of the renewable energy sources. In particular, storing of thermal energy
(also applicable to waste heat recovery) can be achieved through three distinct modes: 1-
Sensible heat storage, 2- Latent heat storage and 3- Chemical energy storage. Sensible storage is
the process of storing thermal energy through a temperature change in the material in one phase
and utilizes a material’s heat capacity which is known as the specific heat. Latent storage is the
process of achieving thermal energy storage upon melting and releasing the absorbed energy
during freezing of a material at a nearly constant temperature. Instantaneous temperature of a
typical phase change material (PCM) during heating and cooling near its fusion (melting)
temperature are shown in Figure 1-1 that depicts both sensible and latent modes of thermal
energy storage.
A variety of PCM are used as the media for latent heat storage. Water, aqueous salt solutions,
sugar alcohols, paraffins, etc. are typical phase change materials possessing a wide range of
melting temperatures and heat of fusion (Figure 1-2). In choosing an appropriate PCM, one
needs to consider many important factors. A number of such factors are listed in Table 1-1. The
PCM must have a melting point in the range of the system’s working temperature. Many groups
3
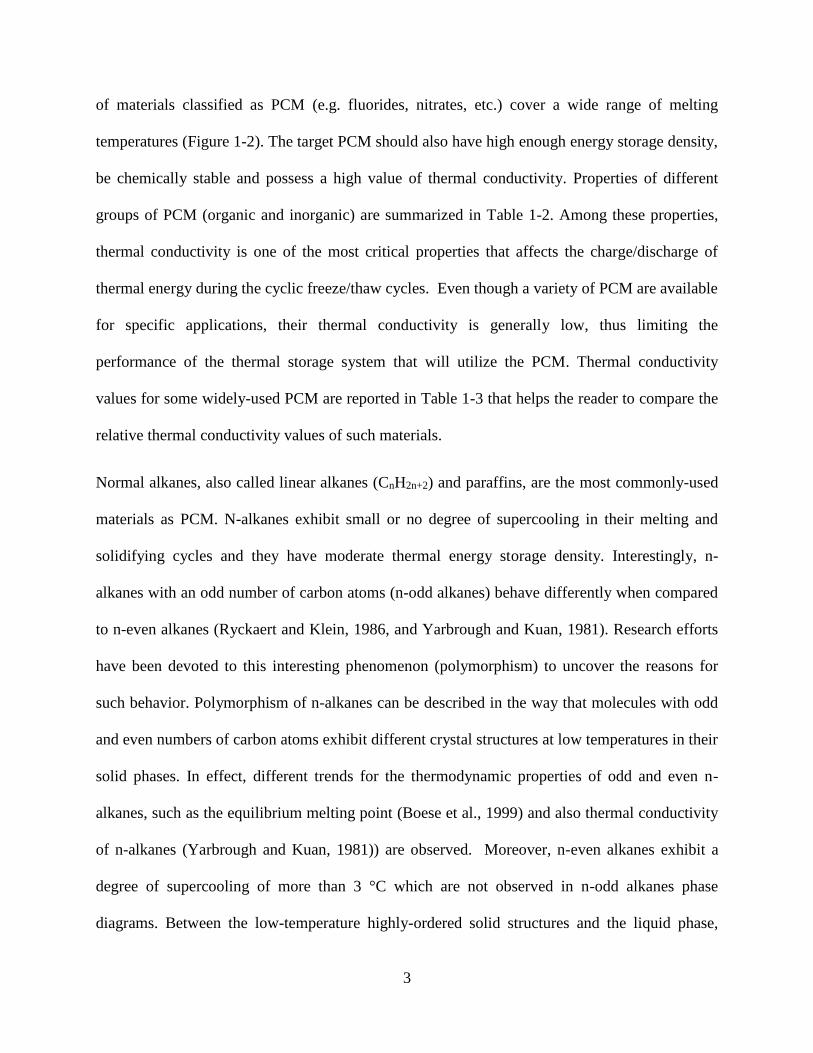
of materials classified as PCM (e.g. fluorides, nitrates, etc.) cover a wide range of melting
temperatures (Figure 1-2). The target PCM should also have high enough energy storage density,
be chemically stable and possess a high value of thermal conductivity. Properties of different
groups of PCM (organic and inorganic) are summarized in Table 1-2. Among these properties,
thermal conductivity is one of the most critical properties that affects the charge/discharge of
thermal energy during the cyclic freeze/thaw cycles. Even though a variety of PCM are available
for specific applications, their thermal conductivity is generally low, thus limiting the
performance of the thermal storage system that will utilize the PCM. Thermal conductivity
values for some widely-used PCM are reported in Table 1-3 that helps the reader to compare the
relative thermal conductivity values of such materials.
Normal alkanes, also called linear alkanes (CnH2n+2) and paraffins, are the most commonly-used
materials as PCM. N-alkanes exhibit small or no degree of supercooling in their melting and
solidifying cycles and they have moderate thermal energy storage density. Interestingly, n-
alkanes with an odd number of carbon atoms (n-odd alkanes) behave differently when compared
to n-even alkanes (Ryckaert and Klein, 1986, and Yarbrough and Kuan, 1981). Research efforts
have been devoted to this interesting phenomenon (polymorphism) to uncover the reasons for
such behavior. Polymorphism of n-alkanes can be described in the way that molecules with odd
and even numbers of carbon atoms exhibit different crystal structures at low temperatures in their
solid phases. In effect, different trends for the thermodynamic properties of odd and even n-
alkanes, such as the equilibrium melting point (Boese et al., 1999) and also thermal conductivity
of n-alkanes (Yarbrough and Kuan, 1981)) are observed. Moreover, n-even alkanes exhibit a
degree of supercooling of more than 3 °C which are not observed in n-odd alkanes phase
diagrams. Between the low-temperature highly-ordered solid structures and the liquid phase,
4
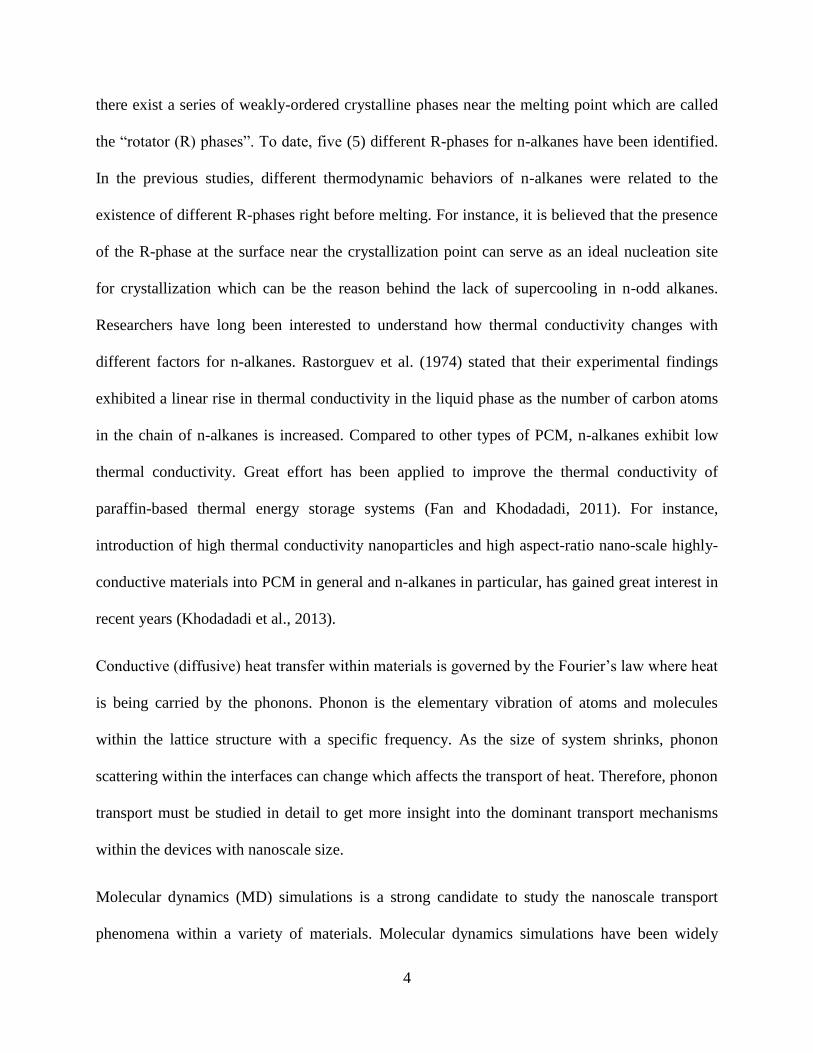
there exist a series of weakly-ordered crystalline phases near the melting point which are called
the “rotator (R) phases”. To date, five (5) different R-phases for n-alkanes have been identified.
In the previous studies, different thermodynamic behaviors of n-alkanes were related to the
existence of different R-phases right before melting. For instance, it is believed that the presence
of the R-phase at the surface near the crystallization point can serve as an ideal nucleation site
for crystallization which can be the reason behind the lack of supercooling in n-odd alkanes.
Researchers have long been interested to understand how thermal conductivity changes with
different factors for n-alkanes. Rastorguev et al. (1974) stated that their experimental findings
exhibited a linear rise in thermal conductivity in the liquid phase as the number of carbon atoms
in the chain of n-alkanes is increased. Compared to other types of PCM, n-alkanes exhibit low
thermal conductivity. Great effort has been applied to improve the thermal conductivity of
paraffin-based thermal energy storage systems (Fan and Khodadadi, 2011). For instance,
introduction of high thermal conductivity nanoparticles and high aspect-ratio nano-scale highly-
conductive materials into PCM in general and n-alkanes in particular, has gained great interest in
recent years (Khodadadi et al., 2013).
Conductive (diffusive) heat transfer within materials is governed by the Fourier’s law where heat
is being carried by the phonons. Phonon is the elementary vibration of atoms and molecules
within the lattice structure with a specific frequency. As the size of system shrinks, phonon
scattering within the interfaces can change which affects the transport of heat. Therefore, phonon
transport must be studied in detail to get more insight into the dominant transport mechanisms
within the devices with nanoscale size.
Molecular dynamics (MD) simulations is a strong candidate to study the nanoscale transport
phenomena within a variety of materials. Molecular dynamics simulations have been widely
5
used in recent years to study the interfacial conductance between the layers and identify the
dominant transport mechanisms related to thermal conductivity measurements. Utilizing MD
simulations, one can understand and analyze the motion and dynamics of atoms and molecules
within the PCM.
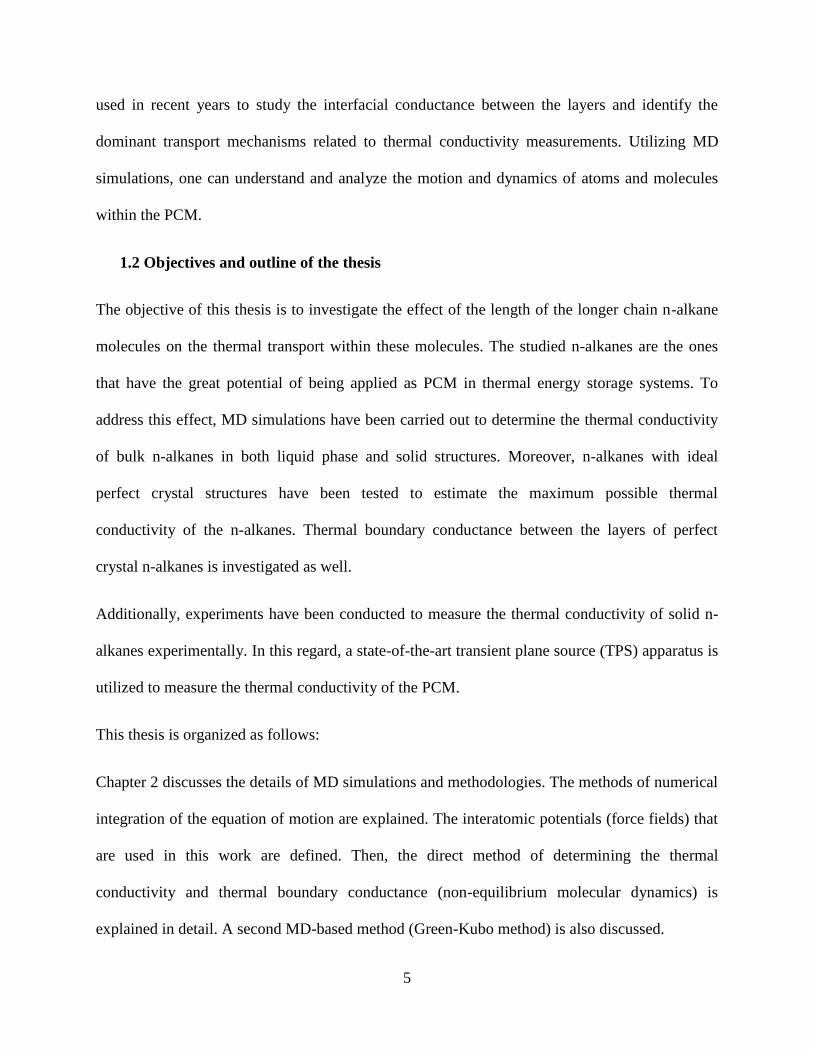
1.2 Objectives and outline of the thesis
The objective of this thesis is to investigate the effect of the length of the longer chain n-alkane
molecules on the thermal transport within these molecules. The studied n-alkanes are the ones
that have the great potential of being applied as PCM in thermal energy storage systems. To
address this effect, MD simulations have been carried out to determine the thermal conductivity
of bulk n-alkanes in both liquid phase and solid structures. Moreover, n-alkanes with ideal
perfect crystal structures have been tested to estimate the maximum possible thermal
conductivity of the n-alkanes. Thermal boundary conductance between the layers of perfect
crystal n-alkanes is investigated as well.
Additionally, experiments have been conducted to measure the thermal conductivity of solid n-
alkanes experimentally. In this regard, a state-of-the-art transient plane source (TPS) apparatus is
utilized to measure the thermal conductivity of the PCM.
This thesis is organized as follows:
Chapter 2 discusses the details of MD simulations and methodologies. The methods of numerical
integration of the equation of motion are explained. The interatomic potentials (force fields) that
are used in this work are defined. Then, the direct method of determining the thermal
conductivity and thermal boundary conductance (non-equilibrium molecular dynamics) is
explained in detail. A second MD-based method (Green-Kubo method) is also discussed.
6
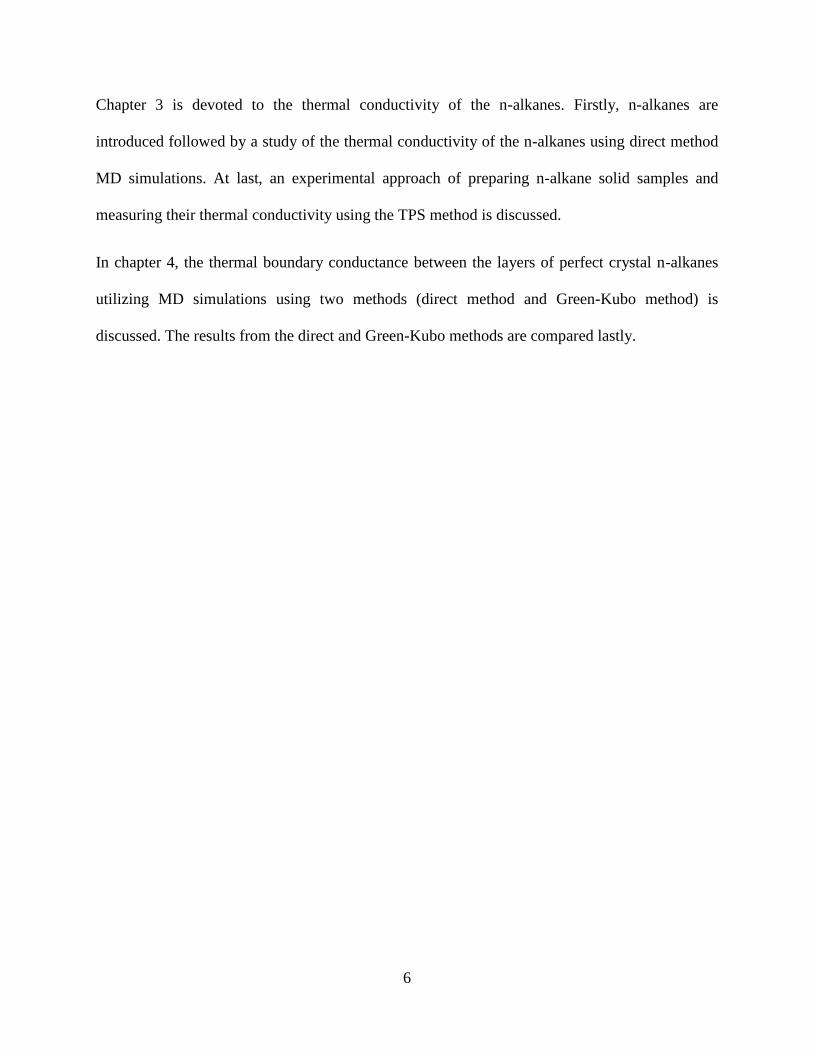
Chapter 3 is devoted to the thermal conductivity of the n-alkanes. Firstly, n-alkanes are
introduced followed by a study of the thermal conductivity of the n-alkanes using direct method
MD simulations. At last, an experimental approach of preparing n-alkane solid samples and
measuring their thermal conductivity using the TPS method is discussed.
In chapter 4, the thermal boundary conductance between the layers of perfect crystal n-alkanes
utilizing MD simulations using two methods (direct method and Green-Kubo method) is
discussed. The results from the direct and Green-Kubo methods are compared lastly.

7
Table 1-1: Important properties of PCM
Heat of fusion High
Thermal conductivity High
Density High
Specific heat High
Volume change Low
Vapor pressure Low
Stability Chemical stability in
response to exposures
Cycling stability > 1000
Supercooling Small
Compatibility With container material
Price Low
Recyclability Desired

8
Table 1-2: Critical properties of different PCM (data from Mehling and Cabeza, 2008)
PCM Melting
temperature
Storage
density
Phase
separation
Super-
cooling
degree
Volume
change Corrosion
Chemical
stability
Eutectic
water-
salt
solutions
< 0 °C good Possible High High
(5-10%)
Corrosive
to metals Stable
Salt
hydrates 5-130 °C high Possible high
High
(up to
10%)
Corrosive
to metals Very stable
Paraffins 0-200 °C good - Little or no
supercooling
High
(10%)
Not
corrosive
to metals
Stable but
not stable at
higher
temperatures
Fatty
acids 0-200 °C good -
Little or no
supercooling -
Corrosive
to metals
Stable but
not stable at
higher
temperatures
Sugar
alcohols 90-200 °C high - Some - Soft
Not stable at
higher
temperatures

9
Table 1-3: Thermal conductivity values of some common PCM (data from Mehling and Cabeza,
2008)
Material Thermal conductivity (W/ m K)
Water (liquid, 20 °C) 0.6
Water (solid, 0 °C) 2.2
CaCl2.6H20 (liquid, 39 °C) 0.54
CaCl2.6H20 (solid, 23 °C) 1.088
LiNO3 (liquid) 0.58
LiNO3 (solid) 1.37
n-Tetradecane (solid)
C14H30 0.21
n-Octadecane (liquid, 40 °C)
C18H38 0.148
n-Octadecane (solid, 25 °C)
C18H38 0.358

10
Figure 1-1: Schematic diagram of temperature change of PCM during melting and consequent
solidification with possible supercooling during freezing (extracted and reworked from Mehling
and Cabeza, 2008)

11
Figure 1-2: Groups of materials widely used as PCM with their associated range of melting
temperature and latent storage potential (extracted from Fan, 2011)

12
2. Chapter Two: Molecular Dynamics Simulations
13
2.1 Overview:
Molecular dynamics (MD) simulations have been utilized to study the transport phenomena at
the nanoscale. Moreover, MD simulations have been widely used to study the thermal transport
within different phases of a variety of materials. In effect, MD simulation is considered to be a
powerful tool that provides observation of a system with atomic-scale resolution. Despite the fact
that MD simulations are simple in principle, there might be a dark side for these simulations that
need to be considered crucial to all simulations and a very careful study is needed to verify the
results (Frenkel, 2013).
In a MD simulation, the positions and momenta of the atoms/molecules are determined by
integrating the governing Newton’s equations of motion. The only input that is needed to
perform a MD simulation is an appropriate function that specifies the atomic interactions which
is called the atomic force field.
There are two notable restrictions for a MD simulation. Firstly, MD simulation neglects the
motion of electrons, thus it is limited to materials for which thermal transport is mostly governed
by the phonon transport. In this thesis, thermal transport within n-alkanes which are considered
to be phonon-dominated heat transfer materials will be studied (Murashov and White, 2004).
Secondly, because the motion of atoms/molecules is specified by the Newton’s equations of
motion, the atomic dynamics in MD simulation are classical. In addition, the MD-predicted
properties in this thesis are evaluated at temperatures near or above the Debye temperature to
minimize the quantum effects.

14
2.2 Integration of the Newton’s equation of motion:
A variety of algorithms have been developed to numerically integrate the simultaneous Newton’s
equations of motion in an MD simulation involving a great number of atoms. These include the
velocity Verlet, Verlet leapfrog and Gear predictor-corrector algorithms. These algorithms are
employed to predict the motion of atoms at the time instant t+Δt based on the position and
momenta at a previous time instant t. Smaller values of the time step, Δt, will lead to a lower
numerical error. In this thesis, the velocity Verlet algorithm is chosen over other algorithms
because of its ease of implementation. The force acting on the particle i, i.e. F(i), is the partial
derivative of the total system potential energy, U, which reads as
𝐹(𝑖) = 𝜕𝑈
𝜕𝑟(𝑖). (2.1)
with r(i) standing for the position vector for atom i. Knowing about the initial position and
momentum of one particle, the Verlet algorithm can be utilized to predict the motion of the
particle at the end of the time step using the Taylor series expansion of the expressions for the
position and momentum of the particle, i.e.,
𝑝 (𝑖, 𝑡 +∆𝑡
2) = 𝑝(𝑖, 𝑡) +
𝐹(𝑖,𝑡)∆𝑡
2 (2.2)
𝑟 (𝑖, 𝑡 +∆𝑡
2) = 𝑟(𝑖, 𝑡) + 𝑝 (𝑖, 𝑡 +
∆𝑡
2) ∆𝑡/𝑚𝑖 (2.3)
𝑝 (𝑖, 𝑡 + ∆𝑡) = 𝑝 (𝑖, 𝑡 +∆𝑡
2) +
𝐹(𝑖,𝑡+∆𝑡)∆𝑡
2. (2.4)
In the relations above, 𝑚𝑖 stands for the mass of atom i, whereas 𝑟(𝑖, 𝑡) and 𝑝(𝑖, 𝑡) are the
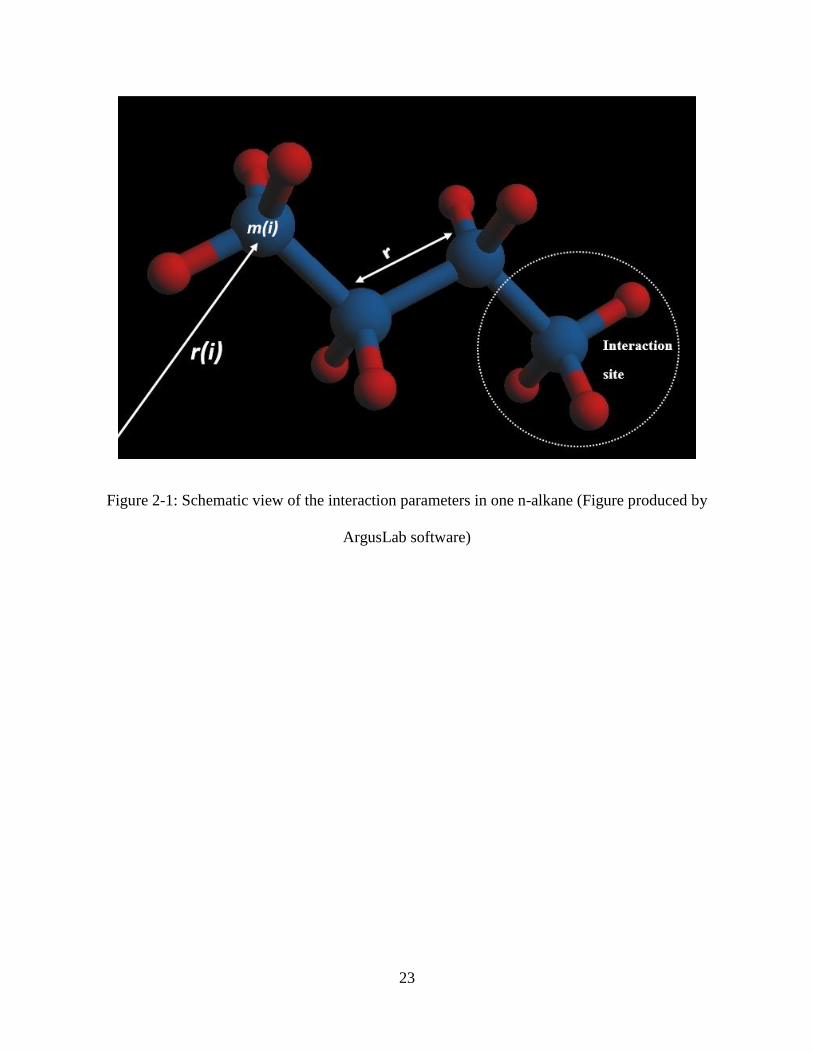
position and momentum vectors of atom i, respectively. A schematic view of the system of
atoms along with the pertinent interaction parameters is shown in Figure 2-1.

15
A very important factor in MD simulations is the value of the time step. This value should be
small enough so that the total energy of the system under study, E, is conserved within the whole
simulation. Landry (2009) used a general rule of choosing the suitable time step and that is to
choose the time step such that 1/Δt is one to two orders of magnitude greater than the maximum
vibrational frequency in the system. It has been shown in previous inelastic neutron scattering
studies that molecular motions in n-alkanes on a time scale of 10-12 seconds are associated with
phase change (Barnes, 1973). In this thesis, we study n-alkanes and the value of time step is
chosen to be 0.5 fs (0.5×10⁻¹⁵ seconds).
2.3 Interatomic Potentials:
An MD simulation is in need of only one type of input and that is the interatomic potential which
is also called the force-field. A force-field describes the potential energy of a system of
molecules/atoms.
The Lennard-Jones potential (Lennard-Jones, 1924) which is referred to as the L-J potential, is a
form of potential that describes the interaction between two neutral particles. In this model, the
particles are modeled as spherical balls. The mathematical model for this potential in the most
common way reads as
𝑉𝐿𝐽 = 4𝜖 [ (𝜎
𝑟)
12
− (𝜎
𝑟)
6
], (2.5)
where 𝜖 is the potential well depth (energy scale), 𝜎 is the van der Waals radius (length scale)
and r is the distance of separation between two particles (Figure 2-1). A cut-off radius is used to
make the calculation process in molecular modeling faster and that is to ignore the van der Waals
interaction energy for pairs with the respective distance being greater than the cut-off radius. The
cut-off radius is usually taken to be 2.5σLJ.
16
In this thesis, we study the thermal transport within long chain n-alkanes. There are various
force-fields for n-alkanes. The four (4) most suitable force-fields for molecular modeling of n-
alkanes are the OPLS (Optimized Potentials for Liquid Simulations) credited to Jorgensen et al.
(1984), TraPPE (Transferable potentials for phase equilibria) introduced by Martin and
Siepmann (1998), SKS (Smit, Karaborni and Siepmann, 1995) and NERD (Nath, Escobedo and
de Pablo-revised) credited to Nath et al. (1998). All of these force-fields utilize mathematical
functions to describe the interaction between the particles considering pairwise interactions, bond
stretching, bond bending and dihedral torsion of such molecules. The differences among these
force-fields are due to the parameters of the respective mathematical functions.
The NERD is a united atom (UA) potential that considers CH2- and CH3- groups as interaction
sites (Figure 2-1). The Anisotropic united atom (AUA) model which is also called the full atomic
model is more realistic than the UA potential since this model considers the hydrogen atoms in
the chains explicitly. However, it is mentioned in previous studies (Martin and Siepmann, 1998)
that the AUA model is computationally very time-consuming and will introduce unnecessary
complications through explicit representation of the hydrogen atoms.
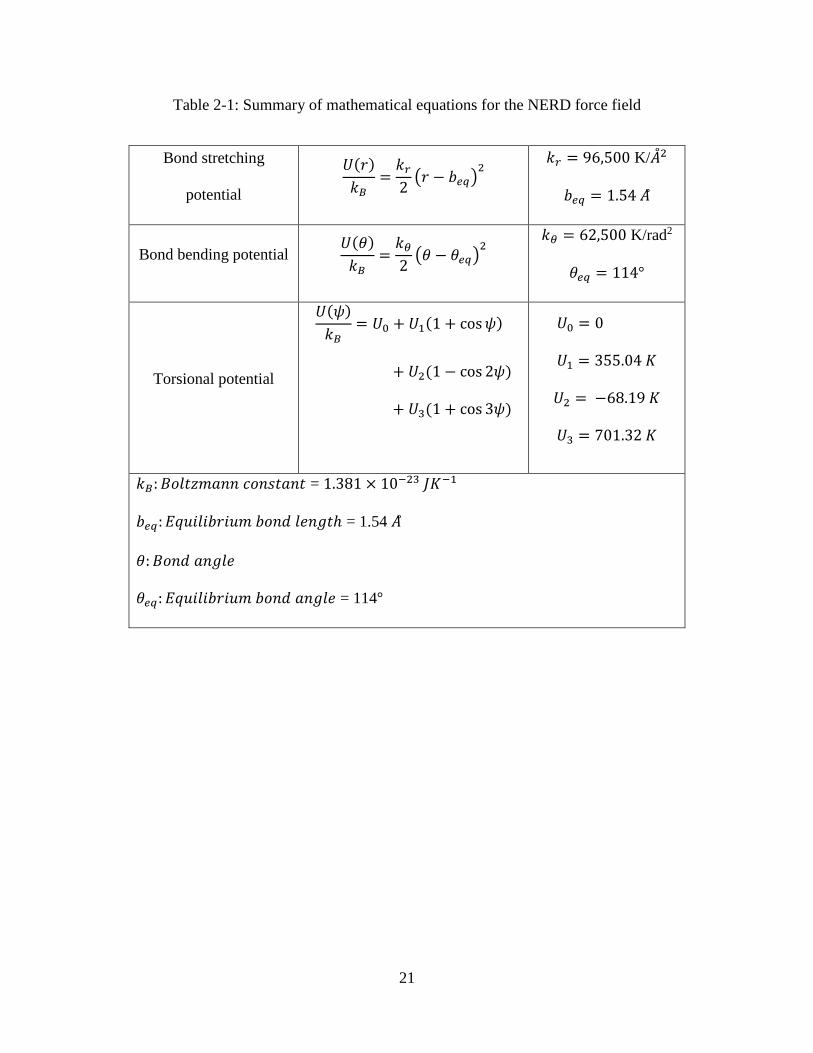
Babaei (2013a) found that the NERD potential is the most appropriate force-field to investigate
the thermal transport within the long chain n-alkanes. Table 2-1 summarizes the mathematical
equations for the NERD force-field.
For the non-bonded intermolecular atoms or atoms belonging to the same molecules but at least
four bounds away, the pair potential is that of the Lennard-Jones model with the parameters that
are summarized in Table 2-2. The cut-off radius in this thesis was chosen to be 10 A.
17
2.4 MD Ensembles:
There are three mostly discussed equilibrium ensembles in statistical thermodynamics for any
isolated system inside a specific volume. These ensembles correspond to classical
thermodynamics in the macroscopic limit.
The NVE ensemble, also known as the microcanonical ensemble, describes a system with a fixed
number of atoms, N, volume, V, and the total energy of the system, E.
The isothermal-isobaric ensemble (NPT), also known as the grand canonical ensemble, describes
a system with fixed pressure and temperature. It is sometimes desired to set the pressure and
temperature of the system in an MD simulation. The system can then be allowed to equilibrate
under the NPT ensemble at the desirable values of pressure and temperature.
Under the conditions of the NVT ensemble, also known as the canonical ensemble, the
temperature of the system is fixed without setting any value for pressure. In this ensemble, the
volume of the system will be held fixed during the simulation.
2.5 NEMD Direct Method for Prediction of the Thermal Conductivity and Thermal
Interfacial Conductance
The direct method is a nonequilibrium, steady state MD approach that can be used to determine
the thermal conductivity of a structure or the thermal interfacial conductance between the layers
of the molecules. In this method, a known heat flux is imposed along one direction that in turn
gives rise to a temperature profile. The thermal conductivity can then be determined using the
Fourier’s law:
�� = −𝑘 ∇𝑇, (2.6)

18
where �� is the heat flux vector, �� is the thermal conductivity tensor and ∇𝑇 is the temperature
gradient vector. A constant amount of kinetic energy is exchanged between a hot and a cold slab
to generate the heat flux (Schelling et al., 2002). The value of the heat flux should be chosen in a
way that the resulting temperature drop in the simulation box is greater than the statistical
temperature fluctuations (Landry, 2009). Figure 2-2 exhibits a schematic view of the system with
the adopted heat sink and sources. Periodic boundary conditions are imposed in all three spatial
directions. It is also possible to utilize one sink and one source in the system that should lead to
similar results we obtained using the arrangement shown in Figure 2-2.
One challenge in utilizing the NEMD direct method is to remove the size effect from the MD-
predicted values for the thermal conductivity. The size effect is mainly due to Phonon dynamics
within the simulation box and it has been mentioned that phonon scattering in the vicinity of
sink/source is one cause for this effect. Schelling et al. (2002) stated that in an NEMD direct
method simulation, the effect of the size of the simulation box should be studied. To remove the
size effect, the thermal conductivity values for different sizes of the structure should be obtained.
The inverse of thermal conductivity values will then be plotted vs. the inverse of the length of the
simulation box. One can determine the thermal conductivity of the system with the length of
infinity (𝐿 → ∞) using an extrapolation from the resulting graph. The extrapolation procedure
explained here is based on the assumption that the thermal conductivity of an isotropic system is
a function of the length of sample and the phonon properties, or equivalently,
1
𝑘=
1
𝑘∞+
𝐶
𝐿, (2.7)
where 𝑘∞ is the macroscopic thermal conductivity and C is related to the phonon properties.
Sellan et al. (2010) stated that increasing the simulation cell size simply to remove the cell size

19
effect has a limitation. They found that increasing the size might result in over-estimation of the
thermal conductivity values. They proved that the systems with a minimum size of the largest
mean free path of the effective phonon modes in thermal transport should be utilized to predict
the macroscopic thermal conductivity.
The NEMD method is also utilized to determine the thermal interfacial conductance between the
layers of perfect crystal n-alkanes. Temperature profile associated with the imposed heat flux
was collected from the MD simulations. There is a temperature jump between each two
neighboring layers of the perfect crystal n-alkane molecules. Thermal interfacial conductance
can be calculated using the formula:
𝐺𝑘 =𝑞
∆𝑇, (2.8)
where q is the value for the imposed heat flux and ∆𝑇 is the average of all the temperature
differences between the neighboring layers.
2.6 Equilibrium Molecular Dynamics Green-Kubo Method
The Green-Kubo method relates the fluctuating dynamical variables of the systems in
equilibrium to their transport properties (Kubo, 1957, and Vogelsang et al., 1987). The
equilibrium molecular dynamics (EMD) Green-Kubo method has been widely used to determine
the thermal conductivity of the material utilizing the relation below:
𝑘𝑖𝑖 =𝑉
𝑘𝐵𝑇2 ∫ < 𝐽𝑖(𝑡)𝐽𝑖(0) > 𝑑𝑡, 𝑖 = 𝑥, 𝑦 𝑜𝑟 𝑧∞
0 (2.9)
where the symbol < > denotes ensemble average, V is the volume of the simulation box, kB is the
Boltzmann constant, t is time and J is the heat current which is obtained from the simulations. By
20
integrating the heat current autocorrelation function (HCACF) over time, the i-th diagonal
component of the thermal conductivity matrix is calculated at temperature T.
In this thesis, however, the Green-Kubo method has been used to predict the thermal interfacial
conductance (Gk) between the layers of the perfect crystal n-alkanes. The Green-Kubo formula
for calculating the thermal interfacial conductance is as follow:
𝐺𝑘 =1
𝐴𝑘𝐵𝑇2 ∫ < 𝑝(𝑡)𝑝(0) > 𝑑𝑡,∞
0 (2.10)
where A is the cross sectional area of the solid interface and p is the fluctuating heat power
across the interface which can be computed by p(t) =dE(t)/dt, with E standing for the
instantaneous internal energy of the layer of molecules that is obtained from the simulations.
The structure was equilibrated under the NPT ensemble for 3,000,000 time steps. The total
energy of the middle layer then was recorded every five (5) time steps for 2,000,000 time steps
under the NVE ensemble for calculating the power and the auto-correlation. Correlation time
was chosen to be 32,000 time steps (80 ps). According to a work on MD-based determination of
the interfacial thermal conductance (Liang et al., 2013), one can determine the Gk by fitting the
tail of the integration of the power auto-correlation function (PACF) by exponential functions.
Five (5) other simulations were performed for the same structure with different initial conditions
to check on the repeatability of the simulations.
21
Table 2-1: Summary of mathematical equations for the NERD force field
Bond stretching
potential
𝑈(𝑟)
𝑘𝐵=
𝑘𝑟
2(𝑟 − 𝑏𝑒𝑞)
2
𝑘𝑟 = 96,500 K/��2
𝑏𝑒𝑞 = 1.54 ��
Bond bending potential 𝑈(𝜃)
𝑘𝐵=
𝑘𝜃
2(𝜃 − 𝜃𝑒𝑞)
2
𝑘𝜃 = 62,500 K/rad2
𝜃𝑒𝑞 = 114°
Torsional potential
𝑈(𝜓)
𝑘𝐵= 𝑈0 + 𝑈1(1 + cos 𝜓)
+ 𝑈2(1 − cos 2𝜓)
+ 𝑈3(1 + cos 3𝜓)
𝑈0 = 0
𝑈1 = 355.04 𝐾
𝑈2 = −68.19 𝐾
𝑈3 = 701.32 𝐾
𝑘𝐵: 𝐵𝑜𝑙𝑡𝑧𝑚𝑎𝑛𝑛 𝑐𝑜𝑛𝑠𝑡𝑎𝑛𝑡 = 1.381 × 10⁻²³ 𝐽𝐾−1
𝑏𝑒𝑞: 𝐸𝑞𝑢𝑖𝑙𝑖𝑏𝑟𝑖𝑢𝑚 𝑏𝑜𝑛𝑑 𝑙𝑒𝑛𝑔𝑡ℎ = 1.54 ��
𝜃: 𝐵𝑜𝑛𝑑 𝑎𝑛𝑔𝑙𝑒
𝜃𝑒𝑞: 𝐸𝑞𝑢𝑖𝑙𝑖𝑏𝑟𝑖𝑢𝑚 𝑏𝑜𝑛𝑑 𝑎𝑛𝑔𝑙𝑒 = 114°

22
Table 2-2: Parameters of the Lennard-Jones model for pair potentials
CH2-CH2
𝜎 = 3.93 ��
𝜀 = 0.0907 𝑘𝑐𝑎𝑙/𝑚𝑜𝑙
CH3- CH3 𝜎 = 3.91 ��
𝜀 = 0.2059 𝑘𝑐𝑎𝑙/𝑚𝑜𝑙
CH2-CH3
𝜎𝐶𝐻2−𝐶𝐻3=
𝜎𝐶𝐻2+ 𝜎𝐶𝐻3
2
𝜀𝐶𝐻2−𝐶𝐻3= (𝜀𝐶𝐻2
𝜀𝐶𝐻3)
1/2
23
Figure 2-1: Schematic view of the interaction parameters in one n-alkane (Figure produced by
ArgusLab software)

24
Figure 2-1: Schematic view of the position of the heat sink and sources in the system
25
3. Chapter 3: Thermal Conductivity of n-alkanes

26
3.1 Introduction
Phase change materials (PCM) have the great potential to be utilized in thermal energy
storage/conversion systems, waste heat recovery, thermal management of electronics, etc. These
materials can store thermal energy upon melting and then release the absorbed energy during
freezing at a nearly constant temperature. This type of storing thermal energy is known as the
latent heat mode of thermal energy storage. Among the 500+ materials known as PCM (some
groups shown in Fig. 1.2), n-alkanes (CnH2n+2) in particular are the most commonly-used
materials as PCM. N-alkanes exhibit small or no degree of supercooling in their melting and
solidifying cycles and they have moderate thermal energy storage density. Compared to other
types of PCM, n-alkanes exhibit low thermal conductivity. Great effort has been applied to
improve the thermal conductivity of paraffin-based thermal energy storage systems (Fan and
Khodadadi, 2011). For instance, introduction of high aspect-ratio nano-scale highly-conductive
materials into n-alkanes to enhance the thermal conductivity has gained great interest in recent
years (Wang et al., 2009). Great efforts have been devoted to investigate the crystalline
structures that the n-alkanes possess in their solid form utilizing different methods such as the X-
ray scattering, MD simulations and etc. In the literature, there are thermal conductivity data of
shorter n-alkanes in both liquid and solid phases. However, as the number of carbon atoms
within the molecule chains increase, thermal conductivity data on solid phase n-alkanes is
missing. From the earlier studies it is well-known that for the shorter n-alkanes when the number
of carbon atoms within the molecule chain is less than 20, the thermal conductivity of the n-
alkanes increase in both solid and liquid phase as the length of the n-alkane molecule goes up.
Therefore, we studied the effect of the length of the n-alkane molecules on their thermal
conductivity for longer n-alkanes (n > 20).
27
This chapter is devoted to a discussion of both MD and experimental studies on the
determination of the thermal conductivity of n-alkanes. Firstly, section 3.2 presents a short
introduction on n-alkanes and their structure. This chapter continues with section 3.3 which is
about MD simulations utilized to determine the thermal conductivity of the n-alkanes (n= 20, 24,
26 and 30).
In section 3.4, we utilized the transient plane source (TPS) method to measure the thermal
conductivity of these n-alkanes (n= 20, 24 and 26). The TPS method has been widely used by
researchers to measure thermal conductivity of a wide range of materials.
Thermal conductivity data from the MD simulations and the experiments are then compared in
section 3.5.
3.2 N-alkanes
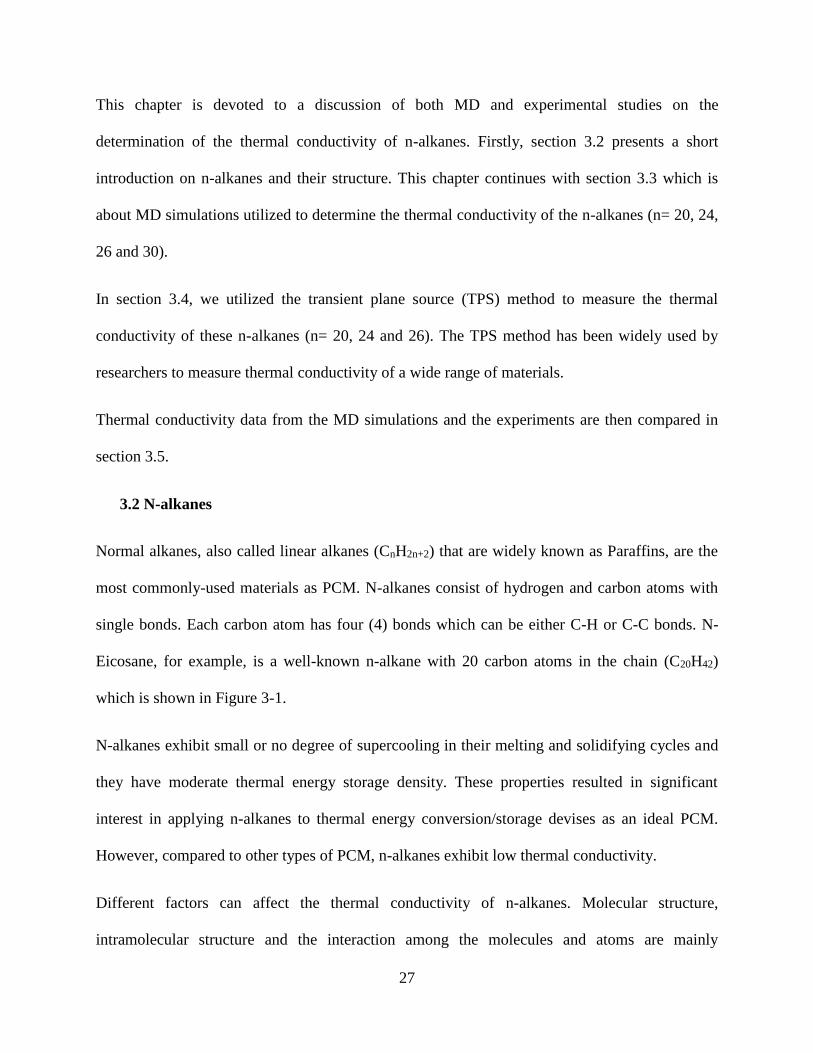
Normal alkanes, also called linear alkanes (CnH2n+2) that are widely known as Paraffins, are the
most commonly-used materials as PCM. N-alkanes consist of hydrogen and carbon atoms with
single bonds. Each carbon atom has four (4) bonds which can be either C-H or C-C bonds. N-
Eicosane, for example, is a well-known n-alkane with 20 carbon atoms in the chain (C20H42)
which is shown in Figure 3-1.
N-alkanes exhibit small or no degree of supercooling in their melting and solidifying cycles and
they have moderate thermal energy storage density. These properties resulted in significant
interest in applying n-alkanes to thermal energy conversion/storage devises as an ideal PCM.
However, compared to other types of PCM, n-alkanes exhibit low thermal conductivity.
Different factors can affect the thermal conductivity of n-alkanes. Molecular structure,
intramolecular structure and the interaction among the molecules and atoms are mainly

28
responsible for thermal transport within these molecules (Rastorguev et al., 1975). Other factors
can also affect the thermal transport directly or by altering the above factors. In this thesis, the
effect of the length of the n-alkane molecules on their thermal conductivity is investigated. The
length of the molecule can be related to the mass of the molecule as well. Thus, the effect of
either mass or the length of n-alkane molecules on the thermal conductivity is studied.
3.3 Molecular Dynamics Simulations
3.3.1 Review
There has been considerable effort to calculate the transport properties of n-alkanes utilizing the
NEMD and EMD methods. Researchers have put great time and effort to calculate the shear
viscosity of shorter n-alkanes (Edberg et al., 1987, Marechal et al., 1987). Babaei et al. (2013b)
determined the thermal transport properties of n-eicosane using the NEMD and EMD
simulations and predicted the thermal conductivity of n-eicosane in both liquid and solid phases.
They realized that as the n-eicosane solidifies, the molecules form nano domain crystallines.
They showed in their simulations that the thermal conductivity of solid phase n-eicosane is
nearly twice the thermal conductivity of liquid n-eicosane and this enhancement is mainly due to
the observed nanoscale grain boundaries. The effect of adding nano additives such as carbon
nanotubes (CNT) and graphene sheets is investigated in their work as well (Babaei et al., 2013b).
They utilized both NEMD and EMD simulations to determine the thermal interfacial
conductance between the paraffin and CNT layers and paraffin and graphene sheets as well. Luo
et al. (2010) studied the chain length effect for systems with different alkanedithiol molecule
chain lengths using EMD simulations. They determined the thermal conductivity of 3 systems
with different lengths that were -S-(CH2)8-S-, –S-(CH2)9-S- and –S-(CH2)10-S-. They believed
that there is no chain length effect on the thermal conductivity based on their simulations.

29
However, it is stated that longer n-alkanes (n=14 to 20) exhibit two different trends for thermal
conductivity values depending on if n (number of carbon atoms in the chain) is odd or even
(Murashov and White, 2004). Moreover, it is stated that thermal conductivity of n-alkanes
increases linearly as the number of the carbon atoms increase (Murashov and White, 2004). N-
alkane molecules with an odd number of carbon atoms exhibit 30% lower thermal conductivities
compared to the molecules with an even number of carbon atoms. This behavior is mainly
because of the different packing structures at low temperatures which is called polymorphism
(Ryckaert and Klein, 1986). Polymorphism of n-alkanes can be described in the way that
molecules with odd (n-odd alkanes) and even (n-even alkanes) numbers of carbon atoms exhibit
different crystal structures at low temperatures in their solid phase. In effect, different trends for
the thermodynamic properties of odd and even n-alkanes, such as the equilibrium melting point
and also thermal conductivity of n-alkanes are observed. Moreover, n-even alkanes exhibit a
degree of supercooling of more than 3 °C which are not observed in n-odd alkanes phase
diagrams. Between low-temperature highly-ordered solid structures and the liquid phase, there
exist a series of weakly-ordered crystalline phases near the melting point which are called
“rotator (R) phases” (Ungar and Masic, 1985). To date, five (5) different R-phases for n-alkanes
have been identified. In the previous studies, different thermodynamic behaviors of n-alkanes
were related to the existence of different rotator phases (R-phases) right before melting. R-phases
are a series of phases that occur between the fully-ordered crystalline phases of n-alkanes and the
liquid phase without any long range order about their long axis. For instance, it is believed that
the presence of the R-phase at the surface near the crystallization point can serve as an ideal
nucleation site for crystallization which can be the reason behind the lack of supercooling in n-
odd alkanes. Sirota et al. (1992) presented a detailed study on the rotator phases of n-alkanes

30
using the x-ray scattering technique. However, MD simulations have also been utilized to study
theses rotator phases.
Ryckaert et al. (1987) used MD simulations to investigate the rotator phase structures and the
effect of temperature on packing within the n-odd n-alkanes chains. They utilized a centered
orthorhombic lattice for the initial structure of the n-alkanes. The phase change of different n-
alkanes from butane to n-dodecane was studied by Esselink et al. (1994) utilizing MD
simulations. They determined the melting and crystallization temperatures for those n-alkanes.
Marbeuf and Brown (2006) studied the transition from ordered crystalline to a melt for odd and
even n-alkanes (C18H38, C19H40, and C20H42) using MD calculations. Based on the number of
carbons and whether it is odd or even, alkanes show different behaviors in melting process in
terms of rotator phases before complete melting. Wentzel and Milner (2010) carried out MD
simulation to study the ordered rotator phases of pure C23 and a mix of C21-C23. They tried
different all-atom potentials for the n-alkane molecules and showed that their results were in
good agreement with the observed physical properties measured by experiments.
Rao et al. (2013) utilized MD simulations to investigate the self-diffusion and heat capacity of n-
alkanes and their binary mixtures. Two n-alkanes including n-nonadecane ad n-tetracosane and
their mixtures were used in this study. They compared the results of their MD simulations with
the experimental observations.
In this thesis, effect of the length of the n-alkane molecules on their thermal conductivity is
investigated. For this objective, four (4) n-alkane molecules with different lengths are studied.
C20H42 (n-eicosane), C24H50 (n-tetracosane), C26H54 (n-hexacosane) and C30H62 (n-triacontane)
are the n-alkane molecules that are investigated in this work.

31
3.3.2 Simulation Methodology
The NEMD direct method has been used to determine the thermal conductivity of n-alkane
molecules in liquid, solid and perfect crystal phases (Schelling et al., 2002). In the direct method,
a known heat flux is imposed through the simulation box. The heat flux can be generated by
exchanging kinetic energy between cold (sink) and hot (source) slabs. The thermal conductivity
can then be determined using the Fourier’s law under steady state conditions.
𝑞𝑖 = −𝑘𝑖𝑗𝑑𝑇
𝑑𝑋𝑗, (3.1)
where 𝑞𝑖 (i =1, 2 and 3) is the heat flux component in the i-th direction, 𝑘𝑖𝑗 is thermal
conductivity tensor and 𝑑𝑇
𝑑𝑋𝑗 is the temperature gradient due to the heat flux. This approach was
adopted in view of the negligible effect of the anisotropy for solid systems (Appendix A).
Interaction between atoms of n-alkane molecules is defined by the NERD force field (Nath et al.,
1998). Neighboring atoms, bonds, angles and dihedrals are required to be defined in the
appropriate input file to utilize this potential. This force field describes bonded interactions with
bond stretching, bending and torsion and non-bonded interactions with the LJ potential between
the interaction sites within different molecules and with the appropriate cut-off radius for the
sites in the same molecules.
The Newton’s equations of motion are integrated numerically using the velocity Verlet algorithm
with a time step of 1 fs. All simulations were performed with the large-scale atomic/molecular
massively parallel simulator (LAMMPS) molecular dynamics package (Plimpton, 1995).

32
3.3.3 Model Structures
3.3.3.1 Bulk structures
Four different n-alkanes including C20H42, C24H50, C26H54 and C30H62 (n=20, 24, 26 and 30) are
the molecules with different lengths that were studied in this work. In each case, the simulated
system contains 600 molecules of each of these n-alkanes which were created using the Packmol
package (Martínez et al., 2009). The systems were initially equilibrated under the NPT
conditions at 360 K and atmospheric pressure for 5,000,000 time steps. Molecules in the liquid
phase for the case of C24H50 were observed to be oriented randomly as shown in Figure 3-2. The
systems were then cooled down to T = 230 K at a rate of 1.5 K/ns to obtain the solid structures
and Figure 3-3 exhibits the typical structures of the realized solid phase after freezing for the
case of C24H50. Molecules in the solid case exhibit a localized ordering with the grain boundaries
of paraffin molecules aligned in different directions. This alignment is a reason for the higher
thermal conductivities compared with the liquid phase. The solid structure was heated up to 360
K again and the re-melt process was performed. The change in the potential energy of the
systems during the solidification and re-melting process for the case of C24H50 is given in Figure
3-4. Observing an abrupt change in the potential energy is an indication of crystallization and
melting temperatures. As shown in this figure, the melting temperature is different from the
crystallization temperature and this can be caused by the purity of the system. Molecules cannot
crystallize at melting temperatures since solidification is in need of a nucleation site and it is
difficult for the molecules in pure systems to nucleate. This phenomenon is called supercooling
which is well-known (Chalmers, 1959, and Knight, 1967).
To consider the effect of the orientation of the chains with respect to the direction of the imposed
heat flux, we computed the alignment factor (s) to determine how the thermal conductivity

33
changes with alignment of the molecules (Rigby and Roe, 1988). The alignment factor is given
by:
𝑠 = |⟨cos2 𝜃⟩−
1
32
3
|, (3.2)
where Ɵ is the angle between the end-to-end vector of each molecule and the desired axis with
the symbol < > standing for the average over all molecules. The alignment parameter can vary
from 0 to 1 with the limits corresponding to completely random orientation of the molecules and
the molecules perfectly aligned along the desired direction, respectively.
3.3.3.2 Perfect Crystal
Perfect crystal is an idealized model for which all the molecules will be aligned in one direction
and it can be used as a reference model which gives the maximum possible thermal conductivity
of these molecules along the molecular axis. Four different n-alkanes including C20H42, C24H50,
C26H54 and C30H62 were chosen for this study. The basic unit of these structures included 161
molecules which resulted in the same surface area for the simulation boxes for all the cases. The
Xenoview© software (Shenogin and Ozisik, 2007) was used to align the molecules in a
hexagonal lattice. Xenoview is a MD program that is used for creating structures with a built-in
graphical user interface. Figure 3-5 exhibits the structure developed using Xenoview© for the
case of C20H42. The system was then equilibrated under the NPT conditions at T = 150 K and
atmospheric pressure for 5,000,000 time steps and then heated up to T = 270 K for another
5,000,000 time steps and was equilibrated at T = 270 K under the NPT conditions over 3,000,000
time steps. Figure 3-6 shows a snapshot of the realized system for the C20H42 molecules after
equilibration and Figure 3-7 is the corresponding snapshot of the stacked system composed of 12
replications.

34
3.3.4 Results
Temperature profiles associated with the imposed heat flux for the liquid systems are shown in
Figure 3-8 for the four n-alkanes systems studied. The value of the heat flux for the case of bulk
liquid was set to be 0.01 kcal/mol. Based on the average temperature gradients and the heat flux,
the thermal conductivity of liquid modes was determined and tabulated in table 3-1. Figure 3-9
exhibits the trend for the computed values of the thermal conductivity of liquid n-alkanes with
the number of carbon atoms in the chain and compares these values with the experimental data of
Rastorguev et al. (1974) for liquid n-alkanes (n less than or equal to 24). The MD-predicted
values of the thermal conductivity exhibit the same trends of the experimental data in liquid
phase, i.e. the thermal conductivity rises as the chain length is increased.
Thermal conductivity of the solid n-alkanes was determined as well. There is a strong possibility
that the thermal conductivity within the structures is not isotropic. Thus, thermal conductivity
was determined in three (3) spatial directions (xx-, yy- and zz- components of thermal
conductivity matrix). To address the possible size effect, the base structure was replicated along
the heat current direction for four (4) to twelve (12) times. The associated computed thermal
conductivity values of the molecules are plotted in Figure 3-10 for different number of replicas.
Table 3-2 summarizes all the computed thermal conductivity values in the x-, y- and z-
directions. Note that in extracting the thermal conductivity of the materials from Figure 3-10
following the procedure outlined in Chapter 2, some data for higher replicas were eliminated in
order to consider the possible size effect. Results of table 3-2 exhibit a weak dependence of the
thermal conductivity on direction. The trend for variation of the thermal conductivity (averaged
over x-, y- and z-components) of the solid structures with the length of the molecule is shown in

35
Figure 3-11. The results of the MD simulations suggest that the thermal conductivity in solid
phase rises as the chain length is increased.
In order to determine the thermal conductivity of the perfect crystal phase of n-alkanes, the base
structures were replicated in the molecular axis direction for 6, 8, 10, 12 and 14 times to
investigate the size effect of the simulation box. The systems then were equilibrated under the
NVT conditions for 3,000,000 time steps when the systems attained steady state. The NVT
ensemble was chosen over the NPT ensemble because under the NPT conditions the layers are
pushed toward each other and the structure is not perfect anymore. The value of the heat flux was
chosen to be 0.005 kcal/mol and imposed over the system for 5,000,000 time steps. The resulting
temperature profiles for perfect crystal stacked structures are shown in Figure 3-12 for the
various n-alkanes studied. Temperature profiles were averaged over the last 1,000,000 time steps
of heat flux addition. The temperature profiles in Figure 3-12 exhibit distinct stepwise behavior
wherein the temperature drops/rises occur essentially at the interfaces between the crystalline
layers of n-alkanes. Within each layer, the temperature profile is almost flat due to the ballistic
phonon transport along straight alkane chains (Chen, 2000). For each case, thermal conductivity
of the replicated system was evaluated utilizing the associated temperature profiles. Inverse of
the computed thermal conductivity values was plotted versus the inverse of the length of the
various n-alkanes structure as shown in Figure 3-13. The length-independent thermal
conductivity of each molecule was determined by fitting the individual graphs in Figure 3-13 by
an appropriate linear function. The thermal conductivity values for the perfect crystal structures
are tabulated in Table 3-3 and plotted in Figure 3-14. The results of the MD simulations suggest
that the thermal conductivity of the perfect crystal structures rises as the chain length is
increased.
36
3.4 Experimental Measurement
3.4.1 Literature review
Rastorguev et al. (1974) measured the thermal conductivity of long n-alkanes at different
temperatures for liquid phases experimentally using the heated-filament technique. They showed
that the thermal conductivity in the liquid phase decreases linearly as the temperature of the
sample is increased. They also stated that their experiments exhibited a rise in thermal
conductivity in the liquid phase as the number of carbon atoms in the chain is raised (Figure 3-9).
They believed that n-alkanes follow no trend of direct proportionality with the number of carbon
atoms and the reason was that the thermal conductivity of n-alkanes showed an asymptotic
behavior as the number of carbon atoms increase and finally the value of the thermal
conductivity approaches an asymptotic value as the molecular length becomes high.
Yarbrough and Kuan (1981) did some experiments using a radial heat flow apparatus to
determine the thermal conductivity of n-alkanes in the solid phase and they asserted that the
thermal conductivity has an inverse relation with temperature that lead to a linear decrease of
thermal conductivity as temperature rises. Moreover, they showed that the thermal conductivity
values of the n-even alkanes are higher than those with an odd number of the carbon atoms in the
chain. There is a linear increase of thermal conductivity with the number of carbon atoms (Figure
3-20).
Stryker and Sparrow (1989) used a spherical thermal conductivity cell operating under steady
state condition to determine the thermal conductivity of solid n-eicosane as a function of sample
mean temperature, rate of solidification and some other parameters. They stated that despite the

37
results of Yarbrough and Kuan (1981), their experiments showed no temperature dependence for
thermal conductivity values.
Yaws (1995) also reported thermal conductivity data for a wide range of organic compounds. He
reported this data for n-alkanes (n = 8 to 28) mainly in liquid phase for higher n-alkanes.
Nabil (2013) (also Nabil and Khodadadi, 2013) utilized the transient plane source (TPS) method
to measure the thermal conductivity of solid n-eicosane. They showed that the thermal
conductivity of solid n-eicosane does not change significantly with temperature and it remains
constant at different temperatures in the solid phase. Fang et al. (2013) basically repeated the
experiments of Nabil (2013) for the solid n-eicosane using the TPS method and obtained the
same results for the thermal conductivity.
3.4.2 Sample Preparation
Details of the preparation schemes of the NePCM liquid and solid samples are discussed in the
theses of Fan (2011) and Nabil (2013), respectively. Similar steps for preparation of samples
were followed in this study. N-eicosane (C20H42), n-tetracosane (C24H50) and n-hexacosane
(C26H54) were selected as PCM. All of these samples were provided as 99% pure n-alkanes by
Acros Organics (Thermo Fisher Scientific, Hampton, New Hampshire). Table 3-4 provides
information about the physical properties of these n-alkanes. Firstly, the n-alkanes were weighed
and melted followed by rigorous stirring on a hot-plate magnetic stirrer (SP131325Q, Thermo
Fisher, Dubuque, IA) at 80 °C for 30 minutes.
The liquid samples then were placed inside a vacuum oven (Fischer Scientific, Isotemp®
Vacuum Oven Model 281A) for at least 20 hours. The vacuum oven was operated at -30 kPa
absolute pressure at a fixed temperature of 65 °C in order to degas the samples. The aluminum
38
molds were machined disks with a diameter of one inch and height of 0.375 inches. Commercial
aluminum foil molds (VWR® International LLC, Model 611-1362) with a diameter of 1 inch
was pressed into the machined aluminum molds using a custom-designed molding handle.
Samples were solidified using the oven solidification method (Nabil, 2013) while the oven was
turned off and maintained at the atmospheric pressure. The solidification process took 4 hours to
be completed for all the samples. A photograph of the pure solid samples is shown in Figure 3-15
that shows sides of the solid disks of which was exposed to the local atmosphere. The weight of
each sample was in the range of 3-4 grams. A brief overview diagram containing the descriptions
of the preparation schemes is shown in Figure 3-16.
3.4.3 Experimental Details
The transient plane source (TPS) technique is known as the commonly-used transient method of
measuring the thermal conductivity. The main advantage of the transient methods is that the
measurement process is fast and extremely suitable for liquid samples measurements so as to
avoid possible initiation of natural convection within the samples.
In this thesis, we utilized a Hot Disk Thermal Constants Analyzer system (TPS 500, Hot Disk
AB, Gothenburg, SWEDEN) based on the transient plane source technique (maximum
uncertainty of 2% specified by the manufacturer) to measure the thermal conductivity of solid n-
alkanes samples.
Measurements were performed for a range of temperature varying from 0 ºC to temperatures just
below the melting temperature of each sample. The two solid disks were positioned on a pair of
aluminum cold plates (LYTRON Co., Woburn, MA, Model CP20G01), whereas the flow inlets
and outlets of the cold plates (I.D. of 5/16 inches and O.D. of 3/8 inches) were connected to a

39
bath/circulator. The programmable temperature bath (TC-502P, Brookfield, Middleboro, MA)
was utilized to circulate a 50:50 water/ethylene glycol solution as the working fluid at a constant
temperature through the two cold plates. The bath system has a stability of 0.01 °C allowing the
user to control the measurement temperature of interest within the bath. Due to the internally
criss-crossed finned arrangement of the aluminum cold plates, the cold plates can be adjusted
rapidly to the temperature of the bath. The sample-holding assembly was insulated effectively
from the laboratory environment using Styrofoam® sheets. The temperature of solid discs were
measured by the thermistor (GE, Model A733F-CSP60BT103M, accuracy of 0.01 °C) placed on
top of the cold plate. An adjustable screw was used on top of a compression metal plate to
impose a uniform pressure on the sample-holding assembly. Two adjustable screws on the sides
of the set-up in addition to an adjustable metal plate were utilized to precisely adjust the
horizontal level of the TPS sensor between the solid samples as recommended by the
manufacturer. A schematic view of the measurement system is shown in Figure 3-17.
3.4.4 Results
For each pair of the solid samples, five sets of experiments were performed at a specific
temperature to measure the thermal conductivity.
Thermal conductivity values for the three n-alkanes are shown in Figure 3-18 as a function of
sample temperature and tabulated in Table 3-5. The measured thermal conductivity values for n-
eicosane are in agreement with the experimental values reported by Stryker and Sparrow (1989)
and Nabil (2013). Similar to Stryker and Sparrow (1989), no temperature dependence for thermal
conductivity of these n-alkanes was observed in our work. Thermal conductivity values for the n-
eicosane from our experiments are compared with the reported values of Nabil (2013) in Figure
3-19.

40
3.5 Comparison between Simulations and Experimental Observations
A comparison between the MD-predicted values of thermal conductivity and those from
experiments is made in Figure 3-20. As is shown in Figure 3-20, MD simulations exhibit that the
thermal conductivity increases very slightly as the number of carbon atoms within the n-alkanes
chains goes up. However, our experiments are showing that thermal conductivity decreases as
the length of the n-alkanes molecule increases. We know that the solidification process for the
MD simulations and experiments might be different in process. As discussed by Nabil (2013),
thermal conductivity of n-eicosane is strongly dependent on the specific process of solidification.
The rate of solidification can result in different crystalline structures and different thermal
conductivity values. To study the effect of crystalline structures, we calculated the alignment
factors for the solid n-alkane samples using equation (3.2) and the values are tabulated in Table
3-6. It can be inferred from the data that alignment factor values are nearly in the same range for
almost all the cases except for some cases that exhibit different values and this had no direct
effect on thermal conductivity values as can be seen in Table 3-6.
Another interesting fact is that Yarbrough and Kuan (1981) showed in their experiments that
thermal conductivity of the solid n-alkanes increase as the number of carbon atoms changes from
14 to 20 (Figure 3-20). However, our experiments show that thermal conductivity of solid n-
alkanes (n=20, 24 and 26) remains almost unchanged from n=20 to n=24 and decreases from
n=24 to n=26. More work is needed to realize what is the reason for this behavior of n-alkanes,
However, R-phases within n-alkanes might be a strong candidate for the reason behind this
behavior.
Thermal conductivity trends for perfect crystal n-alkanes are also interesting to us. It can be
inferred from the data for perfect crystal that thermal conductivity exhibits a zigzag trend as the

41
number of n-alkanes increase from n=20 to n=30. As was discussed earlier, n-alkanes exhibit the
same zigzag trend for some other thermodynamics properties such as melting temperature and
etc. Since we don’t have experimental data on thermal conductivity of solid n-triacontane
(n=30), we cannot conclude that experiments exhibit the same zigzag trend for thermal
conductivity or not.
3.6 Summary
Both MD simulations and experiments were utilized to determine the thermal conductivity of n-
alkanes of interest. The direct method NEMD simulations is used to determine thermal
conductivity of the n-alkanes (n=20, 24, 26 and 30) in liquid, solid and perfect crystal phase
modes. Simulations exhibit that the thermal conductivity of the liquid n-alkanes increases as the
number of carbon atoms within the chain rises. The solid phase n-alkanes exhibit a more
organized structure than the liquid systems, where crystalline nano-domain structures are clearly
seen in solid phases compared to randomly-oriented liquid systems. This suggests that as the
structure gets more organized, it will result in higher thermal conductivity values. Moreover, it is
shown that the perfect crystal structures exhibit higher thermal conductivities than solid systems.
This can also be a proof to the fact that if the molecules in the system align in an organized
structure, this will enhance the thermal conductivity. Experiments were used to measure the
thermal conductivity of the n-alkanes (n=20, 24 and 26). Interestingly, experiments exhibit that
as the length of the n-alkanes molecules increase, thermal conductivity of these n-alkanes
decrease where MD simulations exhibit a very slight increase in the thermal conductivity as the
number of carbon atoms within the chain increase. Moreover, perfect crystal n-alkanes follow a
zigzag trend for thermal conductivity values with the number of carbon atoms within n-alkane
molecules.
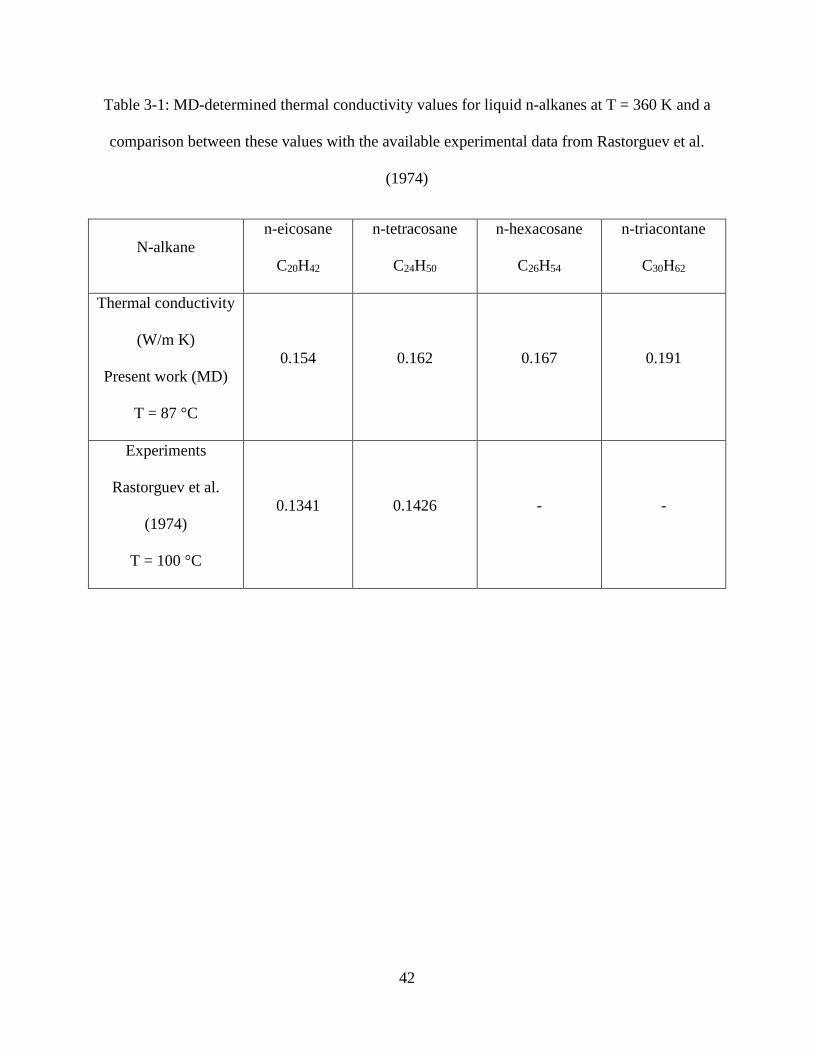
42
Table 3-1: MD-determined thermal conductivity values for liquid n-alkanes at T = 360 K and a
comparison between these values with the available experimental data from Rastorguev et al.
(1974)
N-alkane
n-eicosane
C20H42
n-tetracosane
C24H50
n-hexacosane
C26H54
n-triacontane
C30H62
Thermal conductivity
(W/m K)
Present work (MD)
T = 87 °C
0.154 0.162 0.167 0.191
Experiments
Rastorguev et al.
(1974)
T = 100 °C
0.1341 0.1426 - -

43
Table 3-2: MD-determined thermal conductivity values for solid n-alkanes at T=270 K
N-alkane
n-eicosane
C20H42
n-tetracosane
C24H50
n-hexacosane
C26H54
n-triacontane
C30H62
Thermal
conductivity
(W/m K)
X-
component
0.41 0.35 0.44 0.53
Y-
component
0.40 0.47 0.41 0.39
Z-
component
0.35 0.36 0.38 0.40

44
Table 3-3: MD-determined thermal conductivity values for perfect crystal n-alkanes at T = 270 K
N-alkane
n-eicosane
C20H42
n-tetracosane
C24H50
n-hexacosane
C26H54
n-triacontane
C30H62
Thermal conductivity
(W/m K)
0.86 0.92 0.86 1.05
Standard deviation
for curve fitting
0.4054 0.0768 0.489 0.5755

45
Table 3-4: Physical properties of the n-alkanes supplied by ACROS ORGANICS (Thermo Fisher
Scientific, Hampton, New Hampshire)
n-eicosane
C20H42
n-tetracosane
C24H50
n-hexacosane
C26H54
Density (g/mL) 0.7886 0.797 0.8
Melting point
(°C)
36-38 °C 49-52 °C 56-59 °C
Boiling point
(°C)
220 °C 391 °C 420 °C
Solubility in Water Insoluble Insoluble Insoluble
Property
N-alkane

46
Table 3-5: Thermal conductivity data for solid n-eicosane, n-tetracosane and n-hexacosane
samples at different temperatures using the oven solidification method; Data are averaged over
five measurements (maximum standard deviation of 1%)
N-alkane
n-eicosane
C20H42
n-tetracosane
C24H50
n-hexacosane
C26H54
Thermal
conductivity
(W/m K)
0 ºC 0.4465 0.4433 0.3929
5 ºC 0.4444 0.4594 0.3776
10 ºC 0.4436 0.4384 0.3698
15 ºC 0.4366 0.4354 0.3840
20 ºC 0.4309 0.4353 0.3663
25 ºC 0.4357 0.4339 0.3780
30 ºC 0.4315 0.426 0.3712
35 ºC - 0.4151 0.3717

47
Table 3-6: Alignment factors in 3 spatial directions for solid n-alkanes from MD simulations and
the effect of alignment on the thermal conductivity of the solid samples
N-alkane
n-eicosane
C20H42
n-tetracosane
C24H50
n-hexacosane
C26H54
n-triacontane
C30H62
Alignment
factor
X-dir. 0.44 0.26 0.27 0.16
Y-dir. 0.19 0.27 0.29 0.30
Z-dir. 0.11 0.22 0.19 0.29
Thermal
Conductivity
(W/m K)
X-dir. 0.37 0.35 0.44 0.41
Y-dir. 0.40 0.47 0.41 0.39
Z-dir. 0.35 0.36 0.34 0.40
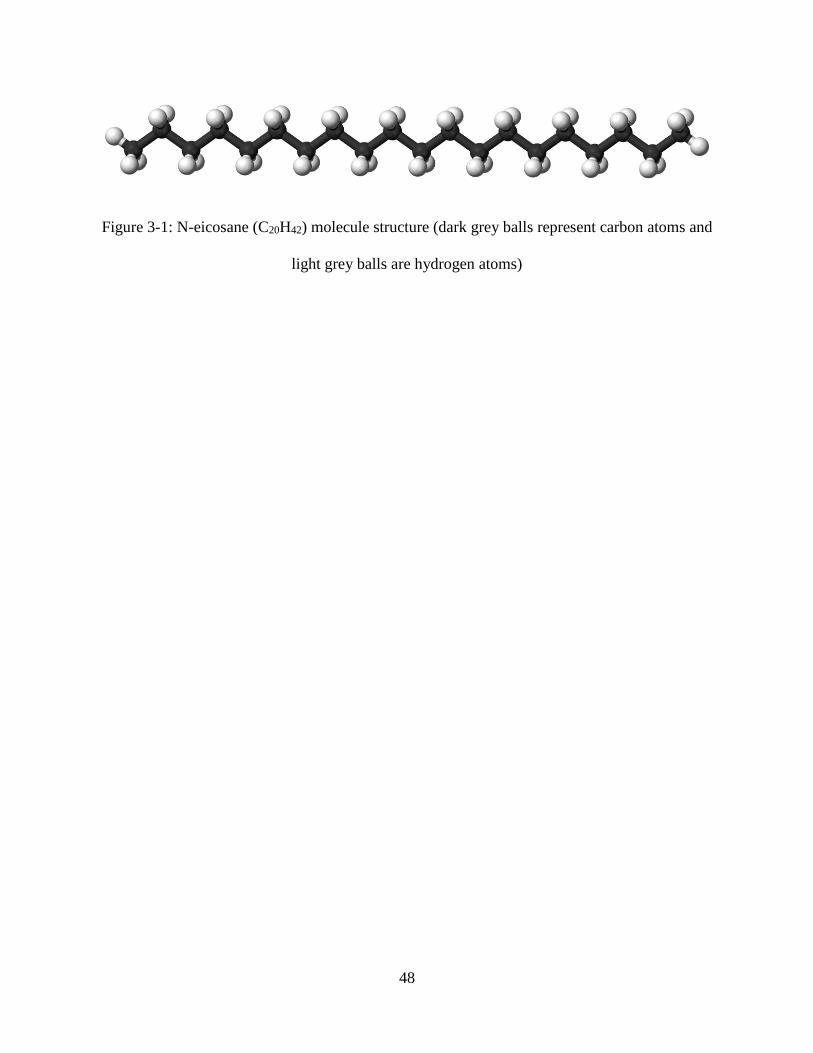
48
Figure 3-1: N-eicosane (C20H42) molecule structure (dark grey balls represent carbon atoms and
light grey balls are hydrogen atoms)
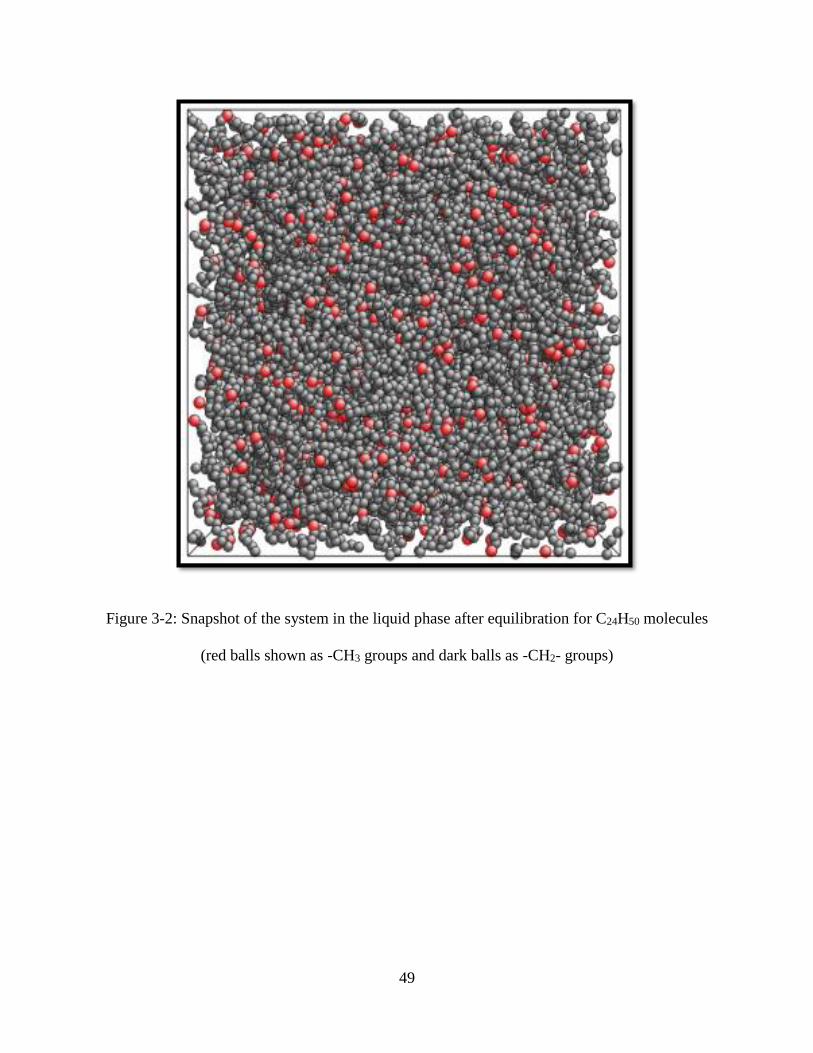
49
Figure 3-2: Snapshot of the system in the liquid phase after equilibration for C24H50 molecules
(red balls shown as -CH3 groups and dark balls as -CH2- groups)

50
Figure 3-3: Snapshot of the system in the solid phase after equilibration for C24H50 molecules
(red balls shown as -CH3 groups and dark balls as -CH2- groups)

51
Figure 3-4: Potential energy change during the melting-solidification cycle for C24H50

52
Figure 3-5: Snapshot of the perfect crystal model structure before equilibration for the C20H42
molecules

53
Figure 3-6: Snapshot of the equilibrated system of the C20H42 molecules for the perfect crystal
model
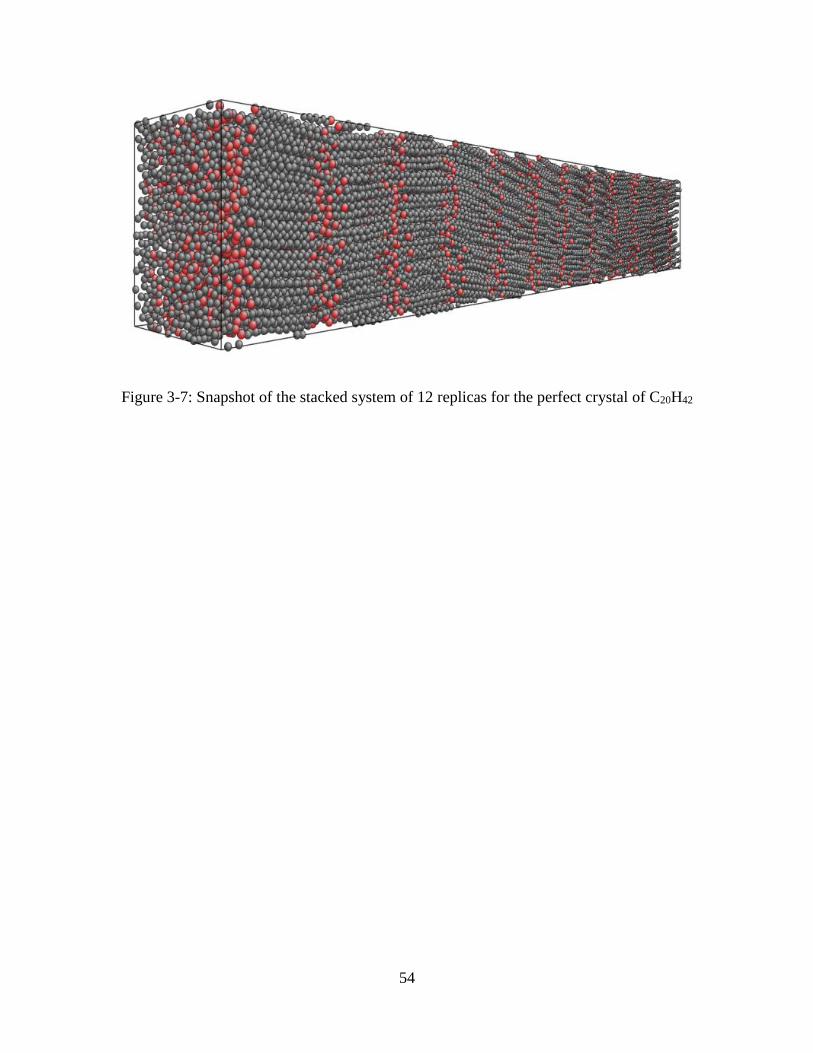
54
Figure 3-7: Snapshot of the stacked system of 12 replicas for the perfect crystal of C20H42

55
Figure 3-8: Temperature profiles in response to the imposed heat flux for liquid phases of (a)
C20H42, (b) C24H50, (c) C26H54 and (d) C30H62

56
Figure 3-9: MD-determined thermal conductivity values for liquid n-alkanes at T = 360 K versus
the number of carbon atoms within the chain compared with the experimental data from
Rastorguev et al. (1974)

57
Figure 3-10: Inverse of the thermal conductivity in the x-direction versus the inverse of the
length of the stacked layers for different number of replicas for solid (a) C20H42, (b) C24H50, (c)
C26H54 and (d) C30H62
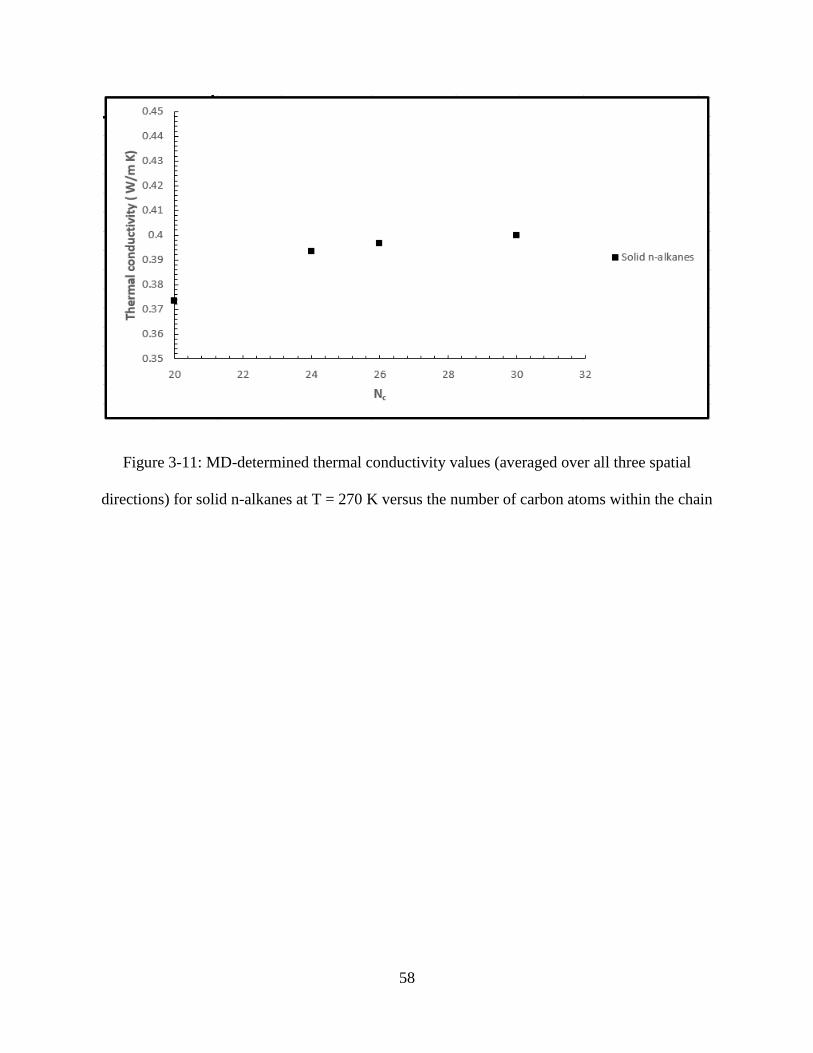
58
Figure 3-11: MD-determined thermal conductivity values (averaged over all three spatial
directions) for solid n-alkanes at T = 270 K versus the number of carbon atoms within the chain

59
Figure 3-12: Temperature profiles for the case of perfect crystals with six (6) replications in
response to the imposed heat flux for (a) C20H42, (b) C24H50, (c) C26H54 and (d) C30H62
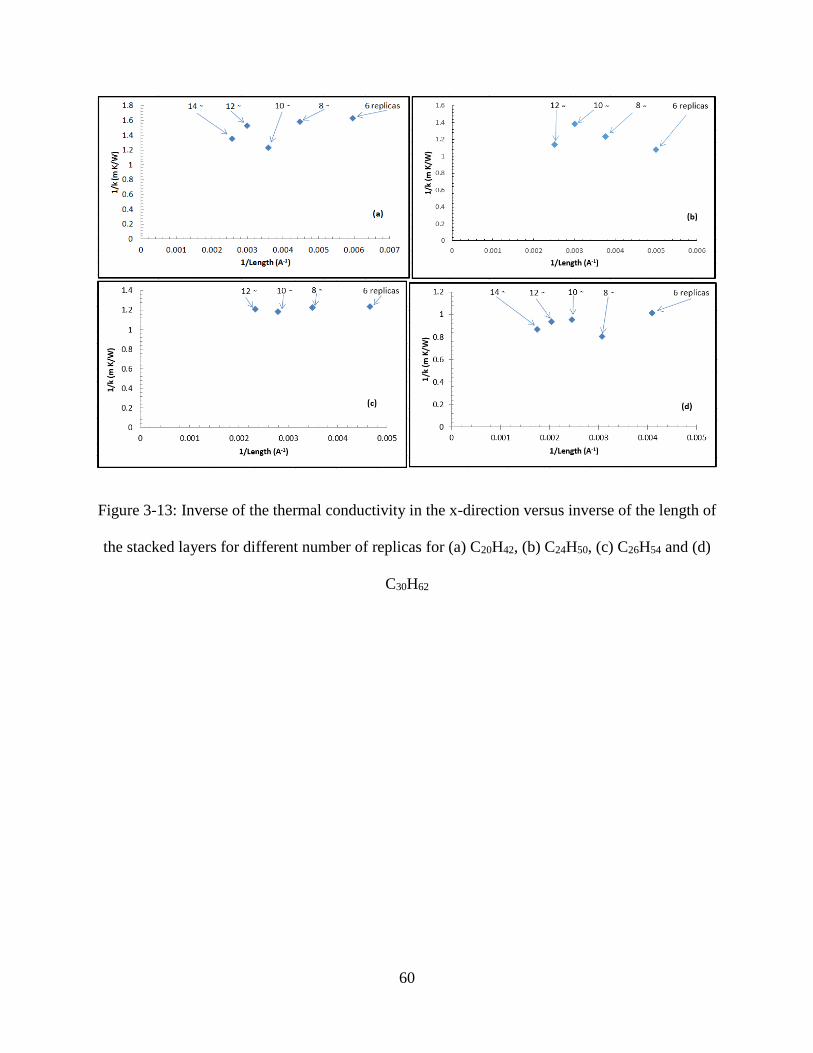
60
Figure 3-13: Inverse of the thermal conductivity in the x-direction versus inverse of the length of
the stacked layers for different number of replicas for (a) C20H42, (b) C24H50, (c) C26H54 and (d)
C30H62

61
Figure 3-14: Thermal conductivity values for perfect crystal n-alkanes at T = 270 K versus the
number of carbon atoms within the chain
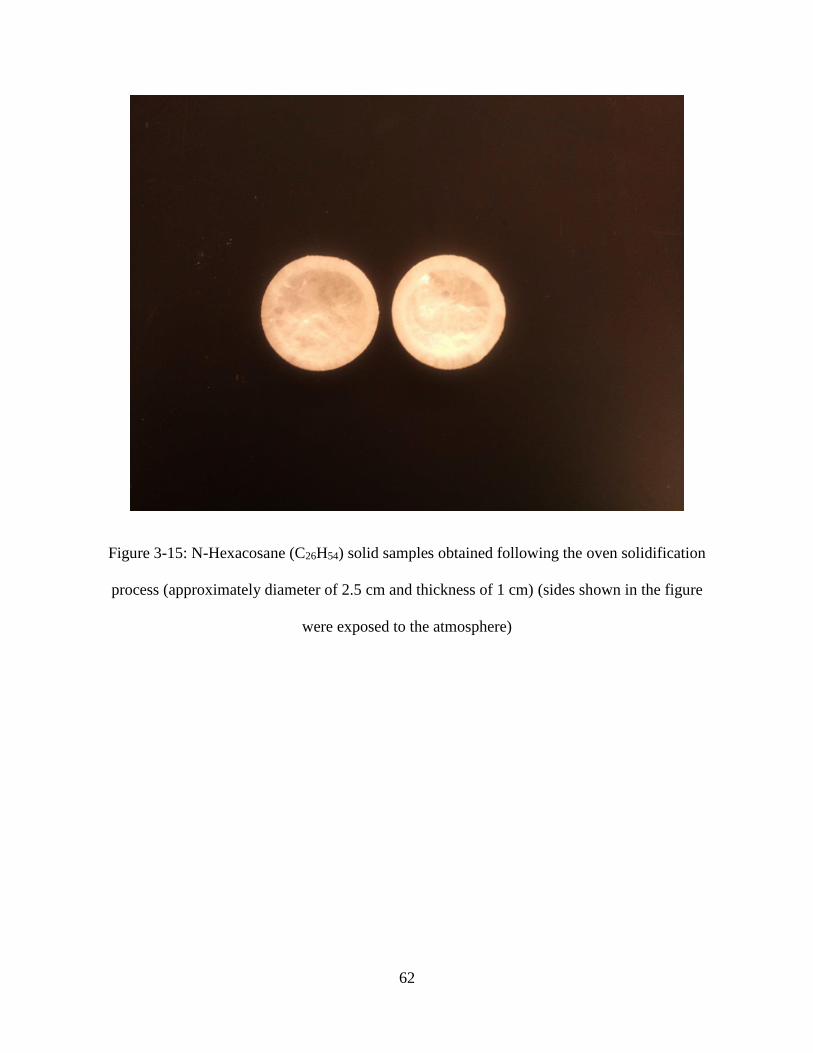
62
Figure 3-15: N-Hexacosane (C26H54) solid samples obtained following the oven solidification
process (approximately diameter of 2.5 cm and thickness of 1 cm) (sides shown in the figure
were exposed to the atmosphere)

63
Figure 3-16: Schematic diagram for preparation of the solid samples

64
Figure 3-17: Schematic view of the support set-up for the samples supplied with the TPS 500
instrument (Hot Disk AB, Gothenburg, SWEDEN) (taken from M. Nabil, 2013)
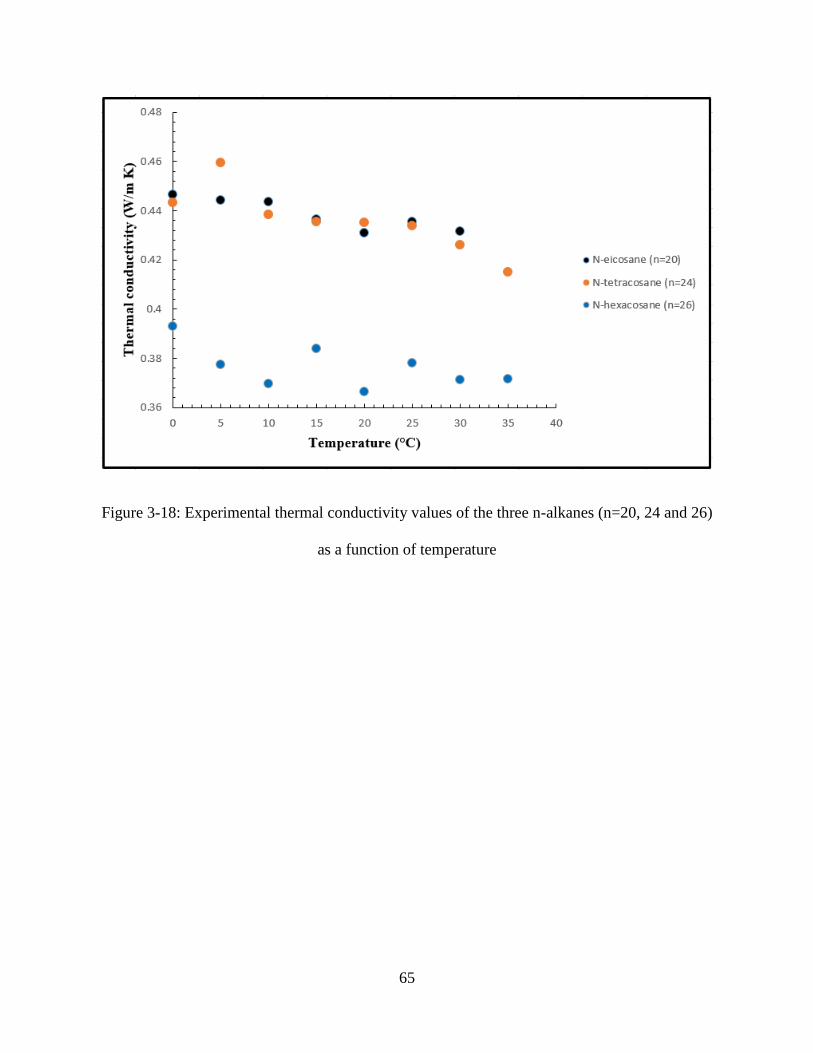
65
Figure 3-18: Experimental thermal conductivity values of the three n-alkanes (n=20, 24 and 26)
as a function of temperature
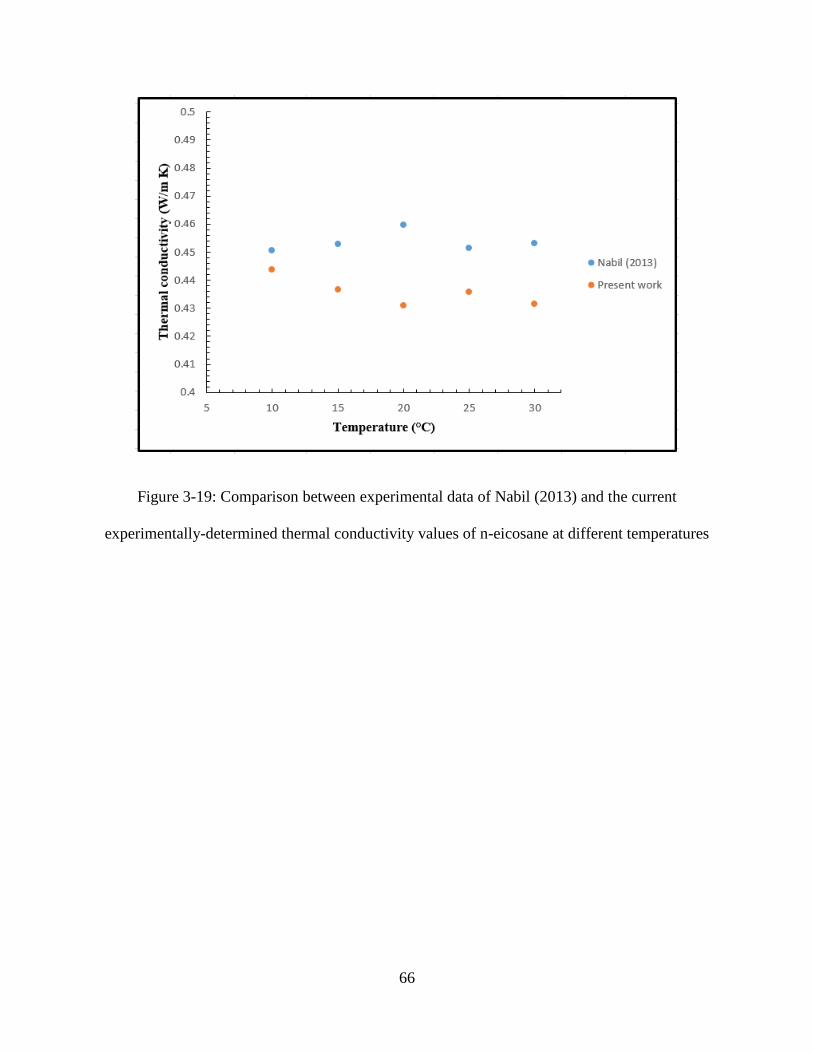
66
Figure 3-19: Comparison between experimental data of Nabil (2013) and the current
experimentally-determined thermal conductivity values of n-eicosane at different temperatures
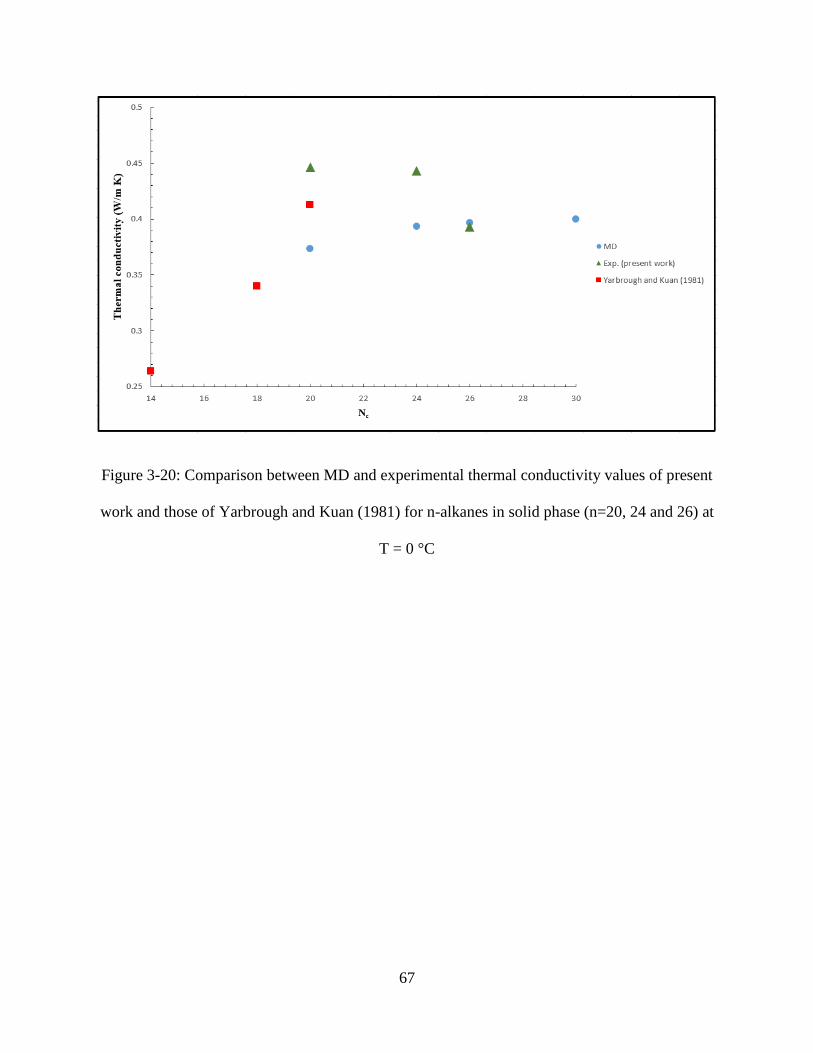
67
Figure 3-20: Comparison between MD and experimental thermal conductivity values of present
work and those of Yarbrough and Kuan (1981) for n-alkanes in solid phase (n=20, 24 and 26) at
T = 0 °C

68
4. Chapter 4: The Thermal Interfacial Conductance between the Layers of N-alkane
Molecules

69
4.1 Introduction
There are two important factors that determine effectiveness of heat transfer. Thermal
conductivity of bulk materials is one factor which was discussed in the previous chapter in detail.
The other important concept in heat transfer is the effect of the boundaries and interfaces on the
conductive mode of heat transfer. Different factors such as defects across the interfaces, phonon
mismatch, and temperature of the interfaces can affect heat transfer and make a marked impact
on heat transport. It is possible that two materials with very high thermal conductivities combine
at a junction (interface) and exhibit a very low effective thermal conductivity (combination of the
thermal conductivity of the materials and the thermal interfacial conductance). In the previous
chapter, the effect of the length of the n-alkanes molecules on the thermal conductivity of bulk n-
alkanes was studied. In this chapter, we will investigate the thermal boundary conductance
between the layers of perfect crystal n-alkanes. Theoretically, there are two main models that are
utilized to predict the interfacial thermal conductance in the nanoscale, namely the acoustic
mismatch model (AMM) and the diffusive mismatch model (DMM). In recent years, MD
simulations have received greater attention for predicting the thermal boundary conductance
between the junctions. Both NEMD and EMD simulations can be utilized to study this effect.
Section 4.2 of this chapter is a review on what have been done on this topic. Next section is
about the NEMD and EMD simulations that were used to determine the interfacial thermal
conductance between the layers of n-alkanes. Lastly, we will compare the results from the
NEMD and EMD simulations for determining the thermal boundary conductance.

70
4.2 Literature Review
Work on the nanoscale transport across the boundaries and the interfaces has been less developed
compared to studies devoted to phonon transport in bulk materials. Thermal boundary
conductance, which is the inverse of the Kapitza resistance (Kapitza, 1941) relates the
temperature discontinuity at the interface to the associated heat flux. Attempts to predict the
thermal interfacial conductance have led to development of two main models that are called the
acoustic mismatch model (AMM) and the diffusive mismatch model (DMM). AMM is based on
the classical wave theory and acoustics (Swartz and Pohl, 1989). Completely specular scattering
is assumed in this model which means that all the incident phonons are assumed to be
transmitted to the other side of the interface. AMM determines the transmissivity based on the
phonon modes, wave number and the wave vectors (acoustic impedance). However, real
interfaces are not perfect and exhibit some measure of roughness or the material might be at
higher temperatures which AMM method is not suitable to use for these conditions. The DMM
approach was introduced to address these deficiencies of the AMM technique. DMM calculates
the transmission probability based on the group velocity and the density of states. Norris et al.
(2013) reviewed the effect of different factors such as the interface mismatch, temperature,
roughness and etc., as well as the effects due to multilayered structures on the thermal boundary
conductance. For more detailed information, the reader is encouraged to refer to Swartz and Pohl
(1989), Chen (2000), Cahill et al. (2002) and a recent review by Pop (2010).
MD simulations have exhibited great potential as an appropriate numerical solution to the
thermal boundary conductance phenomenon within materials. Both EMD (Barrat and Chiaruttini,
2003) and NEMD (Barrat and Chiaruttini, 2003, Shenogin et al., 2004, and Hu et al., 2011)
approaches have been carried out for MD determination of the thermal boundary conductance.
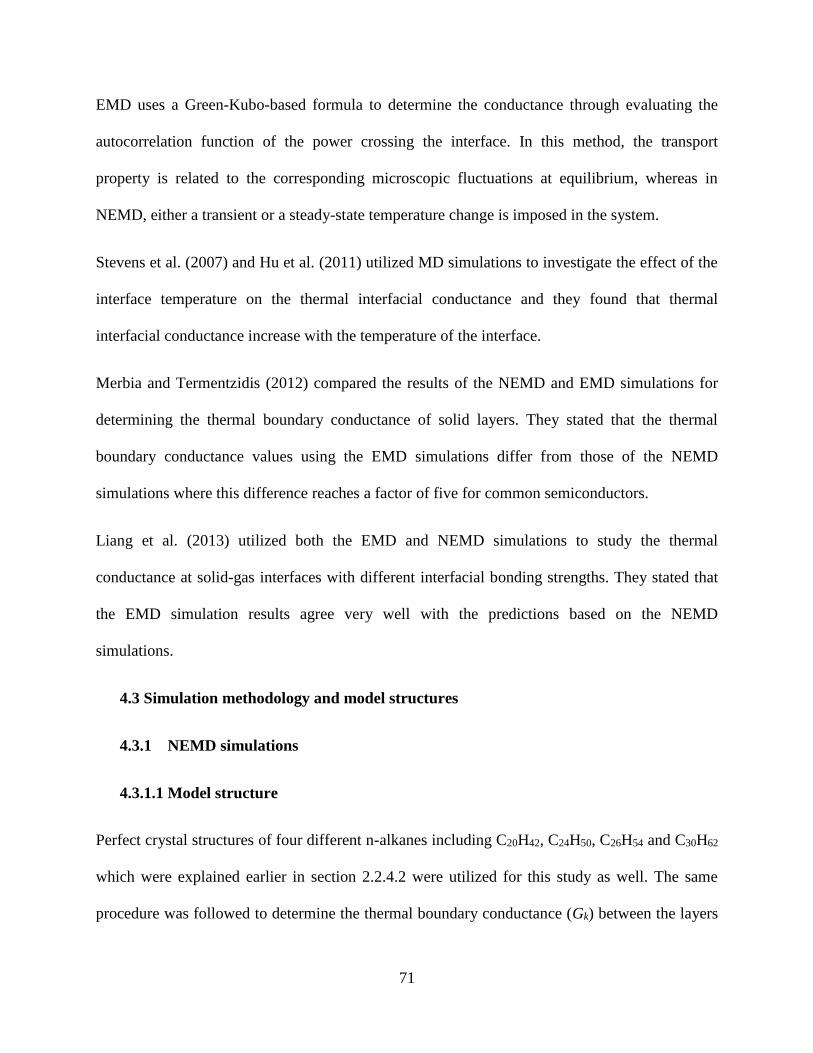
71
EMD uses a Green-Kubo-based formula to determine the conductance through evaluating the
autocorrelation function of the power crossing the interface. In this method, the transport
property is related to the corresponding microscopic fluctuations at equilibrium, whereas in
NEMD, either a transient or a steady-state temperature change is imposed in the system.
Stevens et al. (2007) and Hu et al. (2011) utilized MD simulations to investigate the effect of the
interface temperature on the thermal interfacial conductance and they found that thermal
interfacial conductance increase with the temperature of the interface.
Merbia and Termentzidis (2012) compared the results of the NEMD and EMD simulations for
determining the thermal boundary conductance of solid layers. They stated that the thermal
boundary conductance values using the EMD simulations differ from those of the NEMD
simulations where this difference reaches a factor of five for common semiconductors.
Liang et al. (2013) utilized both the EMD and NEMD simulations to study the thermal
conductance at solid-gas interfaces with different interfacial bonding strengths. They stated that
the EMD simulation results agree very well with the predictions based on the NEMD
simulations.
4.3 Simulation methodology and model structures
4.3.1 NEMD simulations
4.3.1.1 Model structure
Perfect crystal structures of four different n-alkanes including C20H42, C24H50, C26H54 and C30H62
which were explained earlier in section 2.2.4.2 were utilized for this study as well. The same
procedure was followed to determine the thermal boundary conductance (Gk) between the layers
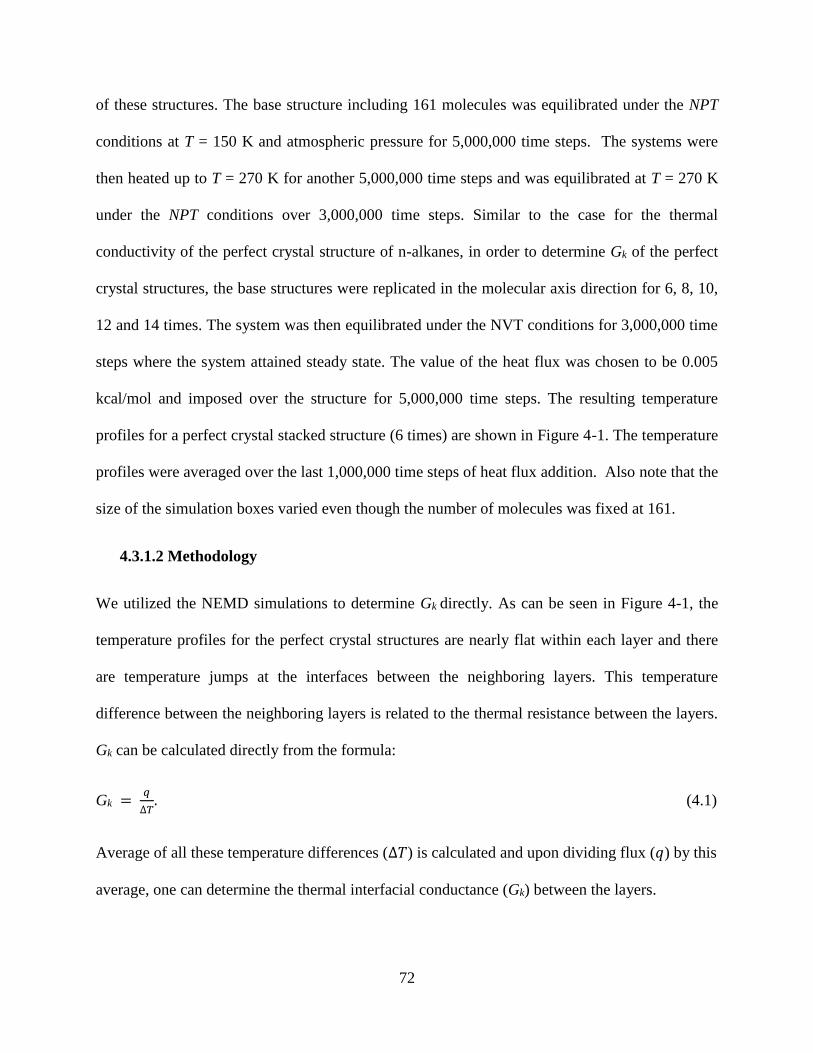
72
of these structures. The base structure including 161 molecules was equilibrated under the NPT
conditions at T = 150 K and atmospheric pressure for 5,000,000 time steps. The systems were
then heated up to T = 270 K for another 5,000,000 time steps and was equilibrated at T = 270 K
under the NPT conditions over 3,000,000 time steps. Similar to the case for the thermal
conductivity of the perfect crystal structure of n-alkanes, in order to determine Gk of the perfect
crystal structures, the base structures were replicated in the molecular axis direction for 6, 8, 10,
12 and 14 times. The system was then equilibrated under the NVT conditions for 3,000,000 time
steps where the system attained steady state. The value of the heat flux was chosen to be 0.005
kcal/mol and imposed over the structure for 5,000,000 time steps. The resulting temperature
profiles for a perfect crystal stacked structure (6 times) are shown in Figure 4-1. The temperature
profiles were averaged over the last 1,000,000 time steps of heat flux addition. Also note that the
size of the simulation boxes varied even though the number of molecules was fixed at 161.
4.3.1.2 Methodology
We utilized the NEMD simulations to determine Gk directly. As can be seen in Figure 4-1, the
temperature profiles for the perfect crystal structures are nearly flat within each layer and there
are temperature jumps at the interfaces between the neighboring layers. This temperature
difference between the neighboring layers is related to the thermal resistance between the layers.
Gk can be calculated directly from the formula:
Gk = 𝑞
∆𝑇. (4.1)
Average of all these temperature differences (∆𝑇) is calculated and upon dividing flux (𝑞) by this
average, one can determine the thermal interfacial conductance (Gk) between the layers.

73
4.3.1.3 Results
The thermal boundary conductance between the n-alkanes layers were determined using the
NEMD method for different number of replications (Table 4-1) and the averaged values are
given in Table 4-2. Gk values from the NEMD method are plotted as a function of the length of
the n-alkane molecules in Figure 4-2. As can be seen in Figure 4-2, NEMD-based thermal
interfacial conductance of the n-alkanes exhibit nearly no dependence on the number of carbon
atoms within the n-alkanes molecule chains.
4.3.2 EMD simulations
4.3.2.1 Model structure and simulation methodology
Three n-alkanes (n=20, 26 and 30) were selected for this study. Three (3) layers of each molecule
were aligned in a perfect crystal structure (Figure 4-3). The structure was then equilibrated under
the same conditions as the NEMD method. C24H50 (n=24) was not included in this study at the
outset. After the results were obtained for EMD-determined thermal boundary conductance, no
more work was done on this part.
Equilibrium molecular dynamics (EMD) simulations was also carried out to determine Gk. In
using this method, Gk will be calculated using the Green-Kubo formula:
𝐺𝑘 =1
𝐴𝑘𝐵𝑇2 ∫ < 𝑝(𝑡)𝑝(0) > 𝑑𝑡∞
0, (4.2)
where the symbol < > denotes the ensemble average, A is the cross sectional area of the solid
surface, t is time, and p is the fluctuating heat power across the interface which can be computed
by p (t) = dEgas (t) /dt, where Egas is the instantaneous internal energy of the layer of molecules.
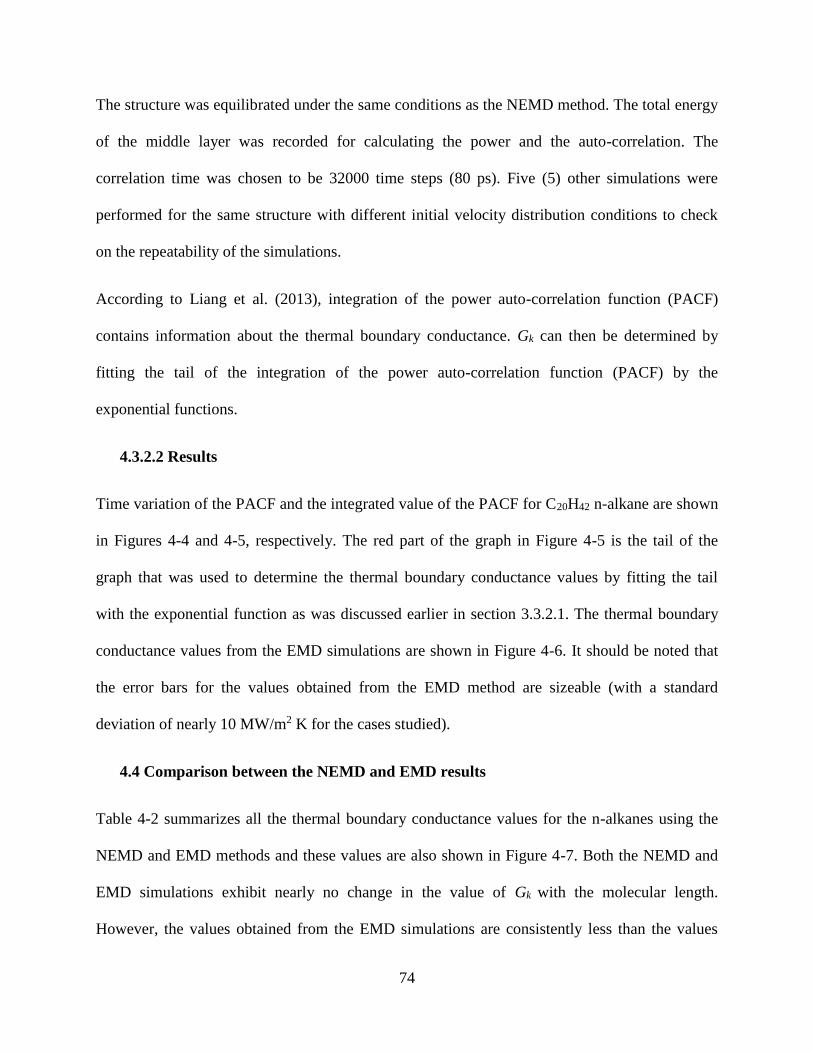
74
The structure was equilibrated under the same conditions as the NEMD method. The total energy
of the middle layer was recorded for calculating the power and the auto-correlation. The
correlation time was chosen to be 32000 time steps (80 ps). Five (5) other simulations were
performed for the same structure with different initial velocity distribution conditions to check
on the repeatability of the simulations.
According to Liang et al. (2013), integration of the power auto-correlation function (PACF)
contains information about the thermal boundary conductance. Gk can then be determined by
fitting the tail of the integration of the power auto-correlation function (PACF) by the
exponential functions.
4.3.2.2 Results
Time variation of the PACF and the integrated value of the PACF for C20H42 n-alkane are shown
in Figures 4-4 and 4-5, respectively. The red part of the graph in Figure 4-5 is the tail of the
graph that was used to determine the thermal boundary conductance values by fitting the tail
with the exponential function as was discussed earlier in section 3.3.2.1. The thermal boundary
conductance values from the EMD simulations are shown in Figure 4-6. It should be noted that
the error bars for the values obtained from the EMD method are sizeable (with a standard
deviation of nearly 10 MW/m2 K for the cases studied).
4.4 Comparison between the NEMD and EMD results
Table 4-2 summarizes all the thermal boundary conductance values for the n-alkanes using the
NEMD and EMD methods and these values are also shown in Figure 4-7. Both the NEMD and
EMD simulations exhibit nearly no change in the value of Gk with the molecular length.
However, the values obtained from the EMD simulations are consistently less than the values
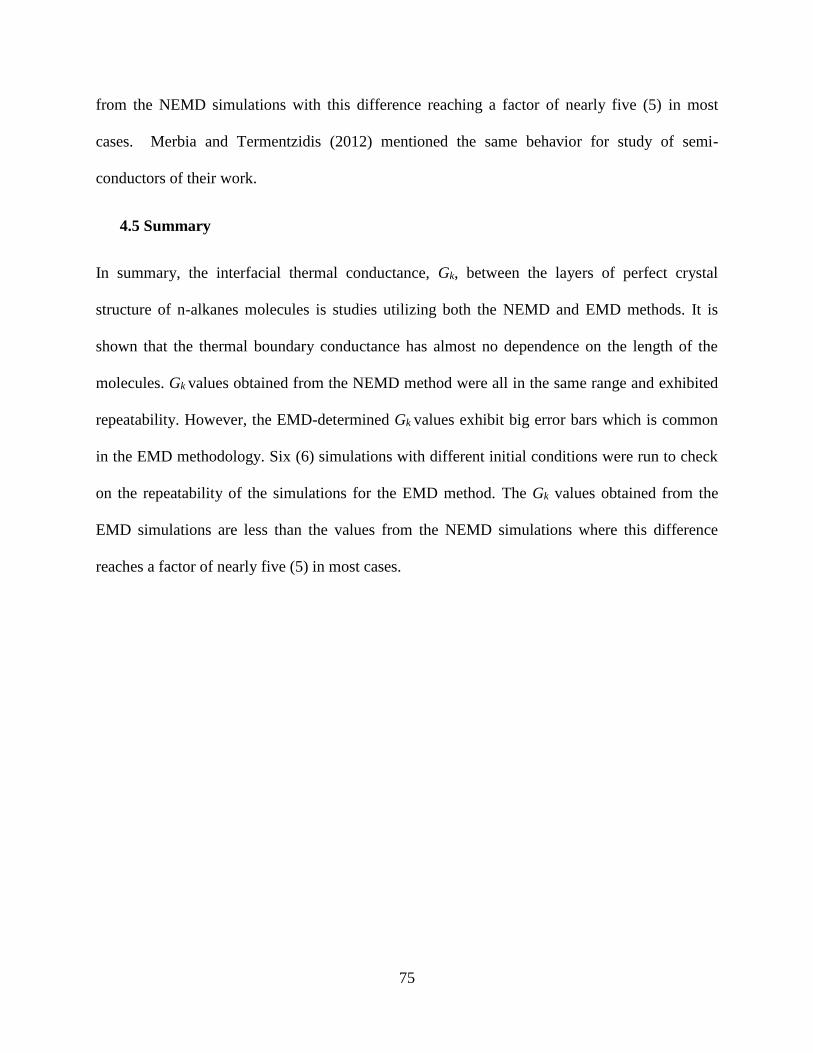
75
from the NEMD simulations with this difference reaching a factor of nearly five (5) in most
cases. Merbia and Termentzidis (2012) mentioned the same behavior for study of semi-
conductors of their work.
4.5 Summary
In summary, the interfacial thermal conductance, Gk, between the layers of perfect crystal
structure of n-alkanes molecules is studies utilizing both the NEMD and EMD methods. It is
shown that the thermal boundary conductance has almost no dependence on the length of the
molecules. Gk values obtained from the NEMD method were all in the same range and exhibited
repeatability. However, the EMD-determined Gk values exhibit big error bars which is common
in the EMD methodology. Six (6) simulations with different initial conditions were run to check
on the repeatability of the simulations for the EMD method. The Gk values obtained from the
EMD simulations are less than the values from the NEMD simulations where this difference
reaches a factor of nearly five (5) in most cases.

76
Table 4-1: Thermal boundary conductance values for different number of replications for the n-
alkanes using the NEMD method
n-eicosane
C20H42
n-tetracosane
C24H50
n-hexacosane
C26H54
n-triacontane
C30H62
Gk (NEMD)
(MW/m2 K)
6 172.4 221.9 183.4 161.6
8 204.1 228.9 208.3 208.6
10 254.2 207.3 221.6 215.5
12 223.7 243.8 218.5 243.7
Replicas
N-alkanes

77
Table 4-2: Summary of the thermal boundary conductance values obtained from the NEMD and
EMD methods
N-alkanes n-eicosane
C20H42
n-tetracosane
C24H50
n-hexacosane
C26H54
n-triacontane
C30H62
Gk (NEMD)
(MW/m2 K) 214 219 216 212
Gk (EMD)
(MW/m2 K) 39 - 34 46

78
Figure 4-1: Temperature profiles for the case of perfect crystals with six (6) replications in
response to the imposed heat flux for (a) C20H42, (b) C24H50, (c) C26H54 and (d) C30H62
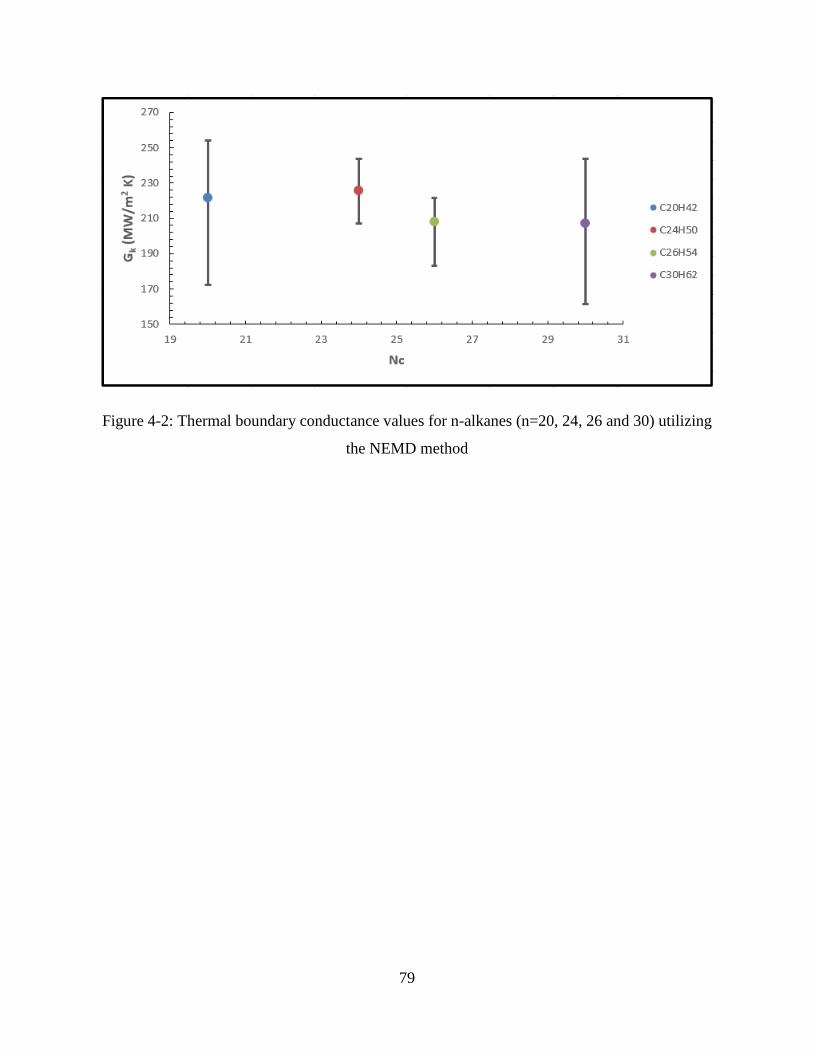
79
Figure 4-2: Thermal boundary conductance values for n-alkanes (n=20, 24, 26 and 30) utilizing
the NEMD method

80
Figure 4-3: Snapshot of the system of three stacked n-eicosane (n=20) molecule layers after
equilibration utilizing the EMD method (red balls shown as -CH3 groups and grey balls as -CH2-
groups)

81
Figure 4-4: Power auto-correlation function (PACF) for C20H42 molecules as a function of time

82
Figure 4-5: Integrated value of the PACF for C20H42 molecules as a function of time (red part is
the tail of the graph)

83
Figure 4-6: Thermal boundary conductance determined by the EMD method vs. the number of
carbon atoms within the n-alkanes molecule chains

84
Figure 4-7: Comparison between the values of the thermal boundary conductance obtained from
the NEMD and EMD methods

85
5. Chapter Five: Conclusions
In this chapter, conclusions pertinent to the molecular dynamics simulations and experimental
determination of the thermal conductivity of long chain n-alkanes are presented.
Firstly in this thesis, the nanoscale thermal transport within long chain n-alkanes was
investigated utilizing molecular dynamics simulations. Specifically, the effect of the length of n-
alkane molecules on the thermal conductivity of n-alkanes and the thermal interfacial
conductance between the layers of n-alkanes was studied. Thermal conductivity of some long
chain n-alkanes was also measured experimentally using the TPS method and the results were
compared with those of the MD simulations.
Thermal conductivity of n-alkanes:
Molecular dynamics simulations were utilized to investigate the nanoscale thermal transport for
both liquid and solid n-alkanes. The solid phase n-alkanes exhibit a more organized structure
compared to the liquid systems, where crystalline nano-domain structures are clearly observed.
Structural organization of the solid n-alkanes was quantified using the alignment factor when
compared to the randomly-oriented molecules in the liquid systems. This suggests that as the
structure becomes more organized, it will result in higher thermal conductivity values. Moreover,
it is shown that the perfect crystal structures exhibit higher thermal conductivities compared to
the solid structures. This can also be a proof to the fact that if the molecules in the system align
in an organized structure, this will enhance the thermal conductivity.
Using molecular dynamics simulations, the thermal conductivity of four (4) n-alkanes (n = 20,
24, 26 and 30) in liquid, solid and perfect crystal phases was determined by the direct non-
equilibrium molecular dynamics (NEMD) method. Imposing a heat flux over the samples will

86
lead to an associated temperature profile. Using the temperature gradient, heat flux value and the
Fourier’s relation, the thermal conductivity of these n-alkanes was calculated. Thermal
conductivity values for liquid n-alkanes increase as the number of the carbon atoms within the
chains increase which is consistent with the available experimental data in the literature. For the
case of solid n-alkanes, there was no distinct relation between the thermal conductivity and the
length of the n-alkane molecule. Thermal conductivity of C24H50 was higher than C20H42. As the
number of the carbon atoms within the molecules increase from n=24 to n=26, thermal
conductivity remained almost unchanged. Thermal conductivity of C30H62 was the highest
among these solid n-alkanes. Overall, there is an increase in the thermal conductivity of solid n-
alkanes as the length of the n-alkane molecules increases, however, we cannot conclude that
thermal conductivity of solid n-alkanes rises with the number of the carbon atoms within the
chains. The possible effect of anisotropy of the thermal conductivity tensor due to the structural
organization of the solid phase was also investigated and was shown to be negligible. Perfect
crystal n-alkanes follow a zigzag trend for thermal conductivity values with the number of the
carbon atoms within the n-alkane molecules which is interesting because in previous studies of
n-alkanes, this zigzag trend for other thermodynamic properties such as the melting point and
etc. was reported.
The transient plane source (TPS) method was utilized to measure the thermal conductivity of
three (3) pure n-alkanes (n = 20, 24 and 26) in the solid phase. The experimental thermal
conductivity values of C20H42 agreed well with previous measured data of other researchers. It
was shown that the thermal conductivities of C20H42 and C24H50 are very close to each other,
whereas the thermal conductivity decreased for C26H54. This trend suggests that the thermal
conductivity of n-alkanes goes down as the number of the carbon atoms within the n-alkane

87
molecules increase from n=20 to n=26 which is opposite of the results obtained from the MD
simulations. However, we cannot conclude this suggested trend because the thermal conductivity
of solid n-triacontane (n=30) is not measured experimentally.
Thermal boundary conductance:
Thermal interfacial conductance between the layers of the perfect crystal n-alkanes was
determined utilizing both equilibrium and non-equilibrium molecular dynamics (EMD and
NEMD respectively) methods. The EMD method uses the Green-Kubo relation for the thermal
boundary conductance which relates power fluctuations across the interfaces to the thermal
boundary resistance. In the NEMD method, heat flux was directly imposed over the stacked
perfect crystal n-alkane layers. Temperature drop/rise across each interface was related to the
thermal boundary conductance between the neighboring layers. It is shown that the thermal
interfacial conductance between the layers is not changing as the number of the carbon atoms
within the n-alkane molecules increase. Both methods (NEMD and EMD) exhibit the same trend
for the thermal interfacial conductance where no significant change in the thermal boundary
conductance values was seen. However, values obtained from the EMD simulations are less than
the values from NEMD simulations where this difference reaches a factor of nearly five (5) in
most cases.
88
Bibliography
Babaei, Hasan, “Molecular-level modeling of thermal transport mechanisms within carbon
nanotube/graphene-based nanostructure-enhanced phase change materials.” Diss. Auburn
University, (2014), http://etd.auburn.edu/.
Babaei, Hasan, Keblinski P., and Khodadadi J. M., "Thermal conductivity enhancement of
paraffins by increasing the alignment of molecules through adding CNT/graphene." International
Journal of Heat and Mass Transfer, Vol. 58 Issue 1, pp. 209-216, (2013).
Barnes, J. D., "Inelastic neutron scattering study of the rotator phase transition in n-
nonadecane." The Journal of Chemical Physics, Vol. 58, Issue 12, pp. 5193-5201, (1973).
Barrat, J.-L., and Chiaruttini, F., “Kapitza resistance at the liquid-solid interface.” Molecular
Physics, 101(11), pp. 1605–1610, (2003).
Boese, Roland, Weiss H.-C., and Bläser D., "The Melting point alternation in the short‐chain
n‐alkanes: single‐crystal x‐ray analyses of propane at 30 K and of n‐butane to n‐nonane at 90
K." Angewandte Chemie International Edition, Vol. 38, Issue 7, pp. 988-992, (1999).

89
Cahill, D. G., Ford, W. K., Goodson, K. E., Mahan, G. D., Majumdar, A., Maris, H. J., ... and
Phillpot, S. R., “Nanoscale thermal transport.” Journal of Applied Physics, Vol. 93, Issue 2, pp.
793-818, (2003).
Chalmers, Bruce, "How water freezes." Scientific American, Vol. 200, pp. 114-122, (1959).
Chen, Gang, "Phonon heat conduction in nanostructures." International journal of thermal
sciences, Vol. 39, issue 4, pp. 471-480, (2000).
Edberg, R., Evans, D. J., and Morriss, G. P., "Constrained molecular dynamics: Simulations of
liquid alkanes with a new algorithm." The Journal of chemical physics, Vol. 84, Issue 12, pp.
6933-6939, (1986).
Esselink, K., Hilbers, P. A. J., and Van Beest, B. W. H., “Molecular dynamics study of
nucleation and melting of n‐alkanes.” The Journal of Chemical Physics, 101, 9033, (1994).
Fan, L. and Khodadadi, J. M., “Thermal conductivity enhancement of phase change materials for
thermal energy storage: a review.” Renewable and Sustainable Energy Reviews, Vol. 15, pp. 24-
46, (2011).
Fan, Liwu, “Enhanced thermal conductivity and expedited freezing of nanoparticle suspensions
utilized as novel phase change materials.” Diss. Auburn University, (2011),
http://hdl.handle.net/10415/2707.
Fang, Xin, et al., "Increased thermal conductivity of eicosane-based composite phase change
materials in the presence of graphene nanoplatelets." Energy & Fuels, Vol. 27, issue 7, pp. 4041-
4047, (2013).

90
Frenkel, Daan, "Simulations: The dark side." The European Physical Journal Plus, Vol. 128,
Issue 1, pp. 1-21, (2013).
Hu, L., Desai, T. G., and Keblinski, P., “Determination of interfacial thermal resistance at the
nanoscale.” Physical Review B, Vol. 83, Issue 19, 195423, (2011).
Jorgensen, W. L., Madura, J. D., Swenson, C. J., and Carol, J., “Optimized intermolecular
potential functions for liquid hydrocarbons.” Journal of American Chemical Society, 106(22),
pp. 6638-6646, (1984).
Kapitza, P. L., “The study of heat transfer in helium II.” Zh. Eksp. Teor. Fiz, Vol. 11, Issue 1,
(1941) [English translation: Journal of Physics-USSR, 4, 181.]
Khodadadi, J. M., Fan Liwu, and Babaei H., "Thermal conductivity enhancement of
nanostructure-based colloidal suspensions utilized as phase change materials for thermal energy
storage: a review." Renewable and Sustainable Energy Reviews, Vol. 24, pp. 418-444, (2013).
Knight, Charles Alfred, "The freezing of supercooled liquids." 1-1, (1967).
Kubo, R., “Statistical-mechanical theory of irreversible processes. I. General theory and simple
applications to magnetic and conduction problems.” Journal of the Physical Society of Japan,
Vol. 12, Issue 6, pp. 570-586, (1957).
Landry, E. S., “Thermal transport by phonons across semiconductor interfaces, thin films and
superlattices.” PhD thesis, Carnegie Mellon University, (2009).
Lennard-Jones, J. E., "On the Determination of molecular fields." Proc. R. Soc. Lond. A 106
(738), pp. 463–477, (1924).

91
Liang, Z., Evans, W. and Keblinski, P., “Equilibrium and nonequilibrium molecular dynamics
simulations of thermal conductance at solid-gas interfaces.” Physical Review E, Vol. 87, Issue 2,
pp. 022119, (2013).
Liang, Zhi, Evans, William, and Keblinski, P. "Equilibrium and nonequilibrium molecular
dynamics simulations of thermal conductance at solid-gas interfaces." Physical Review E, Vol.
87, Issue 2, 022119, (2013).
Luo, T., and Lloyd J. R., "Equilibrium molecular dynamics study of lattice thermal
conductivity/conductance of Au-SAM-Au junctions." Journal of Heat Transfer, Vol. 132, Issue
3, 032401, (2010).
Marbeuf, A., and Brown, R., “Molecular dynamics in n-alkanes: Premelting phenomena and
rotator phases.” The Journal of Chemical Physics, 124, 054901 (2006).
Marechal, G., Ryckaert, J-P, and Bellemans, André, "The shear viscosity of n-butane by
equilibrium and non-equilibrium molecular dynamics." Molecular Physics, Vol. 61, Issue 1, pp
33-49, (1987).
Martin, M. G., and Siepmann, J. I., “Transferable potentials for phase equilibria. 1. United-atom
description of n-alkanes.” The Journal of Physical Chemistry B, Vol. 102, Issue 14, pp. 2569-
2577, (1998).
Martínez, L., Andrade, R., Birgin, E. G. and Martínez, J. M., “Packmol: A package for building
initial configurations for molecular dynamics simulations.” Journal of Computational Chemistry,
Vol. 30, pp. 2157-2164, (2009).

92
Mehling, H. and Cabeza, L. F., “Heat and cold storage with PCM: An up to date introduction
into basics and application.” Springer-Verlag, Berlin, GERMANY, (2008).
Merabia, Samy, and Termentzidis, K. "Thermal conductance at the interface between crystals
using equilibrium and nonequilibrium molecular dynamics." Physical Review B, Vol. 86, Issue
9, 094303, (2012).
Murashov, Vladimir, and Mary Anne White, "Thermal conductivity of insulators and
glasses." Thermal Conductivity. Springer US, pp. 93-104, (2004).
Nabil, Mahdi, and Khodadadi, J. M., "Experimental determination of temperature-dependent
thermal conductivity of solid eicosane-based nanostructure-enhanced phase change
materials." International Journal of Heat and Mass Transfer, Vol. 67, pp. 301-310, (2013).
Nabil, Mahdi. "Thermal Conductivity of Nanostructure-Enhanced Phase Change Materials:
Measurements for Solid Eicosane-Based Copper Oxide and Carbon Nanotube Colloids and
Numerical Modeling of Anomalous Measurements near Phase Transition." Thesis, Auburn
University, (2013), http://hdl.handle.net/10415/3672.
Nath, S. K., Escobedo, F. A., and de Pablo, J. J., “On the simulation of vapor–liquid equilibria
for alkanes.” The Journal of Chemical Physics, 108, 9905, (1998).
Norris, Pamela M., Le, Nam Q., and Baker, Christopher H., "Tuning phonon transport: from
interfaces to nanostructures." Journal of Heat Transfer, Vol. 135, Issue 6, 061604, (2013).
Plimpton, S., “Fast parallel algorithms for short-range molecular dynamics.” Journal of
Computational Physics, Vol. 117, pp. 1-19, (1995).

93
Pop, Eric, "Energy dissipation and transport in nanoscale devices." Nano Research, Vol. 3, Issue
3, pp. 147-169, (2010).
Rao, Z., Wang, S., and Peng, F., “Self diffusion and heat capacity of n-alkanes based phase
change materials: A molecular dynamics study.” International Journal of Heat and Mass
Transfer, Vol. 64, pp. 581–589, (2013).
Rastorguev, Y. L., Bogatov, G. F. and Grigor’ev, B. A., “Thermal conductivity of higher n-
alkanes.” Chemistry and Technology of Fuels and Oils, Vol. 10, Issue 9, pp. 728-732, (1974).
Rigby, D. and Roe, R., “Molecular dynamics simulation of polymer liquid and glass. II. Short
range order and orientation correlation.” The Journal of Chemical Physics, Vol. 89, pp. 205280,
(1988).
Ryckaert, J. P. and Klein, M. L., “Translational and rotational disorder in solid n-alkanes:
constant temperature-constant pressure molecular dynamics calculations using infinitely long
flexible chains.” J. Chem. Phys. Vol. 85, Issue 3, (1986).
Schelling, P. K., Phillpot, S. R., and Keblinski, P., “Comparison of atomic-level simulation
methods for computing thermal conductivity.” Physical Review B, Vol. 65, Issue 14, pp. 1–12,
(2002).
Sellan, D., Landry, E., Turney, J., McGaughey, A., and Amon, C., “Size effects in molecular
dynamics thermal conductivity predictions.” Physical Review B, Vol. 81, Issue 21, pp. 1–10,
(2010).
Shenogin, S., Ozisik, R., “Xenoview: visualization for atomistic simulations.” (2007).

94
Shenogin, S., Xue, L., Ozisik, R., Keblinski, P., and Cahill, D.G., “Role of thermal boundary
resistance on the heat flow in carbon-nanotube composites.” Journal of Applied Physics, Vol. 95,
Issue 12, pp. 8136–8144, (2004).
Smit, B., Karaborni, S., and Siepmann, J. I., “Computer simulations of vapour-liquid phase
equilibria of n-alkanes.” Journal of Chemical Physics, 102, 2126, (1995).
Stevens, Robert J., Zhigilei Leonid V., and Norris Pamela M. "Effects of temperature and
disorder on thermal boundary conductance at solid–solid interfaces: Nonequilibrium molecular
dynamics simulations." International Journal of Heat and Mass Transfer, Vol. 50, Issue 19, pp.
3977-3989, (2007).
Stryker, P. C., and Sparrow, E. M., "Application of a spherical thermal conductivity cell to solid
n-eicosane paraffin." International journal of heat and mass transfer, Vol. 33, issue 9, pp. 1781-
1793, (1990).
Swartz, E. T., and Pohl, R. O., “Thermal boundary resistance.” Reviews of Modern Physics, Vol.
61, Issue 3, pp. 605-668, (1989).
Ungar, G., and Masic, N., "Order in the rotator phase of n-alkanes." The Journal of Physical
Chemistry, Vol. 89, Issue 6, pp. 1036-1042, (1985).
Vogelsang, R., Hoheisel, C., Paolini, G. V., and Ciccotti, G., “Soret coefficient of isotopic
Lennard-Jones mixtures and the Ar-Kr system as determined by equilibrium molecular-dynamics
calculations.” Physical Review A, Vol. 36, Issue 8, pp. 3964-3974, (1987).
Wang, J., H. Xie and Z. Xin, “Thermal properties of paraffin based composites containing multi-
walled carbon nanotubes.” Thermochimica Acta, Vol. 488, pp. 39–42, (2009).

95
Wentzel, N., and Milner S. T., “Crystal and rotator phases of n-alkanes: A molecular dynamics
study,” The Journal of Chemical Physics, 132, 044901 (2010)
Yarbrough, D. W. and Kuan, C. N., “The thermal Conductivity of Solid N-Eicosane, N-
Octadecane, N-Heptadecane, N-Pentadecane and N-Tetradecane.” Proceedings of the 17th Int.
Thermal Conductivity Conference, pp. 265-274, (1981).
Yaws, Carl L., “Handbook of Thermal Conductivity, Volume 3:: Organic Compounds C8 to
C28.” Vol. 3, Gulf Professional Publishing, (1995).

96
Appendix A: Three Dimensional Fourier’s Law and the Anisotropy Effect
The Fourier’s Law can be written in vector and index notations as follows:
�� = −𝑘 ∇𝑇, (A-1a)
𝑞𝑖 = −𝑘𝑖𝑗𝑑𝑇
𝑑𝑋𝑗, (A-1b)
where �� is the heat flux vector, �� is the thermal conductivity tensor and ∇𝑇 is the temperature
gradient vector. Utilizing the three dimensional Cartesian coordinate system (X1-, X2- and X3-
coordinates), the Fourier’s Law is re-written as the following equations:
𝑞1 = −𝑘11𝑑𝑇
𝑑𝑋1− 𝑘12
𝑑𝑇
𝑑𝑋2− 𝑘13
𝑑𝑇
𝑑𝑋3, (A-2)
𝑞2 = −𝑘21𝑑𝑇
𝑑𝑋1− 𝑘22
𝑑𝑇
𝑑𝑋2− 𝑘23
𝑑𝑇
𝑑𝑋3, (A-3)
𝑞3 = −𝑘31𝑑𝑇
𝑑𝑋1− 𝑘32
𝑑𝑇
𝑑𝑋2− 𝑘33
𝑑𝑇
𝑑𝑋3, (A-4)
where 𝑞𝑖 (i =1, 2 and 3) is the heat flux component in the i-th direction, 𝑘𝑖𝑗 is thermal
conductivity tensor and 𝑑𝑇
𝑑𝑋𝑗 is the temperature gradient due to the heat flux. The thermal
conductivity tensor can be shown as follows:
𝑘𝑖𝑗 = [
𝑘11 𝑘12 𝑘13
𝑘21 𝑘22 𝑘23
𝑘31 𝑘32 𝑘33
]. (A-5)
As was discussed in chapter 3 (section 3.3.3.1), the solid n-alkane samples exhibit a crystalline
structure with observable and quantified grain boundaries. The nano-crystalline domains in the
solid structures may introduce the anisotropy effect in the case of thermal conductivity
97
determination. Thus, to address this effect, the temperature profiles in the y- and z-directions due
to the imposed heat flux in the x-direction were also obtained. As was expected, there was no
noticeable temperature change in the y- and z-directions. The temperature variations in the y-
and z-directions are shown in Figures A-1 and A-2 for the solid C20H42 (shortest chain),
respectively, whereas the temperature variations in the y- and z-directions are shown in Figures
A-3 and A-4 for C30H62 (longest chain), respectively. It is observed that the temperature
variations in the y- and z-directions (due to the heat flux through the x-direction) fluctuate about
an average temperature value. The values of the maximum temperature difference in all three
spatial directions due to the heat flux in the x-direction are given in Table A-1. It can be inferred
from the values in Table A-1 that there is no noticeable anisotropy for the base solid structure
and the number of molecules were chosen such that this effect is negligible. In effect, the off-
diagonal components of the thermal conductivity tensor (𝑘𝑖𝑗 , 𝑖 ≠ 𝑗) are shown to be negligible.
The determination of the dominant diagonal elements of the same matrix (𝑘𝑖𝑗 , 𝑖 = 𝑗) is presented
in this thesis.

98
Table A-1: Maximum temperature difference in three directions (x-, y- and z-directions) due to
heat flux in the x-direction for two n-alkanes
N-alkane C20H42 C30H62
Maximum
Temperature
Difference,
ºC
X-
Direction
98.8 67.4
Y-
Direction
3.2 1.2
Z-
Direction
2.5 1.0

99
Figure A-1: Temperature profile in the y-direction due to the heat flux in the x-direction for solid
n-C20H42

100
Figure A-2: Temperature profile in the z-direction due to the heat flux in the x-direction for solid
n-C20H42

101
Figure A-3: Temperature profile in the y-direction due to the heat flux in the x-direction for solid
n-C30H62

102
Figure A-4: Temperature profile in the z-direction due to the heat flux in the x-direction for solid
n-C30H62