effect of temperature and frequency on the dielectric ... ·...
TRANSCRIPT
U.S. Department of Commerce, Bureau of Standards
RESEARCH PAPER RP585
Part of Bureau of Standards Journal of Research, Vol. 11, August 1933
EFFECT OF TEMPERATURE AND FREQUENCY ON THEDIELECTRIC CONSTANT, POWER FACTOR, AND CON-DUCTIVITY OF COMPOUNDS OF PURIFIED RUBBERAND SULPHUR
By A. H. Scott, A. T. McPherson, and Harvey L. Curtis
ABSTRACTThe dielectric constant, power factor, and conductivity of purified rubber and
of a series of its compounds with sulphur were determined at temperatures from— 75° to 235° C. The dielectric constant and power factor were measured atfive frequencies from 60 to 300,000~ and the apparent conductivity at about0.002 second and at one minute after the application of potential. The resultsof the measurements are expressed in both tabular and graphic form. At 25° C.and 1,000^ the dielectric constant of purified rubber containing no sulphur was2.37. With increasing sulphur content the dielectric constant increased to amaximum of about 3.75 at 11.5 percent sulphur, then decreased to a minimumof 2.70 at 22 percent sulphur and again increased to 2.82 at 32 percent sulphur.Under similar circumstances, the power factor increased from 1.6X10⁻³ for therubber alone to a maximum of 93.8X10⁻³ for the compound containing 13.5percent sulphur; it then decreased to about 4.0 X 10~3 at 20 percent sulphur, andagain slowly increased to 5.1 X 10⁻³ at 32 percent sulphur. The 1-minute conduc-tivity was 2.3X10⁻¹⁷ mho/cm for the rubber alone. With 12 percent sulphur, it
was only 0.5X10⁻¹⁷, while at 18 percent sulphur it passed through a sharp maxi-
mum of 38X10-17, and then decreased to values between 1 and 1.5X10⁻¹⁷ for
compositions between 22 and 32 percent sulphur. Changes of the temperatureor the frequency at which the measurements were made shifted the maxima andminima in these curves and modified their heights. For example, at —25° C,the maximum dielectric constant at 1,000-^ was 2.8, and was obtained with acompound containing 4 percent sulphur, while at 145° C. the maximum was 4.5
and was obtained for a compound containing about 28 percent sulphur. Com-parison of the results of this investigation on purified rubber with previous workdone with crude rubber indicates that purification alters the values obtained forthe electrical properties, but it does not modify the general manner in whichthese properties vary with changes in composition, temperature, or frequency.The results may have practical bearing on the selection of rubber compounds for
specific uses and in pointing out the manner in which the properties of rubberare related to temperature or frequency.
CONTENTSPage
I. Introduction 174II. Preparation of specimens 175
1. Purification of rubber 1752. Mixing of rubber and sulphur 1753. Electrodes 1764. Molding of specimens 1765. Vulcanization of specimens 177
III. Measurement of the dimensions of specimens 1771. Measurement of thickness 1772. Measurement of area 1793. Change in dimensions with temperature 179
IV. Mounting of specimens for electrical measurement 1801. Electrical connections to test specimens 1802. Chamber for measurements at 25° C 1803. Chamber for measurements at - 75° to 235° C 1814. Means for maintaining constant temperature 182
173
174 Bureau of Standards Journal oj Research [Vol. u
Pafee
V. Electrical measurements 1831. Capacitance and power factor 1832. Dielectric constant 1853. Conductance 1874. Conductivity 1875. Accuracy of determinations 188
(a) Effect of errors in dimensional measurements 189(6) Possible sources of error in electrical connections
and measurements 189(c) Independent determinations of dielectric constant- 189(d) Effect of the condition of electrode surfaces 190
VI. Values of electrical properties 1901. Electrical properties at 25° C 191
(a) Dielectric constant 191(6) Power factor 192(c) Conductivity 193
2. Measurements at —75° to 235° C 193(a) Dielectric constant 196(6) Power factor 200(c) Conductivity 205
VII. Comparison of the electrical properties of compounds of purifiedrubber and sulphur with those of crude rubber and sulphur 207
VIII. Selection of rubber compounds for specific uses 208IX. Conclusion 209X. Acknowledgment 209
I. INTRODUCTION
The authors have previously reported results 1 on the electrical
properties of a series of rubber-sulphur compounds which were madefrom commercial rubber and were measured at 25° C. with 1,000 ~.The present paper reports results on the electrical properties of asimilar series of compounds made from purified rubber and measuredover a wide range of temperature and frequency. Sufficient datahave been obtained to enable one to determine the dielectric constantand power factor for any composition of rubber and sulphur at anyuseful temperature and at any normal frequency.The results obtained in this paper do not entirely confirm the con-
clusions of the previous paper. When the electrical measurementsreported in that paper were plotted as functions of the percent of
combined sulphur, curves were obtained which showed changes in
direction at compositions corresponding to simple, empirical formulas.From this evidence as well as from a consideration of changes in
density with composition, it was inferred that
The existence of a definite compound of empirical formula (C5H 8)2S is indicatedby all the properties which have been studied. Evidence for the other threecompounds (CsHg^S, (C5H8) 3S, and (C5H 8 ) 4S3 is less complete.
Soon after that paper was published it was pointed out by Kimura,Aizawa, and Takeuchi 2 that the electrical properties are functions of
the temperature, and by Kitchin 3 that they are functions of the fre-
quency at which measurements are made. Kimura and Namikawa 4
i H. L. Curtis, A. T. McPherson, and A. H. Scott, Density and Electrical Properties of the System,Rubber-Sulphur, Part II. Electrical Properties of Rubber-Sulphur Compounds, B.S.,Sci. Papers, vol.
22 (S560), p. 398, 1927.2 S. Kimura, T. Aizawa, and T. Takeuchi, Dielectric Properties of the Rubber-Sulphur System, Inst.
Elec.Engrs.J. (Japan) pp. 1274-1277, December 1928.3 Donald W. Kitchin, Power Factor and|Dielectric Constant in Viscous Dielectrics, Am.Inst.Elec.
Engrs.J., vol. 48, p. 495, 1929.4 S. Kimura and N. Namikawa, The Specific Gravity and Thermal Expansion of the Rubber-Sulphur
System, Soc.Chem.Indust.J. (Japan), Supplemental Binding, vol. 32, p. 196B, 1929.

Scott, Mcpherson]Electrical Properties of Rubber 175
pointed out that the density and coefficient of expansion of the rubber-sulphur compounds likewise varies with the temperature. Hence,the positions of the maxima and minima which were observed in theearlier paper and were attributed to the formation of definite com-pounds of rubber and sulphur bear no relation to the chemical struc-
ture of the vulcanized rubber.The present paper is primarily concerned with the description of
methods of experimental measurement of the electrical properties andthe presentation of the results. A consideration of the results in thelight of modern dielectric theory will form the subject of a separatepaper.
II. PREPARATION OF SPECIMENS
The specimens were prepared by molding and vulcanizing thinsheets of different rubber-sulphur compounds between aluminumplates which later served as electrodes. The process of preparationconsisted in purifying the rubber, mixing it with sulphur, molding it
between prepared electrodes, and vulcanizing the specimen thus formedin an atmosphere of inert gas.
1. PURIFICATION OF RUBBER
The purification of rubber consisted in the digestion of crude rubberor latex with water at about 180° C, followed by washing with water,extraction with alcohol, and drying in an atmosphere of inert gas.
The digestion hydrolyzed the proteins, while the washing and extrac-
tion served to remove the protein-hydrolysis products, the resins, thesugars, and part of the inorganic salts. The product, thus obtained,contained about 99.5 percent of rubber hydrocarbon. The principal
impurities were inorganic salts, as indicated by ash, and residual
quantities of resins and protein-hydrolysis products, as indicated bya few hundredths percent of oxygen and nitrogen. This method of
purification afforded a simple and convenient method for makingrubber hydrocarbon of reasonably high purity in lots of several kilo-
grams. A detailed description of the method of purification and a
discussion of the properties of the purified rubber is given elsewhere. 5
2. MIXING OF RUBBER AND SULPHUR
The purified rubber was usually mixed with sulphur in an internal
mixer in an atmosphere of nitrogen or carbon dioxide, but some batcheswere mixed carefully on a roll mill in air. The rubber and the sulphurwere weighed separately and the batch was weighed after mixing.
The weight of the batch seldom differed from the sum of the weightsof the constituents by more than 1 part in 1,000. Any greater dif-
ference was due to a loss of sulphur by dusting and the requisite
quantity of sulphur was added to correct this loss. The batches,
after mixing, were stored in an atmosphere of inert gas until used for
making specimens.The sulphur employed was a commercial grade of ground, rhombic
sulphur, specially prepared for use in rubber manufacture. Analysisindicated no impurities except a trace of ash.
» A. T. McPherson, A Method for the Purification of Rubber and Properties of Purified Rubber, B.S.Jour. Research (RP449), vol. 8, p. 751, 1932.
176 Bureau of Standards Journal of Research [Vol. n
3. ELECTRODES
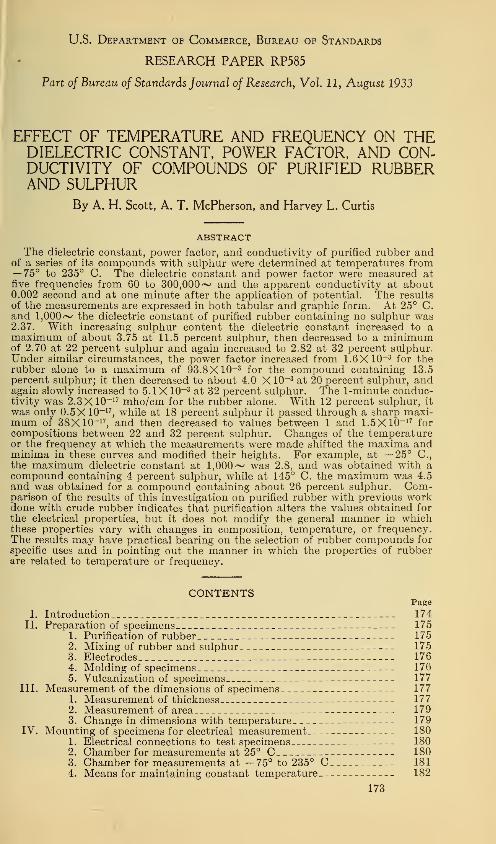
The electrodes were circular disks cut from aluminum sheet andwere approximately 0.025 cm in thickness. They were used in pairs
24 and 26 cm in diameter, respectively, as indicated in figure 1.
The electrodes were of two types—one type was made from ordinarypolished aluminum sheet, and the other from aluminum sheet perfo-
rated with fine holes. The perforated aluminum sheet used for this
purpose had 97 perforations per square centimeter; each perforation
was about 0.05 cm in diameter and was separated from adjacentperforations by about the same distance.
The electrodes of polished sheets were employed in measurements at25° C. These ordinary electrodes were not satisfactory, however,for specimens that were to be measured over a range of temperature,because differences in thermal expansion frequently caused separationof the rubber and metal. For this reason, specimens that were to beemployed in determining the effect of temperature were made withelectrodes of perforated aluminum. Since the rubber was molded
5rr?c?/i/ A/u/n/nc/m £/<?cfroJe
/.25/nn? f ~. Rubber
f L i JT
ZGcm h
I LanpG A/um/num £/ecJ-roc/e
Figure 1.
—
Cross section of molded specimen.
into the perforations, excellent attachment to the electrodes wassecured at all times.
4. MOLDING OF SPECIMENS
The electrical test specimens were made by placing the requisite
quantity of the unvulcanized rubber-sulphur stock in the form of asheet about 1 cm thick between a pair of electrodes and pressing it
out in a hydraulic press to form a sheet about 0.075 cm thick betweenthe electrodes. The exact thickness was controlled by the use of alarge spacing ring between the platens of the press. Enough of therubber-sulphur stock was used to permit considerable overflow beyondthe edge of the electrodes. The overflow carried most of the entrappedair with it, and thus minimized the quantity of air enclosed in thespecimen. A large sheet of aluminum foil was placed on each side
of the specimen in order to prevent the overflow from sticking to theplatens of the press. The foil was left on the specimen during vulcani-zation and up to the time the electrical measurements were made,in order to protect the rubber from oxidation and contamination.
Care was exercised to secure a uniform thickness that could bemeasured with the accuracy requisite for the determination of thedielectric constant. The platens of the press were plane to within0.01 cm over the entire bearing surfaces. The molding was doneat about 100° C, and the specimen was left between the platens of
the press for 10 minutes in order to permit the rubber to flow as much
scott, Mcpherson]Electrical Properties of Rubber 177
as it would. The best specimens that were obtained were uniform in
thickness to within 2 percent of the thickness of the rubber, or about15 n, over their entire area, but in some cases the thickness of the
specimens varied by as much as 5 or 10 percent. These large varia-
tions were traced to inequalities or irregularities in the platens andcould be eliminated by regrinding which was done whenever they werediscovered.
5. VULCANIZATION OF SPECIMENS
After molding, the specimens were vulcanized in an autoclave.
Those made during the early part of the investigation were vulcan-ized in open steam, but the majority of the specimens were vulcanizedunder pressure in an autoclave filled with carbon dioxide, hydrogen, or
nitrogen. An autoclave for this purpose was improvised from a
standard 12-inch iron pipe cap on which a rigid iron plate was bolted
as a cover. A gasket made from a ring of wire solder effectively
prevented the leakage of gas.
The time of vulcanization in the gas-filled autoclave was between25 and 40 hours at 140° C, with the gas pressure at 50 or 60 lbs. /in.
2
in excess of the pressure of the atmosphere. Vulcanization in steamwas conducted for about 15 hours at 149° C. This relatively longtime of vulcanization was intended to bring practically all the sulphurinto combination with the rubber. Analysis indicated that this pur-pose was accomplished in the case of all specimens except those con-taining the maximum amount of sulphur. Specimens compoundedwith 32 percent of sulphur were found to contain 0.5 to 0.8 percentof sulphur in the uncombined state. Those compounded with 28percent of sulphur contained 0.1 to 0.2 percent of free sulphur, whilethe specimens of lower sulphur content contained not more than 0.1
percent of the element in the uncombined state.
III. MEASUREMENT OF THE DIMENSIONS OF SPECIMENS
The dielectric constant and the conductivity of the material of aflat specimen with ordinary electrodes can be computed from theresults of electrical measurements, the thickness between the elec-
trodes, and the area of the smaller electrode.
That, however, cannot be done for specimens having perforatedelectrodes. Here the electrical properties may be arrived at indirectly
by determining experimentally a shape factor for each specimen—
a
procedure which amounts to finding the dimensions of a parallel platecapacitor which would be equivalent to the specimen under considera-tion.
1. MEASUREMENT OF THICKNESS
The majority of the measurements of thickness were made with thedial gage which was used by the authors in previous investigations.6
This gage, however, was found to be unsuitable because the pressureexerted by the plunger, which had a very small foot, reduced thethickness of the rubber of the softer specimens even through the thinaluminum electrodes. The error from this source was as much as 2
percent for some soft rubber specimens but was negligible in the case
6 See footnote 1 (p. 174) and also H. L. Curtis and A. T. McPherson, Dielectric Constant, Power Factor,and Resistivity of Rubber and Gutta-Percha, B.S.Tecb. Papers, vol. 19, p. 669, 1925.
205—33 2
178 Bureau of Standards Journal oj Research [Vol. 11
W£T/GHT
of hard rubber. A correction for each composition was determinedand was applied to the measurements which had been made with thedial gage.
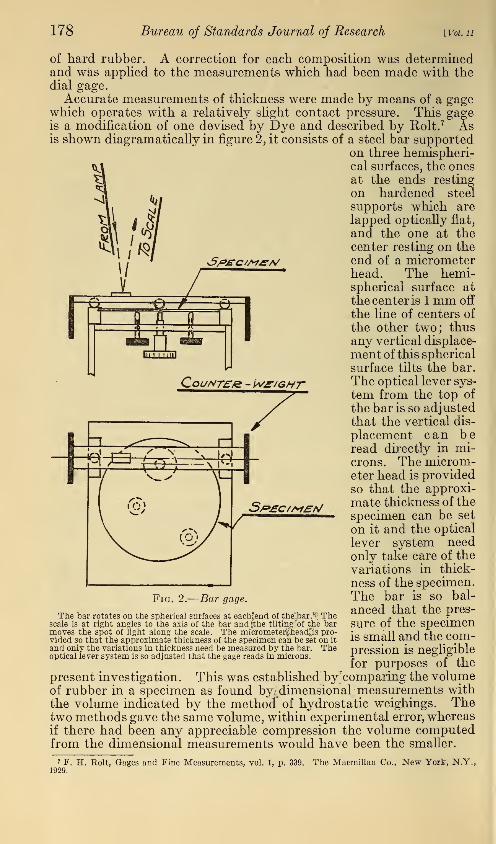
Accurate measurements of thickness were made by means of a gagewhich operates with a relatively slight contact pressure. This gageis a modification of one devised by Dye and described by Rolt. 7 Asis shown diagramatically in figure 2, it consists of a steel bar supported
on three hemispheri-cal surfaces, the onesat the ends resting
on hardened steel
supports which are
lapped optically flat,
and the one at thecenter resting on theend of a micrometerhead. The hemi-spherical surface at
the center is 1 mm off
the line of centers of
the other two; thusany vertical displace-
ment of this spherical
surface tilts the bar.
The optical lever sys-
tem from the top of
the bar is so adjustedthat the vertical dis-
placement can beread directly in mi-crons. The microm-eter head is providedso that the approxi-
mate thickness of the
specimen can be set
on it and the optical
lever system needonly take care of the
variations in thick-
ness of the specimen.The bar is so bal-
anced that the pres-
sure of the specimenis small and the com-pression is negligible
for purposes of the
present investigation. This was established by^comparing the volumeof rubber in a specimen as found by^dimensional- measurements withthe volume indicated by the method of hydrostatic weighings. Thetwo methods gave the same volume, within experimental error, whereasif there had been any appreciable compression the volume computedfrom the dimensional measurements would have been the smaller.
«S/RffC/AflfiV
Fig. 2.
—
Bar gage.
The bar rotates on the spherical surfaces at each^end of the'bar.l: Thescale is at right angles to the axis of the bar and £the tilting ;of the barmoves the spot of light along the scale. The micrometergheadgis pro-vided so that the approximate thickness of the specimen can be set on it
and only the variations in thickness need be measured by the bar. Theoptical lever system is so adjusted that the gage reads in microns.
7 F. H. Rolt, Gages and Fine Measurements, vol. 1, p.1929.
339. The Macmillan Co., New York, N.Y.,
Sam, Mcpherson^Electrical Properties of Rubber 179
The thickness of each specimen was measured at 19 points, whichwere so distributed as to represent equal areas. A pattern wasemployed as a convenient means for locating the points. To test thereproducibility of the average so obtained, several specimens weremeasured repeatedly with the pattern shifted each time to a newposition. The largest variation found in the average thickness wasabout 1 percent.
The thickness of the rubber in a specimen was found by subtractingthe average thickness of the aluminum electrodes from the over-all
thickness of the specimen. This was done mechanically by offsetting
the zero of the measuring instrument by an amount equal to the thick-
ness of the aluminum plates of the particular specimen under observa-tion.
The thickness of the aluminum plates was ascertained either by theuse of the optical gage desecribed above or by weighing them, measur-ing their diameters and computing the thickness from these data andthe known specific gravity of the aluminum. Measurements on alum-inum plates at different points indicated that they were sufficiently
uniform to justify the use of the simple average thickness.
2. MEASUREMENT OF AREA
The area of the specimen used in the computation of the dielectric
constant and conductivity was obtained by correcting the area of thesmaller electrode for the fringe or edge effect. This correction wasincluded in the equations used to compute these electrical propertiesand is discussed in a subsequent section of this paper.The area of the smaller electrode was computed from the average
diameter, as determined by measurements with a steel scale in differ-
ent directions. The diameters of a given electrode seldom varied bymore than 0.5 mm, and the accuracy with which the area was deter-
mined was about 0.5 percent.
3. CHANGE IN DIMENSIONS WITH TEMPERATURE
The change in area of the electrical test specimen due to thermalexpansion was small and therefore no correction was applied. Takingthe coefficient of expansion of aluminum as 23X10 -6
per °C, thechange in area would be about 1 percent for a temperature change of210° C, which is the largest difference between the temperature of
dimensional measurement and the temperature of electrical measure-ment reported in this investigation. In the majority of measurementsthe change was considerably less than 1 percent.The change in thickness with temperature was, however, of signifi-
cant magnitude, not only because the coefficient of expansion of rub-ber is much greater than that of aluminum, but also because the rub-ber held in a thin sheet between the aluminum plates is free to movein only one direction, so that any contraction or expansion is manifestalmost wholly as a change in thickness, the lateral dimensions chang-ing only as much as the aluminum.To investigate experimentally the change in thickness with tem-
perature, the thickness gage described above was mounted in anelectric oven and measurements were made on representative samplesat several temperatures from 25° to 150° C. The results were foundto be in accord with those computed or extrapolated from the volume
180 Bureau of Standards Journal oj Research [Vol. n
coefficients of expansion reported by Kimura and Namikawa, 8so theselatter coefficients were used as a basis for correcting all determinationsfor change in thickness with temperature. These correctionsamounted in extreme cases to as much as 13 percent.
IV. MOUNTING OF SPECIMENS FOR ELECTRICALMEASUREMENT
The specimens were assembled for the electrical measurements in ameasuring chamber which was provided with a means for connectingto the specimens. Two different measuring chambers were employed,one being used solely at 25° C. and the other at temperatures belowor above 25° C. Several different methods were used for securing andcontrolling the temperature, but the same method of assembling thespecimens and making electrical connections was employed through-out the work.
1. ELECTRICAL CONNECTIONS TO TEST SPECIMENS
The test specimens were assembled by pairs into test units, twospecimens of the same composition being placed with their smallerelectrodes together. Electrical connection was made to the smallerelectrodes by placing between them an aluminum disk which was pro-vided with a slender projection that extended from between the speci-
mens. Connection was made to the larger electrodes by pressingagainst them aluminum disks having projections which extendedbeyond the edges of the specimens. When the larger electrodes weremaintained at earth potential and the smaller, inner electrodes at anelevated potential, the test unit constituted a shielded condenser.In practice as many as 10 of these test units were placed one on top of
another in the constant temperature chamber at one time. Thesmaller electrodes were connected to well-insulated, individual meas-uring leads. The larger electrodes were connected to a common lead.
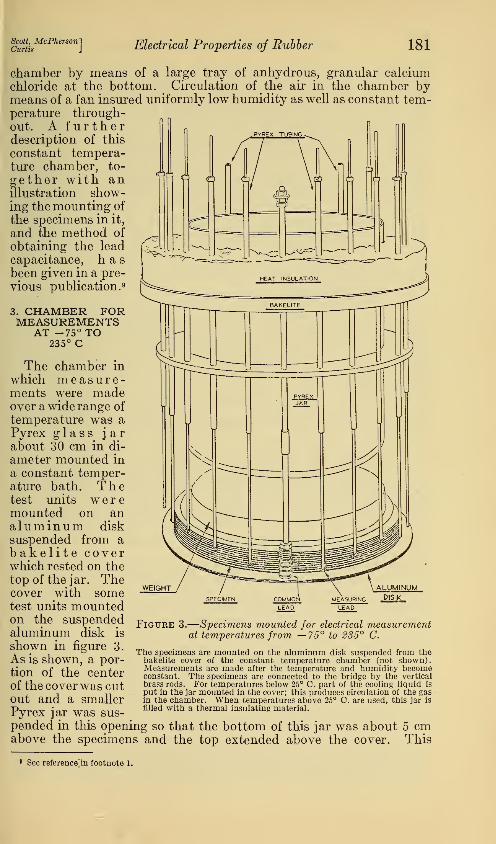
In Figure 3 a stack of test units assembled for electrical measurementsis shown outside the measuring chamber.
In order to insure good electrical contact between the electrodes
and the aluminum disks that were used to establish connection to
the leads, brass filings were sprinkled on the surfaces [and a weightof about 7 kg was placed on the assembly of specimens. Measure-ments indicated that this reduced the contact resistance to less than0.005 ohm. Contact resistances at other connections were reducedby sandpapering or scraping the metal surfaces. The weight placedon the top of the specimens was assumed to have no appreciable effect
on the thickness of the specimens, since application of the weight did
not change the capacitance as measured with 1,000~.
2. CHAMBER FOR MEASUREMENTS AT 25° C
The chamber in which measurements were made at 25° C. was a
large earthenware jar mounted in a thermostatically controlled oil
bath. The test units were placed on a hard rubber disk which wassuspended from a hard rubber cover, the cover being seated on a ledge
inside the jar. Electrical connections to the specimens were estab-
lished by means of brass rods passing through the cover. These wereinsulated by paraffin bushings. The humidity was kept low in the
fSee footnote 4.
Scott, McPherson]Curtis J
Electrical Properties of Rubber 181
chamber by means of a large tray of anhydrous, granular calciumchloride at the bottom. Circulation of the air in the chamber bymeans of a fan insured uniformly low humidity as well as constant tem-perature through-out. A furtherdescription of this
constant tempera-ture chamber, to-
gether with anillustration show-ing the mounting of
the specimens in it,
and the method of
obtaining the lead
capacitance, hasbeen given in a pre-
vious publication. 9
3. CHAMBER FORMEASUREMENTS
AT -75° TO235° C
The chamber in
which measure-ments were madeover a wide range of
temperature was aPyrex glass jarabout 30 cm in di-
ameter mounted in
a constant temper-ature bath. Thetest units weremounted on analuminum disk
suspended from abakelit e coverwhich rested on thetop of the jar. Thecover with sometest units mountedon the suspendedaluminum disk is
shown in figure 3.
As is shown, a por-tion of the centerof the cover was cutout and a smallerPyrex jar was sus-
Figure 3.
—
Specimens mounted for electrical measurementat temperatures from —75° to 285° C.
The specimens are mounted on the aluminum disk suspended from thebakelite cover of the constant temperature chamber (not shown).Measurements are made after the temperature and humidity becomeconstant. The specimens are connected to the bridge by the verticalbrass rods. For temperatures below 25° C. part of the cooling liquid is
put in the jar mounted in the cover; this produces circulation of the gasin the chamber. When temperatures above 25° C. are used, this jar is
filled with a thermal insulating material.
pended in this opening so that the bottom of this jar was about 5 cmabove the specimens and the top extended above the cover. This
9 See reference in footnote 1.
182 Bureau of Standards Journal oj Research [Vol. u
provided a means for stirring the air in the chamber at temperaturesbelow room temperature since a part of the cooling liquid used in thebath could be put in the smaller jar thereby producing convectioncurrents. Pyrex glass tubes were inserted in the cover for the leadrods to pass through in order to furnish better electrical insulation thanwas afforded by the bakelite. A ring of bakelite attached to thesmaller jar about 7 cm below the cover afforded additional support to
the tubes which insulated the leads, and also provided some thermalinsulation for the chamber. No fan was provided for stirring theair in the chamber since the heating and the cooling arrangementswere such that convection could be relied upon to maintain a reason-ably uniform temperature. The temperature at the center of thestack of specimens was determined by means of a thermocouple.This thermocouple was imbedded in an aluminum plate which wasplaced between the test units. Electrical measurements were madewhen the temperature at the center of the assembly was within 0.5° C.of the temperature of the bath.
Low relative humidity in the measuring chamber was insured by theuse of anhydrous calcium chloride as a drying agent, and by thepassage of a slow stream of carbon dioxide from a cylinder into thechamber. The carbon dioxide escaped through the annular spacesbetween the Pyrex glass insulating tubes and the brass rods whichserved as leads and prevented the entrance of air or moisture into
the measuring chamber.Small electric heaters were placed around the Pyrex glass insulat-
ing tubes as an additional precaution against the condensation of
frost on the leads when measurements were being made at lowtemperatures.
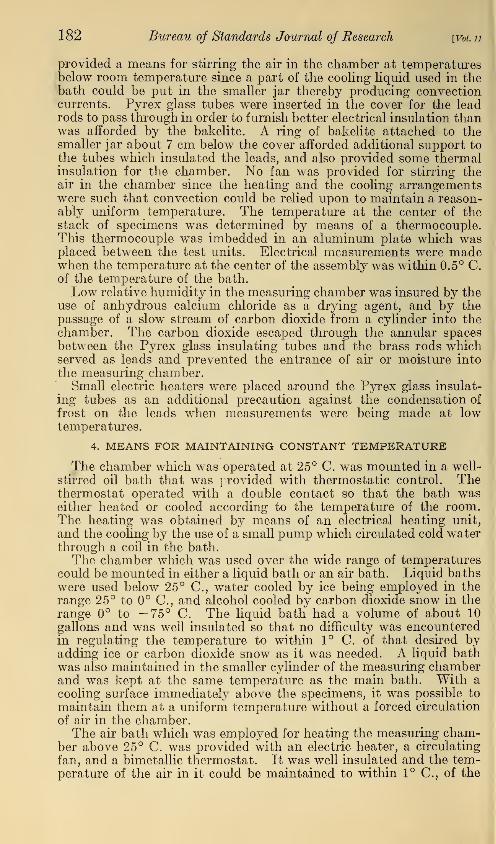
4. MEANS FOR MAINTAINING CONSTANT TEMPERATURE
The chamber which was operated at 25° C. was mounted in a well-
stirred oil bath that was provided with thermostatic control. Thethermostat operated with a double contact so that the bath waseither heated or cooled according to the temperature of the room.The heating was obtained by means of an electrical heating unit,
and the cooling by the use of a small pump which circulated cold waterthrough a coil in the bath.The chamber which was used over the wide range of temperatures
could be mounted in either a liquid bath or an air bath. Liquid bathswere used below 25° C, water cooled by ice being employed in the
range 25° to 0° C, and alcohol cooled by carbon dioxide snow in the
range 0° to —75° C. The liquid bath had a volume of about 10
gallons and was well insulated so that no difficulty was encounteredin regulating the temperature to within 1° C. of that desired byadding ice or carbon dioxide snow as it was needed. A liquid bathwas also maintained in the smaller cylinder of the measuring chamberand was kept at the same temperature as the main bath. With a
cooling surface immediately above the specimens, it was possible to
maintain them at a uniform temperature without a forced circulation
of air in the chamber.The air bath which was employed for heating the measuring cham-
ber above 25° C. was provided with an electric heater, a circulating
fan, and a bimetallic thermostat. It was well insulated and the tem-perature of the air in it could be maintained to within 1° C, of the
sccott,McPherson]
Electrical Properties of Rubber 183
desired temperature. When the measuring chamber was placed in
this air bath, the smaller jar was simply filled with a thermal insulat-
ing material. In this case, the air in the chamber was sufficiently
stirred by convection to maintain the specimens at a uniform tem-perature, since the heat was applied to the bottom and sides.
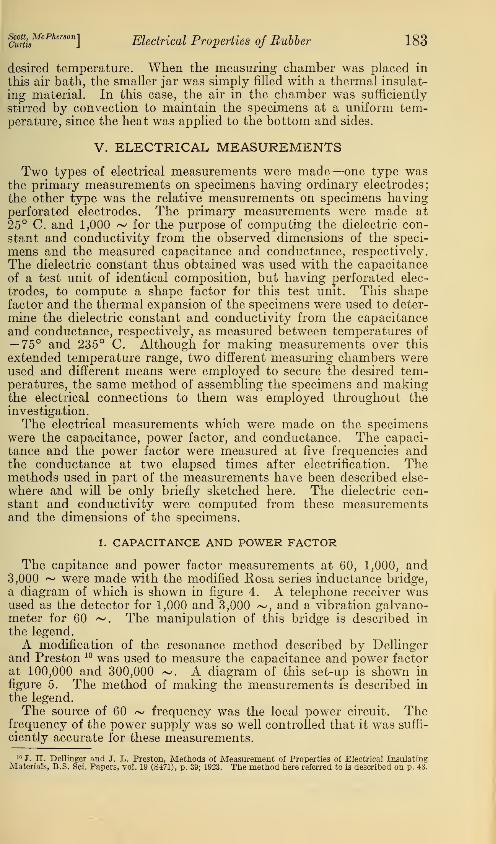
V. ELECTRICAL MEASUREMENTS
Two types of electrical measurements were made—one type wasthe primary measurements on specimens having ordinary electrodes;
the other type was the relative measurements on specimens havingperforated electrodes. The primary measurements were made at25° C. and 1,000 ~ for the purpose of computing the dielectric con-stant and conductivity from the observed dimensions of the speci-
mens and the measured capacitance and conductance, respectively.
The dielectric constant thus obtained was used with the capacitance
of a test unit of identical composition, but having perforated elec-
trodes, to compute a shape factor for this test unit. This shapefactor and the thermal expansion of the specimens were used to deter-
mine the dielectric constant and conductivity from the capacitanceand conductance, respectively, as measured between temperatures of— 75° and 235° C. Although for making measurements over this
extended temperature range, two different measuring chambers wereused and different means were employed to secure the desired tem-peratures, the same method of assembling the specimens and makingthe electrical connections to them was employed throughout theinvestigation.
The electrical measurements which were made on the specimenswere the capacitance, power factor, and conductance. The capaci-
tance and the power factor were measured at five frequencies andthe conductance at two elapsed times after electrification. Themethods used in part of the measurements have been described else-
where and will be only briefly sketched here. The dielectric con-stant and conductivity were computed from these measurementsand the dimensions of the specimens.
1. CAPACITANCE AND POWER FACTOR
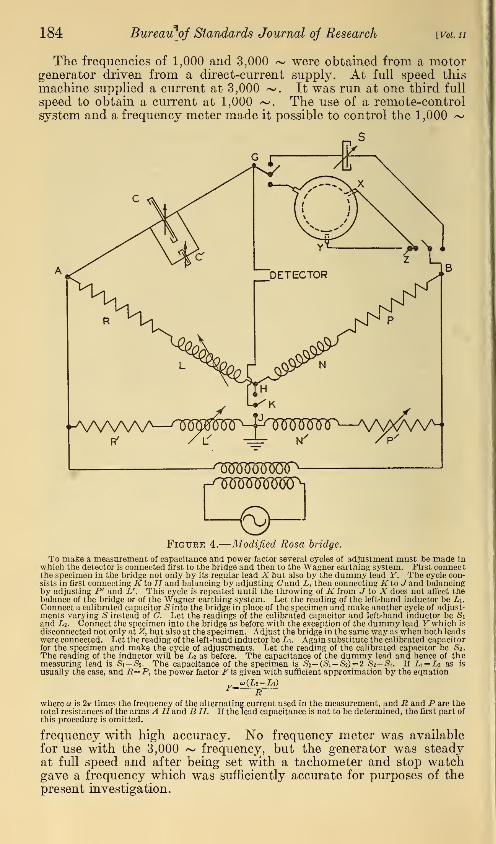
The capitance and power factor measurements at 60, 1,000, and3,000 ~ were made with the modified Rosa series inductance bridge,
a diagram of which is shown in figure 4. A telephone receiver wasused as the detector for 1,000 and 3,000 ~, and a vibration galvano-meter for 60 ~. The manipulation of this bridge is described in
the legend.
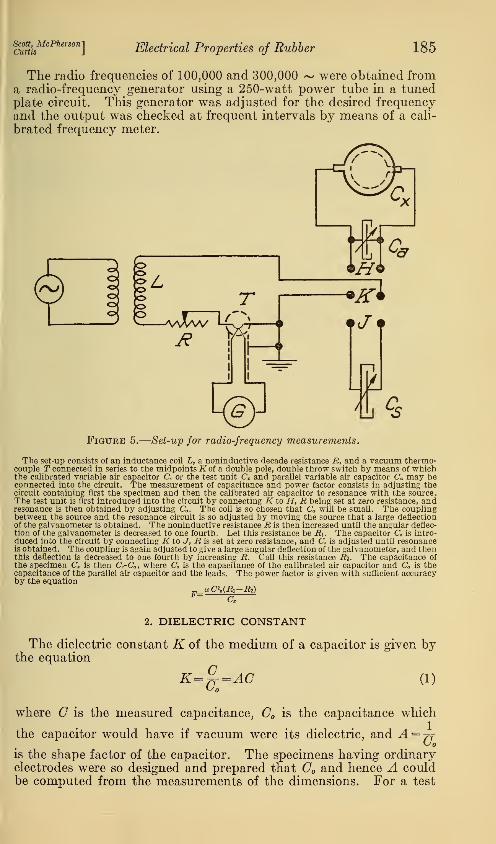
A modification of the resonance method described by Bellingerand Preston 10 was used to measure the capacitance and power factorat 100,000 and 300,000 ~. A diagram of this set-up is shown in
figure 5. The method of making the measurements is described in
the legend.
The source of 60 ~ frequency was the local power circuit. Thefrequency of the power supply was so well controlled that it was suffi-
ciently accurate for these measurements.
10 J. H. Dellinger and J. L. Preston, Methods of Measurement of Properties of Electrical InsulatingMaterials, B.S. Sci. Papers, vol. 19 (S471), p. 39; 1923. The method here referred to is described on p. 43.
184 Bureaurqf Standards Journal oj Research [Vol. 11
The frequencies of 1,000 and 3,000 ~ were obtained from a motorgenerator driven from a direct-current supply. At full speed this
machine supplied a current at 3,000 ~. It was run at one third full
speed to obtain a current at 1,000 ~. The use of a remote-controlsystem and a frequency meter made it possible to control the 1,000 ~
Figure 4.
—
Modified Rosa bridge.
To make a measurement of capacitance and power factor several cycles of adjustment must be made inwhich the detector is connected first to the bridge and then to the Wagner earthing system. First connectthe specimen in the bridge not only by its regular lead X but also by the dummy lead Y. The cycle con-sists in first connecting Kto H and balancing by adjusting Cand L, then connecting Kto J" and balancingby adjusting P' and L'. This cycle is repeated until the throwing of K from J to X does not affect thebalance of the bridge or of the Wagner earthing system. Let the reading of the left-hand inductor be Li.Connect a calibrated capacitor S into the bridge in place of the specimen and make another cycle of adjust-ments varying S instead of C. Let the readings of the calibrated capacitor and left-hand inductor be S\and In. Connect the specimen into the bridge as before with the exception of the dummy lead Y which is
disconnected not only at Z, but also at the specimen. Adjust the bridge in the same way as when both lead s
were connected. Let the reading of the left-hand inductor be L%. Again substitute the calibrated capacitorfor the specimen and make the cycle of adjustments. Let the reading of the calibrated capacitor be St
.
The reading of the inductor will be Li as before. The capacitance of the dummy lead and hence of themeasuring lead is S1—S2. The capacitance of the specimen is S2— (Si— <S2) = 2 S2—S1. If L\=L% as is
usually the case, and R=P, the power factor F is given with sufficient approximation by the equation
u(L2—Li)*= R
where w is 2ir times the frequency of the alternating current used in the measurement, and R and P are thetotal resistances of the arms A H and B H. If the lead capacitance is not to be determined, the first part of
this procedure is omitted.
frequency with high accuracy. No frequency meter was available
for use with the 3,000 ~ frequency, but the generator was steadyat full speed and after being set with a tachometer and stop watchgave a frequency which was sufficiently accurate for purposes of the
present investigation.
Scott, McPherson]Curtis J
Electrical Properties of Rubber 185
The radio frequencies of 100,000 and 300,000 ~ were obtained froma radio-frequency generator using a 250-watt power tube in a tunedplate circuit. This generator was adjusted for the desired frequencyand the output was checked at frequent intervals by means of a cali-
brated frequency meter.
A
Figure 5.
—
Set-up for radio-frequency measurements.
The set-up consists of an inductance coil L, a noninductive decade resistance R, and a vacuum thermo-couple T connected in series to the midpoints Koi a double pole, double throw switch by means of whichthe calibrated variable air capacitor C, or the test unit Cz and parallel variable air capacitor Ca may beconnected into the circuit. The measurement of capacitance and power factor consists in adjusting thecircuit containing first the specimen and then the calibrated air capacitor to resonance with the source.The test unit is first introduced into the circuit by connecting K to H, R being set at zero resistance, andresonance is then obtained by adjusting Ca . The coil is so chosen that Ca will be small. The couplingbetween the source and the resonance circuit is so adjusted by moving the source that a large deflectionof the galvanometer is obtained. The noninductive resistance R is then increased until the angular deflec-tion of the galvanometer is decreased to one fourth. Let this resistance be Ri. The capacitor C, is intro-duced into the circuit by connecting K to J, R is set at zero resistance, and Cs is adjusted until resonanceis obtained. The coupling is again adjusted to give a large angular deflection of the galvanometer, and thenthis deflection is decreased to one fourth by increasing R. Call this resistance R2. The capacitance ofthe specimen Cx is then Cs-Ca , where C, is the capacitance of the calibrated air capacitor and Ca is thecapacitance of the parallel air capacitor and the leads. The power factor is given with sufficient accuracyby the equation
_, o>C*t(Ri-R2)F== cx
2. DIELECTRIC CONSTANT
The dielectric constant K of the medium of a capacitor is given bythe equation
K=^=AC (1)
where C is the measured capacitance, C is the capacitance which
the capacitor would have if vacuum were its dielectric, and A = ^f
is the shape factor of the capacitor. The specimens having ordinaryelectrodes were so designed and prepared that C and hence A couldbe computed from the measurements of the dimensions. For a test
186 Bureau of Standards Journal of Research [Vol. 11
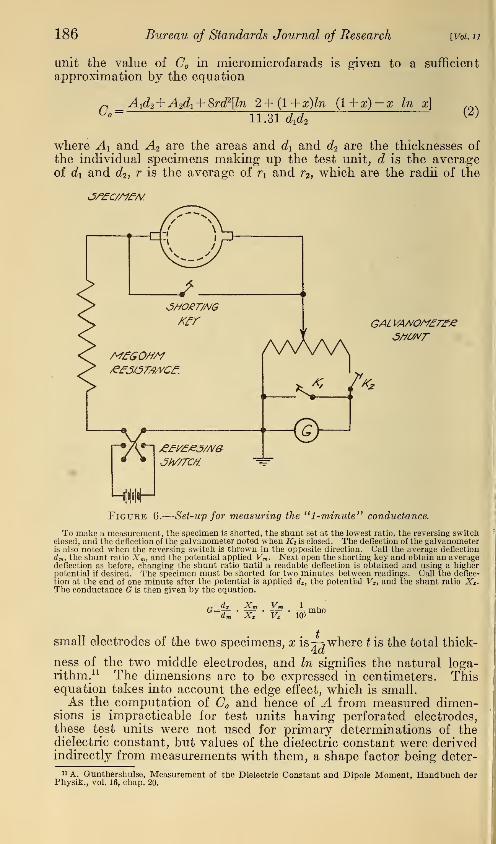
unit the value of C in micromicrofarads is given to a sufficient
approximation by the equation
n _ A 1d2 +A2d1 + 8rd2[ln 2+(l+x)ln (l+ap-s In x]
Lo ~ 11.3144{Z)
where A\ and A2 are the areas and d\ and d2 are the thicknesses of
the individual specimens making up the test unit, d is the averageof d\ and d2 , r is the average of r\ and r2 , which are the radii of the
AAAAAGAL VANO/Y£Tfje
Ki Jh#rc/t.
K/v 4*2
<£>
HUHFigure 6.
—
Set-up for measuring the "1-minute" conductance.
To make a measurement, the specimen is shorted, the shunt set at the lowest ratio, the reversing switchclosed, and the deflection of the galvanometer noted when Ki is closed. The deflection of the galvanometeris also noted when the reversing switch is thrown in the opposite direction. Call the average deflection
dm, the shunt ratio Xm , and the potential applied Vm . Next open the shorting key and obtain an averagedeflection as before, changing the shunt ratio until a readable deflection is obtained and using a higherpotential if desired. The specimen must be shorted for two minutes between readings. Call the deflec-
tion at the end of one minute after the potential is applied dx , the potential Vx , and the shunt ratio Xx .
The conductance G is then given by the equation.
(?=-VmVx 10»
mho
tsmall electrodes of the two specimens, x is jjwhere t is the total thick-
ness of the two middle electrodes, and In signifies the natural loga-rithm. 11 The dimensions are to be expressed in centimeters. Thisequation takes into account the edge effect, which is small.As the computation of C and hence of A from measured dimen-
sions is impracticable for test units having perforated electrodes,these test units were not used for primary determinations of thedielectric constant, but values of the dielectric constant were derivedindirectly from measurements with them, a shape factor being deter-
" A. Gunthershulse, Measurement of the Dielectric Constant and Dipole Moment, Handbuch derPhysik., vol. 16, chap. 20.

curtisMcPherson
]Electrical Properties of Rubber 187
mined for each test unit at 25° C. This shape factor was obtainedfrom measurements of the capacitance of two test units of the samecomposition, one having ordinary electrodes and the other perforatedelectrodes The dielectric constant of the rubber was calculatedfrom the measurements on the test unit having ordinary electrodes.
This value was used in conjunction with the capacitance of the test
unit having perforated electrodes to obtain its shape factor Thetest units having perforated electrodes were used for measurementsover a wide range of temperature and frequency, and the shape fac-
tors, corrected for the thermal expansion of the rubber, were usedfor the calculation of the dielectric constant
3. CONDUCTANCE
The conductance G of a test unit was determined by measuring,with a suitable apparatus, the current which flowed through the
specimen under an applied electromotive force of known value.
Since the value obtained for the conductance depended on the elapsed
time between the application of the electromotive force and the meas-urement of the current, two different time intervals were used in this
investigation— 1 minute, which is the usual time in measurements of
this sort, and a much shorter interval (about 0.002 second). Theset-up for measuring the conductance at the end of 1 minute, whichmay be designated as the "1-minute" conductance, was the same as
that described previously, 12 a self-explanatory diagram of which is
shown in figure 6.
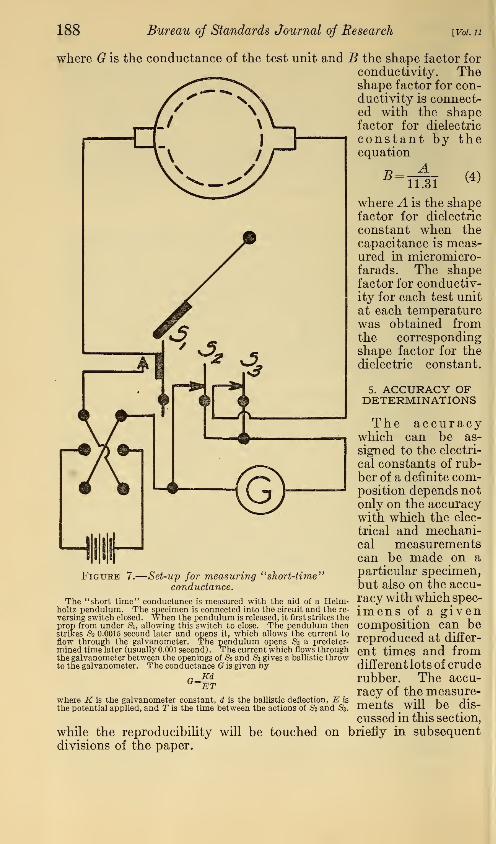
The " short-time" conductance; that is, the conductance obtainedat the end of about 0.002 second, was measured with the aid of aHelmholtz pendulum, as shown diagrammatically in figure 7.
Although the time interval between the actions of S2 and S3 wasusually 0.001 second, in some instances the conductance was so highthat the galvanometer would deflect off the scale when this timeinterval was used, and in other instances the conductance was so lowthat the galvanometer deflection was too small to read. The deflec-
tion was made readable by shortening or lengthening the time interval
between the actions of S2 and Sz , although this affected the results,
since the current was changing with time. For the highest conduct-ance, this time interval was reduced to 0.0005 second, and the valuesobtained were higher than would have been obtained if the usualtime interval had been employed. For the lowest conductances,the time interval was increased to 0.005 second which made theresults lower than they would have been had the usual time beenemployed. However, the results are usable since high accuracycannot be obtained in such measurements. All the " short-time"conductivity measurements are tabulated as though they weremeasured at 0.002 second after the potential was applied.
4. CONDUCTIVITY
The conductivity y of the material of a test unit was obtained bymeans of the equation
y = BG (3)
12 H. L. Curtis and A. T. McPherson, Dielectric Constant, Power Factor, and Resistivity of Rubberand Gutta-Percha, B.S.Tech. Papers, vol. 19, p. 669. The set-up here referred to is described on p. 678.
188 Bureau of Standards Journal of Research [Vol. 11
where G is the conductance of the test unit and B the shape factor for
conductivity. Theshape factor for con-ductivity is connect-ed with the shapefactor for dielectric
constant by theequation
where A is the shapefactor for dielectric
constant when thecapacitance is meas-ured in micromicro-farads. The shapefactor for conductiv-ity for each test unit
at each temperaturewas obtained fromthe correspondingshape factor for thedielectric constant.
5. ACCURACY OFDETERMINATIONS
The accuracywhich can be as-
signed to the electri-
cal constants of rub-ber of a definite com-position depends notonly on the accuracywith which the elec-
trical and mechani-cal measurementscan be made on aparticular specimen,but also on the accu-
racy with which speoimens of a givencomposition can bereproduced at differ-
ent times and fromdifferent lots of cruderubber. The accu-racy of the measure-ments will be dis-
cussed in this section,
briefly in subsequent
Figure 7 -Set-up for measuringconductance.
short-time"
The "short time" conductance is measured with the aid of a Helm-holtz pendulum. The specimen is connected into the circuit and the re-
versing switch closed. When the pendulum is released, it first strikes theprop from under Si, aUowing this switch to close. The pendulum thenstrikes S2 0.0015 second later and opens it, which allows the current to
flow through the galvanometer. The pendulum opens S3 a predeter-mined time later (usually 0.001 second) . The current which flows throughthe galvanometer between the openings of S2 and S3 gives a ballistic throwto the galvanometer. The conductance G is given by
r Kd
where K is the galvanometer constant, d is the ballistic deflection, E is
the potential applied, and T is the time between the actions of £2 and S3.
while the reproducibility
divisions of the paper.will be touched on
cuLMcPherson
]Electrical Properties oj Rubber 189
(a) EFFECT OF ERRORS IN DIMENSIONAL MEASUREMENTS
As already stated, the probable errors involved in the dimensionalmeasurements are of the order of 1 or 2 percent. These impose thechief limitation on the accuracy of the dielectric constant measure-ment. Conductance measurements, on the other hand, are subjectto errors, common to this type of measurement, of such magnitudethat the accuracy of dimensional measurements is of relatively smallimportance. Power factor determinations are, of course, independentof the dimensions of the specimens.
(b) POSSIBLE SOURCES OF ERROR IN ELECTRICAL CONNECTIONS ANDMEASUREMENTS
In the measurement of capacitance care was taken to make thebridge errors as small as possible. The substitution method wasused to eliminate from the measurements the capacitance betweenpieces of apparatus and between apparatus and ground. The errors
in the bridge itself were considered to be negligible in comparison withother errors in the determination of dielectric constant.
It was necessary to make a correction for the capacitance of theleads which extended from the test unit to the outside of the constanttemperature bath. The lead capacitance was not determined eachtime, but the average of a large number of determinations was takenas the capacitance of each lead. This average value did not differ
from the measured value in any case by more than 5juAif whichcorresponds to a maximum error of 0.4 percent in the determinationof the capacitance of a test unit. The method of determining thelead capacitance is described in the legend under figure 4.
A possible source of error in the determination of the capacitance of
a test unit resided in the fact that the individual members of the test
unit did not necessarily have their small electrodes precisely in juxta-position. But from the procedure used in assembling a test unit, it is
unlikely that the centers of the small electrodes were out of line by asmuch as 1 mm. An eccentricity of this amount would give a maxi-mum error of 0.3 percent. As a matter of fact when several test unitswere repeatedly taken apart, reassembled, and remeasured, themaximum variation in the capacitance which was observed was nevergreater than 0.2 percent.
Contact resistances in the circuit were a potential source of errorin the capacitance and power factor measurements. At the lowerfrequencies the errors due to any such resistances as may have beenpresent were negligible, but at radio frequencies it was necessary to
take special precautions to see that these resistances were so small thatthey did not cause any appreciable error. For these frequencies, all
the metal parts were scraped before connections were made, and metalfilings were put between each electrode and its connecting plate.
No guard rings were used in making any of the measurements, butit was unlikely that any significant errors arose from their omissionbecause the specimens were kept in an atmosphere of low relative
humidity while being measured.
(c) INDEPENDENT DETERMINATION OF DIELECTRIC CONSTANT
A check was made on the determination of the dielectric constantof a few compounds at 25° C. by using an entirely different methodfor ascertaining it. The method consisted in measuring the dielectric
190 Bureau of Standards Journal of Research [Vol. u
constant by means of a parallel plate capacitor with a guard ring.
Care was taken to have the guard ring at all times as near the potentialof the guarded plate as possible. Measurements were made on asheet of rubber prepared from the same batch as a pair of specimenswhich constituted a test unit. The sheet of rubber was placedbetween the parallel plates of the capacitor and an air gap was left
between the sheet and the upper plate. The bridge containing this
capacitor was then balanced. The rubber sheet was removed frombetween the plates and the bridge was again brought to balance bychanging the distance between the plates. The change in distancebetween the plates was determined by making readings on an en-
graved scale with a telescope and micrometer eyepiece. The dielectric
constant was then obtained from the equation
K^t-(d'-d") (5)
where t is the thickness of the sheet of rubber and (d' — d") is thechange in distance between the plates. Values of the dielectric
constant obtained by this method agreed to within 2 percent withthose obtained by the other method.
(d) EFFECT OF THE CONDITION OF ELECTRODE SURFACES
• Some experiments were made to determine whether or not thecondition of the electrode surfaces had any appreciable effect on the
measured values of the capacitance and power factor. Such an effect
has been reported for aluminum electrodes. 13 Several specimens weremade up with aluminum electrodes which had been anodized (oxy-
dized) like those used in that work. No appreciable difference wasfound between the values of the dielectric constant and power factor
obtained with such electrodes and those obtained with ordinaryelectrodes.
VI. VALUES OF ELECTRICAL PROPERTIES
The measurements on rubber-sulphur compounds which are herereported show the effect of composition, temperature, and frequencyon the electrical properties. From an experimental standpoint theresults fall into two general groups. In the first group are themeasurements at 25° C. on specimens having ordinary electrodes.
In the second group are the determinations which were made overa range of temperatures and frequencies on specimens having per-
forated electrodes. The second group of measurements are dependenton the first since a shape factor was obtained from capacitance deter-
minations on specimens of identical composition having the two typesof electrodes.
There is a further difference between the two groups of measure-ments in that the values reported for the electrical properties in thefirst group represent, in most cases, averages of several determina-tions, while those reported in the second group represent single
determinations.
13 H. J. Curtis, The Dielectric Constant of Liquid Sulphur, J. Chem. Phys., vol. 1, p. 160; February1933. Curtis obtained temperature curves of dielectric constant and power factor similar to those whichwere obtained for rubber, but the values were not the same on different runs. When the aluminum elec-
trodes were anodized, quite different curves were obtained which could be readily reproduced.

Scott, McPherson'Curtis Electrical Properties of Rubber 191
The primary measurements, which constitute the first group of
results, were made at a single temperature, 25° C, and at a single
frequency, 1,000~, and consequently these data can be summed up in
one table or figure. The comparative measurements, however, weremade at a number of temperatures and at several frequencies. Toexpress these results concisely, tables and figures are given showingthe relation of the electrical properties to two simultaneous vari-
ables—composition and temperature. The effect of the third vari-
able, frequency, is shown by giving separate tables and figures for
each frequency.
1. ELECTRICAL PROPERTIES AT 25° C
Electrical measurements at 25° C. were made on compounds of
purified rubber and sulphur covering the range from unvulcanizedrubber to completely vulcanized hard rubber. Twenty-two different
/Z J6 ZO 24
Figure 8.
—
Relation of the dielectric constant, power factor, and "1-minute" con-ductivity of rubber-sulphur compounds to the percent of sulphur.
The power factor is given in units of 1XHH and the "1-minute" conductivity in units of 1XHH 7
mho/cm.
compositions were employed, these being spaced at intervals of 0.5 to
2.0 percent sulphur so as to precisely define the changes in electrical
properties with composition. From 1 to 16 different test units orpairs of specimens of each composition were prepared and measured,the average number being 7. Dielectric constant and power factormeasurements were made at 1,000~ and the conductance measure-ments were made 1 minute after the application of potential to thespecimen.The results are summarized in table 1 and are shown graphically in
figure 8, in which the three electrical properties are plotted as functionsof the composition expressed as percent of sulphur. Each of theproperties has characteristic features, but it should be noted that eachhas a maximum at some composition.
(a) DIELECTRIC CONSTANT
The dielectric constant of unvulcanized rubber was found to be 2.37.
With increasing sulphur content the dielectric constant increasedalmost linearly to a maximum of about 3.75 in the neighborhood of
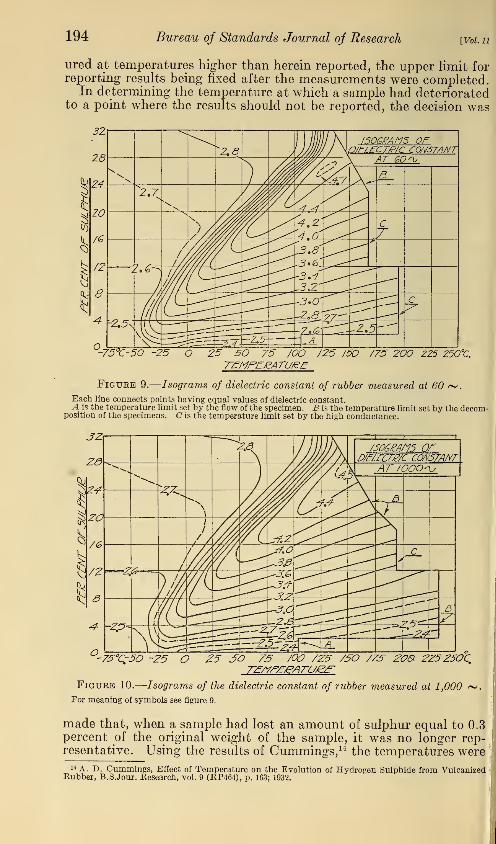
192 Bureau of Standards Journal of Research [Vol. 11
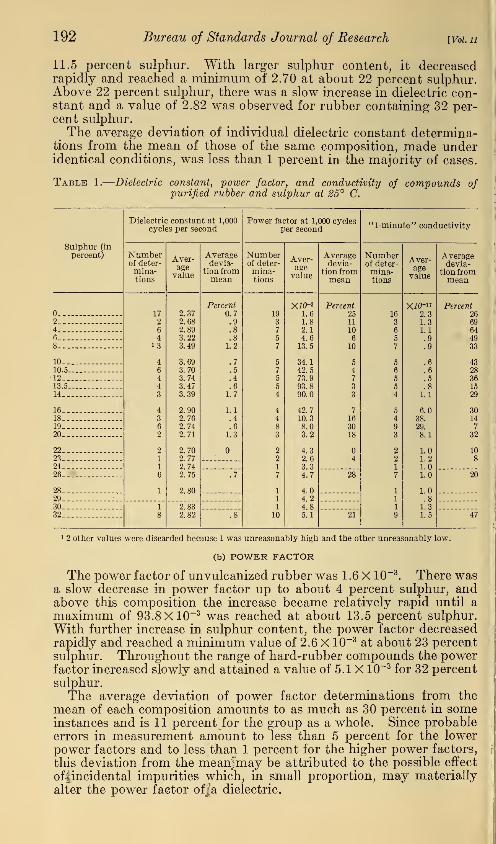
11.5 percent sulphur. With larger sulphur content, it decreasedrapidly and reached a minimum of 2.70 at about 22 percent sulphur.Above 22 percent sulphur, there was a slow increase in dielectric con-stant and a value of 2.82 was observed for rubber containing 32 per-cent sulphur.The average deviation of individual dielectric constant determina-
tions from the mean of those of the same composition, made underidentical conditions, was less than 1 percent in the majority of cases.
Table 1.
—
Dielectric constant, power factor, and conductivity of compounds ofpurified rubber and sulphur at 25° C.
Dielectric constant at 1,000cycles per second
Power factor at 1,000 cyclesper second "1-minute" conductivity
Sulphur (in
percent) Numberof deter-mina-tions
Aver-agevalue
Averagedevia-
tion frommean
Numberof deter-mina-tions
Aver-agevalue
Averagedevia-
tion frommean
Numberof deter-mina-tions
Aver-agevalue
Averagedevia-
tion frommean
17
26
413
46443
4362
21
1
6
1
2.372.682.893.223.49
3^703.743.473.39
2.902.762.742.71
2.702.772.742.75
2.80
Percent0.7.9.8.8
1.2
.7
.5
.4
.61.7
1.1
.4
.61.3
19
3
7
5
7
5
7
5
5
4
4483
2
2
1
7
1
1
1
10
XlO-s1.61.82.14.613.5
34.142.573.993.890.0
42.710.38.03.2
4.32.63.34.7
4.04.24.85.1
Percent2511
106
10
54
7
3
3
716
3018
4
16
3
6
5
7
5
6
5
54
5
49
3
2
21
7
1
1
1
9
xio-"2.31.31.1
.9
.9
.6
.6
.5
.81.1
6.038.
29.
8.1
1.01.21.01.0
1.0.81.31.5
Percent26
2 694 646 498 33
10 4310.5 2812... 3613.5 1514 29
16 3018 1419 720 32
22 . 1023 824_26 .7 28 20
2829 :_.
30 1
8
2.832.8232 .8 21 47
1 2 other values were discarded because 1 was unreasonably high and the other unreasonably low.
(b) POWER FACTOR
The power factor of unvulcanized rubber was 1 .6 X 10~3. There was
a slow decrease in power factor up to about 4 percent sulphur, andabove this composition the increase became relatively rapid until a
maximum of 93.8 X10~3 was reached at about 13.5 percent sulphur.
With further increase in sulphur content, the power factor decreasedrapidly and reached a minimum value of 2.6 X 10~3 at about 23 percentsulphur. Throughout the range of hard-rubber compounds the powerfactor increased slowly and attained a value of 5.1 X 10~3 for 32 percentsulphur.
The average deviation of power factor determinations from the
mean of each composition amounts to as much as 30 percent in someinstances and is 11 percent for the group as a whole. Since probableerrors in measurement amount to less than 5 percent for the lowerpower factors and to less than 1 percent for the higher power factors,
this deviation from the meanfmay be attributed to the possible effect
ofiincidental impurities which, in small proportion, may materially
alter the power factor offa dielectric.
sco^McPherson]Electrical Properties of Rubber 193
(c) CONDUCTIVITY
The curve relating " 1-minute" conductivity to composition is
similar to the curve for the power factor in that both show similar
sharp and high maxima. The conductivity of unvulcanized rubberis 2.3 X 10~ 17 mho/cm. This decreases with increasing sulphur con-
tent and reaches a minimum value of 0.5 X 10~ 17 at about 12 percentsulphur. Above this minimum a sharp increase takes place and at
18 percent sulphur there is a maximum conductivity of 38X10-17.
Beyond the maximum there is an equally sharp decrease so that at
22 percent sulphur the conductivity is only 1 X 10~ 17. Above this
point, throughout the hard-rubber range, the conductivity increases
very slightly.
The variation in conductivity between individual samples of thesame composition is considerable, as would be expected from thenature of the results that are obtained in conductivity measurementson dielectrics in general. This variation is as much as 70 percent in
one instance, and is, on the average, 31 percent. A negligible partof this variation is doubtless attendant on circumstances having to
do with the dimensional or electrical determinations, but most of it
is probably due to slight accidental variations in the composition of
the rubber.
2. MEASUREMENTS AT -75° TO 235° C
The measurements which were carried out to determine the effect
of temperature and frequency on the electrical properties covered therange from —75° to 235° C. at intervals of about 10° and were madeat five frequencies, namely, 60, 1,000, 3,000, 100,000, and 300,000~.The conductivity was measured at two time intervals after the appli-
cation of potential, namely, 0.002 second and 1 minute. The com-positions on which the measurements were made covered the rangeof possible rubber-sulphur compounds at slightly wider intervals thanthe previous series of measurements at 25° C., there being 14 insteadof 22 different percentages of sulphur. As has been indicated pre-
viously, these specimens were all made with perforated aluminumsheets as electrodes, and, instead of measuring the thickness and area,
a shape factor was determined and was used in computing the dielec-
tric constant and conductivity values.
For specimens containing not over 12 percent of sulphur, the test
units used above 25° C. were not the same as those used below25° C, but for higher percentages of sulphur each test unit was usedthroughout the entire range of temperature.Only a single pair of specimens constituting a single test unit of
each composition was used, but the consistency of the change in
electrical properties with temperature and frequency affords a rea-
sonable indication that there were no large experimental errors.
Measurements are here reported for temperatures between —75° C.and the highest temperature at which accurate measurements couldbe made. The lower limit was fixed by the lowest temperature whichcould be readily maintained with carbon dioxide snow. The upperlimit was different for different samples, depending either on thedecomposition of the sample during the time the observations werein progress, on its change in shape because the sample began to flow,
or on its increase in conductivity. The samples were generally meas-205—33 3
194 Bureau of Standards Journal of Research [Vol. u
ured at temperatures higher than herein reported, the upper limit forreporting results being fixed after the measurements were completed.
In determining the temperature at which a sample had deterioratedto a point where the results should not be reported, the decision was
-75X-50 -25 O 25 50 75 /OO /25 I50 /7S 200 ZZ5 Z50°C.
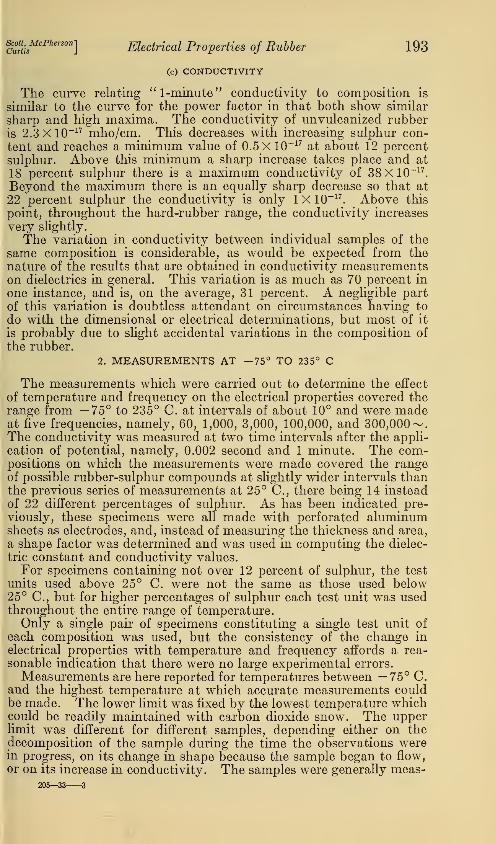
Figure 9.
—
Isograms of dielectric constant of rubber measured at 60 ~.Each line connects points having equal values of dielectric constant.A is the temperature limit set by the flow of the specimen. B is the temperature limit set by the decom-
position of the specimens. C is the temperature limit set by the high conductance.
JZ
-75°Cr50 -25 O 25 SO 75 /OO 725 7SO 775 200 ZZ5 Z5QC.
Figure 10.
—
Isograms of the dielectric constant of rubber measured at 1,000 ~.For meaning of symbols see figure 9.
made that, when a sample had lost an amount of sulphur equal to 0.3percent of the original weight of the sample, it was no longer rep-resentative. Using the results of Cummings, 14 the temperatures were
14 A. D. Cummings, Effect of Temperature on the Evolution of Hydrogen Sulphide from VulcanizedRubber, B.SJour. Research, vol. 9 (RP464), p. 163; 1932.

Scott, McPhersonlCurtis J
Electrical Properties of Rubber 195
determined at which the samples of each composition would lose
this amount of sulphur under the conditions at which the electrical
measurements were made; namely, increasing the temperature in
steps of 10° or 20° and maintaining the specimens at each tempera-
3Z
75Q-50 -Z5 O Z5 50 75 /OO /Z5 /50 775 ZOO ZZ5Z50C.
Figure 11.
—
Isograms of the dielectric constant of rubber measured at 100,000 ~.For meaning of symbols see figure 9.
ture for 8 hours. A change in shape caused by the flowing of thematerial of the sample affected only the one having percent
-75VC~50 -25 O 25 50 75 /OO /Z5 /50 /75 200 225250C.
Figure 12.
—
Isograms of dielectric constant of rubber measured at 300,000 ~.For meaning of symbols see figure 9.
sulphur. It is known that such material flows readily at temperaturesabove 105° C. A temperature limit was imposed by the increase inthe conductivity of certain samples because neither it nor its accom-panying power factor could be measured without a redesign of the
196 Bureau oj Standards Journal of Research [Vol. u
apparatus, which did not seem to be necessar}^ The figures showwhich one of these causes decided the upper limit.
The effect of the temperature on the relation between electrical
properties and the composition is shown by the use of contour chartsin which temperature and composition are abscissa and ordinate,
respectively, while the electrical properties are represented byisograms which may be visualized as the contour lines of a solid model.The subsequent discussion will refer to the charts as representationsof such models. While the model for each property has distinctive
features, they have one feature in common, namely, a prominentdiagonal ridge in which each property goes through a maximum.
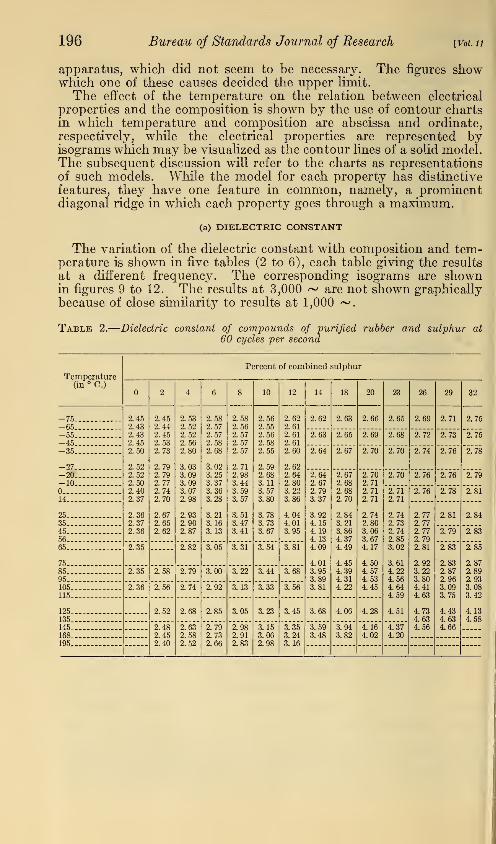
(a) DIELECTRIC CONSTANT
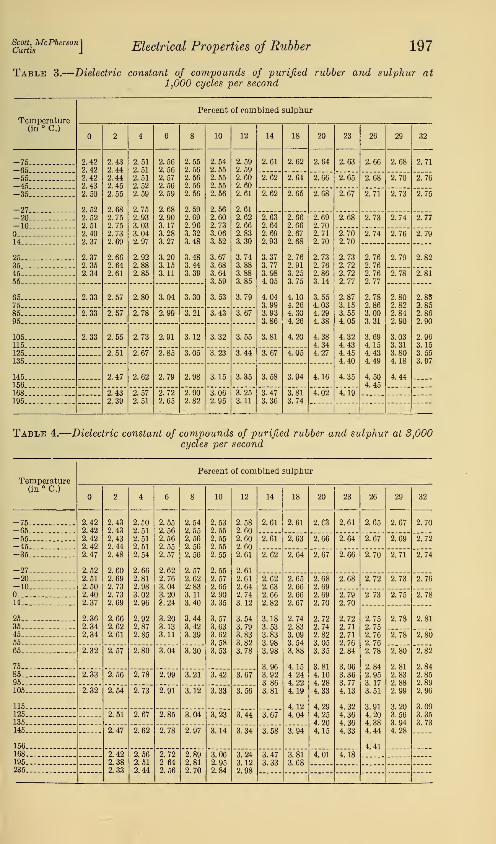
The variation of the dielectric constant with composition and tem-perature is shown in five tables (2 to 6), each table giving the results
at a different frequency. The corresponding isograms are shownin figures 9 to 12. The results at 3,000 ~ are not shown graphicallybecause of close simiiarit}7 to results at 1,000 ~.
Table 2.
—
Dielectric constant of compounds of purified rubber and sulphur at
60 cycles per second
TemperaturePercent of combined sulphur
(in ° C.)2 4 6 8 10 12 14 18 20 23 26 29 32
-75-65
2.452.432.432.452.50
2.522.522.502.402.37
2.362.372.36
2.452.442.452.532.73
2.792.792.772.742.70
2.672.652.62
2.532.522.522.562.80
3.033.093.093.072.98
2.932.902.87
2.582.572.572.582.68
3.023.253.373.363.28
3.213.163.13
2.582.562.572.572.57
2.712.983.443.593.57
3.513.473.41
2.562.552.562.582.55
2.592.683.113.573.80
3.783.733.67
2.622.612.612.612.60
2.622.642.803.223.86
4.044.013.95
2.62 2.63 2.66 2.65 2.69 2.71 2.75
-55 „ 2.63 2.65 2.69 2.68 2.72 2.73 2.75-45 .
—35 .. 2.64 2.67 2.70 2.70 2.74 2.76 2.78
-27-20— 2.64
2.672.793.37
3.924.154.194.134.09
4.013.953.893.81
2.672.682.682.70
2.843.213.864.374.49
4.454.394.314.22
2.702.712.712.71
2.742.803.063.674.17
4.504.574.534.45
2.70 2.76 2.76 2.79-10—.
2.712.71
2.742.732.742.853.02
3.614.224.564.644.59
4.51
2.76 2.78 2.8114 ._
25. 2.772.772.772.792.81
2.923.223.804.414.63
4.734.634.56
2.81 2.843545 2.79 2.835665
75.
2.35 2.82 3.05 3.31 3.54 3.81 2.83
2.832.872.963.093.75
4.434.634.66
2.85
2.8785 2.35 2.58 2.79 3.00 3.22 3.44 3.68 2.8995— 2.93105.115. -
2.36 2.56 2.74 2.92 3.13 3.33 3.56 3.083.42
125 —135 —
2.52 2.68 2.85 3.05 3.23 3.45 3.68 4.06 4.28 4.134.58
145.168
2.482.452.40
2.632.582.52
2.792.732.66
2.982.912.83
3.153.062.98
3.353.243.16
3.593.48
3.943.82
4.164.02
4.374.20
195
Scott, McPhersonlCurtis J
Electrical Properties of Rubber 197
Table 3.
—
Dielectric constant of compounds of purified rubber and sulphur at
1,000 cycles per second
TemperaturePercent of combined sulphur
(in ° 0.)2 4 6 8 10 12 14 18 20 23 26 29 32
-75—65
2.422.422.422.432.50
2.522.522.512.402.37
2.372.352.34
2.432.442.442.452.55
2.682.752.752.732.69
2.662.642.61
2.512.512.512.522.59
2.752.933.033.042.97
2.922.882.85
2.562.562.572.562.59
2.682.903.173.283.27
3.203.153.11
2.552.562.562.562.56
2.592.692.963.323.48
3.483.443.39
2.542.552.552.552.56
2.562.602.733.063.52
3.673.683.643.59
3.53
2.592.592.602.602.61
2.612.622.662.833.30
3.743.883.883.85
3.79
2.61 2.62 2.64 2.63 2.66 2.68 2.71
-55—45
2.62 2.64 2.66 2.65 2.68 2.70 2.76
-35 2.62 2.65 2.68 2.67 2.71 2.73 2,75
-27.-20 2.63
2.64
2^93
3.373.773.984.05
4.043.993.933.86
3.81
2.662.662.672.68
2.762.913.253.75
4.104.264.304.26
4.20
2.692.702.712.70
2.732.762.863.14
3.554.034.294.38
4.384.344.27
2.68 2.73 2.74 2.77— 10
14"2.702.70
2.732.722.722.77
2.873.153.554.05
4.324.434.454.40
4.35
2.74 2.76 2.79
25 2.762.762.762.77
2.782.863.003.31
4154.434.49
4.504.45
2.79
~2.~78~
2.823545 "2.81
55—
65 2.33 2.57 2.80 3.04 3.30 2.802.822.842.90
3.033.313.804.18
4.44
2.8575 2.858595„
2.33 2.57 2.78 2.99 3.21 3.43 3.67 2.862.90
105 2.33 2.55 2.73 2.91 3.12 3.32 3.55 2.96115 3.15125135 .
2.51 2.67 2.85 3.05 3.23 3.44 3.67 4.05 3.553.97
145 2.47 2.62 2.79 2.98 3.15 3.35 3.58 3.94 4.16156168 - 2.43
2.392.572.51
2.722.65
2.902.82
3.062.95
3.253.11
3.473.36
3.813.74
4.02 4.19195 —
I
Table 4.
—
Dielectric constant of compounds of purified rubber and sulphur at 3,000cycles per second
TemperaturePercent of combined sulphur
(in ° C.)2 4 6 8 10 12 14 18 20 23 26 29 32
-75 2.422.422.422.422.47
2.522.512.502.402.37
2.362.342,34
2.432.432.432.442.48
2.602.692.732.732.69
2.662.622.61
2.502.512.512.512.54
2.662.812.983.022.96
2.922.872.85
2.552.562.562.552.57
2.622.763.043.203.24
3.203.133.11
2.542.552.562.562.56
2.572.622:833.113.40
3.443.423.39
2.532.552.552.552.55
2.552.572.652.903.35
3.573.633.623.583.53
2.582.602.602.602.61
2.612.612.642.743.12
3.543.793.833.823.78
2.61 2.61 2.63 2.61 2.65 2.67 2.70—65—55 2.61 2.63 2.66 2.64 2.67 2.69 2.72—45—35 2.62 2.64 2.67 2.66 2.70 2.71 2.74
-27-20 2.62
2.632.662.82
3.]83.533.833.983.98
3.963.923.863.81
2.652.662.662.67
2.742.833.093.543.88
4.154.244.224.19
4.124.04
2.682.692.692.70
2.722.742.823.053.35
3.814.104.284.33
4.294.254.204.15
2.68 2.72 2.73 2.76-10
14-1--— .'."'.2.792.70
2.722.712.712.762.84
3.063.363.774.13
4.324.364.364.33
2 73 2.75 2.78
25354555
2.752.752.762.762.78
2.842.953.173.51
3.914.204.384.44
4.41
2.78
~2.~78~
2.81
~2.~80
65
75
2.32 2.57 2.80 3.04 3.30 2.80
2.812.832.882.99
3.203.563.944.28
2.82
2.8485 2.33 2.56 2.78 2.99 3.21 3.42 3.67 2.8595 2.89105-— 2.32 2.54 2.73 2.91 3.12 3.33 3.56 2 96
115 3.09125135
2.51 2.67 2.85 3.04 3.23 3.44 3.67 3.353.73
145 2.47 2.62 2.78 2.97 3.14 3.34 3.58 3.94
156168 2.42
2.382.33
2.562.512.44
2.722 642.56
2.892.812.70
3.062.952.84
3.243.122.98
3.473.33
3.813.68
4.01 4.18195235
198 Bureau of Standards Journal oj Research [Vol. 11
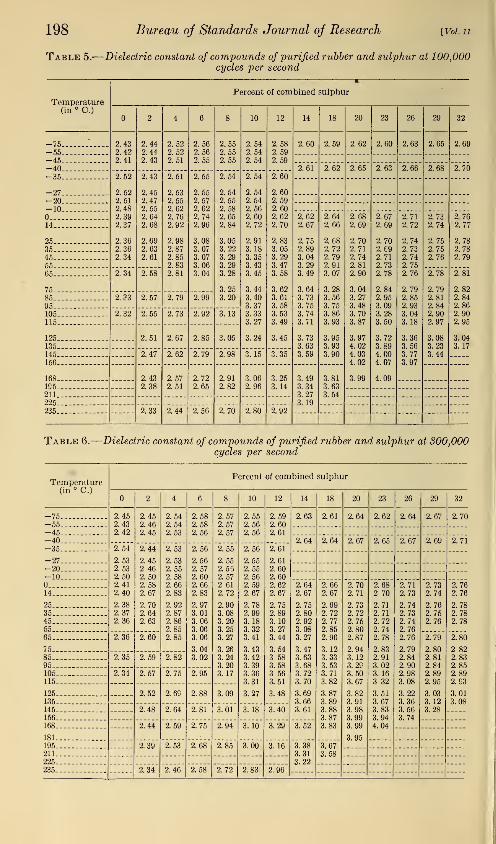
Table 5.
—
Dielectric constant of compounds of purified rubber and sulphur at 100,000cycles per second
Temperature
*
Percent of combined sulphur
(in ° C.)2 4 6 8 10 12 14 18 20 23 26 29 32
-75. .'
—552.432.422.41
2.442.442.43
2.522.522.51
2.562.562.55
2.552.552.55
2.542.542.54
2.582.592.59
2.60 2.59 2.62 2.60 2.63 2.65 2.69
—45-40 . 2.61 2.62 2.65 2.63 2.66 2.68 2.70-35 2.52
2.522.512.482.392.37
2.362.362.34
2.43
2.452.472.552.642.68
2.692.632.61
2.51
2.532.552.622.762.92
2.982.872.852.832.81
2.55
2.552.572.622.742.96
3.083.073.073.063.04
2.54
2.542.552.582.652.84
3.053.223.293.293.28
3.253.20
2.54
2.542.542.562.602.72
2.913.183.353.433.45
3.443.403.373.333.27
3.24
2.60
2.602.592.602.622.70
2.833.053.293.473.58
3.623.613.583.533.49
3.45
—27—20— 10
2.622.67
2.752.893.043.293.49
3.643.733.753.743.71
3.733.63
2.642.66
2.682.722.792.913.07
3.283.563.753.863.93
3.953.933.90
2.682.69
2.702.712.742.812.90
3.043.273.483.703.87
3.974.024.034.02
3.99
2.672.69
2.702.692.712.732.78
2.842.953.093.283.50
3.723.894.004.07
4.09
2.712.72
2.742.73,2.742.752.76
2.792.852.933.043.18
3.363.563.773.97
2.732.74
2.752.752.76
2 76
14
25
2.77
2.783545 ..
2.782.79
5565 2.34 2.58 2.78
2.792.812.842.902.97
3.083.233.44
? 81
75 2.8285 2.33 2.57 2.79 2.99 2.8495 2.86105 2.32 2.55 2.73 2.92 3.13 2.90115 2.95
125135
2.51 2.67 2.85 3.05 3.043.17
145156
2.47 2.62 2.79 2.98 3.15 3.35
168 2.432.38
2.572.51
2.722.65
2.912.82
3.062.96
3.253.14
3.493.343.273.19
3.813.633.54
195211225235 2.33 2.44 2.56 2.70 2.80 2.92
Table 6.
—
Dielectric constant of compounds of purified rubber and sulphur at 300,000cycles per second
Temperature(in ° C.)
Percent of combined sulphur
2 4 6 8 10 12 14 18 20 23 26 29 32
-75 2.452.432.42
2.452.462.45
2.542.542.53
2.582.582.56
2.572.572.57
2.552.562.56
2.592.602.61
2.63 2.61 2.64 2.62 2.64 2.67 2.70-55-45-40.. 2.64 2.64 2.67 2.65 2.67 2.69 2.71-35-- 2.54
2.532.532.502.412.40
2.382.372.36
2.44
2.452 462.502.582.67
2.702.642.63
2.53
2.532.552.582.662.83
2.922.872.862.852.85
2.56
2.562.572.602.662.83
2.973.013.063.063.06
3.043.02
2.55
2.552.552.572 61
2.72
2.903.083.203.253.27
3.263.243.203.17
2.56
2.552.552.562.592.67
2.782.993.183.323.41
3.433.423.393.363.31
3.27
2.61
2.612.602.602.622.67
2.752.893.103.273.44
3.543 583.583 563.51
3.48
-27-20-10.
2.642.67
2.752.802.923.083.27
3.473.633.683.723.70
3.693.663.61
2.662.67
2.692.722.772.852.96
3.123.333.533.713.82
3.873.893.883.873.83
2.702.71
2.732.722.752.802.87
2.943.123.293.503.67
3.823.913.983.993.99
3.95
2.682 70
2.71
2.712.722.742.78
2.832.913.023.163 32
3.513.673.833.944.04
2.712.73
2.742.732.742.762.76
2.792.842.902.983.08
3.223.363.563.74
2.732.74
2.762.752.76
2.7614
2535
2.76
2.782.78
4555 .
2.78
65
75
2.36 2.60 2.79
2.802.812.842.892.95
3.033.123.28
2.80
2 8285 2.35 2.59 2.82 2.8395 2.85105.- 2.34 2.57 2.75 2.95 2.89115... 2.93
125
1352.52 2. 69 2.88 3.09 3.01
3.08145156
2.48 2.64 2.81 3.61 3.18 3.40
168 2.44 2.59 2.75 2.94 3.10 3.29 3.52
181195 2.39 2.53 2.68 2.85 3.00 3.16 3.38
3.313.22
3.673.58211
225235 2.34 2.46 2.58 2.72 2.83 2.96
Scott, McPhersonlCurtis J
Electrical Properties of Rubber 199
All of the charts have as a prominent feature the diagonal ridge
which was mentioned previously. This ridge increases in height fromlow to high percentages of sulphur. On the low temperature side
of the ridge, there is a steep slope which falls away to an almost level
area. This level area represents a region in which the dielectric con-stant changes little with composition and temperature. On the hightemperature side of the ridge, the slope is gradual and fairly uniform.In this region the dielectric constant decreases with rising tempera-ture and increases as the percentage of sulphur becomes larger.
A change of frequency changes the height and position of the maxi-mum or ridge, and changes the steepness of the slope on the low sul-
phur side of the ridge. Increasing the frequency has the effect of
shifting the maximum to lower percentages of sulphur and to highertemperatures. Or, in other words, with increasing frequency, thediagonal ridge is displaced toward the right of the chart. The heightof the maximum becomes less as the frequency is increased—that is,
75°C-50 -25 O 25 50 75 /OO /25 150 175 200 225 250C.
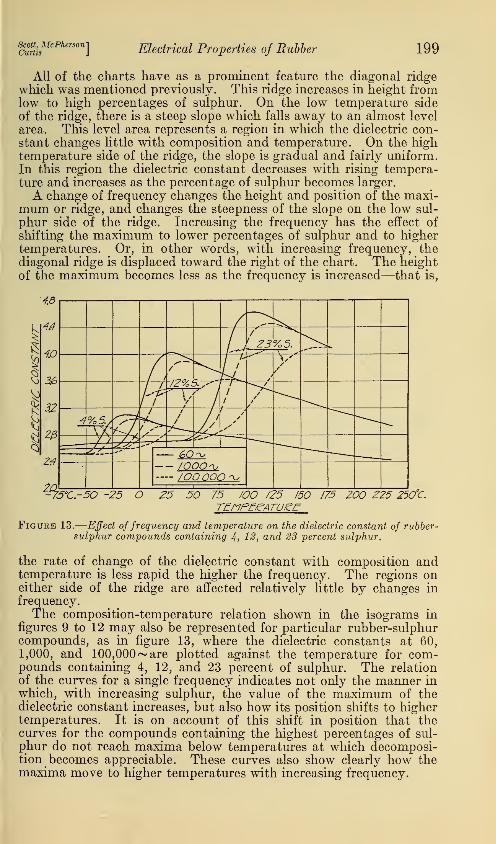
Figure 13.
—
Effect of frequency and temperature on the dielectric constant of rubber-sulphur compounds containing 4, 12, and 23 percent sulphur.
the rate of change of the dielectric constant with composition andtemperature is less rapid the higher the frequency. The regions oneither side of the ridge are affected relatively little by changes in
frequency.The composition-temperature relation shown in the isograms in
figures 9 to 12 may also be represented for particular rubber-sulphurcompounds, as in figure 13, where the dielectric constants at 60,
1,000, and 100,000 ~ are plotted against the temperature for com-pounds containing 4, 12, and 23 percent of sulphur. The relationof the curves for a single frequency indicates not only the manner in
which, with increasing sulphur, the value of the maximum of thedielectric constant increases, but also how its position shifts to highertemperatures. It is on account of this shift in position that thecurves for the compounds containing the highest percentages of sul-
phur do not reach maxima below temperatures at which decomposi-tion becomes appreciable. These curves also show clearly how themaxima move to higher temperatures with increasing frequency.
200 Bureau of Standards Journal of Research
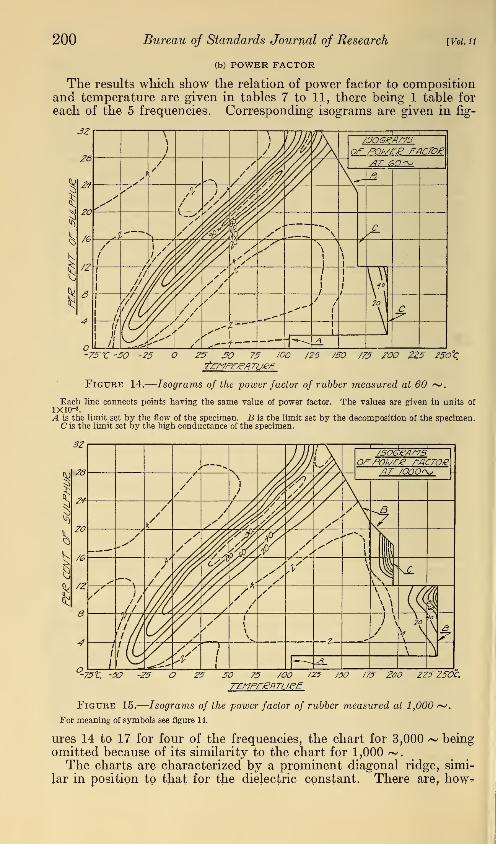
(b) POWER FACTOR
[Vol. 11
The results which show the relation of power factor to compositionand temperature are given in tables 7 to 11, there being 1 table for
each of the 5 frequencies. Corresponding isograms are given in fig-
7SK -50 -?5 25 50 75 (Oo
£5M35££7Vg£125 /50 775 200 2Z5 Z50C
Figure 14.
—
Isograms of the power factor of rubber measured at 60 ~.
Each line connects points having the same value of power factor. The values are given in units of
1X10-3.A is the limit set by the flow of the specimen. B is the limit set by the decomposition of the specimen.Cis the limit set by the high conductance of the specimen.
-75%. -50 -25 25 50 75 700 (25 (50 (75 ZOO 225 Z50C.
Figure 15.
—
Isograms of the power factor of rubber measured at 1,000 <*>*.
For meaning of symbols see figure 14.
ures 14 to 17 for four of the frequencies, the chart for 3,000 ~ beingomitted because of its similarity to the chart for 1,000 ~.The charts are characterized by a prominent diagonal ridge, simi-
lar in position to that for the dielectric constant. There are, how-*
Scott, McPherson]Curtis J
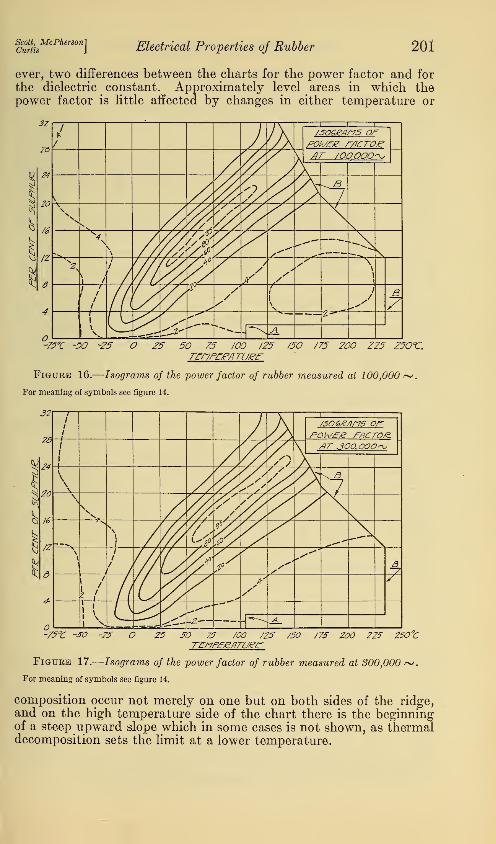
Electrical Properties of Rubber 201
ever, two differences between the charts for the power factor and for
the dielectric constant. Approximately level areas in which thepower factor is little affected by changes in either temperature or
3Z
Z&
70
/6
12
i/
i i n
—
/506£Af~75 OrPOk/EZ FACTOR —y
/\ TIT /OO.OOO^f\
\ v/'2^\>^N.
A//A'
A
//2'/A \V
XV
///( 2A s
,"'^"--^KX
N, /
\
v/t> '/,/
A aA" ' \\
1
i
1 /('2'?/ i A f!
1
vx(L//
t£ "**••»_
— __ 2-* -"
r^j±
-75% -50 -25 O 25 50 75 /OO 125 /50 /Z5 200 225 250<£.
rtnfceATue£-
Figure 16.
—
Isograms of the power factor of rubber measured at 100,000 ~.
For meaning of symbols see figure 14.
-75% SO -25 25 SO 75 /OO /25 /50 /75 200 225 250"C
Figure 17.
—
Isograms of the power factor of rubber measured at 300,000 ~.
For meaning of symbols see figure 14.
composition occur not merely on one but on both sides of the ridge,and on the high temperature side of the chart there is the beginningof a steep upward slope which in some cases is not shown, as thermaldecomposition sets the limit at a lower temperature.
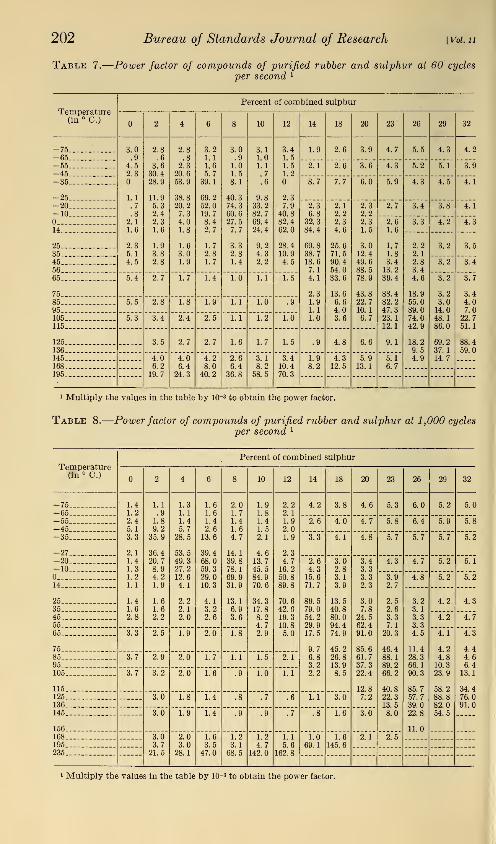
202 Bureau of Standards Journal oj Research [Vol. u
Table 7.
—
Power factor of compounds of purified rubber and sulphur at 60 cycles
per second 1
Temperature(in ° C.)
Percent of combined sulphur
2 4 6 8 10 12 14 18 20 23 26 29 32
-75-65
3.0.9
4.52.3
1.1
.7
.82.11.6
2.35.14.5
2.8.6
3.630.428.9
11.95.32.42.31.6
1.9
3.82.8
2.8.8
2.320.653.9
38.820.27.34.01.8
1.63.01.9
3.21.1
1.65.7
39.1
69.252.019.78.42.7
1.72.81.7
3.0.9
1.01.58.1
40.374.360.627.57.7
3.32.81.4
3.11.01.1
.7
.6
9.833.282.769.424.4
9.24.32.2
3.41.51.51.2
2.37.9
40.882.462.0
28.410.94.5
1.9 2.6 3.9 4.7 5.5 4.3 4.2
-55—45
2.1 2.6 3.6 4.3 5.2 5.1 3.9
-35 8.7 7.7 6.0 5.9 4.3 4.5 4.1
-25-20 2.3
6.832.384.4
69.838.718.67.1
4.1
2.31.91.11.0
2.12.22.34.6
25.671.590.454.033.6
13.66.64.03.6
2.32.22.31.5
3.012.449.688.578.9
43.822.710.16.7
2.7 3.4 3.8 4.1-10
2.61.6
1.71.83.413.239.4
88.482.247.323.112.1
9.1
3.3 4.2 4.314
25 2.22.1
2.83.44.6
18.955.089.074.042.9
18.29.54.9
3.2
"Z.2
3.53545 3.456 .
65... 5.4 2.7 1.7 1.4 1.0 1.1 1.5 3.2
3.23.014.048.186.0
69.237.114.7
3.7
75 3.48595
5.5 2.8 1.8 1.9 1.1 1.0 .9 4.07.0
105 5.3 3.4 2.4 2.5 1.1 1.2 1.0 22.7115 51.1
125136
3.5 2.7 2.7 1.6 1.7 1.5 .9 4.8 6.6 88.459.0
145168
4.06.2
19.7
4.06.4
24.3
4.28.0
40.2
2.66.4
36.8
3.18.258.5
3.410.4
70.3
1.98.2
4.312.5
5.913.1
5.16.7
195
1 Multiply the values in the table by 10~3 to obtain the power factor.
Table 8.
—
Power factor of compounds of purified rubber and sulphur at 1,000 cycles
per second !
Temperature(in ° C.)
Percent of combined sulphur
2 4 6 8 10 12 14 18 20 23 26 29 32
-75 1.41.22.45.13.3
2.11.41.31.21.1
1.41.62.8
1.1
.91.89.235.9
36.420.78.94.21.9
1.61.62.2
1.31.1
1.45.7
28.5
53.549.327.212.64.1
2.22.12.0
1.61.61.42.613.6
39.468.059.329.010.3
4.13.22.6
2.01.71.41.64.7
14.1
39.878.169.931.9
13.1
6.93.6
1.9
1.81.41.52.1
4.613.745.584.970.6
34.317.88.24.72.9
2.22.11.92.01.9
2.34.716.250.889.8
70.642.619.310.85.0
4.2 3.8 4.6 5.3 6.0 5.2 5.0-65-55 2.6 4.0 4.7 5.8 6.4 5.9 5.8-45-35 3.3 4.1 4.8 5.7 5.7 5.7 5.2
-27-20-10
2.64.315.671.7
89.579.054.229.917.5
9.76.83.22.2
3.62.83.13.9
13.540.880.094.474.9
45.226.813.98.5
3.43.33.32.3
3.07.8
24.562.491.0
85.661.737.322.4
12.87:2
4.3 4.7 5.2 5.1
U.".'.'..
3.92.7
2.52.63.37.1
20.3
46.488.189.266.2
40.822.313.58.0
4.8 5.2 5.2
25 3.23.13.33.34.5
11.428.366.190.3
85.757.739.022.8
11.0
4.2
~~4.T
4.3354555
~~4.~7
65. .. 3.3 2.5 1.9 2.0 1.8 4.1
4.24.810.323.9
58.288.882.054.5
4.3
75 4.48595
3.7 2.9 2.0 1.7 1.1 1.5 2.1 4.66.4
105 3.7 3.2 2.0 1.6 .9 1.0 1.1 13.1
115 34.4125136
3.0 1.8 1.4 .8 .7 .6 1.1 3.0 76.091.0
145
156
3.0 1.9 1.4 .9 .9 .7 .8 1.6 3.0
168 ... 3.03.7
21.5
2.63.0
28.1
1.63.5
47.0
1.23.1
68.5
1.24.7
142.0
1.1
5.6162.8
1.069.1
1.6145.6
2.1 2.5195 ..
235
Multiply the values in the table by 10~3 to obtain the power factor.
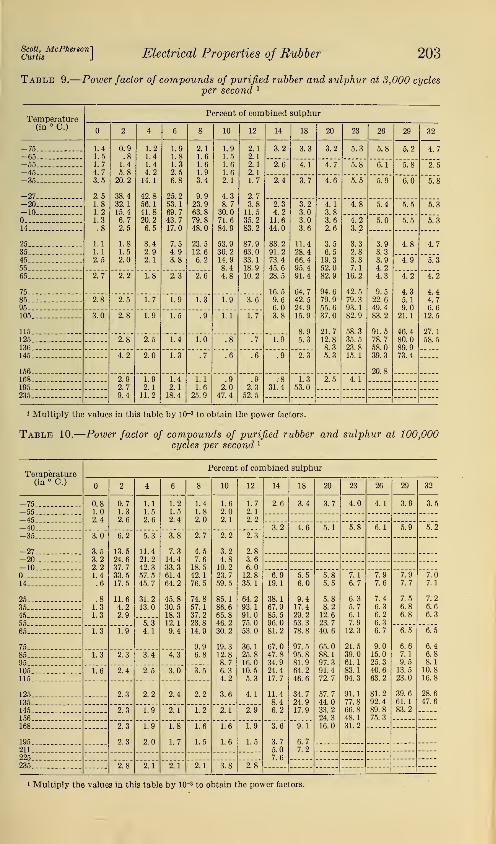
Scott, McPhersonlCurtis J
Electrical Properties of Rubber 203
Table 9. -Power factor of compounds of purified rubber and sulphur at 3,000 cyclesper second x
TemperaturePercent of combined sulphur
(in ° C.)2 4 6 8 10 12 14 18 20 23 26 29 32
-75 1.41.51.74.73.5
2.51.81.21.3.8
1.1
1.1
2.5
0.9.8
1.45.8
20.2
38.432.115.46.72.5
1.81.52.0
1.21.41.44.214.1
42.856.141.820.26.5
3.42.92.1
1.91.81.32.56.8
25.253.169.743.717.0
7.54.93.8
2.11.61.61.93.4
9.923.963.879.848.0
23.512.66.2
1.91.51.61.62.1
4.38.730.071.684.9
53.930.214.98.44.8
2.12.12.12.11.7
2.73.8
11.535.283.2
87.963.033.118.910.2
3.2 3.3 3.2 5.3 5.8 5.2 4 7-65-55-45
2.6 4.1 4.7 5.8 6.1 5.8 2.5
—35 . 2.4 3.7 4.6 5.5 5.9 6.0 5 8
-27-20 2.3
4.211.644.0
83.291.273.445.628.5
16.59.66.03.8
3.23.03.03.6
11.428.466.495.491.4
64.742.524.915.9
8.95.3
4.13.83.62.6
3.56.519.352.082.9
94.679.955.637.0
21.712.88.35.3
4.8 5.4 5.5 5 3-10—14"""—"-"-" 4.2
3.2
3.32.83.37.116.2
42.579.393.182.9
58.335.523.815.1
5.0 5.5 5.3
25
3545
3.93.33.94.24.3
9.522.649.483.2
91.578.758.039.3
20.8
4.8
~~4."9"
4.7
5.35565
75
2.7 2.2 1.8 2.3 2.6 4.2
4.35.1
9.021.1
46.480.089.973.4
4.2
4.485... 2.8 2.5 1.7 1.9 1.3 1.9 3.6 4.795 6.6105 3.0 2.8 1.9 1.5 .9 1.1 1.7 12.5
115 27.1125136
2.8 2.5 1.4 1.0 .8 .7 1.9 58.5
145
156
4.2 2.0 1.3 .7 .6 .6 .9 2.3
168 2.92.79.4
1.92.111.2
1.42.118.4
1.1
1.625.9
.92.047.4
.92.3
52.5
.831.4
1.353.0
2.5 4.1195235
1 Multiply the values in this table by 10-3 to obtain the power factors.
Table 10.
—
Power factor of compounds of purified rubber and sulphur at 100,000cycles per second 1
TemperaturePercent of combined sulph ur
(in ° C.)2 4 6 8 10 12 14 18 20 23 26 29 32
-75 0.81.02.4
0.71.32.6
1.1
1.52.6
1.21.52.4
1.41.82.0
1.62.02.1
1.72.12.2
2.6 3.4 3.7 4.0 4.1 3.9 3.5—55—45-40 3.2 4.6 5.1 5.8 6.1 5.9 5 ?
—35 3.0
3.53.22.21.4.6
.81.31.3
6.2
13.524.637.733.517.5
11.64.22.9
5.3
11.421.242.357.545.7
31.213.0
""ST4.1
3.8
7.314.433.361.464.2
45.830.518.312.19.4
2.7
4.57.618.542.176.5
74.857.137.223.814.9
9.96.8
2.2
3.24.810.223.759.5
85.186.665.846.230.2
19.312.88.76.34.2
3.6
2.3
2.83.66.0
12.835.1
64.293.191.075.053.0
36.125.816.010.55.3
4.1
—27—20—10
14~"6.9
19.1
38.167.985.596.081.2
67.047.834.924.417.7
11.48.46.2
5.56.0
9.417.429.253.378.8
97.595.881.964.246.6
34.724.917.9
5.85.5
5.88.212.623.740.6
65.088.197.391.472.7
57.744.033.224.316.0
7.1
6.7
6.35.76.17.9
12.3
21.539.061.183.194.3
91.177.866.848.131.2
7.97.6
7.46.36.26.36.7
9.015.025.340.663.2
81.292.489.875.3
7.97.7
7.56.86.8
7.07 1
25
354555
7.26.66.3
65
75 .„
1.3 1.9 6.5
6.67.19.513.523.0
39.661.183.2
6.5
6.4
85 1.3 2.3 3.4 4.3 6.8
95 8.1
105 .. 1.6 2.4 2.5 3.0 3.5 10.8
115 16.8
125 ... 2.3 2.2 2.4 2.2 28.6
135 47.6
145156
2.3 1.9 2.1 1.2 2.1 2.9
168 2.3
2.3
1.9
2.0
1.8
1.7
1.6
1.5
1.6
1.6
1.9
1.5
3.6
3.75.07.6
9.1
6.77.2
195211225 .
235 2.8 2.1 2.1 2.1 3.8 2.8
Multiply the values in this table by 10~3 to obtain the power factors.

204 Bureau of Standards Journal of Research [Vol. u
Table 11.
—
Power factor of compounds of purified rubber and sulphur at 300,000cycles per second l
TemperaturePercent of combined sulphur
(in ° C.)2 4 6 8 10 12 14 18 20 23 26 29 32
-75 0.71.22.1
0.91.22.2
1.01.52.4
1.21.62.3
1.81.82.2
1.81.92.3
1.91.92.4
2.4 3.0 3.2 3.6 3.5 3.6 3.5-55-45—40 3.3 4.3 4.6 5.4 5.5 5.3 4.7—35 2.4
3.23.52.71.71.0
.81.1
1.0
4.4
8.516.729.737.627.9
19.57.44.5
4.7
8.113.728.949.455.6
42.622.413.29.06.2
3.5
5.710.421.944.067.8
62.948.830.721.713.4
10.99.0
2.6
3.76.513.027.762.4
79.475.358.140.125.6
17.913.39.36.7
2.3
3.04.07.8
17.141.8
70.089.287.365.949.1
32.224.817.212.38.3
6.0
2.5
2.83.5
-27-20-10 5.6
10.125.0
45.178.890.990.576.0
60.041.430.021.214.2
10.9
6.716.0
28.250.074.893.598.9
90.070.151.738.829.5
20.816.312.0
6.17.3
9.615.524.941.864.0
89.0101.098.985.566.1
51.540.132.123.817.0
6.46.6
7.19.013.320.933.2
55.075.793.498.292.9
78.763.250.640.127.8
19.4
7.78.0
7.97.5
'
7.79.79.8
20.832.551.7
83^9
96.194.086.268.146.3
8.18.3
8.57.97.78.08.2
10.815.623.234.652.5
68.486.694.292.4
7.88.7
8.58.37.8
7.314
25354555
7.6
7.77.57.6
65 1.3 2.7 5.8
7.78.410.614.322.4
32.448.272.2
7.6
75 7.58595
1.4 2.8 4.7 7.48.9
105115
1.3 2.7 3.3 4.9 11.217.1
125135
2.4 2.6 3.4 4.2 25.136.8
145156
2.3 2.3 2.7 2.7 4.3 6.0
168 ._ 2.3 2.1 2.4 2.2 3.5 4.1 7.4
181195 2.2 2.0 2.2 1.8 2.4 2.6 5.8
5.25.6
10.89.4211
225235 2.8 2.4 2.1 2.1 4.9 2.2
Multiply the values in this table by MH to obtain the power factors.
— 60^
•/OOjDOO*
-75Vr50 -Z5 O 25 50 75 /OO JZ5 ISO /75 ZOO ZZ5 Z50C.
Figure 18.
—
The effect of frequency and temperature on the power factor of rubber-sulphur compounds containing 4, 1®, and 23 percent of sulphur.
A comparison of the isograms in figures 14 to 17 shows that achange in frequency has the same type of effect on the power factor
that it|has on the dielectric constant, in that the characteristic diag-
onal ridge is^shifted toward the high temperature side of the diagram
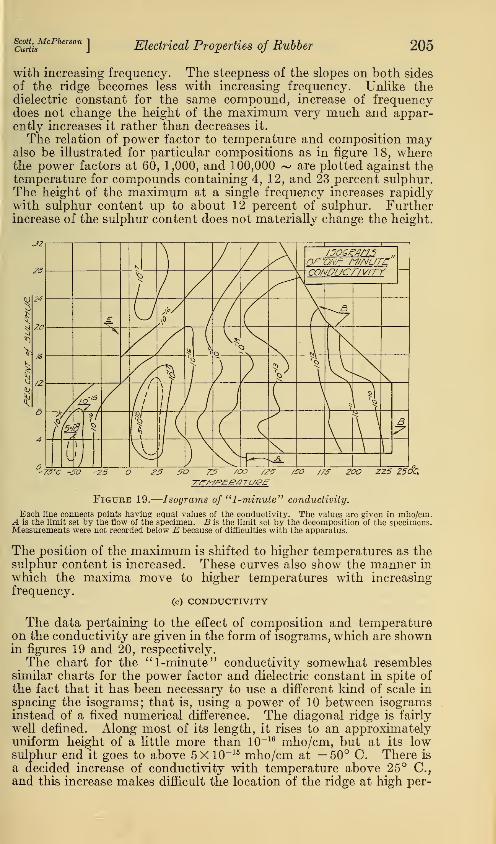
Scott, McPhersonCurtis Electrical Properties of Rubber 205
with increasing frequency. The steepness of the slopes on both sides
of the ridge becomes less with increasing frequency. Unlike thedielectric constant for the same compound, increase of frequencydoes not change the height of the maximum very much and appar-ently increases it rather than decreases it.
The relation of power factor to temperature and composition mayalso be illustrated for particular compositions as in figure 18, wherethe power factors at 60, 1,000, and 100,000 ~ are plotted against thetemperature for compounds containing 4, 12, and 23 percent sulphur.The height of the maximum at a single frequency increases rapidlywith sulphur content up to about 12 percent of sulphur. Furtherincrease of the sulphur content does not materially change the height.
75°C -JO JO 7_J /OO /£J 200 ZZ5 Z50C,
Figure 19.
—
Isograms of "1-minute" conductivity.
Each line connects points having equal values of the conductivity. The values are given in mho/cm.A is the limit set by the flow of the specimen. B is the limit set by the decomposition of the specimens.Measurements were not recorded below E because of difficulties with the apparatus.
The position of the maximum is shifted to higher temperatures as thesulphur content is increased. These curves also show the manner in
which the maxima move to higher temperatures with increasingfrequency.
(c) CONDUCTIVITY
The data pertaining to the effect of composition and temperatureon the conductivity are given in the form of isograms, which are shownin figures 19 and 20, respectively.
The chart for the "1-minute" conductivity somewhat resemblessimilar charts for the power factor and dielectric constant in spite of
the fact that it has been necessary to use a different kind of scale in
spacing the isograms; that is, using a power of 10 between isogramsinstead of a fixed numerical difference. The diagonal ridge is fairly
well defined. Along most of its length, it rises to an approximatelyuniform height of a little more than 10~ 16 mho/cm, but at its lowsulphur end it goes to above 5X 10-15 mho/cm at —50° C. There is
a decided increase of conductivity with temperature above 25° C,and this increase makes difficult the location of the ridge at high per-
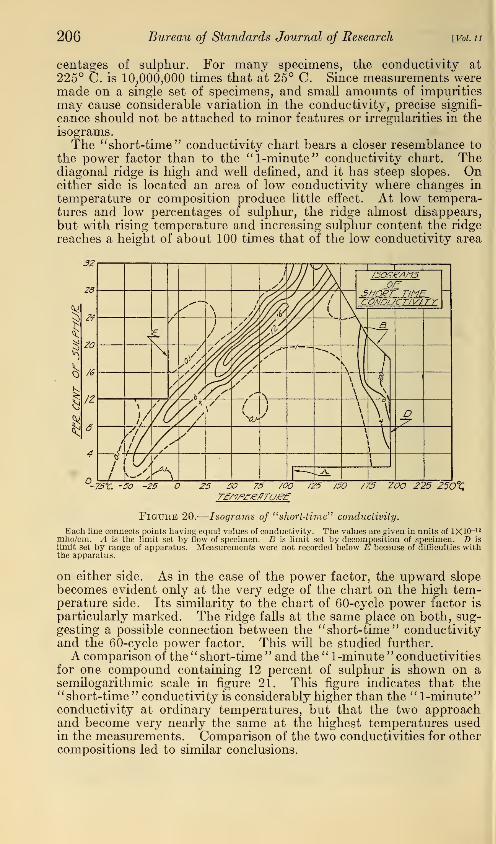
206 Bureau oj Standards Journal of Research [Vol. 11
centages of sulphur. For many specimens, the conductivity at225° C. is 10,000,000 times that at 25° C. Since measurements weremade on a single set of specimens, and small amounts of impurities
may cause considerable variation in the conductivity, precise signifi-
cance should not be attached to minor features or irregularities in theisograms.The " short-time" conductivity chart bears a closer resemblance to
the power factor than to the "1-minute" conductivity chart. Thediagonal ridge is high and well defined, and it has steep slopes. Oneither side is located an area of low conductivity where changes in
temperature or composition produce little effect. At low tempera-tures and low percentages of sulphur, the ridge almost disappears,
but with rising temperature and increasing sulphur content the ridge
reaches a height of about 100 times that of the low conductivity area
-75t. -50 -25 O 25 50 75 /OO /Z5 150 775 200 225 250%
Figure 20.
—
Isograms of "short-time" conductivity.
Each line connects points having equal values of conductivity. The values are given in units of IX 10-12
mho/cm. A is the limit set by flow of specimen. B is limit set by decomposition of specimen. D is
limit set by range of apparatus. Measurements were not recorded below E because of difficulties withthe apparatus.
on either side. As in the case of the power factor, the upward slopebecomes evident only at the very edge of the chart on the high tem-perature side. Its similarity to the chart of 60-cycle power factor is
particularly marked. The ridge falls at the same place on both, sug-gesting a possible connection between the " short-time" conductivityand the 60-cycle power factor. This will be studied further.
A comparison of the " short-time " and the " 1-minute " conductivitiesfor one compound containing 12 percent of sulphur is shown on asemilogarithmic scale in figure 21. This figure indicates that the" short-time" conductivity is considerably higher than the " 1-minute"conductivity at ordinary temperatures, but that the two approachand become very nearly the same at the highest temperatures usedin the measurements. Comparison of the two conductivities for othercompositions led to similar conclusions.

Scott, McPhersonCurtis Electrical Properties of Rubber 207
VII. COMPARISON OF ELECTRICAL PROPERTIES OF COM-POUNDS OF PURIFIED RUBBER AND SULPHUR WITHTHOSE OF CRUDE RUBBER AND SULPHUR
A comparison of the results reported in this paper with those pre-
viously reported for crude rubber indicates that purification of therubber has only a relatively small effect on the dielectric constant andpower factor, and a larger effect on the conductivity. The curves in
figure 8 of this paper were made under the same conditions as thecurves in figures 8, 9, and 10 of our previous paper giving results oncrude rubber. 15 The curve of dielectric constant for compounds of
purified rubber is slightly lower than the corrresponding curve for
crude rubber except that the maximum value at about 11 percent of
sulphur is the same (3.75) for the two. The values of the dielectric
/o'c
/6"
/d'2
/d°
to*4
to'5
i6'G
/d/7
~.1 1 1
z
'sr/aeT T/f-if"
1 / Jy
/
-
'.
v^^s.
ONE ff/NUTf
s
\^'-
'~-75°C. -50 -25 O Z5 JO 75 /OO /25 00 /Z5 200 ZZ5 250°C.
Figure 21.
—
"Short-time" and "1-minute" conductivities for a rubber containing12 percent of sulphur.
constant for purified rubber specimens are, on the average, about0.06 lower than those of the corresponding crude rubber specimens onthe low sulphur side of the maximum and about 0.08 lower on the highsulphur side of the maximum. The maxima of the two curves occurat the same composition for both.The power factors of the purified rubber specimens are lower than
those of the corresponding crude rubber specimens except in theregion of the maximum, where the power factor of the purified rub-ber appears to rise to a higher maximum than that of crude rubber.In the regions of low and of high percent of sulphur, the power factorsof specimens of purified rubber are generally 30 to 50 percent less
than those of crude rubber.The conductivity of purified rubber is not so readily compared with
that of the previous work on crude rubber, since in the previous paperthe resistivity was plotted instead of the conductivity. A comparisonof values shows that the conductivity of crude rubber is from 5 to
15 See reference in footnote 1, p. 411.
208 Bureau oj Standards Journal of Research [Vol. ti
20 times as much as the corresponding specimens of purified rubberexcepting in the region of the maximum where there seems to belittle difference between the two.The values for the dielectric constant and power factor of crude
rubber as determined by Kitchin 16 and by Kimura 17 and his asso-
ciates are appreciably larger than those herein reported. The curveswhich they give indicate that purification of the rubber does not changethe temperature or the frequency at which either the dielectric con-stant or power factor is a maximum.
VIII. SELECTION OF RUBBER COMPOUNDS FOR SPECIFICUSES
The properties of rubber and its compounds with sulphur have adirect bearing on many practical problems because such sulphurcompounds form the basis of virtually all commercial rubber products.
While the commercial rubber products are usually compounded withfillers and other ingredients which affect the electrical properties of
the product, the effects of these are superimposed on the basic
properties of the rubber-sulphur compounds.If rubber of low dielectric constant is required, as for the insulation
of submarine telephone or telegraph cables, an inspection of isogramsin figures 9 to 12 indicates clearly that the best results are to be ob-tained with the lowest practicable proportion of combined sulphur.
.For example, at 25° C. and 1,000~ the rubber alone has a dielectric
constant of 2.4; with 1 percent of combined sulphur, the dielectric
constant is about 2.5, and with 3 percent of sulphur it is about 2.8.
If a dielectric constant less than 2.8 is necessary, percentages of com-bined sulphur less than 3 percent must be used. If it is desirable thatthe insulation have the mechanical properties of the high sulphur or
hard-rubber range, a dielectric constant as low as 2.75 can be obtained.
The use of the minimum percent of sulphur in such cases is in accord-ance with recent developments in cable engineering, 18 some of whichhave resulted from this investigation.
When a low power factor is needed, the frequency used must betaken into account. At 60 ~ and 25° C, specimens containing up to
8 percent of combined sulphur have power factors of less than 4 X 10~3,
but the range of composition having this low power factor at 300,000~ lies below 1 percent of combined sulphur. About as low a powerfactor can be obtained with high sulphur content; that is, above 20percent at 60 ~. However, the power factor in this range of com-position increases but little with frequency rising to about 8 X 10~3 at25° C. and 300,000 ~.The results show that purification of the rubber makes it possible
to obtain soft rubber having as low conductivity as hard rubber,
whereas if the rubber is not purified the soft rubber has much higherconductivity than the hard rubber. It is of advantage, then, to
purify the rubber when a low conductivity is desired. If the rubberis purified, it makes little difference, as far as conductivity at 25° C,is concerned, what composition is used with the exception of the range
' 6 Donald W. Kitchin, Studies in the Vulcanization of Rubber. Part V. Dielectric Constant and PowerFactor of Vulcanized Rubber, Ind. & Eng. Chem., vol. 24, p. 549, May 1932.
17 See footnote 2.
is H. E. Rowand, Part I, E. W. Davis and G. J. Crowdes; Part II: Submarine Telephone Cable. Elec-
trician, 107, p. 721, November 1931.
A. R. Kemp, Paragutta, A New Insulating Material for Submarine Cables, Bell System Techn. J., vol.
10, p. 132, 1931. Jour. Frank. Inst., vol. 211, p. 37, 1931.

scott, Mcpherson]Electrical Properties oj Rubber 209
from 14 to 24 percent of sulphur where the conductivity is definitely
higher.
The conductivity of rubber does not necessarily increase withtemperature as is usually assumed in the preparation of tables andformulas which are used in specifications for correction of tempera-ture. This is clearly shown by figure 19. It may either increase or
decrease according to the temperature range used. For instance, the
conductivity of a specimen containing 8 percent of sulphur decreases
with temperature from 0° C. to about 20° C. and then increases as the
temperature is increased above this. This indicates quite clearly the
inadequacy of the usual formulas for correcting the conductivity or
resistivity for differences in temperature.
IX. CONCLUSION
The electrical measurements given in this paper differ from those
previously reported by the authors and by other investigators in thatthey were made on specimens prepared from purified rubber. Thepurification, which involved the removal of proteins; resins, andwater-soluble salts, affected all the electrical properties to some extent,
but did not alter the general character of the variation in electrical
properties with composition, temperature, or frequency.The results of the present investigation afford comprehensive data
on the electrical properties of rubber-sulphur compounds, and mayform a basis for designing rubber compounds for specific electrical
uses. They also demonstrate the inadequacy of the simple numericalcoefficients that are sometimes employed to evaluate the changesin the electrical properties with temperature and frequency.A discussion of the results from the standpoint of modern dielectric
theory is not included in the present paper, but is contemplated or
a separate paper.
X. ACKNOWLEDGMENT
Acknowledgment is made of the important assistance which A. D.Cummings rendered in preparing many of the specimens used in this
investigation and in helping with some of the electrical measurements.
Washington, April 17, 1933.
205—33-