effect of strategic marketing positioning on …
TRANSCRIPT

EFFECT OF STRATEGIC MARKETING POSITIONING
ON EFFECTIVE ORGANIZATIONAL PERFORMANCE: A
CASE OF DOMESTIC TOUR OPERATORS IN KENYA
BY
VANESSA STELLA OCHIENG
UNITED STATES INTERNATIONAL UNIVERSITY –
AFRICA
SUMMER 2021
ii
EFFECT OF STRATEGIC MARKETING POSITIONING
ON EFFECTIVE ORGANIZATIONAL PERFORMANCE: A
CASE OF DOMESTIC TOUR OPERATORS IN KENYA
BY
VANESSA STELLA OCHIENG
A Research Project Submitted to the Chandaria School of
Business in Partial Fulfilment of the Requirement for Degree in
Masters in Business Administration (MBA)
UNITED STATES INTERNATIONAL UNIVERSITY -
AFRICA
SUMMER 2021

iii
STUDENT’S DECLARATION
I, the undersigned, declare that this is my original work and has not been submitted to any
other institution, or university other than United States International University-Africa,
Nairobi for academic credit.
Signed: _________________________________ Date: ________________________
Ochieng Vanessa Stella (ID 660883)
This research project has been presented for examination with my approval as the
appointed Supervisor
Signed: _________________________________ Date: ________________________
Mary Mutisya, PhD
Signed: _________________________________ Date: ________________________
Dean, Chandaria School of Business

iv
COPYRIGHT
All rights reserved. This report may not be copied, replaced, recorded, or transmitted by
any electronic or mechanical means without the consent of the author. The research is to
be used for private study or non-commercial research purpose only.
Vanessa Ochieng © 2021

v
ABSTRACT
The general objective of this research was to determine the effect of strategic marketing
positioning on the effective organizational performance of domestic tour operators in
Kenya. The specific objectives were to determine the effect that digital transformation has
on effective organizational performance of domestic tour operators in Kenya; to examine
how pricing strategies affects effective organizational performance of domestic tour
operators in Kenya and to determine the influence of diversification strategies on
effective organizational performance of domestic tour operators in Kenya.
The study adopted a descriptive research design since it gives information of the status of
a phenomenon and that is what the research intends on doing. The population of interest
in this research were 193 domestic tour operators in Kenya. A sample size of 130
domestic tour operators was selected. The sample was selected using stratified sampling
technique. A closed-ended questionnaire was used to obtain primary data. The data
collected was then be analysed using Statistical Package for Social Sciences (SPSS)
which was used to generate percentage frequencies and mean standard deviation scores.
Also, using the descriptive and inferential statistics Spearman’s rank correlation
technique and multiple linear regression modelling techniques, the relationships between
the three independent study variables which are digital transformation, pricing strategies
and diversification strategies and the dependent variable effective organizational
performance were analyzed. The correlation method was used to determine whether there
was a relationship between the variables, while the regression method was used to
determine the relationship's level of significance. Graphs and tables were used to present
the findings.
In determining the influence of digital transformation on effective organizational
performance, the findings indicated that there exists a significant relationship between
digital transformation and effective organizational performance, r (0.918); p-value < 0.01.
The study further established that digital transformation accounts for 79.2% in variability
in effective organizational performance. The findings of the study showed that the
variable that was the predictor had a positive association with a level of significance of
0.05. It was shown that there existed a strong positive relationship between digital
transformation and effective organizational performance (r=0.918, P=0.000, N=100).
vi
This study sought to determine the effect of pricing strategy on effective organizational
performance. The findings of the study revealed that there exists a significant relationship
between pricing strategy and effective organizational performance, r (0.970); p-value <
0.01. The study established that pricing strategies accounts for 88.36% variability in
effective organizational performance. The study findings showed that the variable that
was the predictor had a positive association with a level of significance of 0.05. A strong
positive relationship between pricing strategies and effective organizational performance
was very much evident from these findings (r=0.970, P=0.00, N=100).
This study also sought to determine the influence of diversification strategies on effective
organizational performance. The findings of the study revealed that there exists a
significant relationship between effect of diversification strategies on effective
organizational performance, r (0.9566); p-value < 0.01. The study established that
diversification strategies accounts for 75.46 % in effective organizational performance.
The study findings showed that the variable that was the predictor had a positive
association with a level of significance of 0.05. It was evident that there existed a positive
relationship between diversification strategies and effective organizational performance
(r=0.956, P=0.00, N=100)
This research study concluded that there exists a positive relationship between digital
transformation and effective organizational performance and agreed that the relationship
between digital transformation and effective organizational performance was statistically
important. Equally, findings showed that there exists a positive relationship between
pricing strategies and effective organizational performance, and therefore this research
concluded that the relationship between pricing strategies and effective organizational
performance was statistically significant. Finally, findings on this study have also showed
that there exists a positive relationship between diversification strategies and effective
organizational performance, in conclusion, this research concludes that the relationship
between diversification strategies and effective organizational performance was
statistically significant.
This study’s recommendations on domestic tour firms included leveraging on digital
technology especially using platforms such as social platforms, and online marketing

vii
sites. This not only increases efficiency in the organization’s performance but also quick
delivery to its customers. In addition, it was recommended that pricing strategies be
implemented based on the specification of the type of market positioning domestic tour
firms take. For instance, tier pricing system that differentiates prices paid by locals and
that paid by international tourists is important so that an organization can achieve its
profitability goal as well as perform effectively. Finally, it was recommended that
managers of tour firms adopt a mix of diversification strategies (both related and
unrelated) as a way of boosting the firms’ appearance to investors and maintain/built
customer loyalty in their organizations

viii
ACKNOWLEDGEMENT
I wish to thank my family for according to me the needed support, encouragement and
advise while undertaking this project. Also, I acknowledge my Professor, Dr. Mary
Mutisya for intellectual support and research mentorship that has enabled me to put this
project together.

ix
DEDICATION
I would like to dedicate this research project to my parents, Nick and Cathy and my
brother John Mark for giving me the necessary support to complete it successfully.

x
TABLE OF CONTENTS
STUDENT’S DECLARATION ...................................................................................... iii
COPYRIGHT .................................................................................................................... iv
ABSTRACT ........................................................................................................................ v
ACKNOWLEDGEMENT ............................................................................................. viii
DEDICATION................................................................................................................... ix
TABLE OF CONTENTS .................................................................................................. x
LIST OF TABLES ......................................................................................................... xiii
LIST OF FIGURES ........................................................................................................ xiv
LIST OF ABBREVIATIONS AND ACRONYMS ....................................................... xv
CHAPTER ONE ................................................................................................................ 1
1.0 INTRODUCTION........................................................................................................ 1
1.1 Background of the Problem .................................................................................. 1
1.2 Statement of the Problem ...................................................................................... 9
1.3 General Objective ............................................................................................... 11
1.4 Specific Objectives ............................................................................................. 11
1.5 Significance of the Study .................................................................................... 11
1.6 Scope of the Study .............................................................................................. 12
1.7 Definition of Terms............................................................................................. 13
1.8 Chapter Summary ............................................................................................... 14
CHAPTER TWO ............................................................................................................. 15
2.0 LITERATURE REVIEW ......................................................................................... 15
2.1 Introduction ......................................................................................................... 15
2.2 The Effect of Digital Transformation on Effective Organizational Performance
of Domestic Tour Operators ..................................................................................... 15

xi
2.3 The Effect of Pricing on Effective Organisational Performance ........................ 19
2.4 The Effect of Diversification on Effective Organizational Performance on
Domestic Tour Operators .......................................................................................... 25
2.5 Chapter Summary ............................................................................................... 31
CHAPTER THREE ......................................................................................................... 32
3.0 RESEARCH METHODOLOGY ............................................................................. 32
3.1 Introduction ......................................................................................................... 32
3.2 Research Design.................................................................................................. 32
3.3 Population and Sampling Design ........................................................................ 33
3.4 Data Collection Methods .................................................................................... 36
3.5 Research Procedures ........................................................................................... 37
3.6 Data Analysis ...................................................................................................... 37
3.7 Chapter Summary ............................................................................................... 38
CHAPTER FOUR ............................................................................................................ 39
4.0 RESULTS AND FINDINGS ..................................................................................... 39
4.1 Introduction ......................................................................................................... 39
4.2 Response Rate ..................................................................................................... 39
4.3 Demographic Data .............................................................................................. 40
4.4 Digital Transformation and Effective Organizational Performance ................... 44
4.5 Regression Test for Digital Transformation and Effective Organizational
Performance .............................................................................................................. 47
4.6 Pricing Strategies and Effective Organizational Performance............................ 49
4.7 Regression Test for Pricing Strategies and Effective Organizational
Performance. ............................................................................................................. 51
4.8 Diversification Strategies and Effective Organizational Performance ............... 53
xii
4.9 Regression Test for Diversification Strategies and Effective Organizational
Performance .............................................................................................................. 55
4.10 Chapter Summary ............................................................................................. 57
CHAPTER FIVE ............................................................................................................. 58
5.0 DISCUSSION, CONCLUSIONS AND RECOMMENDATIONS ........................ 58
5.1 Introduction ......................................................................................................... 58
5.2 Summary ............................................................................................................. 58
5.3 Discussion ........................................................................................................... 60
5.4 Conclusion .......................................................................................................... 66
5.5 Recommendations ............................................................................................... 67
REFERENCES ................................................................................................................. 69
APPENDICES .................................................................................................................. 84
APPENDIX 1: INTRODUCTORY COVER LETTER................................................ 84
APPENDIX 1I: RESEARCH QUESTIONNAIRE ....................................................... 85
APPENDIX III: CONSENT FORM .............................................................................. 90
APPENDIX IV: DEBRIEF FORM ................................................................................ 92
APPENDIX V: IRB LETTER ........................................................................................ 93
APPENDIX VI: NACOSTI RESEARCH PERMIT ..................................................... 94

xiii
LIST OF TABLES
Table 3. 1 : Population Distribution ................................................................................... 33
Table 3. 2 : Sample Size Distribution ................................................................................ 36
Table 4. 1: Descriptive Analysis for Digital Transformation And Effective Organizational
Performance ....................................................................................................................... 45
Table 4.2: Correlations Between Digital Transformation and Effective Organizational
Performance ....................................................................................................................... 47
Table 4.3: Model Summary for Digital Transformation and Effective Organizational
Performance ....................................................................................................................... 47
Table 4.4: ANOVA for Digital Transformation and Effective Organizational Performance
............................................................................................................................................ 48
Table 4.5: Regression Coefficients between Digital Transformation and Effective
Organizational Performance .............................................................................................. 49
Table 4.6: Descriptive analysis for Pricing Strategies and Effective Organizational
Performance ....................................................................................................................... 49
Table 4.7: Correlation Between Pricing Strategies and Effective Organizational
Performance ....................................................................................................................... 51
Table 4.8: Model Summary for Pricing Strategies and Effective Organizational
Performance ....................................................................................................................... 51
Table 4.9: ANOVA for Pricing Strategies and Effective Organizational Performance .... 52
Table 4.10: Regression Coefficients on Pricing Strategies and Effective Organizational
Performance ....................................................................................................................... 53
Table 4.11: Descriptive Analysis for Diversification Strategies and Effective
Organizational Performance .............................................................................................. 54
Table 4.12: Correlations Between Diversification Strategies and Effective Organizational
Performance ....................................................................................................................... 55
Table 4.13: Regression Analysis on Diversification Strategies and Effective
Organizational Performance .............................................................................................. 56
Table 4.14: ANOVA on Diversification Strategies and Effective Organizational
Performance ....................................................................................................................... 56
Table 4.15: Regression Coefficient on Diversification Strategies and Effective
Organizational Performance .............................................................................................. 57
xiv
LIST OF FIGURES
Figure 2. 1 Alternative Approaches to Value Creation...................................................... 24
Figure 4. 1 : Response Rate ............................................................................................... 40
Figure 4. 2 Domestic Tour Firm Categories ...................................................................... 41
Figure 4. 3 Domestic Tour Firm Years of Operations ....................................................... 42
Figure 4. 4 Domestic Tour Firm’s Number of Employees ............................................... 42
Figure 4. 5 Form of Business ............................................................................................. 43
Figure 4. 6 Respondents Role in the Tour Firm................................................................ 44
Figure 4. 7 : Respondents Work Experience ..................................................................... 44
xv
LIST OF ABBREVIATIONS AND ACRONYMS
AI Artificial Intelligence
COVID Corona Virus Disease
CRM Customer Relationship Management
GDP Gross Domestic Product
IBM International Business Management
ICT Information and Communication Technology
IRB Internal Review Board
KATA Kenya Association of Travel Agents
KATO Kenya Association of Travel Operators
KTB Kenya Tourism Board
NACOSTI National Commission for Science, Technology and Innovation
PWC Price Waterhouse Coopers
RBT Resource Based Theory
SPSS Statistical Package for the Social Science
UK United Kingdom
UNCTAD United Nations Conference on Trade and Development
UNWTO United Nations World Trade Organization
USD United States Dollars
VUCA Volatility, Uncertainty, Complexity and Ambiguity

1
CHAPTER ONE
1.0 INTRODUCTION
1.1 Background of the Problem
Strategic marketing positioning is defined as a deeply stakeholder-oriented concept that
focuses on a company’s long-term vision for competitive advantage and value-addition
through innovation (Jaakkola & Möller, 2019). The term strategic positioning is credited
to Michael Porter who first came up with the idea which informed the development of
competitive strategies in the early 1980s (Porter, 2017). Positioning strategy is defined as
the choice of target segments and the selection of differential advantage(s) used by a firm
to compete in strategy. The firms normally compete on one or more dimensions such as
innovation, quality, value and service (Butt & Kumar, 2017). Strategic marketing
positioning is a concept that is growing in importance in the wake of market turbulence. It
is applied in different industries for all kinds of corporate and product brands (Saqib,
2020).
An organization's unique strategic position influences strategic decision-making and
fosters strategic execution (Dimitrova, 2017). Corporates adopt a strategy to appeal to
consumer requirements and separate themselves from competitors that combines a unique
position with effective utilization of the firm's talents and resources. Various strategic
positioning pathways are open to organizations including pricing, diversification, and
digital transformation (McCormick, 2018). According to (Okeyo and Lewa, (2020), in the
competitive strategy the key is to identify a desired marketing position in the industry and
at that point, develop the capabilities and structure the activities of the firm to fit the
requirements of that position.
Positioning plays a crucial role in marketing strategies and this enables the organization
to mitigate the competitive pressure and to enhance performance (Riasat & Nisar, 2015).
A firm that establishes and sustains a distinctive place for itself and its offerings in the
market, is said to be successfully positioned. According to Johnson and Scholes (2005),
The impact of the external environment, internal resources, competences, and
expectations, as well as the influence of stakeholders on strategy, are all addressed in
strategic marketing positioning. A company's existing and future business environments
must be assessed, and its position must be aligned with its current strategy, taking internal

2
and external environmental elements into account. Toyota, one of the most successful
firms in the automobile sector, has used strategic marketing positioning to maintain its
global competitive advantage (Harnowo, 2015). It's a well-developed brand that caters to
a risk-averse and safety-conscious consumer, basing its identity on dependability and
technological innovation. With a diverse product line spanning from the Toyota Prado to
the Toyota Premio, they can appeal to a wide range of customers regardless of their
discretionary means. Toyota's primary positioning approach has been brand distinction
(Egessa, 2016).
Pricing strategy is important as a coping mechanism for dealing with both the severity of
competition and the size of the customer base. The company's pricing strategy should be
aligned with its strategic goals and aimed at increasing shareholder wealth. The business's
uniqueness, value-added services, operating costs, target market, and rival price all
influence pricing strategy. (McCormick, 2018). Among the seven Ps of marketing,
pricing is the determinant of the survival of an organisation but also rewards the factors of
production (Forbes et al., 2014).
Companies that strive to achieve high market share by producing products that are on
demand and offering them at competitive prices in the market are able to provide value
creation for their shareholders by ensuring continuous and sustainable value of growth
and shareholders return (Okeyo & Lewa, 2020). Any pricing strategy's worth is debatable
if it is incompatible with the company's overall strategy. The effects of pricing schemes
have significant managerial and policy ramifications. (Mokaya, Kanyagia & Wagoki,
2012). Similarly, Mukeshimana, Nkechi and Jefferson (2019), agreed that any pricing
strategy which does not reflect to the organizational goals is detrimental to its
performance. Through various positioning strategies such as differentiation, costing and
promotion, perceived quality of services as well as pricing strategy, IPPs’ performances
among tour organizations in Kenya are able to improve (Mukeshimana et al., 2019).
Pricing strategies have a significant effect on cost strategies, perceived services quality,
innovation and organizational performance (Riasat & Nisar, 2015). Diversification of
products and services can also be explored to set a company distinct from competitors
with similar offerings. It gives the company a distinct identity and sets it apart from its
3
competition. Diversification might mean entering a new market or providing altogether
new products or services to improve consumer satisfaction. This promotes organizational
growth because it entails the creation of new items and the entry into a new market area.
Product and market diversity can also be employed in times of market decline and to
create new technology competences (Tussyadiah, 2020).
The idea of a digital transformation arises from the blending of personal and corporate IT
environments and encapsulates the transformational effect of new digital technologies
such as social, mobile, analytics, cloud and the Internet of Things (SMACIT) (Ismail,
Khater and Zaki, 2017). Domestic tour companies may embrace digital transformation by
employing artificial intelligence to engage with present and potential consumers.
(Tussyadiah, 2020). A new global world economy, characterized by dynamism,
customization and intense competition, is developing and the cornerstones for succeeding
in it involve embedding knowledge, technology and innovation into products and services
(Ismail et al., 2017). Organizations must aim at providing satisfaction to customers if they
hope to stay afloat the tide of globalization in technology innovations, competitiveness
and customer demands (Kimutai, 2015).
Today, a digital strategy is much more, because digital technologies and connectivity are
fundamentally transforming traditional business strategies into modular and cross-
functional global strategies that enable business processes to be established beyond the
boundaries of time, distance or function (Becker & Schmid, 2020). It can also be utilized
to create an internet presence for the operator so that they can advertise their services on
Google, Instagram, or Facebook, which is a superior strategy given the large number of
prospective clients online (Nuseir, 2020). Moreover, the importance of collaboration
between marketing and R&D services can be emphasized, since new products are more
successful if based on both technology use and consumer information (Jaakkola &
Möller, 2019).
At the microeconomic level the digital transformation of marketing affects all aspects of
the domain of marketing including product/service configuration; pricing; distribution
and promotion activities while at the macroeconomic level the digital transformation
impact national competitiveness, labor markets, innovation, antitrust, taxation among
other factors (Gillpatrick, 2019). The implementation of positioning strategy may in the

4
short-term be uncomfortable as the company may be forced to abandon seemingly short-
term profitable venture. The effectiveness of the new positioning strategy determines
customer perception and the subsequent business accrued. Market analysis, competition
analysis, segment analysis, and internal company analysis all play important roles in
competitive strategy. (Mukeshimana, Nkechi, & Jefferson, 2019).
The innovation effectiveness at Toyota is a benchmark for competitors, yet Toyota is only
the third-highest spender in the auto industry (Egessa, 2016). As a result, through
technological innovation, the company has been able to set itself apart from its
competitors. According to Pratap (2018), the production of hybrid cars like the Toyota
Prius, as well as the development of electrified cars and autonomous vehicles, has helped
Toyota establish a competitive advantage in the worldwide market.
Shoprite Holdings is South Africa's largest grocery chain, with 1,844 stores as of June
2019, including Shoprite, Checkers, Checkers Hyper, Usave, Hungry Lion, and Liquor
Shop (Market Screener, 2019). Shoprite has used a low pricing strategy as a stimulus for
growth in order to beat the competition and position itself strategically. Shoprite has
succeeded to maintain market leadership by keeping up with developing markets,
investing in retail modernisation, and leveraging possibilities in the region, according to
Dai, Cantor, and Montabon (2017), who performed a study on the methods used by
supermarkets in South Africa. They came to the conclusion that the group's various
investments, as well as their flexibility in allocating resources, had a positive impact. This
has increased their consumer base in both South Africa and the 14 African nations where
they operate, allowing them to increase their sales volume and profitability.
The 21st Century is characterised by turbulence that has been summed up by four
descriptors: volatility, uncertainty, complexity and ambiguity (Dhillon & Nguyen, 2021).
Driving the now often referred to as ‘VUCA world’, are natural and man-made
environmental factors such as ecological disasters, technological disruptions, competition
intensity, societal pressures, and market saturation just to mention but a few (Hamati &
Govenda, 2020; Raghuramapatruni & Kosuri, 2017). For example, technological
upheaval has ushered forth a digital revolution (Nadkarni & Prugl, 2021). Banking,
shipping, insurance, and telecommunications are just a few of the industries that have
embraced technology and moved to computerized systems. Resultant changes and
5
disruptions in the business ecosystems occasioned by environmental turbulence have
significant implications on strategic positioning across most business sectors (Abrantes,
2020).
One of the sectors where the VUCA phenomenon is challenging organizational
effectiveness is the tourism sector which is continuing to undergo various stages of
transformation that have been observed by some scholars as dramatic (Chang, McAleer,
& Ramos, 2020; Epuran, Tescasiu, Tecau, Ivasciuc, & Candrea, 2020). For instance, a
2020 publication by the World Tourism Federation (2021) reported that the combined
domestic and international tourist arrivals dropped by 40.8 percent and revenue fell by
68.7 percent and tourism within a year, occasioning the sharpest decline in tourism since
World War II due to the COVID 19 pandemic.
They further estimate that the pandemic will lead to a loss of $3.3 trillion globally, equal
to 4.2% of the world gross domestic product if the pandemic continues for 12 months.
Additionally, technological advances and globalisation, have in turn intensified
competition; a company in Asia can outsell a company in South Africa within the local
market. As pressure increases, and the environment becomes more complex and
turbulent, creative companies adopt innovative survival tactics. On the other hand, the
less innovative companies’ peers fizzle off the market, even as their space is either
occupied by the better resourced existing companies or new agile entrants out entrants.
Furthermore, the tour industry has seen massive transformations as a result of the digital
disruption that has impacted every element of the sector, transforming the travel and
tourism industries into daring early adopters of digital transformation. (IOETI, 2020).
How can domestic tour operators build effective tactics to help them maintain
productivity and remain at the forefront in a VUCA world? This is a question that every
domestic tour company should consider as they work toward their current and future
goals. In the long run, a company that effectively overcomes environmental turbulence
and enhances its competitive potential can raise profitability, expand market share,
improve client contentment, improve its industry image, and enjoy organizational
sustainability (Penc-Petrzak, 2014).

6
Strategic positioning is a marketing and communication strategy that can significantly
improve the appeal of a tourist attraction or other point of interest (Muthama & Ndeto,
2020). Cerovic and Batic (2008) suggested that a tourist enterprise's market position is
determined by its total perception and expertise of all comparable tourist qualities such as
requirements, requests, and behaviour. With the tourism market saturated with
participants selling similar destination products and services, domestic tour operators
must identify a niche market where specific customer needs have not been met and tap
into that market, as well as revamp their product offerings to make them inimitable and
unique in the current market of operations.
There have been studies undertaken on the worldwide front to explore how strategic
positioning has been implemented in the tourism business. Saqib (2019) did research in
Kashmir, India, to develop a tourist destination's positioning strategy based on customer
perceptions and satisfaction. She discovered that there are four niche markets in Kashmir
that need be targeted for effective positioning: nature or environment, adventure and
exploration, cultural discovery, and gastronomic. Diversification in the tourism industry
offers a wide variety of options which when optimised, can ensure continued survival for
domestic tour operators. The need for diversification as a strategy is amplified by
disintermediation resulting from digitization and the internet. Disintermediation gives an
opportunity for firms to horizontally occupy other areas hitherto it was not operating in.
Wei (2016) recounted that before internet, the tourism industry was linearly reorganised
suppliers, intermediaries and consumers. With the advent of internet these three
components have taken a new shape; from the suppliers’ perspective, the internet has led
to more flexibility and convenience, global reach, real time accessibility and reduced
operational activities and the accompanying cost. Additionally, the internet has led to
disintermediation or reduced the number of intermediaries, making it possible for
suppliers to sell directly to consumers. In terms of marketing and competition internet has
reduced the world into a global village. Consumers are able to access information at the
touch of a bottom. This means that consumers are able to access real time information, for
comparison between the various service providers; marketers are able to send
personalised information to prospective customers more affordably (De Carlos, Araujo, &
Fraiz, 2016).

7
Tourism has seen a tremendous boost around the world since the war ended a few years
ago. Roser (2017) examined figures based on foreign tourist arrivals worldwide from the
United Nations World Tourism Organization's records, which revealed a phenomenal 56-
fold rise in international arrivals per year, from 25 million in 1950 to 1.4 billion in 2017.
Tour companies have had a significant impact on the growth and development of global
tourism. This is the case because they are in charge of consumer interaction, which has a
significant impact on consumer purchasing decisions, conducting research and identifying
suitable destinations based on customer needs and requirements, as well as raising
customer awareness through promotions and tourism advertising.
Tourism continues to be one of Africa's most important economic industries. Before the
COVID-19 pandemic, international visitor arrivals increased by 4% between January and
June 2019 compared to the same time in 2018, with Africa contributing for 3% of this
increase, which is considered moderate (UNWTO, 2019). Tourism is one of the world's
largest and fastest-growing industries, according to the United Nations Conference on
Trade and Development (UNCTAD), which identified it as one of the world's largest and
fastest-growing industries as a result of increased interaction between countries and the
development of foreign direct investments and e-commerce.
As the tourism business develops, new difficulties emerge that highlight the need of
strategic positioning. The Covid-19 pandemic wreaked havoc on the tourism industry,
with government-imposed quarantines and international travel bans. According to the
United Nations World Tourism Organization (2020), international travel fell by 70%
between January and August 2020, compared to the same time in 2019, due to worldwide
travel restrictions imposed to combat the ongoing Covid-19 epidemic.
In the tourism industry, tour operators would like to realise profit while tourists would
like to see value for the money charged for the service rendered. As noted by Forbes et
al., (2014) most African countries targets international markets so that their pricing is
beyond the reach of most of the local tourist. With the current global challenges including
terrorism, and in the Kenyan context, election related violence, and other security issues
and global pandemics like Covid 19, global competition, the flow of international tourist
is not guaranteed. As a result, domestic tour operators need to revaluate their pricing as a

8
tool for strategic positioning to attract the low cadre tourist, especially local tourist. The
internet has cut off or reduced the number of intermediaries in the tourist sector.
Kenya's tourism industry is one of the country's most important economic drivers,
accounting for 8.8% of the country's GDP in 2018 and valued USD 7.9 billion (Ministry
of Tourism and Wildlife, 2020). Domestic tourism, in particular, contributes a significant
portion of the GDP. The ministry went on to say that international tourists accounted for
71.2 percent of all tourism activities in 2018, while domestic travellers increased from
2,948,000 in 2014 to 4,559,000 in 2018. Tour operators play an important role in creating
and maintaining international relationships that arise as a result of international travel,
which has boosted the country's foreign profits through expanding the shared economy.
There are two industry associations that play a key role in promoting tourism industry in
Kenya. These are: Kenya Association of Tour Operators (KATO) and Kenya Association
of Travel Agents (KATA). KATO is an umbrella organisation representing over 400 tour
operators in Kenya. Their main objective is to promote Kenya as a tourist destination.
KATO is also a vehicle which members use to lobby for their interest with the
government and other bodies. Additionally, the association is also involved in the
marketing of tourism products on behalf of its members (KATO, 2021). Both associations
provide linkages and networking opportunities which their members can exploit for
business. In comparison, while KATO markets tourist products and link their customers
with other service providers, KATA ensures that tourist travel in a safe and conducive
environment (KATA, 2021).
At the policy front, domestic tourism has recently been recognized by the Government of
Kenya as an important tourism sub-sector with potential to contribute to the economy and
national development. This came in the wake of Covid-19 pandemic which triggered a
commissioning of research by the National Tourism Crisis Management under the
Ministry of Tourism and Wildlife (2020). The research, which explored domestic tourism
recovery strategies for Kenya acknowledged the need for a holistic enabling environment
for exploitation of the market potential for domestic tourism.
Several reports found on tourism websites claim that the Kenya Tourism Board and the
Domestic Tourism Council of Kenya's marketing strategies target premium customers,
9
ignoring the majority of Kenyans who are low- and middle-income earners, who, if taken
into account, could significantly improve domestic tourism in Kenya. Security concerns,
irreparable damage to tourist-drawing attractions, deterioration of habitats and wildlife
corridors, and overcrowding of famous tourist spots have all hampered the development
of Kenya's tourism business (World Bank, 2017) and following a drop in the number of
local tourists, these concerns have filtered down to domestic travel companies, restricting
their growth and development.
According to Metz, Ilies and Nistor (2020), every organization strives to be effective
towards achieving organizational goals. However, there is no specific way of articulating
the meaning or measurement of organizational effectiveness. In the context of tourism,
organizational effectiveness can be defined as a company's capacity to meet its goals
within a given time frame while making efficient use of its resources to satisfy customers.
Customer happiness is the most important indication of organizational effectiveness in the
tourism business. Profitability, overall success, sometimes known as performance,
competitive advantage, and sustainability are the remaining indicators.
1.2 Statement of the Problem
At a time when the international tour markets are confronted by severe environmental
disruptions, the domestic tourism market offers the next growth frontier for the
effectiveness of tour operators that are strategically positioned. This needs to be
supported by evidence-based data to inform strategic decision making. However, an
assessment of the trends, initiatives and practices in Kenya’s domestic tourism undertaken
by Kihima (2015) lamented lack of data on domestic tourism, a situation attributed to
immaturity and stagnation of the subsector. The study observed that the domestic tourism
sub-sector lagged behind many other sectors in terms of research and knowledge
production. This perspective is shared by Kwoba (2018) who took note of a large share of
investment in tourism research being directed towards international tourism, leaving
domestic tour sub-sector opaque.
Tourism is one of the leading foreign exchange earners and creates enormous
employment opportunities for Kenyan people, revenue base and thus, a decline of tourists
must be a cause of concern. (Kikemu, 2017). Tourism being the third largest foreign

10
exchange earner after tea and horticulture at 23% but Kenya spends relatively less on
tourism marketing (Sindiga, 2005). Similarly, Osiako (2021) in his study reports that
financial constraints and insufficient tourism knowledge, and scarcity of tourism
programs and packages were cited in the Kenya National Tourism Policy of 2015 as the
main reasons why most Kenyan nationals shun tourism.
Studies previously undertaken among tour and travel operators explored various
environmental factors influencing performance of the sector (Kamau, 2015; Ndope, 2015;
Muthama & Ndeto, 2020). In a study to determine how travel agencies in Nairobi County
responded to internet evolution, Kamau (2015) discovered that the main challenges travel
agencies faced included client loss due to disintermediation, a lack of government
support, a lack of ICT expertise, and the cost of dealing with internet dynamism. Going
online, customer relationship management, product diversity, and ongoing staff training
were the primary coping competitive tactics implemented, she said.
Ndope (2015) conducted a study in Kenya to examine the impact of global environmental
turbulence on tour operators and found that travel advisories issued by tourism-producing
countries had the greatest impact on tour operator performance, followed by country risk
factors and industry forces to a lesser extent. She proposed a coping strategy in which
Kenyan tour operators collaborated and formed strategic partnerships with other
participants in the industry, as well as working with the government to design and
implement foreign policies that would help lessen travel advisories against the country.
Muthama and Ndeto (2020) did a study to examine the impact of technological
advancements on Kenya's tourist sector's strategic positioning and found that it had a
substantial impact. They advocated for the use of computerized technologies in the
tourism industry to speed up and improve decision-making, streamline internal business
processes, and boost operational efficiency. Organizations that develop a multifaceted
interpretative capability are able to perceive complex environmental patterns in order to
develop and implement effective solutions for their organizations (Neill & Rose, 2018).
The three studies provide a reference point for understanding the environmental dynamics
of the tourism industry in Kenya. The studies, on the other hand, present a limited
empirical evaluation of the implementation and influence of strategic marketing

11
positioning on successful organizational performance of Kenyan domestic tour operators.
The current study aims to close a knowledge gap by investigating the effects of digital
transformation, price, and diversification aspects of strategic market positioning on
successful organizational performance of Kenyan domestic tour operators.
1.3 General Objective
The general objective of this study was to assess the effect of strategic marketing
positioning on Kenyan domestic tour operators' effective organizational performance.
1.4 Specific Objectives
1.4.1 To assess the effect of digital transformation on Kenyan domestic tour operators'
effective organizational performance.
1.4.2 To examine the effect of pricing on the effective organizational performance of
Kenyan domestic tour operators.
1.4.3 To identify the effect of diversification on the effective organizational
performance of Kenyan domestic tour operators.
1.5 Significance of the Study
1.5.1 Domestic Tour Operators
The conclusions of this study will provide the finest strategic positioning approaches for
domestic tour operators in Kenya, which they can apply to their present and new business
models, ensuring further expansion, development, and productivity. Domestic tour
companies will be able to put together favourable all-inclusive trip packages for domestic
travellers and market them. Also, because tourists have so many options, domestic tour
operators will use this research information to frequently combine numerous tourism
components into an all-inclusive package that they can sell to travellers within the
country's borders.
1.5.2 The National Government of Kenya
With the constant establishment of national government parastatals, state corporations,
and overall development of the public sector, the national government of Kenya can
greatly benefit from this study. By gaining information on various strategic positioning,
the government officers will make use of practices and learning specific skills on how to

12
implement them into these institutions to ensure performance improvement and proper
policy formulation. Also, this research study will offer the recommendations which will
help the government involvement in tourism development help in the enhancement of the
production and provision of tourism products to the wide range of stakeholders in this
industry.
1.5.3 Researchers and Academics
This research and its findings will add to what is already known about strategic
positioning and how it affects organizational growth and development in Kenya. It will
take a different path based on the domestic tour business, while also giving useful
information. Scholars will find this information beneficial in furthering academic study in
the topic, as well as providing a platform for recommendation and critique in order to
bridge knowledge gaps.
1.6 Scope of the Study
The study's target demographic included 193 Kenya Association of Tour Operators-
accredited domestic tour operators, based in Nairobi County, Kenya. A total of 130
domestic tour operators were chosen as the focus group, with top managers and
supervisors being the focus group. These groups were divided into five focus groups. The
research was carried out in the months of July and August 2021, and data was gathered by
use of questionnaires. The study used a descriptive research design and descriptive
statistics in its data analysis, which was done using SPSS. The respondents for this study
were limited to domestic tour operators in Nairobi County when, they should have
included tour operators in other parts of the country. Due to the financial constraints
imposed by the study budget and available resources, this was not possible. Another
limitation revealed during the investigation was that due to the COVID 19 pandemic,
movement between counties was prohibited. To overcome this issue, we used technology
to ensure the research's success, using Google forms and the use of social media sites like
WhatsApp.

13
1.7 Definition of Terms
1.7.1 Strategic Positioning
A company's strategic positioning include identifying the position of its brand and
corporate image in a specific market, as well as the types of benefits to emphasize and the
types of segments to target (Douglas & Craig, 2005).
1.7.2 Domestic Tour Operator
A domestic tour operator is an organization or platform that assembles and sells all-
inclusive trip packages to domestic travellers within their own country (Darboe, 2019).
1.7.3 Domestic Tourism
Domestic tourism is defined as travel within a country by residents of that country
without crossing international boundaries at any entry points (Choo, 2015).
1.7.4 Sustainable Competitive Advantage
When a company implements a value-creating strategy that is not being applied by any
existing or potential competitors, it gains a sustainable competitive advantage
(O’Shannassy, 2008).
1.7.5 Customer Satisfaction
Customer satisfaction is a general assessment of a company's products or services in
terms of whether their pre-determined expectations are reached (Khadka, & Maharjan.
2017).
1.7.6 Diversification
Diversification is a strategy used by businesses to change their business trajectory by
generating new goods or growing into new markets on their own or in partnership with
another company (Su & Tsang, 2015).
1.7.7 Organizational Effectiveness
Organizational effectiveness is described as a term that measures an organization's
efficiency in achieving its goals with limited resources and without putting undue burden
on its people (Bhasin, 2020).
1.7.8 Organizational Performance
Organizational performance refers to the performance of a company as compared to its
goals and objectives. In other words, organizational performance is the actual results or
output of an organization as measured against that organization’s intended outputs
(Bashaer & Singh, 2016).

14
1.7.9 Digital Transformation
Digital transformation is defined as the use of digital technologies to impact an
organization externally, with a focus on digitally enhancing the customer experience,
internally, affecting business operations, and holistically, where all business segments and
functions are affected (Ismail et al., 2017).
1.7.10 Diversification
Diversification is defined as a business strategy to develop new markets with new
products, and is taken when the company develops to a certain stage for longer
development and more profit (Le, 2019).
1.8 Chapter Summary
The context of the study of strategic market positioning as it applies to tourism was
examined in this chapter. This research study discussed how to run a successful
organization and established Kenya's tourism profile on a worldwide and regional basis.
A discussion on the problems faced in domestic tourism and various studies conducted on
the travel and tourism sector, defined the knowledge gap, and properly articulated the
general and specific objectives of this study, highlighting coping strategies that have been
used to address these challenges, before moving on to the statement of the problem. Also,
this research study evaluated the study's importance and identified who would benefit
from it, as well as the study's scope, before concluding with the definition of several
crucial terminologies. The literature review will be covered in Chapter 2, and research
technique will be covered in Chapter 3. The findings are summarized in Chapter 4 based
on the specific objectives, and the study's conclusions and recommendations are
presented in Chapter 5.

15
CHAPTER TWO
2.0 LITERATURE REVIEW
2.1 Introduction
This chapter reviews existing conceptual, theoretical and empirical literature on strategic
positioning in relation to organizational effectiveness. The literature review is presented
in line with the specific objectives. The first section reviews literature on the effect of
digital transformation on the organizational effectiveness of domestic tour operators. The
second section comprises a critical review of the effect of pricing on organizational
effectiveness of domestic tour operators. The final portion examines the impact of
diversification on domestic tour operators' organizational effectiveness.
2.2 The Effect of Digital Transformation on Effective Organizational Performance
of Domestic Tour Operators
Vial (2019) described digital transformation as the process in which digital technologies
create disruption triggering strategic responses from organisations which seek to alter
their value creation path. Three terms standout in this definition and are all relevant to the
modern business environment: disruption, triggering and responses. This definition
implies that digital transformation will lead into new ways of doing business. Digital
disruption is initiated by an organisational desire to do business in a more cost-effective
way, even as it builds customer loyalty and trust by providing superior and innovative,
personalised integrated customer service (Gillpatrick, 2019). Advances in information
technology and the global transition from the analogue to the digital era have proven to be
a challenge, since domestic tour companies face extinction because of the travellers’
capacity to plan and organize their own excursions over the internet (Suominen, 2017).
Organizations have adopted digital transformation as one of the most prominent
managerial ways to achieving successful organizational performance in recent years.
PWC, for example, has taken a digital approach to organizational performance,
emphasizing organizational agility, a forward-thinking culture, and the use of virtual
models to optimize the companies’ health Digital transformation is a multi-step, ongoing
process rather than a one-time event. This idea was backed by Ziyadin, Suieubayeva, and
Utegenova (2020), who defined it as the process through which businesses encounter
multiple new digital innovations that have been upgraded with a global network, through

16
modifying numerous business measurements and affecting persons and organizational
systems, with the goal of gaining predominant execution and managed upper hand.
The fundamental and most important goal of digital transformation is to better satisfy the
demands of customers (Melo, 2019) by introducing technology into corporate operations,
increasing automation, and improving customer interactions. Digital transformation, in
addition to assuring customer happiness, accelerates organizational growth and increases
the likelihood of profitability, and is now considered a priority in corporate expansion,
whether through localization or new market entry (Becker & Schmid, 2020).
2.2.1 Artificial Intelligence and Effective Organizational Performance
Artificial intelligence (AI) is a term which insinuates the utilisation of computer to model
intelligent behaviour with minimal human intervention (Hamet & Trembley, 2019).
Artificial intelligence, a term originally coined by John McCarthy in 1955, is said to have
started with the innovation of robots (Hamet & Trembley, 2019). Like other industries,
suppliers in the tourism industry have started to adopt AI in their operations. Tussyadiah
(2020) gave an example of KLM Royal Dutch Airlines which introduced a robot named
Care-E, an intelligent self-driving trolley which helps passengers haul their luggage to the
gate. This is in addition to android robot called Spenser to help guide passengers within
Amsterdam Airport. Other examples include the Henn na Hotel which employs robots to
manage its reception cloakroom, robot porters, and in-house personal assistants
(Tussyadiah, 2020). These developments in AI can boost customer satisfaction and
efficiency in the domestic tour operator market.
Information technology has been viewed as a major disruptor in major sectors, changing
corporate processes and typical organizational operations over time. The shift from
manual operations to automation and the use of machines to undertake daily
organizational functions has had a significant impact on organizational productivity,
efficiency, and effectiveness (Kikemu, 2017). Artificial intelligence, which is a result of
information technology, is defined as the application of technical activities aimed at
recreating human cognitive skills to achieve goals autonomously while taking into
account any limits (Haenlein & Kaplan, 2019).
17
Artificial Intelligence (AI) has grown at an unparalleled rate in recent years, progressing
from just ideas and theoretical research to a real-world and practical subject. Nurton
(2019) backed up this claim by pointing to a change away from theoretical research and
toward the deployment of AI technologies in commercial products and services, as seen
by a drop in the ratio of scientific articles to inventions from 8:1 in 2010 to 3:1 in 2016.
The change underlines the world's move to the digital era, which promotes efficiency and
ease of operation. Unlike other developing technologies, AI research began in 1956,
which made it simpler for the ideology to materialize because various intellectuals and
researchers had studied and projected how AI will be absorbed into society.
To be effective, AI technology relies significantly on machine learning, which allows
robots to learn from their experiences and change their responses, accordingly, essentially
enabling robots to learn and behave like people (Wattanajantra, 2019). It usually entails
mimicking a human's ability to think and act in a certain way. Machine learning, a form
of artificial intelligence, can be used in the service business to create customer portraits
based on customer attributes, email spam filtering, credit risk analysis, and fraud
detection. (Amalina, Suhaimi & Abas, 2020).
The IBM (2018) study was used by Daqar and Smoudy (2019) to suggest three areas in
which AI can improve customer experience. They claimed that AI gives a clear
understanding of consumer wants and aids in the identification of appropriate
communication channels to engage customers; it also improves customer interactions
through the application of market strategy, and it improves workflow efficiency and
effectiveness, by allowing marketers more time to build strategies and be more creative in
order to achieve greater results (Sindiga, 2005).
Interactions with customers are growing more sophisticated as AI technologies progress.
According to Galitsky (2020), artificial intelligence builds a strong CRM by speaking
with consumers, delivering requested information, completing transactions, and
addressing difficulties by creating a systematic method of determining a customer's
mood. Determine when to deliver a complete answer, a recommendation, an explanation,
a proper argument, timely advice, and promotion or compensation based on their
intentions and attitudes. As a result, the consumer experience improves and becomes
more enjoyable.

18
Organizations are turning to artificial intelligence (AI) for customer support, and this,
combined with human intervention, boosts efficiency. According to Hopkinson, Perez-
Vega, and Singhal (2018), AI will be used to supplement existing customer relationship
technologies and approaches rather than to completely replace human engagement.
However, because some machine learning systems may learn to recognize human
emotions through training, it would be a mistake to believe that AI is exclusively capable
of dealing with impersonal interactions (Brynjolfsson & Mcafee, 2017).
2.2.2 Digital Presence and Effective Organizational Performance
While artificial intelligence has ushered in a sea change in the service business, digital
presence has grown in importance over the last decade, not only in the social scene with
human interactions but also in organizational platforms. Cruz and Karatzas (2019) define
digital presence as the sum of all online activity maintained by a company (including
websites, blogs, and social media accounts), as well as online activities conducted by
stakeholders such as employees and customers. Banner (2018) took an in-depth look at
digital presence, highlighting key areas such as digital marketing, digital product/service
experience, e-commerce, and social media presence, based on the assumption that a firm
already has a website.
Digital marketing is a type of digital strategy that focuses on leveraging digital
technology to attract, engage, and convert customers online. It is tactical and operational
in nature (Kapoor, 2020). It takes advantage of technology's efficiency and offers a
marketing strategy that is distinct from traditional marketing. Blogs have been
successfully employed as digital marketing tools to generate sales income, especially for
products and services where current and potential customers may read reviews. Also,
Consumers leave comments on their personal experiences, and businesses have used these
online reviews as part of their entire marketing plan (Ismail et al., 2017).
Customers' experiences with digital channels such as websites and apps to acquire access
to a product or service are referred to as digital product/service experience. Customer
purchase behaviour is frequently influenced by their online/digital experience. This is
evaluated by the platforms' accessibility, efficiency, and convenience. According to Lich
(2020), a consumer's digital experience is considered exceptional if it provides a rapid,
19
responsive, and frictionless experience for customers as they switch between channels on
their way to become clients.
Electronic commerce, also known as e-commerce, is the activity of buying and selling
products over the internet or through online services using technologies such as mobile
commerce, electronic funds transfer, supply chain management, internet marketing,
online transaction processing, electronic data interchange, inventory management
systems, and automated data collection systems (Kidane & Sharma, 2016). According to
Harbison (2021), an efficient e-commerce strategy must promote profitable growth by
expanding customer reach, lowering cost-to-serve, and creating differentiated consumer
experiences.
The great majority of people on the planet have integrated social media into their daily
lives. Forward-thinking businesses have also ridden the social media wave, leveraging the
potential consumer base on these platforms to market their goods and services. (Jaakkola
& Möller, 2019). Despite being a relatively new phenomenon, social media has proven to
be as effective as, if not more effective than, traditional marketing (Oyza & Edwin, 2015).
With the exceptional example of Facebook, social media has allowed businesses to
engage with millions of people about their products and services, as well as create new
marketing opportunities on the internet (Bala & Verma, 2018). Organizations can use
social media to obtain data on current market trends and fads, technical breakthroughs,
and current customer tastes and preferences, and then adjust their strategy to match the
market narrative. According to Parveen, Jaafar, and Ainin (2016), social media platforms
like as Instagram, Facebook, and Twitter are utilized to improve access to information
about potential customers as well as competitors, their activities, tactics, and brand
sentiments.
2.3 The Effect of Pricing on Effective Organisational Performance
Pricing is the only revenue marketing element which generates revenue (Kienzler, &
Kowalkowski, 2017). It therefore goes without saying that a sound pricing strategy is
required to facilitate the customer value creation. The price of a product or service has a
direct impact on consumer purchasing decisions (Mokaya et al., 2012). It has an impact
on a potential customer's willingness and ability to buy a goods. Managers should ensure
that prices for products and services are aligned with the organization's goals in order to
increase profitability and customer satisfaction. as two of the most important factors of

20
organizational effectiveness (Ismail et al., 2017). However, because of the change from a
barter economy to a money-based market system, as well as the consequences of greater
competition as a result of globalization, the use of pricing strategies to achieve
organizational objectives has become more pronounced and complex in today's world
(Agbaeze, Chiemeke, Ogbo, & Ukpere, 2020).
Monroe (2003) stated that pricing decisions are critical since they influence not only a
company's profitability and returns, but also its market competitiveness. Furthermore, the
pricing strategy is a critical component in financial modelling, as it impacts the revenues
generated, profits obtained, and funds reinvested in the firm's long-term survival
(Sammut-Bonnici & Channon, 2015). Increased demand for products and services is
considerably aided by effective pricing. Various techniques have been devised and tested
in order to generate product demand by enticing customers based on price, however the
primary subject of what customers’ value most is what they will really pay for a product,
as opposed to what they claim they will pay for a product (All Answers, 2019).
The sort of pricing strategy that an organization chooses will be determined by the goal
that the pricing strategy is aiming to achieve, such as profitability, sales volume, or
maintaining the status quo in the industry (Cant, Wiid, & Sephapo, 2016). The difference
between conventional and strategic price setting is that strategic price setting involves
setting prices in response to current market conditions and the ability to manage them
proactively, with the sole purpose of generating more value for customers while avoiding
the obligation of increasing the business' sales volume (Nagle & Holden, 2004). This
necessitates the organization conducting frequent internal and external environmental
scanning in order to analyse the constantly changing market temperature and adapt the
utilization of organizational resources to suit these changes.
According to Kotler and Armstrong (2012), there are three basic tactics used by managers
inside firms when establishing how pricing is set strategically. This notion was originated
from Ohmae (1986), who proposed the 3Cs model in his book "The Mind of a Strategist,"
in which he claimed that a successful pricing strategy must prioritize the Corporation, the
Customer, and the Competition. Each of the three factors contributes to the achievement
of an organization's goals in its own way.
21
The three main pricing techniques utilized today are cost-based pricing, competition-
based pricing, and customer value-based pricing, which are all based on Ohmae's 3C's
model. Internal cost-based pricing, which represents the first C, corporation, is decided by
the operations of the business. Competition-based and value-based pricing, on the other
hand, are both produced because of a review of external circumstances, rival price, and
the consumers' perception of the products and services' value (Le, 2019). The 3Cs concept
aims to inspire firms to provide greater value to their consumers at a lower cost to
establish and maintain competitive advantage by highlighting the trap of being stuck
between companies that emphasize costs and those who emphasize difference (User,
2015).
2.3.1 Competition-based Pricing and Effective Organizational Performance
Competition-based pricing is a strategic approach that entails analysing the price
structures of competitors who sell similar products or services and using that information
as the foundation for developing the company's own strategy (Campbell, 2020). This is an
outward-looking approach because it allows the company to price its products and
services in line with market trends and customer expectations without considering
operating expenses or demand. Businesses that operate in a highly saturated industry
benefit from competition-based pricing because they can set prices that are somewhat
below or slightly above the competition is likely to be a determining factor for customers
(Decker, 2021).
Chapman (2020) offered an example of pricing based on competitors He discovers
business A, which creates specialized sales enablement software for marketers. If a
competitor enters the market with a similar product priced at $39.99, firm A can
strategically price theirs at $34.99, offering prospective customers equivalent or better
quality at a lower price, hence expanding their customer base (Chapman, 2020). A lower
pricing strategy compared to the competition allows an organization to benefit from
economies of scale, produce in bulk, and reduce production costs; a high pricing strategy
is used for luxury goods, where customers are less concerned with the price and are more
concerned with the quality of the products or services as well as the brand reputation.
When delivering better quality products or a unique buying experience, matching the
pricing of competitors offering the same or very comparable products is a strong tactic for
attracting more customers. (Carillo, 2019).

22
There are drawbacks to using competition price as a standard for pricing strategy.
Competitors can utilize strategic and tactical planning to reduce their production costs,
allowing them to lower product pricing (Kucheriavy, 2019). If a company with
comparatively greater production and operating costs tries to match a competitor's price,
it risks having very narrow margins or, worse, losing money. Diamantopoulos (2005)
claims that competition-based price reduction methods in which corporations seek to
increase sales volume might induce competitors to decrease their prices, promoting price
wars and predatory competition, resulting in lower profit margins and profitability in
enterprises with a lesser market share.
“Trying to be ‘competitive' by offering ‘competitive' rates,” Kucheriavy (2019) stated.
You don't want to be known as a "consultant for hire." You want to be the ‘best-in-class
in your field.” This means that a competitive pricing strategy should consider more than
just competitors' prices; it should also include cost and consumer demands for more
affordable pricing, as a result, the brand, profitability, and customer relationship are all
bolstered (Ziehrock & Zhang, 2019).
Digital transformation has had implications on competition-based pricing. According to
Van Rensburg (2014), there are various opportunities that accrue to tour operators that
embrace the digital age and harness the potential of information and communication
technologies. For instance, an examination of tour operator’s positioning strategies and
their impact on price was conducted by Picazo and Moreno-Gil (2018). The study
sampled published information in Spain, Egypt, Turkey, Malta and Cyprus. Results
showed that having Wi-Fi significantly increased price by up to 6.4% compared to tour
operators without Wi-Fi (Picazo & Moreno-Gil, 2018).
2.3.2 Cost-based Pricing and Effective Organizational Performance
Cost-based pricing is the most popular and preferred type of pricing by companies due to
its simplicity, ease of application, and concrete character, as compared to the other two
pricing techniques, which are abstract in nature (Gillpatrick, 2019). According to Leijon
(2017), cost-based pricing is based on the fact that the complete expenses of business
operations, including but not limited to production costs and selling and distribution costs,
must be paid, and that the business's intended profit margin must be fulfilled on top of
those costs. Dai et al. (2017) agreed, stating that the sales revenue is established first, then

23
the unit and total expenses are computed, the company's profit objectives are checked,
and finally the prices are set.
Vu, et al., (2018) conducted a cost-based pricing study on Vietnamese field mills and
discovered that the magnitude of the enterprise, market share, amount of impact on
setting the selling price, and cost information are the primary criteria that decide the
usage of cost-based pricing. In a study of 187 companies in the UK and 90 enterprises in
Australia, Guilding, Drury, and Tayles (2005) agreed with the authors to some extent.
They came to the conclusion that cost-based pricing is influenced by three key elements
(i) High levels of competition can result in reduced margins as a result of the drive to
match or undercut competitor prices, putting a premium on cost information; ii) Larger
organizations are more likely to function as price setters because they are key participants
in the sector; as a result, they will have more reason to use cost information when
determining pricing for their products and services; iii) Companies in the service sector
value cost-based pricing more because of service differentiation, which makes them price
setters, as well as traceable labor expenses per unit (Guilding, Drury & Tayles,2005).
As beneficial as cost-based pricing is, businesses have demonstrated the inefficiency that
it brings with it. According to Dholakia (2018), cost-based pricing is inconsistent and
inhibits cost reduction because the lower the cost, the lower the revenue, resulting in a
lower total profit, and vice versa. Companies struggle to maintain steady budgets or
predictions as a result of these swings, restricting organizational advancement.
Furthermore, under cost-based pricing, because fixed overhead expenses are factored into
pricing calculations, it will be hard to lower prices to boost sales when resource
utilization is low, e.g., electricity, leading in a loss of profit, sales, or both (Burton, &
Holden, 2019). Finally, cost-based pricing posits that buyers determine the price they are
willing to pay for a product or service based on manufacturing or operational costs. This
utterly ignores the value that customers seek in products and services, as well as the fact
that they are unconcerned with manufacturing costs. More discipline in cost-based
processes can result in extremely quick results (Liozu, 2020).
2.3.3 Customer Value-Based Pricing and Effective Organizational Performance
The key determinant of purchasing decisions is consumer perception. The price a
consumer is willing to pay for a product or service is largely determined by the benefit
they stand to earn from purchasing and using it. This leads to the concept of value-based

24
pricing (Ingenbleek, 2007). Value-based pricing is defined as the extent to which a
corporation uses information on the perceived relative advantages that it delivers and how
customers will trade off these benefits against price in the process of determining price.
Value-based pricing is the most important of the three pricing strategies since it focuses
on the needs and expectations of customers, resulting in enhanced customer loyalty and
value creation. In terms of value generation, value-based pricing (Ivarsson & Moller,
2020) is the polar opposite of cost-based pricing (Ivarsson & Moller, 2020), as shown in
figure 2.1.
Figure 2.1 Alternative Approaches to Value Creation
Source: Nagle, Hogen and Zale (2011).
Addressing consumer requirements allows organizations to charge the best price for their
products while also improving organizational performance (Ostewalder et al. 2014).
Despite the pricing strategy's credibility, only 17 to 20% of companies reported to have
used value-based pricing between 2008 and 2013 (Hinterhuber, 2008; Liozu &
Hinterhuber, 2013). According to Liozu (2017), however, awareness of it is growing, as is
the desire to shift away from cost-based and competition-based pricing to a more
customer-value-centric pricing approach.
Subjectivity refers to how customers value the same product differently and everyone has
an individual and distinct vision of the product. Pricing approaches that prioritize
customer perceived value must cope with this issue (Morris, 1987). According to Kienzler
(2017), this difference of opinion among customers implies the separation of distinct
value perceptions and the re-grouping of comparable ideologies; hence, subjectivity needs
and exacerbates segmentation. When it comes to clients' perceived value and preference,

25
there's also the issue of uncertainty. Companies must be aware that consumer value might
fluctuate over time, according to Nagle, Hogen, and Zale (2011). As a result, because
customer value is an external component that has a direct impact on price, pricing should
be flexible enough to adjust in response to changes in customer value (Ivarrson & Moller,
2020).
Customers want differentiated products adapted to their specific needs and preferences,
rather than standardised items, in today's culture (Olve, Cöster, Iveroth, Petri, &
Westelius, 2013). In this sense, value-based pricing has the benefit of allowing businesses
to create and change their products or services to satisfy the individual needs of their
clients. According to Kuhn (2020), organizations may discover what people are ready to
pay for additional features or services through research and then incorporate them into
their projects and product packages to assure customer happiness and build consumer
loyalty.
2.4 The Effect of Diversification on Effective Organizational Performance on
Domestic Tour Operators
Companies have begun to diversify their activities in order to manage risks as a result of
technological advancements and an increasingly competitive environment (Le, 2019).
Companies employ diversification as a strategic management technique to boost their
performance. It is, according to Ansoff (1957), the "father of strategic management," the
introduction into new markets with new products. Several researchers, however, have
proposed diverse approaches to the concept of diversification based on this foundation.
Diversification, according to Penrose (1959), occurs when corporations create new items
that are significantly distinct from those already produced but not fully abandoning
existing product lines. Despite this comprehensive approach, it appears to rely solely on
new product entry, leaving new market entry out.
“Diversification is a strategy performed by a company's top executives that comprises
entering new products into new markets and achieving above average returns by taking
advantage of incoming possibilities in order to accomplish corporate growth,” according
to another definition of diversification (Mizre & Ulgen, 2004). Dai et al. (2017)
conducted a study on corporate diversification and concluded that companies diversify
when they conduct new operations that are related to the original operations while
working with limited resources. They also found that organizations whose new activities

26
were related to the original activities performed better than those whose activities were
unrelated. His strategy focuses modifying or collaborating with existing operations.
According to Oladimeji and Udosen (2019), the Research Based Theory (RBT) enables a
company to harness and leverage its inner capabilities through diversification in order to
gain a competitive advantage. He emphasizes that all firms have various untapped
resources with potential that enable them to outperform industry competitors when the
resources are effectively consolidated. In a similar study on RBT, Chen and Yu (2011)
found that exploitation of skills through diversity boosted economic returns. Increased
economic returns derive from a company's economies of size and scope as a result of
increasing the efficiency with which these strategic resources are used (Contractor,
Kundu, & Hsu, 2002).
Diversification strategies can be motivated by synergies, resource sharing, risk reduction,
market power, and growth, all of which encourage regional and worldwide market share
expansion (Sahni & Juhari, 2019). Firms diversify, according to Milano (2017), when
they have extra money that can't be put back into the existing business with a decent
return on reinvestment, or when they're overly reliant on one product or a set of
customers, which could lead to disastrous competition-related effects. Diversification also
has an important role in wealth creation of firms in emerging markets, according to
Sentiato (2020).
The levels and types of diversification can be used to evaluate a diversification plan. We
have related and unrelated diversification techniques under levels of diversification,
which fall on a relatedness continuum and are decided by the interrelatedness of the
businesses in the company's portfolio (Wiersema & Beck, 2017). The forms of
diversification are the more essential of the two, as they incorporate the relatedness of the
diversification strategies. These are product-market entrance decisions, according to Dhir
& Dhir (2015), and these strategies might be horizontal, vertical, concentric, or
conglomerate.
2.4.1 Horizontal Integration and Effective Organizational Performance
The integration strategy, which is a fusion of multiple corporate entities running or
capable of operating separately for the manufacture of market products, derives from the
ability to implement similar goals, procedures, or tasks, is one of the most widely

27
employed alternatives for company development (Kudelko, Wirth, Bachowski, & Gacek,
2015). Integration can occur in both horizontal and vertical directions, resulting in the
distinction of horizontal and vertical integration.
Horizontal integration, according to Bruno (2012), occurs when a company operates in
many industries or branches of the same industry while remaining at the same level of the
production chain. Tarver (2019) uses the acquisition of Instagram by Facebook in 2012
for a reported $1 billion as a more recent and clear example of horizontal integration. He
hinted that the integration was horizontal in nature because both firms operate in the same
market, namely social media, and they were in comparable stages of development when it
came to their photo-sharing services.
Dinc (2010) suggested that horizontal integration most typically takes the form of
mergers and acquisitions, based on the example provided. An acquisition is the whole or
partial purchase of another firm, whereas a merger is the uniting of two similar sized
separate companies to form a single organization (Ngaru, 2016). Horizontal mergers
occur in industries and markets when products are in the mature stages of the product life
cycle (Adeleke, Odebeatu, & Adeoye, 2018) and where the business model of the product
needs to be extended. Increased market strength and revenue growth are the primary
drivers of value creation in horizontal mergers, which can be realized through revenue
enhancement, cost reductions, and new growth opportunities (Kumar, 2015).
Companies also employ horizontal integration, such as acquisitions or mergers, to enter
untapped markets where the other business has consumer equity. As a result, it's used to
grow the company's customer base (Millenaar, 2016). It can also be used to buy the
products and assets of the other organization. The parent company's goal in most
acquisitions is to purchase the smaller company's intellectual property in order to expand
their asset portfolio. When a company operates in a growing industry, competitors lack
capabilities, competencies, skills, or resources that the company already has, the strategy
would result in a government-approved monopoly, economies of scale would be
significant, and the company has sufficient resources to ensure a smooth merger or
acquisition, horizontal integration may be an effective strategy (Jurevicius, 2013).
Some organizations, on the other hand, use a horizontal integration plan with malicious
purpose, putting the other entity's survival or business portfolio in jeopardy. According to

28
Millenaar (2016), horizontal integration generates a variety of hazards because it might be
driven by value-destroying causes such as a company's desire to distribute risks,
managerial ambitions that compete with one another, and. that have a conflict of interest
and are a reaction to a market downturn. In addition to these potential dangers, when an
organization grows and gets more complex, its ability to change organizational methods
in response to environmental turbulence is harmed (Riasat & Nisar, 2015). This adds to
the bureaucracy and inhibits creativity and innovation, thereby slowing down
development.
2.4.2 Vertical Integration and Effective Organizational Performance
Vertical integration is the process of a corporation owning and controlling two or more
supply chain stages (Teece, 2018). In vertical integration, Lanfontaine and Slade (2007)
separated ownership and control rights, emphasizing that ownership is joint and control
rights are inlying, whereas both are separate in a market transaction. Firms can vertically
integrate into different directions of their supply chain, covering different lengths across
the value chain, by developing new assets or acquiring them (Claici, Basalisco, De
Michiel, Okholm, & Maier, 2020).
Forward integration, according to Sraders (2018), occurs when a corporation eliminates
middlemen and takes control of its distribution networks in order to provide items directly
to customers, i.e., extending forward to deliver products to customers. Forward
integration helps the manufacturer to better monitor and regulate its retail price, allowing
it to better adapt to changes in demand (Lin, Parlaktürk, & Swaminathan, 2014). This is
especially useful in a volatile market where customer tastes and preferences vary
frequently. Forward integration is also used by businesses to gain and retain market
control over how their products are presented to their target markets. They take the effort
to present products and services in a way that appeals to current demand through
successful marketing methods (Kimutai, 2015).
Backward integration, on the other hand, occurs when a corporation goes backward in its
supply chain and takes control of or acquires the company that supplies the items or
services needed for production, with the goal of enhancing efficiency (Anapoorna, 2021).
Backward integration is a cost-cutting tool. Transport costs, operational expenses, and
any additional costs imposed by the provider are reduced, resulting in enhanced
29
efficiency. According to Hansman, Hjort, León, and Teachout (2020), organizations
vertically integrate to generate higher-quality products, and the rationale for this appears
to be that integration alters supplier behavior in a way that improves output quality. As a
result, a company's competitiveness improves, and its bottom line improves (Musungu,
2020).
2.4.3 Concentric Diversification and Effective Organizational Performance
To appeal to new groups of clients, concentric diversification entails adding new items or
services that have technological and/or marketing synergy with the existing product or
service line (Adeleke et al., 2018). Due to the relationship that is maintained between the
old firm and the new venture, some scholars refer to concentric diversification as related
diversification. Concentric diversification occurs when a company branches out into a
similar business, according to Marangu, Oyagi, and Gongera (2014). It's a big plan that
entails the running of a second company that benefits from the firm's core strengths
(Pearce & Robinson, 2010). A tour operator creating a passenger bus shuttle business for
synergistic purposes instead of contracting transport firms is one example of concentric
diversification.
Concentric diversification is a strategy that allows the organization to fully exploit its
original expertise, proprietary talents, and marketing channels while posing a low risk of
merger due to relatedness (Le, 2019). It also leads to growth, which is based on a
combination of current strengths and the company's varied earnings as a consequence of
improved strengths and reduced weaknesses (Ndung'u, 2019). Concentric diversification
entails tapping into a distinct but connected industry, which broadens the organizational
business portfolio and allows for growth (Okeyo & Lewa, 2020). Furthermore, it enables
the organization to broaden its customer base by catering to a variety of markets, resulting
in increased profitability. Because it entails branching out to start a new firm, this method
is considered high risk; nevertheless, proper implementation of the concentric
diversification strategy will ensure that the advantages outweigh the potential dangers
(Ndung'u, 2019).
2.4.4 Conglomerate Diversification and Effective Organizational Performance
Conglomerate diversification is a strategy that ignores product/market synergies with
existing firms in favor of operating in businesses with distinct goods or markets with the

30
primary goal of increasing overall profitability, flexibility, and top management authority
(Adeleke et al., 2018). Conglomerate diversification is also used by organizations to assist
organizational expansion and to tap into new prospects that may be missing in their
existing line of business. One of the key motivations for conglomerate diversification,
according to Picone (2011), is "conglomerate power," which allows for cross-
subsidization among enterprises and can thus support predatory pricing strategy.
Marlboro is an example of a corporation that has effectively used conglomerate
diversification. They began as a cigarette company before branching out into the Formula
One racing realm, which is an entirely different market. Conglomerate diversification is
the riskiest method because it necessitates the corporation entering a new market and
selling items or services to a new customer base (CFI, 2020).
There are few success examples, and many businesses avoid conglomerate diversification
since it necessitates a strong brand identity, a vast pool of resources, and a large financial
base to offset the high costs of entry associated with this type of expansion. To be
considered effective and lucrative, organizations must also be equipped with the essential
skill sets to conduct efficient environmental surveillance of the potential market and
produce appropriate plans that are in line with the level of turbulence (Butt & Kumar,
2017).
2.4.5 Disintermediation Strategy and Effective Organizational Performance
Disintermediation is a strategy which involves the removal of middlemen or
intermediaries in the supply chain (Munikrishman, Imm, Ann, & Yusof, 2019). It occurs
when buyers and sellers connect with each other and consummate the transaction without
reference to third parties. The third parties play the role of aggregating supply and
or/demand, matching buyers and sellers, facilitating transaction and establishing trust
(Tad, 2021). Disintermediation therefore helps the seller to reduce coordination and
transaction of the buyers (Tad, 2021).
Munikrishnan et al. (2019) investigated how small medium traditional travel agencies
respond to disintermediation due to emergence of virtual travel agencies, as it relates to
the adoption of ICT into their business operation. They found that despite earlier resistant,
all travel agencies responded positively to the changes and had overcome by embracing
ICT for sustainability and growth. The study shows adoption of ICT, especially with
advanced adopters which imbedded more integrated applications, with features used

31
include intranet/extranet to collaborate with other members in the industry; electronic
integration to transform the entire business model, enabled the traditional travel agencies
to compete beyond their borders with more profitability (Munikrishnan et al.2019).
Duygun, Hashem and Tanda (2021) studied the opportunities brought about by Fin Tech
technology which continues to profoundly transform the traditional intermediation
channels. Through Fin Tech technology, new currencies like Bitcoin, and
cryptocurrencies have emerged. Other banking products which have been affected by Fin
Tech technology include lending and asset management. The study noted that new
entrants in the banking sector and technologies are massively changing the baking system
from a silo mentality to a more collaborative approach. The same study in Germany
revealed that banks are willing to collaborate with Fin Tech technologies to bring value to
their customers. However, they have not fully embraced the new technology because of
their different ICT infrastructures (Duygun, Hashem &Tanda, 2021). Again, the proposal
of cryptocurrency and bitcoin as currencies created worries to the top managers.
2.5 Chapter Summary
The three specific research objectives were covered in this chapter's literature review.
This included strategic positioning components such as digital transformation, pricing
strategies, and diversification, as well as the impact that each has on the organizational
success of Kenyan domestic tour operators. Each of these factors has been examined in
greater depth, shedding insight on the many sub-dimensions and how they interact to
generate strategic posture. The research methodology is described in depth in the
following chapter.
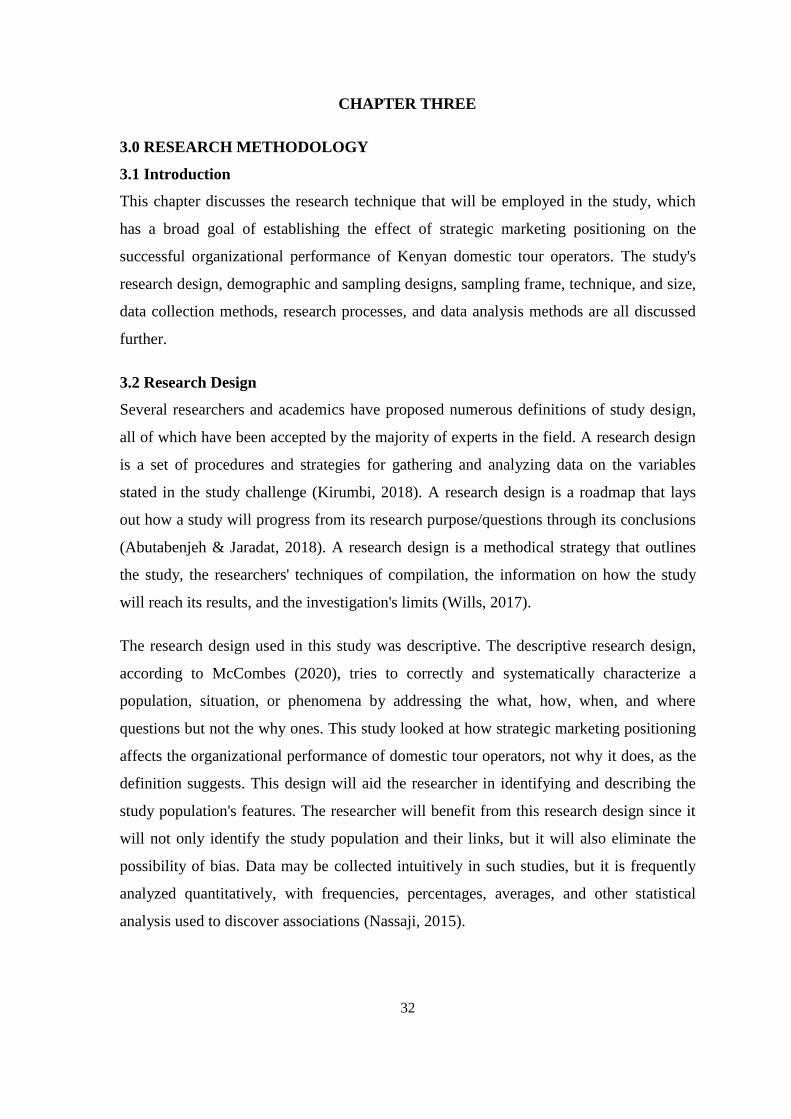
32
CHAPTER THREE
3.0 RESEARCH METHODOLOGY
3.1 Introduction
This chapter discusses the research technique that will be employed in the study, which
has a broad goal of establishing the effect of strategic marketing positioning on the
successful organizational performance of Kenyan domestic tour operators. The study's
research design, demographic and sampling designs, sampling frame, technique, and size,
data collection methods, research processes, and data analysis methods are all discussed
further.
3.2 Research Design
Several researchers and academics have proposed numerous definitions of study design,
all of which have been accepted by the majority of experts in the field. A research design
is a set of procedures and strategies for gathering and analyzing data on the variables
stated in the study challenge (Kirumbi, 2018). A research design is a roadmap that lays
out how a study will progress from its research purpose/questions through its conclusions
(Abutabenjeh & Jaradat, 2018). A research design is a methodical strategy that outlines
the study, the researchers' techniques of compilation, the information on how the study
will reach its results, and the investigation's limits (Wills, 2017).
The research design used in this study was descriptive. The descriptive research design,
according to McCombes (2020), tries to correctly and systematically characterize a
population, situation, or phenomena by addressing the what, how, when, and where
questions but not the why ones. This study looked at how strategic marketing positioning
affects the organizational performance of domestic tour operators, not why it does, as the
definition suggests. This design will aid the researcher in identifying and describing the
study population's features. The researcher will benefit from this research design since it
will not only identify the study population and their links, but it will also eliminate the
possibility of bias. Data may be collected intuitively in such studies, but it is frequently
analyzed quantitatively, with frequencies, percentages, averages, and other statistical
analysis used to discover associations (Nassaji, 2015).

33
3.3 Population and Sampling Design
3.3.1 Population
The population from which data is obtained is a crucial aspect of a study that can have a
significant impact on its validity. Several meanings of the term population are available,
each of which sheds additional light on its significance. A target population, according to
Vonk (2017), is a group of people to whom the researchers want their research findings to
apply. A population, according to Kenton (2020), is an observation of persons clustered
together by a shared trait. A population, according to Bhandari (2020), is a complete
group of individuals, things, events, organizations, countries, species, or animals about
whom the researcher wishes to make conclusions.
The study's target demographic was 193 Kenya Association of Tour Operators-accredited
domestic tour operators (Kenya Association of Tour Operators, 2019). These were
divided into five groups: A, B, C, D and E. Category A Category A businesses are
allowed to deal with lodging establishments. Restaurant and food and beverage services
fall within category B, Travel agencies, balloon operators, local air charters, tourist
service vehicle hire, water sports and boat excursions are all included in Category C.
Game fishing outfitters, businesses that rent out camps and camping equipment, nature
parks, natural reserves, nature trails, game ranches, amusement parks, and non-citizen
tour leaders/guides fall within category D. Local boat operators, professional safari
photographers, curio sellers, and beach operators are included in Category E, as are
private zoos, citizen tour leaders/guides, general merchants, and beach operators. Table
3.1 summarizes the population distribution.
Table 3. 1 : Population Distribution
Types of Domestic Tour
Operators
Number of
Population
Percentage of
Population
1 Category A 30 16%
2 Category B 38 20%
3 Category C 39 20%
4 Category D 41 21%
5 Category E 45 23%
193 100%
Source: Kenya Association of Tour Operators (2019)

34
3.3.2 Sampling Design
A sample is a subset of a population segment that is chosen using a variety of approaches
to make the data gathering process easier for the researcher. The strategies and methods
to be followed in selecting a sample from the target population, as well as the estimate
approach used for computing sample statistics, are referred to as a sample design (Kabir,
2016). A sample design, according to Sisay (2016), is the technique or procedure used by
the researcher to pick objects for the sample. The sample design has three components: a
sampling frame, sampling techniques, and sample size determination.
3.3.2.1 Sampling Frame
Rahi (2017) defined a sampling frame as a frame from which a sample of the target
population can be drawn. It's also a list of real-life cases from which the sample will be
taken, and it serves as a representative of the population (Taherdoost, 2016). “A sampling
frame is the actual list of sampling units from which the sample, or some stage of the
sample, is collected,” Ali (2018) explains. The phrase "list" appears more frequently in
definitions, and describing the many elements of the population will aid the researcher in
narrowing down the results. The membership list of domestic tour operators as reported
by the KATO serves as the sampling frame for this research.
3.3.2.2 Sampling Techniques
The researcher must follow a certain procedure and technique for choosing the
appropriate sample for data collection and analysis. The best sample is one whose
characteristics can be extrapolated to the study's target population. The study's objective
was to use stratified sampling to accomplish this. This is a sampling strategy that
separates the population into homogeneous sub-populations first (Taherdoost, 2016). Sub-
populations have qualities in common that set them apart from other sub-population
groups (Emerson, 2015). This is required in order to ensure that the study population is
well-represented (Sahu, 2013).
As a result, even though all the tour operators came from the same environment, they
were in different places. As a result, the population of this research study was separated
into several unique categories. After all, when used on large samples, stratified sampling
produces a more reliable approach with lower levels of bias and error probability

35
(Kothari, 2004). Domestic tour operators were divided into five categories, or strata, in
this example Categories A, B, C, D, and E, from which specific items were chosen at
random.
3.3.2.3 Sample Size
Sample size refers to a small share of the population that is studied in order to draw
conclusions about the whole population (Taherdoost, 2016). The sample size has a
significant impact on the accuracy of the data collected and the inferences made about the
population. To minimize Type 1 or Type 2 mistakes caused by selecting extremely small
or large sample sizes, it is vital to calculate the appropriate sample size for the study using
the population provided. The most suitable sample size for our population of 193
domestic tour operators, according to Yamane (1967) would be 130 participants from all
five categories.
Yamane (1967) established the following method for determining sample size,
Where:
n is the sample size
N is the population size
e is the margin of error (in this case, we will take it to be 5%)
𝑛 =193
1 + 193( 0.05)2
This formula yields a number that is 130, which is similar to Qualtrics' online sample size
calculator. Thus, the total sample was 130 domestic tour operators. This was further sub-
divided into the five categories. The sample size per stratum was determined using the
following formula:
Sample size per stratum = Stratum population x Total sample
Total population
The output of this exercise was summarized in Table 3.2 below which presented the
sample size distribution. As presented in the table, the sample size comprised of 20 tour

36
operators in Category A, 26 tour operators in Category B, 26 tour operators in Category
C, 28 tour operators in Category D and 30 tour operators in category E.
Table 3. 2 : Sample Size Distribution
Strata Population Sample Size Percent
Category A 30 20 15%
Category B 38 26 20%
Category C 39 26 20%
Category D 41 28 22%
Category E 45 30 23%
Total 193 130 100%
Source: Author (2021)
3.4 Data Collection Methods
Data collection, according to Kabir (2016), is the process of acquiring and measuring
information on variables of interest in a systematic manner that allows one to answer
research questions, test hypotheses, and assess outcomes. The top managers and
supervisors of the 130-sample size of domestic tour companies in Kenya were
interviewed for this study. For data gathering, questionnaires were distributed. They were
preferred in this study because questionnaires allow for the collection of both subjective
and objective data from a large sample of the study population in order to obtain
statistically significant results, which is especially important when resources are limited,
and participants have privacy concerns (Taherdoost, 2016).
The questionnaire entailed structured questions which included both open-ended and
close-ended questions which were divided into four sections, and thereafter telephone
follow up calls on the respondents were undertaken by the analyst. The first section
contained demographic questions, while the second, third and fourth section contained
closed ended questions based on the specific objectives on digital transformation, pricing
and diversification respectively. The accompanying questionnaire included both open-
ended and closed-ended questions, as well as a five-point Likert scale system that was
used to evaluate responses.
37
3.5 Research Procedures
The investigation began with a request for permission to perform the study from United
States International University. Following that, authorization from accredited tour
operators was sought for the collecting of primary data. This allowed the researcher to
obtain the sample frame based on the study's specifications. Finally, registration was
completed with the National Commission for Science, Technology, and Innovation
(NACOSTI), which gives a permission allowing one to do research. Finally,
appointments with respondents were set up, and Google Form questions were distributed
via e-mail and telephone discussions.
In terms of instrument reliability, pre-tests were used to evaluate the reliability and
validity of the measurement instrument chosen. Initially, a request letter was issued to the
organizations involved, together with a data protection disclaimer insuring the responders'
anonymity. Once approved, the participants' email addresses were forwarded to the
companies' human resources departments. The questionnaires were delivered to the
participants by e-mail and took two weeks to respond before receiving an automatic
reminder. The findings of the pre-test were then evaluated using the Statistical Program
for Social Sciences (SPSS) to see whether the items in each of the independent variables
were internally consistent. Cronbach’s alpha test was run and a coefficient of 0.944 gave
an assurance of reliability.
3.6 Data Analysis
The data was coded and entered the Statistical Package for Social Sciences (SPSS)
software before it can be analysed. Following that, the data was coded and entered the
statistical program for social sciences (SPSS) to determine the results. The quantitative
data was analysed using descriptive and inferential statistics supplied by IBM® SPSS®
Statistics to obtain the requisite frequencies and percentages, which was then interpreted
to answer the specific objectives. Inferential analysis to be used included correlations and
regressions between the various independent variable factors namely the three dimensions
of strategic marketing positioning (digital transformation, pricing, and diversification)
and organizational Performance. Finally, the findings of the research study were shown
by use of statistical tables and figures and a multiple linear regression analysis was
performed on the dataset using the following general linear model:
38
OrgEff=β0 + β1xDigTra + β2xPriStra + β3xDivStra + e
Where; OrgEff = Organizational Performance
β0 = Organizational Performance Intercept
DigTra = Digital Transformation
PriStra = Pricing Strategy
DivStra = Diversification Strategy
β1-3 = Regression Coefficients
e = Standard error
3.7 Chapter Summary
In summary, this chapter covered study design, population, sampling design, sample size,
sampling technique, sampling frame, data collecting, research procedures, and data
analysis. The researcher specified descriptive research as the design chosen. Data was
collected from a sample of 130 participants drawn from a population of 193 domestic tour
operators using a stratified random sampling technique. Data was collected via structured
questionnaires, which used the Likert-scale system of data response. Both descriptive and
inferential statistical techniques were applied to the data. The next Chapter 4 presents
study results and findings.

39
CHAPTER FOUR
4.0 RESULTS AND FINDINGS
4.1 Introduction
This chapter gives an overview of the results and findings based on the research’s specific
objectives. The findings on the effect that digital transformation has on effective
organizational performance of domestic tour operators in Kenya are tackled first.
Secondly, the findings on the examination of how pricing affects effective organizational
performance of domestic tour operators in Kenya are discussed, and thirdly, the influence
of diversification on effective organizational performance of domestic tour operators in
Kenya are presented.
4.2 Response Rate
The researcher had a sample size of 130 respondents who had been selected using the
stratified sampling technique. A total of 130 closed ended questionnaires were distributed
electronically through Google forms to the chosen respondents. Follow ups through
telephone calls, social media applications such as WhatsApp and email links, were able to
generate 100 questionnaires which were received back complete and were therefore used
for the analysis of the study. The incomplete ones and those that were not returned
accounted for 30 questionnaires. Research shows that as response rates increase, the risk
for bias decreases. It is assumed that the higher the response rate, the better the study,
which has led to the creation of heuristics, like the 60% rule, where establishing the
threshold for statistical significance at P⬍.05, the 60% response threshold is accepted by
some (Livingston & Wislar, 2016). In our research, therefore a response rate of 77% was
obtained which is within the required threshold as shown in Figure 4.1 below.
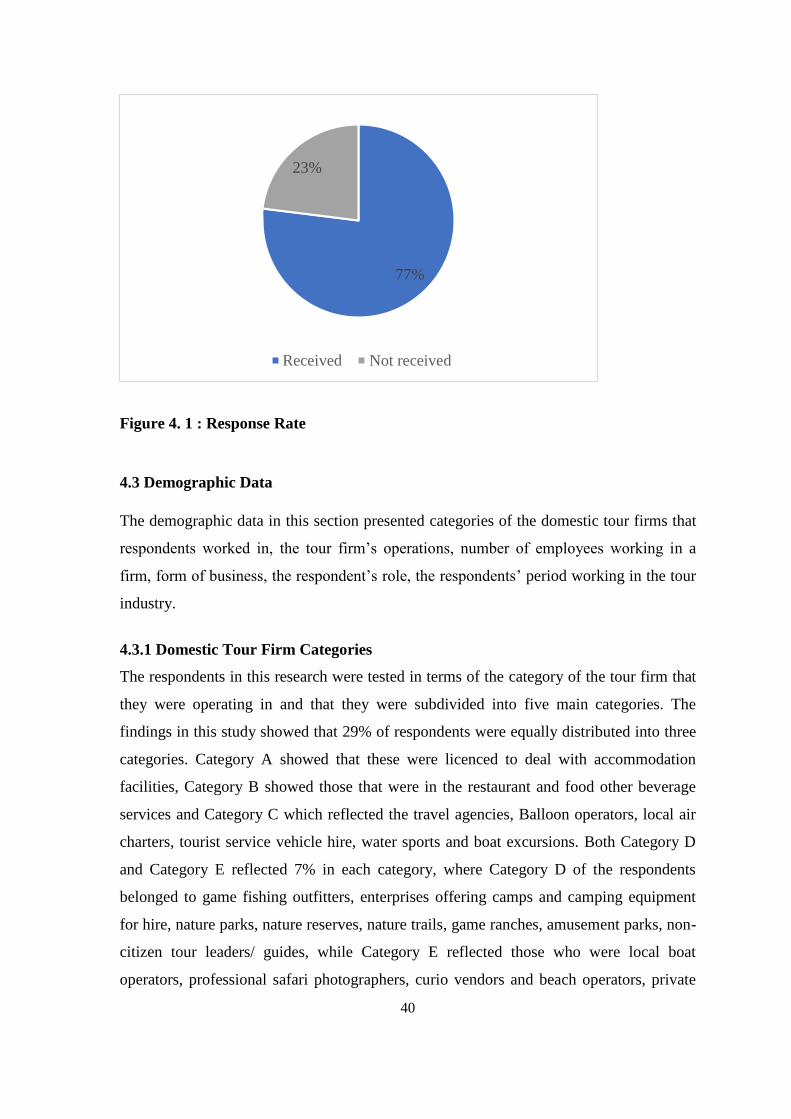
40
Figure 4. 1 : Response Rate
4.3 Demographic Data
The demographic data in this section presented categories of the domestic tour firms that
respondents worked in, the tour firm’s operations, number of employees working in a
firm, form of business, the respondent’s role, the respondents’ period working in the tour
industry.
4.3.1 Domestic Tour Firm Categories
The respondents in this research were tested in terms of the category of the tour firm that
they were operating in and that they were subdivided into five main categories. The
findings in this study showed that 29% of respondents were equally distributed into three
categories. Category A showed that these were licenced to deal with accommodation
facilities, Category B showed those that were in the restaurant and food other beverage
services and Category C which reflected the travel agencies, Balloon operators, local air
charters, tourist service vehicle hire, water sports and boat excursions. Both Category D
and Category E reflected 7% in each category, where Category D of the respondents
belonged to game fishing outfitters, enterprises offering camps and camping equipment
for hire, nature parks, nature reserves, nature trails, game ranches, amusement parks, non-
citizen tour leaders/ guides, while Category E reflected those who were local boat
operators, professional safari photographers, curio vendors and beach operators, private
77%
23%
Received Not received

41
zoos, citizen tour leaders/guides, general vendors, and beach operators . This showed that
the tour firms had a diverse categorical representation of the respondents as indicated in
Figure 4.2 below.
Figure 4. 2 : Domestic Tour Firm Categories
4.3.2 Domestic Tour Firm Years of Operations
The findings in this study showed that majority of the respondents agreed that their firms
had been in operation for more than 10 years at 43%, then closely followed by those who
agreed their firms had been in operation for a period of between 6-10 years at 36%, then
lastly those who agreed that their firms had been in operation for less than three years
were at 21 %, as indicated in Figure 4.3 below. This showed that there was a good
distribution of age among the target respondents.
29%
29%
29%
7%
7%
Category A : Accommodation facilities
Category B : Restaurant and food other beverage services
Category C : travel agencies
Category D : Nature Campings and Parks
Category E: Third party executioners. Eg curios and beach guides

42
Figure 4. 3 : Domestic Tour Firm Years of Operations
4.3.3 Domestic Tour Firm’s Number of Employees
The study findings regarding the respondent’s number of employees within their tour firm
showed that 36% of the firms had between 5-20 employees, then secondly, there was
equal distribution on the number of employees of firms which hired 21-50 employees as
well as 51-100 employees at 21% respectively, fourthly, it was found that firms that
employ less than 5 employees were at 14% while tour firms that employed more than 100
employees were at 7% as indicated in Figure 4.4 below. This showed that the respondents
had enough knowledge on the information being sought in this study.
Figure 4. 4 : Domestic Tour Firm’s Number of Employees
36%
21%
43%
6 to 10 years Less than 3 years More than 10 years
14%
36%
21% 21%
7%
0%
5%
10%
15%
20%
25%
30%
35%
40%
Less than 5
employees5 – 20
employees
21 – 50
employees
51 – 100
employees
More than 100
employees
Per
centa
ge
Number of Employees
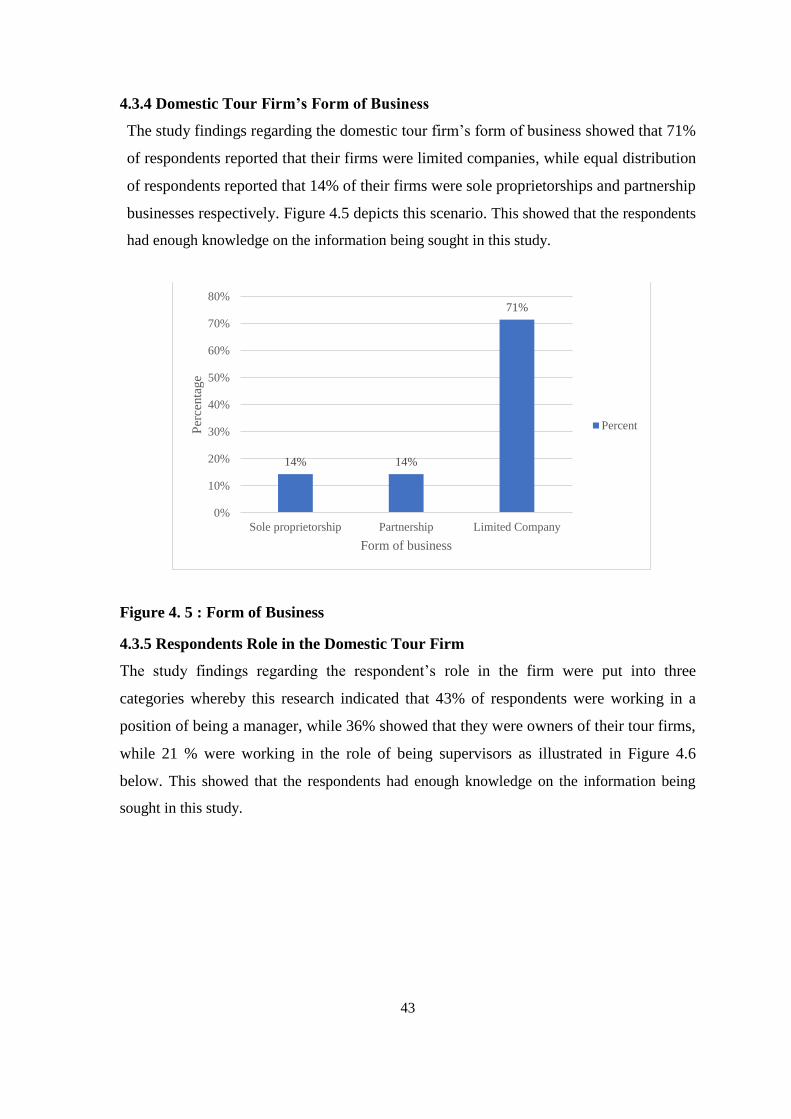
43
4.3.4 Domestic Tour Firm’s Form of Business
The study findings regarding the domestic tour firm’s form of business showed that 71%
of respondents reported that their firms were limited companies, while equal distribution
of respondents reported that 14% of their firms were sole proprietorships and partnership
businesses respectively. Figure 4.5 depicts this scenario. This showed that the respondents
had enough knowledge on the information being sought in this study.
Figure 4. 5 : Form of Business
4.3.5 Respondents Role in the Domestic Tour Firm
The study findings regarding the respondent’s role in the firm were put into three
categories whereby this research indicated that 43% of respondents were working in a
position of being a manager, while 36% showed that they were owners of their tour firms,
while 21 % were working in the role of being supervisors as illustrated in Figure 4.6
below. This showed that the respondents had enough knowledge on the information being
sought in this study.
14% 14%
71%
0%
10%
20%
30%
40%
50%
60%
70%
80%
Sole proprietorship Partnership Limited Company
Per
centa
ge
Form of business
Percent

44
Figure 4. 6 : Respondents Role in the Tour Firm
4.3.6 Respondents Work Experience
When respondents were asked to indicate the length of period that they had worked in
their tour firms, 43% showed that they had worked for a period of between 3-5 years,
36% indicated that they had worked for a period of more than 10 years, 14% showed that
they had worked for a period of between 6-10 years while 7% showed that they had
worked for a period of less than 3 years as shown in Figure 4.7. This showed that the
respondents had enough knowledge on the information being sought in this study.
Figure 4. 7 : Respondents Work Experience
4.4 Digital Transformation and Effective Organizational Performance
The first specific objective in this study was to determine whether digital transformation
influences effective organizational performance of domestic tour operators. The
43%
36%
21%
0%
10%
20%
30%
40%
50%
Manager Owner Supervisor
Per
cen
tage
Role in the Firm
43%
14%
7%
36%
0%
5%
10%
15%
20%
25%
30%
35%
40%
45%
50%
3 to 5 years 6 to 10 years Less than 3 years More than 10
years
Per
centa
ge
Work Experience
Series1

45
respondents were requested to give their honest views regarding digital transformation on
organizational performance. The questions were structured based on the assumption that
digital transformation has an influence on effective organizational performance as
indicated in table 4.1. The table gives an overview of the descriptive statistics that
revealed an overall mean of 3.85 and a standard deviation of 0.16. There was a 100%
response from all the respondents to these questions and from the data collected and
analyzed, the mean scores on most of the questions regarding service quality have been
found to be above 3.5. This analysis shows that most respondents agreed that cognitive
competencies enhance graduate employability in the job market. Planning in delivering
better customer services to clients had the highest mean score closely followed by ability
to work in interdisciplinary team enhances employee productivity and analytical thinking
being a critical component of mental activity that enables people to solve problems quickly and
effectively came third.
Table 4. 1: Descriptive Analysis for Digital Transformation And Effective
Organizational Performance
N Mean Std.
Deviation
My company has efficient delivery of new value
propositions through information technology-business
process integration
100 3.714 1.540
My company has an external information technology
linkage which is essential in launching and sustaining
its operational success.
100 3.357 1.336
Service-oriented portal function dimension, consisting
of portal maintenance service, B2B function, and cloud
computing, significantly influences my organizational
performance.
100 3.428 1.452
There is constant technological innovation to facilitate
increased access to my new customers 100 3.714 1.266
Using artificial intelligence in operations has increased
customer inflow in my organization. 100 3.285 1.325
Artificial intelligence reduces the waiting time for
service delivery to my clients. 100 3.357 1.336
From inception, I can say that artificial intelligence has
increased overall productivity of my organization. 100 3.285 1.204
My organization makes full use of the three main social
media platforms in its operations (Facebook, Instagram
and Twitter)
100 3.785 1.4233
My organization can fully conduct operations digitally
(online transactions, internet marketing, and customer
relationship management).
100 4.071 1.384
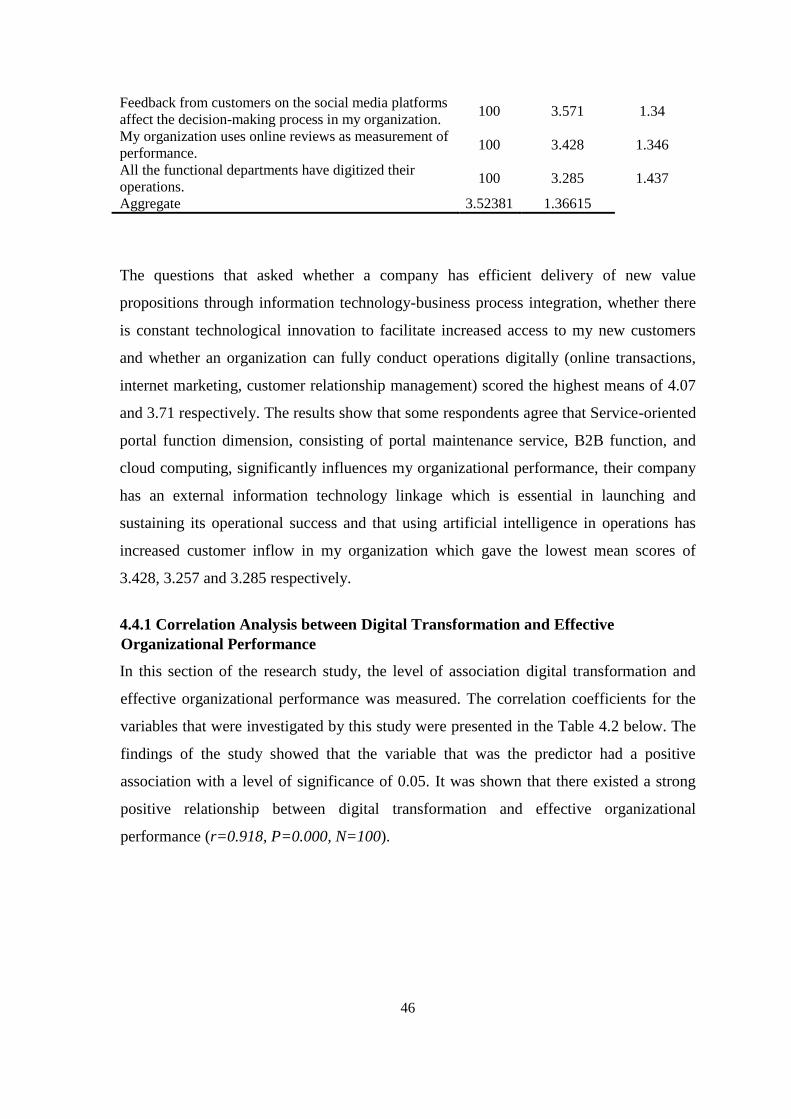
46
Feedback from customers on the social media platforms
affect the decision-making process in my organization. 100 3.571 1.34
My organization uses online reviews as measurement of
performance. 100 3.428 1.346
All the functional departments have digitized their
operations. 100 3.285 1.437
Aggregate 3.52381 1.36615
The questions that asked whether a company has efficient delivery of new value
propositions through information technology-business process integration, whether there
is constant technological innovation to facilitate increased access to my new customers
and whether an organization can fully conduct operations digitally (online transactions,
internet marketing, customer relationship management) scored the highest means of 4.07
and 3.71 respectively. The results show that some respondents agree that Service-oriented
portal function dimension, consisting of portal maintenance service, B2B function, and
cloud computing, significantly influences my organizational performance, their company
has an external information technology linkage which is essential in launching and
sustaining its operational success and that using artificial intelligence in operations has
increased customer inflow in my organization which gave the lowest mean scores of
3.428, 3.257 and 3.285 respectively.
4.4.1 Correlation Analysis between Digital Transformation and Effective
Organizational Performance
In this section of the research study, the level of association digital transformation and
effective organizational performance was measured. The correlation coefficients for the
variables that were investigated by this study were presented in the Table 4.2 below. The
findings of the study showed that the variable that was the predictor had a positive
association with a level of significance of 0.05. It was shown that there existed a strong
positive relationship between digital transformation and effective organizational
performance (r=0.918, P=0.000, N=100).

47
Table 4.2: Correlations Between Digital Transformation and Effective
Organizational Performance
Effective Organizational
Performance
Digital
Transformation
Effective Organizational
Performance
Pearson
Correlation 1 0.918
Sig. (2-tailed)
.000
N 100 100
Digital Transformation
Pearson
Correlation 0.906 1.000
Sig. (2-tailed) .000
N 100 100
** Correlation is significant at the 0.05 level (2-tailed).
4.5 Regression Test for Digital Transformation and Effective Organizational
Performance
4.5.1 Model Summary for Digital Transformation and Effective Organizational
Performance
Table 4.3 as shown below provides the model summary analysis on digital transformation
and effective organizational performance. From the analysis conducted, it was revealed
that the variation in percentage in the dependent variable being explained by any changes
in the independent variables R2 is equal to 0.792. This means that digital transformation
explained 79.2% of changes observed in effective organizational performance. The
remaining 20.8% is explained by other factors not considered in the study and the error
term.
Table 4.3: Model Summary for Digital Transformation and Effective Organizational
Performance
Model Summary
Model R R Square Adjusted R Square Std. Error of the Estimate
1 .89a .792 .820 .834
a. Predictors: (Constant), Digital Transformation.
b. Dependent Variable: Effective Organizational Performance
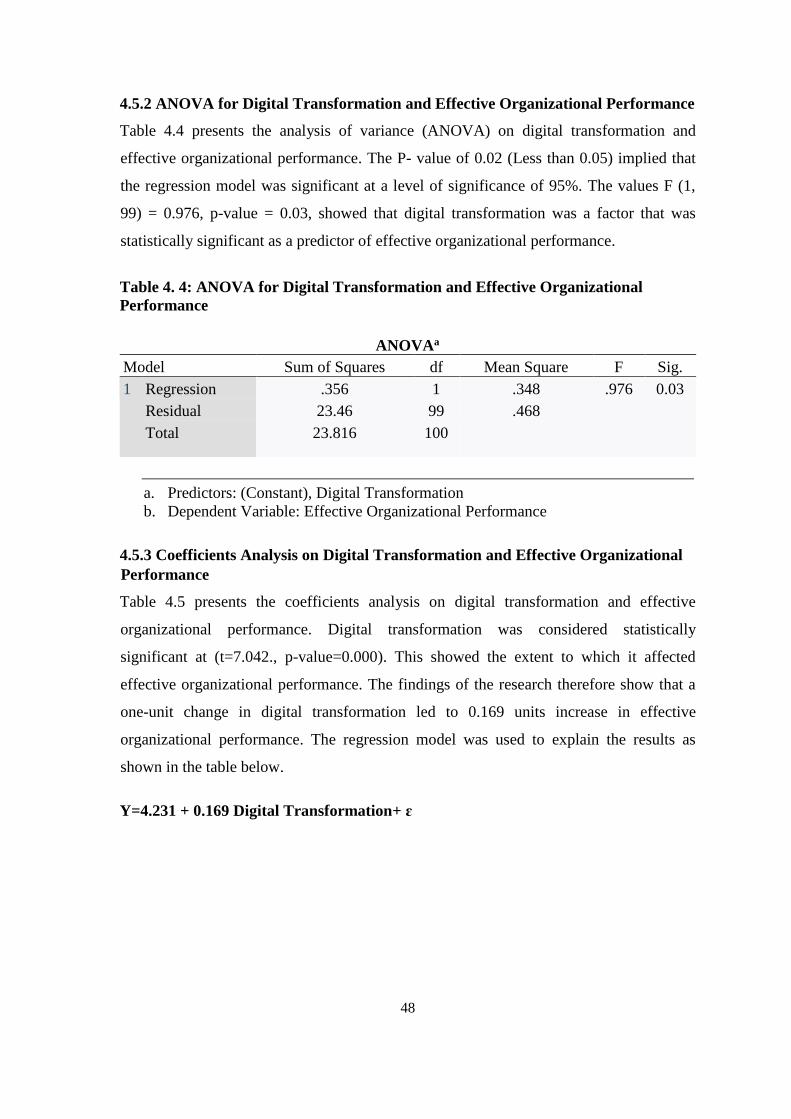
48
4.5.2 ANOVA for Digital Transformation and Effective Organizational Performance
Table 4.4 presents the analysis of variance (ANOVA) on digital transformation and
effective organizational performance. The P- value of 0.02 (Less than 0.05) implied that
the regression model was significant at a level of significance of 95%. The values F (1,
99) = 0.976, p-value = 0.03, showed that digital transformation was a factor that was
statistically significant as a predictor of effective organizational performance.
Table 4. 4: ANOVA for Digital Transformation and Effective Organizational
Performance
ANOVAa
Model Sum of Squares df Mean Square F Sig.
1 Regression .356 1 .348 .976 0.03
Residual 23.46 99 .468
Total 23.816 100
a. Predictors: (Constant), Digital Transformation
b. Dependent Variable: Effective Organizational Performance
4.5.3 Coefficients Analysis on Digital Transformation and Effective Organizational
Performance
Table 4.5 presents the coefficients analysis on digital transformation and effective
organizational performance. Digital transformation was considered statistically
significant at (t=7.042., p-value=0.000). This showed the extent to which it affected
effective organizational performance. The findings of the research therefore show that a
one-unit change in digital transformation led to 0.169 units increase in effective
organizational performance. The regression model was used to explain the results as
shown in the table below.
Y=4.231 + 0.169 Digital Transformation+ ɛ

49
Table 4.5: Regression Coefficients between Digital Transformation and Effective
Organizational Performance
Coefficientsa
Model
Unstandardized
Coefficients
Standardized
Coefficients
T Sig. B Std. Error Beta
(Constant) 4.231 .601 7.042 .000
Digital Transformation 0.169 .169 .090 .976 .330
a. Predictor: (Constant), Digital Transformation
b. Dependent Variable: Effective Organizational Performance
4.6 Pricing Strategies and Effective Organizational Performance
The second specific objective was tested to find out whether there’s an influence of
pricing strategies on effective organizational performance of domestic tour operators in
Kenya. The respondents were asked to give their opinion based on the assumption that
pricing strategies affected effective organizational performance as indicated in table 4.6.
Table 4. 6: Descriptive analysis for Pricing Strategies and Effective Organizational
Performance
N Mean Std.
Deviation
Our competitive price in the market attracts its customers
towards our organization 100 3.571 1.342
The prices of the services offered in my company increases
smooth organizational operations 100 3.429 1.016
Our set prices capture the majority of tourist and that are
willing to pay 100 3.643 1.277
The price of the services offered in my organization are in
line with the competitor and market price. 100 3.643 1.216
Customer perception of the product offering, or service
affects the profitability of my company 100 3.857 1.292
Discounts and sales used by my company increases sales and
in acquiring more customers. 100 3.571 1.284
The price of the product/service more often determines my
organizational operational capability 100 3.429 1.284
Credit sales or payment in instalments enhances my
company’s operational capability 100 3.143 1.292
My company sales have increased profitability of the
organization over the years 100 3.643 1.336
Premium price for high quality services offered (VIP,
Executive services) increases flexibility of my organizational
operations
100 3.786 0.975
Lower prices in my organization compared to competitors 100 3.000 1.359
50
guarantee customer loyalty.
Aggregate 3.519 1.243
The table above shows the descriptive statistics that revealed an overall mean of 3.519
and an aggregate standard deviation of 1.243. All respondents provided opinions to the
questions and from the data collection and analysis; it was found that the mean scores on
most of the questions in relation to pricing strategies were above 3.1. This suggested that
respondents agreed that the pricing factor was considered an important factor that
contributed to effective organizational performance. The questions that garnered the
highest mean scores were on whether the price of the services offered in the organization
are in line with the competitor and market price at 3.857, followed by whether customer
perception of the product offering, or service affects the profitability of the company at
3.786 and whether premium price for high quality services offered (VIP, Executive
services) increases flexibility of an organizational operations at 3.846. The questions that
asked whether lower prices in my organization compared to competitors guarantee
customer loyalty scored the lowest mean score of 3.000, followed by the question on
whether credit sales or payment in instalments enhances a company’s operational
capability at a score of 3.143, and lastly but not least by the question on whether the
prices of the services offered in their company increases smooth organizational operations
at a score of 3.49. It was also found out from the results that competitive prices in the
market attracts its customers towards an organization, and that discounts and sales used
by my company increases sales and in acquiring more customers at a score of 3.571
respectively. As a result, the set prices capture the majority of tourist and that are willing
to pay as evidenced by the response in that question at a mean score of 3.643.
4.6.1 Correlation Analysis between Pricing Strategies and Effective Organizational
Performance
In this section of this research study, the degree to which pricing strategies and effective
organizational performance are associated was measured. The correlation coefficients for
the variables that were considered in this study were presented in table 4.7 as shown
below. The study findings showed that the variable that was the predictor had a positive
association with a level of significance of 0.05. A strong positive relationship between
pricing strategies and effective organizational performance was very much evident from
these findings (r=0.970, P=0.00, N=100)
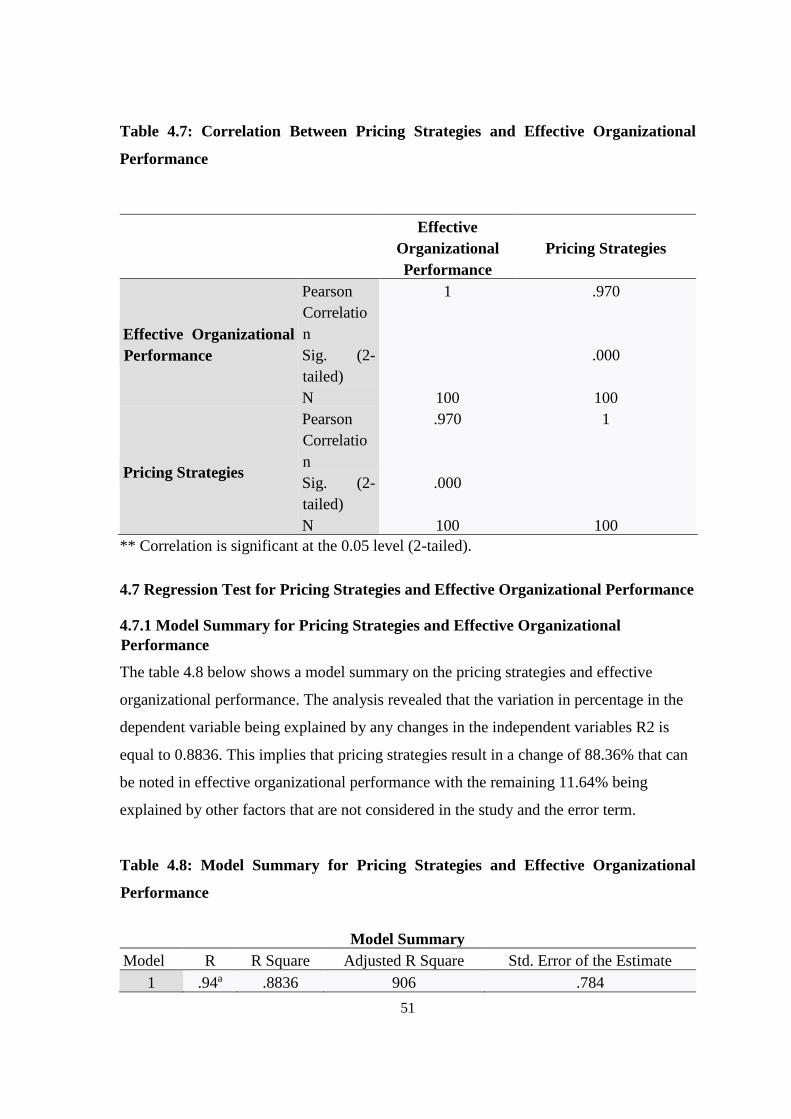
51
Table 4.7: Correlation Between Pricing Strategies and Effective Organizational
Performance
Effective
Organizational
Performance
Pricing Strategies
Effective Organizational
Performance
Pearson
Correlatio
n
1 .970
Sig. (2-
tailed)
.000
N 100 100
Pricing Strategies
Pearson
Correlatio
n
.970 1
Sig. (2-
tailed)
.000
N 100 100
** Correlation is significant at the 0.05 level (2-tailed).
4.7 Regression Test for Pricing Strategies and Effective Organizational Performance
4.7.1 Model Summary for Pricing Strategies and Effective Organizational
Performance
The table 4.8 below shows a model summary on the pricing strategies and effective
organizational performance. The analysis revealed that the variation in percentage in the
dependent variable being explained by any changes in the independent variables R2 is
equal to 0.8836. This implies that pricing strategies result in a change of 88.36% that can
be noted in effective organizational performance with the remaining 11.64% being
explained by other factors that are not considered in the study and the error term.
Table 4.8: Model Summary for Pricing Strategies and Effective Organizational
Performance
Model Summary
Model R R Square Adjusted R Square Std. Error of the Estimate
1 .94a .8836 906 .784
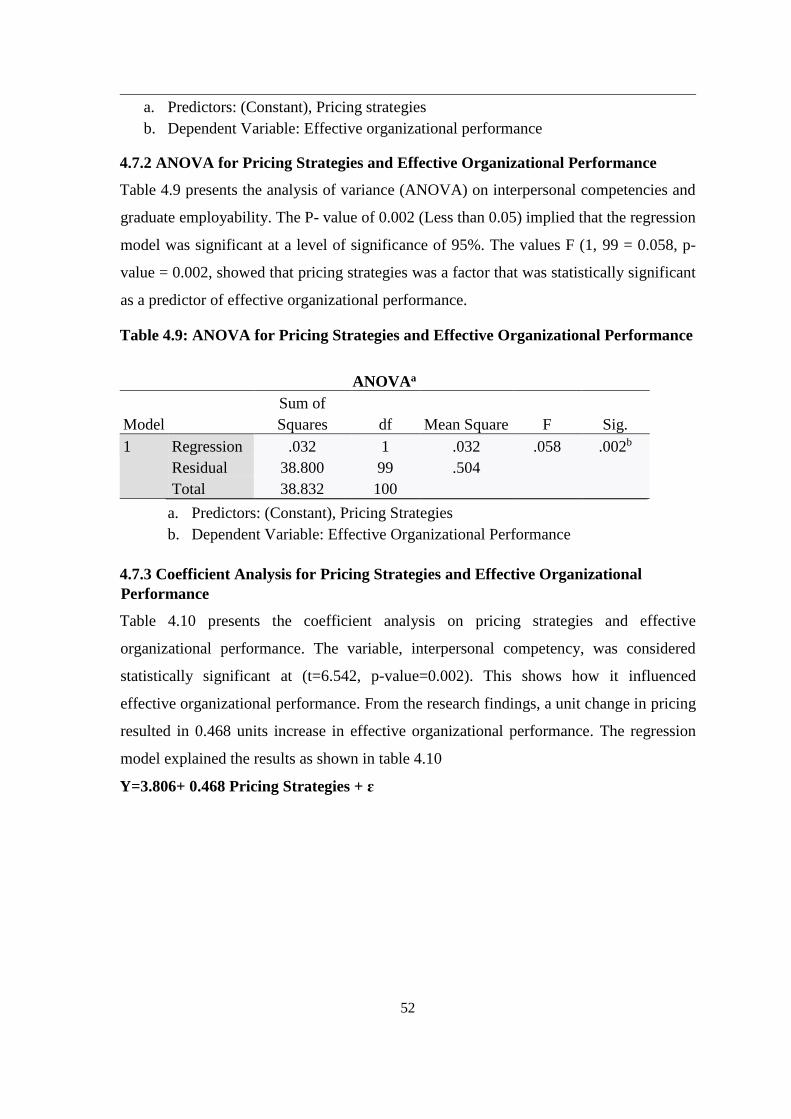
52
a. Predictors: (Constant), Pricing strategies
b. Dependent Variable: Effective organizational performance
4.7.2 ANOVA for Pricing Strategies and Effective Organizational Performance
Table 4.9 presents the analysis of variance (ANOVA) on interpersonal competencies and
graduate employability. The P- value of 0.002 (Less than 0.05) implied that the regression
model was significant at a level of significance of 95%. The values F (1, 99 = 0.058, p-
value = 0.002, showed that pricing strategies was a factor that was statistically significant
as a predictor of effective organizational performance.
Table 4.9: ANOVA for Pricing Strategies and Effective Organizational Performance
ANOVAa
Model
Sum of
Squares df Mean Square F Sig.
1 Regression .032 1 .032 .058 .002b
Residual 38.800 99 .504
Total 38.832 100
a. Predictors: (Constant), Pricing Strategies
b. Dependent Variable: Effective Organizational Performance
4.7.3 Coefficient Analysis for Pricing Strategies and Effective Organizational
Performance
Table 4.10 presents the coefficient analysis on pricing strategies and effective
organizational performance. The variable, interpersonal competency, was considered
statistically significant at (t=6.542, p-value=0.002). This shows how it influenced
effective organizational performance. From the research findings, a unit change in pricing
resulted in 0.468 units increase in effective organizational performance. The regression
model explained the results as shown in table 4.10
Y=3.806+ 0.468 Pricing Strategies + ɛ
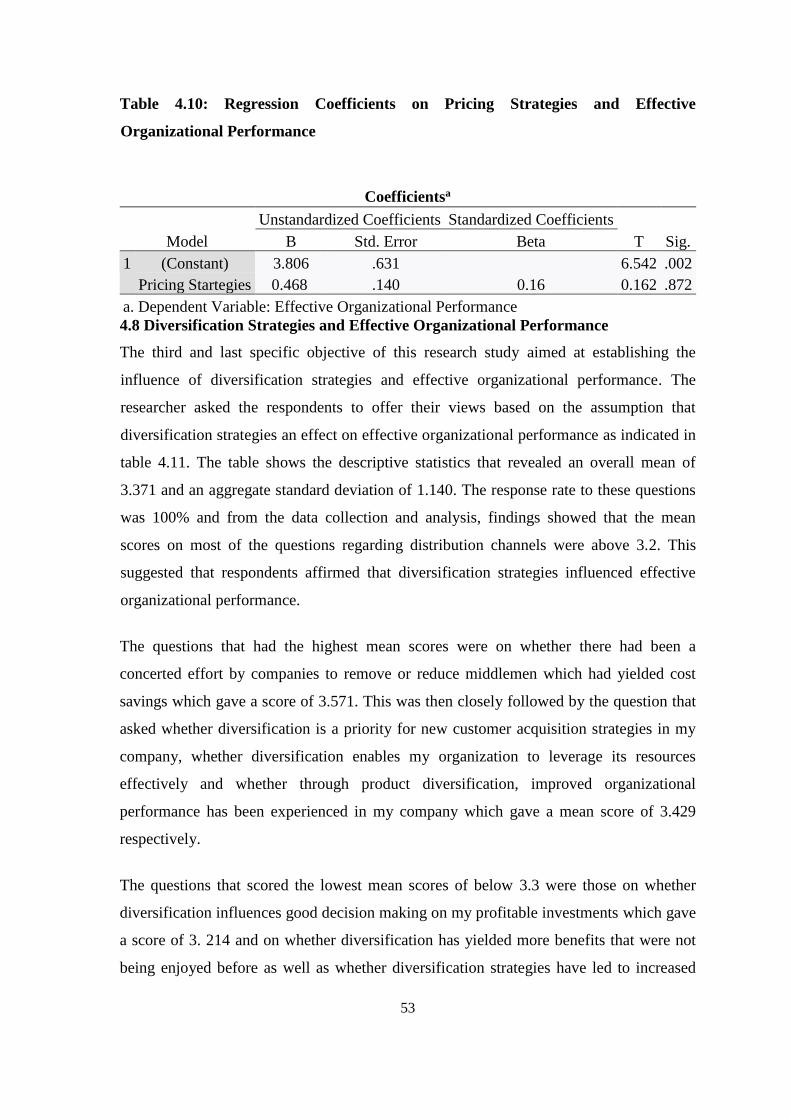
53
Table 4.10: Regression Coefficients on Pricing Strategies and Effective
Organizational Performance
Coefficientsa
Model
Unstandardized Coefficients Standardized Coefficients
T Sig. B Std. Error Beta
1 (Constant) 3.806 .631 6.542 .002
Pricing Startegies 0.468 .140 0.16 0.162 .872
a. Dependent Variable: Effective Organizational Performance
4.8 Diversification Strategies and Effective Organizational Performance
The third and last specific objective of this research study aimed at establishing the
influence of diversification strategies and effective organizational performance. The
researcher asked the respondents to offer their views based on the assumption that
diversification strategies an effect on effective organizational performance as indicated in
table 4.11. The table shows the descriptive statistics that revealed an overall mean of
3.371 and an aggregate standard deviation of 1.140. The response rate to these questions
was 100% and from the data collection and analysis, findings showed that the mean
scores on most of the questions regarding distribution channels were above 3.2. This
suggested that respondents affirmed that diversification strategies influenced effective
organizational performance.
The questions that had the highest mean scores were on whether there had been a
concerted effort by companies to remove or reduce middlemen which had yielded cost
savings which gave a score of 3.571. This was then closely followed by the question that
asked whether diversification is a priority for new customer acquisition strategies in my
company, whether diversification enables my organization to leverage its resources
effectively and whether through product diversification, improved organizational
performance has been experienced in my company which gave a mean score of 3.429
respectively.
The questions that scored the lowest mean scores of below 3.3 were those on whether
diversification influences good decision making on my profitable investments which gave
a score of 3. 214 and on whether diversification has yielded more benefits that were not
being enjoyed before as well as whether diversification strategies have led to increased
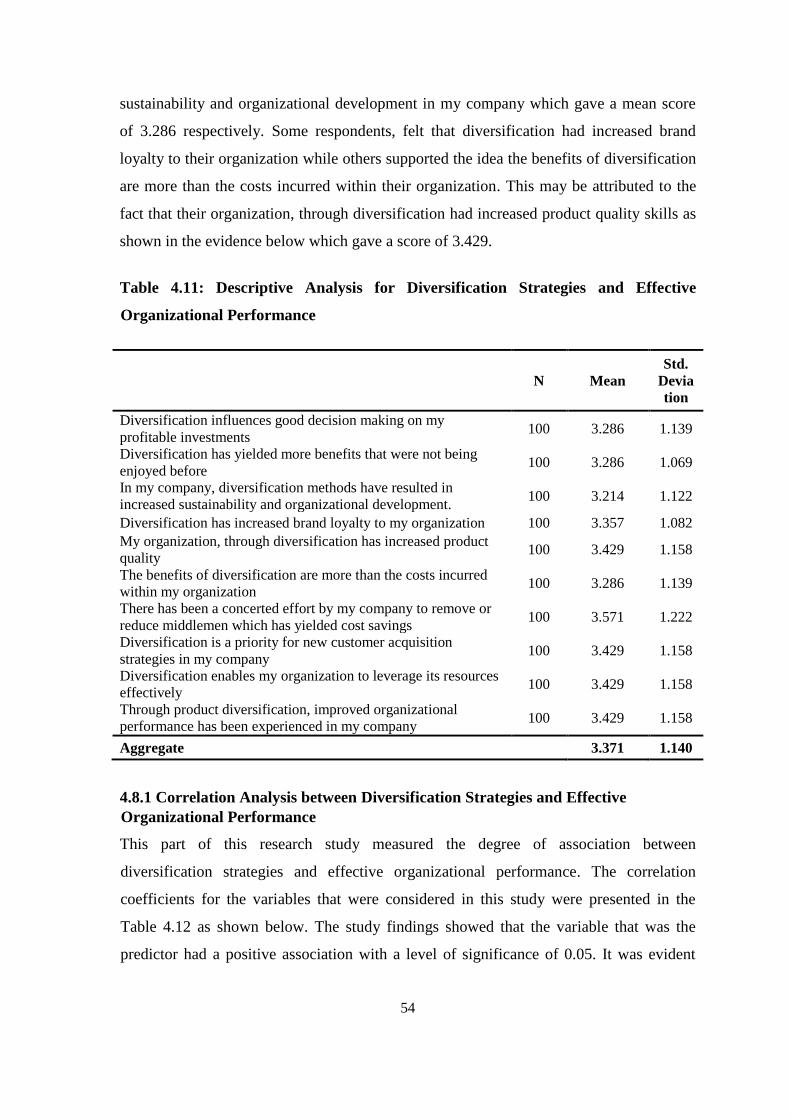
54
sustainability and organizational development in my company which gave a mean score
of 3.286 respectively. Some respondents, felt that diversification had increased brand
loyalty to their organization while others supported the idea the benefits of diversification
are more than the costs incurred within their organization. This may be attributed to the
fact that their organization, through diversification had increased product quality skills as
shown in the evidence below which gave a score of 3.429.
Table 4.11: Descriptive Analysis for Diversification Strategies and Effective
Organizational Performance
N Mean
Std.
Devia
tion
Diversification influences good decision making on my
profitable investments 100 3.286 1.139
Diversification has yielded more benefits that were not being
enjoyed before 100 3.286 1.069
In my company, diversification methods have resulted in
increased sustainability and organizational development. 100 3.214 1.122
Diversification has increased brand loyalty to my organization 100 3.357 1.082
My organization, through diversification has increased product
quality 100 3.429 1.158
The benefits of diversification are more than the costs incurred
within my organization 100 3.286 1.139
There has been a concerted effort by my company to remove or
reduce middlemen which has yielded cost savings 100 3.571 1.222
Diversification is a priority for new customer acquisition
strategies in my company 100 3.429 1.158
Diversification enables my organization to leverage its resources
effectively 100 3.429 1.158
Through product diversification, improved organizational
performance has been experienced in my company 100 3.429 1.158
Aggregate 3.371 1.140
4.8.1 Correlation Analysis between Diversification Strategies and Effective
Organizational Performance
This part of this research study measured the degree of association between
diversification strategies and effective organizational performance. The correlation
coefficients for the variables that were considered in this study were presented in the
Table 4.12 as shown below. The study findings showed that the variable that was the
predictor had a positive association with a level of significance of 0.05. It was evident

55
that there existed a positive relationship between diversification strategies and effective
organizational performance (r=0.956, P=0.00, N=100)
Table 4.12: Correlations Between Diversification Strategies and Effective
Organizational Performance
Correlations
Effective
Organizational
Performance
Diversification
Strategies
Effective Organizational
Performance
Pearson
Correlation
1 .956
Sig. (2-
tailed)
.000
N 100 100
Diversification
Strategies
Pearson
Correlation
.956 1
Sig. (2-
tailed)
.000
N 100 100
** Correlation is significant at the 0.05 level (2-tailed).
4.9 Regression Test for Diversification Strategies and Effective Organizational
Performance
4.9.1 Model Summary for Diversification Strategies and Effective Organizational
Performance
The table 4.13 below gives an overview analysis in form of a model summary on
diversification strategies and effective organizational performance. The analysis showed
that the variation in percentage in the dependent variable being explained by any changes
in the independent variables R Square is equal to 0.7546. This shows that diversification
strategies result in a change of 75.46% that can be noted in effective organizational
performance. The remaining 24.54% is explained by other factors not considered in the
study and the error term.

56
Table 4.13: Regression Analysis on Diversification Strategies and Effective
Organizational Performance
Model Summary
Model R R Square Adjusted R Square Std. Error of the Estimate
1 .87a .7546 .750 .702
a. Predictors: (Constant), Diversification Strategies
b. Dependent Variable: Effective Organizational Performance
4.9.2 ANOVA for Diversification Strategies and Effective Organizational
Performance
Table 4.14 gives an analysis of variance (ANOVA) on diversification strategies and
effective organizational performance. The P-value of 0.02 (Less than 0.05) implied that
the regression model was significant at a level of significance of 95%. The values F (1,
99) = 1.246, p-value = 0.03, showed that diversification strategies was a factor that was
statistically significant as a predictor of effective organizational performance.
Table 4.14: ANOVA on Diversification Strategies and Effective Organizational
Performance
ANOVAa
Model Sum of Squares df Mean Square F Sig.
Regression 1.246 1 1.082 3.886 0.02b
Residual 28.478 99 .262
Total 29.724 100
a. Predictors (Constant), Diversification Strategies
b. Dependent Variable: Effective Organizational Performance
4.9.3 Coefficients Analysis on Diversification Strategies and Effective Organizational
Performance
Table 4.15 gives a presentation on the coefficient analysis on diversification strategies
and effective organizational performance. Technical competencies factor was considered
statistically significant at (t=6.234, p-value=0.003). This shows how diversification
strategies affects effective organizational performance. From the research findings, one-

57
unit change in diversification strategies resulted in 0.282 units increase in effective
organizational performance. The regression model explained the results as shown in the
table below.
Y=3.582+ 0.306 diversification Strategies+ ɛ
Table 4.15: Regression Coefficient on Diversification Strategies and Effective
Organizational Performance
Coefficientsa
Model
Unstandardized
Coefficients
Standardized
Coefficients
T Sig. B Std. Error Beta
(Constant) 3.582 .400 6.234 .003
Diversification
Strategies
.282 .104 .192 1.971 .051
a. Dependent Variable: Effective Organizational Performance
4.10 Chapter Summary
This chapter presented the study results on the effects of strategic marketing positioning
on effective organizational performance of domestic tour operators in Kenya which was
guided by this research’s specific study objectives. The demographic findings were
presented in form of charts and graphs. The descriptive analysis gave a summary of the
variables that were used for the study by presenting them in terms of their standard
deviations and means. To establish the relationship between the dependent and
independent variables, the data was analyzed using correlation and regression analysis.
All of the connections were discovered to be statistically significant. The study
discussion, conclusion, and recommendations are presented in Chapter 5.

58
CHAPTER FIVE
5.0 DISCUSSION, CONCLUSIONS AND RECOMMENDATIONS
5.1 Introduction
This chapter gives a summary of this research’s study discussion, conclusions and
recommendations based on the specific objectives that guided this study. Discussion on
the effect of digital transformation on effective organizational performance is handled
first, secondly, the effect of pricing strategies on effective organizational performance is
discussed and lastly, the effect of diversification on the effective organizational
performance is discussed. The study on conclusions and recommendations are also
presented towards the end of this chapter in that order.
5.2 Summary
The general objective of this research was to examine the effect of strategic market
positioning on effective organizational performance. The specific objectives that guided
this study were to determine the effect of digital transformation on effective
organizational performance, to establish the effect of pricing strategies on effective
organizational performance and to determine the effect of diversification on the effective
organizational performance.
The study adopted a descriptive research design since it gives information of the status of
a phenomenon and that is what the research intends on doing. The population of interest
in this research were 193 domestic tour operators in Kenya. A sample size of 130
domestic tour operators was selected. The sample was selected using stratified sampling
technique. A closed-ended questionnaire was used to obtain primary data. The data
collected was then be analysed using Statistical Package for Social Sciences (SPSS)
which was used to generate percentage frequencies and mean standard deviation scores.
The correlation method was used to determine whether there was a relationship between
the variables, while the regression method was used to determine the relationship's level
of significance. Graphs and tables were used to present the findings.

59
The findings on the effect of digital transformation on effective organizational
performance showed that there is a positive relationship between digital transformation
among tour firms and effective organizational performance. Artificial intelligence, for
example, has had a significant impact on this, as it is a vital component in stressing the
worldwide shift to the digital era, whose motto is efficiency and ease of operation. Digital
marketing is a type of digital strategy that focuses on leveraging digital technology to
attract, engage, and convert customers online. It is tactical and operational in nature.
Organizations may better obtain information on current industry trends and fads, technical
breakthroughs, and current customer tastes and preferences via marketing channels like
social media, and adjust their strategy to match the market narrative. The relationship was
reported to be statistically significant.
The findings on the extent to which pricing strategies affect effective organizational
performance revealed that there is a positive relationship between pricing of products and
services and effective organizational performance. The study further revealed that factors
such as competitive costs, customer-based costs and cost-based costs while emphasizing
on differentiation encourages companies to bring more value to their customers at a lower
cost to achieve and sustain competitive advantage. This relationship was also found to be
statistically significant. Furthermore, value-based pricing has the advantage of allowing
companies to develop and modify their products or services to meet the specific needs of
their customers, whereas cost-based pricing is inconsistent and discourages cost
containment, i.e., the lower the cost, the lower the revenue, resulting in a lower total
profit, and vice versa. Companies struggle to maintain steady budgets or predictions as a
result of these swings, restricting organizational advancement.
Lastly, the findings on whether diversification strategies affect effective organizational
performance revealed that there is a positive relationship between diversification
strategies and effective organizational performance. Untapped resources with potential,
making them superior to industry rivals, and thus boosts performance when the resources
are appropriately integrated, were among the variables emphasized and explored. Another
issue investigated was the usage of horizontal mergers, which can raise market power and
revenue growth by enhancing revenue, reducing costs, and introducing new growth.
Backward integration as a factor, on the other hand, was discovered to be a cost-control
60
technique. Reduced transportation costs, operational expenses, and other additional costs
imposed by the supplier boost efficiency. The relationship was found to be statistically
significant.
5.3 Discussion
5.3.1 Digital Transformation and Effective Organizational Performance
The research study carried out on the effect of digital transformation on effective
organizational performance has shown a positive relationship between digital
transformation and effective organizational performance on domestic tour operators in
Kenya. This finding concurs with Gillpatrick, (2019) research which found out that buyer
behavior is the most critical factor driving the evolution of economic demand today and
into the future. Therefore, Innovations have changed how firms measure demand and
therefore have been able to deploy new marketing strategies that have far reaching effects
on competitiveness, consumer welfare and public policy decision-making. Similarly,
Becker and Schmid, (2020) found that a digital strategy is much more, because digital
technologies or connectivity are fundamentally transforming traditional business
strategies into modular and cross functional global strategies that enable business
processes to be established beyond the boundaries of time, distance or function.
To remain competitive in the future, companies, companies need to develop an entire
digitization strategy that affects all areas of the business, enabling them to achieve a
holistic digital transformation and ensure their survival in the digital age (Becker &
Schmid, 2020). This research has confirmed that organizations use online reviews as
measurement of performance and that they affect strategic market positioning. In a
similar view, Gillpatrick (2019) in his research found that consumer shopping and
purchase behaviour is rapidly evolving with increased preferences for shared
consumption over ownership, use of mobile technology, consumer co-creation of value,
online shopping and an increased preference for experiences over material things among
the many changes in preferences.
This research concurs with the findings that technology has been identified as a key
internal dimension aiding organizations in transforming. In fact, the role of new
information and communication technologies has been widely recognized because of their
61
rapid development and diffusion, resulting in triggering business transformation
considerations within organizations (Ismail et al., 2017). This study discovered that,
rather than doing traditional marketing, businesses can conduct all of their activities
digitally (online transactions, internet marketing, and customer relationship management).
Similarly, Gillpatrick,(2019) research findings show that increasingly firms are looking to
decouple the consumer value chains by using shopping apps and digital technology that
disrupt the business models of retail incumbents and provide value enhancements for
shoppers.
Also, according to findings by Sindiga, (2005) reveal that the revolution of technology
has influenced and changed the buying behavior of consumers in developed countries.
The use of social media e.g., Facebook, twitter, my space etc. and mobile
telecommunication is a cheaper and has a wider reach. These findings are in line with the
research findings where most respondents agreed that organization makes full use of the
three main social media platforms in its operations (Facebook, Instagram, and Twitter)
and that feedback received from customers on the social media platforms affect the
decision-making process and performance of the organization is hence affected. In
addition, Sindiga, (2005) in his findings concludes that the travel and tourism industry is
undergoing a period of rapid change and uncertainly with new technologies and more
experienced consumers being some of the opportunities and challenges facing the
industry. It is paramount that the board is on the forefront in integrating the use of
technology and social media in its strategies.
According to Gillpatrick, (2019) the rapid transformation of marketing with digital tools,
product and strategies will hasten the adoption of digitization globally with impacts on
labour markets, consumer welfare, and the competitiveness of both companies and
nations. The digitization transformation of marketing is expected to create uneven
benefits and costs for consumers, businesses and nations (Gillpatrick, 2019). Through
digital transformation, organizations are able to integrate digital technologies in many
facets of their operations and are also able to engage customers with emerging digital
innovations (Nwankpa & Roumani, 2016). These findings correspond to the research
findings where digital transformation was found to improve both existing and creation of
new products. Other findings such as those discussed by (Foerster-metz and Marquardt,
62
(2018) reveal with the emergence of social media, social networks and by the
improvement of the sensor technology, additional information is being recorded,
digitalized and shared. Today, non-digitalized products are more and more digitalized as
they receive. Similarly, Kerri, (2016) findings corresponds with this research where firms
that make optimal use of information communication technology (hereafter ICT) can
access new market opportunities, gain new knowledge regarding their customers, and
improve new product development processes more effectively.
5.3.2 Pricing Strategies and Effective Organizational Performance
The findings on the influence of pricing strategies on effective organizational
performance showed that there was a significant positive relationship between the two
variables. These findings correspond to those of Ismail et al., (2017) which found that
product pricing enables companies to conduct finer customer segmentation, to tailor their
offerings and to develop more sophisticated pricing strategies that are in line with the data
they extract and analyze. Similarly, Mokaya et al., (2012) found that cost strategies are
very important in enhancing the performance of organizations as they inform the market,
increase sales, maintain and improve market share, create and improve brand recognition
and create a competitive advantage relative to competitor’s products and market position.
Findings show that customer perception of the product offering, or service is important
during the price setting process as this determines the number of sales and how effective
an organization can deliver its services and products to their consumers. These are in line
with findings revealed by Riasat and Nisar, (2015) who found that market positioning
strategies have significant association with organizational performance and that pricing
strategies have significant effect on cost strategies, perceived services quality, innovation
and organizational performance. Research shows that some companies employ the
strategy of offering lower prices compared to competitors to guarantee customer loyalty.
Other findings such as those done by Le (2019), revealed that some companies in a bid to
stay relevant in the market, have devised methods of reducing market competition and
consolidating their predatory pricing through cross-subsidization, conspiracy, and
reciprocal transactions. It was however noted that this behaviour seriously harms
consumers’ interests and therefore not recommended.
63
According to Gillpatrick, (2019)findings, in-store pricing and assortments if optimized
and, when combined with predictive recommendations, clearly benefits consumers and
the organizational performance itself. These findings are consistent with the conclusions
of this study, which indicated that the corporation uses discounts and sales to attract new
clients. Similarly, Mokaya et al., (2012) found that pricing is important in influencing an
organization's performance because cost strategies focus on informing the market about
its products and services, maintaining, or improving market share, creating, or improving
brand recognition, and gaining a competitive advantage over competitors' products or
markets.
Research findings show that dual pricing with different pricing for international and
local/domestic tourists, and/or lower prices in off-season months expand domestic
tourism (Ministry of Tourism and Wildlife [GOK], 2020). In fact, this research study
confirmed that imposing a lower fee for domestic tourists and/or charging less in off-
season months, authorities make tourism services more widely accessible to different
social classes across the countries, create all year- round tourism and can help to alleviate
pressure from over-crowding (GOK, 2020). Some findings such as those of Sindiga,
(2005) found that pricing is a difficult process for destinations as it is often determined by
the pricing and marketing policies of individual enterprises both at the destination and
distributors at the place of origin. Local suppliers can have their own policy and thus co-
coordinating and establishing a destination wide pricing strategy is almost unachievable.
Companies better pricing strategies generates informed employees, consumers and
partners that have real time access to competitive pricing and product information which
increases pricing transparency (Foerster-metz & Marquardt, 2018). Similarly, Gillpatrick
(2019) research findings show that cost structure allows pricing that can substantially
undercut rivals. Thus, the go-to-market strategies of these firms have impact at the
macro-economic level as well as the level of competition between firms. Understanding
consumer benefits and costs can help to predict the macro impact of these platform
networks.
These concur with this research study which found that a mark-up added on the cost of
offering services helps an organization in attaining profitability. According to Sindiga,

64
(2005) findings, the pricing structure is negotiable and set independently by tour
operators. Premium pricing is applied to high end products while price discrimination is
practiced depending on the season. Use of global television as promotional media is up to
20% which organizations can use to have a competitive edge on their customers. Also,
other research findings show that pricing strategies affect performance outcome and that
other than table- locating prices, other forms of pricing policy are not regarded as unfair
(Mokaya et al., 2012).
5.3.2 Diversification Strategies and Effective Organizational Performance
The results on effect of diversification strategies on effective organizational performance
revealed that there is a positive relationship between diversification and effective
organizational performance. This finding concurs with Oladimeji and Udosen, (2019)
study findings which suggest that diversification is advantageous to professional service
firms while performance is positively related to the strategy used by specialized barrow
brands. Diversification initiatives, according to this study, have resulted in enhanced
sustainability and organizational growth in Kenya. This research further suggests that
through diversification, increased product quality has been realized. In other words as
found by Oladimeji and Udosen, (2019), it was revealed that the benefits of
diversification outweighs its cost and that diversification is less positively associated with
performance and the benefits associated with unrelated diversification are harder to make
during periods of crisis.
Findings carried out by Le, (2019) show that diversified companies benefit from multiple
types of coordination effects, such as the economies of scale and economies of scale
formed by companies implementing diversification strategies, the superiority of access to
information from multiple product markets and the achievement of stable market returns.
In order for the Ministry of Tourism and Wildlife and the entire tourism industry to
effectively strengthen the domestic tourism in Kenya there is a need for a comprehensive
enabling environment, especially on diversification of the tourism products and markets
(GOK, 2020). Similarly Osiako, (2021) found that tourism products widened by product
developers through diversification by innovation and creativity on their product and
service offers encourages tourism here in Kenya.

65
According to Mwangi, (2016), diversification strategies eventually leads to tour firms
achieving a balanced way to both risks reduction and leveraged synergies. There are
several marketing diversification strategies adopted by tour firms to enhance their
performance. Additionally, their findings showed that a diversification strategy would be
an extremely relevant indicator if the firm’s performance did not follow any specific
pattern over time. But because of firms’ outstanding performance heterogeneity,
diversification is advantageous for the firm (Arasa, 2014). According to G. J. Mwangi,
(2017) findings, firms are able to operate in other new/similar or different markets.
Therefore, diversification strategy is considered a corporate growth strategy and hence
enhances organizational performance.
This research has confirmed that there has been a concerted effort by the company to
remove or reduce middlemen which has yielded cost savings and that the benefits of
diversification are more than the costs incurred. Similarly, according to Anıla and
Yititba, (2011) findings, diversification strategies does not augment the company value
after the optimal level, on the contrary costs of engaging in diversification strategies start
to climb up, exceeding the benefits, after the optimal level. However, in emerging
markets, the potential benefits and costs arising from diversification, and other criteria
influence performance level.
Also, Anil and Yigit, (2013) findings concur with this research study where they
concluded that diversification strategies and their effects on performance vary across time
periods according to their study on Japanese firms. All these inconclusive empirical
research evidence have led to a need for researchers examining how diversification
strategy affects firm performance in different institutional environments and market
conditions. In a research carried out by Arasa, (2014) revealed that, diversification has a
positive effect on the performance of tour firms especially those that have been running
for longer periods. As the income from diversification increases, the total profits of the
tour firms have also registered significant increment over the years.
G. J. Mwangi, (2017) findings also concur that the extent and type of diversification
significantly determines the success of a diversification strategy. However, sometimes
diversification does not lead to enhanced performance. Related diversification strategies
(vertical and horizontal) give rise to several competitive advantages. This is because

66
related diversification is thought to allow the corporate centre to take advantage of the
interrelationships that exist across its various businesses, allowing it to gain cost and
differentiation competitive advantages over its competitors (Anla & Yititba, 2011).
These findings concur with those of Le, (2019) which found that the essence of
diversification is the decision-making behaviour of managers in order to seek their own
hidden benefits and reduce their income risks, which will definitely damage corporate
performance and company value. Also, (A. N. Mwangi, 2016)revealed that addition of
new product features to the existing product (pricing) and branding /rebranded most of
the existing products and re-launching them into the market are major marketing
approaches employed by the population to improve performance
5.4 Conclusion
5.4.1 Digital Transformation and Effective Organizational Performance
This research confirmed that there exists a positive relationship between digital
transformation and effective organizational performance. Digital transformation
considered factors such as digital marketing and Artificial intelligence. All these factors
very much contributed to the positive relationship observed. In conclusion, this research
therefore agreed that the relationship between digital transformation and effective
organizational performance was statistically important.
5.4.2 Pricing Strategies and Effective Organizational Performance
This research showed that there exists a positive relationship between pricing strategies
and effective organizational performance. Competition-based pricing, cost-based pricing,
and customer value-based pricing were among the pricing techniques mentioned. All of
these variables contributed to the development of a positive relationship. Therefore, in
conclusion, this research concluded that the relationship between pricing strategies and
effective organizational performance was statistically significant.
5.4.3 Diversification Strategies and Effective Organizational Performance
This research has revealed that there exists a positive relationship between diversification
strategies and effective organizational performance. Diversification strategies captured in
this study included horizontal integration, vertical integration, concentric diversification,

67
conglomerate diversification, and disintermediation strategy. All these factors
significantly contributed to the existence of this positive relationship. Therefore, in
conclusion, this research concludes that the relationship between diversification strategies
and effective organizational performance was statistically significant.
5.5 Recommendations
Recommendations on this section are based on the three specific objectives of this study.
5.5.1 Recommendation for Improvement
5.5.1.1 Digital Transformation and Effective Organizational Performance
The findings of this research revealed a positive relationship between digital
transformation and effective organizational performance. Therefore, it is recommended
that since digitalization has shown that it has majorly changed organizational
performance over the years, it is important for tour companies to leverage on digital
technology most especially using platforms such as social platforms, and online
marketing sites. This not only increases efficiency in the organization’s performance but
also quick delivery to its customers. Also, as found in this research digitization cuts lots
of costs in that the skill set of many employees carrying out the role of traditionally
marketing a company’s product. Therefore, it is recommended that tour firms adopt this
strategy to effectively position themselves when marketing their servicers to the tourists
and other stakeholders involved.
5.5.1.2 Pricing Strategies and Effective Organizational Performance
The findings, in this study showed a strong positive relationship between pricing
strategies and effective organizational performance. It is recommended that pricing
strategies be implemented based on the specification of the type of market positioning
tour firms take. For instance, tier pricing system that differentiates prices paid by locals
and that paid by international tourists is important so that an organization can achieve its
profitability goal as well as perform effectively. This will also ensure that tour firms are
able to deliver quality products. On the other hand, revision on pricing in rated hotels and
premier parks for the domestic market is important and should be encouraged so that tour
firms are able to attract local tourism and therefore tour firms are able to generate income

68
regardless of whether it’s the low season or not. This will not only ensure profitability of
the firms are attained but also the organizational activities are able to run smoothly.
5.5.1.3 Diversification Strategies and Effective Organizational Performance
Since the research findings of this study showed that there exists a strong positive
relationship between diversification strategies and effective organizational performance,
it is recommended that tour firms not making profits or rather are underperforming
consider unrelated diversification as a way of increasing organizational profitability and
performance. These strategies will ensure that tour firms attract adequate investment
relevant for survival and expansion/growth for their companies. The study also
recommends that managers of tour firms adopt a mix of diversification strategies (both
related and unrelated) as a way of boosting the firms’ appearance to investors and
maintain/built customer loyalty in their organizations. Small and start-up tour firms
seeking to engage unrelated diversification strategy must first focus on their
growth/accumulation of assets to attain a large firm size as this will contribute to
enhanced performance. This can be achieved by bringing on board new investments such
as introduction of new line products or partners such as travel agents.
5.5.2 Recommendation for Further Studies
The focus of this study was on the effect of strategic marketing positioning on the
successful organizational performance of Kenyan domestic tour operators. It has therefore
been able to determine that adoption of digital transformation strategies such as digital
marketing and artificial intelligence enhances effective organizational performance.
Secondly, the pricing strategies factor was explored. Models such as the 3Cs were
discussed and how and when they should be implemented were well explored in this
research study. Further, diversification strategies such as horizontal integration and
vertical integration were captured in this study. However, these factors are not exhaustive
in that these are the only effects brought about by market positioning in relation to an
organizational performance. Researchers and other academicians who are interested to
further studies on other strategic marketing positions and narrow down to a specific
region that tour firms are dominant such as the coastal region in Kenya. Similarly, this
study can be carried out in other fields of study not taken into consideration by this
research study.
69
REFERENCES
Abrantes, B. F. (2020). Are Neoclassic Internationalization Models Enduring? A Case-
Review of the Uppsala Paradigm. Sage Open, 1(1), 1-16.
Abutabenjeh, S., & Jaradat, R. (2018). Clarification of research design, research methods,
and research methodology. Teaching Public Administration, 36(3), 237–258.
Adeleke, B. S., Odebeatu, C. K., & Adeoye, K. F. (2018). Survival priority for Nigerian
banks: Investigating the need for diversification strategies in a downturn
economy. European Journal of Economic and Financial Research, 3(2), 40–52.
Agbaeze, E., Chiemeke, M. N., Ogbo, A., & Ukpere, W. I. (2020). Impact of pricing
practice management on performance and sustainability of supermarkets in the
urban area of Enugu State, Nigeria. Sustainability, 12(15), 1-23.
Andersson, H. & Jansson, G. (2012). Evaluating corporate strategy: A case study of
Lansforsakringar. (Unpublished Master’s Thesis, Swedish University of
Agricultural Sciences).
Anil, I., & Yigit, I. (2013). The Relationship Between Diversification Strategy And
Organizational Performance : A Research Intented For Comparing Belgium And
Turkey. Procedia - Social and Behavioral Sciences, 99(9), 997–1006.
https://doi.org/10.1016/j.sbspro.2013.10.573
Anıla, I., & Yi?itba*, I. (2011). The Relation between Diversification Strategy and
Organizational Performance : A Research on Companies Registered to the Istanbul
Stock Exchange Market. Procedia Social and Behavioral Sciences, 24(7), 1494–
1509. https://doi.org/10.1016/j.sbspro.2011.09.093
Arasa, S. O. (2014). Diversification Strategy And Performance Of Kenya Commercial
Bank Group By Sophia Obonyo Arasa A Research Project Submitted In Partial
Fulfillment Of The Requirements For The Award Of A Master Of Business
Administration , School Of Business , University O. University Of Nairobi.
Banner, M. (2018). Digital presence and transformation: The growing importance of
digital presence in today’s business marketplace. (Unpublished Thesis, Centria
University of Applied Sciences, Kokkola, Finland).
Bashaer, A., & Singh, S. (2016). Determinants of organizational performance : a proposed
framework International Journal of Productivity and Performance Management
Article information : International Journal of Productivity and Performance
Management, 65(December 2017), 19. https://doi.org/10.1108/IJPPM-02-2016-0038
Bhandari, P. (2020). Population vs sample: what’s the difference? Retrieved on 10th May
2021 from https://www.scribbr.com/methodology/population-vs-sample/
Becker, W., & Schmid, O. (2020). an empirical analysis of the design and implementation
of digital strategies in SMEs and LSEs. Business Research, 13(3), 985–1005.
https://doi.org/10.1007/s40685-020-00124-y

70
Bhasin, H. (2020). Organizational effectiveness - Definition, meaning and six systems.
Retrieved on 15th April 2021 from https://www.marketing91.com/organizational-
effectiveness/
Bruno, C. (2012). Vertical and horizontal integration, unbundling and quality of service in
public utilities. A literature reviews. Impresa Progetto - Electronic Journal of
Management, 1–30.
https://www.impresaprogetto.it/sites/impresaprogetto.it/files/articles/ipejm_articol
o_n_1_-_1-2012_bruno_def.pdf
Brynjolfsson, E., & McAfee, A. (2017). Artificial Intelligence: The Insights You Need
from Harvard Business Review (HBR Insights Series) (Illustrated ed.). Harvard
Business Review Press.
Burton, M., & Holden, R. (2019). Common Pricing Strategies and Why They Fail.
Business Know-How.
https://www.businessknowhow.com/money/pricingstrategies.htm
Butt, I., & Kumar, U. (2017). An Empirical Investigation of An Empirical Investigation
of Factors Influencing the Development of Positioning Strategy. Procedia Computer
Science, 122, 629–633. https://doi.org/10.1016/j.procs.2017.11.416
Campbell, P. (2020). What is competitor-based pricing? (+ how-to guide) | ProfitWell.
Profit Well. https://www.profitwell.com/recur/all/competitor-based-
pricing#:%7E:text=Competitor%20based%20pricing%20is%20a,for%20your%20
product%20or%20service.
Cant, M. C., Wiid, J., & Sephapo, C. M. (2016). Key Factors Influencing Pricing
Strategies For Small Business Enterprises (SMEs): Are They Important? Journal
of Applied Business Research (JABR), 32(6), 1737.
https://doi.org/10.19030/jabr.v32i6.9820
Carillo, J. (2019). The advantages of competitive pricing strategy | Retail Technology
Review. Retail Technology Review.
https://www.retailtechnologyreview.com/articles/2019/07/30/the-advantages-of-
competitive-pricing-strategy/
Cerovic, S., & Batic, S. (2008). Competitiveness and Positioning in Tourism. Economics
and Organization, 5(2), 133–141.
http://facta.junis.ni.ac.rs/eao/eao200802/eao200802-05.pdf
Chang, C., McAleer, M. & Ramos, V. (2020). A charter for sustainable tourism after
Covid-19. Sustainability, 12(3671), 1-4.
Chapman, L. (2020). How to identify a suitable pricing strategy. Product Marketing
Alliance. https://productmarketingalliance.com/how-to-identify-a-suitable-
pricing-strategy/
71
Chen, C. J., & Yu, C. M. J. (2011). Managerial ownership, diversification, and firm
performance: Evidence from an emerging market. International Business Review,
21(3), 518–534.
Choo, H. (2015). Domestic tourism. Encyclopedia of Tourism, 1–2.
https://doi.org/10.1007/978-3-319-01669-6_255-1
Claici, A., Basalisco, B., De Michiel, F., Okholm, H., & Maier, N. (2020). The Economic
Rationale for Vertical Integration in the Tech Sector. Copenhagen Economics.
https://www.copenhageneconomics.com/dyn/resources/Publication/publicationPD
F/0/550/1606320780/copenhagen-economics-the-economic-rationale-for-vertical-
integration-in-tech.pdf
Contractor, F. J., Kundu, S. K., & Hsu, C. C. (2002). A three-stage theory of international
expansion: the link between multinationality and performance in the service
sector. Journal of International Business Studies, 34(1), 5–18.
Cruz, A., & Karatzas, S. (2019). Book highlight-Developing an effective digital presence.
Global Business and Organizational Excellence, 38(2), 64–74.
Dai, J. Cantor, E.D. & Montabon, L.F. (2017). Examining corporate environmental
proactivity and operational performance: A strategy-structure-capabilities -
performance perspective with a green context .within a green context.
International Journal of Production Economics.
Daqar, M. A. A., & Smoudy, A. K. A. (2019). The role of artificial intelligence on
enhancing customer experience. International Review of Management and
Marketing, 9(4), 22–31.
Darboe, F. (2020). Which Type of Tour Operator are You? [Infographic]. Regiondo.
https://pro.regiondo.com/types-of-tour-operators/
De Carlos, P., Araujo, N., & Fraiz, J. A. (2016). The new intermediaries of tourist
distribution: Analysis of online accommodation booking sites. The International
Journal of Management Science and Information Technology, 1(1), 39-58.
De Toni, D., Milan, G. S., Saciloto, E. B., & Larentis, F. (2017). Pricing strategies and
levels and their impact on corporate profitability. Revista de Administração, 52(2),
120–133.
72
Decker, A. (2021). The Ultimate Guide to Pricing Strategies. Hub Spot.
https://blog.hubspot.com/sales/pricing-strategy
Dhillon, R. & Nguyen, Q. C. (2020). Strategies to respond to a VUCA world.
(Unpublished Thesis, Lunds Universitet, Lund, Sweden).
Dholakia, U. M. (2018). When Cost-Plus Pricing Is a Good Idea. Harvard Business
Review. https://hbr.org/2018/07/when-cost-plus-pricing-is-a-good-idea
Diamantopoulos, A. (2005). Determinac¸ão de prec¸os. In: M. Baker (org.),
Administrac¸ão de marketing, Rio de Janeiro: Elsevier.
Dimitrova, T. (2017). Evaluating the Strategic Position of an Organization through Space
Analysis. Economic Archive, 3, 19–32. https://www.researchgate.net/publication
Dinc, A., & Erel, I. (2010). Economic Nationalism in Merger and Acquisitions. Fisher
College of Business Working Paper. https://doi.org/10.1111/jofi.12086
Douglas, S. P. & Craig, C. S. (2005). Understanding the new bases for global market
segmentation, Journal of Consumer Marketing, 20(5), 446-60.
Duygun, M., Hashem, Q.S., & Tanda, A., (2021). Editorial: Financial mediation versus
intermediation: Opportunities and challenges in the Fin Tech era. Front Artil
Intell.
Egessa, R. K. . (2016). Organizational capabilities and performance of sugar companies
in kenya. International Journal of Management Research & Review, 5(March), 20.
https://www.researchgate.net/publication/297761740_Organizational_capabilities_a
nd_performance_of_sugar_companies_in_kenya
Emerson, R. W. (2015). Convenience sampling, random sampling, and snowball
sampling: How does sampling affect the validity of research? Journal of Visual
Impairment & Blindness, 109(2), 164-168.
Epuran, G.., Tescasiu, B., Tecau, A.-S.; Ivasciuc, I. S., & Candrea, A. N. (2020).
Permaculture and downshifting-sources of sustainable tourism development in
rural areas. Sustainability, 13, (230), 1-19.
Galitsky, B. (2020). Artificial Intelligence for Customer Relationship Management:
Keeping Customers Informed (Human–Computer Interaction Series) (1st ed. 2020
ed.). Springer. https://doi.org/10.1007/978-3-030-52167-7
Gillpatrick, T. (2019). The Digital Transformation of Marketing : Impact on Marketing
Practice & Markets. Economics, 7(2), 139–156. https://doi.org/10.2478/eoik-2019-
73
0023
Guilding, C., Drury, C., & Tayles, M. (2005). An empirical investigation of the
importance of cost‐plus pricing. Managerial Auditing Journal, 20(2), 125–137.
Haenlein, M., & Kaplan, A. (2019). A Brief History of Artificial Intelligence: On the
Past, Present, and Future of Artificial Intelligence. California Management
Review, 61(4), 5–
Hamatwi, N. J. & Govender, K. K. (2020). Exploring Air Namibia’s operational
efficiency: The interface between strategy and the six pillars of the organisation.
African Journal of Hospitality, Tourism and Leisure, 9(5), 1238-1251.
Hamet, P., & Trembley, J., (2019). Artificial intelligence in medicine. Metabolism
Clinical and Experimental .Experimental.
Hansman, C., Hjort, J., León, G., & Teachout, M. (2020). Vertical Integration, Supplier
Behavior, and Quality Upgrading among Exporters. Journal of Political Economy,
128(9), 3570–3625.
Harbison, K. (2021). B2B Pricing in a Changed Economic Environment. Blue Canyon
Partners. https://bluecanyonpartners.com/3-key-objectives-ecommerce-strategy/
Hinterhuber, A. (2008). Value delivery and value-based pricing in industrial markets.
Advances in Business Marketing and Purchasing, 14, 381–448.
Hopkinson, P. J., Perez-Vega, R., & Singhal, A. (2018). Exploring the use of AI to
manage customers’ relationships. Examining the Evolution of Social CRM.
Academy of Marketing Workshop: Artificial Intelligence in Marketing – The
field, research directions, and methodological issues.
IBM. (2018). IBM Research - Home. IBM Research.
https://www.research.ibm.com/arti%EE%82%BFcial-intelligence/publications
Ingenbleek, P. (2007)., “Value-informed pricing in itsorganizationalits organizational
context: literature review, conceptualframeworkconceptual framework, and
directions for future research”, Agriculturalresearch. Agricultural Economics
Research, Vol. 7, pp. 441-58.

74
INTRAC (2017). Sampling. intrac.org. https://www.intrac.org/wpcms/wp-
content/uploads/2017/01/Sampling.pdf
IOETI. (2020). 2020 The Age of Digital Transformation in Tourism Sector.
https://ioeti.org/2020-the-age-of-digital-transformation-trends-in-tourism-sector/
Ismail, M. H., Khater, M., & Zaki, M. (2017). Digital Business Transformation and
Strategy : What Do We Know So Far ? (Issue November 2017).
https://www.researchgate.net/publication/338687507_
Ivarsson, H., & Moller, P. (2020). Developing Value-Based Pricing for A New Product-
Service System.
https://odr.chalmers.se/bitstream/20.500.12380/301086/1/E2020_039.pdf
Jaakkola, M., & Möller, K. (2019). Strategic marketing and business performance : A
study in three European ‘ engineering countries ’ [Aalto University School of
Economics].
https://www.researchgate.net/publication/228117079_Strategic_marketing_and_busi
ness_performance_A_study_in_three_European_engineering_countries
Johnson, G. & Scholes, K. (2005). Exploring corporate strategy: text and cases
Jurevicius, O. (2013). Horizontal Integration. Strategic Management Insight.
https://strategicmanagementinsight.com/topics/horizontal-integration.html
Kabir, S. (2016). In book: Basic Guidelines for Research: An Introductory Approach for
All Disciplines (1st ed., p. 169;202). Book Zone Publication.
Kamau, J. P. W. (2016). Travel agencies responses to internet evolution in Nairobi
County: An analysis of competitive strategies. (Unpublished Doctoral
Dissertation, Kenyatta University, Kenya).
Kapoor, N. (2020). Still Confusing Digital Transformation with Digital Marketing?
Relevance. https://www.relevance.com/still-confusing-digital-transformation-
with-digital-marketing/
Kenya Association of Tour Operators (KATO). (2019). KATO Accredited Safari
Operators Guide 2018–2019 KENYA. Issuu.
https://issuu.com/landmarine/docs/kato_safari_operators_guide_2018-20
Khadka, K., & Maharjan, S. (2017). Customer Satisfaction and Customer Loyalty.
https://core.ac.uk/download/pdf/161421179.pdf

75
Kidane, T.K. & Sharma, K.R.R. (2016). Factors affecting consumers’ purchasing decision
through e-commerce. Proceedings of 2016 international conference on industrial
Engineering and operations management.
Kienzler, M. (2017). Value-based pricing and cognitive biases: An overview for business
markets. Industrial Marketing Management, 68, 86–94.
Kienzler, M., & Kowalkowki, C. (2017). Pricing strategy: A review of 22 years of
marketing research. Journal of Business Research.
Kihima, B. O. (2015). Domestic tourism in Kenya: Trends, initiatives and practices. The
East African Review, 50(1), 22-39.
Kikemu, D. K. (2017). The Opportunities for Kenyan Inbound Tour Operators In
Marketing Kenya As A Tourist Destination Of Choice For The USA Tourism Market,
Nairobi, Kenya (Issue October) [Moi University].
http://ir.mu.ac.ke:8080/xmlui/bitstream/handle/123456789/743/Daniel kikemu for
printing FINAL 30 Aug.pdf?sequence=1&isAllowed=y
Kimutai, J. J. (2015). Influence of Strategic Marketing Practices on Performance of
Firms in The Flower Industry in Kenya [University of Nairobi].
http://erepository.uonbi.ac.ke/bitstream/handle/11295/94511/Kimutai_Influence of
strategic marketing practices on performance of firms in the flower industry in
Kenya.pdf?sequence=1
Kirumbi, A. (2018). Modelling the point spread function using principal component
analysis (Department of Physics and Astronomy and College of Arts and
Science). The University of Ohio.
Kotler, P., & Armstrong, G. (2012). Principles of Marketing (14th ed.). Pearson
Education Limited.
Kubai, E. (2019). Reliability and Validity of Research Instruments. Presentation, Lusaka,
Zambia.
Kudelko, J., Wirth, H., Bachowski, C., & Gacek, J. (2015). Horizontal integration in the
development strategy of mining companies. Mining Science, 22, 97–114.
Kuhn, B. (2020). What is Value-Based Pricing? | Pros & Cons of Value-Based. Pasaban
Accounting Solutions, LLC. https://www.pasabanaccounting.com/guide-to-value-
based-pricing/
Kumar, R. (2015). Valuation (1st ed.). Academic Press.
Kwoba, V. (2018). Promoting domestic tourism in Kenya: an assessment of economic
significance and opportunities for tourism stakeholders in Nairobi. (Unpublished
Master’s Thesis, Strathmore University, Nairobi, Kenya).
76
Lanfontaine, & Slade. (2007). Vertical Integration and Firm. Journal of Economic
Literature
Le, H. (2019). Literature Review on Diversification Strategy , Enterprise Core
Competence and Enterprise Performance. American Journal of Industrial and
Business Management, 9(January), 91–108.
https://doi.org/10.4236/ajibm.2019.91008
Leijon, A. (2017). The Right Price – At What Cost? : A Multi-industry Approach in the
Context of Technological Advancement. https://kth.diva-
portal.org/smash/get/diva2:1158227/FULLTEXT01.pdf
Lich, A. L. (2020). What Makes a Great Digital Customer Experience? Bright IT.
https://www.bright.global/en/blog/what-makes-a-great-digital-customer-
experience
Lin, Y. T., Parlaktürk, A. K., & Swaminathan, J. M. (2013). Vertical Integration under
Competition: Forward, Backward, or No Integration? Production and Operations
Management, 23(1), 19–35.
Liozu, S. M. (2017). Value-based pricing special issue: Editorial. Journal of Revenue and
Pricing Management, 16(1), 1–3.
Liozu, S. M., & Hinterhuber, A. (2013). Pricing orientation, pricing capabilities, and firm
performance. Management Decision, 51(3), 594–614.
Livingston, E. H., & Wislar, J. S. (2016). Minimum Response Rates for Survey Research.
Archives of Surgery, 147(2), 2016. https://doi.org/10.1093/poq/nfn011.3.
Market Screener. (2019). Shoprite Holdings Limited: Shareholders Board Members
Managers and Company Profile | ZAE000012084 | MarketScreener.
Https://Www.Marketscreener.Com
McCombes, S. (2020). Descriptive research. Scribbr.
https://www.scribbr.com/methodology/descriptive-research/
McCormick, M. (2018). Pricing Strategies for Tour Operators and Online Travel Agents.
Black Curve. https://blog.blackcurve.com/pricing-strategies-for-tour-operators-
and-online-travel-agents

77
Melo, S. (2019). What is the goal of digital transformation? DataScope.
https://mydatascope.com/blog/en/what-is-the-goal-of-digital-transformation/
Metz, D., Ilies, L. & Nistor, R. L. (2020). The impact of organizational culture on
customer service effectiveness from a sustainability perspective. Sustainability,
12(15), 1-27.
Milano, S. (2017). Corporate Diversification Strategies. Small Business - Chron.Com.
https://smallbusiness.chron.com/corporate-diversification-strategies-61480.html
Ministry of Wildlife and Tourism, Kenya. (2020). COVID-19 and Tourism in Kenya:
Impact, Measures Taken and Recovery Pathways. https://www.tourism.go.ke/wp-
content/uploads/2020/07/Executive-Summary-COVID-19-and-Travel-and-
Tourism-Final-4.pdf
Mohajan, H. (2017). Two criteria for good measurements in research: Validity and
reliability. Manuscript, Chittagong. Annals of Spiru Haret University. Economic
Series, 17(4), 59–82.
Mokaya, S. O., Kanyagia, C. P., & Wagoki, J. (2012). Market Positioning and
Organizational Performance in the Airlines Industry in Kenya. International Journal
of Arts and Commerce, 1(4), 121–132.
https://ijac.org.uk/images/frontImages/gallery/Vol._1_No._4/11.pdf
Monroe, K. B. (2003). Pricing: Making Profitable Decisions (3rd ed.). McGraw-
Hill/Irwin.
Morris, M. H. (1987). Separate prices as a marketing tool. Industrial Marketing
Management, 16(2), 79–86.
Mukeshimana, A., Nkechi, I. E., & Jefferson, H. O. (2019). Effect of Strategic
Positioning on Organizational Performance of Independent Power Producers in
Rwanda : A Case Study of Selected IPPs. European Journal of Business and
Management Research, 4(5), 1–7.
https://www.ejbmr.org/index.php/ejbmr/article/view/82
Munikrishman, T.U., Imm, S.N., Ann, J.H., & Yusof, R.N.R., (2019). Intermediation
threat: Do small medium traditional travel agencies in Malaysia embrace ICT
adequately? Social Sciences and Humanities.
Musungu, M. N. (2020). Perceived Influence of Backward Integration Strategy on
Organizational Efficiency in the Cement Industry in Kenya.
http://erepository.uonbi.ac.ke/bitstream/handle/11295/154362/MBA%20Final%20
Project-MNM-5318-02122020.pdf?sequence=1&isAllowed=y
78
Muthama, A. M. & Ndeto, M. (2020). Effect of technology on strategic positioning of
Kenya’s tourism sector. International Journal of Business Management &
Finance, 3(2), 275-290.
Mwangi, A. N. (2016). The Effect of Diversification Strategies on The Performance of
Commercial Banks In Kenya. University of Nairobi.
Mwangi, G. J. (2017). Diversification Strategies and Performance of Small and Medium
Enterprises(Issue May). Kenyatta University.
Marangu, W., Oyagi, B., & Gongera, G. E. (2014). An analysis of concentric
diversification strategy on Organization competitiveness: Case of sugar firms in
Kenya. European Journal of Business and Management, 6(19), 175–180.
Nadkarni, S. & Prugl, R. (2021). Digital transformation: a review, synthesis
and opportunities for future research. Management Review Quarterly, 71(1), 233–
341.
Nagle, T. T., Hogan, J., & Zale, J. (2011). The Strategy and Tactics of Pricing: A Guide
to Growing More Profitably (5th ed.). Routledge.
Nassaji, H. (2015). Qualitative and descriptive research: Data type versus data analysis.
Language Teaching Research, 19(2), 129–132.
Ndope, K. (2015). The Effect of Global Environmental Turbulence on the Performance of
Firms in the Tourism Sector in Kenya: A Case Study of Tour Operators.
http://erepo.usiu.ac.ke/bitstream/handle/11732/630/The%20Effect%20of%20Glob
al%20Environmental%20Turbulence%20on%20the%20Performance%20of%20Fi
rms%20in%20the%20Tourism%20Sector%20in%20Kenya%20A%20Case%20St
udy%20of%20Tour%20Operators.pdf?sequence=3&isAllowed=y
Ndung’u, G. W. (2019). Adoption of Diversification Strategies and the Performance of
State Owned Sugar Firms in Western Region Kenya.
http://41.89.195.24/bitstream/handle/123456789/1356/Gladys%20Thesis%20Novem
ber.pdf?sequence=1&isAllowed=y
Neill, S., & Rose, G. M. (2018). The effect of strategic complexity on marketing strategy
and organizational performance (p. 10). Milgard School Business University.
https://citeseerx.ist.psu.edu/viewdoc/download?doi=10.1.1.871.5948&rep=rep1&typ
e=pdf
Ngaru, B. W. (2016). An Assessment of Competitive Advantage Gained through
Horizontal Integration, A Case of Insurance Company of Ease Africa Lion Group.
http://erepo.usiu.ac.ke/bitstream/handle/11732/2646/Thesis%20Bertha.pdf?sequen
ce=1&isAllowed=y

79
Nurton, J. (2019). The IP behind the AI boom. WIPO Magazine.
https://www.wipo.int/wipo_magazine/en/2019/01/article_0001.html
Nuseir, M. T. (2020). Is advertising on social media effective an empirical study on the
growth of advertisements on the Big Four [Facebook, Twitter, Instagram,
WhatsApp. International Journal of Procurement Management, 13(1), 134-142.
Nwankpa, J. K., & Roumani, Y. (2016). IT Capability and Digital Transformation : A
Firm Performance Perspective. International Conference on Information Systems, 1–
16.
Okeyo, V. ., & Lewa, E. (2020). Effect of Strategic Positioning on Organizational
Performance of Commercial Banks in Mombasa County. The Strategic Journal of
Business and Change Management, 7(September), 17.
http://strategicjournals.com/index.php/journal/article/view/1751
O’Shannassy, T. (2008). Sustainable competitive advantage or temporary competitive
advantage. Journal of Strategy and Management, 1(2), 168–180.
Ohmae, K. (1986). Mind of the Strategist: Business Planning for Competitive Advantage
(Business Library) (2nd ed.). Penguin Business Library.
Oladimeji, M. S., & Udosen, I. (2019). The Effect of Diversification Strategy on
Organizational Performance. Journal of Competitiveness, 11(4), 120–131.
Olve, N.G., Cöster, M., Iveroth, E., Petri, C-J. & Westelius, A. (2013), Prissättning:
affärsekologier, affärsmodeller, prismodeller, Lund: Studentlitteratur
Omare, M. (2016). The Factors that affect Kenyan Domestic Tourists from Visiting
Tourism Facilities in Kenya: Case of Nairobi, Mombasa and Nakuru Towns.
http://library.kisiiuniversity.ac.ke:8080/xmlui/bitstream/handle/123456789/254/Dom
estic_tourism_%285%29.PDF?sequence=1&isAllowed=y
Oladimeji, M. S., & Udosen, I. (2019). THE EFFECT OF DIVERSIFICATION
STRATEGY ON ORGANIZATIONAL PERFORMANCE. Journal of
Competitiveness, 11(October), 120–131.
https://doi.org/10.7441/joc.2019.04.08%0ATHE
Osiako, P. O. (2021). Research Trends and Perspectives on Domestic Tourism in Kenya :
A Review. African Journal of Hospitality, Tourism and Leisure, 10(1), 288–301.
https://www.ajhtl.com/uploads/7/1/6/3/7163688/article_19_10_1_288-301-1.pdf

80
Oyza, I., & Edwin, A. M. (2015). Effectiveness of Social Media Networks as a Strategic
Tool for Organizational Marketing Management. The Journal of Internet Banking
and Commerce, 01(s2), 1. https://doi.org/10.4172/1204-5357.s2-006
Pearce, J., & Robinson, R. (2010). Strategic Management: Formulation, Implementation
and Control. McGraw Hill Irwin.
Penc-Pietrzak, I. (2014). Competitive Strategy in Turbulent Environment [E-book]. Lodz
University of Technology.
http://repozytorium.p.lodz.pl/bitstream/handle/11652/1241/Penc-
Pietrzak_Competitive_strategy_in_turbulent_environment_2014.pdf?sequence=3
&isAllowed=y
Picazo, P. & Moreno-Gil, S. (2018). Tour operators' marketing strategies and their impact
on prices of sun and beach package holidays. Journal of Hospitality and Tourism
Management, 35(2018), 17-28.
Picone, P. M. (2011). Conglomerate diversification strategy and corporate performance.
University of Catania. https://nanopdf.com/download/conglomerate-
diversification-strategy-and-corporate_pdf
Porter, M. E. (2017). Competitive strategy: Techniques for analyzing industries and
competitors. Scotts Valley, California: CreateSpace Independent Publishing
Platform
Pratap, A. (2018, December 28). Toyota Motors Strategic Analysis. Notesmatic.
https://notesmatic.com/2018/09/toyota-motors-strategic-analysis/
Raghuramapatruni, R. & Kosuri, S. R. (2017). The traits of success in a VUCA world.
IOSR Journal of Business and Management (IOSR-JBM), 1(1), 16-22.
Rahi, S. (2017). Research Design and Methods: A Systematic Review of Research
Paradigms, Sampling Issues and Instruments Development. International Journal of
Economics & Management Sciences, 06(02), 1–5. https://doi.org/10.4172/2162-
6359.1000403
Robins, J. A., & Wiersema, M. F. (2003). The measurement of corporate portfolio
strategy: analysis of the content validity of related diversification indexes. Strategic
Management Journal, 24(1), 39–59. https://doi.org/10.1002/smj.282
81
Roser, M. (2017). Tourism. Our World in Data. https://ourworldindata.org/tourism
Riasat, F., & Nisar, Q. A. (2015). Relationship among Strategic Positioning , Strategic
Customer Relationship Management and Organization ’ s Performance.
International Journal of Management Research and Emerging Sciences, 5(January),
18. https://www.researchgate.net/publication/320331710%0ARelationship
Sahni, J., & Juhari, A. S. (2019). Corporate Diversification: A Fundamental Exploration
of General Business Environments, Industry Environments and Firm
Characteristics. Academy of Strategic Management Journal, 18(2), 1.
https://www.abacademies.org/articles/corporate-diversification-a-fundamental-
exploration-of-general-business-environments-industry-environments-and-firm-
characteristic-8065.html
Sahu, P. K. (2013). Research methodology: A guide for researchers in agricultural
science, social science and other related fields (p. 432). Mumbai: Nadia: Springer.
Sammut-Bonnici, T., & Channon, D. F. (2015). Pricing Strategy. Wiley Encyclopedia of
Management, 1–3. https://doi.org/10.1002/9781118785317.weom120162
Saqib, N. (2019). A positioning strategy for a tourist destination, based on analysis of
customers’ perceptions and satisfactions. Journal of Tourism Analysis: 26(2),
131–151.
Saqib, N. (2020). Positioning: A literature review. PSU Research Review, 1-29.
Su, W., & Tsang, E. W. K. (2015). Product Diversification and Financial Performance:
The Moderating Role of Secondary Stakeholders. Academy of Management
Journal, 58(4), 1128–1148.
Suominen, K. (2017). Fuelling trade in the digital era: Policy roadmap for developing
countries. Geneva: International Centre for Trade and Sustainable Development
(ICTSD).
Taherdoost, H. (2016). Sampling methods in research methodology; how to choose a
sampling technique for research. How to Choose a Sampling Technique for
Research. California, CA: Sage Publications.
Tarver, E. (2019). Horizontal Integration Definition and Examples. Investopedia.
https://www.investopedia.com/ask/answers/051315/what-are-some-examples-
horizontal-integration.asp
Teece, D. J. (2018). Vertical Integration. In D. J. Teece & M. Augier (Eds.), The
Palgrave Encyclopedia of Strategic Management (p. 27). Palgrave Macmillan.

82
Tussyadiah, L. (2020). A review of research into automation in tourism: Launching the
annals of tourism research curated collection on artificial intelligence and robotics
in tourism. Annals of Tourism Research, 1(1), 1-45.
Ülgen, M. K. S. (2004). İşletmelerde Stratejik Yönetim. Beta Basim Yayin.
United Nations Conference on Trade and Development. (2007). FDI in Tourism: The
Development Dimension. https://unctad.org/system/files/official-
document/iteiia20075_en.pdf
UNWTO. (2019). International tourism up 4% in first half of 2019, World Tourism
Organization reports. https://www.unwto.org/global/press-release/2019-09-
09/international-tourism-4-first-half-2019-world-tourism-organization-reports
UNWTO. (2020). International travel plunges 70% in the first eight months of 2020.
UNWTO World Tourism Barometer. https://www.e-
unwto.org/doi/epdf/10.18111/wtobarometereng.2020.18.1.6
User, S. (2015). Concept 5.5: The 3Cs model for pricing. Malea Fashion District.
http://www.maleafd.com/index.php/2-uncategorised/55-concept-
55#:%7E:text=The%203C%22s%20model%20is,%3A%20costs%2C%20custome
rs%20and%20competitors.
Van, D. J. Martin, Noble, N. Hulland, J. Ostrom, A. Grewal, D. & Petersen, A.,(2017),
Domo Arigato Mr. Roboto: Emergence of Automated Social Presence in
Organizational Frontlines and Customers’ Service Experiences. Journal of Service
Research, 20(1) 43-58.
Van Remsburg, M. J. (2014). Relevance of travel agencies in the digital age. African
Journal of Hospitality, Tourism and Leisure, 3(2), 1-9.
Vial, G., (2019). Understanding digital transformation: A review and a research agenda.
Journal of Strategic Information Systems.
Vonk, J. (2017). Sampling [Slides]. JenniferVonk.Com.
https://www.jennifervonk.com/uploads/7/7/3/2/7732985/lecture_6_sampling.pdf
Wei, F. (2016). Research on the internet's impact on tourism distribution channels in the
era of smart tourism. Advances in Intelligent Systems Research, 130(1), 253-256.
Wells, C. S., & Wollack, J. A. (2003). An Instructor’s Guide to Understanding Test
Reliability. An Instructor’s Guide to Understanding Test Reliability

83
Wiersema, M. F., & Beck, J. B. (2017). Corporate or Product Diversification. Oxford
Research Encyclopedia of Business and Management, 1–20.
https://doi.org/10.1093/acrefore/9780190224851.013.14
Wills, M. K. W. (2017). How to Define Research Design. Pen and the Pad.
https://penandthepad.com/define-research-design-7402461.html
World Bank. (2017). An Economic Assessment of Tourism in Kenya.
http://documents1.worldbank.org/curated/en/573241507036299777/pdf/AUS1675
8-WP-REVISED-P156577-OUO-9-Tourism-report-FINAL.pdf
World Tourist Cities Federation (2021). Report on world tourism economy trends.
Retrieved on 10th May 2021 from
https://en.wtcf.org.cn/Research/WTCFReports/2021031220363.html
Yamane, T. (1967). Statistics: An Introductory Analysis (2nd ed.). Harper and Row.
Ziehrock, L., & Zhang, M. (2019). Advantages and disadvantages of different pricing
strategies and instruments regards consulting focused on China.
https://www.researchgate.net/publication/343836781_Advantages_and_disadvant
ages_of_different_pricing_strategies_and_instruments_regards_consulting_focuse
d_on_China
Ziyadin, S., Suieubayeva, S., & Utegenova, A. (2019). Digital Transformation in
Business. Lecture Notes in Networks and Systems, 408–415.

84
APPENDICES
APPENDIX 1: INTRODUCTORY COVER LETTER
United
States
International
University-Africa
National Commission for Science Technology and Innovation P.
O. Box 30623, 00100, Nairobi, KENYA.
27th July, 2021
Dear Sir/Madam
REF: PERMISSION TO CONDUCT RESEARCH-VANESSA STELLA OCHIENG
STUDENT ID NO 660883
The bearer of this letter is a student at United States International University (USIU) —Africa and is
pursuing Master of Business Administration.
As part of the progranL the student is required to undertake a dissertation on "Effect of Strategic Marketing Positioning on Effective Organizational Performance of Domestic Tour Operators in
Kenya." which requires the student to collect data. The proposal has been subjected to ethical review
and positive verdict given by the Institutional Review Board.
Kindly assist the student with the research permit and should you have any queries contact the
undersigned.
Yours Sincerely,
Prof. Amos Njuguna, Dean — School of Graduate Studies, Research and Extension
Tel: 0730 116 442
Email: [email protected]
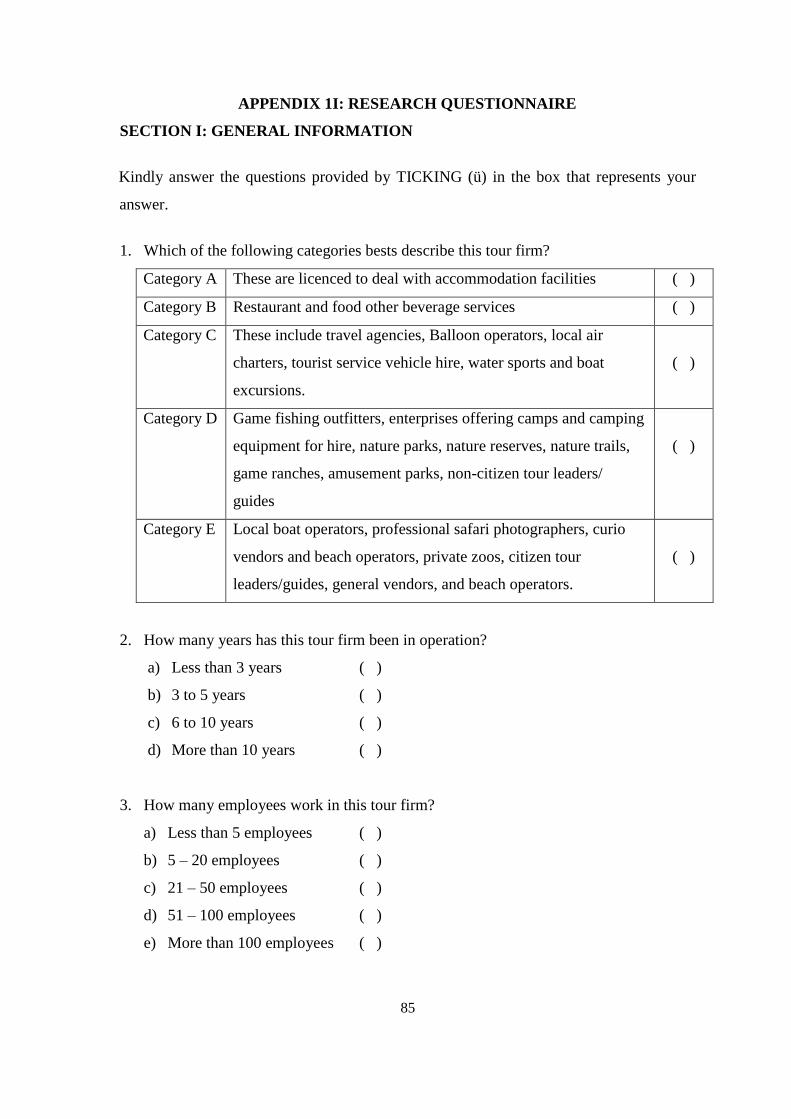
85
APPENDIX 1I: RESEARCH QUESTIONNAIRE
SECTION I: GENERAL INFORMATION
Kindly answer the questions provided by TICKING (ü) in the box that represents your
answer.
1. Which of the following categories bests describe this tour firm?
Category A These are licenced to deal with accommodation facilities ( )
Category B Restaurant and food other beverage services ( )
Category C These include travel agencies, Balloon operators, local air
charters, tourist service vehicle hire, water sports and boat
excursions.
( )
Category D Game fishing outfitters, enterprises offering camps and camping
equipment for hire, nature parks, nature reserves, nature trails,
game ranches, amusement parks, non-citizen tour leaders/
guides
( )
Category E Local boat operators, professional safari photographers, curio
vendors and beach operators, private zoos, citizen tour
leaders/guides, general vendors, and beach operators.
( )
2. How many years has this tour firm been in operation?
a) Less than 3 years ( )
b) 3 to 5 years ( )
c) 6 to 10 years ( )
d) More than 10 years ( )
3. How many employees work in this tour firm?
a) Less than 5 employees ( )
b) 5 – 20 employees ( )
c) 21 – 50 employees ( )
d) 51 – 100 employees ( )
e) More than 100 employees ( )
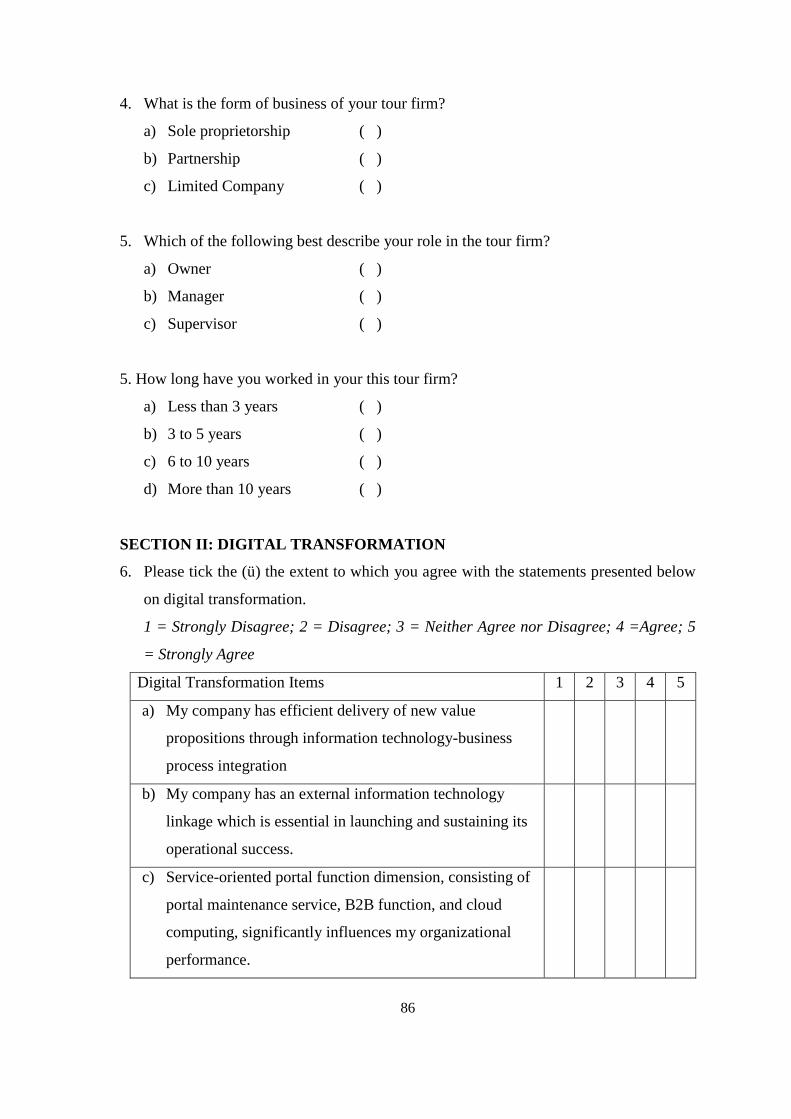
86
4. What is the form of business of your tour firm?
a) Sole proprietorship ( )
b) Partnership ( )
c) Limited Company ( )
5. Which of the following best describe your role in the tour firm?
a) Owner ( )
b) Manager ( )
c) Supervisor ( )
5. How long have you worked in your this tour firm?
a) Less than 3 years ( )
b) 3 to 5 years ( )
c) 6 to 10 years ( )
d) More than 10 years ( )
SECTION II: DIGITAL TRANSFORMATION
6. Please tick the (ü) the extent to which you agree with the statements presented below
on digital transformation.
1 = Strongly Disagree; 2 = Disagree; 3 = Neither Agree nor Disagree; 4 =Agree; 5
= Strongly Agree
Digital Transformation Items 1 2 3 4 5
a) My company has efficient delivery of new value
propositions through information technology-business
process integration
b) My company has an external information technology
linkage which is essential in launching and sustaining its
operational success.
c) Service-oriented portal function dimension, consisting of
portal maintenance service, B2B function, and cloud
computing, significantly influences my organizational
performance.
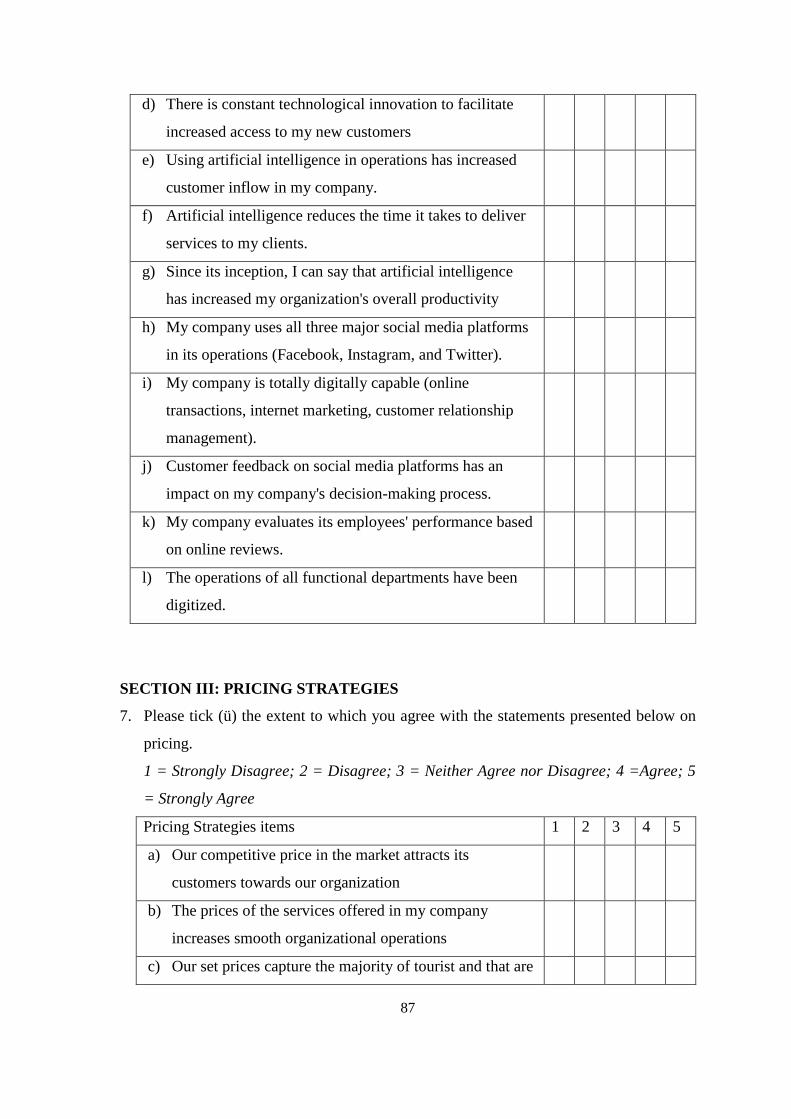
87
d) There is constant technological innovation to facilitate
increased access to my new customers
e) Using artificial intelligence in operations has increased
customer inflow in my company.
f) Artificial intelligence reduces the time it takes to deliver
services to my clients.
g) Since its inception, I can say that artificial intelligence
has increased my organization's overall productivity
h) My company uses all three major social media platforms
in its operations (Facebook, Instagram, and Twitter).
i) My company is totally digitally capable (online
transactions, internet marketing, customer relationship
management).
j) Customer feedback on social media platforms has an
impact on my company's decision-making process.
k) My company evaluates its employees' performance based
on online reviews.
l) The operations of all functional departments have been
digitized.
SECTION III: PRICING STRATEGIES
7. Please tick (ü) the extent to which you agree with the statements presented below on
pricing.
1 = Strongly Disagree; 2 = Disagree; 3 = Neither Agree nor Disagree; 4 =Agree; 5
= Strongly Agree
Pricing Strategies items 1 2 3 4 5
a) Our competitive price in the market attracts its
customers towards our organization
b) The prices of the services offered in my company
increases smooth organizational operations
c) Our set prices capture the majority of tourist and that are

88
willing to pay
d) My organization's service prices are comparable to those
of competitors and the market.
e) Customer perception of the product offering, or service
affects the profitability of my company
f) My organization uses discounts and sales to generate
sales and acquire new consumers.
g) The price of the product/service more often determines
my organizational operational capability
h) Credit sales or payment in instalments enhances my
company’s operational capability
i) My company sales have increased profitability of the
organization over the years
j) Premium price for high quality services given (VIP,
Executive services) promotes flexibility of my
organizational operations.
k) Lower costs in my organization compared to competitors
ensure client loyalty.
SECTION IV: DIVERSIFICATION STRATEGIES
8. Please tick (ü) the extent to which you agree with the statements presented below
on diversification.
1 = Strongly Disagree; 2 = Disagree; 3 = Neither Agree nor Disagree; 4 =Agree; 5
= Strongly Agree
Diversification Strategies Items 1 2 3 4 5
a) Diversification influences good decision making on my
profitable investments
b) Diversification has yielded more benefits that were not
being enjoyed before
c) In my company, diversification methods have resulted in
enhanced organizational growth and sustainability.
d) My company's brand loyalty has improved as a result of

89
diversification.
e) My organization, through diversification has increased
product quality
f) The benefits of diversification are more than the costs
incurred within my organization
g) There has been a concerted effort by my company to
remove or reduce middlemen which has yielded cost
savings
h) Diversification is a priority for new customer acquisition
strategies in my company
i) Diversification enables my organization to leverage its
resources effectively.
j) Through product diversification, improved organizational
performance has been experienced in my company
SECTION V: ORGANIZATIONAL PERFOMANCE
9. On a scale of 1-5, please rate organizational effectiveness of your tour firm over the
past 3 years of operations using the following indicators: -
1 = Very low; 2 = Low; 3 = Moderate; 4 = High; 5=Very high
Organizational Performance Indicators 1 2 3 4 5
a) Customer Satisfaction
b) Growth
c) Profitability
d) Employee retention
e) Internal business process efficiency
f) Organizational goal attainment
Thank you for your participation!
90
APPENDIX III: CONSENT FORM
My name is Vanessa Stella Ochieng. I am a post-graduate student pursuing a Masters in
Business Administration (MBA) degree at United States International University - Africa
(USIU-A). I am doing a research project as part of my degree requirements. The title of
the research project is “Effect of Strategic Marketing Positioning on Effective
Organizational Performance of Domestic Tour Operators in Kenya.” The research is
supervised by Doctor Mary Mutisya at USIU-A.
The objective of this research is to see how strategic marketing positioning affects the
effective organizational performance of Kenyan domestic tour operators. The factors
being tested are the effect of digital transformation on effective organizational
performance of domestic tour operators in Kenya, how pricing affects effective
organizational performance of domestic tour operators in Kenya and to determine the
influence of diversification on effective organizational performance of domestic tour
operators in Kenya. We plan to collect and analyze data from domestic tour operators,
with top managers and supervisors selected as the focus group.
There is no direct benefit to you from this research project. However, your participation
will increase knowledge and assist us to gather information and possibly offer
recommendations on various strategic marketing positions that many other organizations
can undertake to improve on the effectiveness of their organizational performance.
Your participation in this study is voluntary. I will highly appreciate if you would
spare several minutes to fill in all sections of the questionnaire to enable me to
complete the study. The findings of this study will solely be used for the purpose of
research only. Your identity will be treated with the utmost confidentiality. No
name of the respondent or institution is required.
The total time you will take to interact with the researcher is less than 30 minutes.
If you have any questions or concerns related to the research project, you may contact me
at the following number: +254 731144469 --- or by email :
[email protected] contact Dr Mary Mutisya by email:

91
[email protected]: +254 722299278.
If you have questions about regarding your rights in the research, you may contact the
Chairperson of the USIU Institutional Review Board (IRB) at this email: [email protected].
By signing or indicating your thumbprint below, you consent to participate in this
research project.
Study Participant Date
Principal Investigator Date

92
APPENDIX IV: DEBRIEF FORM
I wish to thank you for participating in this research project. Your participation will help
us in determining the effect of strategic marketing positioning on the effective
organizational performance of domestic tour operators in Kenya
Do not hesitate to contact me or Dr Mary Mutisya on the phone numbers and email
indicated in the consent form.
Your participation is highly appreciated.
Yours faithfully,
Vanessa S. Ochieng
93
APPENDIX V: IRB LETTER
REF: USIU-AlRB/272-2021
TO: VANESSA STELLA
OCHIENG
Dear Sir/madam
United States
International
University-Africa
27th July, 2021
RE: EFFECT OF STRATEGIC MARKETING POSITIONING ON EFFECTIVE ORGANIZATIONAL PERFORMANCE OF DOMESTIC TOUR OPERATORS IN KENYA
This is to inform you that IRB has reviewed and approved your above research proposal. Your application approval number is USIU-NlRB/272-2021. The approval period is 27th July 2021 — 27th
July 2022
This approval is subject to compliance with the following requirements;
Only approved documents including (informed consents, study instruments, MTA) will be used ii. Al changes including (amendments, deviations, and violations) are submitted for review and approval by IRB.
i i i . Death and life threatening problems and serious adverse events or unexpected adverse events whether related or unrelated to the study must be reported to IRB within 72 hours of notification iv. Any changes, anticipated or otherwise that may increase the risks or affected safety or welfare of study participants and others or affect the integrity of the research must be reported to IRB within 72 hours v. Submission of a request for renewal of approval at least 60 days prior to expiry of the
approval period. Attach a comprehensive progress report to support the renewal. vi. Submission of an executive summary report within 90 days upon completion of the study
to IRB
Prior to commencing your study, you will be expected to obtain a research license from National Commission for Science, Technology and Innovation (NACOSTI) https://researchportal.nacosti.qo.ke and also obtain other clearances needed.
Yours sincerely
Juliana M. Namada
Institutional Review Board (IRB) Chair

94
APPENDIX VI: NACOSTI RESEARCH PERMIT
THE SCIENCE, TECHNOLOGY AND INNOVATION ACT, 2013

95
The Grant of Research Licenses is Guided by the Science, Technology and Innovation (Research Licensing)
Regulations, 2014
CONDITIONS
1. The License is valid for the proposed research, location and specified period
2. The License any rights thereunder are non-transferable
3. The Licensee shall inform the relevant County Director of Education, County Commissioner and County
Governor before commencement of the research
4. Excavation, filming and collection of specimens are subject to further necessary clearence from relevant
Government Agencies
5. The License does not give authority to tranfer research materials
6. NACOSTI may monitor and evaluate the licensed research project
7. The Licensee shall submit one hard copy and upload a soft copy of their final report (thesis) within one year of
completion of the research
8. NACOSTI reserves the right to modify the conditions of the License including cancellation without prior notice
National Commission for Science, Technology and Innovation off Waiyaki Way, Upper Kabete,
P. O. Box 30623, 00100 Nairobi, KENYA
Land line: 020 4007000, 020 2241349, 020 3310571, 020 8001077
Mobile: 0713 788 787 / 0735 404 245
E-mail: [email protected] /
[email protected] Website:
www.nacosti.go.ke