effect of soil buffering capacity and clay minerals on the ...msss.com.my/mjss/full...
TRANSCRIPT

___________________*Corresponding author : [email protected]
INTRODUCTIONPotassium in soil exists in four different forms including structural potassium (5000-25000 mg/kg), fixed or non-exchangeable potassium (50-750 mg/kg), exchangeable potassium (40-600 mg/kg) and soluble potassium (1-10 mg/kg) (Sparks 2000). The amount of potassium in each one of these forms is controlled by the quantity of clay, potassium uptake by plants, application of potassium fertilisers, losses through leaching, and the relative effect of K+ fixation and release processes that occur in the soil (Kirkman et al. 1994). Long-term non-application of K would cause a large amount of soil K to be depleted (Tan et al. 2017). Soils with different properties have different amounts of non-exchangeable potassium (Jalali, 2007). Non-exchangeable potassium is the main portion of the reserve of available potassium in soil as well as is an important factor to determine soil potassium fertility (Huoyan et al. 2016). Questions such as
ISSN: 1394-7990Malaysian Journal of Soil Science Vol. 22:59-75 (2018) Malaysian Society of Soil Science
Effect of Soil Buffering Capacity and Clay Minerals on the Rate Coefficient of Non-Exchangeable Potassium Release
Sirous Shakeri
Department of Agriculture, Payame Noor University (PNU), Tehran, Iran
ABSTRACTPotassium (K) is an essential element for plant growth. The difference in K release from the non-exchangeable K sources can be a result of soil properties. This research was carried out to assess the effect of soil buffering capacity and clay minerals on the rate coefficient of non-exchangeable potassium release as well as evaluation of kinetic equations in describing and predicting non-exchangeable potassium release in calcareous soils in the southwest of Iran. Extraction of non-exchangeable potassium was performed with 0.01 M CaCl2 and 0.01 M oxalic acid consecutively 15 times within 15-min intervals, in duplicate. The results showed that due to the high buffering capacity of the soils resulting from a high carbonate level and neutralising oxalic acid, no significant difference was observed between the amount of cumulative non-exchangeable potassium released by oxalic acid and CaCl2. The results also showed that the coefficient of potassium release rate (b) in Elovich equation is significantly correlated with non-exchangeable potassium and some physical and chemical characteristics, as samples containing more clay and organic carbon with more cation exchange capacity had the maximum potassium release rates. Therefore the coefficient of potassium release rate (b) can be a more accurate indicator for plant available potassium.
Keywords: Non-exchangeable potassium, calcareous soils, potassium release rate.
Malaysian Journal of Soil Science Vol. 22, 201860
how potassium is released in the soil solution and which part of that has more importance for plant utilisation and production, are very important and several studies have been conducted about them (Havlin and Westfall 1985). Availability of non-exchangeable potassium does not depend on its amount, but on the rate of release and amount of potassium, which could be changed into its exchangeable form (Jalali 2005). The difference in K release from the non-exchangeable K sources can result from the differences in soil texture and organic matter content of soils (Akbas et al. 2017). In calcareous soils, Ca2+ is known as a common cation that replaces interlayer potassium. Presence of Ca2+ in irrigation water and soil minerals, which are able to release Ca2+, has a great importance in the determination of leaching K+ in soils of arid and semi-arid regions. Further, sequential extractions of K+ by Ca2+ is one of the suitable methods to evaluate the release kinetics of non-exchangeable potassium in calcareous soils (Jalali and Rowell 2003). Also, K is weakly maintained compared to Ca2+, therefore K is more readily exchangeable than Ca2+ (Zhang et al. 2015).
Roots of plants exude large amounts of organic acids in their rhizosphere. Among the different roles of rhizosphere secretions, the capacity of organic acids in dissolving the cations which have been adsorbed or have precipitated are important (Jones and Edwards1993; Rajawat et al. 2016). Increasing mineral weathering by creating a complex of metal-organic compounds and promoting the exchange of H+ by K+, are two main mechanisms, which increase availability of non-exchangeable potassium by using organic acids (Wang et al. 2011). Oxalic acid is an organic acid that has an important role in improving availability of elements in the soil. This acid is one of the simplest acids with two pKa values, 1.23 and 4.19, which occur in sediments, forest and agriculture soils especially in the rhizosphere of plants (Fox and Comerford 1990).
Different equations have been used by researchers to describe and predict the mechanism of non-exchangeable potassium release as well as its rate of release. Some of these equations, most used by researchers, are first order, parabolic diffusion, power function and Elovich equation (Martin and Sparks 1983; Jalali 2005 ;Srinivasarao et al. 2006; Rajashekhar 2015). Sequential extractions by different extractants such as 0.01 M calcium chloride (Srinivasarao et al. 2006; Hosseinpur and Motaghian 2013; Rajashekhar 2015; Ghiri et al. 2011) and low-molecular-weight organic acids (Jalali 2005; Jalali and Zarabi 2006; Srinivasarao et al. 2006) are some of the methods used to release non-exchangeable potassium. The purpose of conducting this research was (i) to assess the effect of soil buffering capacity and clay minerals on the rate coefficient of non-exchangeable potassium release, and (ii) to evaluate kinetic equations that best describe and predict non-exchangeable potassium release in calcareous soils of Bahmaei plain in Kohgiluyeh and Boyer-Ahmad Province in the southwest of Iran.

Malaysian Journal of Soil Science Vol. 22, 2018 61
MATERIALS AND METHODS
Study Area CharacteristicsThe study area is located between longitudes 30°39’ 10” E to 31°11’ 23” E and latitudes 49°51’ 44” N to 50°26’ 43”N, in the southwest of Iran. The average altitude is 1470 m. The climate of the region is arid and semi-arid. The mean annual temperature and precipitation are 20.5 °C and 480 mm, respectively. In general, the mountains surrounding the study area are a small part of the great Zagros sync. The studied pedons are mostly located on calcareous deposits. Predominant formations in the area are alluvial belonging to the lower cretaceous of Darian formation.
Soil Sampling and Soil AnalysesBased on aerial photos and topographic maps, physiographic units were distinguished and separated, and on each unit, a profile was dug and four representative pedons were selected. Soil samples were prepared in each diagnostic horizon to determine physico-chemical properties, mineralogical analyses, different K+ forms, and desorption kinetic experiments. Particle-size distribution was determined by the hydrometer method (Buoyoucos 1962). Calcium carbonate equivalent (CCE) was measured by back neutralisation titration with HCl (Loeppert and Suarez 1996). Measurement of organic carbon (OC) was by wet oxidation in the presence of potassium dichromate and sulfuric acid followed by back titration using ferrous ammonium sulfate to determine the unreacted dichromate based on the procedures of Nelson and Sommers (1982), soil pH from saturated paste and electrical conductivity (EC) in soil saturated extract using a conductometer, cation exchange capacity (CEC) using sodium acetate (CEC at pH 7 with Ammonium Acetate) (Chapman 1965) and gypsum by precipitation with acetone (Richards 1954). Soluble K+ was measured by flame photometer in the saturated extract. Exchangeable K+ was extracted by 1.0 M NH4OAc at pH 7.0 (McLean and Watson 1985). Non-exchangeable K+ was extracted by boiling 1.0 M HNO3 (Pratt 1965). Digestion by aqua-regia and HF method was carried out to determine total K+ (Buckley and Cranston 1971).
After performing physico-chemical tests and estimating various potassium forms on all samples, four surface samples were selected to conduct kinetics of non-exchangeable potassium release. First, exchangeable potassium was removed through saturation by equilibrating 10 g soil with 1 M CaCl2, three times for 48 h. Then the extra CaCl2 was washed out of soil by suspending with alcohol and deionised water followed by centrifugation. Samples were dried in an oven at 65°C and ground to resolve the agglomeration. In the next step, 20 mLof calcium chloride solution (0.01 M) was added to a centrifuge tube containing Ca-saturated soil (2 g). Similarly, in another centrifuge tube, 2 g of soil and 20 mLof oxalic acid solution (0.01 M) were added respectively. The extraction pairs, as prepared for different samples, were stirred on a shaker for 15 min at 25 °C, centrifuged and the supernatant solution was stored for subsequent determination. The remaining

Malaysian Journal of Soil Science Vol. 22, 201862
soil in the tube was re-extracted a further 14 times and the released potassium in each of the 15 stages was determined for K+ concentration by flame photometry (Elico Model CL-360) (Jalali 2006).
Then the released non-exchangeable potassium was fitted with different kinetics equations versus time. These equations are as follows:
ln (Yº – Y ) = a – b t First orderY = a + b ln t ElovichY = a + b t1/2 Parabolic diffusionsln Y = ln a + b ln t Power function
Y: is the amount of cumulative potassium (mg/kg), released within the time t (h), Yº: is the maximum released cumulative potassium (mg/kg) and a and b are the constants of the equations. The equations were compared based on coefficients of determination (r2) and standard errors of estimation (SE). The standard errors of estimation were calculated using the following relation:
SE = {(q-q*)2/(n-2)}1/2
In this equation q and q* represent the amount of the measured and predicted non-exchangeable potassium, respectively, and n is the number of the evaluated data.
For the preparation of samples for clay minerals analyses, cementation agents including carbonates, organic matter and iron oxides were removed by 1 N HCl, 30% H2O2 and dithionite citrate bicarbonate, respectively (Mehra and Jackson 1960; Kittrick and Hope 1963; Jackson 1975). Samples containing gypsum, depending on the quantity of gypsum, were washed by distilled water. After separation of the clay fraction, samples were saturated with Mg2+ and K+, using MgCl2 and 1 N KCl, respectively. The Mg2+ and K+ saturated samples were saturated using ethylene glycol and heated at 550 °C, respectively. In addition, to discriminate kaolinite and Fe chlorite, samples were treated with 1 N HCl. These five treatments were analysed by XRD diffraction. Relative abundance of clay minerals based on peak’s intensity was measured semi-quantitatively according to the method of Johns et al. (1954).
RESULTS AND DISCUSSION
Soil Characteristics Based on our results, calcic, gypsic and argillic subsurface horizons were observed in the studied area. Due to the arid and semi-arid climate as well as dry and wet periods of the region during the year, in addition to the calcareous and gypsum parent materials, calcic and gypsic subsurface horizons are predictable in the soils of the region. However, the argillic horizon observed in pedon 2 is most probably related to the past humid climate. This is because at the present time, conditions

Malaysian Journal of Soil Science Vol. 22, 2018 63
are not suitable for dispersion and transfer of clay to lower horizons and formation of argillic horizon. In addition, due to a high temperature, lack of rainfall and low vegetation cover, the ochric epipedon was the only epipedon in the area. According to U.S. Soil Taxonomy (Soil Survey Staff 2014), as a characteristic of the surface and subsurface horizons and also a consequence of the soil moisture and soil temperature regime, the soils of the region are included in the orders of Inceptisols and Alfisols (Table 1). The results of the physicochemical analysis (Table 1) show that the amount of clay in the samples is variable, between 19.5% in C horizon of pedon 3, which is an Inceptisols soil, and 60.7% in Bt2k horizon which is an Alfisols soil, with an average of approximately 39% in the study area. CCE is high with an average of approximately 55.5%, with the maximum value being 81.7% observed in the C horizon of pedon 1, while its minimum value was observed in surface horizon of pedon 2 which is an Alfisols. The average OC is approximately 0.55%, with A horizon in pedon 4 which is under forest cover having the maximum amount (1.94 %) and C horizons of pedons 1 and 3 having the minimum amounts of approximately 0.1% of the organic carbon. CEC is variable, between 8.6 and 39.1 cmol (+) kg-1. The maximum amount of CEC was related to the surface horizon of pedon 4, while its minimum amount was observed in C horizon of pedon 3. Some amount of gypsum was also observed in the studied pedons with the maximum being found in Bk2y horizon of pedon 1. Given the calcareous nature of the soils in the region, the pH of the soils was expectedly variable, ranging between 7.1 and 7.8.
Soluble potassium was variable, ranging between 0.5 mg/kg and 9.1mg/kg with the average being 2.7 mg/kg. The average of the exchangeable potassium was 136 mg/kg, with the maximum amount being observed in A horizon of pedon 4 (325 mg/kg) and the minimum amount in C horizon of pedon 4. The average non-exchangeable potassium was 245 mg/kg, with the maximum and minimum amounts being observed, like the exchangeable potassium, in A horizon of pedon 4 and C horizon of pedon 1, respectively. The average of the structural potassium
TABLE 1Physico-chemical analysis, different forms of potassium and cumulative non-
exchangeable K released in different media of extraction (0.01 M CaCl2 and 0.01 M oxalic acid) in representative pedons (mg/kg)
5
TABLE 1 Physico-chemical analysis, different forms of potassium and cumulative non-exchangeable K released in different media of
extraction (0.01 M CaCl2 and 0.01 M oxalic acid) in representative pedons (mg/kg)
Ped. Soil no. Horizon Sol* Exch* Nonex* Struc* K1 K2 Clay
(%) pH CCE (%)
Gypsum (%)
OC (%)
CEC (cmol kg-1)
Taxonomy
1
1 Ap 3.8 67 155 1328 110 128 24.2 7.6 70.1 0.4 0.58 15.6 Typic
Calcixerepts 2 Bk1 1 44 91 779 - - 42.3 7.7 77.9 0.3 0.27 22.0 3 Bk2y 0.7 39 56 639 - - 40.8 7.8 81.2 5.3 0.1 20.1 4 C 0.7 33 44 597 - - 50.3 7.8 81.7 0.4 0.1 26.2
2
5 Ap 0.5 129 223 2451 137 145 26.1 7.5 35.4 0.4 1.22 20.1 Aquic
Haploxeralfs 6 Bt1 0.9 142 310 3594 - - 35.1 7.9 36.2 0.4 0.29 27.2 7 Bt2k 0.8 181 372 3990 - - 60.7 7.7 41.6 0.4 0.34 34.3 8 Cky 1.5 168 341 3057 - - 54.7 7.9 43.9 2.7 0.24 31.3
3 9 Ap 9.1 155 308 4158 170 176 36.1 7.7 36.2 0.3 1.05 18.1
Typic Haploxerepts 10 Bk 5 116 325 2510 - - 25.2 7.9 57.4 0.5 0.51 25.8
11 C 4.2 44 104 1268 - - 19.5 7.1 76.3 0.5 0.1 8.6
4 12 A 3.7 325 488 4244 295 274 46.2 7.6 44.2 0.3 1.94 39.1 Typic
Haploxerepts 13 Bw 3.9 280 388 2976 - - 31.7 7.8 47.9 0.4 0.85 28.4 14 C 2 181 223 2399 - - 52.7 7.8 46.7 0.4 0.15 34.4
Mean 2.7 136 245 2428 178 181 39.0 7.7 55.5 0.9 0.55 25.1
Notes: Sol*: Soluble K; Exch: Exchangeable K; Nonex*: Non-exchangeable K; Struc*: Structural K; K1 and K2: cumulative non-exchangeable K released in 0.01 M CaCl2 and 0.01 M oxalic acid respectively. The results show that the clay minerals in this region are smectite, chlorite, illite, palygorskite and kaolinite respectively with smectite being the predominant mineral (Table 2). Considering the climate of the region, the smectite in the soils is most likely inherited from parent materials and parent rock. Further, with increasing depth, the amount of smectite showed an ascending trend, suggesting the possible hereditary nature of this mineral in this region. On the other hand, the conversion of other minerals such as illite and palygorskite to smectite in the surface of the soil and its transfer to the lower horizons, due to the smaller size of smectite, can be another reason for the increase in smectite with increasing depth in this region. The source of the minerals of chlorite, kaolinite and illite in the region is hereditary, as in other soils of the regions in the South of Iran. Palygorskite, which morphologically has a fibrous form, is often found in soils of the arid and semi-arid regions.. Existence of high levels of Si and Mg, high pH, and low Al and Fe, are ideal conditions for palygorskite formation.
TABLE 2 Semi-quantitative analysis of the soil clays
Pedon Soil no. Horizon Smectite Illite Chlorite Vermiculite Kaolinite Palygorskite 1 1 Ap +++ ++ ++ - + + 1 2 Bk1 ++ +++ + - + + 2 5 Ap ++++ ++ ++ - + + 2 6 Bt1 +++ +++ + - + + 3 9 Ap ++++ ++ ++ - - - 3 10 Bk +++ +++ + - + + 4 12 A ++++ ++ + - + + 4 13 Bw +++ ++ + - + +
Notes : trace or not detected; +: 10-20%; ++: 20-30%; +++: 30-45%; ++++ : 45-55% Potassium Release by 0.01 M Cacl2 and 0.01 M Oxalic Acid Cumulative non-exchangeable K released in different media of extraction (0.01M CaCl2 and 0.01M oxalic acid) in representative pedons (mg/kg) is shown in Table 1 while Figure 1 indicates the cumulative amount of K+ released by sequential extractions with 0.01 M CaCl2 and 0.01 M oxalic acid versus time. As can be seen, there is no significant difference between potassium extracted with CaCl2, and oxalic acid; the mean potassium extracted by CaCl2 was 178 mg/kg (from 110 to 295 mg/kg), while the amount of potassium released by sequential extractions using oxalic acid varied between 128 and 274 mg/kg and had a mean of 181

Malaysian Journal of Soil Science Vol. 22, 201864
of the studied pedons was 2428 mg/kg. The average amounts of cumulative non-exchangeable K+ released by 0.01M CaCl2 and 0.01M oxalic acid were 178 mg/kg and 181 mg/kg respectively, with the amount of potassium released by the two extractions being maximum in A horizon of pedon 4 and minimum in Ap horizon of pedon 1.
The results show that the clay minerals in this region are smectite, chlorite, illite, palygorskite and kaolinite respectively with smectite being the predominant mineral (Table 2). Considering the climate of the region, the smectite in the soils is most likely inherited from parent materials and parent rock. Further, with increasing depth, the amount of smectite showed an ascending trend, suggesting the possible hereditary nature of this mineral in this region. On the other hand, the conversion of other minerals such as illite and palygorskite to smectite in the surface of the soil and its transfer to the lower horizons, due to the smaller size of smectite, can be another reason for the increase in smectite with increasing depth in this region. The source of the minerals of chlorite, kaolinite and illite in the region is hereditary, as in other soils of the regions in the South of Iran. Palygorskite, which morphologically has a fibrous form, is often found in soils of the arid and semi-arid regions.. Existence of high levels of Si and Mg, high pH, and low Al and Fe, are ideal conditions for palygorskite formation.
TABLE 2Semi-quantitative analysis of the soil clays
5
TABLE 1 Physico-chemical analysis, different forms of potassium and cumulative non-exchangeable K released in different media of
extraction (0.01 M CaCl2 and 0.01 M oxalic acid) in representative pedons (mg/kg)
Ped. Soil no. Horizon Sol* Exch* Nonex* Struc* K1 K2 Clay
(%) pH CCE (%)
Gypsum (%)
OC (%)
CEC (cmol kg-1)
Taxonomy
1
1 Ap 3.8 67 155 1328 110 128 24.2 7.6 70.1 0.4 0.58 15.6 Typic
Calcixerepts 2 Bk1 1 44 91 779 - - 42.3 7.7 77.9 0.3 0.27 22.0 3 Bk2y 0.7 39 56 639 - - 40.8 7.8 81.2 5.3 0.1 20.1 4 C 0.7 33 44 597 - - 50.3 7.8 81.7 0.4 0.1 26.2
2
5 Ap 0.5 129 223 2451 137 145 26.1 7.5 35.4 0.4 1.22 20.1 Aquic
Haploxeralfs 6 Bt1 0.9 142 310 3594 - - 35.1 7.9 36.2 0.4 0.29 27.2 7 Bt2k 0.8 181 372 3990 - - 60.7 7.7 41.6 0.4 0.34 34.3 8 Cky 1.5 168 341 3057 - - 54.7 7.9 43.9 2.7 0.24 31.3
3 9 Ap 9.1 155 308 4158 170 176 36.1 7.7 36.2 0.3 1.05 18.1
Typic Haploxerepts 10 Bk 5 116 325 2510 - - 25.2 7.9 57.4 0.5 0.51 25.8
11 C 4.2 44 104 1268 - - 19.5 7.1 76.3 0.5 0.1 8.6
4 12 A 3.7 325 488 4244 295 274 46.2 7.6 44.2 0.3 1.94 39.1 Typic
Haploxerepts 13 Bw 3.9 280 388 2976 - - 31.7 7.8 47.9 0.4 0.85 28.4 14 C 2 181 223 2399 - - 52.7 7.8 46.7 0.4 0.15 34.4
Mean 2.7 136 245 2428 178 181 39.0 7.7 55.5 0.9 0.55 25.1
Notes: Sol*: Soluble K; Exch: Exchangeable K; Nonex*: Non-exchangeable K; Struc*: Structural K; K1 and K2: cumulative non-exchangeable K released in 0.01 M CaCl2 and 0.01 M oxalic acid respectively. The results show that the clay minerals in this region are smectite, chlorite, illite, palygorskite and kaolinite respectively with smectite being the predominant mineral (Table 2). Considering the climate of the region, the smectite in the soils is most likely inherited from parent materials and parent rock. Further, with increasing depth, the amount of smectite showed an ascending trend, suggesting the possible hereditary nature of this mineral in this region. On the other hand, the conversion of other minerals such as illite and palygorskite to smectite in the surface of the soil and its transfer to the lower horizons, due to the smaller size of smectite, can be another reason for the increase in smectite with increasing depth in this region. The source of the minerals of chlorite, kaolinite and illite in the region is hereditary, as in other soils of the regions in the South of Iran. Palygorskite, which morphologically has a fibrous form, is often found in soils of the arid and semi-arid regions.. Existence of high levels of Si and Mg, high pH, and low Al and Fe, are ideal conditions for palygorskite formation.
TABLE 2 Semi-quantitative analysis of the soil clays
Pedon Soil no. Horizon Smectite Illite Chlorite Vermiculite Kaolinite Palygorskite 1 1 Ap +++ ++ ++ - + + 1 2 Bk1 ++ +++ + - + + 2 5 Ap ++++ ++ ++ - + + 2 6 Bt1 +++ +++ + - + + 3 9 Ap ++++ ++ ++ - - - 3 10 Bk +++ +++ + - + + 4 12 A ++++ ++ + - + + 4 13 Bw +++ ++ + - + +
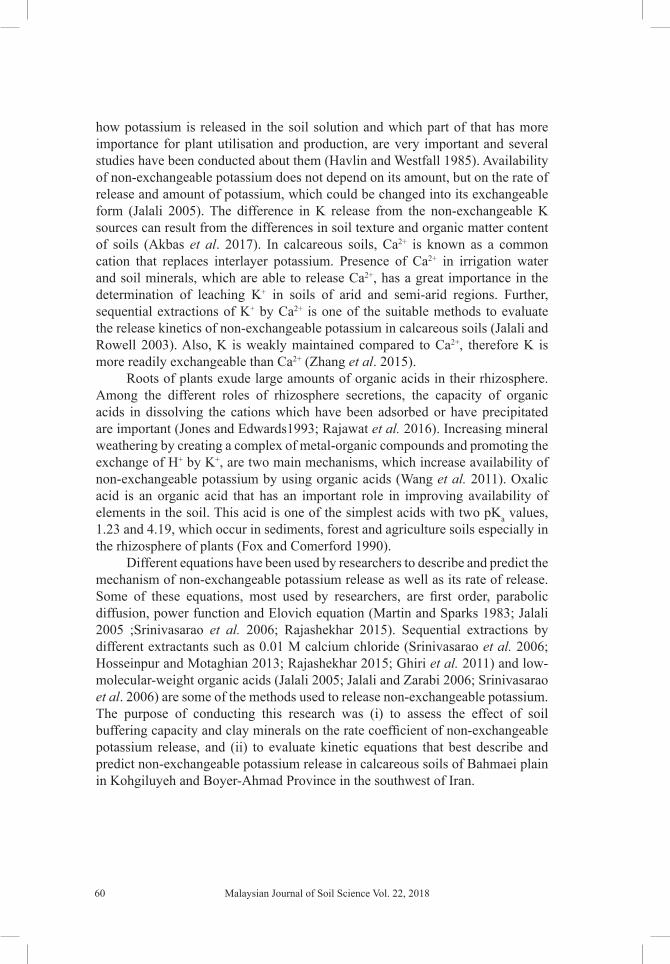
Notes : trace or not detected; +: 10-20%; ++: 20-30%; +++: 30-45%; ++++ : 45-55% Potassium Release by 0.01 M Cacl2 and 0.01 M Oxalic Acid Cumulative non-exchangeable K released in different media of extraction (0.01M CaCl2 and 0.01M oxalic acid) in representative pedons (mg/kg) is shown in Table 1 while Figure 1 indicates the cumulative amount of K+ released by sequential extractions with 0.01 M CaCl2 and 0.01 M oxalic acid versus time. As can be seen, there is no significant difference between potassium extracted with CaCl2, and oxalic acid; the mean potassium extracted by CaCl2 was 178 mg/kg (from 110 to 295 mg/kg), while the amount of potassium released by sequential extractions using oxalic acid varied between 128 and 274 mg/kg and had a mean of 181
Potassium Release by 0.01 M Cacl2 and 0.01 M Oxalic AcidCumulative non-exchangeable K released in different media of extraction (0.01M CaCl2 and 0.01M oxalic acid) in representative pedons (mg/kg) is shown in Table 1 while Figure 1 indicates the cumulative amount of K+ released by sequential extractions with 0.01 M CaCl2 and 0.01 M oxalic acid versus time. As can be seen, there is no significant difference between potassium extracted with CaCl2, and oxalic acid; the mean potassium extracted by CaCl2 was 178 mg/kg (from 110 to 295 mg/kg), while the amount of potassium released by sequential extractions using oxalic acid varied between 128 and 274 mg/kg and had a mean of 181 mg/kg. In his study, Jalali (2007) extracted about 340 mg/kg in calcareous soils of Hamadan province in the West of Iran. In another experiment in calcareous soils of Iran, Ghiri et al. (2011) extracted about 152 mg/kg of non-exchangeable potassium using 0.01M calcium chloride. Non-exchangeable potassium release is not necessarily the result of dissolution of minerals containing potassium, rather it may be a slow exchangeable reaction. During slow exchange between clay minerals such as mica, the ion replacing potassium in anhydrate form should first
Malaysian Journal of Soil Science Vol. 22, 2018 65
enter into unexpanded inner layers and then simultaneously these inner layers are expanded under the influence of hydration of such ions. These ions are then allowed to stabilise or are captured and the released potassium in its hydrated form spreads slowly to exchange sites in the external parts of clay particles (Sparks and Huang 1985).
In all soil samples and in both extractions, the process of potassium release was almost the same with the release rate being initially high and decreasing gradually. Since the non-exchangeable potassium is located between the layers and in the sites at the edge, in the early stages the potassium located on the edge of the minerals which are more available is released. With increasing time, potassium located in the wedge-shaped locations is released, with the extraction becoming increasingly difficult. Ca2+, due to the larger hydrating radius compared to K+, cannot be easily located between the layers of minerals and releases the potassium, and over time, the distance of potassium from the edges increases and the release becomes slower (Jalali 2005). Therefore, the first part of the cumulative release
Figure 1: Cumulative amount of K+ released with time by successive extractions with 0.01 M CaCl2 (1) and 0.01 M oxalic acid (2)
6
Potassium Rrelease by 0.01 M Cacl2 and 0.01 M Ooxalic Aacid Cumulative non-exchangeable K released in different media of extraction (0.01M CaCl2 and 0.01M Oxalicoxalic acid) in representative pedons (mg/kg) is shown in Ttable 1 while . Further, Figure. 1 indicates the cumulative amount of K+ released by sequential extractions with 0.01 M CaCl2 and 0.01 M Oxalicoxalic acid versus time. As can be seen, there is no significant difference between potassium extracted with CaCl2, and oxalic acid;, so that the mean potassium extracted by CaCl2 was 178 mg/kg (from 110 to 295 mg/kg), while the amount of potassium released by sequential extractions using oxalic acid varied between 128 and 274 mg/kg and had a mean of 181 mg/kg. In an expermenthis study,, Jalali (2007) extracted of about 340 mg/kg in calcareous soils of Hamadan province in the Wwest of Iran. In another experiment in calcareous soils of Iran, Ghiri et al.(2011) extracted about 152 mg/kg of Nonnon-exchangeable potassium using 0.01M calcium chloride. Non-exchangeable potassium release is not necessarily the result of dissolution of minerals containing potassium, rather it may be a slow exchangeable reaction. During slow exchange between clay minerals such as mica, the ion replacing potassium in anhydrate form should first enter into unexpanded inner layers and then simultaneously these inner layers are expanded under the influence of hydration of such ions. These described ions are then allowed to stabilisze or being are captured and the released potassium in its hydrated form spreads slowly to exchange sites in the external parts of clay particles (Sparks and Huang, 1985). In all soil samples and with in both extractions, the process of potassium release is was almost the same and with the releasing release rate is being high initially high and reduces decreasing gradually. Since the Nonnon-exchangeable potassium is located between the layers and in the edge sites at the edge, in the early stages first the potassium located on the edge of the minerals which are more available is released. With increasing time, potassium located in the wedge-shaped locations is released, whose with the extraction is becoming increasingly more difficult. Ca2+, due to the larger hydrating radius compared to K+, cannot be easily located between the layers of minerals and releases the potassium, and over time, the distance of potassium from the edges increases and the release becomes slower (Jalali , 2005). Therefore, the first part of the cumulative release curve is related to edge potassium and the second part is associated with the wedge and interlayer potassium (Benipal et al. 2006). By investigation investigating the release of soil potassium releasing,, Hosseinpur et al. (2014) announced stated that potassium releasing release rate is fast initially, but renders rateslowed slows down in the next stage. Further, the amount of potassium released in the first part of the curve is a perfect indicator of available potassium to plant. They also announced reported the release of potassium follows followed the diffusion process.
Malaysian Journal of Soil Science Vol. 22, 201866
curve is related to edge potassium and the second part is associated with the wedge and interlayer potassium (Benipal et al. 2006). By investigating the release of soil potassium, Hosseinpur et al. (2014) stated that potassium release rate is fast initially, but slows down in the next stage. Further, the amount of potassium released in the first part of the curve is a perfect indicator of available potassium to plant. They also reported the release of potassium followed the diffusion process.
On average, CaCl2 and oxalic acid released about 73% and 74% of non-exchangeable potassium. The results also showed no significant difference between the amounts of cumulative non-exchangeable potassium released by oxalic acid and the amount released with CaCl2. At pH values below 3.5, oxalic acid is in the form of a non-ionised molecule. At pH values between 3.5 and 4.5, one of the acidic protons is ionised and both protons are released at pH values greater than 4.5 (Wani 2012; Shu-Xin et al. 2007). Therefore, with pH>4.5, there are two negative free charges that can be exchanged with cations such as K, Ca and Na. The non-exchangeable potassium release mechanism by oxalic acid in different soils can be either an exchange or degradation of minerals. In the studied area, calcium carbonate of the soil is high. Since the solubility constant of calcium carbonate (4.5×10⁻⁹ M) is larger than that of calcium oxalate (1.7×10⁻⁹ M), there are large amounts of Ca2+ and equal amounts of hydroxyl ions (OH)- in the soil. As a result, the hydrogen released from oxalic acid, which probably causes degradation of minerals in acidic soils, expands to neutralise hydroxyl ions in calcareous soils. Moreover, Ca2+ of the soil solution in the presence of oxalate ions is precipitated as calcium oxalate, preventing the exchange of potassium with oxalate. Since calcareous soils are rich in calcium and have a high buffering capacity, they prevent the impact of this acid on minerals and release less potassium compared with soils possessing lower pH or less calcium carbonate. Shu-Xin et al. (2007) and Wani, (2012), reported that soils with mica and smectite as dominant minerals, and calcareous soils which have a high buffering capacity release less potassium than other soils. Some researchers obtained the opposite results. Jalali and Zarabi (2006) reported that oxalic acid could release more non-exchangeable potassium than CaCl2 in some calcareous soils. It appears that a lesser amount of calcium carbonate in their soil samples is responsible for higher potassium release by oxalic acid.
To investigate the release rate of non-exchangeable potassium in the soils of the area, released non-exchangeable potassium data were fitted with first order, Elovich, parabolic diffusion and power function equations. These results are shown in Table 3. Figures 2 and 3 reveal various kinetic models to describe and predict the non-exchangeable potassium release Coefficient of determination and standard errors were used to determine the best equation. As can be seen, the equations of power function, parabolic diffusion and Elovich for the 0.01M CaCl2 extraction have a coefficient of determination close to each other, but the lowest standard errors were obtained by power function equation. For the extraction of 0.01M oxalic acid, power function and parabolic diffusion equations have the highest coefficient of determination. Power function equation for CaCl2 and oxalic

Malaysian Journal of Soil Science Vol. 22, 2018 67
acid have a coefficient of determination of 0.982- 0.987 (average of 0.985) and 0.990 - 0.998 (average of 0.995) and standard errors between 0.05 - 0.08 (average 0.06) and 0.02 - 0.05 (average of 0.04), respectively. Due to very low standard errors and a larger coefficient of determination for both extractions, this equation is acknowledged as the best equation to describe non-exchangeable potassium release for the soils of area. Havlin and Westfall (1985) indicate that if potassium release follows the power function equation, it suggests that the diffusion process could be the most probable mechanism that controls the potassium release. Following the power function equation, parabolic diffusion and Elovich equations are recognised as the best equations based on the coefficient of determination (with means of 4.8 and 5.6, respectively) and standard errors (with means of 0.989 and 0.986, respectively) for CaCl2 extraction. For the oxalic acid extraction, the
TABLE 3Coefficient of determination (r2) and standard errors of the estimate (SE) of various
kinetic models for K release in soils
Figure 2: Relationship between observed and predicted K+ release kinetics by representative soils for successive extractions with 0.01 M CaCl2 as described by four
mathematical models.
8
TABLE 3 Coefficient of determination (r2) and standard errors of the estimate (SE) of various kinetic models for K release in soils
Soil no. Elovich First order Parabolic diffusion Power function
r2 SE r2 SE r2 SE r2 SE
2lCCa 1 0.987 3.2 0.958 0.219 0.989 3.0 0.985 0.06 5 0.992 2.8 0.953 0.22 0.988 3.5 0.987 0.05 9 0.990 4.3 0.958 0.22 0.984 5.5 0.982 0.06 12 0.987 9.0 0.964 0.203 0.983 10.5 0.985 0.08
Mean 0.989 4.8 0.958 0.216 0.986 5.6 0.985 0.06 Oxalic acid
1 0.931 9.7 0.915 0.286 0.993 3.2 0.998 0.02 5 0.979 5.6 0.914 0.330 0.996 2.4 0.990 0.05 9 0.943 12.1 0.929 0.249 0.997 2.9 0.998 0.03 12 0.950 18.5 0.923 0.299 0.997 4.8 0.994 0.05
Mean 0.951 11.5 0.920 0.291 0.995 3.4 0.995 0.04
Figure 2: Relationship between observed and predicted K+ release kinetics by representative soils for successive extractions with 0.01 M CaCl2 as described by four mathematical models.

Malaysian Journal of Soil Science Vol. 22, 201868
parabolic diffusion and Elovich equations with coefficients of determination of 0.995 and 0.991 respectively and standard errors of 3.4 and 11.5 respectively were identified as the best equations to describe and predict the non-exchangeable potassium release of soil samples, after the power function equation. Srinivasarao et al. (2006), and Rajashekhar, (2015) concluded that power function equation, parabolic equation, and the first order equations are the best kinetic equations to describe potassium release in their studies For calcareous soils Jalali (2006) introduced Elovich equations, power function and diffusion parabolic function, Hosseinpur and Motaghian (2013), the power function and parabolic diffusion equations, Jalali and Khanlari (2014) the parabolic diffusion and Elovich equations, and power function and Jalali and Zarabi (2006) reported power function as the best equations to describe K release for the two extractants of calcium chloride and oxalic acid.
Release Rate Coefficient of the EquationsThe parameters of kinetic equations of potassium release are found in Table 4 while the correlation between some physic-chemical properties and the constant b (slope of all equations) of the kinetic equations of non-exchangeable potassium release (the released cumulative potassium with extractions by 0.01M CaCl2 and 0.01M oxalic acid) are shown in Table 5. The release rate coefficient of non-exchangeable potassium release (b) with extraction by 0.01M CaCl2 in the Elovich equations showed a positive and significant relationship with clay (0.964*), CEC (0.962*) and the extracted potassium with CaCl2 (0.977**) parameter b of parabolic
9
Figure 3: Relationship between observed and predicted K+ release kinetics by representative soils for successive extractions with 0.01 M oxalic acid as described by four mathematical models Release Rate Coefficient of the Equations The parameters of kinetic equations of potassium release are found in Table 4 while the correlation between some physic-chemical properties and the constant b (slope of all equations) of the kinetic equations of non-exchangeable potassium release (the released cumulative potassium with extractions by 0.01M CaCl2 and 0.01M oxalic acid) are shown in Table 5. The release rate coefficient of non-exchangeable potassium release (b) with extraction by 0.01M CaCl2 in the Elovich equations showed a positive and significant relationship with clay (0.964*), CEC (0.962*) and the extracted potassium with CaCl2 (0.977**) parameter b of parabolic equation (1.00**). It also indicated a positive relationship with OC (0.904), non-exchangeable potassium (0.842) and coefficient b of power function equation (0.842). The constant b with the extraction of 0.01M oxalic acid in Elovich equation also showed a positive and significant relationship with clay (0.971*), CEC (0.953*), the potassium extracted with calcium chloride (0.998**) and parameter b of parabolic equation (1.00**) along with a positive relationship with OC (0.898), non-exchangeable potassium (0.856) and coefficient b of power function equation (0.778). The slope of Elovich equation (b) indicates interlayer potassium release rate, and its intercept (a) shows the initial and immediate rate of potassium release (Mengel et al. 1998). The average release rate coefficients for CaCl2 and oxalic acid in the Elovich equation were 56 and 63 mg/kg min-1 respectively with the minimum and maximum amounts for both extractions being observed in sample 1 (A horizon of pedon 1) and sample 12 (A horizon of pedon 4) respectively. As observed, soil 1, which has the minimum amount of coefficient of release, has the minimum amount of clay, CEC and OC, while soil 12 has the maximum amount of clay, OC and CEC. The positive correlation of the amount of clay, OC and CEC with the rate coefficient of the Elovich equation also confirms it. Singh et al. (2002) attributed the increase in non-exchangeable potassium release due to the presence of organic material and expressed the view that organic material has an important role in the distribution of different forms of potassium in soils. They attributed the increase in plant growth with the addition of organic material to soil to the corresponding increase in non-exchangeable potassium release which furnishes the plant with the required potassium. They rationalised the increase in the release
Figure 3: Relationship between observed and predicted K+ release kinetics by representative soils for successive extractions with 0.01 M oxalic acid as described by
four mathematical models

Malaysian Journal of Soil Science Vol. 22, 2018 69
equation (1.00**). It also indicated a positive relationship with OC (0.904), non-exchangeable potassium (0.842) and coefficient b of power function equation (0.842). The constant b with the extraction of 0.01M oxalic acid in Elovich equation also showed a positive and significant relationship with clay (0.971*), CEC (0.953*), the potassium extracted with calcium chloride (0.998**) and parameter b of parabolic equation (1.00**) along with a positive relationship with OC (0.898), non-exchangeable potassium (0.856) and coefficient b of power function equation (0.778). The slope of Elovich equation (b) indicates interlayer potassium release rate, and its intercept (a) shows the initial and immediate rate of potassium release (Mengel et al. 1998). The average release rate coefficients for CaCl2 and oxalic acid in the Elovich equation were 56 and 63 mg/kg min-1 respectively with the minimum and maximum amounts for both extractions being observed in sample 1 (A horizon of pedon 1) and sample 12 (A horizon of pedon 4) respectively. As observed, soil 1, which has the minimum amount of coefficient of release, has the
TABLE 4Parameters of models used to describe release kinetics of non-exchangeable K+ into
0.01M CaCl2 and 0.01M oxalic acid in soils
TABLE 5Linear correlation (Pearson) coefficients between some physico-chemical properties and the constant b into 0.01 M CaCl2 (Below the diagonal, white background) and into 0.01
M oxalic acid (Above the diagonal, gray background)
11
TABLE 4 Parameters of models used to describe release kinetics of non-exchangeable K+ into 0.01M CaCl2 and 0.01M oxalic acid in
soils
Soil no.
Elovich First order Parabolic diffusion Power function a
mg/kg b
mg/kg min-1 a
mg/kg min b
(mg/kg )-1 a
mg/kg b
mg/kg min-1/2 a
mg/kg b
mg/kg min-1 2Cacl
1 -79 35 4.9 -0.016 -4.4 7.9 1.6 0.58 5 -79 39 5.0 -0.015 6.4 9.0 2.3 0.50 9 -118 53 5.3 -0.016 -3.6 12.1 2.1 0.57 12 -239 98 5.9 -0.016 -26.3 22.4 2.2 0.65
Mean -129 56 5.3 -0.016 -7.0 12.8 2.1 0.58 Oxalic acid
1 -121 44 5.2 -0.014 -29.0 10.4 0.9 0.74 5 -114 47 5.3 -0.016 -13.2 10.9 1.7 0.63 9 -169 61 5.5 -0.014 -40.6 14.4 1.1 0.77 12 -281 99 6.1 -0.016 -70.9 23.4 1.2 0.83
Mean -171 63 5.5 -0.015 -38.4 14.8 1.2 0.74
TABLE 5 Linear correlation (Pearson) coefficients between some physico-chemical properties and the constant b into 0.01 M CaCl2
(Below the diagonal, white background) and into 0.01 M oxalic acid (Above the diagonal, gray background)
Clay CCE OC CEC Nonexch. K1 K2 Elovichb First border
Parabolic bdiffusion
Power bfunction
Clay 1 .143 .852 .863 .954* - .970* .971* -.341 .971* .799
CCE .143 1 .019 .343 -.113 - .261 .305 .089 .314 .547
OC .852 .019 1 .945 .756 - .921 .898 -.783 .891 .422
CEC .863 .343 .945 1 .694 - .960* .953* -.685 .950* .599
Nonexch. .954* -.113 .756 .694 1 - .860 .856 -.210 .856 .719
K1 .965* .247 .933 .966* .854 1 - - - - -
K2 - - - - - - 1 .998** -.509 .997** .742
Elovichb .964* .315 .904 .962* .842 .997** - 1 -.468 1.000** .778
First order b -.463 -.588 .027 -.194 -.424 -.334 - -.398 1 -.456 .172 Parabolic b
diffusion .964* .306 .909 .963* .843 .998** - 1.000** -.388 1 .787 Power b
function .775 .706 .497 .714 .619 .767 - .815 -.815 .808 1
**. Correlation is significant at the 0.01 level,*. Correlation is significant at the 0.05 level.
The correlation of the soil properties and the potassium release rate coefficient in the parabolic equation for both extractions of CaCl2 and oxalic acid was the same as the Elovich equation. The main reason for the high correlation of the release rate coefficient of parabolic equation with soil properties can be the presence of illite in soils which slowly releases potassium, in addition to organic matter and clay content and size. In the studied region, illite was a hereditary mineral. Further, because of the rich resources of this mineral in the surrounding formations and its transfer to the pedons, and despite its decomposability and alteration of illite to other minerals such as smectite, the amount of this mineral is high in these soils. As a result, in the pedons though the dominant mineral is smectite, the level of illite is also high. Srinivasarao et al. (2006) reported that the highest release rate coefficients of parabolic diffusion equation were in soils with dominant mineral of illite and explained that this mineral has fixed potassium with a great power and releases it at a slower rate. Their results showed that the release of non-exchangeable potassium in illite dominant mineral soils followed the diffusion law. The parameter b in the equation of power function for the 11
TABLE 4 Parameters of models used to describe release kinetics of non-exchangeable K+ into 0.01M CaCl2 and 0.01M oxalic acid in
soils
Soil no.
Elovich First order Parabolic diffusion Power function a
mg/kg b
mg/kg min-1 a
mg/kg min b
(mg/kg )-1 a
mg/kg b
mg/kg min-1/2 a
mg/kg b
mg/kg min-1 2Cacl
1 -79 35 4.9 -0.016 -4.4 7.9 1.6 0.58 5 -79 39 5.0 -0.015 6.4 9.0 2.3 0.50 9 -118 53 5.3 -0.016 -3.6 12.1 2.1 0.57 12 -239 98 5.9 -0.016 -26.3 22.4 2.2 0.65
Mean -129 56 5.3 -0.016 -7.0 12.8 2.1 0.58 Oxalic acid
1 -121 44 5.2 -0.014 -29.0 10.4 0.9 0.74 5 -114 47 5.3 -0.016 -13.2 10.9 1.7 0.63 9 -169 61 5.5 -0.014 -40.6 14.4 1.1 0.77 12 -281 99 6.1 -0.016 -70.9 23.4 1.2 0.83
Mean -171 63 5.5 -0.015 -38.4 14.8 1.2 0.74
TABLE 5 Linear correlation (Pearson) coefficients between some physico-chemical properties and the constant b into 0.01 M CaCl2
(Below the diagonal, white background) and into 0.01 M oxalic acid (Above the diagonal, gray background)
Clay CCE OC CEC Nonexch. K1 K2 Elovichb First border
Parabolic bdiffusion
Power bfunction
Clay 1 .143 .852 .863 .954* - .970* .971* -.341 .971* .799
CCE .143 1 .019 .343 -.113 - .261 .305 .089 .314 .547
OC .852 .019 1 .945 .756 - .921 .898 -.783 .891 .422
CEC .863 .343 .945 1 .694 - .960* .953* -.685 .950* .599
Nonexch. .954* -.113 .756 .694 1 - .860 .856 -.210 .856 .719
K1 .965* .247 .933 .966* .854 1 - - - - -
K2 - - - - - - 1 .998** -.509 .997** .742
Elovichb .964* .315 .904 .962* .842 .997** - 1 -.468 1.000** .778
First order b -.463 -.588 .027 -.194 -.424 -.334 - -.398 1 -.456 .172 Parabolic b
diffusion .964* .306 .909 .963* .843 .998** - 1.000** -.388 1 .787 Power b
function .775 .706 .497 .714 .619 .767 - .815 -.815 .808 1
**. Correlation is significant at the 0.01 level,*. Correlation is significant at the 0.05 level.
The correlation of the soil properties and the potassium release rate coefficient in the parabolic equation for both extractions of CaCl2 and oxalic acid was the same as the Elovich equation. The main reason for the high correlation of the release rate coefficient of parabolic equation with soil properties can be the presence of illite in soils which slowly releases potassium, in addition to organic matter and clay content and size. In the studied region, illite was a hereditary mineral. Further, because of the rich resources of this mineral in the surrounding formations and its transfer to the pedons, and despite its decomposability and alteration of illite to other minerals such as smectite, the amount of this mineral is high in these soils. As a result, in the pedons though the dominant mineral is smectite, the level of illite is also high. Srinivasarao et al. (2006) reported that the highest release rate coefficients of parabolic diffusion equation were in soils with dominant mineral of illite and explained that this mineral has fixed potassium with a great power and releases it at a slower rate. Their results showed that the release of non-exchangeable potassium in illite dominant mineral soils followed the diffusion law. The parameter b in the equation of power function for the

Malaysian Journal of Soil Science Vol. 22, 201870
minimum amount of clay, CEC and OC, while soil 12 has the maximum amount of clay, OC and CEC. The positive correlation of the amount of clay, OC and CEC with the rate coefficient of the Elovich equation also confirms it. Singh et al. (2002) attributed the increase in non-exchangeable potassium release due to the presence of organic material and expressed the view that organic material has an important role in the distribution of different forms of potassium in soils. They attributed the increase in plant growth with the addition of organic material to soil to the corresponding increase in non-exchangeable potassium release which furnishes the plant with the required potassium. They rationalised the increase in the release process to the acidification of the root environment by the organic material. The amount, type and size of clays have important effects on the release rate coefficient. The results indicate that samples with the maximum amount of release contain more clay and also smectite mineral than other samples. Smectites are 2:1 clay types with high CEC and variable interlayer distance. Homogenous substitution causes the development of permanent negative charge in these clays which is neutralised by cations such as potassium. Due to greater expandability and lower layer charge, smectites easily release their interlayer potassium. Srinivasarao et al. (2006) reported that the greater rate of non-exchangeable potassium release in the soils with dominant smectite mineral suggests that the expansion properties of smectite results in potassium release in sites on the edges and wedge zones of minerals. Also the positive correlation of the organic material with the release coefficient of Elovich equation(b) can be due to development of decomposition and degradation conditions of minerals and as a result, conversion of minerals such as illite to smectite by the organic material. Boyle et al. (1974) state that an increase in organic material results in increasing non-exchangeable potassium release from minerals and consequently leads to greater concentration of soluble and exchangeable potassium. Kaolinite was observed in hereditary form and in trace amounts in the studied region. Kaolinite mineral can easily release the potassium from its external surfaces as only its external surface is available. Further due to the low amount of cation exchange capacity, kaolinite has a low amount of exchangeable potassium which is negligible. Vermiculite and illite minerals have low expandability due to a high layer charge and as a result, the ions are not exchanged easily. Despite the high amount of interlayer and structural potassium, the above minerals have a lower release capacity than the smectites. Song and Huang (1988) attribute the difference in the rate and amount of non-exchangeable potassium release in the soil to factors such as a varying percentage of potassium in the minerals, the tininess and largeness and degree of weathering of minerals. Similarly, in the micaceous minerals, they attribute the difference to the extent of structural hydroxyl navigation, degree of tetrahedral rotation, the layer charge site, amount of potassium depletion, the degree of tetrahedral distortion, difference in the chemical composition and structural defects. Lopez and Navarro, (1997) observed that the coefficient b in the Elovich equation had a high correlation with potassium removed by forage plants.

Malaysian Journal of Soil Science Vol. 22, 2018 71
The correlation of the soil properties and the potassium release rate coefficient in the parabolic equation for both extractions of CaCl2 and oxalic acid was the same as the Elovich equation. The main reason for the high correlation of the release rate coefficient of parabolic equation with soil properties can be the presence of illite in soils which slowly releases potassium, in addition to organic matter and clay content and size. In the studied region, illite was a hereditary mineral. Further, because of the rich resources of this mineral in the surrounding formations and its transfer to the pedons, and despite its decomposability and alteration of illite to other minerals such as smectite, the amount of this mineral is high in these soils. As a result, in the pedons though the dominant mineral is smectite, the level of illite is also high. Srinivasarao et al. (2006) reported that the highest release rate coefficients of parabolic diffusion equation were in soils with dominant mineral of illite and explained that this mineral has fixed potassium with a great power and releases it at a slower rate. Their results showed that the release of non-exchangeable potassium in illite dominant mineral soils followed the diffusion law. The parameter b in the equation of power function for the extractions of CaCl2 and oxalic acid showed a positive correlation with clay, OC, CEC, non-exchangeable potassium, potassium extracted by CaCl2, potassium extracted by oxalic acid and also coefficient b of Elovich and parabolic equations. The average potassium release rate coefficient (b) of the power function equation for CaCl2 was 0.58 mg/kg min-1and between 0.50-0.65 mg/kg min-1, while in oxalic acid it was 0.74 mg/kg min-1 and between 0.83-0.63 mg/kg min-1, which is less than 1 in both extractions. When the coefficient of the potassium release rate of power function equation is less than 1, it implies that the non-exchangeable potassium release rate decreases over time (Feigenbaum et al. 1981). Mengel and Uhlenbecker (1993) state that there is a relationship between the b parameter in parabolic diffusion, the power function and Elovich equations with potassium extracted by the ryegrass plant. According to them, parameter b can be a more realistic indicator for plant available potassium.
CONCLUSIONThe results showed that due to the high buffering capacity of the soils because of a high carbonate level and neutralising oxalic acid, no significant difference was observed between the amount of cumulative non-exchangeable potassium released by oxalic acid and CaCl2. Considering the two coefficients of determination and standard errors of estimation, for the extraction of CaCl2, equations of power function, Elovich and parabolic diffusion, respectively are the best equations to predict the released non-exchangeable potassium in soils of the region. Similarly equations of power function, parabolic diffusion and Elovich are the best to describe non-exchangeable potassium for the extraction of oxalic acid. The results also demonstrate that the rate coefficient of non-exchangeable potassium release (b) of Elovich equation has a positive and significant relationship with some of the physical and chemical properties of the soils. Therefore the coefficient of potassium release rate (b) can be a more accurate indicator for plant available

Malaysian Journal of Soil Science Vol. 22, 201872
potassium. Further, the results indicate that the soil samples which have more smectite minerals, have a larger coefficient of release, as smectite releases interlayer potassium easily due to more expandability and lower layer charge.
ACKNOWLEDGEMENTThis research is a part of a research project fellowship whose costs were borne by Payame Noor University (Grant number: D/96/245/23671/1).Their support is highly appreciated.
REFERENCESAkbas, F. H. Gunal and N. Acir. 2017. Spatial variability of soil potassium and its
relationship to land use and parent material. Soil and Water Research 12: 202-211.
Benipal, D.S., N.S. Pasricha and R. Singh. 2006. Potassium release to proton saturated resin and its diffusion characteristics in some alluvial soils. Geoderma 132: 464-470.
Boyle, J.R. G.K. Voigt and B.L. Sawhney. 1974. Chemical weathering of biotite by organic acids. Soil Science 117(1): 42-45.
Buckley, D.E. and R.E. Cranston. 1971. Atomic absorption analyses of 18 elements from a single decomposition of aluminosilicate. Chemical Geology 7(4): 273-284.
Buoyoucos, G.J. 1962. Hydrometer method for marking particle size analysis of soil. Agronomy Journal 54: 4661-4665.
Chapman, H.D. 1965. Cation-exchange capacity. In: Methods of Soil Analysis. Part 2. Chemical and microbiological properties, pp. 891-901.
Feigenbaum, S. R. Edelstein and I. Shainberg. 1981. Release rate of potassium and structural cations from micas to ion exchangers in dilute solutions. Soil Science Society of America Journal 45: 501-506.
Fox, T.R. and N.B.Comerford. 1990. Low-molecular-weight organic acids in selected forest soils of the southeastern USA. Soil Science Society of America Journal 54: 1139-1144.
Ghiri, M.N., A.Abtahi and F.Jaberian. 2011. Factors affecting potassium release in calcareous soils of southern Iran. Soil Research 49: 529-537.
Havlin, J.L. and D.G. Westfall. 1985. Potassium release kinetics and plant response in calcareous soils. Soil Science Society of America Journal 49(2): 366-370.
Malaysian Journal of Soil Science Vol. 22, 2018 73
Hosseinpur, A.R. and H.R. Motaghian. 2013. Application of kinetic models in describing soil potassium release characteristics and their correlations with potassium extracted by chemical methods. Pedosphere 23(4): 482-492.
Hosseinpur, A.R., T. Raisi, S. Kiani and H.R. Motaghian. 2014. Potassium-release characteristics and their correlation with bean (Phaseolus vulgaris) plant indices in some calcareous soils. Communications in Soil Science and Plant Analysis 45(6): 726-740.
Huoyan, W.A.N.G., W.Cheng, L.I.Ting, Z.H.O.U. Jianmin, and C.H.E.N. Xiaoqin. 2016. Can non-exchangeable potassium be differentiated from structural potassium in soils? Pedosphere 26: 206-215.
Jackson, M.L. 1975. Soil Chemmical Analysis Advanced Course. Madison, WI:
Department of Soils, College of Agriculture, University Wisconsin, pp.27-224.
Jalali, M. and D.L. Rowell. 2003. The role of calcite and gypsum in the leaching of potassium in a sandy soil. Experimental Agriculture 39: 379–394.
Jalali, M. and Z.V.Khanlari. 2014. Kinetics of potassium release from calcareous soils under different land use. Arid Land Research and Management 28(1): 1-13.
Jalali, M.and M. Zarabi. 2006. Kinetics of non-exchangeable-potassium release and plant response in some calcareous soils. Journal of Plant Nutrition and Soil Science 169(2): 196-204.
Jalali, M. 2005. Release kinetics of non-exchangeable potassium in calcareous soils. Communications in Soil Science and Plant Analysis 36: 1903-1917.
Jalali, M. 2006. Kinetics of non-exchangeable potassium release and availability in some calcareous soils of western Iran. Geoderma 135: 63-71.
Jalali, M. 2007. Spatial variability in potassium release among calcareous soils of western Iran. Geoderma 140: 42-51.
Jones, D.L. and A.C. Edwards. 1993. Effect of moisture content and preparation technique on the composition of soil solution obtained by centrifugation. Communications in Soil Science and Plant Analysis 24: 171-186.
Johns, W.D.R., E. Grim and F.Bradley. 1954. Quantitative estimation of clay minerals by diffraction methods. Journal of Sedimentary Research 24: 242–251.
Kirkman, J.H., A. Basker, A. Surapaneni and A.N.MacGregor. 1994. Potassium in the soils of New Zealand-a review. New Zealand Journal of Agricultural Research 37(2): 207-227.
Malaysian Journal of Soil Science Vol. 22, 201874
Kittrick, J. A. and E. W.Hope. 1963. A procedure for the particle size separation of soils for X-ray diffraction analysis. Soil Science 96: 312–325.
Loeppert, R.H. and D.L. Suarez. 1996. Carbonate and gypsum, In: Methods of Soil Analysis, ed D.L. Sparks. Part 3, Series, pp. 437-474.Madison, WI: SSSA Book Series.
Lopez-Pineiro, A. and A.G. Navarro. 1997. Potassium release kinetics and availability in unfertilized Vertisols of southwestern Spain. Soil Science 162: 912-918.
Martin, H.W.and D.L. Sparks. 1983. Kinetics of non-exchangeable potassium release from two coastal plain soils. Soil Science Society of America Journal 47: 883-887.
Mc Lean, E.O. and M.E. Watson. 1985. Soil measurements of plant-available potassium. Potassium in Agriculture. 277-308 pp.
Mehra, G. W. and M. L. Jackson. 1960. Iron oxide removal from soils and clays by a dithionite-citrate system buffered with sodium bicarbonate. In: National Conference on Clays and Clays Minera, . pp. 317-327. Washington D.C: Pergamon Press.
Mengel, K.and H. Rahmatullah. 1998. Release of potassium from the silt and sand fraction of loss–derived soil. Soil Science 163: 805 - 813.
Mengel, K.and K. Uhlenbecker.1993. Determination of available interlayer potassium and its uptake by ryegrass. Soil Science Society of America Journal 57: 761-766.
Nelson, D.W. and L. Sommers. 1982. Total carbon, organic carbon, and organic matter. In: Methods of Soil Analysis. Part 2. Chemical and microbiological properties, ed C.A. Black, pp. 539-579. Madison, WI: American Society of Agronomy.
Pratt, P.F. 1965. Potassium. In: Methods of Soil Analysis, Part 2., ed C.A. Black, pp. 1022–1030. Madison, WI: American Society of Agronomy.
Rajashekhar Rao. and B.K. 2015. Kinetics of potassium release in sweet potato cropped soils: a case study in the highlands of Papua New Guinea. Solid Earth 6: 217-225.
Rajawat, M.V., S.S. Singh, S.P. Tyagi and A.K. Saxena. 2016. A modified plate assay for rapid screening of potassium-solubilizing bacteria. Pedosphere 26: 768-773.
Richards, L.A. 1954. Diagnosis and improvement of saline and alkaline soils-United States Department of Agriculture Handbook No. 60. United States Government Printing Office. Washington DC.

Malaysian Journal of Soil Science Vol. 22, 2018 75
Shu-Xin, T.U. G.U.O. Zhi-Fen, and S.U.N. Jin-He. 2007. Effect of oxalic acid on potassium release from typical Chinese soils and minerals. Pedosphere 17: 457-466.
Singh, M.V.P. Singh and D.D. Reddy. 2002. Potassium balance and release kinetics under continuous rice-wheat cropping system in Vertisol. Field Crops Research 77: 81-91.
Soil Survey Staff. 2014. Keys to Soil Taxonomy. USDA: NRCS, Washington.
Song, S.K and P.M. Huang. 1988. Dynamics of potassium release from potassium-bearing minerals as influenced by oxalic and citric acids. Soil Science Society of America Journal 52: 383-390.
Sparks, D.L and P.M. Huang. 1985. Physical chemistry of soil potassium. Potassium in Agriculture 16: 238-249.
Sparks, D.L. 2000. Bioavailability of soil potassium. In: Handbook of Soil Science, pp 38-52. Town ??? Publisher????
Srinivasarao, C.T., R. Rupa, A. Subba Rao, G. Ramesh and S.K. Bansal. 2006. Release kinetics of non-exchangeable potassium by different extractants from soils of varying mineralogy and depth. Communications in Soil Science and Plant Analysis 37: 473-491.
Tan, D., Z. Liu, L. Jiang, J. Luo and J. Li. 2017. Long-term potash application and wheat straw return reduced soil potassium fixation and affected crop yields in North China. Nutrient Cycling in Agroecosystems 108(2): 121-133.
Wang, H.Y., Q.H. Shen, J.M. Zhou, J. Wang, C.W. Du and X.Q. Chen. 2011. Plants use alternative strategies to utilise non-exchangeable potassium in minerals. Plant and Soil 343: 209-220.
Wani, M.A. 2012. Oxalic Acid effect on potassium release from typical rice soils of Kashmir. Communications in Soil Science and Plant Analysis 43: 1136-1148.
Zhang, Y., S. Yang, M. Fu, J. Cai, Y. Zhang, R. Wang, Z. Xu, Y. Bai and Y. Jiang. 2015. Sheep manure application increases soil exchangeable base cations in a semi-arid steppe of Inner Mongolia. Journal of Arid Land 7(3) : 361-369.