effect of shape and bending modulus on the properties of
TRANSCRIPT

RSC Advances
PAPER
Ope
n A
cces
s A
rtic
le. P
ublis
hed
on 0
7 Ja
nuar
y 20
16. D
ownl
oade
d on
09/
03/2
016
15:4
3:25
. T
his
artic
le is
lice
nsed
und
er a
Cre
ativ
e C
omm
ons
Attr
ibut
ion-
Non
Com
mer
cial
3.0
Unp
orte
d L
icen
ce.
View Article OnlineView Journal | View Issue
Effect of shape a
aUni. de Chile, Fac. de Ciencias, Departam
Chile. E-mail: [email protected]. Politecnica de Cartagena, Grupo de Bi
Campus de Alfonso XIII, Aulario II, 30203 C
[email protected]. de Murcia, Fac. de Quımica, Dep. de
30100 Espinardo, Murcia, SpaindCIC biomaGUNE, Biofunctional Nanomater
San Sebastian, Ed. Miramon 182, GuipuzcoaeUni. de Talca, Inst. de Quımica de Recurso
Cite this: RSC Adv., 2016, 6, 7455
Received 13th November 2015Accepted 4th January 2016
DOI: 10.1039/c5ra24019k
www.rsc.org/advances
This journal is © The Royal Society of C
nd bending modulus on theproperties of nematic lyotropic liquid crystals
A. R. Ruiz-Fernandez,ab J. J. Lopez-Cascales,*b J. J. Giner-Casares,d R. Araya-Maturana,e F. G. Dıaz-Banos,c D. Munoz-Gacituaa and B. E. Weiss-Lopez*a
Synovial liquid is a natural lubricant of articular joints, such as shoulders, knees and hips. Thus, the
development of biocompatible lubricants that can be employed in medical prosthesis for artificial
implants, and eventually in certain therapies against osteo-arthritis or rheumatoid-arthritis diseases, is of
an undoubted importance. Lyotropic liquid crystals have been used in the synthesis of silica and metals
containing regularly oriented nanoporous, to obtain oriented carbon nanotube materials, in several
pharmaceutical applications, as membrane mimetics and in lubrication applications. In this context,
a new nematic lyotropic liquid crystal has been developed based on tetradecyltrimethyl ammonium
chloride (TTAC), decanol (DeOH), a natural mixture of lipids (PL) extracted from soybean and sodium
chloride (NaCl), all dissolved in water. A 30% w/w increase in TTAC content respect a certain
composition of reference produces a more than 24-fold increase in the macroscopic viscosity of the
solution. To understand the molecular principles that explain this behavior, several experimental and
theoretical studies have been carried out. In this regard, 2H-NMR quadrupole splittings of fully
deuterated sodium dodecyl sulphate (SDS-d25) introduced as molecular probe, transmission electron
microscopy (TEM), freeze fracture transmission electron microscopy (FF-TEM), cryogenic transmission
electron microscopy (Cryo-TEM) and polarized light microscopy (PLM) were obtained. In addition,
hydrodynamic studies determined how the enhancement in viscosity requires a change in the shape of
the aggregate, from circular to elliptic. Finally, molecular dynamics simulations allowed to estimate how
variations in the bending modulus, kb, can explain the observed tendency of the quadrupole splittings, on
the basis of a modification in the flexibility of the aggregate.
1 Introduction
Synovial liquid plays a crucial role as a natural lubricant andshock absorption of articular joins such as hips, shoulders andknees, where an optimal lubrication is required for the properjoint mobility and a reduction in cartilages degradation.1,2 Inthis regard, a deciency in hyaluronic acid as a consequence ofdegradation in chronic diseases, such as osteo-arthritis andrheumatoid-arthritis, reduces the lubrication ability of synovialliquid, increasing the wearing of cartilages in knees, shouldersand hips.1–5 Furthermore, the sphingolipid and cholesterolcomposition of synovial liquid have been investigated with the
ento de Quımica, Casilla 653, Santiago,
oinformatica y Macromoleculas (BioMac),
artagena, Murcia, Spain. E-mail: javier.
Quımica Fısica, Campus de Espinardo,
ials – Laboratory 6 Parque tecnologico de
, 20009 Donostia – San Sebastian, Spain
s Naturales, Casilla 747, Talca, Chile
hemistry 2016
goal of deciphering the role of these lipids in the lubrication ofnatural joints.1,2
By increasing the concentration of amphiphiles in aqueoussolution above certain value, known as critical micellarconcentration (CMC), it is possible to observe the formation ofa variety of different molecular organizations or phases. Themain forces that drive these aggregation processes are ofhydrophobic and electrostatic nature. These materials havebeen used in the synthesis of silica and metals containingregularly oriented nanoporous,6–11 to obtain oriented carbonnanotube materials,12–14 as carriers in pharmaceutical formu-lations,15–17 as membrane mimetics18–20 and in lubricationapplications.21
In this context, Kupchinov et al.4 determined that synovialliquid contains about 2% nematic liquid crystals, to whichimportant lubrication effects have been associated. The partic-ular rheological properties and bio-compatibility of nematiclyotropic liquid crystals made of natural phospholipids makesthem excellent candidates to be used as lubricants in joints ofmedical prosthesis for articial implants and in potentialtherapeutic applications. Nematic lyotropic liquid crystals ofnite size can be spontaneously generated in the laboratory
RSC Adv., 2016, 6, 7455–7464 | 7455

RSC Advances Paper
Ope
n A
cces
s A
rtic
le. P
ublis
hed
on 0
7 Ja
nuar
y 20
16. D
ownl
oade
d on
09/
03/2
016
15:4
3:25
. T
his
artic
le is
lice
nsed
und
er a
Cre
ativ
e C
omm
ons
Attr
ibut
ion-
Non
Com
mer
cial
3.0
Unp
orte
d L
icen
ce.
View Article Online
when amphiphiles are dissolved in water in the presence ofaliphatic alcohols and salt. Thus, at least two types of aggregatescan be spontaneously generated: calamitic (NC) derived fromhexagonal phases with prolate average symmetry, and discotic(ND), derived from the lamellar phase with oblate averagesymmetry.22–24 Searching for the development of an articialand bio-compatible nematic liquid crystal that can be used aslubricant in prosthetic joints for medical applications, andeventually as substitute of synovial liquid in certain therapeuticapplications,25 different liquid crystals have been prepared fromthe mixture of tetradecyltrimethyl ammonium chloride (TTAC),decanol (DeOH), a natural mixture of phospholipids (PL)extracted from soybean and sodium chloride (NaCl), all inaqueous solution. Few mg of fully deuterated sodium dode-cylsulphate (SDS-d25) were added as a probe to test for themobility of the aliphatic chains towards the interior of thehydrophobic core. The main advantage of using these liquidcrystals as lubricant is that it is possible to modulate its lubri-cating power. In effect, an increase of 30% w/w in TTAC content,produces a more than 24-fold increase in the solution viscosity.Thus, small variations in TTAC composition allows to modulatethe lubricating properties of the solution within a wide range ofvalues.
In this article, we focused our efforts on explaining how thekinematic viscosity of the liquid crystal is related to the size,shape and exibility of the molecular aggregate. To characterizethe structure of the aggregates, different experimental andtheoretical studies have been carried out. Thus, to observe theorder degree of the molecular packing along the aliphaticchains of the aggregate, a 2H-NMR study was performed in thepresence of SDS-d25, used as molecular probe. The kinematicviscosity of the solutions were measured at 298 K in all thestudied concentration range. To explore the shape and size ofthe molecular aggregates, Transmission Electron Microscopy(TEM), freeze fracture transmission electron microscopy (FF-TEM) and Cryo-transmission electron microscopy (Cryo-TEM)images of selected samples were obtained. To assist with thecharacterization of the phases, polarized light microscopy(PLM) textures were also observed. With the aim of obtainingdetailed insights into the properties of these liquid crystals,several molecular dynamics (MD) simulations were carried outwith atomic detail. Finally, on the basis that our MD simula-tions are not capable to provide information related with themolecular rearrangements that should take place to explain theincrease in viscosity with the increase in TTAC, a hydrodynamicmodeling study was performed to explain the experimentalobservations.
2 Materials and methods2.1 Mesophase preparation
PL from soybean, SDS-d25, TTAC and DeOH were purchasedfrom Aldrich and used as received. Water of HPLC grade andNaCl at the highest purity available were purchased fromMerckand used as received. The liquid crystal solutions were preparedby initially dissolving 0.2140 g of TTAC, 0.1165 g of PL, 0.012 g ofSDS-d25, 0.0912 g of NaCl and 58 ml of DeOH in 1 ml of H2O.
7456 | RSC Adv., 2016, 6, 7455–7464
Furthermore, the TTAC concentration was increased up toa total of 0.2930 g of TTAC, maintaining the other componentsconstant. This TTAC content corresponds the range of TTACconcentrations in which the liquid crystal generated exists. Allmesophases were allowed to equilibrate at least 48 hours at 300K before any measurements were made. These mesophasesdisplayed thermal stability up to 315 K.
2.2 2H-NMR spectra
All NMR spectra were obtained at 300 K in a Bruker Avance 400NMR spectrometer, located at the Universidad de Santiago deChile, using a broadband probe tuned to 61.425 MHz. The 2H90� pulse was 19 ms long and more than 1000 transients froma spectral window of 40 kHz were accumulated in 32 kB les.
2.3 Polarized light microscopy (PLM) and viscosity (h)
A Motic series B microscope equipped with crossed polarizerswas employed to observe the textures. The samples were placedin a concave slide with a depth of 1 mm and were allowed toorient in a 2.35 T magnet for 15 min; longer periods in the eldhad no effects on the textures. The photos were taken at 300 Kwith a 20-fold magnication, from the center of the concavity,avoiding variations in the thickness of the sample due to thecurvature of the slide.
Kinematic viscosities of the liquid crystals, h, were measuredusing a standard Ubbelohde viscometer at 298 K and 1 atmo-sphere. Within the range of TTAC content, a noticeable changein the slope of the plot viscosity vs. TTAC concentration wasobserved. This is attributed to a change of phase and iscorroborated with the PLM textures modication, observed atthe same TTAC concentration. In this context, an specialinterest was paid on the following three experimental samples,which correspond to different phases of the synthesized liquidcrystals:
Sample 1: this sample was prepared with 0.2250 g of TTAC,0.1165 g of PL, 0.012 g of SDS-d25, 0.0912 g of NaCl and 58 ml ofDeOH in 1 ml of H2O.
Sample 2: this sample was prepared with 0.2930 g of TTAC,0.1165 g of PL, 0.012 g of SDS-d25, 0.0912 g of NaCl and 58 ml ofDeOH in 1 ml of H2O. In summary, this phase was preparedstarting from sample 1 in which the TTAC content wasincreased by 30% w/w and the rest of the components weremaintained constant.
Sample 3: this sample was prepared with 0.2250 g of TTAC,0.1165 g of PL, 0.012 g of SDS-d25, 0.1048 g of NaCl and 58 ml ofDeOH in 1 ml of H2O. We note that sample 3 and 1 are of equalcomposition except that the NaCl content was increased by15% w/w.
2.4 Transmission electron microscopy (TEM)
TEM images were collected with a JEOL JEM-1400PLUS instru-ment operating at 120 kV, using carbon coated 400 square meshcopper grids. Samples were drop casted onto the TEM grids.
This journal is © The Royal Society of Chemistry 2016

Paper RSC Advances
Ope
n A
cces
s A
rtic
le. P
ublis
hed
on 0
7 Ja
nuar
y 20
16. D
ownl
oade
d on
09/
03/2
016
15:4
3:25
. T
his
artic
le is
lice
nsed
und
er a
Cre
ativ
e C
omm
ons
Attr
ibut
ion-
Non
Com
mer
cial
3.0
Unp
orte
d L
icen
ce.
View Article Online
2.5 Freeze fracture transmission electron microscopy (FF-TEM)
FF-TEM samples were prepared according to a previouslydescribed methodology.26 The solution was deposited betweentwo copper platelets using a 400-mesh gold grid spacer. Thesamples were frozen by immersion in liquid propane, at�189 �C, and fractured at �150 �C and 10�8 mbar in a BAF 060freeze-etching system (Leica Microsystems, Vienna). Thereplicas were obtained by unidirectional shadowing at 45� with2 nm of Pt/C and at 90� with 20 nm of C; they were oated ondistilled water during 5 min and observed at 120 kV in a TecnaiSpirit microscope (FEI Company, Eindhoven, Netherlands).
2.6 Cryo-transmission electron microscopy (Cryo-TEM)
Dipping and withdrawing a bare glow-discharged holey carbongrid from the solution a thin lm was formed. The grid wasblotted against lter paper, leaving thin sample lms spanningthe grid holes. These lms were vitried from room tempera-ture by dipping into boiling ethane, using a Vitrobot (FEICompany, Eindhoven, Netherlands). The sample was kept at100% humidity before freezing. Then it was transferred toa Tecnai F20 microscope (FEI Company, Eindhoven, Nether-lands) using a Gatan cryoholder (Gatan, Pleasanton, CA).Images were taken at 200 kV, below �170 �C, using low-doseimaging conditions and an Eagle 4k � 4k CCD camera (FEICompany, Eindhoven, Netherlands).
Fig. 1 Snapshots of the system 1 (A) and system 2 (B). For furtherinformation, see the text.
2.7 Setting up the computational boxes
To explore the effects of TTAC concentration and ionic strengthon the properties of these liquid crystals, we have performed 3simulations, representing sample 1, 2 and 3 as bilayer frag-ments. Consequently, three computational boxes were gener-ated, with periodic boundary conditions in all directions ofspace.
(1) System 1: this system was constituted by 392 tetradecyl-trimethyl ammonium ion (TTA+) + 72 phosphatidylcholine(DOPC) + 32 phosphatidylethanolamine (POPE) + 200DeOH + 32dodecylsulphate ion (DS�) + 32 cis-10-octadecanoic acid (AOL) +32 sodium ions (Na+) + 392 chloride ions (Cl�). We mustmention in this point, that Na+ and Cl� are not balanced in thesystem, because they were introduced only for maintaining theelectroneutrality of the system (392Cl� are required to balancethe 392TTA+ and 32Na+ are required to balance the 32DS�). Thedimensions of the original computational box were 10.3, 10.3and 9.5 nm for the x, y, and z axis, respectively, and themolecular ratios among TTA+, DOPC, POPE, DeOH and DS�
were close to the experimental values. This computational box isa representation of the experimental sample 1 (see Section 2.3),corresponding to the liquid crystal with 0.2250 g of TTAC.
(2) System 2: in this system, the number of TTAC wasincreased by 30% with respect to system 1. Thus, the totalnumber of molecules that constituted this system resulted asfollows: 512TTA+ + 72DOPC + 32POPE + 200DeOH + 32DS� +32AOL + 32Na+ + 512Cl�. The starting dimensions of thecomputational box were 12.2, 12.2 and 10.6 nm, for the x, y and
This journal is © The Royal Society of Chemistry 2016
z axis, respectively. In this case, this computational box isa representation of the experimental sample 2 (see Section 2.3),which corresponds to the liquid crystal with 0.2930 g of TTAC.
(3) System 3: in this case, system 1 was simulated includingNaCl at 1 M concentration. The dimensions of the startingcomputational box were 10.4, 10.4 and 9.6 nm, for the x, y and zaxis, respectively. In this case, this computational box isa representation of the experimental sample 3 (see Section 2.3),which corresponds to the liquid crystal with 0.2250 g of TTAC(sample 1) with an increase in the ionic strength.
In all three system described above, the species weresymmetrically distributed between the two leaets that consti-tute the bilayer. Fig. 1 shows a snapshot of system 1 and system2 aer 100 ns of trajectory.
2.8 MD simulation parameters
Once all three systems mentioned above were generated, thesteepest descent minimization method was applied to removethe excess of energy associated with the overlapping betweenadjacent atoms. Once the energy achieved a minimum, 200 nsof trajectory length were simulated for each one of the systemspreviously described. GROMACS package 4.5.3 was used to carryout the molecular dynamics simulations. In this regard, anintegration time step of 4 fs was employed. van der Waalsinteractions were simulated using the Lennard Jones potential(LJ), and long range electrostatic interactions were calculatedusing the Particle Mesh Ewald (PME) method.27,28 In both cases,for the LJ and the electrostatic interactions, a cut-off of 1.2 nmwas employed. The bond lengths were restrained using theLINCS algorithm.29 All simulations were carried out in a NPTensemble at 300 K and 1 atm, coupled to weak temperature andpressure baths algorithms,30 with time constants of 0.1 ps and1 ps for temperature and pressure, respectively. The Ryckaert–Bellemans potential31 was used in all torsions along the
RSC Adv., 2016, 6, 7455–7464 | 7457

Table 1 CNDO atomic charges of all molecules involved in this study,according to the atom numeration of Fig. 2
Atom number TTA+ DOPC POPE DeOH DS� AOL
1 0.400 0.40 0.645 0.426 �0.404 0.242 0.400 0.40 0.148 �0.722 �0.404 �0.243 0.400 0.40 0.005 0.329 �0.404 0.414 �0.500 �0.50 �0.383 �0.033 0.418 �0.3045 0.300 0.30 0.447 0.0 �0.286 �0.1066 0.0 0.40 �0.256 0.0 0.108 0.07 0.0 �0.80 �0.259 0.0 �0.028 0.08 0.0 1.70 �0.347 0.0 0.0 0.09 0.0 �0.80 0.060 0.0 0.0 0.010 0.0 �0.80 0.109 0.0 0.0 0.011 0.0 �0.70 �0.232 0.0 0.0 0.012 0.0 0.40 0.380 0.0 0.0 0.013 0.0 0.30 �0.344 — 0.0 0.014 0.0 �0.70 0.027 — 0.0 0.015 0.0 0.070 0.0 — 0.0 0.016 0.0 �0.70 0.0 — 0.0 0.017 0.0 0.0 0.0 — 0.0 0.018–21 — 0.0 0.0 — — 0.022–30 — 0.0 0.0 — — 0.031 — 0.0 0.121 — — —32 — 0.0 �0.233 — — —33 — 0.0 0.426 — — —34 — 0.50 �0.341 — — —35 — �0.70 0.027 — — —36 — 0.8 0.0 — — —37 — �0.6 0.0 — — —38–53 — 0.0 0.0 — — —Total charge 1.0 0.0 0.0 0.0 �1.0 0.0
RSC Advances Paper
Ope
n A
cces
s A
rtic
le. P
ublis
hed
on 0
7 Ja
nuar
y 20
16. D
ownl
oade
d on
09/
03/2
016
15:4
3:25
. T
his
artic
le is
lice
nsed
und
er a
Cre
ativ
e C
omm
ons
Attr
ibut
ion-
Non
Com
mer
cial
3.0
Unp
orte
d L
icen
ce.
View Article Online
aliphatic chains, for a better reproduction of cis–transtransitions.
The Lennard-Jones parameters were the same than thosespecied in a previous work,32 along with the standard GRO-MOS 54a7 force eld.33 The atomic charges distribution of TTA+,DS�, DeOH, DOPC, POPE and AOL were calculated using thesemi-empirical Complete Neglect of Differential Overlap(CNDO) method.34 Table 1 shows the atomic charge distribu-tions (in e units), considering the atom numeration of Fig. 2.Such as argued in a previous work,32 the charge distributions ofall species with net charge were halved, to consider the absenceof polarizability in all molecules involved and the constancy of
Fig. 2 Atoms numeration of all molecules involved in the simulations.
7458 | RSC Adv., 2016, 6, 7455–7464
the dielectric medium.32,35–40 Simple Point Charge (SPC) watermodel41 was employed in all simulations.
3 Results and discussion3.1 Characterization of the molecular aggregates
Fig. 3 shows the 2H-NMR spectra of SDS-d25 dissolved in sample1 (A) and in sample 2 (B). The presence and magnitude of thequadrupole splittings along with the line shape of both spectra,strongly suggests that the aggregates correspond to bilayerstructured micelles with nematic order.42–46 It is important toemphasize that these aggregates can not be spherical micellessince they can not generate 2H-NMR quadrupole splittings.
Table 3 shows the experimentally measured quadrupolesplittings of SDS-d25 in samples 1, 2 and 3 (sample compositionswere described in Section 2.3). A signicant decrease in thesplittings is observed when increasing the TTAC content,however both spectra are very similar. Accepting that in therange of studied concentrations the average orientation of theaggregate in the magnetic eld is not modied, the value of theobserved 2H-NMR quadrupole splitting of a given C–D bond ina deuterated probe, such as SDS-d25, is a measurement of thealignment of that C–D bond with the spectrometer magneticeld; in other words it is representative of the mobility of theC–D bond. Therefore we can test for modications in thedynamics of the aliphatic chains at different depths towards theinterior of the hydrophobic core. A signicant decrease in thegeneral alignment is observed when augmenting the TTACcontent. In addition, bothmesophases display a region, near theinterface, that shows similar mobility; in particular, this regionincreases from C1 to C5 in sample 1 to C1 to C7 in sample 2.
Despite the similarities between the 2H-NMR spectra ofsample 1 and sample 2, they present very different polarizedlight microscopy textures (see Fig. 3C and D). This observationevidences the existence of two different nematic mesophases,necessarily arising from structural changes in the aggregates.However, this change does not seems to affect the bilayerstructure of the micelles, as evidenced from the 2H-NMRspectra. The oily streaks texture observed in Fig. 3C usuallyappears as a consequence of homeotropic order, generallyobserved in lamellar phases, however, sometimes it is displayedby nematic discotic lyotropic liquid crystals, such as in this case.The texture observed in Fig. 3D is the typical schlieren texture,usually observed in nematic mesophases.47 These textures cannot arise from smectic phases since these phases displaya 2H-NMR spectrum typical of a powder pattern; smectic phasesdo not orient in the spectrometer magnetic eld. All discussedevidence strongly suggest that the structure of the aggregatesshould be associated to some type of bilayer structuredmicelles.
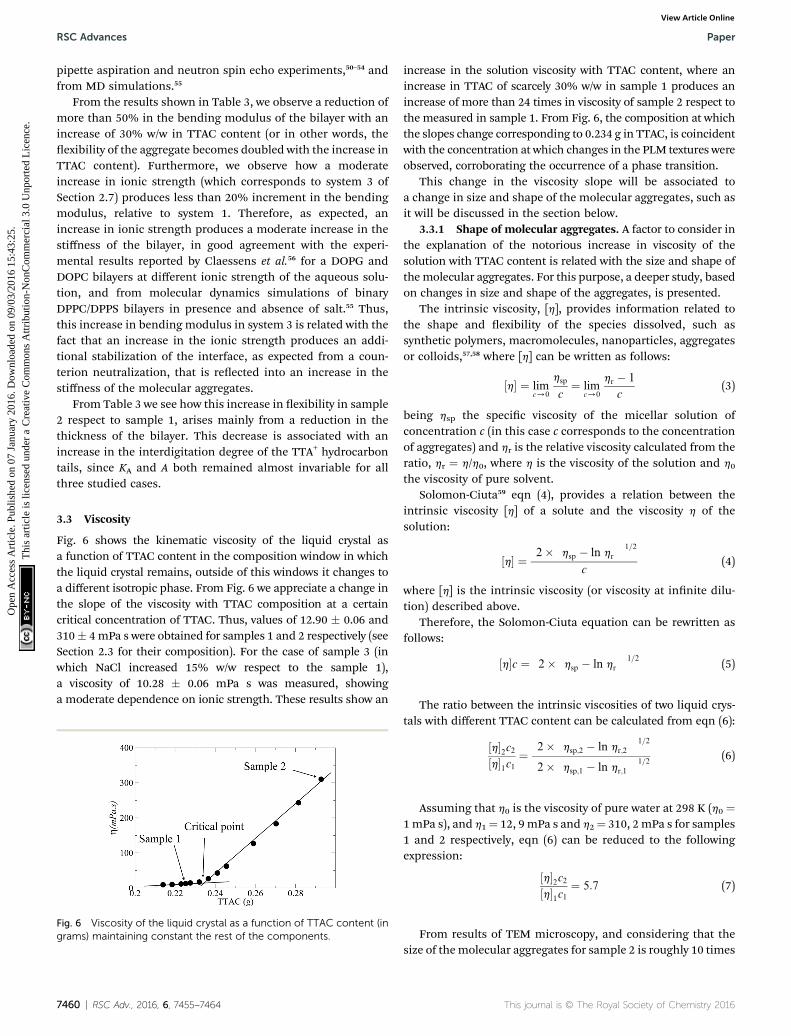
Fig. 4 shows Cryo-TEM (A) and FF-TEM (B) images of sample1. Both gures corroborate the existence of individual aggre-gates of nite size, strongly suggesting the presence ofa nematic phase. In particular, aggregates of about 2 to 5 nmcan be observed from both gures, however clusters of aggre-gates can also be observed, which could be the origin of the oilystreaks observed in PLM. In an effort to experimentally explorevariations in the size of the aggregates with the modication in
This journal is © The Royal Society of Chemistry 2016
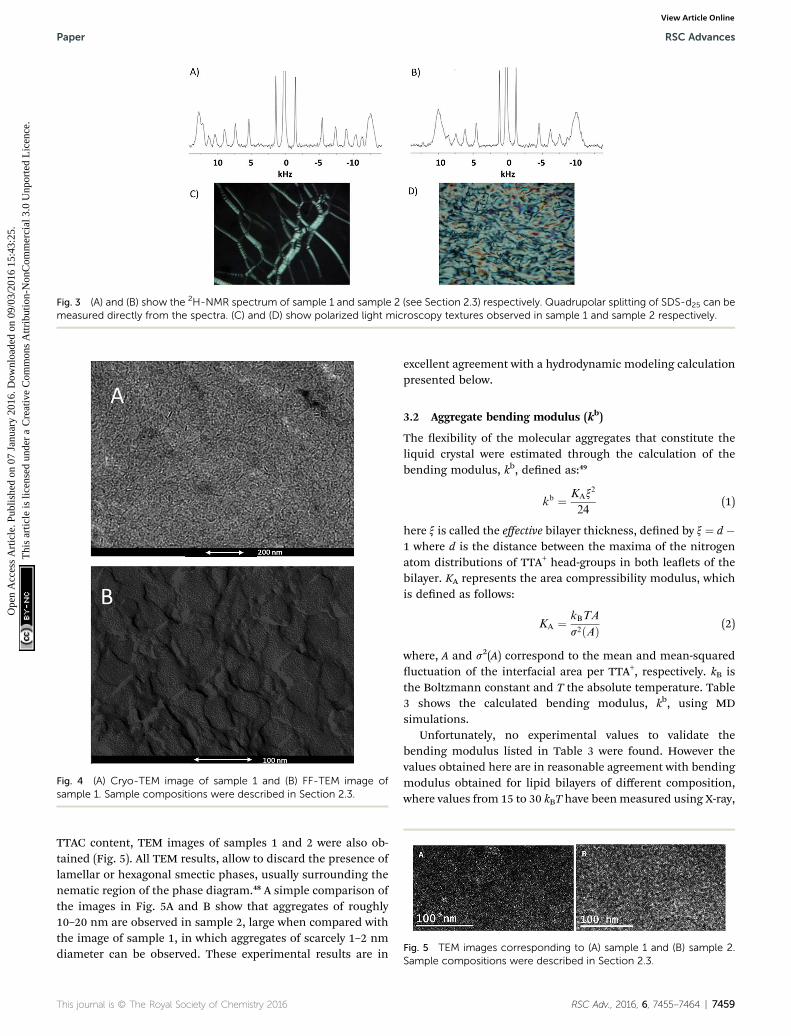
Fig. 3 (A) and (B) show the 2H-NMR spectrum of sample 1 and sample 2 (see Section 2.3) respectively. Quadrupolar splitting of SDS-d25 can bemeasured directly from the spectra. (C) and (D) show polarized light microscopy textures observed in sample 1 and sample 2 respectively.
Fig. 4 (A) Cryo-TEM image of sample 1 and (B) FF-TEM image ofsample 1. Sample compositions were described in Section 2.3.
Fig. 5 TEM images corresponding to (A) sample 1 and (B) sample 2.Sample compositions were described in Section 2.3.
Paper RSC Advances
Ope
n A
cces
s A
rtic
le. P
ublis
hed
on 0
7 Ja
nuar
y 20
16. D
ownl
oade
d on
09/
03/2
016
15:4
3:25
. T
his
artic
le is
lice
nsed
und
er a
Cre
ativ
e C
omm
ons
Attr
ibut
ion-
Non
Com
mer
cial
3.0
Unp
orte
d L
icen
ce.
View Article Online
TTAC content, TEM images of samples 1 and 2 were also ob-tained (Fig. 5). All TEM results, allow to discard the presence oflamellar or hexagonal smectic phases, usually surrounding thenematic region of the phase diagram.48 A simple comparison ofthe images in Fig. 5A and B show that aggregates of roughly10–20 nm are observed in sample 2, large when compared withthe image of sample 1, in which aggregates of scarcely 1–2 nmdiameter can be observed. These experimental results are in
This journal is © The Royal Society of Chemistry 2016
excellent agreement with a hydrodynamic modeling calculationpresented below.
3.2 Aggregate bending modulus (kb)
The exibility of the molecular aggregates that constitute theliquid crystal were estimated through the calculation of thebending modulus, kb, dened as:49
kb ¼ KAx2
24(1)
here x is called the effective bilayer thickness, dened by x¼ d�1 where d is the distance between the maxima of the nitrogenatom distributions of TTA+ head-groups in both leaets of thebilayer. KA represents the area compressibility modulus, whichis dened as follows:
KA ¼ kBTA
s2ðAÞ (2)
where, A and s2(A) correspond to the mean and mean-squareductuation of the interfacial area per TTA+, respectively. kB isthe Boltzmann constant and T the absolute temperature. Table3 shows the calculated bending modulus, kb, using MDsimulations.
Unfortunately, no experimental values to validate thebending modulus listed in Table 3 were found. However thevalues obtained here are in reasonable agreement with bendingmodulus obtained for lipid bilayers of different composition,where values from 15 to 30 kBT have beenmeasured using X-ray,
RSC Adv., 2016, 6, 7455–7464 | 7459
RSC Advances Paper
Ope
n A
cces
s A
rtic
le. P
ublis
hed
on 0
7 Ja
nuar
y 20
16. D
ownl
oade
d on
09/
03/2
016
15:4
3:25
. T
his
artic
le is
lice
nsed
und
er a
Cre
ativ
e C
omm
ons
Attr
ibut
ion-
Non
Com
mer
cial
3.0
Unp
orte
d L
icen
ce.
View Article Online
pipette aspiration and neutron spin echo experiments,50–54 andfrom MD simulations.55
From the results shown in Table 3, we observe a reduction ofmore than 50% in the bending modulus of the bilayer with anincrease of 30% w/w in TTAC content (or in other words, theexibility of the aggregate becomes doubled with the increase inTTAC content). Furthermore, we observe how a moderateincrease in ionic strength (which corresponds to system 3 ofSection 2.7) produces less than 20% increment in the bendingmodulus, relative to system 1. Therefore, as expected, anincrease in ionic strength produces a moderate increase in thestiffness of the bilayer, in good agreement with the experi-mental results reported by Claessens et al.56 for a DOPG andDOPC bilayers at different ionic strength of the aqueous solu-tion, and from molecular dynamics simulations of binaryDPPC/DPPS bilayers in presence and absence of salt.55 Thus,this increase in bending modulus in system 3 is related with thefact that an increase in the ionic strength produces an addi-tional stabilization of the interface, as expected from a coun-terion neutralization, that is reected into an increase in thestiffness of the molecular aggregates.
From Table 3 we see how this increase in exibility in sample2 respect to sample 1, arises mainly from a reduction in thethickness of the bilayer. This decrease is associated with anincrease in the interdigitation degree of the TTA+ hydrocarbontails, since KA and A both remained almost invariable for allthree studied cases.
3.3 Viscosity
Fig. 6 shows the kinematic viscosity of the liquid crystal asa function of TTAC content in the composition window in whichthe liquid crystal remains, outside of this windows it changes toa different isotropic phase. From Fig. 6 we appreciate a change inthe slope of the viscosity with TTAC composition at a certaincritical concentration of TTAC. Thus, values of 12.90 � 0.06 and310� 4mPa s were obtained for samples 1 and 2 respectively (seeSection 2.3 for their composition). For the case of sample 3 (inwhich NaCl increased 15% w/w respect to the sample 1),a viscosity of 10.28 � 0.06 mPa s was measured, showinga moderate dependence on ionic strength. These results show an
Fig. 6 Viscosity of the liquid crystal as a function of TTAC content (ingrams) maintaining constant the rest of the components.
7460 | RSC Adv., 2016, 6, 7455–7464
increase in the solution viscosity with TTAC content, where anincrease in TTAC of scarcely 30% w/w in sample 1 produces anincrease of more than 24 times in viscosity of sample 2 respect tothe measured in sample 1. From Fig. 6, the composition at whichthe slopes change corresponding to 0.234 g in TTAC, is coincidentwith the concentration at which changes in the PLM textures wereobserved, corroborating the occurrence of a phase transition.
This change in the viscosity slope will be associated toa change in size and shape of the molecular aggregates, such asit will be discussed in the section below.
3.3.1 Shape of molecular aggregates. A factor to consider inthe explanation of the notorious increase in viscosity of thesolution with TTAC content is related with the size and shape ofthe molecular aggregates. For this purpose, a deeper study, basedon changes in size and shape of the aggregates, is presented.
The intrinsic viscosity, [h], provides information related tothe shape and exibility of the species dissolved, such assynthetic polymers, macromolecules, nanoparticles, aggregatesor colloids,57,58 where [h] can be written as follows:
½h� ¼ limc/0
hsp
c¼ lim
c/0
hr � 1
c(3)
being hsp the specic viscosity of the micellar solution ofconcentration c (in this case c corresponds to the concentrationof aggregates) and hr is the relative viscosity calculated from theratio, hr ¼ h/h0, where h is the viscosity of the solution and h0
the viscosity of pure solvent.Solomon-Ciuta59 eqn (4), provides a relation between the
intrinsic viscosity [h] of a solute and the viscosity h of thesolution:
½h� ¼�2� �
hsp � ln hr
��1=2
c(4)
where [h] is the intrinsic viscosity (or viscosity at innite dilu-tion) described above.
Therefore, the Solomon-Ciuta equation can be rewritten asfollows:
½h�c ¼ �2� �
hsp � ln hr
��1=2(5)
The ratio between the intrinsic viscosities of two liquid crys-tals with different TTAC content can be calculated from eqn (6):
½h�2c2½h�1c1
¼�2� �
hsp;2 � ln hr;2
��1=2�2� �
hsp;1 � ln hr;1
��1=2 (6)
Assuming that h0 is the viscosity of pure water at 298 K (h0 ¼1mPa s), and h1¼ 12, 9 mPa s and h2¼ 310, 2mPa s for samples1 and 2 respectively, eqn (6) can be reduced to the followingexpression:
½h�2c2½h�1c1
¼ 5:7 (7)
From results of TEM microscopy, and considering that thesize of themolecular aggregates for sample 2 is roughly 10 times
This journal is © The Royal Society of Chemistry 2016
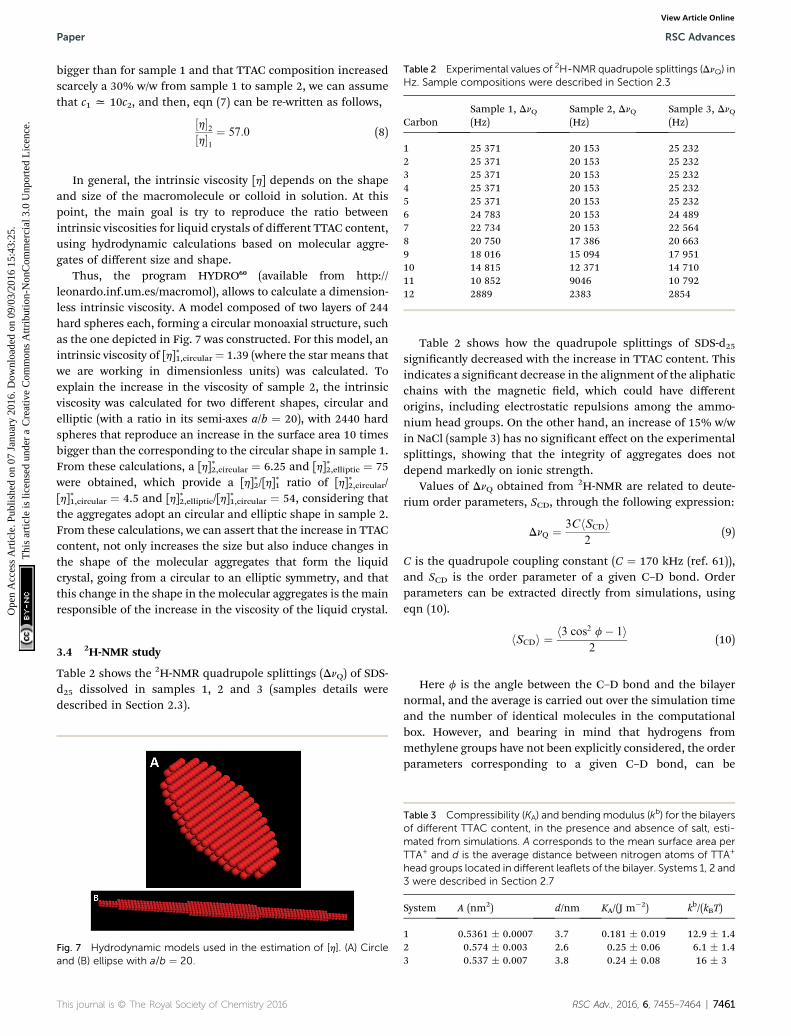
Table 2 Experimental values of 2H-NMR quadrupole splittings (DnQ) inHz. Sample compositions were described in Section 2.3
CarbonSample 1, DnQ(Hz)
Sample 2, DnQ(Hz)
Sample 3, DnQ(Hz)
1 25 371 20 153 25 2322 25 371 20 153 25 2323 25 371 20 153 25 2324 25 371 20 153 25 2325 25 371 20 153 25 2326 24 783 20 153 24 4897 22 734 20 153 22 5648 20 750 17 386 20 6639 18 016 15 094 17 95110 14 815 12 371 14 71011 10 852 9046 10 79212 2889 2383 2854
Paper RSC Advances
Ope
n A
cces
s A
rtic
le. P
ublis
hed
on 0
7 Ja
nuar
y 20
16. D
ownl
oade
d on
09/
03/2
016
15:4
3:25
. T
his
artic
le is
lice
nsed
und
er a
Cre
ativ
e C
omm
ons
Attr
ibut
ion-
Non
Com
mer
cial
3.0
Unp
orte
d L
icen
ce.
View Article Online
bigger than for sample 1 and that TTAC composition increasedscarcely a 30% w/w from sample 1 to sample 2, we can assumethat c1 x 10c2, and then, eqn (7) can be re-written as follows,
½h�2½h�1
¼ 57:0 (8)
In general, the intrinsic viscosity [h] depends on the shapeand size of the macromolecule or colloid in solution. At thispoint, the main goal is try to reproduce the ratio betweenintrinsic viscosities for liquid crystals of different TTAC content,using hydrodynamic calculations based on molecular aggre-gates of different size and shape.
Thus, the program HYDRO60 (available from http://leonardo.inf.um.es/macromol), allows to calculate a dimension-less intrinsic viscosity. A model composed of two layers of 244hard spheres each, forming a circular monoaxial structure, suchas the one depicted in Fig. 7 was constructed. For this model, anintrinsic viscosity of [h]*1,circular¼ 1.39 (where the star means thatwe are working in dimensionless units) was calculated. Toexplain the increase in the viscosity of sample 2, the intrinsicviscosity was calculated for two different shapes, circular andelliptic (with a ratio in its semi-axes a/b ¼ 20), with 2440 hardspheres that reproduce an increase in the surface area 10 timesbigger than the corresponding to the circular shape in sample 1.From these calculations, a [h]*2,circular ¼ 6.25 and [h]*2,elliptic ¼ 75were obtained, which provide a [h]*2/[h]*1 ratio of [h]*2,circular/[h]*1,circular ¼ 4.5 and [h]*2,elliptic/[h]*1,circular ¼ 54, considering thatthe aggregates adopt an circular and elliptic shape in sample 2.From these calculations, we can assert that the increase in TTACcontent, not only increases the size but also induce changes inthe shape of the molecular aggregates that form the liquidcrystal, going from a circular to an elliptic symmetry, and thatthis change in the shape in the molecular aggregates is the mainresponsible of the increase in the viscosity of the liquid crystal.
3.4 2H-NMR study
Table 2 shows the 2H-NMR quadrupole splittings (DnQ) of SDS-d25 dissolved in samples 1, 2 and 3 (samples details weredescribed in Section 2.3).
Fig. 7 Hydrodynamic models used in the estimation of [h]. (A) Circleand (B) ellipse with a/b ¼ 20.
This journal is © The Royal Society of Chemistry 2016
Table 2 shows how the quadrupole splittings of SDS-d25signicantly decreased with the increase in TTAC content. Thisindicates a signicant decrease in the alignment of the aliphaticchains with the magnetic eld, which could have differentorigins, including electrostatic repulsions among the ammo-nium head groups. On the other hand, an increase of 15% w/win NaCl (sample 3) has no signicant effect on the experimentalsplittings, showing that the integrity of aggregates does notdepend markedly on ionic strength.
Values of DnQ obtained from 2H-NMR are related to deute-rium order parameters, SCD, through the following expression:
DnQ ¼ 3ChSCDi2
(9)
C is the quadrupole coupling constant (C ¼ 170 kHz (ref. 61)),and SCD is the order parameter of a given C–D bond. Orderparameters can be extracted directly from simulations, usingeqn (10).
hSCDi ¼ h3 cos2 f� 1i2
(10)
Here f is the angle between the C–D bond and the bilayernormal, and the average is carried out over the simulation timeand the number of identical molecules in the computationalbox. However, and bearing in mind that hydrogens frommethylene groups have not been explicitly considered, the orderparameters corresponding to a given C–D bond, can be
Table 3 Compressibility (KA) and bending modulus (kb) for the bilayersof different TTAC content, in the presence and absence of salt, esti-mated from simulations. A corresponds to the mean surface area perTTA+ and d is the average distance between nitrogen atoms of TTA+
head groups located in different leaflets of the bilayer. Systems 1, 2 and3 were described in Section 2.7
System A (nm2) d/nm KA/(J m�2) kb/(kBT)
1 0.5361 � 0.0007 3.7 0.181 � 0.019 12.9 � 1.42 0.574 � 0.003 2.6 0.25 � 0.06 6.1 � 1.43 0.537 � 0.007 3.8 0.24 � 0.08 16 � 3
RSC Adv., 2016, 6, 7455–7464 | 7461
Table 4 Calculated values of 2H-NMR quadrupole splittings (DnQ, Hz)from MD simulations. Systems 1, 2 and 3 were described in Section 2.7
Carbon System 1, DnQ (Hz) System 2, DnQ (Hz) System 3, DnQ (Hz)
1 25 467 � 525 24 975 � 816 24 183 � 3912 25 639 � 663 25 596 � 844 25 483 � 5893 26 260 � 670 26 415 � 1110 26 721 � 5594 26 651 � 678 26 414 � 1254 27 390 � 5835 26 858 � 716 26 949 � 1360 27 600 � 6226 26 652 � 659 27 162 � 1354 27 566 � 6927 25 699 � 647 27 067 � 1439 27 299 � 7178 25 268 � 619 26 755 � 1390 26 864 � 6909 23 572 � 568 26 091 � 1388 26 019 � 71110 20 904 � 410 24 831 � 1236 24 489 � 58611 16 389 � 223 22 688 � 1020 21 038 � 557
Fig. 8 Orientation of the aggregate with respect to the magnetic fielddirection. (1) Represents the orientation of stiff aggregates with oblateshape perfectly orientated in the magnetic field. (2) Represents dis-torted flexible aggregates with an elliptic shape, partially orientatedrespect to the magnetic field.
RSC Advances Paper
Ope
n A
cces
s A
rtic
le. P
ublis
hed
on 0
7 Ja
nuar
y 20
16. D
ownl
oade
d on
09/
03/2
016
15:4
3:25
. T
his
artic
le is
lice
nsed
und
er a
Cre
ativ
e C
omm
ons
Attr
ibut
ion-
Non
Com
mer
cial
3.0
Unp
orte
d L
icen
ce.
View Article Online
calculated employing a well described methodology, exhaus-tively explained elsewhere.32,38 Consequently, order parameterfor C12–D bond can not be calculated. Table 4 shows thequadrupole splittings obtained from simulations, correspond-ing to the systems 1, 2 and 3 (described in Section 2.7) whichcorrelate with the experimental samples 1, 2 and 3 described inSection 2.3.
An inspection to Tables 2 and 4 shows that a semi-quantitative agreement between calculated splittings ofSDS-d25 in system 1 and the experimental measured values insample 1, is obtained for the rst few carbon atoms of thealiphatic chain, near the interface. However, a signicant devi-ation emerged when we look at the last C–D bonds of the chain.This discrepancy could arise either from the fact that oursimulations corresponds to bilayer fragments, neglectingcompletely the curved rims which can be particularly importantfor small aggregates, or frommolecules present as impurities inthe PLmixture, which perturb the order of the hydrophobic core.
The observed 2H quadrupole splitting along the SDS-d25 tailare not signicantly altered by an increase in the solution ionicstrength, as shown in Table 2 for samples 1 and 3. This behavioris reproduce by the simulation, as shown in Table 4, for systems1 and 3 respectively.
As mentioned before, comparing systems 1 and 2 with theircorresponding experimental samples 1 and 2, a noticeable
Table 5 Calculated values of 2H-NMR quadrupole splittings (DnQ, Hz)of system 2 (see Section 2.7 for different tilt angles with respect to theZ axis: (a) 0�, (b) 10� (c) 15� and (d) 20�)
Carbon (DnQ (Hz))a (DnQ (Hz))b (DnQ (Hz))c (DnQ (Hz))d
1 24 183 � 391 21 302 � 1211 18 440 � 1425 14 845 � 17182 25 483 � 589 22 557 � 1354 19 603 � 1575 15 917 � 18823 26 721 � 559 23 633 � 1268 20 525 � 1465 16 645 � 17524 27 390 � 583 24 229 � 1253 21 048 � 1455 17 080 � 17555 27 600 � 622 24 448 � 1237 21 235 � 1433 17 226 � 17266 27 566 � 692 24 381 � 1231 21 178 � 1423 17 183 � 17207 27 299 � 717 24 132 � 1246 20 955 � 1436 16 943 � 17248 26 864 � 690 23 733 � 1199 20 599 � 1393 16 695 � 16819 26 019 � 711 22 960 � 1183 19 910 � 1368 16 115 � 164610 24 489 � 586 21 596 � 1123 18 720 � 1298 15 146 � 156111 21 038 � 557 18 524 � 1063 16 036 � 1217 12 942 � 1443
7462 | RSC Adv., 2016, 6, 7455–7464
discrepancy between simulation and experiment arises. Exper-imentally it is observed how a moderate increase in TTACcontent produces a reduction of about 19% in the quadrupolesplitting for the rst methylene groups of SDS-d25. This resultsclearly diverge from the results obtained from simulations, inwhich the same increase in TTAC content, produces no varia-tion in the quadrupole splittings of the rst C–D bonds, buta signicant increment at the interior of the hydrophobic core.
This discrepancy between experiment and simulation canbe explained on the basis of changes in the shape and exibilityof the aggregates when increasing the TTAC content, such as itwas deduced in the previous Sections 3.2.1 and 3.2.2. There-fore, due to the increase in size and symmetry modications ofthe aggregate, to a larger and elongated shape, there appearcollective motions, similar to undulations observed inextended lamellar phases, which could increase the mobility ofall C–D bonds, decreasing the quadrupole splittings withoutaffecting their average orientation. Thus, to explore the effect ofundulations on DnQ, values of DnQ have been recalculatedconsidering four different tilt angles between the C–D bondsand the magnetic eld, and the results are displayed in Table 5.It is observed that an angle deviation of x15�, such as it isrepresented in Fig. 8, is sufficient to reduce the values of DnQclose to the experimental values, as observed from Table 5.Therefore, undulations with oscillations of 15� amplitudearound the average orientation should be enough to explainthe decrease in DnQ. This result evidences how considerationsof exibility and size of the molecular aggregates are of crucialimportance for the correct interpretation of the experimentaldata.
4 Conclusions
The use of molecular dynamics in conjunction with hydrody-namic calculations have proven to be very useful in the inter-pretation of the experimental results.
This journal is © The Royal Society of Chemistry 2016

Paper RSC Advances
Ope
n A
cces
s A
rtic
le. P
ublis
hed
on 0
7 Ja
nuar
y 20
16. D
ownl
oade
d on
09/
03/2
016
15:4
3:25
. T
his
artic
le is
lice
nsed
und
er a
Cre
ativ
e C
omm
ons
Attr
ibut
ion-
Non
Com
mer
cial
3.0
Unp
orte
d L
icen
ce.
View Article Online
From the change in the slope of the plot of kinematicviscosity vs. TTAC content, a phase transition process betweendifferent bilayer structured aggregates is evidenced. Additionalexperimental evidence to support this hypothesis arises fromthe observation of PLM texture modication, at the sameconcentration where the slope of viscosity vs. TTAC content isobserved. Cryo-TEM, FF-TEM and room temperature TEMimages point in the same direction.
Hydrodynamic calculations support a phase transition fromdisk shaped mono-axial aggregates to bigger elliptic shaped bi-axial aggregates, explaining the viscosity increase. A decrease inbending modulus going from system 1 to system 2 is predictedby MD simulations. This increase in exibility, which arisesfrom the inter-digitation of TTA+ hydrocarbon chains, alsocontributes to increase the viscosity.
Finally, the increase in size and exibility of the aggregatesallows collective motions to occur, which decreases the align-ment of the C–D bonds with the magnetic eld, decreasing thevalues of DnQ. MD simulations indicates that oscillationamplitudes which deviates by 15� the alignment with the eld,should be sufficient to explain the observed splittings.
Acknowledgements
The authors are pleased to acknowledge nancial support fromFondecyt-Chile (Grant No. 1150135), Universidad de Chile (VIDGrant ENL-003 and Facultad de Ciencias). The authors alsoacknowledge the invaluable assistance from the staff andfacilities at the Computing Center of the Universidad Politecn-ica de Cartagena and the National Laboratory for High Perfor-mance Computing (NLHPC), Universidad de Chile. ARRFacknowledges a doctoral fellowship from Conicyt. JJLCacknowledges the nancial support from Fundacion Seneca(19353/PI/14).
References
1 S. Sivan, A. Schroeder, G. Verberne, Y. Merkher, D. Diminsky,A. Priev, A. Maroudas, G. Halperin, D. Nitzan, I. Etsion andY. Barenholz, Langmuir, 2009, 26, 1107–1116.
2 M. Knosinska, G. Liebisch, G. Lochnit, J. Wilhelm, H. Klein,U. Kaesser, G. Lasczkowski, M. Rickert, G. smitz andJ. Steinmeyer, PLoS One, 2014, 9, e91769.
3 E. Waters, P. Spedding, A. Doherthy and R. Spedding, Asia-Pac. J. Chem. Eng., 2009, 4, 80–89.
4 B. Kupchinov, S. Ermakov, V. Rodnenkov, S. Bobrysheva,E. Beloenko and V. Kestelman, Smart Mater. Struct., 1993,2, 7–12.
5 C. Myant and P. Cann, J. Mech. Behav. Biomed. Mater., 2014,34, 338–348.
6 A. Takai, Y. Yamauchi and K. Kuroda, J. Am. Chem. Soc., 2009,132, 208–214.
7 S. Warren and U. Wiesner, Pure Appl. Chem., 2009, 81, 73–84.8 X. Zhang, W. Lu, J. Dai, L. Bourgeois, J. Yao, H. Wang,J. Friend, D. Zhao and D. MacFarlane, Sci. Rep., 2014, 4, 7420.
9 S. Che, Z. Liu, T. Ohsuna, K. Sakamoto, O. Terasaki andT. Tatsumi, Nature, 2004, 429, 281–284.
This journal is © The Royal Society of Chemistry 2016
10 H. Lin and C. Mou, Acc. Chem. Res., 2002, 35, 927–935.11 S. Umadevi, H. Lee, V. Ganesh, X. Feng and T. Hegmann, Liq.
Cryst., 2014, 41, 265–276.12 G. Scalia, ChemPhysChem, 2010, 11, 333–340.13 D. Vijayaraghavan, J. Mol. Liq., 2014, 199, 128–132.14 M. Casavant, D. Walters, J. Schmidt and R. Smalley, J. Appl.
Phys., 2003, 93, 2153–2156.15 M. Cohen-Avrahami, A. Shames, M. Ottaviani, A. Aserin and
N. Garti, Colloids Surf., B, 2014, 122, 231–240.16 C. Guo, J. Wang, F. Cao, R. Lee and G. Zhai, Drug Discovery
Today, 2010, 15, 1032–1040.17 M. Ki, J. Lim, J. Ko, S. Park, J. Kim, H. Cho, E. Park and
D. Kim, J. Controlled Release, 2014, 185, 62–70.18 V. Bahamonde-Padilla, J. Lopez-Cascales, R. Araya-
Maturana, M. Martınez-Cifuentes and B. Weiss-Lopez,ChemPhysChem, 2014, 15, 1422–1431.
19 U. Durr, M. Gildenberg and A. Ramamoorthy, Chem. Rev.,2012, 112, 6054–6074.
20 D. Warschawski, A. Arnold, M. Beaugrand, A. Gravel,E. Chartrand and I. Marcotte, Biochim. Biophys. Acta,Biomembr., 2011, 1808, 1957–1974.
21 L. Pinchuk, Y. Chernyakova and V. Goldade, J. Frict. Wear,2008, 29, 224–233.
22 A. Nesrullajev, F. Tepehan and N. Kazanci, Mater. Chem.Phys., 2002, 73, 74–77.
23 R. Montecinos, H. Ahumada, R. Araya-Maturana, A. Olea andB. Weiss-Lopez, J. Colloid Interface Sci., 2007, 316, 126–131.
24 A. Neto and S. Salinas, The Physics of Lyotropic LiquidCrystals: Phase Transitions and Structural Properties: PhaseTransitions and Structural Properties, Oxford UniversityPress, 2005.
25 J. Lagerwall and G. Scalia, Curr. Appl. Phys., 2012, 12, 1387–1412.
26 O. Lopez, A. de la Maza, L. Coderch, C. Lopez-Iglesias,E. Wehrli and J. Parra, FEBS Lett., 1998, 426, 314–318.
27 T. Darden, D. York and L. Pedersen, J. Chem. Phys., 1993, 98,10089–10092.
28 U. Essmann, L. Perera, M. Berkowitz, T. Darden, H. Lee andL. Pedersen, J. Chem. Phys., 1995, 103, 8577–8593.
29 B. Hess, H. Bekker, H. Berendsen and J. Fraaije, J. Comput.Chem., 1997, 18, 1463–1472.
30 H. Berendsen, J. Postma, W. van Gunsteren, A. DiNola andJ. Haak, J. Chem. Phys., 1984, 81, 3684–3690.
31 J. Ryckaert and A. Bellemans, Faraday Discuss. Chem. Soc.,1978, 95–106.
32 V. Bahamonde-Padilla, J. Espinoza, B. Weiss-Lopez,J. L. Cascales, R. Montecinos and R. Araya-Maturana, J.Chem. Phys., 2013, 139, 14703–14711.
33 N. Schmid, A. Eichenberger, M. Winger, A. Mark and W. vanGunsteren, Eur. Biophys. J., 2011, 7, 843–856.
34 J. Pople and G. Segal, J. Chem. Phys., 1966, 44, 3289.35 B. Jonsson, O. Edholm and O. Teleman, J. Chem. Phys., 1986,
85, 2259–2271.36 E. Egberts, S. Marrink and H. Berendsen, Eur. Biophys. J.,
1994, 22, 423–436.37 P. Ahlstrom and H. Berendsen, J. Phys. Chem., 1993, 97,
13691–13702.
RSC Adv., 2016, 6, 7455–7464 | 7463
RSC Advances Paper
Ope
n A
cces
s A
rtic
le. P
ublis
hed
on 0
7 Ja
nuar
y 20
16. D
ownl
oade
d on
09/
03/2
016
15:4
3:25
. T
his
artic
le is
lice
nsed
und
er a
Cre
ativ
e C
omm
ons
Attr
ibut
ion-
Non
Com
mer
cial
3.0
Unp
orte
d L
icen
ce.
View Article Online
38 J. J. Lopez Cascales, J. Garcıa de la Torre, S. Marrink andH. Berendsen, J. Chem. Phys., 1996, 104, 2713–2720.
39 P. David, W. van Gunsteren and A. Mark, J. Comput. Chem.,2010, 31, 1117–1125.
40 T. Heinz, W. van Gunsteren and P. Hunenberger, J. Chem.Phys., 2001, 115, 1125–1136.
41 H. Berendsen, J. Postma, W. van Gunsteren and J. Hermans,Intermolecular Forces, D. Reidel Publishing Company, 1981.
42 G. Raffard, S. Steinbruckner, A. Arnold, J. H. Davis andE. J. Dufourc, Langmuir, 2000, 16, 7655–7662.
43 L. S. Vermeer, B. L. de Groot, V. Reat, A. Milon andJ. Czaplicki, Eur. Biophys. J., 2007, 36, 919–931.
44 M. Bloom, J. H. Davis and A. L. Mackay, Chem. Phys. Lett.,1981, 80, 198–202.
45 Biological Membranes. A Molecular Perspective fromComputation and Experiment, ed. K. Merz and B. Roux,Birkhauser, Boston, 1996.
46 M. Brown, R. Thurmond, S. Dodd, D. Otten and K. Beyer, J.Am. Chem. Soc., 2002, 124, 8471–8484.
47 H. Stegemeyer and H. Behret, Liquid Crystals, Steinkopff,1994.
48 A. A. de Melo Filho, A. Laverde and F. Y. Fujiwara, Langmuir,2003, 19, 1127–1132.
49 M. Orsi, D. Haubertin, W. Sanderson and J. Essex, J. Phys.Chem. B, 2008, 112, 802–815.
7464 | RSC Adv., 2016, 6, 7455–7464
50 N. Chu, N. Kucerka, Y. Liu, S. Tristram-Nagle and J. Nagle,Phys. Rev. E: Stat., Nonlinear, So Matter Phys., 2005, 71,71.041904.
51 W. Rawicz, K. Olbrich, T. McIntosh, D. Needham andE. Evans, Biophys. J., 2000, 79, 328–339.
52 H. Petrache, S. Tristram-Nagle, K. Gawrisch, D. Harries,V. Parseguian and J. Nagle, Biophys. J., 2004, 86, 1574–1586.
53 J. Pan, S. Tristram-Nagle, N. Kucerka and J. Nagle, Biophys. J.,2008, 94, 117–124.
54 H. Seto, N. Yamada, M. Nagao, M. Hishida and T. Takeda,Eur. Phys. J. E: So Matter Biol. Phys., 2008, 26, 217–223.
55 J. J. Lopez Cascales, S. D. Oliveira Costa, A. Garro andR. D. Enriz, RSC Adv., 2012, 2, 11743–11750.
56 M. Claessens, B. van Oort, F. Leermakers, F. Hoekstra andM. C. Stuart, Biophys. J., 2004, 87, 3882–3893.
57 H. Elias, Macromolecules: structure and properties, PlenumPress, 1984, vol. 1, p. 7420.
58 S. Harding, Prog. Biophys. Mol. Biol., 1997, 68, 207–262.59 R. Pamies, J. H. Cifre, M. L. Martınez and J. de la Torre,
Colloid Polym. Sci., 2008, 286, 1223–1231.60 J. Garcıa de la Torre, S. Navarro, M. L. Martınez and
J. J. Lopez Cascales, Biophys. J., 1994, 67, 530–531.61 A. Seelig and J. Seelig, Biochemistry, 1974, 13, 4839–4845.
This journal is © The Royal Society of Chemistry 2016