effect of salinity on seedling growth in early vegetative phase of rice
TRANSCRIPT
1
EFFECT OF SALINITY ON SEEDLING GROWTH IN EARLY VEGETATIVE
PHASE OF RICE

2
Aim
The aim of this investigation was to analyze genotypic variations of salt tolerance of rice varieties at germination and seedling growth of early vegetative phase of rice.

3
Sequences
IntroductionObjective Materials and Methods Results and discussionConclusions Recommendations
4
IntroductionRice is the staple food about 159 million people of Bangladesh.
About 75% of the total cropped area and over 80% of the total irrigated area is planted to rice.
Total rice production in Bangladesh was about 10.59 million tons in the year 1971, when the country's population was only about 70.88 millions.
However, the country is now producing about 33.5 million tons to feed her 159 million people.
This indicates that the growth of rice production was much faster than the growth of population.
5
Objectives
To find out the effects of different salinity on germination and seedling growth on direct seeded rice.
To determine the level of tolerance at seedling stage.

6
Materials and Methods
Experimental site:
The experiment was conducted at the Net house of Plant Physiology Division, BRRI, Gazipur.
Geographical location:
The location of the site is at 24.00º N latitude and 90.00 º E longitude at an elevation of 8.4 meters from the sea level.
Climatic condition:
The experimental site was under the subtropical climate, characterized by three distinct seasons winter season from November to February, pre- monsoon or hot season from March to April and the monsoon period from May to October.

7
Methods of the study con….Tools are used for the experiment:
Due to the direct seed swing method are needed simple laboratories equipment those are mentioned for the complete the setup.
pH meter EC meterHot-air circulating oven Digital weighing machinePlastic trays: 12 piece 13-L capacity rectangular trays of size 15 x 13 x 6 cm Styro-foam or Cork sheets (12 piece 14 x 12 x 1.5 cm thick for making seedling floats) Nylon net (insect proofing type) Dram (160-L capacity for making culture solution) Steel Centimeter Scale/Ruler Scissor etc.

8
Methods of the study con….Seed Collection:
Pure seeds of 11 rice varieties were collected from Plant Breeding and Plant Physiology Division of Bangladesh Rice Research Institute (BRRI), Gazipur.
Name of variety Institute released Season to grow Known Salinity reaction
BRRI dhan40 BRRI T. Aman Moderately tolerantBRRI dhan41 BRRI T. Aman Moderately tolerant
BRRI dhan47 BRRI Boro Tolerant
BRRI dhan53 BRRI T. Aman Moderately tolerant
BRRI dhan54 BRRI T. Aman Moderately tolerant
BRRI dhan61 BRRI Boro Tolerant
BRRI dhan67 BRRI Boro Tolerant
BINA dhan8 BINA Boro Tolerant
BINA dhan10 BINA Boro Tolerant
IRRI154 IRRI Boro Sensitive
Pokkali Indian (Local variety)
T. Aman Tolerant

9
Methods of the study con….
Design and layout:The experiment was laid out into 2 factor, factorial Randomized Complete Block Design with three replications.
Total forty four (44) treatment of the experiment was assigned at random into 4 tray of each replication.
10
Methods of the study con….
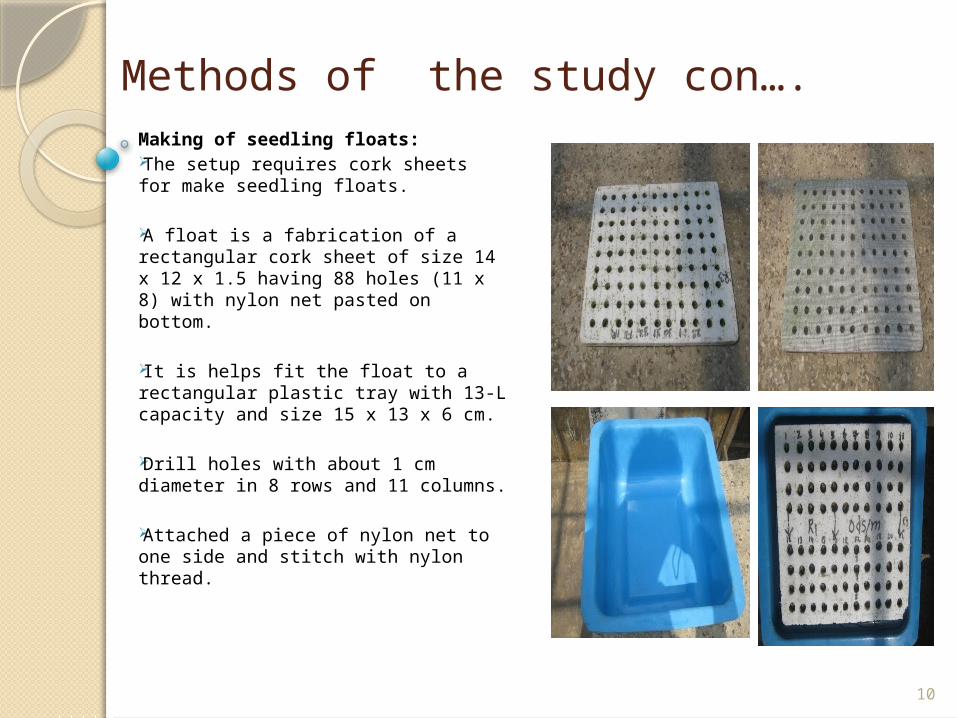
Making of seedling floats:The setup requires cork sheets for make seedling floats.
A float is a fabrication of a rectangular cork sheet of size 14 x 12 x 1.5 having 88 holes (11 x 8) with nylon net pasted on bottom.
It is helps fit the float to a rectangular plastic tray with 13-L capacity and size 15 x 13 x 6 cm.
Drill holes with about 1 cm diameter in 8 rows and 11 columns.
Attached a piece of nylon net to one side and stitch with nylon thread.

11
Methods of the study con….
Macro Nutrient for 2 Liter Solution Micro Nutrient for 2 Liter Solution
Element Reagent Amount in gram
NAmmonium nitrate(NH4NO3)
182.80
P
Sodium Phosphate, Monobasic Monohydrates(NaH2PO4.H2O)
80.60
KPotassium Sulfate (K2SO4)
142.80
CaCalcium Chloride dehydrate (CaC12.2H2O)
177.20
MgMagnesium sulfate 7-hydrate (MgSO4.7H2O)
684.00
Element Reagent Amount in gram
MnManganese chloride 4-hydrate (MnC13.4H2O)
3.00
with 100 ml H2SO4
Mo
Ammonium molybdate , 4-hydrate [(NH4)6Mo7O24-
4H2O)0.148
B Boric acid (H3BO 3) 1.868
ZnZinc sulfate 7-hydrate (ZnSO4.7H2O)
0.070
CuCupric sulfate, 5-hydrate(CuSO4.5H2O)
0.062
FeFerric chloride, 6-hydrate(FeCl3.6H2O)
15.40
Citric acidCitric acid, monohydrate(C6H8O7.H2O)
23.80
Composition of Yoshida nutrient solution for rice

12
Methods of the study con….Preparation of stock solution:Macro nutrient solutions were prepared separately by weighing each element tabulated above in to beaker.
After dissolved the solution were stored separately in Amber glass bottle.
However, micro nutrient solution was prepared together, but first each of the elements were weighted and dissolved in to minimum distilled and all together mix well by adding H2SO4.

13
Methods of the study con….
Preparation of culture solution:Culture solution was prepared through tap water with recommended ratios for 4L culture solution 5 ml of each macro and micro nutrient stock solution.
The maintenance of the nutrient solution is very important. Considerable attention has to be given in adjusting the pH.
pH will be 5±0.5

14
Methods of the study con….
Preparation of saline solution:NaCl was added to the nutrient solution and the solution was stirred up to dissolve the salt and the desired concentration of EC is 4, 8 and 12 dS/m respectively.
Fill up the trays with this solution high enough to touch the nylon net bottom of the cork sheets.
The solution was changed every 7 days.

15
Methods of the study con….
Measuring electrical conductivity (EC):The EC meter measures the amount of electrolytes present in the solution. The amount of electrolytes is associated with the degree of salinity.
When evaporation and transpiration or seedling uptake water that time salinity level was checked and adjusted EC level every day.

16
Methods of the study con….
Measuring pH :Maintaining the pH of the culture solution is very critical.
Any error the pH may create unnecessary stress to the plants due to the deficiency of nutrients, because of salinity.
Calibration of pH meter must therefore be regular and pH was adjusted 5±0.5
17
Methods of the study con….
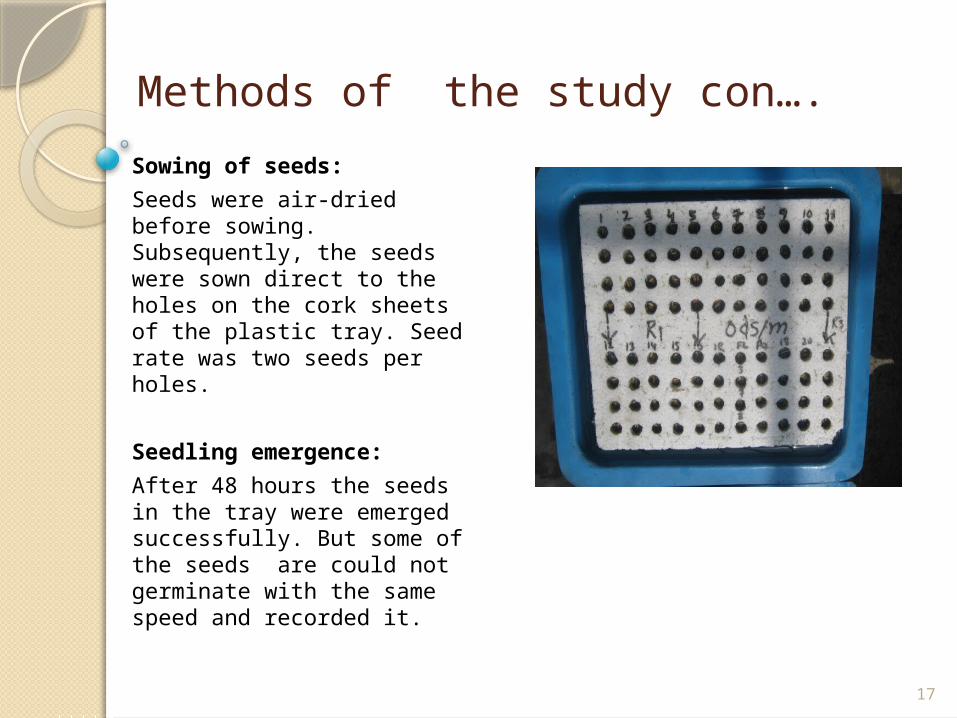
Sowing of seeds:
Seeds were air-dried before sowing. Subsequently, the seeds were sown direct to the holes on the cork sheets of the plastic tray. Seed rate was two seeds per holes.
Seedling emergence:
After 48 hours the seeds in the tray were emerged successfully. But some of the seeds are could not germinate with the same speed and recorded it.

18
Methods of the study con….
Thinning:
Seeds were sown two seeds per hole, but after 15 days one seedling was removed for allowing space to grow 1 seedling.
Test entries and checks:The seedling float has 8 rows and 11 columns with 8 holes each. So, the tray can accommodate all 11 varieties.
Varieties were randomly distributed to each tray. Here, we tested 9 salt tolerant varieties with two checks namely, Pokkali (tolerant local) and IRRI154 (sensitive).

19
Methods of the study con….Counting germination:Counting for germination percentages were started 24 hours after sowing and it was continued till 100% germination occurred (7 days sowing).
Final germination percentages (FGP), Speed of germination (SG) and Germination energy (GE) were calculated to the following formula.

20
Methods of the study con….
Evaluation of salt stress symptoms :
Modified standard evaluation system score was used to rating the visual symptoms of salt toxicity at seedling stage.
This scoring discriminates the susceptible from the tolerant and the moderately tolerant genotypes.
Scoring was carried out 1 month after sowing the seed.
21
Methods of the study con….
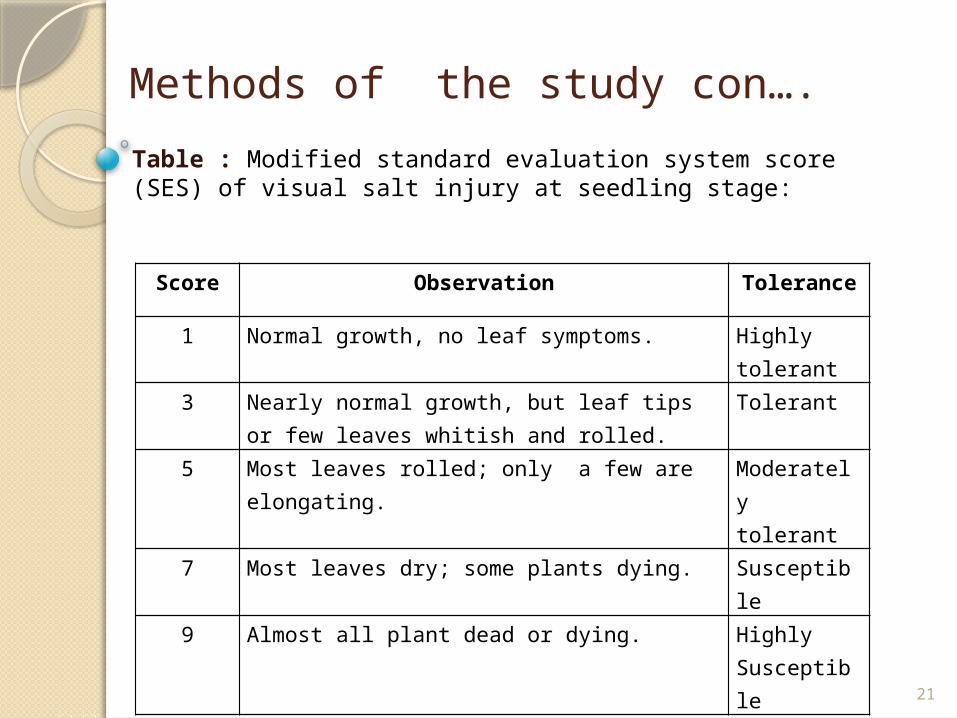
Table : Modified standard evaluation system score (SES) of visual salt injury at seedling stage:
Score Observation Tolerance
1 Normal growth, no leaf symptoms. Highly tolerant
3 Nearly normal growth, but leaf tips or few leaves whitish and rolled.
Tolerant
5 Most leaves rolled; only a few are elongating. Moderately tolerant
7 Most leaves dry; some plants dying. Susceptible
9 Almost all plant dead or dying. Highly Susceptible
22
23
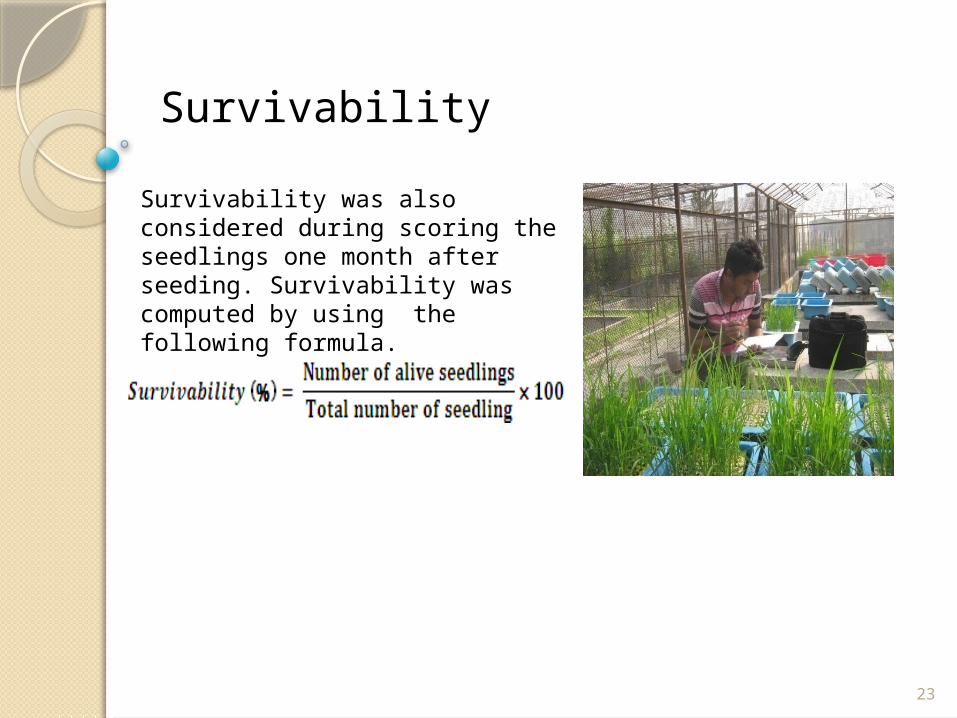
Survivability
Survivability was also considered during scoring the seedlings one month after seeding. Survivability was computed by using the following formula.
24
Methods of the study con….
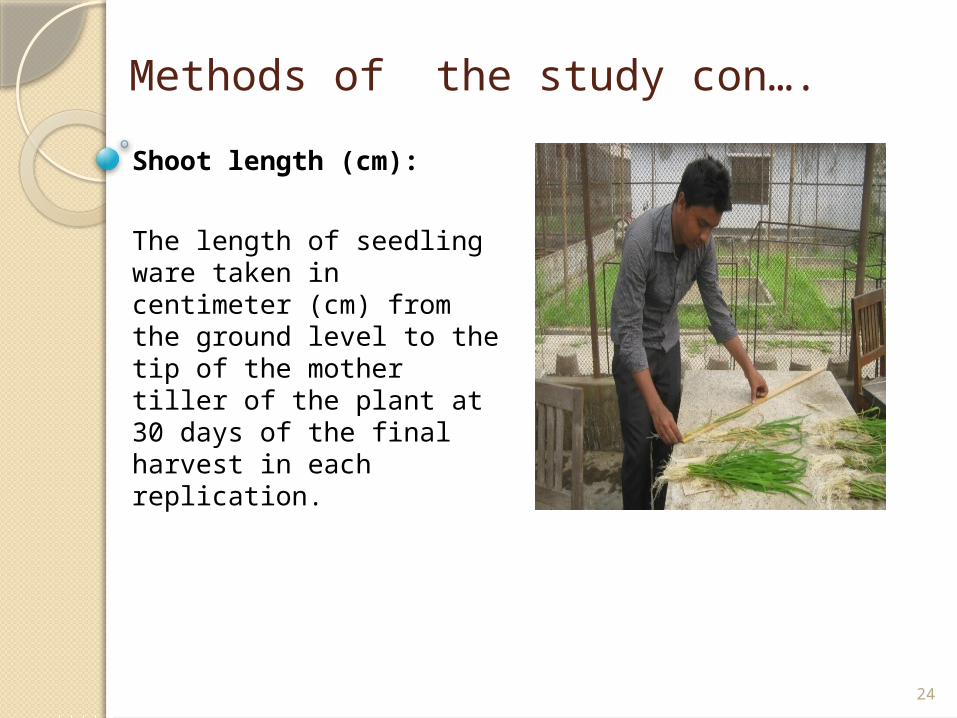
Shoot length (cm):
The length of seedling ware taken in centimeter (cm) from the ground level to the tip of the mother tiller of the plant at 30 days of the final harvest in each replication.

25
Methods of the study con….
Root length (cm):
The length of root ware taken in centimeter (cm) from the ground level to the bottom of the mother tiller of the plant at 30 days of the final harvest in each replication.
26
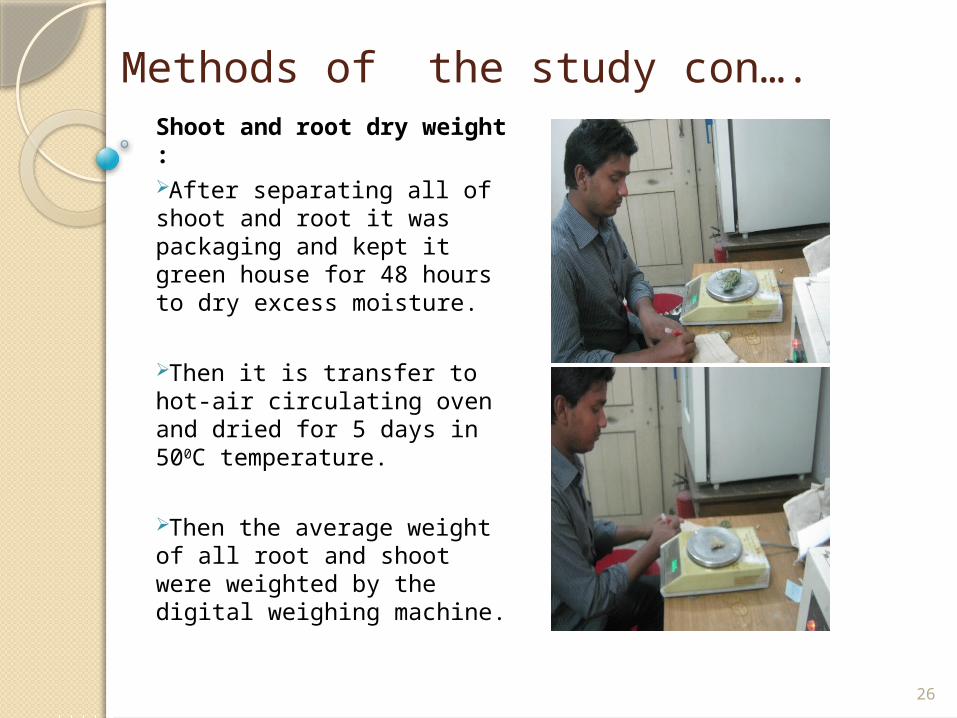
Methods of the study con….Shoot and root dry weight :After separating all of shoot and root it was packaging and kept it green house for 48 hours to dry excess moisture.
Then it is transfer to hot-air circulating oven and dried for 5 days in 500C temperature.
Then the average weight of all root and shoot were weighted by the digital weighing machine.
27
Methods of the study con….Data analysis:All measured data were recorded in to MS-Excel for calculation of FGP, SG and GE.
All data were analyzed by using IRRI’s statistical software CropStat 7.2
All graphs were prepared through the MS-Excel software from Microsoft.

28
Results and Discussion

29
Fig: Final germination percentage of 11 rice varieties affected by different level of salinity.
0 4 8 1280.00
84.00
88.00
92.00
96.00
100.00
BR40
BR41
BR47
BR53
Pokkali
IRRI154
BR54
BR61
BR67
BINA8
BINA10
Salinity level (dS/m)
Fin
al g
erm
inat
ion
(%
)

30
Fig: Speed of germination (SG) of 11 rice varieties affected by different salinity
0 4 8 120.00
2.00
4.00
6.00
8.00
10.00
12.00
14.00
BR40
BR41
BR47
BR53
Pokkali
IRRI154
BR54
BR61
BR67
BINA8
BINA10
Salinity level (dS/m)
Sp
eed
of
germ
inat
ion

31
Fig: Germination energy percentage (GE) of 11 rice varieties affected by different salinity.
0 4 8 1270
75
80
85
90
95
100
BR40
BR41
BR47
BR53
Pokkali
IRRI154
BR54
BR61
BR67
BINA8
BINA10
Salinity level (dS/m)
Ger
min
atio
n e
ner
gy (
%)

32
Table: Standard evaluation system score (SES) of 11 rice varieties affected by different salinity.
Salinity level
(dS/m)BR40 BR41 BR47 BR53 POK IR154 BR54 BR61 BR67
BINA8
BINA10
0 1.00 1.00 1.00 1.00 1.00 1.00 1.00 1.00 1.00 1.00 1.00
4 4.42 3.61 3.94 4.12 3.08 5.69 5.08 4.08 5.19 3.92 3.33
8 9.00 8.75 7.25 8.50 8.58 8.75 9.00 8.00 8.83 8.08 7.25
12 9.00 9.00 9.00 8.92 9.00 9.00 8.75 9.00 9.00 8.50 8.33

33
Survivability (SUR) (%) of 11 rice varieties affected by different salinity
Salinity level
(dS/m)BR40 BR41 BR47 BR53 POK IR154 BR54 BR61 BR67
BINA8
BINA10
0 100.00 100.00 100.00 100.00 100.00 100.00 100.00 100.00 100.00 100.00 100.00
4 100.00 100.00 100.00 100.00 100.00 91.67 100.00 100.00 91.67 100.00 100.00
8 0.00 12.50 58.33 16.67 12.50 4.17 0.00 25.00 4.17 33.33 50.00
12 0.00 0.00 0.00 4.17 0.00 0.00 8.33 0.00 0.00 20.83 20.83

34
Fig: Shoot length (SL) of 11 rice varieties affected by different salinity.
0 4 8 120.00
10.00
20.00
30.00
40.00
50.00
60.00
70.00
80.00
90.00
BR40
BR41
BR47
BR53
Pokkali
IR154
BR54
BR61
BR67
BINA8
BINA10
Salinity level (dS/m)
Shoot
heig
ht
(cm
)

35
Fig: Root length (RL) of 11 rice varieties affected by different salinity.
0 4 8 120
5
10
15
20
25
BR40
BR41
BR47
BR53
Pokkali
IR154
BR54
BR61
BR67
BINA8
BINA10
Salinity level (dS/m)
Root
length
(cm
)

36
Fig: Shoot dry weight (SDW) (gm/8 seedling) of 11 rice varieties affected by different salinity.
0 4 8 120
2
4
6
8
10
12
BR40
BR41
BR47
BR53
Pokkali
IR154
BR54
BR61
BR67
BINA8
BINA10
Salinity level (dS/m)
Shoot
weig
ht
(gm
/8 p
lants
)

37
Table: Shoot dry weight (SDW) (gm/8 seedling) of 11 rice varieties affected by different salinity.
Salinity level
(dS/m)BR40 BR41 BR47 BR53 Pokkali IR154 BR54 BR61 BR67
BINA8
BINA10
0 5.52 4.87 3.52 2.86 10.87 2.56 2.52 2.44 2.40 3.96 4.58
4 3.36 3.56 3.12 2.51 8.30 1.44 1.91 2.33 1.39 3.13 3.63
8 0.29 0.32 1.73 0.54 1.09 0.52 0.24 1.06 0.28 1.22 1.59
12 0.13 0.17 0.24 0.22 0.22 0.17 0.11 0.29 0.12 0.56 0.52

38
Fig: Root dry weight (RDW) (gm/8 seedling) of 11 rice varieties affected by different salinity.
0 4 8 120.00
0.50
1.00
1.50
2.00
2.50
BR40
BR41
BR47
BR53
Pokkali
IR154
BR54
BR61
BR67
BINA8
BINA10
Salinity level (dS/m)
Root
weig
ht
(gm
/8 p
lants
)

39
Table: Root dry weight (RDW) (gm/8 seedling) of 11 rice varieties affected by different salinity.
Salinity level
(dS/m)BR40 BR41 BR47 BR53 Pokkali IR154 BR54 BR61 BR67
BINA 8
BINA 10
0 1.35 1.54 0.81 0.84 2.19 0.98 0.91 0.58 0.53 0.97 1.23
4 0.80 1.00 0.58 0.67 1.97 0.29 0.46 0.55 0.36 0.86 0.92
8 0.05 0.05 0.29 0.08 0.19 0.11 0.05 0.23 0.05 0.20 0.32
12 0.03 0.03 0.06 0.05 0.06 0.04 0.03 0.07 0.03 0.12 0.10

40
Conclusions Germination and seedling growth was inhibited by increasing salt concentration.
Salinity level 8 dS/m could be the critical level for classifying/discriminating tolerant to susceptible varieties at seedling stage by maintaining salinity stress for whole seedling growth period.
Germination stage was relatively tolerant than seedling stage.
Based on all parameters analyzed during germination and seedling growth stage, 2 varieties namely, BRRI dhan47 and BINA dhan10 was found tolerant; 3 varieties namely, BRRI dhan61, BRRI dhan67 and BINA dhan8 was found moderately tolerant; 4 varieties namely, BRRI dhan40, BRRI dhan41, BRRI dhan53 and BRRI dhan54 was found moderately susceptible and 2 varieties namely, Pokkali and IRRI154 was found susceptible.

41
Recommendation
In order to enable the successful utilization of these results for salinity tolerance, additional laboratory, and field experiments are required to confirm the findings and further research should be taken to assess the underlying salinity tolerance mechanisms for developing future durable tolerant varieties.

42
Any Suggestion and Question???

43
THANK YOU ALL