effect of replacing fish meal by sweet lupin meal on
TRANSCRIPT

Ethiop. J. Sci & Technol 12(1): 1-17, 2019 1
Effect of replacing fish meal by sweet lupin meal on
growth performance of African catfish fingerlings, Clarias
gariepinus (Burchell, 1822)
Alayu Yalew1,*, Abebe Getahun2 and Eshete Dejen3
1Bahir Dar Fish and Aquatic Life Research Centre, Aquaculture research
team 2Addis Ababa University, Department of Zoological Sciences
3Inter Governmental Authority on Development, Agriculture and
Environment
ABSTRACT
Scarcity of fish meal remains one of the major challenges in the development
of aquaculture in Ethiopia. A growth performance experiment was conducted
to investigate the best inclusion level of sweet lupin meal (SLM) in replacing
fish meal (FM) to grow African catfish fingerlings, Clarias gariepinus. A
total of 120 juveniles weighing an average of 6.01 to 6.09 g were stocked at
a rate of 100 fishes m-3. The control group received 100% FM and 3
treatments with different proportions of SLM replacement level (50%, 75%
and 100%) were tested and feed was provided at a rate of 5% of their live
body weight. The mean live weight varied from 8.5 g to 30 g and condition
factor from 0.44 to 0.68 after 9 weeks of feeding. The fingerlings grown in
50% SLM and 50% FM formulated feed showed better condition and growth
than 75% and 100%. The feed conversion ratio was higher for all treatments
but the FCR at 100% replacement level was significantly different from
others. Cost of production was higher on the control group, while the profit
index was better for treatment I. The study revealed the possibility of growing
C. gariepinus juveniles to 30 g sized fingerlings in 9 weeks by replacing 50%
of FM with cheaper and locally available SLM.
Keywords: Catfish, Feed conversion, Profit index, Sweet lupin, Weight gain
DOI: https://dx.doi.org/10.4314/ejst.v12i1.1
*Corresponding author: [email protected]

2 Alayu Yalew et al.
INTRODUCTION
The major production cost in aquaculture is feed and the role locally
available feed resources play is largely overlooked. Expensive and
imported feeds are always considered for fish farming in Ethiopia
(personal experience). In order to take the advantage of incorporating
cheap protein sources in fish feed formulations, newly introduced and
adapted (Likawent Yeheyis et al., 2012a) yellow sweet lupin seeds
(Lupinus luteus) were investigated.
The nutrient composition of fish meal (FM) from tilapia offal is
54.8% crude protein (CP) and 23.7% digestible energy (DE) (Dale et
al., 2004) and yellow sweet lupin L. luteus has 44.9% CP and 18.6%
DE (Sipsas, 2003; Kim et al., 2009; Likawent Yeheyis et al., 2012b).
But FM from tilapia offal is not always available and its price in Bahir
Dar is expensive (25 Birr kg-1) compared to SLM (5 birr kg-1).
SLM is cheaper and can be incorporated in fish feeds with different
inclusion levels depending on the species (Robaina et al., 1995;
Smith, 1997; Burel et al., 1998; Williams, 1998). But yellow sweet
lupin (L. luteus) has never been tested in C. gariepinus feed
formulations. Niger seed (Guizotia abyssinica) cake contains 32.7%
CP and 27% carbohydrate (Tadele Dessie and Ogle, 1997). The CP
content of wheat (Triticum aestivum) bran is 16.4% and gross energy
(GE) is 17 KJ g-1 (Tekeba Eshete, 2005).
Considering the newly introduced sweet lupin, L. luteus, feed
experiment using SLM as replacement to FM was conducted with the
objective of evaluating the effect of different replacement levels of
SLM on fish growth and to determine the optimum inclusion level at
which C. gariepinus juveniles can perform better at less cost.

Ethiop. J. Sci & Technol 12(1): 1-17, 2019 3
MATERIALS AND METHODS
Materials
The research was conducted in the laboratory of Bahir Dar Fishery
and Aquatic Life Research Center (BFALRC) using twelve
rectangular glass aquariums having a total volume of 0.18 m3 (45
cm x 45 cm x 90 cm) and actual water level of 0.1 m3 (25 cm x 45
cm x 90 cm).
Feed ingredients available in the area were collected from different
sources. Nile tilapia (Oreochromis niloticus) leftover from Bahir Dar
fish processing units and L. luteus from the local market were
purchased. Different locally available feed sources were also
incorporated to formulate fish feed. A premix of vitamins (from
Alema koudijs-Debrezeit) and salt was also prepared and mixed with
the other ingredients. Adding minerals in the premix in the diets
containing fishmeal has no beneficial effect (Ng et al., 2001). A batch
of 120 healthy C. gariepinus juveniles reared by BFALRC from the
same parent were selected and used. The juveniles used for the
experiment had an average weight of 6.04 to 6.09 g and a standard
length of 9.2 to 9.6 cm while stocking.
Aerators and thermostats were used and fixed to each aquarium for a
regular supply of oxygen and for the maintenance of optimum
temperature. Mortar, meat mincer, solar tent drier and different sized
plastic buckets were used for the processing of feed ingredients.
Electrical weighing scale (0.01 g precision), measuring board and
hand held multi-parameter (Model 556 MPS) were used for
measuring the temperature, dissolved oxygen and pH.
Methods
Prior to the formulation (processing) of the feed, the experimental
feeds (FM and SLM) and other locally available ingredients were
grounded to a fine powder using mortar and hammer mill. Locally
available ingredients incorporated with the experimental feed
included 12% wheat bran (T. aestivum), 5.5% niger seed cake

4 Alayu Yalew et al.
(Guizotia abyssinica) and 2% bone meal. The proportion of the
experimental ingredients was 80% and the rest was 19.5% from other
local ingredients and 0.5% from premixes. Then, the flour of FM,
SLM, wheat bran, bone meal and oil cake were individually weighed
and properly mixed together with a premix and adequate water added
to ensure smooth pelleting.
The proportion of major ingredients (FM and SLM) in all the diets
was 80% and the rest from other locally available ingredients and a
premix. The replacement level of SLM treatments was 50%, 75% and
100% based on the acceptable minimum replacement level from other
reports (Smith, 2002). The control group was provided with
formulated feed without SLM, normally given in fish culture at DE
content of 22%. Moist formulated feed was rolled using meat mincer
and the strands were cut into short pieces. To remove the moisture,
the feed was kept outside a room in a solar tent drier for a day. The
pelleted diets, 2 mm in size, were then packed in water impermeable
polyethylene bags and stored in a freezer until use. The feed was
formulated based on equal proportions of CP (48%) but the DE
content was 20% for T1, 19% for T2 and 18% for T3 (Table 1).
Table 1. Chemical composition of experimental diets
Nutrients Without
SLM
(%)
50% SLM
inclusion
(%)
75% SLM
inclusion
(%)
100% SLM
replacement
(%)
Dry matter 95 97.4 98.0 98.4
Protein 48 48.0 48.0 48.0
Energy 22 20.0 19.0 18.0
Crude fat 13 13.4 13.8 14.5
Ash 12 16.0 17.2 17.9
“Protein” stands for Crude protein, “Energy” stands for Digestible energy.
The aquariums were filled with UV light treated water, pumped direct
from Lake Tana. For the supply of oxygen and the maintenance of
optimum temperature, thermostats and aerators were installed in each
aquarium. Electric power was obtained from the grid and upon power
interruption by a stand-by electric generator. C. gariepinus juveniles
were stocked at a density of 10 fishes per aquarium (100 fishes m-3)
in an indoor clear water aquarium.

Ethiop. J. Sci & Technol 12(1): 1-17, 2019 5
First, the fish were provided with similar feed for three days of
acclimatization and then, starved for the next 24 h in order to empty
their stomach and ready them for new feed and feeding. After
acclimatization, the fish were fed with different diets at a rate of 5%
of their body weight twice a day (at 10:00 and 17:00) for 9 weeks. In
this condition, three diets (different replacement levels of SLM) were
tested. All glass aquariums were arranged in a random block of three
treatments and a control group and each treatment was replicated
three times. All the replicated aquaria were distributed equally to each
treatment in a Completely Randomized Design (CRD). The
aquariums were cleaned every day early in the morning, before
feeding, using a long pipette without disturbing the fishes.
The weight and length of all fishes were measured every week early
in the morning before feeding and then the feed amount was adjusted
accordingly. At the end of 9 weeks of feeding, the average survival
and growth performance of the fish fed with different replacement
level of SLM were compared. The weight gain (%), actual growth
rate (AGR) and specific growth rate (SGR), food conversion ratio
(FCR) of the fish and the profit index were computed using the
following formulas:
Condition factor (K)= (b/L3)*100; Where b = body weight (g); L=
standard length (cm).
Survival rate (%) =(𝑁𝑢𝑚𝑏𝑒𝑟 𝑜𝑓 𝑓𝑟𝑦 𝑡ℎ𝑎𝑡 𝑠𝑢𝑟𝑣𝑖𝑣𝑒𝑑
𝑇𝑜𝑡𝑎𝑙 𝑁𝑢𝑚𝑏𝑒𝑟 𝑜𝑓𝑓𝑟𝑦 𝑎𝑡 𝑡ℎ𝑒 𝑠𝑡𝑎𝑟𝑡)*100.
Weight gain = Wf - Win; Where, Wf = Final weight; Win = Initial
weight.
Actual growth rate (AGR, g day-1) = (Wf1/3−Win1/3
t); t is time in
days.
Specific growth rate (g day-1) = (lnWf− lnWin
t)*100 (Brown, 1957).
Food conversion ratio (FCR) = (Weight of feed used(g)
Weight of fish produced (g)) (Broody,
1945).
Profit index (PI) =(Value of fish (Birr)
Cost of feed (𝐵𝑖𝑟𝑟)).
6 Alayu Yalew et al.
Statistical analysis
The mean value of each water quality parameter was taken and
compared between treatments. Experimental fish size increment was
computed based on the measurement taken. The SGR, FCR and PI
values of the different feeding regimes were compared to select the
feeding level with better growth and low cost. The data obtained from
this experiment was subjected to one-way analysis of variance test,
and the means compared using SPSS version 20 software.
RESULTS AND DISCUSSION
Water quality
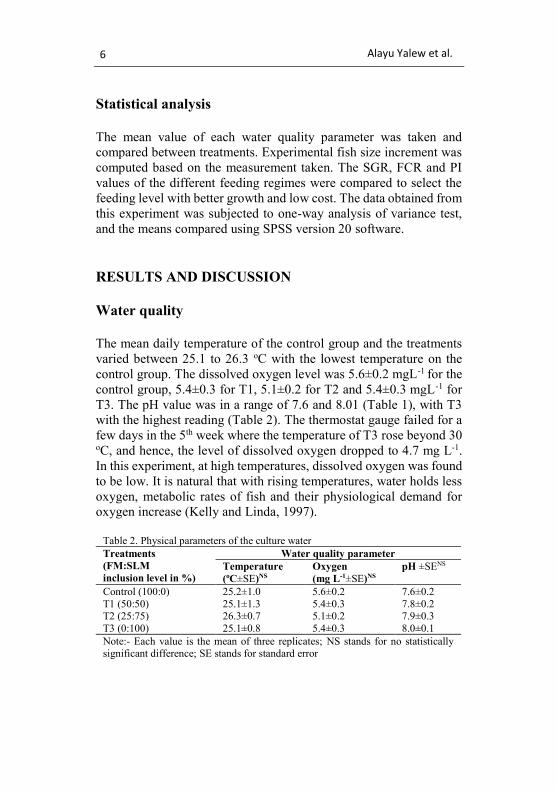
The mean daily temperature of the control group and the treatments
varied between 25.1 to 26.3 oC with the lowest temperature on the
control group. The dissolved oxygen level was 5.6±0.2 mgL-1 for the
control group, 5.4±0.3 for T1, 5.1±0.2 for T2 and 5.4±0.3 mgL-1 for
T3. The pH value was in a range of 7.6 and 8.01 (Table 1), with T3
with the highest reading (Table 2). The thermostat gauge failed for a
few days in the 5th week where the temperature of T3 rose beyond 30 oC, and hence, the level of dissolved oxygen dropped to 4.7 mg L-1.
In this experiment, at high temperatures, dissolved oxygen was found
to be low. It is natural that with rising temperatures, water holds less
oxygen, metabolic rates of fish and their physiological demand for
oxygen increase (Kelly and Linda, 1997).
Table 2. Physical parameters of the culture water
Treatments
(FM:SLM
inclusion level in %)
Water quality parameter
Temperature
(oC±SE)NS
Oxygen
(mg L-1±SE)NS
pH ±SENS
Control (100:0) 25.2±1.0 5.6±0.2 7.6±0.2
T1 (50:50) 25.1±1.3 5.4±0.3 7.8±0.2 T2 (25:75) 26.3±0.7 5.1±0.2 7.9±0.3
T3 (0:100) 25.1±0.8 5.4±0.3 8.0±0.1
Note:- Each value is the mean of three replicates; NS stands for no statistically significant difference; SE stands for standard error

Ethiop. J. Sci & Technol 12(1): 1-17, 2019 7
Temperatures, dissolved oxygen levels and pH varied between
treatments and the control group, though not significant. The mean
levels were found within the optimum demand for the growth of C.
gariepinus juveniles, i.e., 22 – 30 oC, 4 mgL-1 dissolved oxygen and
pH range of 6.5 to 9 (Schram et al., 2010).
Fish adaptation and condition
As the intention is to grow fish fries into fingerlings, the average
stocking size of a fish was 6.05 for the control group, 6.08 g for T1,
6.04 g for T2 and 5.88 g for T3, and the condition factor (K value)
varied between 0.69 and 0.71. There was no significant difference
among treatments. At the end of the experiment, the K values were
significantly different, i.e., 0.68 for the control group, 0.67 for T1,
0.60 for T2 and 0.44 for T3 (Table 3). Some 90% of experimental
fishes adapted well to the condition; adaptation levels significantly
varied between treatments (40% of the fishes in T3 died during the
experiment).
Table 3. Effect of sweet lupin replacement on the performance of C. gariepinus
juveniles (mean ±SD).
Variable Mean for treatments (diets)
Control T1 T2 T3
Survival (%) 100±0.0b 100.0±0.0b 99.7±0.10b 60.0±1.3a
Mean weight (g)
Initial 6.1±0.2a 6.1±0.22a 6.0±0.20a 5.88±0.2a
Final 30.7±0.4c 29.8±0.45c 19.7±0.30b 3.47±0.2a
Condition factor (k)
Initial 0.7±0.1a 0.71±0.03a 0.7±0.03a 0.71±0.0a
Final 0.7±0.0c 0.67±0.01c 0.6±0.04bc 0.44±0.1a
Weight gain (g) 23.2±1.1c 22.6 ± 0.8c 13.5±0.07b -3.75±0.6a
AGR (g day-1) 0.1±0.0c 0.044±0.0c 0.03±0.00b 0.02±0.0a
SGR (g day-1) 2.6±0.1c 2.53±0.2c 2.02±0.08b -1.68±0.1a
FCR 2.7±0.1c 2.73±0.1c 3.55±0.12b -8.92±2.3a
Survival (%) stands for “Fish survival (%)”; means followed by different letters
within a row are not significantly different from each other at α=0.05; all values are means of three replicates.
The mean adaptation of the fishes was generally high with no
cannibalism observed during the experiment. This might be due to the

8 Alayu Yalew et al.
minimum stocking density (FAO, 2010) of the fingerlings, uniformity
of the fingerlings and the management of the fingerlings in the same
environment in which they have been reared and grown till they are
recruited for the experiment. Juveniles at T3 did not perform well
indicating that replacing FM 100% with SLM in feed formulation had
a negative effect on the performance and condition of fish. Apart from
incorporating SLM 100% in fish diet, death and weight loss of
experimental fish increased when the dissolved oxygen level dropped
to 3 mg L-1.
Studies show that more than 90% of dissolved oxygen consumption
of juvenile C. gariepinus is from tank water (Hecht and Uys, 1997)
and at a temperature of 30 oC, oxygen level of the water dropped and
the body condition of small C. gariepinus fishes decreased by 11%
day-1 (Degani et al., 1988). The condition of the fish was good at the
beginning compared to the end of the experiment due to the change
in feeding regime whereby the experimental fishes become
completely dependent on formulated feed.
Fish weight gain and growth performances
The weekly percentage weight gain showed a decreasing trend in time
for all the treatments and the control group. The gain was very low
for T3 and better for the control and T1 (Figure 1). The growth of the
fingerlings (weight) for the control group and T1 was higher (30.6
and 29.8 g) but that of T2 and T3 was lower (19.7 and 3.5 g) and the
difference was significant (Figure 2).
The average weight gained by C. gariepinus fingerlings was 23.17 g
for T1, 22.64 g for T2, and 13.47 g for T3 and (-)3.75 g for the control
(Table 3). The control group and T1 had better mean weight gain
compared to the other treatments and the difference was significant.
The decline in average mean weight gain for T3 was extreme and
went below zero indicating that the fish failed to grow and dropped
from their original size. This might be due to the presence of insoluble
molecules (Carter and Hauler, 1999), protease (mainly chymotrypsin)
inhibitors (Petterson et al., 1997; Alonso et al., 2000) and saponins in
L. luteus (Cuadrado et al., 1995). At the 8th week, all the experimental

Ethiop. J. Sci & Technol 12(1): 1-17, 2019 9
fishes showed 90% and more reduction in weight. Fingerlings fed
with 100% replacement of FM by SLM decreased from their original
size and they were stunted. Fingerlings that were fed on 75% SLM
achieved their maximum weight at the 9th week on which those on the
control group and 50% inclusion of SLM attained earlier at their 5th
week (Figure 2). Feed formulations with SLM inclusion level of 75%
and more had significant effect on the growth of fish.
Figure 1. Weekly percentage weight gain of experimental fishes
The control group and T1 showed similar growth patterns in the
growth curve but fingerlings in T2 had been growing so slowly and
those in T3 have a negative growth. An overlapped error bars in the
figure indicated no significance difference.
Growth rates and food conversion ratio
The AGR of fishes on the control and T1 was better than T2 and T3,
which received higher proportion (75% and 100%) of SLM. The
AGR was 0.045 g day-1 for fishes that grow in 0 and 0.44 g day-1 in
50% SLM replacement. Fishes that fed with higher proportion of
SLM or lower proportion (25 and 0%) of FM had lower AGR (0.032
and 0.02 g day-1). Over the duration of the study period, SGR was
-2.5
-1.5
-0.5
0.5
1.5
2.5
3.5
4.5
1 2 3 4 5 6 7 8
Time (weeks)
Control T1 T2 T3

10 Alayu Yalew et al.
2.57 for the control, 2.53 for T1, 2.02 for T2 and (-)1.68 for T3 (Table
3). These values significantly varied.
Figure 2. Experimental fish growth curve (g) in time (weeks).
SGR and FCR values were the same for treatments that received equal
or higher proportion of FM and SLM (Figure 3). But the FCR value
was significantly higher for T3 which received 100% inclusion of
SLM compared to the others. The FCR was very high for T3 with
100% replacement of SLM to that of FM, indicating lower efficiency
of SLM in the production of fingerlings (Table 3).
The FCR of the control group and T1 was higher and hence the fish
have converted feeds into biomass. Diets that contain a high level of
animal protein and those composed principally of plant-based
ingredients are digestible due to reduced trypsin and chymotrypsin
inhibitory activities (Petterson et al., 1997; Alonso et al., 2000). In
this study, feeds formulated with high level of SLM (75 and 100%)
had poor growth performance of C. gariepinus fingerlings than those
fed in 0% and 50% SLM inclusion levels. This poor performance and
stunted growth in T3 might be due to the anti-nutritional factor found
in small concentrations in sweet lupin seeds (Petterson et al., 1997;
Barneveld, 1999; Alonso et al., 2000; Glencross, 2001) and the
comparatively low concentration of methionine and cysteine, which
0
10
20
30
40
week 0 week 1 week 2 week 3 week 4 week 5 week 6 week 7 week 8 week 9
Fish
gro
wth
, g
Control T1 T2 T3

Ethiop. J. Sci & Technol 12(1): 1-17, 2019 11
are important for the growth of fingerlings (Glencross, 2001;
Likawent Yeheyis et al., 2012b).
Better growth rates in the control group and T1 might be due to better
digestibility and availability of amino acids and fish oil in FM in
concentrations that satisfy what is required for C. gariepinus
fingerlings. Studies also confirmed that feeds with higher proportion
of dietary carbohydrate levels increased intestinal alpha-amylase
activity of fishes (Ali and Jauncey, 2005).
The food conversion efficiency of fishes that received higher
proportion of SLM was low, which might be because of high levels
of saturated fats that reduce palatability (Goda et al., 2007). Reduced
FCR might also be caused by the quality of the feed, i.e.,
indigestibility of SLM and deficiency of amino acids methionine and
cysteine on L. luteus (Petterson et al., 1997). Juveniles of C.
gariepinus fish require 50% CP (Ali, 2001). As the proportion of
SLM increases, the strength of the pellets gets harder and stiffer for
the juveniles of C. gariepinus and cannot eat it immediately.
Feasibility of sweet lupin meal replacement
All other costs were the same for the control group and treatments 1,
2 and 3 till the end of the experiment. Feed provided for experimental
fishes was 1.96 kg for the control group and 1.95 kg for T1, 1.49 for
T2 and 0.35 kg for T3. The feed consumed by T3 was significantly
lower compared to the other treatments (Figure 3). This was due to
the smaller number and size of the experimental fishes in this
treatment group. Treatments with higher proportion of FM (50 and
100%) incurred significantly more cost than treatments with lower
level; cost was higher for the control group (Table 4). The amount of
feed consumed by T1 was the same with the control group but the
cost was still higher for the control. This was due to the higher cost
of FM which continues to increase with time in Ethiopia. Each
treatment received equal number (n = 30) of juveniles at the start. The
estimated market value of a fingerling of C. gariepinus was 0.6 Birr
for 25 to 35 g weighing ones, 0.20 Birr for 15 to 24 g, 0.10 Birr for 5

12 Alayu Yalew et al.
to 14 g and 0.04 Birr for less than 5 g. This was estimated based on
the actual price of tilapia fingerlings around Bahir Dar area.
Figure 3. Feed provided (kg) and cost expended for feed (Birr)
Table 4. Profit index of the different replacement level of sweet lupin.
Ingredients & expenses
Unit
price
Total cost of diets
Control T1 T2 T3
Fish meal (Tilapia offal) 20.0 3.140 1.556 0.596 0.000
Sweet lupin meal‡ 0.4 0.000 0.312 0.358 0.112 Niger seed cake 0.4 0.094 0.094 0.072 0.016
Wheat bran 0.8 0.086 0.086 0.066 0.016
Bone meal 0.6 0.024 0.024 0.018 0.0104 Premix 0.002 0.002 0.002 0.001 0.0004
Total feed cost (Birr) 3.35 2.07 1.11 0.15
Number of fingerlings grown 30 30 29 18 Average weight of a fingerling (g) 30.67 29.82 19.68 3.47
Market value of fingerlings (Birr) 18 18 5.8 0.72
Profit Index (PI) 5.4a 8.7b 5a 4.8a
Note:-Each PI value is a mean calculated from three replicates; (%)”; means followed by different letters within a row are not significantly different from each other at α=0.05
(F=46.56); ‡ Sweet lupin (L. luteus) meal; wheat (T. aestivum) bran; niger seed (G.
abyssinica) cake.
The total feed cost to grow 30.7 g sized fingerling for the control
group was 3.4 Birr, to grow 29.8 g for T1 was Birr 2.1, to grow 19.7
g for T2 was Birr 1.1 and to grow 3.5 g for T3 was 0.2 Birr (Table 4;
Figure 3).
1.96 1.95
1.49
0.35
3.35
2.07
1.11
0.15
0
0.5
1
1.5
2
2.5
3
3.5
4
Control T1 T2 T3
Feed Cost

Ethiop. J. Sci & Technol 12(1): 1-17, 2019 13
Bigger C. gariepinus fingerlings with similar SGR and FCR were
produced from T1 at a reduced cost than the control group (Table 3;
Figure 4). This shows the possibility of growing C. gariepinus
fingerlings to a grow-out sized ones with cheaper and locally
available feed sources. All the fingerlings grown in the experiment
were harvested for grow out ponds.
As indicated on Figure 4, the food conversion efficiency and growth
rate of fish was higher at no replacement of FM by SLM but the feed
cost was higher which might not be feasible for the producer. The
growth performance and food conversion efficiency were reduced at
higher inclusion level of SLM. Clarias gariepinus fingerlings with
better food conversion efficiency, better growth rate and with lower
feed cost were produced at 50% replacement level of SLM (T1). The
arrow indicates the point where better fingerlings were produced at
best cost. The PI value of T1 was significantly higher compared to
the other treatments and the control group. The PI value of T1 was
8.7 but 5.4 for the control group, 5 for T2 and 4.8 for T3 (Table 4).
The 50% replacement had better PI value, indicating that the cost
expended to grow fingerlings was smaller than the other replacement
levels. The PI was higher when large proportion of FM is replaced by
SLM as plant proteins from locally available sources are cheaper. The
optimum production cost with better FCR and SGR have been found
at SLM to FM proportion of 50:50 (T1) as the fishes in this group
grew better in a lower feed cost than the control and their market value
was equal to the control group but more than T2 and T3.
CONCLUSION
For better growth and adaptation of the juveniles of African
catfish (C. gariepinus), it is critically important to keep the
water clean at all times and fix culture water temperature
between 23 and 25 oC. In this study, feeds were formulated and
tested for the juveniles of African catfish.

14 Alayu Yalew et al.
Figure 4. Feed conversion efficiency, growth rate and feed cost
It was confirmed that sweet lupin meal could effectively
replace the standard fish meal but the inclusion level should not
go beyond 50%. To increase the replacement level and reduce
production cost, yellow sweet lupin (L. luteus) seed quality
might have to be improved.
REFERENCES Ali, M.Z. (2001). Dietary protein and energy interaction in African catfish,
C. gariepinus (Burchell, 1822). Ph. D thesis. Sterling University, 271 pp.
Ali, M.Z and Jauncey, K. (2005). Effect of dietary lipid to carbohydrate
ratios on body composition, digestive enzyme activities and blood plasma
components in African catfish, Clarias gariepinus. Journal of
Aquaculture in the Tropics 20(1): 57-70.
Alonso, Aguirre, A and Marzo, F. (2000). Effects of extrusion and
traditional processing methods on anti-nutrients and in vitro digestibility
of protein and starch in faba and kidney beans. Food Chemistry 68 (2):
159-165.
Barneveld, R.J. (1999). Understanding the nutritional chemistry of lupin
(Lupinus spp.) seed to improve livestock production efficiency. Nutrition
Research 12: 203-230.
Broody, S. (Ed.) (1945). Bioenergetics and growth. Reinhold Publication
Corporation, New York.
Brown, M.E. (1957). Experimental studies on growth. In: The Physiology
of Fishes (Vol. 1. pp 361-400). Academic Press, New York.
0
2
4
6
8
10
Control T1 T2 T3
FCR SGR Feed cost

Ethiop. J. Sci & Technol 12(1): 1-17, 2019 15
Burel, C., Boujard, T., Corraze, G., Kaushik, S., Boeuf, G., Mol, K.,
Geyten, S and Kuhn, E. (1998). Incorporation of high levels of extruded
lupin in diets for rainbow trout (O. mykiss): nutritional value and effect
on thyroid status. Aquaculture 163: 325-345.
Carter, C.G and Hauler, R.C. (1999). Evaluation of phytase in Atlantic
salmon, Salmo salar L., feeds containing fishmeal and different plant
meals. In: Fishmeal replacement in Aquaculture Feeds for Atlantic
salmon. Project 93/120. Fisheries Research and Development
Corporation, Canberra, Australia. pp 34-45.
Cuadrado, C., Ayet, G., Burbano, C., Muzquiz M., Camacho L., Caviers, E.,
Lovon M., Osagie A and Price K. (1995). Occurrence of saponins and
sapogenols in Andean crops. Journal of the Science of Food Agriculture
67: 169-172.
Dale, N., Zumbado, M., Gernat, G and Romo, G. (2004). Nutrient value of
tilapia meal. Journal of Applied Poultry Research 13: 370-372.
Degani, G., Ben-Zvi, Y and Levanon, D. (1988). The relationship between
body size and growth of African catfish (Clarias gariepinus) (Burchell,
1922) Fed practical diet. Indian Journal of Fish 35 (3): 207-210.
FAO (2010). Cultured aquatic species information program African catfish,
Clarias gariepinus Burchell, 1822. Fisheries and Aquaculture
Department, Rome, 13pp.
Glencross, B.D. (2001). Feeding lupins to fish: A review of the nutritional
and biological value of lupins in aquaculture feeds. Australia Fisheries
Research Report, 126 pp.
Goda. A., El-Haroun, E and Chowdhury, K. (2007). Effect of totally or
partially replacing fish meal by alternative protein sources on growth of
African catfish Clarias gariepinus (Burchell, 1822) reared in concrete
tanks. Aquaculture Research 39: 279-287.
Hecht, T and Uys, W. (1997). Effect of density on the feeding and behavior of
juvenile African catfish, Clarias gariepinus. South African Journal of
Science 93: 537-41.
Likawent Yeheyis, Kijora, C., van Santen, E and Peters, K.J. (2012a). Sweet
annual lupins (Lupinus spp.); their adaptability and productivity in
different agro-ecological zones of Ethiopia. Journal of Animal Science
Advances 2(2): 201-215.
Likawent Yeheyis, Kijora, C., van Santen, E., Wink, M., Danier, J and
Peters, K.J. (2012b). Crude protein, amino acid and alkaloid content of
annual sweet lupins (Lupinus spp. L.) forages and seeds growth in
Ethiopia. Experimental Agriculture 48 (3): 414-427.
Kelly, A and Linda, G. (1997). Dissolved Oxygen and Temperature. Natural
resources Facts. Fact sheet No.96-3, 5 pp.
Kim, J.C., Mullan, B.P., Heo, J.M., Hernandez, A and Pluske, J.R. (2009).
Variation in digestible energy content of Australian sweet lupins

16 Alayu Yalew et al.
(Lupinus angustifolius L.) and the development of prediction equations
for its estimation. Journal of Animal Science 87(8): 2565-2573.
Ng, W. K, Lim, P. K and Sidek, H. (2001). The influence of dietary lipid
source on growth, muscle fatty acid composition and erythrocyte osmotic
fragility on hybrid tilapia. Fish Physiology and Biochemistry 25: 301-
310.
Petterson, D.S., Sipsa, S and Mackintosh, J.B. (1997). The Chemical
Composition and Nutritive Value of Australian Pulses. Grains Research
and Development Corporation. Canberra, Australia, 65pp.
Robaina, L., Izquierdo, S., Moyano, J., Socorro, J., Vergara, M., Montero,
D and Fernandez-Palacios, H. (1995). Soybean and lupin seed meals as
protein sources in diets for seabream (Sparus aurata): nutritional and
histological implications. Aquaculture 130: 219-233.
Sipsas, S. (2003). Protein concentrates and isolates. In: Seeding a future
for grains in Aquaculture feeds. Workshop proceedings held in
Fremantle, Western Australia, p8-10.
Smith, D.M. (1997). Fishmeal replacement in aquaculture diets for prawns.
Final report of project 93/120-02; Fisheries Research and Development
Corporation, Canberra, Australia, 168pp.
Smith, D.M. (2002). Improving the efficacy of lupin as fishmeal
replacements in aquaculture diets for prawns. Final report to the Grains
Research and Development Corporation (GRDC), Project CSM1, GRDC,
Canberra, Australia, 23pp.
Tadele Dessie and Ogle, B. (1997). Effect of Maize (Zea mays) and Niger
seed (Guizotia abyssinica) cake supplementation on egg production
performance of local birds under scavenging conditions in the Central
Highlands of Ethiopia. Proceedings of the International Network for
Family Poultry Development (INFPD) workshop, M’Bour, Senegal,
p154-167.
Tekeba Eshetie (2005). Compatibility of quality protein maize and sesame
seed meal as a substitute for synthetic amino acids in Broiler Rations.
MSc Thesis, Alemaya University of Agriculture, Ethiopia. 46 pp.
Williams, K.C. (1998). Efficacy of utilization of different feed sources as
measured by summit dilution. In: Fishmeal replacement in aquaculture
feeds for Barramundi (K.C. Williams, ed.), Final Report of Project
93/120-03 to the Fisheries Research and Development Corporation,
Canberra, Australia, 108 pp

Ethiop. J. Sci & Technol 12(1): 1-17, 2019 17
Annex 1. Weight gained by experimental fishes (descriptive statistics)
Treatment N Mean Standard
deviation
Standard
error
95% confidence
interval
Min Max
Lower Upper
Ctrl 3 23.2 1.12 0.64 20.40 25.94 22.2 24.4 T1 3 22.6 0.75 0.43 20.78 24.50 21.8 23.2
T2 3 13.5 0.07 0.04 13.28 13.65 13.4 13.5
T3 3 3.7 0.56 0.33 5.19 2.32 4.3 3.1