effect of rates and forms of potassium feretilization … · effect of rates and forms of potassium...
TRANSCRIPT

EFFECT OF RATES AND FORMS OF EFFECT OF RATES AND FORMS OF POTASSIUM FERETILIZATION ON RICE CROP POTASSIUM FERETILIZATION ON RICE CROP UNDER SALT AFFECTED SOIL CONDITIONS UNDER SALT AFFECTED SOIL CONDITIONS
AT NORTHERN DELTA OF EGYPTAT NORTHERN DELTA OF EGYPT
HADI and SH.Z. SALEHHADI and SH.Z. SALEH--A.H. ABD ELA.H. ABD EL, M. H;, M. H;ELKholyELKholySoil, Water and Environment Research Inst., ARC,Soil, Water and Environment Research Inst., ARC,
GizaGiza, Egypt., Egypt.
EE--mail:mail: [email protected]@hotmail.com

INTRODUCTIONINTRODUCTION

Rice Rice ((OryzaOryza sativa, L.)sativa, L.) is the staple food for is the staple food for
more than half of the worldmore than half of the world’’s population. In s population. In
Egypt, rice is a very important cereal crop Egypt, rice is a very important cereal crop
for both consumption and export. Salinity in for both consumption and export. Salinity in
the Nile Delta increases progressively from the Nile Delta increases progressively from
less than 4 less than 4 dsds/m in the southern part to /m in the southern part to
about 16 about 16 dsds/m in the northern coastal area, /m in the northern coastal area,
which is suffering from intrusion of which is suffering from intrusion of
seawater, water shortage and poor quality seawater, water shortage and poor quality
of irrigation water.of irrigation water.

Therefore, rice is considered as Therefore, rice is considered as
reclamation crop for saline soil in reclamation crop for saline soil in
North Delta because of its flooding North Delta because of its flooding
condition. Also, rice cultivars avoid condition. Also, rice cultivars avoid
NaNa++ toxicity by maintaining a high toxicity by maintaining a high
level of Klevel of K++ in the terms of high in the terms of high
affinity of Kaffinity of K++ uptake against Nauptake against Na++
((ZayedZayed, 2002)., 2002).

Von Von UexkullUexkull and and BeatonBeaton (1992)(1992)
pointed out that rice roots are pointed out that rice roots are
very efficient in extracting K from very efficient in extracting K from
the soil solution and under the soil solution and under
intensive cropping most soils will intensive cropping most soils will
sooner or later be exhausted in K sooner or later be exhausted in K
reserves and thus become reserves and thus become
responsive to applied potash responsive to applied potash
fertilizer. fertilizer.
Also, depletion of soil K is hastened by the Also, depletion of soil K is hastened by the
removal of rice straw. Although the removal of rice straw. Although the
Egyptian soils showed somewhat high KEgyptian soils showed somewhat high K--
content, sporadic response of several crops content, sporadic response of several crops
to K fertilization have been reported. This is to K fertilization have been reported. This is
because of the existence of dynamic because of the existence of dynamic
equilibrium among the different forms of K equilibrium among the different forms of K
in soil. in soil.

Potassium chloride or Potassium chloride or muriatemuriate of potash of potash
(MOP) accounts for some of 91% 0f world (MOP) accounts for some of 91% 0f world
potassium consumption in agriculture. Due potassium consumption in agriculture. Due
to its relatively low price and high K content to its relatively low price and high K content
(60% K2O), the vast majority of crops (60% K2O), the vast majority of crops
fertilized with K chloride including field and fertilized with K chloride including field and
horticultural crops. horticultural crops.

The other potash products namelyThe other potash products namely
sulphatesulphate of potash (SOP) and nitrate of of potash (SOP) and nitrate of
potash (NOP) account for 7% and 2% potash (NOP) account for 7% and 2%
respectively respectively (IPI Research Topics No. 22, (IPI Research Topics No. 22,
2001).2001). Thus, choosing the right kind of Thus, choosing the right kind of
potash fertilizer can be as important as potash fertilizer can be as important as
applying the right amount of potash to a applying the right amount of potash to a
crop.crop.

There is combination of soil and There is combination of soil and climate conditions where the use climate conditions where the use of potassium chloride can of potassium chloride can exacerbate the damaging effects exacerbate the damaging effects of salinity of salinity (as in Egypt)(as in Egypt) because of because of its high chlorine content (48%).its high chlorine content (48%).
So,So, sulphatesulphate of potash (50% of potash (50% K2O and 18% S) is the most K2O and 18% S) is the most preferred K source in Egypt should preferred K source in Egypt should reach up to 250,000 tons Kreach up to 250,000 tons K22O in O in the future. the future.

The question has been recently The question has been recently raised whether the introduction of raised whether the introduction of potassium chloride in Egypt would potassium chloride in Egypt would help to satisfy the growing help to satisfy the growing demand while costing the country demand while costing the country less hard currency and whether it less hard currency and whether it can be used safely without can be used safely without detrimental longdetrimental long--term effects on term effects on crop yield and quality and soil crop yield and quality and soil conservation especially under conservation especially under prevailing conditions of increasing prevailing conditions of increasing fertilizer rates.fertilizer rates.

This study aim to evaluate the This study aim to evaluate the
comparative effects of SOP and comparative effects of SOP and
MOP on rice as well as soil salinity MOP on rice as well as soil salinity
and contents of chlorine and and contents of chlorine and
available potassium throughout available potassium throughout
longlong--term Experiments. term Experiments.

MATERIALS AND METHODSMATERIALS AND METHODS

Two longTwo long--term trials (LTT) were term trials (LTT) were initiated in 1999/00 and lasted until initiated in 1999/00 and lasted until 2003 growing season at El2003 growing season at El--SerwSerwAgricultural Research Station ( clayey Agricultural Research Station ( clayey soils),soils), DamiettaDamietta Governorate (North of Governorate (North of Nile Delta) to compare the relative Nile Delta) to compare the relative effectiveness of potassiumeffectiveness of potassium sulphatesulphate(SOP) and potassium chloride (MOP) (SOP) and potassium chloride (MOP) on various annual crops and soil on various annual crops and soil contents of total soluble salts (TSS), contents of total soluble salts (TSS), soluble chloride and available soluble chloride and available potassium.potassium.

Damietta

The two experiments were established on two different sites The two experiments were established on two different sites having the following characteristics:having the following characteristics:
Table 1. soil analysis of the experimental sites (sampling of 19Table 1. soil analysis of the experimental sites (sampling of 1999).99).
ElEl--SerwSerw--22ElEl--SerwSerw--11Soil characteristicsSoil characteristics
ClayeyClayey
44.444.4
8.78.7
0.360.36
1.241.24
16.216.2
4.324.32
2828
9.89.8
550550
ClayeyClayey
44.244.2
8.28.2
0.240.24
1.451.45
12.512.5
2.972.97
3535
11.411.4
578578
Soil textureSoil texture
CEC (CEC (meqmeq/100 g soil/100 g soil
Soil PH (1: 2.5 Soil PH (1: 2.5 suspsusp.).)
TSS%TSS%
OM%OM%
ESP%ESP%
ClCl meqmeq/100 g soil/100 g soil
AvailableAvailable--N (KN (K--sulphatesulphate ext.) ext.) ppmppm
AvailableAvailable--p (Olsen ext.) p (Olsen ext.) ppmppm
AvailableAvailable--K (K (AmmAmm. . AcetAcet. ext.) . ext.) ppmppm

Rice Rice ((OryzaOryza sativa L., varietysativa L., varietyGizaGiza 178)178) was comprised in was comprised in the crop sequences as a the crop sequences as a summer crop during 2001 and summer crop during 2001 and 2003 seasons at El2003 seasons at El--SerwSerw--1 and 1 and during three summer seasons during three summer seasons (2000, 2002 and 2003)(2000, 2002 and 2003) at Elat El--SerwSerw--2. 2.

The two experiments had five treatments as follows:
1-Control without K fertilizer.
2-70 kg K2O/ha in the form of SOP (50%K2O).
3-140 kg K2O/ha in the form of SOP (50%K2O).
4-70 kg K2O/ha in the form of MOP (60%K2O).
5-140 kg K2O/ha in the form of MOP (60%K2O).

The treatments were arranged in Latin square design with five replications with plot size 25 m2. Potash fertilizers were applied in two equal doses; i.e. 2 weeks after transplanting and at panicle initiation. Urea (46% N) was used as source of nitrogen fertilizer (144 kg N/ha) in two equal doses to all treatments.

Table (2): crop sequence at each location during the experimental period
Location El-Serw-2El-Serw-1Seasons
WheatBerseem1999/00 (winter season)
RiceMaize2000 (summer season)
BerseemWheat2000/01 (winter season)
MaizeRice2001 (summer season)
BerseemBerseem2001/02 (winter season)
RiceMaize2002 (summer season)
BerseemWheat2002/03 (winter season)
RiceRice2003 (summer season)

The first was applied 2 weeks
after transplanting and the second
was added at panicle initiation.
Equal doses (36 kg P2O5/ha) of
triple superphosphate (46%
P2O5), free- sulphate was applied
to the soil surface before final
land preparation and thoroughly
mixed into the soil.

At harvest, rice grain and straw yields
were recorded (ton/ha). The dry grain
samples from each plot were ground
and wet digested with H2SO4-HCLO4
mixture as described by Peterburgski
(1968).

Nitrogen, Phosphorus and Potassium Nitrogen, Phosphorus and Potassium
percentages were determined according to percentages were determined according to Black Black
(1982). (1982).
Chloride was determined according to Chloride was determined according to Piper Piper
(1947). (1947).
SulphateSulphate was determined according to was determined according to Chapman Chapman
and Pratt (1961). and Pratt (1961).

Representative soil surface (0Representative soil surface (0--30 cm) samples 30 cm) samples
were collected from each plot after harvesting the were collected from each plot after harvesting the
rice crop to follow up the concentration of salinity, rice crop to follow up the concentration of salinity,
soluble soluble ClCl and the available K. TSS was estimated and the available K. TSS was estimated
according to according to Jackson (1973).Jackson (1973). Soluble chloride was Soluble chloride was
also determined by titration with silver nitrate also determined by titration with silver nitrate
according to according to Jackson (1973).Jackson (1973).

The available K was extracted by neutral The available K was extracted by neutral
(1N) ammonium acetate and determined by flame (1N) ammonium acetate and determined by flame
Photometer Photometer (Jackson, 1973).(Jackson, 1973).
Finally, the economic aspects of using Finally, the economic aspects of using
potassium fertilizer were done.potassium fertilizer were done.

RESULTS AND DISCUSSIONRESULTS AND DISCUSSION

AA-- Rice yield data:Rice yield data:

The obtained results showed significant The obtained results showed significant
increase in both grain and straw yields as increase in both grain and straw yields as
a result of using both SOP and MOP a result of using both SOP and MOP
fertilizers with no significant differences fertilizers with no significant differences
between the two rates (70 and 140 kg between the two rates (70 and 140 kg
K2O/ha).K2O/ha).

Effect of different sources of potassium fertilizers and its rates (Kg K2O/ha) on rice crop production (t/ha) during the experimental period
at El-Serw-2.
55.45.86.26.6
77.47.88.28.6
99.49.8
Con
trol
SOP
70
SOP
140
Mea
n
MO
P 70
MO
P 14
0
Mea
n
Treatment
Yiel
d t/h
a
2000 Grain 2000 Straw 2002 Grain 2002 Straw 2003 Grain2003 Straw Mean Grain Mean Straw
200320032002200220002000StrawStrawGrainGrainStrawStrawGrainGrainStrawStrawGrainGrain0.980.980.940.940.850.850.730.730.980.980.950.95LSD at 5%LSD at 5%

Generally (according to the mean Generally (according to the mean results of two years at Elresults of two years at El--SerwSerw--1 1 and three years at Eland three years at El--SerwSerw--2), 2), using SOP fertilizer resulted an using SOP fertilizer resulted an increase of rice grain yield over increase of rice grain yield over control (0control (0--K) treatment being K) treatment being 24.5% and 29.6% at El24.5% and 29.6% at El--SerwSerw--1 1 and 19.55% and 20.11% at Eland 19.55% and 20.11% at El--SerwSerw--2 with the rates of 70 and 2 with the rates of 70 and 140 kg K2O/ha respectively. 140 kg K2O/ha respectively.

In conclusion, the grown rice at this In conclusion, the grown rice at this
location in North Delta (heavy clayey soil) location in North Delta (heavy clayey soil)
showed positive significant response to showed positive significant response to
both SOP and MOP fertilizers in most cases. both SOP and MOP fertilizers in most cases.
Moreover, MOP fertilizer, especially at the Moreover, MOP fertilizer, especially at the
higher rate, induced slight reduction in rice higher rate, induced slight reduction in rice
yield compared to SOP confirming that SOP yield compared to SOP confirming that SOP
is exclusive for salt affected soils. is exclusive for salt affected soils.

BB-- Elements concentrations:Elements concentrations:
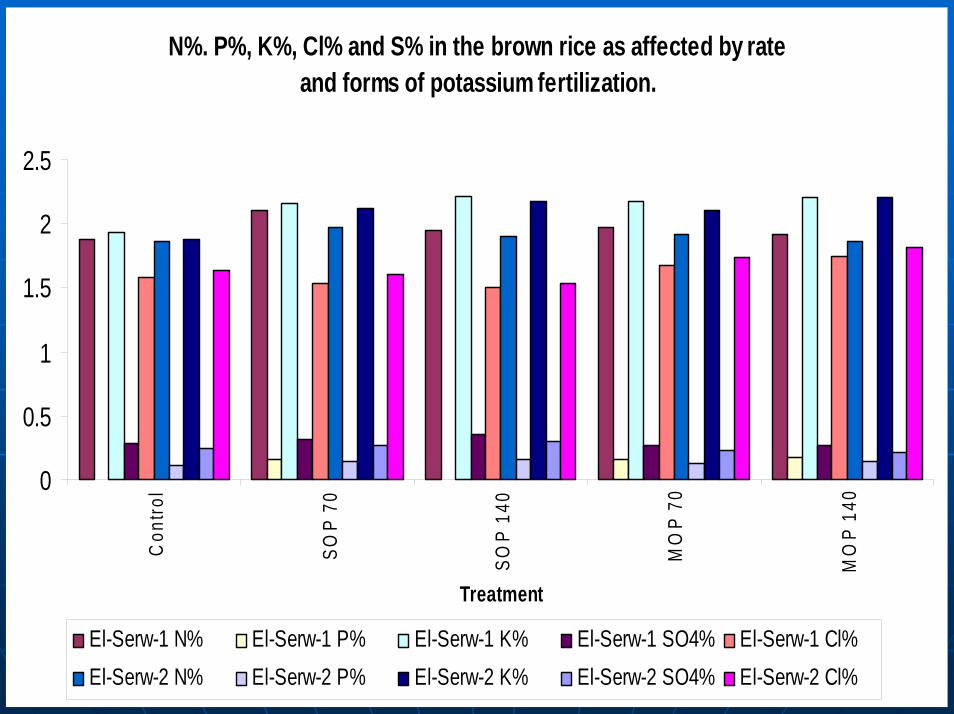
N%. P%, K%, Cl% and S% in the brown rice as affected by rateand forms of potassium fertilization.
0
0.5
1
1.5
2
2.5C
ontro
l
SOP
70
SOP
140
MO
P 70
MO
P 14
0
Treatment
El-Serw-1 N% El-Serw-1 P% El-Serw-1 K% El-Serw-1 SO4% El-Serw-1 Cl%El-Serw-2 N% El-Serw-2 P% El-Serw-2 K% El-Serw-2 SO4% El-Serw-2 Cl%

The results indicated that the higher N% The results indicated that the higher N%
was found in plants fertilized with SOP and was found in plants fertilized with SOP and
MOP respectively, compared with the MOP respectively, compared with the
control (no K fertilization), which gave the control (no K fertilization), which gave the
lowest value of N%. However, the lower lowest value of N%. However, the lower
rate (70 kg K2O/ha) in both two forms gave rate (70 kg K2O/ha) in both two forms gave
values of N% more than those of the higher values of N% more than those of the higher
rate (140 kg K2O/ha). In this respect, rate (140 kg K2O/ha). In this respect, Liu Liu
and and ShelpShelp (1996)(1996) pointed out that N content pointed out that N content
did not decrease in response of did not decrease in response of ClCl
application. application.

While, MOP caused an increase of rice grain While, MOP caused an increase of rice grain
yield over control treatment being 22.7% yield over control treatment being 22.7%
and 26.64% at Eland 26.64% at El--SerwSerw--1 and 14.91% and 1 and 14.91% and
15.47% at El15.47% at El--SerwSerw--2 with using the above 2 with using the above
mentioned two rates. mentioned two rates. The IPI Research The IPI Research
Topics No. 22 (2001)Topics No. 22 (2001) mentioned that mentioned that
potassium application could lessen potassium application could lessen
detrimental effects of drought and soil detrimental effects of drought and soil
compaction on root growth and yield of compaction on root growth and yield of
upland rice. When K was applied, soil upland rice. When K was applied, soil
compaction did not decrease grain even compaction did not decrease grain even
with a low water supply.with a low water supply.

ElEl--SerwSerw--22ElEl--SerwSerw--11ClCl%%SO4SO4
%%K%K%P%P%N%N%ClCl%%SO4SO4%%K%K%P%P%N%N%
1.641.640.240.241.881.880.120.121.861.861.581.580.280.281.931.93o.14o.141.881.88ControlControl
1.601.600.270.272.122.120.140.141.981.981.541.540.310.312.162.160.160.162.102.10SOP 70SOP 70
1.541.540.300.302.182.180.160.161.901.901.501.500.360.362.222.22o.18o.181.941.94SOP 140SOP 140
1.741.740.230.232.102.100.130.131.921.921.681.680.270.272.172.170.150.151.981.98MOP 70MOP 70
1.821.820.210.212.202.200.140.141.861.861.751.750.270.272.202.200.170.171.921.92MOP 140MOP 140
TreatmentTreatment

Results also indicated that SOP produced a Results also indicated that SOP produced a
high value of P% than MOP. This may be high value of P% than MOP. This may be
attributed to low salt index of potassiumattributed to low salt index of potassium
sulphatesulphate in the root zone, which caused an in the root zone, which caused an
increasing in the uptake of phosphorus.increasing in the uptake of phosphorus.
Regarding K content, the results showed Regarding K content, the results showed
that K% was increased with adding the two that K% was increased with adding the two
forms of K fertilizers.forms of K fertilizers.

Results of Results of ClCl% and SO4% showed % and SO4% showed
that application of MOP increased that application of MOP increased
ClCl%, while SOP decreased its %, while SOP decreased its
content. Vice versa, SOP increased content. Vice versa, SOP increased
SO4%, while MOP decreased its SO4%, while MOP decreased its
content.content.
CC-- Soil analysis:Soil analysis:

Soil surface samples were collected Soil surface samples were collected after each summer crop (rice in this study) after each summer crop (rice in this study) and subjected to chemical analysis to and subjected to chemical analysis to follow up the soil contents of TSS, soluble follow up the soil contents of TSS, soluble ClCl and available K under the application of and available K under the application of the two K sources.the two K sources.
The obtained results showed variations The obtained results showed variations between the two locations according to between the two locations according to soil contents of TSS and soil contents of TSS and ClCl at Elat El--SerwSerw--1 1 comparing with the 0comparing with the 0--K treatment, minor K treatment, minor changes in TSS and changes in TSS and ClCl contents were contents were detected due to both SOP and MOP detected due to both SOP and MOP application. application.

This could be due to soil flooding under rice This could be due to soil flooding under rice
planting, which prevents salt accumulation planting, which prevents salt accumulation
because of the vertically down and predominant because of the vertically down and predominant
percolation of irrigation water taking the percolation of irrigation water taking the
dissolved salts with it. This shows that the choice dissolved salts with it. This shows that the choice
of potash forms is not of great important for crop of potash forms is not of great important for crop
rotation included rice at Elrotation included rice at El--SerwSerw--1 location (not 1 location (not
salt affected soil). salt affected soil).

On the other hand, at ElOn the other hand, at El--SerwSerw--2 2
location (salt affected soil), soil content of location (salt affected soil), soil content of TSS and TSS and ClCl under the two rates of SOP and under the two rates of SOP and the lower rate of MOP showed nearly the the lower rate of MOP showed nearly the same trend of Elsame trend of El--SerwSerw--1, but the higher 1, but the higher rate of MOP gave slight increase of soluble rate of MOP gave slight increase of soluble ClCl content compared to 0content compared to 0--K treatment.K treatment.
On the average of years at ElOn the average of years at El--SerwSerw--2, 2,
soil soil ClCl content increased from 1.61 to 2.73 content increased from 1.61 to 2.73 mg/100 g soil for the 0mg/100 g soil for the 0--K and the higher K and the higher rate of MOP respectively.rate of MOP respectively.

MeanMean2003200320012001
Avail.Avail.KK
ppmppm
ClClmeqmeq//100g 100g soilsoil
TSSTSS%%
Avail.Avail.KK
ppmppm
ClClmeqmeq//100g 100g soilsoil
TSSTSS%%
Avail.Avail.KK
ppmppm
ClClmeqmeq//100g 100g soilsoil
TSSTSS%%
4744741.291.290.250.254664661.451.450.280.284824821.121.120.210.21ControlControl
542.5542.51.571.570.260.265345341.541.540.250.255515511.591.590.260.26SOP 70SOP 70
606.5606.51.031.030.240.245595591.041.040.260.266546541.011.010.210.21SOP 140SOP 140
574.5574.51.301.300.250.25546.5546.51.291.290.260.266036031.301.300.240.24MeanMean
6216211.281.280.290.295895891.321.320.270.276536531.241.240.250.25MOP 70MOP 70
593.5593.51.571.570.310.315605601.581.580.340.346276271.551.550.280.28MOP 140MOP 140
607.3607.31.431.430.300.30574.5574.51.451.450.310.316406401.401.400.270.27MeanMean
TreatmentTreatment
Regarding the available soil K content, Regarding the available soil K content,
data showed that the extractable data showed that the extractable
NH4OACNH4OAC--K was fluctuated from year to K was fluctuated from year to
year may be because of the existence year may be because of the existence
of dynamic equilibrium among the of dynamic equilibrium among the
various forms of K in the soil. various forms of K in the soil.

Also, availability of K is controlled by Also, availability of K is controlled by
its release from k bearing minerals its release from k bearing minerals
and fixation by partially weathered and fixation by partially weathered
minerals minerals ((AkhtarAkhtar, 1993)., 1993). At both At both
sites, the available soil K content sites, the available soil K content
was higher by potash fertilizer was higher by potash fertilizer
application in favor of MOP rates in application in favor of MOP rates in
most cases.most cases.

On average of years and k rate, it was On average of years and k rate, it was
increased from 474 increased from 474 ppmppm for 0for 0--K to 574.5 K to 574.5
ppmppm and 607.3 and 607.3 ppmppm for SOP and MOP for SOP and MOP
respectively at Elrespectively at El--SerwSerw--1 and from 482 1 and from 482 ppmppm
for 0for 0--K to 568 K to 568 ppmppm and 586.2 and 586.2 ppmppm for SOP for SOP
and MOP respectively at Eland MOP respectively at El--SerwSerw--2 . 2 .

Also, Also, the IPI Research Topics No. 22 the IPI Research Topics No. 22
(2001)(2001) mentioned that under mentioned that under
reducing conditions (as a result of reducing conditions (as a result of
flooding conditions in Paddy field), flooding conditions in Paddy field),
FeFe+2+2,, MnMn+2+2 and NHand NH44 are released in are released in
the soil solution by various processes the soil solution by various processes
and displace K from the exchange and displace K from the exchange
sites, increasing its concentration in sites, increasing its concentration in
the soil solution and its availability to the soil solution and its availability to
rice.rice.

MeanMean200320032002200220012001
Avail.Avail.KK
ppmppm
ClClmeqmeq
//100g 100g soilsoil
TSSTSS%%
AvaiAvail.l.KK
ppmppm
ClClmeqmeq
//100g 100g soilsoil
TSSTSS%%
AvaiAvail.l.KK
ppmppm
ClClmeqmeq
//100g 100g soilsoil
TSSTSS%%
AvaAvail.il.KKppppmm
ClClmeqmeq//100g 100g soilsoil
TSSTSS%%
4824821.611.610.250.254684681.341.340.250.254924921.741.740.300.304864861.781.780.190.19ControlControl
554.7554.71.631.630.250.255455451.461.460.260.265535531.631.630.290.295665661.791.790.200.20SOP 70SOP 70
581.3581.31.321.320.250.255485481.231.230.280.285605601.361.360.300.306366361.361.360.170.17SOP 140SOP 140
5685681.481.480.250.25546.546.55
1.351.350.270.275575571.501.500.300.306016011.581.580.190.19MeanMean
5445442.552.550.320.325645642.342.340.340.345665662.512.510.370.375025022.792.790.260.26MOP 70MOP 70
628.3628.32.732.730.380.385785782.422.420.380.385875872.672.670.410.417207203.113.110.340.34MOP 140MOP 140
586.2586.22.642.640.350.355715712.382.380.360.365775772.592.590.390.396166162.952.950.300.30MeanMean
TreatmentTreatment

DD-- Economic aspects of potassium fertilizer use:Economic aspects of potassium fertilizer use:

Despite the two sites of this experiment are Despite the two sites of this experiment are
rich in their available potassium (Table 1), rich in their available potassium (Table 1),
adding both SOP and MOP show significant adding both SOP and MOP show significant
effect on this study. This could be attributed to effect on this study. This could be attributed to
the fact that soil tests for K often fail in many the fact that soil tests for K often fail in many
cases to reveal the true fertilizer demand in the cases to reveal the true fertilizer demand in the
field, resulting in frequently unreliable and field, resulting in frequently unreliable and
inefficient fertilizer recommendations. inefficient fertilizer recommendations.

Also, because soil tests measure Also, because soil tests measure
primarily only the soluble and primarily only the soluble and
exchangeable forms of K, any exchangeable forms of K, any
uncontrolled or unrecognized transitions uncontrolled or unrecognized transitions
of K among its forms between the time of of K among its forms between the time of
testing and the time of attempted uptake testing and the time of attempted uptake
by the plant roots will produce an by the plant roots will produce an
erroneous prediction of available K erroneous prediction of available K ((ShenShen
and and StukiStuki, 1994)., 1994).
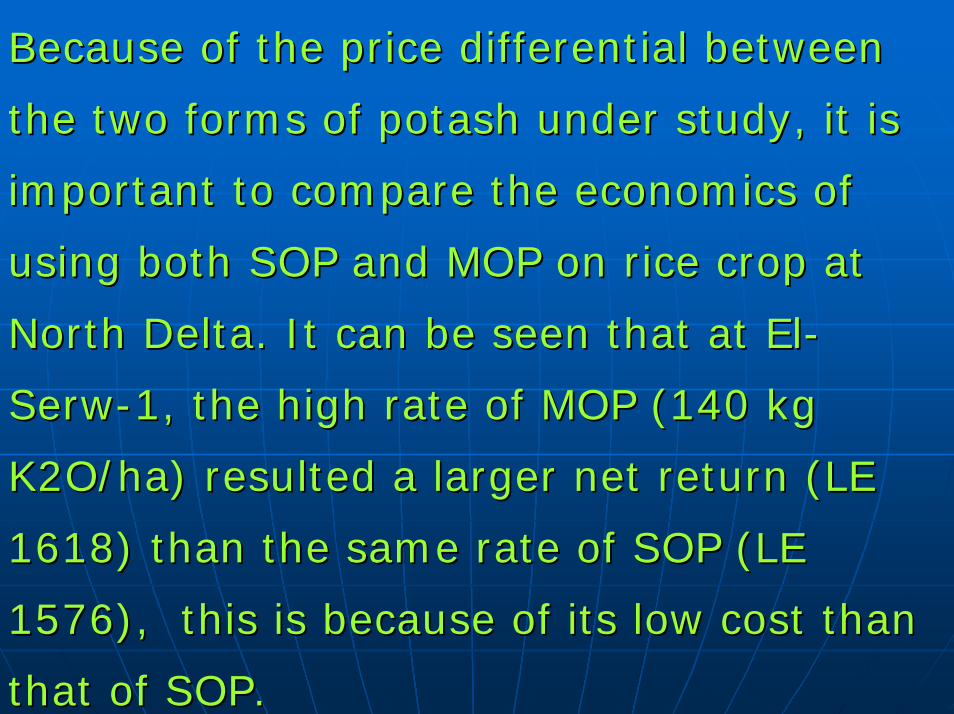
Because of the price differential between Because of the price differential between
the two forms of potash under study, it is the two forms of potash under study, it is
important to compare the economics of important to compare the economics of
using both SOP and MOP on rice crop at using both SOP and MOP on rice crop at
North Delta. It can be seen that at ElNorth Delta. It can be seen that at El--
SerwSerw--1, the high rate of MOP (140 kg 1, the high rate of MOP (140 kg
K2O/ha) resulted a larger net return (LE K2O/ha) resulted a larger net return (LE
1618) than the same rate of SOP (LE 1618) than the same rate of SOP (LE
1576), this is because of its low cost than 1576), this is because of its low cost than
that of SOP.that of SOP.

On contrast, at ElOn contrast, at El--SerwSerw--2 (salt affected 2 (salt affected soil) data showed that the low rate of SOP soil) data showed that the low rate of SOP resulted the highest net return (LE resulted the highest net return (LE 1138/ha) followed by the low rate of MOP 1138/ha) followed by the low rate of MOP (LE 934/ha) and the high rate of SOP (LE (LE 934/ha) and the high rate of SOP (LE 926/ha). While, the high rate of MOP 926/ha). While, the high rate of MOP resulted the lowest net return ( LE 848/ha) resulted the lowest net return ( LE 848/ha) as a result of the harmful effect of high as a result of the harmful effect of high ClClanions around the root zone of rice plants anions around the root zone of rice plants in this location, and these are in harmony in this location, and these are in harmony with the values of the parameter of kg rice with the values of the parameter of kg rice grain/kg K2O.grain/kg K2O.
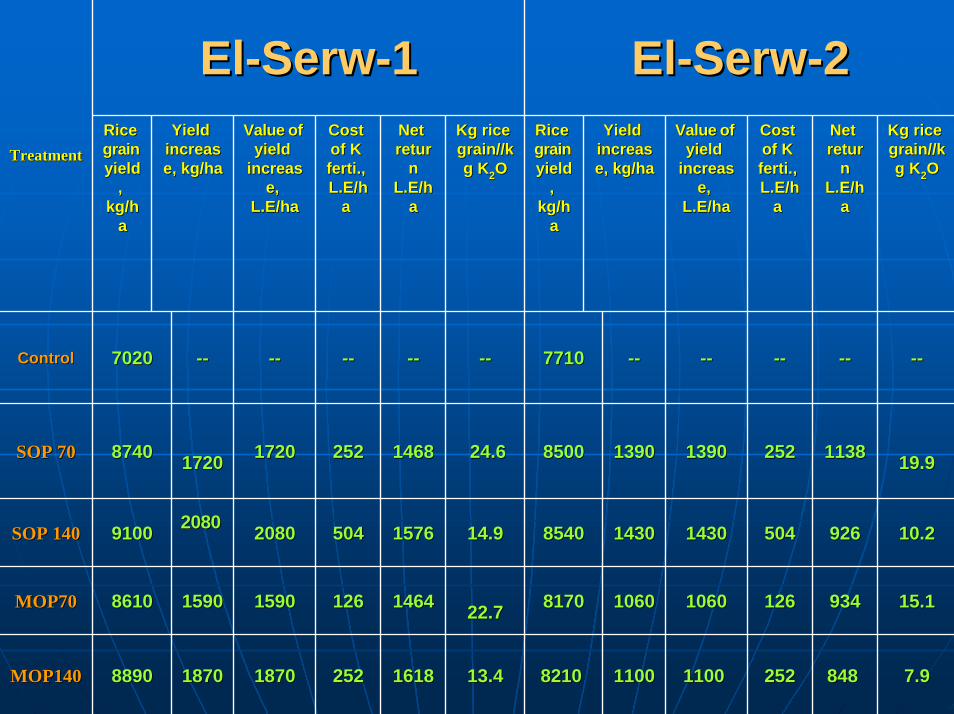
ElEl--SerwSerw--22ElEl--SerwSerw--11Kg rice Kg rice grain//kgrain//kg Kg K22OO
Net Net returretur
nnL.E/hL.E/h
aa
Cost Cost of K of K fertiferti., ., L.E/hL.E/h
a a
Value of Value of yield yield
increasincrease, e,
L.E/haL.E/ha
Yield Yield increasincrease, kg/hae, kg/ha
Rice Rice grain grain yieldyield
, , kg/hkg/h
aa
Kg rice Kg rice grain//kgrain//kg Kg K22OO
Net Net returretur
nnL.E/hL.E/h
aa
Cost Cost of K of K fertiferti., ., L.E/hL.E/h
a a
Value of Value of yield yield
increasincrease, e,
L.E/haL.E/ha
Yield Yield increasincrease, kg/hae, kg/ha
Rice Rice grain grain yieldyield
, , kg/hkg/h
aa
--------------------77107710--------------------70207020ControlControl
19.919.91138113825225213901390139013908500850024.624.614681468252252172017201720172087408740SOP 70SOP 70
10.210.292692650450414301430143014308540854014.914.915761576504504208020802080 2080 91009100SOP 140SOP 140
15.115.193493412612610601060106010608170817022.722.714641464126126159015901590159086108610MOP70MOP70
7.97.9848 848 2522521100 1100 110011008210 8210 13.413.416181618252252187018701870187088908890MOP140MOP140
TreatmentTreatment

CONCLUSIONCONCLUSION

The choice of potash form is not of great The choice of potash form is not of great
important for crop rotation included rice in soil important for crop rotation included rice in soil
having low TSS and having low TSS and ClCl contents; maintaining an contents; maintaining an
adequate K supply and high net profit is the adequate K supply and high net profit is the
prime consideration. On the other hand, only prime consideration. On the other hand, only
chloridechloride-- free potash fertilizers such as SOP could free potash fertilizers such as SOP could
be recommended at location having the trait of be recommended at location having the trait of
high TSS and high TSS and ClCl contents. contents.

ACKNOWLEDGEMENTACKNOWLEDGEMENT

We would like to thank the director and all We would like to thank the director and all
staff members of staff members of International Potash International Potash
Institute, Basel, Switzerland.Institute, Basel, Switzerland.
Also, our appreciation is extended to Also, our appreciation is extended to Dr. Dr.
MunirMunir RusanRusan,, Coordinator of WANA2 for Coordinator of WANA2 for
their assistance and funding this study.their assistance and funding this study.

Thank you very much for your hospitality and generosity Thank you very much for your hospitality and generosity