effect of preparation temperature on the characteristics
TRANSCRIPT

Journal of Controlled Release 69 (2000) 81–96www.elsevier.com/ locate / jconrel
Effect of preparation temperature on the characteristics andrelease profiles of PLGA microspheres containing protein
fabricated by double-emulsion solvent extraction /evaporationmethod
a , b a,b ,1*Yi-Yan Yang , Hui-Hui Chia , Tai-Shung ChungaInstitute of Materials Research & Engineering, 3 Research Link, Singapore 117602, Singapore
bDepartment of Chemical and Environmental Engineering, National University of Singapore, 10 Kent Ridge Crescent,Singapore 119260, Singapore
Received 29 January 2000; accepted 4 June 2000
Abstract
This study describes the influence of preparation temperature on the various characteristics and release profiles ofpoly(DL-lactide-co-glycolide) (PLGA) microspheres. The bovine serum albumin (BSA)-loaded microspheres were preparedusing the water-in-oil-in-water (w/o /w) technique with poly(vinyl alcohol) as surfactant in the external aqueous phase. Wehave varied the preparation temperature to observe its effect on microsphere characteristics such as the microsphereshrinking rate during formation, particle size, density, surface and internal morphology, BSA encapsulation efficiency, BSAinitial release, microsphere degradation and BSA in vitro release behaviour. During fabrication, a low preparationtemperature of 58C gives the fastest initial but the slowest overall shrinking rate. Microspheres formed at high temperaturesof 388C and 428C on the other hand have the lowest initial yet the highest overall shrinking rate. Subsequently, microspheremean size increases and the particle size distribution widens with increase in the preparation temperature. Although all themicrospheres have a porous surface as well as internal structure, microspheres fabricated at high temperatures have auniform internal pore distribution and a very thin dense skin layer, while microspheres fabricated at lower temperatures havea thicker but porous skin layer and bigger pores in the middle of the sphere. Microspheres formed at 338C are found to givethe highest initial burst release. In terms of in vitro release, microspheres fabricated at low temperatures (58C, 158C and228C) exhibit similar, steady rates. Microspheres formed at higher temperatures however give very low release rates aftertheir initial release. The results obtained suggest that preparation temperature significantly affects microsphere formation,resulting in their structural and protein release profile differences. These differences ultimately work together to affect theinitial release and overall release patterns of the microspheres. 2000 Elsevier Science B.V. All rights reserved.
Keywords: Microspheres; Poly(DL-lactic-co-glycolic acid); Preparation temperature; Solvent removal; Morphology; In vitro release profiles
1. Introduction*Corresponding author.E-mail addresses: [email protected] (Y.-Y. Yang),
Although the concept of controlled release is [email protected] (T.-S. Chung).1Corresponding author. old, it was not used for the controlled delivery of
0168-3659/00/$ – see front matter 2000 Elsevier Science B.V. All rights reserved.PI I : S0168-3659( 00 )00291-1

82 Y.-Y. Yang et al. / Journal of Controlled Release 69 (2000) 81 –96
proteins from biodegradable microspheres until differences in the density, specific surface area andaround the 1980s. Proteins possess small half-lives protein loading of the microspheres formed. Li andand are incapable of diffusing through biological co-workers [7,8] modelled the microsphere forma-membranes. Their instability in the stomach and tion, incorporating solvent concentration and solventintestines furthermore makes oral delivery of these removal profiles. Instead of using a temperaturedrugs difficult. Alternative administration by fre- gradient, they noted that having different fixedquent injections is also tedious and expensive. In- preparation temperatures also affected the rate ofdeed the development of biodegradable polymeric solvent removal. Yang et al. [9] went further tomicrospheres has been seen as a promising way to investigate the effect of the preparation temperatureovercome the administering problems of these on morphology and release profiles of microspheresmacromolecules. However, despite this great po- at 228C. Our objective in this study is to sys-tential, there are still considerable difficulties that tematically investigate the fundamental influence ofhave limited the use of this system in the commercial preparation temperature on microsphere formationmarket. One of the major problems lies in the and its shrinking rate during the early stage ofcontrolling of the release rate of the system. formation, particle size, density, morphology, bovine
From the current number of studies being carried serum albumin (BSA) encapsulation efficiency, ini-out by researchers all over the world, it is clear that tial burst and release behaviour of BSA-loadedrelease rates of microspheres depend on many pos- PLGA microspheres at 378C. This work is essentialsible factors. Besides the type of polymers used, for scientists to understand microsphere formationprocessing conditions employed during preparation mechanisms and the relationship between preparationvery much determine the properties of the micro- temperature and properties of PLGA microspheres.spheres formed. Properties such as the size anddensity, the matrix structure, which includes thesurface and internal areas, the drug encapsulation
2. Materials and methodsefficiency and drug distribution all influence therelease of drug from the system. Researchers havetherefore been exploring the various preparation 2.1. Materialsconditions that could influence the above properties.
Giunchedi et al. [1] and Witschi and Doelker [2] PLGA with a copolymer ratio of 65:35 and aboth experimented with the different methods of molecular mass (M ) range of 40 000–75 000 (lotrencapsulation in their preparation of the microparti- 98H1368) was obtained from Aldrich. 88% hydro-cles. Differences were found in terms of degradation lysed poly(vinyl alcohol) (PVA) with a M range ofrrates, encapsulation efficiencies and microsphere 31 000–50 000 was purchased from Fluka. BSAyields. Crotts and Park [3] varied the volume of the (fraction V, M 60 000) was obtained from Sigma.rinner aqueous solution to find that higher inner Methylene chloride of LC-grade was purchased fromaqueous volume produced more surface porous Merck. All other regents were of reagent grade.microspheres. Jeffery et al. [4] studied the effect ofantigen:polymer ratio, volume of external aqueousphase and concentration of emulsion stabiliser on the 2.2. Preparation of microspheressize of the microspheres and antigen entrapment.
The effect of solvent removal technique on poly- BSA-loaded microspheres were fabricated using a(DL-lactide-co-glycolide) (PLGA) microspheres has water-in-oil-in-water (w/o /w) double-emulsion sol-been studied in a series of publications. Mehta et al. vent extraction /evaporation technique as previously[5] reported that the method and rate of solvent described by Yang et al. [9]. Briefly, 20 mg of BSAremoval, namely the temperature gradient (Tmp) and was dissolved in 0.5 ml phosphate-buffered salinethe dilution (Dil) of the continuous phase methods, (PBS) (pH 7.4) solution containing 0.05% (w/v)influenced the internal structure of the microspheres. PVA as an emulsifier and mixed with 12 ml methyl-Jeyanthi et al. [6] then related this effect to the ene chloride containing 400 mg of PLGA. The
Y.-Y. Yang et al. / Journal of Controlled Release 69 (2000) 81 –96 83
emulsification was carried out by sonication for 15 s 2.4. In vitro BSA release studyusing a VC 50T sonicator (Sonics & Materials, CT,USA). The resulting emulsion was further injected In vitro release tests were carried out in triplicateinto a 250 ml PBS (pH 7.4) solution containing at 378C. A 30-mg amount of dried microspheres was0.05% (w/v) PVA as an emulsifier to produce a suspended in a 1.5-ml microfuge tube containing 1double w/o /w emulsion. The dispersion was then ml of PBS and incubated at 378C. The tubes werestirred at a constant temperature for 30 min using a periodically removed and centrifuged for 4 min atmixer (Cole-Parmer Instrument, IL, USA). In order 10 000 rpm using an Eppendorf Centrifuge (Modelto extract methylene chloride from the first emulsion 5415C). The supernatant was then collected and itsinto the external phase, a 640 ml PBS (pH 7.4) BSA content was analysed using a high-performancebuffer solution containing 0.05% (w/v) PVA was liquid chromatography (HPLC) system (HP1050,added continuously at a rate of 3 ml /min using a Waters). The tubes were returned to the incubatorDosimat pump (Model 725, Metrohm, Swiss). The after fresh buffer solution was added. The amount oftemperature of the second emulsion throughout the BSA released in the first 24 h was defined as thesolvent extraction /evaporation stage was maintained initial BSA burst in this study.constant using a low-temperature circulator (LTD6G,Grant Instruments, Cambridge, UK). The resultingBSA-loaded microspheres were collected by vacuum 2.5. Determination of BSA encapsulation efficiencyfiltration and washed three times with PBS. Themicrospheres were then vacuum-dried overnight and The BSA amount per unit weight of microspheresstored at 48C. was determined by an extraction method. A 10-mg
amount of dried microspheres was dissolved in 1 mlof ethyl acetate for 15 min and 10 ml of PBS (pH
2.3. Optical observation of microsphere shrinkage 7.4) was then added. The mixture was vigorouslyshaken for 2 min in order to extract the BSA from
The rates of reduction in the microsphere diameter the organic solution into the PBS. After clarifyingduring the formation process were tracked with a for 1 h, the aqueous solution was filtered and theNikon polarising microscope (Optiphot2-pol, Japan). BSA content of the solution was analysed by HPLC.
The encapsulation efficiency is calculated as the ratioof actual and theoretical BSA content.
2.3.1. Initial shrinkageThe first sample was drawn 5 min after injection
of the first emulsion into the external aqueous phase. 2.6. Particle size distributionFor the next 3 min, photomicrographs of the samplewere captured continuously at 15-s intervals. This The particles were sized using a Coulter LS 230was taken as the initial rate of reduction in diameter particle size analyser. Samples were prepared byof the microspheres. re-dispersion of about 10 mg microspheres in Ultra-
pure Milli-Q water. The results were reported as avolume size distribution.
2.3.2. Continuous shrinkageSamples were continuously drawn at 5-min inter-
vals for the first 30 min after the first sampling. 2.7. Scanning electron microscopy (SEM)Following this, samples were still regularly collectedthroughout the whole dosing period. Photomicrog- The surface and internal morphology of micro-raphs were taken for all the samples. The arithmetic spheres, fabricated under different preparation con-mean diameters of microspheres at the various times ditions or after a certain period of release, waswere determined by averaging the diameters of over observed by SEM (Model JSM-5310, JEOL, Tokyo,100 microspheres. Japan). The microspheres were mounted on brass

84 Y.-Y. Yang et al. / Journal of Controlled Release 69 (2000) 81 –96
stubs using double-sided adhesive tape and vacuum- 3. Results and discussion˚coated with a thin layer (100–150 A) of gold.
3.1. Effect of preparation temperature on netsolvent removal rate and skin formation
2.8. Atomic force microscopy (AFM)
In the double emulsion solvent extraction /evapo-A Multimode Atomic Force Microscope from ration process used, after the first emulsion is
Digital Instruments was used to study the surface injected into the external aqueous phase, dichlorome-morphology of the microspheres. The samples were thane dissolves into the external aqueous phase andmounted on metal slabs using double-sided adhesive evaporates at the air–liquid interface. The extent andtapes and observed under microscope that was speed of solvent extraction from the dispersed phasemaintained in a constant-temperature and vibration- into the external aqueous phase depends on thefree environment. A scan size of 10 mm was used. solubility as well as the rate of solvent mass transfer.
Solvent evaporation on the other hand dependsmostly on temperature and the concentration of the2.9. Determination of polymer molecular massessolvent in the air.
Crotts and Park [3] and Li et al. [8] concentratedMolecular masses of the PLGA microspherestheir work on residual solvents in the microspheresbefore and during the in vitro release were de-or the amount of solvents present in the externaltermined by gel permeation chromatography (Watersaqueous phase. Here, our research emphasised2690) with a differential refractometer detectoranother aspect, the net solvent removal rate from the(Waters 410). Two columns, Styragel@HR 5E, lotmicrosphere and microsphere shell formation duringNo. T81081, 30037.8 mm and Styragel@HR 4E, lotthe entire fabrication process. Since solvents diffusedNo. 780751, 30037.8 mm, with the effective molec-out through the nascent microsphere skin, the micro-ular mass ranges of 2000–4 000 000 and 50–sphere diameter decreased. The net solvent removal100 000, respectively (MA, USA) were connected inrates could then be estimated by the volume shrink-series. The mobile phase was tetrahydrofuran (THF)age of a nascent microsphere. We determine thewith a flow-rate of 1 ml /min. The dried micro-volume shrinkage by two means; namely (i) anspheres were dissolved in THF and filtered. Theinitial shrinkage rate at time t50 (taken to be 5 minpolymer solution injection volume was 100 ml. Theafter injection of first emulsion) and (ii) an overalldata collection and analysis were done using Waters
32 shrinkage rate for the entire period of fabrication.Millennium software. Weight and number averagemolecular masses were calculated from a calibration
3.1.1. Initial shrinkage ratecurve using a series of polystyrene standards (Poly-The analysis here is based on the shrinking rate ofmer Labs., MA, USA) with molecular masses of
a single microsphere from a drop taken from the1350, 4920, 9790, 28 400, 71 550, 150 500, 417 500,external aqueous phase 5 min after injection of the1 254 000 and 3 502 000). The total analysis time forfirst emulsion into the external aqueous phase (t50).every sample was 50 min.Two assumptions are made to enable the analysisnamely: (a) the temperature of the aqueous droplet
2.10. Bulk density does not vary too much from that in the actualfabrication emulsion and (b) the droplet’s small
The microspheres fabricated were weighed and volume does not seriously affect the extent oftransferred to a 10-ml glass graduated cylinder. The contribution of the two mechanisms involved incylinder was tapped using an autotrap (Quantach- solvent removal.rome, FL, USA) until the microsphere bed volume The samples were observed under the opticalstabilised. The bulk density was estimated by the microscope. The reduction in diameter of the micro-ratio of microsphere weight to the final volume of sphere formed at 58C is shown in Fig. 1. Interesting-the tapped microsphere bed. ly, the rate of diameter reduction is constant during

Y.-Y. Yang et al. / Journal of Controlled Release 69 (2000) 81 –96 85
Fig. 2. Initial rate of reduction in diameter of microspheres as afunction of fabrication temperature.
solvent is leaving the sphere faster at 58C than at158C or 228C. From solubility data [10], it is knownthat the solubility of dichloromethane in waterdecreases with increase in temperature. Thus at the
Fig. 1. Top: Photo-micrographs for microspheres at onset ofbeginning, the slightly higher solubility (less than 0.5fabrication at 58C and time interval between photos is 15 s.wt.% difference) of dichloromethane at 58C asBottom: The corresponding diameter reduction of microspheres.compared to 158C and 228C enables a faster removalof the solvent out of the sphere.
the first 3 min, indicating a constant flux (mass However besides solubility, the diffusion coeffi-transfer per unit surface area) during this period of cient and the concentration gradient of the solvent,time if the density is assumed to be almost invariant both significant factors in mass transfer, are alsobecause dependent on temperature. The diffusion coefficient
increases with temperature. Higher temperatures will4 3] also provide greater driving force for evaporation atS Dd pr rdM d(Vr) dr3 2] ]] ]]]] ]5 5 (4pr r ? the air / liquid interface thus reducing the solventdt dt dt dtconcentration in the sink. The concentration gradient1 dM dr
]] ] ]? (r ? between the two liquid phases will then increase,2 dt dt4pr favouring mass transfer. Thus it could be argued thatwhere M is the mass of solvents within a micro- at 58C, since mass transfer is slow, the concentrationsphere, t is the time and r is the density. These data of the solvent in the external aqueous phase wouldsuggest that the structures of the nascent skin and the still be low at the beginning compared to the othermass transfer resistance across the skin at this temperatures. The concentration gradient is probablytemperature do not vary much in the early stage (first still steep, providing the driving force for diffusion3 min) of formation. of the solvent out into the external phase. This
Fig. 2 shows the initial rates of reduction in coupled with a higher solubility, results in the highdiameter of microspheres fabricated at various tem- initial shrinking rate of the microsphere at 58C.peratures. It is observed that the initial rate of On the other hand, at temperatures 158C andreduction in the diameter of the microspheres is the above, faster mass transfer results in faster saturationhighest for a low temperature of 58C. The rate drops of the external aqueous phase. At 158C and above,for 158C but climbs up slightly at 228C and 338C. less than 5 g of dichloromethane (as compared toThe rate falls again at 388C before becoming negli- about 16 g used in experiment) will saturate the 250gible at 428C. A high rate of reduction in diameter ml of water used. Evaporation is then the predomi-means that dichloromethane is leaving the sphere nant process.more rapidly. Thus it can be deduced that initially The drop in rate of reduction in diameter at 388C

86 Y.-Y. Yang et al. / Journal of Controlled Release 69 (2000) 81 –96
and 428C to an almost negligible rate probably through extraction and then evaporation within themeans that the shrinking rate slows down and even first few minutes. This is reflected in the almostlevels off. Since at such temperatures close to or negligible initial formation rate (Fig. 2) and theexceeding the normal boiling point of dichlorome- microsphere rapidly reaches the final diameter (Fig.thane (39.88C [11]), the diffusion and evaporation of 3c).solvent would be so rapid and effectively over-ridethe small difference in solubility. Even within the 3.2. Effect of preparation temperature on size,first 5 min of formation, most of the solvent already density and morphologyescapes from the microspheres, resulting in rapidprecipitation of the microspheres and the apparent Since temperature affects the way and the rate atlow initial shrinkage rate. which microspheres formed, it is conceivable to
expect the physical characteristics of the micro-3.1.2. Overall formation rate spheres to be affected by preparation temperature as
Although the solubility of methylene chloride in well. The physical characteristics investigated in-water is relatively higher at lower temperatures, it is cluding size, density and morphology are reportedon the whole not large. Saturation of methylene below.chloride in water can thus be rapidly achieved. As aresult, without fast diffusion and evaporation, the 3.2.1. Effect on particle size distribution andimpact of this thermodynamic property at low tem- densityperatures can become insignificant during the overall The size of microparticles can be easily affectedformation. When we track the whole formation by a variety of processing factors. Jeffery et al. [4]process of the microspheres, it is observed that the reported in their study that parameters such asoverall reduction in diameters of the microspheres is volume of inner and external aqueous phase and therapid at 58C, gradual at mid-range temperatures like viscosity of inner and external aqueous phase in-158C and 228C and slow at high temperatures of fluenced the size of the microspheres. Increase in the388C and 428C. Fig. 3 shows the change in diameter molecular mass of polymer also leads to an increaseof the microspheres fabricated at the various tem- in the size of microspheres [12]. The control of theperatures. size of microspheres is important since size affects
From the graphs in Fig. 3, we observe that except degradation rate [5], loading and initial burst releasefor microspheres fabricated at 58C, the other micro- [13] of microspheres. The utility of the microspheresspheres already shrink substantially within the first is also very much governed by the suitability of thefew minutes. Two possible reasons could result in size [4,14].this large difference in size right at the beginning. The size distribution curves for all samples pre-First, the reduced viscosity of both phases at higher pared at seven temperatures are as shown in Fig. 4.temperatures result in the spheres being easily Due to the different methods used, the sizes of thebroken up by the vigorous stirring (500 rpm) during microspheres measured here using light scatteringthe first 5 min before the first sample is taken. technique are larger than that observed in SectionSecond, as mentioned in previous paragraphs, higher 3.1.2 using microscopy. With microscopy, the equiv-temperatures result in a higher mass transfer coeffi- alent diameter is obtained from the projected area. Incient for extraction and rapid evaporation. The the Coulter particle size analyser, the equivalentmicrospheres thus harden at the very beginning for diameter used is the volume diameter, which empha-temperatures 338C and above due to most of the sises large particles.solvent being already removed. Consequently, micro- From Fig. 4, one can observe a general increase inspheres fabricated at 338C and above have low the size of the microspheres as temperatures in-overall shrinkage rates. crease. The average size of microspheres was the
At high temperatures such as 388C, equilibrium in smallest for 58C (about 88 mm) and largest for highthe system is not reached since the evaporation of temperatures 388C (about 96 mm) and 428C (aboutsolvent is very rapid, removing almost all the solvent 130 mm). For the rest, particle size ranged from 107

Y.-Y. Yang et al. / Journal of Controlled Release 69 (2000) 81 –96 87
Fig. 3. Change in diameter of microspheres during fabrication at (a) 58C, (b) 158C and 228C, (c) 338C, 388C and 428C.
to 115 mm. Microspheres made at lower tempera- temperatures of 388C and 428C. Microspheres fabri-tures of 58C, 158C and 228C possess the same mode cated at lower temperatures have narrow size dis-(curve pattern) of 87.9 mm. Similarly microspheres tribution curves with higher peaks. Microspheresmade at higher temperatures of 288C, 338C and 388C fabricated at high temperatures start from low vis-have the same size of 96.5 mm. cosity solutions, but spheres harden much rapidly.
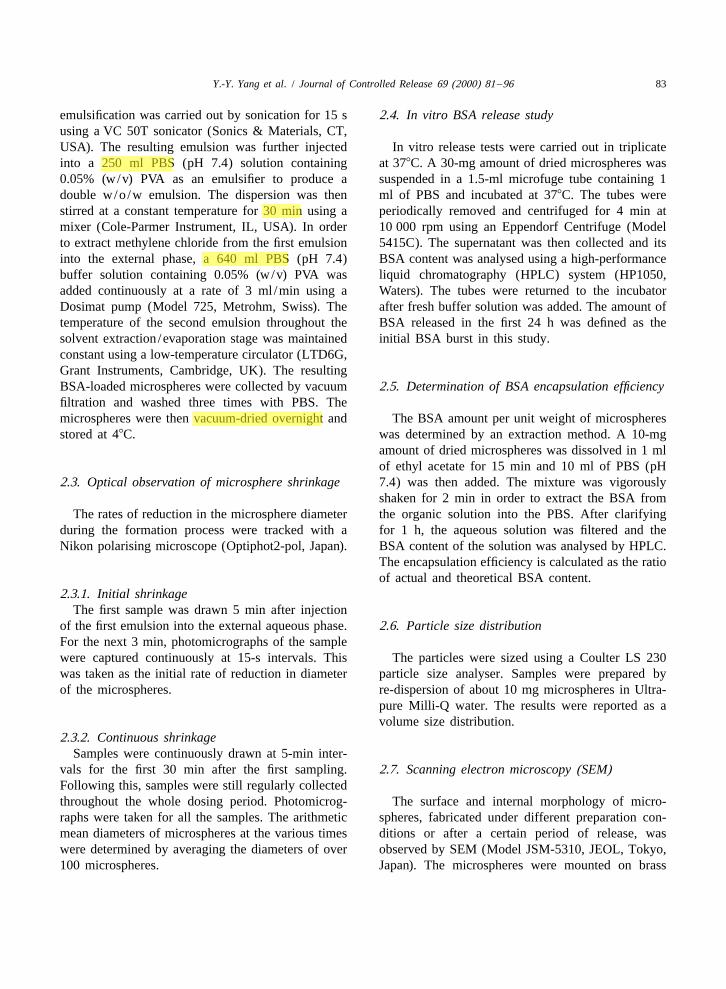
It is further observed from Fig. 4 that the dis- This probably causes the spheres to have a broadertribution curves are broader with lower peaks at high size distribution because shearing forces induced by
88 Y.-Y. Yang et al. / Journal of Controlled Release 69 (2000) 81 –96
Fig. 4. Size distribution of microspheres as measured with a Coulter particle size analyser.
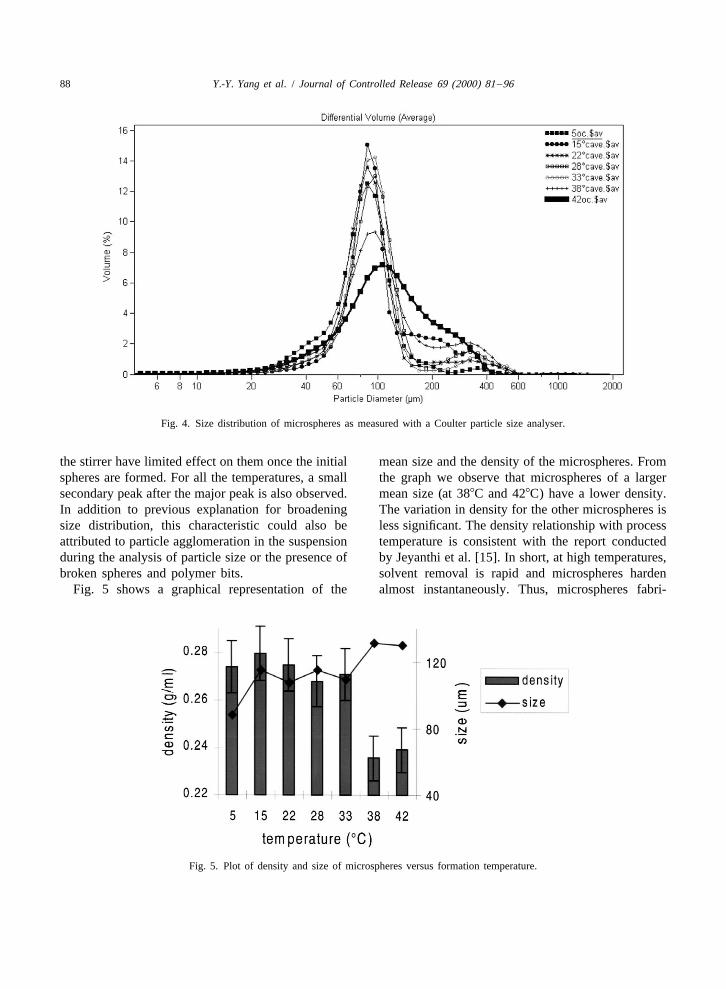
the stirrer have limited effect on them once the initial mean size and the density of the microspheres. Fromspheres are formed. For all the temperatures, a small the graph we observe that microspheres of a largersecondary peak after the major peak is also observed. mean size (at 388C and 428C) have a lower density.In addition to previous explanation for broadening The variation in density for the other microspheres issize distribution, this characteristic could also be less significant. The density relationship with processattributed to particle agglomeration in the suspension temperature is consistent with the report conductedduring the analysis of particle size or the presence of by Jeyanthi et al. [15]. In short, at high temperatures,broken spheres and polymer bits. solvent removal is rapid and microspheres harden
Fig. 5 shows a graphical representation of the almost instantaneously. Thus, microspheres fabri-
Fig. 5. Plot of density and size of microspheres versus formation temperature.

Y.-Y. Yang et al. / Journal of Controlled Release 69 (2000) 81 –96 89
cated at high temperatures are characterised by a droplets. Moreover, at higher temperatures like 338Clower density, fully porous internal structure, larger and 388C, solvent removal is rapid right from themean size and broader size distribution. While for beginning. A dense and tight skin layer of themicrospheres fabricated at low temperatures, solvent microspheres form quickly, hindering the influx ofremoval is slow and microspheres take a longer time water. In fact the whole sphere probably solidifies soto solidify, thus permitting a greater shrinkage and quickly without allowing many water droplets todensification. The resultant spheres are smaller and interact within the matrix. With less water entering,denser. However the observed differences in density there are no large water droplets diffusing into thecould also be due to the way measurements are inner matrix. Rapid solidification really gives littletaken. The fact that smaller spheres can pack more time for instability to set in on the water droplets.tightly than larger spheres when tapped using an They are probably still fairly uniformly distributedautotrap will also contribute to the density differ- within the dispersed phase when the polymerences obtained. solidifies giving the even pore distribution through-
out the matrix as observed in Fig. 6D and E.3.2.2. Effect on morphology For the slower forming microspheres at low
Both surface and internal morphologies of the temperatures, skin formation is slower and themicrospheres are examined using SEM or AFM. interior remains soft for a longer period of time.
External aqueous phase could diffuse in, creating3.2.2.1. Surface and internal morphology with SEM. more water pockets. The inner water droplets, givenFrom SEM scans taken (not shown), the micro- the time, could move within the soft interior of thespheres are observed to be all surface-porous with no matrix, coalescing to form bigger droplets. As thesharp visible differences amongst the different tem- polymer solidifies from the peripheral towards theperatures. From the cross-sectional images of the centre, the water droplets would also be pushedmicrospheres as shown in Fig. 6, it is clear that gradually towards the centre. All these eventuallyalthough internally the microspheres are all highly give the bigger holes observed in the centres of theporous, there are no distinct hollow cores. Porosity microspheres.of microspheres is known to vary with numerous From Fig. 6, it can also be seen that the walls offactors such as polymer molecular mass, co-solvent the microspheres fabricated at low temperatures areconcentration, dispersed phase to continuous phase slightly porous and thicker (A, B) than the higher(DP/CP) ratio, peptide concentration, solvent remov- temperatures (D, E). The microsphere skin layeral rate as well as method [5,15,16]. In our case, the formation is often likened to the phase separationinternal porosity is generally high for the micro- and precipitation of asymmetric membranes. Nuclea-spheres since the polymer concentration is quite low. tion and growth tends to be the dominant mechanismLow polymer concentration means a high distribu- at low temperature precipitation, which yields ation of solvent and internal water in the polymer. slightly porous, but thicker skin layer structure [17].During precipitation, more water from the CP could High-temperature solvent removal results in lessdiffuse in to create more water pockets [7]. Once the defective membrane skin layer. Fig. 7 shows amicrospheres are dried, the water pockets, which simplified ternary phase diagram for a solvent /include the internal water, and the water diffused coagulant /polymer system often used to illustrate thefrom CP will become the holes. It was reported by precipitation characteristics for such a system. ForMehta et al. [5] that rapid removal of solvent using microspheres made at high temperatures, the dis-the temperature gradient technique resulted in hollow persed phase will most likely take the coagulationcore formation. Here, although solvent removal is path (a) during formation. Since solvent removal israpid at high temperatures, the microsphere interior rapid, out-flow of solvent will be higher than in-flowis more uniformly porous instead. of water. Polymer concentration within the dispersed
The absence of core formation could be due to the phase increases quickly, solidifying into a densepresence of emulsifier in the inner aqueous phase, layer. Whereas for microspheres made at low tem-which prevents coalescence of the internal water peratures, polymer precipitation will probably follow

90 Y.-Y. Yang et al. / Journal of Controlled Release 69 (2000) 81 –96
Fig. 6. Cross-sectional SEM scans for (A) 58C, (B) 158C, (C) 228C, (D) 338C and (E) 388C.

Y.-Y. Yang et al. / Journal of Controlled Release 69 (2000) 81 –96 91
tives. The difference in encapsulation efficiency isalso due to the differences in sample preparationconditions [4], microsphere sizes, targeted loadings,polymer concentrations, polymer molecular masses,copolymer compositions and characterisation tech-niques [12].
It has been frequently reported that the rapidsolidification of polymer giving rise to denser skinlayer increases loading efficiency [7,12]. The fastsolidification of the polymer can be a result of manyfactors such as a higher solvent removal rate [7],higher polymer concentration or a lower dispersedphase to continuous phase DP/CP ratio [12]. Yet in
Fig. 7. Ternary phase diagram for the microspheres forming in the our case, although the rate of solvent removal andexternal aqueous phase. thickness of the microsphere skins are different,
these are not reflected in the encapsulation efficiencypath (b). Here solvent out-flow is slower allowing among the different microspheres.increased in-flow of coagulant water. A more porous, Instinctively, since microspheres made at highspongy microsphere wall is thus formed. temperatures (such as at 388C and 428C) solidify
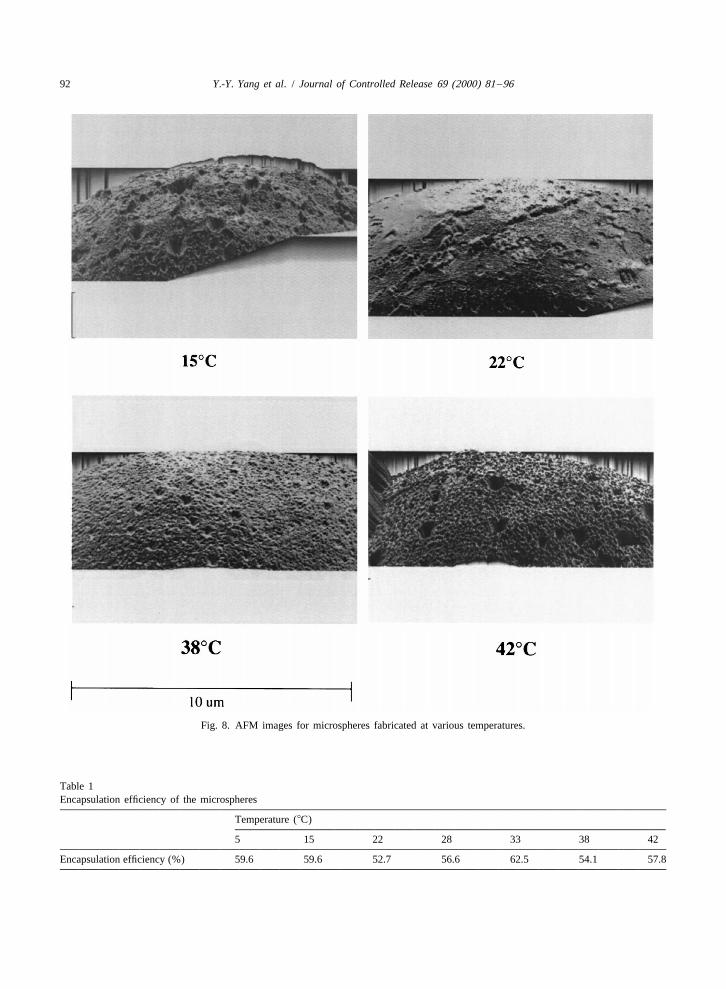
rapidly, forming a dense thin skin, drug encapsula-3.2.2.2. External morphology with AFM. Fig. 8 tion efficiency should be high. Naturally a dense skinshows the external morphology of microspheres as will provide impedance, making it difficult forobserved using AFM. Comparison of the degree of proteins to diffuse through. However, preparationporosity may be difficult here due to limited scan temperature affects not only the mass transfer andsize. However we can observe that the microspheres evaporation rate of the solvent but also the massmade at higher temperatures (388C and 428C) appear transfer and solubility of the protein. Although fasterto have a much rougher surface. This coarse skin is skin formation may reduce protein loss, the increaseprobably due to rapid evaporation and phase sepa- in solubility of protein at higher temperature and theration during the shrinking and hardening stage. faster mass transfer may also increase the amount of
The microspheres made at lower temperatures on BSA leaving the dispersed phase during formation.the other hand have a relatively ‘‘slightly smoother’’ Furthermore protein denaturation at high temperaturesurface. Since the spheres fabricated at lower tem- may also result in less active proteins encapsulated.peratures undergo slower but more extensive shrink- By the same token, although the microspheresing during their formation, it may result in this fabricated at lower temperatures solidify slower, thesmoother sphere surface. Since the surface roughness lower solubility and mass transfer of BSA at thoseof microspheres was suggested to affect their adhe- temperatures probably compensate for the relativesion onto the intestine’s Payer’s patch [18], it is thus ease of diffusing through the softer, less dense skin.a meaningful characteristic to consider. The activity of proteins also remains fairly intact at
these lower temperatures. The resultant encapsula-3.3. Effect of preparation temperature on BSA tion efficiencies for microspheres fabricated at higherencapsulation efficiency or lower temperatures are thus similar.
Table 1 shows the BSA encapsulation efficienciesof various microspheres prepared at different tem- 3.4. Effect of preparation temperature on polymerperatures and the overall average is about 5865%. degradationThis encapsulation efficiency value may be differentfrom those previously obtained by other researchers All microspheres show a small decrease in molec-mainly because we have different research objec- ular mass after release. There is no significant
92 Y.-Y. Yang et al. / Journal of Controlled Release 69 (2000) 81 –96
Fig. 8. AFM images for microspheres fabricated at various temperatures.
Table 1Encapsulation efficiency of the microspheres
Temperature (8C)
5 15 22 28 33 38 42
Encapsulation efficiency (%) 59.6 59.6 52.7 56.6 62.5 54.1 57.8
Y.-Y. Yang et al. / Journal of Controlled Release 69 (2000) 81 –96 93
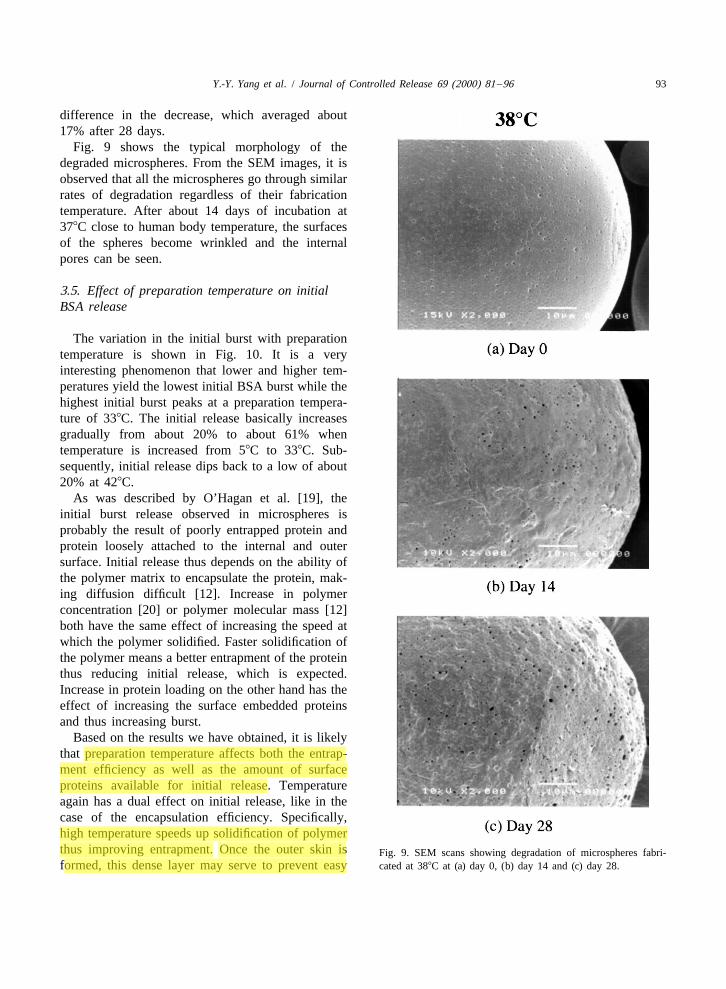
difference in the decrease, which averaged about17% after 28 days.
Fig. 9 shows the typical morphology of thedegraded microspheres. From the SEM images, it isobserved that all the microspheres go through similarrates of degradation regardless of their fabricationtemperature. After about 14 days of incubation at378C close to human body temperature, the surfacesof the spheres become wrinkled and the internalpores can be seen.
3.5. Effect of preparation temperature on initialBSA release
The variation in the initial burst with preparationtemperature is shown in Fig. 10. It is a veryinteresting phenomenon that lower and higher tem-peratures yield the lowest initial BSA burst while thehighest initial burst peaks at a preparation tempera-ture of 338C. The initial release basically increasesgradually from about 20% to about 61% whentemperature is increased from 58C to 338C. Sub-sequently, initial release dips back to a low of about20% at 428C.
As was described by O’Hagan et al. [19], theinitial burst release observed in microspheres isprobably the result of poorly entrapped protein andprotein loosely attached to the internal and outersurface. Initial release thus depends on the ability ofthe polymer matrix to encapsulate the protein, mak-ing diffusion difficult [12]. Increase in polymerconcentration [20] or polymer molecular mass [12]both have the same effect of increasing the speed atwhich the polymer solidified. Faster solidification ofthe polymer means a better entrapment of the proteinthus reducing initial release, which is expected.Increase in protein loading on the other hand has theeffect of increasing the surface embedded proteinsand thus increasing burst.
Based on the results we have obtained, it is likelythat preparation temperature affects both the entrap-ment efficiency as well as the amount of surfaceproteins available for initial release. Temperatureagain has a dual effect on initial release, like in thecase of the encapsulation efficiency. Specifically,high temperature speeds up solidification of polymerthus improving entrapment. Once the outer skin is Fig. 9. SEM scans showing degradation of microspheres fabri-formed, this dense layer may serve to prevent easy cated at 388C at (a) day 0, (b) day 14 and (c) day 28.

94 Y.-Y. Yang et al. / Journal of Controlled Release 69 (2000) 81 –96
3.6. Effect of preparation temperature on BSArelease profile
The release characteristics of the various micro-spheres are summarised in the % cumulative releaseprofiles shown in Fig. 11. From the release profiles,there appear to be two distinct groups of micro-spheres with different patterns and rates of release.Specifically, microspheres fabricated at higher tem-peratures (from 288C onwards) experience a highinitial rate of release before levelling off very
Fig. 10. Initial burst release as a function of preparation tempera- quickly after 2 to 6 days. Subsequent rate of releaseture. is then very slow as seen by the almost straight
horizontal lines. For microspheres fabricated at lowertemperatures of 58C, 158C and 228C, there is still arelatively higher and steady rate of release after the
release of the protein although the protein diffuses initial phase of fast release.more quickly at high temperatures. As a result, Since there are no significant degradation ratemicrospheres made at 388C and 428C have decreas- differences observed, the variation in the releaseing burst. Similarly although microspheres made at profile of the microspheres may very likely comelower temperatures have more porous skin, distribu- primarily from the difference in the diffusion pro-tion of the protein near the surface is low as less cess. For the microspheres fabricated at high tem-protein can move to the surface. Thus initial release peratures, the high initial release of about 2–6 daysdecreases as fabrication temperatures drop from 338C may be a release of the surface proteins available.to 58C. It appears that at 338C, the temperature is However, due to the fact that these microsphereshigh enough for the speedy diffusion of protein to solidify mainly through an evaporation process, theythe surface and through sufficiently porous skin have denser and tighter skin structures and thelayer. release of the deeply embedded protein becomes
Fig. 11. In vitro release profiles of the microspheres.

Y.-Y. Yang et al. / Journal of Controlled Release 69 (2000) 81 –96 95
difficult. Another possible reason is that the bigger sphere formation, resulting in their structural andmicrospheres produced at higher temperatures lead to protein release profile differences.a slower release profile due to their smaller surfacearea for protein diffusion.
Low-temperature microspheres, on the other hand, Acknowledgementssolidify less quickly giving a thicker but spongy skinlayer. Although their initial burst is not exceptionally The authors would like to express their gratitudehigh, their resultant release rates are sustained at a to Dr. Jorge Heller at Advanced Polymer Systemsrate higher than the microspheres fabricated at high Inc., USA for his valuable suggestions in this work.temperatures. Interestingly, the microspheres pro- The authors also appreciate the technical assistanceduced at 58C, 158C and 228C have almost the same of Kah-Wee Lee, Ling Wang, Xue-Qin Chen and Ms.release profile after initial bursts. It may come from Yang-Sun Chang and Mr. Qing-Wen Lin of IMA forthe similar surface and internal morphology of these their technical assistance with SEM.microspheres as presented above. The results showconsistency with previous work [9] where in vitrorelease was carried out at room temperature (228C).
ReferencesIt means that even at 378C, the microspheres stillundergo a predominantly diffusion-based drug re-
[1] P. Giunchedi, H.O. Alpar, U. Conte, PDLLA microsphereslease during the first 20 days.containing steroids: spray-drying, o /w and w/o/w emulsifi-cations as preparation methods, J. Microencapsulation 15(1998) 185–195.
[2] C. Witschi, E. Doelker, Influence of the microencapsulation4. Conclusions method and peptide loading on poly(lactic acid) and poly-
(lactic-co-glycolic acid) degradation during in vitro testing,J. Control. Release 51 (1998) 327–341.We have determined the effects of preparation
[3] G. Crotts, T.G. Park, Preparation of porous and nonporoustemperature on the various characteristics and BSA biodegradable polymeric hollow microspheres, J. Control.release profiles of PLGA microspheres. The micro- Release 35 (1995) 91–105.spheres were prepared using the w/o/w technique [4] H. Jeffery, S.S. Davis, D.T. O’Hagan, The preparation and
characterisation of poly(lactide-co-glycolide) microparticles.with PVA as surfactant in the external aqueousII. The entrapment of a model protein using a (water-in-oil)-phase.Very low preparation temperature (58C) resultsin-water emulsion solvent evaporation technique, Pharm.
in slow formation of microspheres. The resultant Res. 10 (1993) 362–368.microspheres are the smallest in size, with porous [5] R.C. Mehta, R. Jeyanthi, S. Calis, B.C. Thanoo, K.W.surface and internal structure. They have a low initial Burton, P.P. DeLuca, Biodegradable microspheres as depot
system for parental delivery of peptide drugs, J. Control.burst and a characteristic steady release of BSA.VeryRelease 29 (1994) 375–384.high preparation temperature (388C and 428C) on the
[6] R. Jeyanthi, B.C. Thanoo, R.C. Mehta, P.P. DeLuca, Effect ofother hand gives large microspheres with a wide size solvent removal technique on the matrix characteristics ofdistribution and rough surface because of rapid polylactide /glycolide microspheres for peptide delivery, J.solvent removal. Control. Release 38 (1996) 235–244.
[7] W.-I. Li, K.W. Anderson, R.C. Mehta, P.P. Deluca, PredictionDuring fabrication, a low preparation temperatureof solvent removal profile and effect on properties forof 58C gives the slowest overall shrinking rate.peptide-loaded PLGA microspheres prepared by solvent
Microspheres formed at high temperatures of 388C extraction /evaporation method, J. Control. Release 37and 428C on the other hand have the highest overall (1995) 199–214.shrinking rate. Subsequently, microsphere mean size [8] W.-I. Li, K.W. Anderson, P.P. Deluca, Kinetic and thermo-
dynamic modelling of the formation of polymeric micro-increases and the particle size distribution widensspheres using solvent extraction /evaporation method, J.with increase in the preparation temperature. Micro-Control. Release 37 (1995) 187–198.
spheres formed at 338C is found to give the highest [9] Y.Y. Yang, T.S. Chung, X.L. Bai, W.K. Chan, Effect ofinitial burst release. The results obtained suggest that preparation conditions on morphology and release profiles ofpreparation temperature significantly affects micro- biodegradable polymeric microspheres containing protein

96 Y.-Y. Yang et al. / Journal of Controlled Release 69 (2000) 81 –96
fabricated by double-emulsion solvent extraction technique, [15] R. Jeyanthi, S. Calis, R.C. Mehta, P.P. DeLuca, Influence ofChem. Eng. Sci. 55 (2000) 2223–2236. processing parameters on the porosity of poly(glycolide-co-
[10] H. Stephen, T. Stephen (Eds.), Solubilities of Inorganic and lactide) microspheres, Pharmacol. Res. 9 (1992) s-252.Organic Compounds, Pergamon Press, New York, Oxford, [16] R. Jeyanthi, B.C. Thanoo, R.C. Mehta, P.P. DeLuca, Effect of1963–1979. solvent removal technique on the matrix characteristics of
[11] J.M. Smith, H.C. Van Ness, M.M. Abbott, Introduction to polylactide /glycolide microspheres for peptide delivery, J.Chemical Engineering Thermodynamics, McGraw-Hill, Control. Release 38 (1996) 235–244.1996. [17] T.S. Chung, The limitations of using Flory–Huggins equa-
[12] R.C. Mehta, B.C. Thanoo, P.P. DeLuca, Peptide containing tion for the states of solutions during asymmetric hollow-microspheres from low molecular mass and hydrophilic fiber formation, J. Membr. Sci. 126 (1997) 19–34.poly(D,L-lactide-co-glycolide), J. Control. Release 41 (1996) [18] A.T. Florence, The oral absorption of micro- and nanopar-249–257. ticulates: neither exceptional nor unusual, Pharm. Res. 14
[13] X.M. Deng, X.H. Li, M.L. Yuan, C.D. Xiong, Z.T. Huang, (1997) 259–266.W.X. Jia, Y.H. Zhang, Optimisation of preparative conditions [19] D.T. O’Hagan, H. Jeffrey, S.S. Davis, The preparation andfor poly-DL-lactide–polyethylene glycol microspheres with characterisation of poly(lactide-co-glycolide) microparticles.entrapped Vibrio Cholera antigens, J. Control. Release 58 III. Microparticle /polymer degradation rates and the in vitro(1999) 123–131. release of a model protein, Int. J. Pharm. 103 (1994) 37–45.
[14] D.T. O’Hagan, Intestinal translocation of particulates – [20] H.K. Sah, R. Toddywala, Y.W. Chien, The influence ofimplication for drug and antigen delivery, Adv. Drug Deliv. biodegradable microcapsule formulations on the controlledRev. 5 (1990) 265–285. release of a protein, J. Control. Release 30 (1994) 201–211.