effect of precursor mineralogy on the thermal infrared
TRANSCRIPT

Effect of precursor mineralogy on the thermal infrared emission
spectra of hematite: Application to Martian hematite mineralization
T. D. GlotchDepartment of Geological Sciences, Arizona State University, Tempe, Arizona, USA
R. V. MorrisNASA Johnson Space Center, Houston, Texas, USA
P. R. Christensen and T. G. SharpDepartment of Geological Sciences, Arizona State University, Tempe, Arizona, USA
Received 7 December 2003; revised 10 April 2004; accepted 10 May 2004; published 13 July 2004.
[1] Observations from the Thermal Emission Spectrometer (TES) instrument aboardthe Mars Global Surveyor (MGS) spacecraft led to the discovery of two isolateddeposits of gray, crystalline hematite located in Meridiani Planum and Aram Chaosand several smaller deposits in Valles Marineris. Several pathways for formation ofthese hematite deposits have been proposed, involving both aqueous and nonaqueousprocesses. This work uses the precise shape and position of spectral features in theMartian hematite thermal emission spectrum to constrain hematite formation pathways.Thermal infrared emission spectra, X-ray powder diffraction patterns, Mossbauerspectra, and transmission electron microscope (TEM) photomicrographs were obtainedfor synthetic and natural hematite samples derived by (1) dehydroxylation of fine-grained goethite and (2) oxidation of magnetite. Collectively, the instrumental analysesshow that the mineralogical composition and crystal morphology of precursor samplesand the time and temperature conditions under which decomposition to hematiteoccur determine the crystallinity and crystal morphology of the hematite product.Comparison of laboratory and MGS-TES spectra shows that the Martian hematitespectra correspond closely with a synthetic hematite sample derived by pseudomorphicand topotactic dehydroxylation of goethite at 300�C. Spectra of goethite-precursorsamples dehydroxylated at higher temperatures provide increasingly poor fits. Spectraof hematite samples derived by high-temperature thermal oxidation of magnetite arealso poorer fits to the Martian hematite spectrum. Thermal emission spectra ofgoethites heated at lower temperatures are characterized by the spectral signatures ofboth hematite and goethite and are not consistent with the Martian spectra. Thecharacteristic that distinguishes the synthetic hematite sample with the Mars-likespectral signature from the other synthetic hematite samples is the high proportion ofcrystal surfaces that are crystallographic {001} faces (c faces) for the former butnot the latter. The high proportion of {001} face area results because the largestsurface of the lath-shaped hematite particles is the (001) face, as determined by TEM.Thus a possible formation pathway for hematite in Meridiani Planum, Aram Chaos,and Valles Marineris is precipitation of goethite from aqueous solutions as lath-shapedcrystals, possibly as a stain, cement, and/or massive deposit, followed bypseudomorphic and topotactic dehydroxylation to hematite at temperatures below�300�C. INDEX TERMS: 6225 Planetology: Solar System Objects: Mars; 3672 Mineralogy and
Petrology: Planetary mineralogy and petrology (5410); 1060 Geochemistry: Planetary geochemistry (5405,
5410, 5704, 5709, 6005, 6008); KEYWORDS: hematite, Mars, TES
Citation: Glotch, T. D., R. V. Morris, P. R. Christensen, and T. G. Sharp (2004), Effect of precursor mineralogy on the thermal
infrared emission spectra of hematite: Application to Martian hematite mineralization, J. Geophys. Res., 109, E07003,
doi:10.1029/2003JE002224.
JOURNAL OF GEOPHYSICAL RESEARCH, VOL. 109, E07003, doi:10.1029/2003JE002224, 2004
Copyright 2004 by the American Geophysical Union.0148-0227/04/2003JE002224
E07003 1 of 18

1. Introduction
[2] Isolated deposits of gray, crystalline hematite havebeen identified on the Martian surface at Meridiani Planum,Aram Chaos, Candor Chasma, and Ophir Chasma usingdata returned from the Thermal Emission Spectrometer(TES) instrument aboard the Mars Global Surveyor(MGS) spacecraft [Christensen et al., 2000, 2001a].Christensen et al. [2000] listed five hypotheses regardingthe formation of crystalline hematite on Mars: (1) low-temperature precipitation of Fe oxides/hydroxides fromstanding, oxygenated, Fe-rich water, followed by subse-quent alteration to gray hematite, (2) low-temperatureleaching of iron-bearing silicates and other materials leavinga Fe-rich residue (laterite-style weathering) which is subse-quently altered to gray hematite, (3) direct precipitationof gray hematite from Fe-rich circulating fluids of hydro-thermal or other origin, (4) formation of gray hematitesurface coatings during weathering, and (5) thermal oxida-tion of magnetite-rich lavas.[3] Since this initial work, several authors have exam-
ined the geomorphology and/or spectral character of thedeposits to determine hematite formation mechanisms.Lane et al. [2002] cited the absence of a 390 cm�1
absorption in the Martian hematite spectrum as evidencefor platy hematite grains, where the area of the (001) face(c face) is large compared to other faces. Their model forthe formation of the deposits includes deposition of anycombination of iron oxides or oxyhydroxides by aqueousor hydrothermal fluids, burial, and metamorphism to grayplaty hematite grains, followed by exhumation in recenttimes. On the basis of a detailed geomorphic examinationof the Sinus Meridiani region, Hynek et al. [2002] con-clude that the most likely method of hematite formationwas either emplacement by a hydrothermal fluid or oxi-dation of a magnetite-rich pyroclastic deposit. Similarly,Arvidson et al. [2003] and Chapman and Tanaka [2002]favor a model involving the alteration of pyroclasticdeposits by aqueous or hydrothermal fluids. Calvin et al.[2003] and Fallacaro and Calvin [2003] prefer a model ofdeposition analogous to terrestrial banded iron formation(BIF) deposits. On the basis of geochemical modeling andan examination of Aram Chaos, Catling and Moore [2003]favor emplacement by hydrothermal fluids with a mini-mum temperature of 100�C. Kirkland et al. [2004] arguethat the deposits in Meridiani Planum are composed of‘‘fine intimate’’ hematite, possibly in the form of coatings.All of these models are derivatives of the original fiveformation processes suggested by Christensen et al.[2000]. Finally, it has also been suggested that phosphorusmay have played an important role in the formation ofMartian hematite [Barron et al., 2004; Greenwood et al.,2004].[4] To provide constraints for hematite formation path-
ways on Mars, we measured thermal emission spectra for aseries of synthetic and natural hematite samples withdifferent precursor mineralogy and particle morphology,formation temperature, and crystallinity. We also obtainedpowder X-ray diffraction and Mossbauer data for syntheticand natural hematites, and we characterize particle shapeand size and degree of post-transformation crystal growthby transmission electron microscopy (TEM). We conclude
with a comparison of laboratory and MGS-TES hematitespectra and the implications thereof for hematite formationpathways on Mars.
2. Background
[5] The MGS-TES instrument is a Fourier-TransformMichelson Interferometer (FTIR) that covers the wavenumber range from �1700 to 200 cm�1 (�6 to 50 mm) at5 or 10 cm�1 spectral sampling. Each detector has aninstantaneous field of view of �8.5 mrad, providing aspatial resolution of �3 by 3 km. From the final TESmapping orbit of �380 km, the actual surface sampling is3 � �8 km. The elongated pixel dimension results from thefinal mapping orbit of MGS, which is opposite in directionof that originally planned, and the fact that the plannedimage motion compensation could not be used. It also hastwo broadband radiometers which measure energy in thethermal (�5–100 mm) and visible/near-infrared (�0.3–3.5 mm) wavelengths. The focal planes in each wavelengthinterval consist of 6 detectors arranged in a 3 by 2 array. Fora complete description of the TES instrument and instru-ment operations, see Christensen et al. [2001b].[6] Comparison of the average Martian hematite spec-
trum measured by MGS-TES to hematite emissivity spectrafor a variety of naturally occurring hematites shows smallbut important differences [Lane et al., 2002]. In particular,band shapes, positions, and relative intensities of hematitespectra vary over the range of samples. These differencesimply that the IR spectral effects caused by the naturalvariability of hematite have not been fully characterized,especially with respect to the formation pathway and crystalmorphology.[7] Using the target transformation and factor analysis
method of Bandfield et al. [2000, 2002], we recovered ahematite spectrum from ocks 1583 through 7000 of theMGS-TES data (ock 1 is equivalent to MGS mapping orbit1683; some science phasing orbit data were used in thisstudy) for two areas in Meridiani Planum (5�S to 0�, 356.0�to 356.2�E and 3�S to 2�N, 358.6� to 358.8�E) and one inAram Chaos (3� to 4�N, 339� to 340�E). Because thehematite component varies independently of the basalt inthe three scenes, we were able to recover spectra that arerepresentative of just the hematite. The resulting threehematite spectra are nearly identical and were averaged toproduce a single Martian hematite spectrum. Figure 1 showsthe three recovered hematite spectra and the average hema-tite spectrum. The average Martian hematite spectrumhas major emissivity minima centered at 539, 445, and303 cm�1. The broad atmospheric CO2 fundamental ab-sorption centered at 667 cm�1 prevented the use of addi-tional spectral channels at higher wave numbers.
3. Samples and Methods
3.1. Sample Preparation
[8] Three types of hematite samples were studied:(1) hematite synthesized by thermal decomposition of threedifferent synthetic goethite precursors, (2) hematite synthe-sized by thermal oxidation of two different syntheticmagnetite precursors, and (3) three naturally occurringhematite samples from various geologic provinces. Table 1
E07003 GLOTCH ET AL.: MARTIAN HEMATITE MINERALIZATION
2 of 18
E07003

shows the names, precursor mineral, precursor crystal size,and formation temperature for the synthetic goethite andmagnetite precursor samples that were altered to hematite.The nomenclature shows whether a sample has been heatedor not and at what temperature the heating occurred (e.g.,GTS2 versus GTSH2-300).[9] The synthetic hematite samples were pressed at
10,000 psi in a hydraulic hand press into compact pelletsto increase the contrast of their IR spectra [Salisbury andWald, 1992; Johnson et al., 1998]. In all cases, sampleswere compacted after heating to minimize particle sinter-ing. Spectra of samples pressed at higher and lowerpressures did not deviate significantly from those pressedat 10,000 psi.3.1.1. Goethite-Precursor Series[10] Goethite precursors used in this study are synthetic
yellow-orange powders obtained from Pfizer, Inc. SamplesGTS2 and GTS3 are described by Morris and Lauer [1981]and Morris et al. [1985], and they have mean crystaldimensions of 0.05 � 0.4 mm and 0.1 � 0.7 mm, respec-tively. According to the manufacturer, GTS4 was synthe-sized by the same direct precipitation method as GTS2 andGTS3 and has a mean crystal dimension (as supplied by themanufacturer) of �1.5 mm in the long direction. Eachmaterial was heated in air in an Omegalux LMF 3550furnace at temperatures of 250�, 300�, 400�, 500�, 600�,and 700�C for 24 hours and then cooled slowly over aperiod of 2 to 3 hours. According to Morris and Lauer[1981], dehydroxylation of GTS2 and GTS3 is complete by280�C at a heating rate of �0.5�C/min from ambienttemperature. Each final product of heating is a red powder.3.1.2. Magnetite-Precursor Series[11] Magnetite precursors used in this study are the
black powder samples MTS4 and MTS5 described byMorris et al. [1985]. MTS4 was synthesized by directprecipitation from solution, and MTS5 was prepared bydehydroxylation of acicular goethite to hematite andsubsequent reduction of the hematite to magnetite. Moss-bauer spectra of both powders show that these samplesare cation-deficient relative to stoichiometric magnetite
[Morris et al., 1985]. The mean crystal dimensions ofthese samples are 0.5 mm for the equant MTS4 crystalsand 0.09 � 0.6 mm for the acicular MTS5 crystals.Samples of each material were oxidized by heating inair for 24 hours in a furnace at temperatures of 300�,400�, 500�, 600�, and 700�C and then allowed to coolslowly over 2 to 3 hours. Like the goethite-precursorseries, each final product of heating is a red powder.3.1.3. Natural Hematite Samples[12] Three natural gray hematite samples were selected on
the basis of variability of geologic setting and inferredformational mechanisms.[13] Hematite-bearing sample SWAN1 is a quartz-rich
fault breccia coated with black-gray hematite collectednear Swansea, Arizona. The rock is heavily weatheredthroughout (red colored) with only the surface layer gray-black. The hematite was likely deposited as a vein in thequartz country rock (J. Michalski, personal communica-tion, 2003).[14] The hematite deposits in the Swansea mine district
and the surrounding Buckskin and Rawhide Mountainsare the result of mineralization related to Mioceneextensional tectonism. Hematite mineralization was oneof several related processes that included K metasoma-tism of sedimentary and volcanic rocks, chloritic alter-ation of brecciated rocks below the regional detachmentfaults, Cu-Fe mineralization along the detachment faults,hydrothermal carbonate replacement of rocks above thedetachment faults, and sedimentary and fracture-fillingMn mineralization [Spencer and Welty, 1989]. Studies offluid inclusions in rocks near Swansea indicate that the
Figure 1. Target transformation derived hematite spectrafrom Meridiani Planum and Aram Chaos. The nearlyidentical spectra imply a common formation mechanism.No contrast enhancement was performed on the spectra.
Table 1. Summary of Precursor History and Formation
Temperature of Synthetic Samples
Sample
FormationTemperature,
�CPrecursorHistory
PrecursorGrain Size, mm
GTSH2-250 250 goethite 0.05 � 0.4GTSH2-300 300 goethite 0.05 � 0.4GTSH2-400 400 goethite 0.05 � 0.4GTSH2-500 500 goethite 0.05 � 0.4GTSH2-600 600 goethite 0.05 � 0.4GTSH2-700 700 goethite 0.05 � 0.4GTSH3-250 250 goethite 0.1 � 0.7GTSH3-300 300 goethite 0.1 � 0.7GTSH3-400 400 goethite 0.1 � 0.7GTSH3-500 500 goethite 0.1 � 0.7GTSH3-600 600 goethite 0.1 � 0.7GTSH3-700 700 goethite 0.1 � 0.7GTSH4-250 250 goethite �1.5 (long direction)GTSH4-300 300 goethite �1.5 (long direction)GTSH4-400 400 goethite �1.5 (long direction)GTSH4-500 500 goethite �1.5 (long direction)GTSH4-600 600 goethite �1.5 (long direction)GTSH4-700 700 goethite �1.5 (long direction)MTSH4-300 300 magnetite 0.5MTSH4-400 400 magnetite 0.5MTSH4-500 500 magnetite 0.5MTSH4-600 600 magnetite 0.5MTSH4-700 700 magnetite 0.5MTSH5-300 300 goethite ! magnetite 0.09 � 0.6MTSH5-400 400 goethite ! magnetite 0.09 � 0.6MTSH5-500 500 goethite ! magnetite 0.09 � 0.6MTSH5-600 600 goethite ! magnetite 0.09 � 0.6MTSH5-700 700 goethite ! magnetite 0.09 � 0.6
E07003 GLOTCH ET AL.: MARTIAN HEMATITE MINERALIZATION
3 of 18
E07003

hydrothermal fluids were saline (12–24 wt.% NaCl equiv.)and had temperatures between 175�C and 300�C [Wilkins etal., 1986; Roddy et al., 1988].[15] Two massive gray hematite samples (provided by
S. Reynolds) were studied. Sample DUR1 is from the Cerrode Mercado iron deposits, part of the Mercado IronMember of the Cacaria Formation near Durango, Mexico.The coarse-grained hematite in these deposits was derivedby the oxidation of magnetite [Lyons, 1988]. The originaliron deposits were emplaced during a break in the twomajor eruptive cycles of the 30 Ma Chupaderos caldera.The iron deposit was the result of an eruption of an iron-rich magma that also had large amounts of fluorine,chlorine, carbon dioxide, and water. Iron oxides wereoriginally magnetite, but in the late stages of volcanicactivity, large volumes of halogen-rich gases flowedthrough the iron deposits and oxidized the magnetite tohematite [Lyons, 1988].[16] The other massive gray hematite sample (ODH3) is
from the Olympic Dam ore in southern Australia [Oreskesand Einaudi, 1992; Haynes et al., 1995]. The Olympic Damdeposit is located in the mid-Proterozoic granite basementof South Australia and contains over 2 billion tons of Cu-U-Au-Ag-(REE) mineralization [Scott, 1987]. The deposits arecomposed of steeply dipping breccia columns and dikesformed by mechanical brecciation and hydrothermal meta-somatism of the host granite. In rare cases, hematite isformed as an oxidation product of magnetite, but thewidespread hematite replacement of the host granite impliesdirect precipitation from hydrothermal fluids. Hematiteoccurs additionally as coarse-grained (1–10 mm), black,euhedral crystals in massive bodies, fragments, and vugs inthe hematite-rich breccias and as fine-grained hematite laths(5–50 mm) intergrown with barite and sericite [Oreskes andEinaudi, 1992]. Stable oxygen isotopes indicate that hema-tite was emplaced by fluids (d18O < 9%) at temperatures of200�–400�C [Oreskes and Einaudi, 1992]. The sampleexamined in this study is the massive, hydrothermallyemplaced variety.
3.2. Laboratory Sample Analysis
[17] Thermal infrared (200–2000 cm�1) emission spectrawere collected at 2 cm�1 sampling (4 cm�1 spectralresolution) on Arizona State University’s modified NicoletNexus 670 E.S.P. Fourier-Transform Infrared (FTIR) spec-trometer. Each pressed-pellet sample spectrum is an averageof 270 scans collected while the samples were maintained at80�C. The natural hematites studied here are in the form ofhand samples, and only 180 scans were collected. The rocksamples were not actively heated, and fewer scans werecollected in order to facilitate rapid spectral measurementand prevent the introduction of a slope resulting fromsample cooling. Details of the collection procedure, labora-tory setup, and calibration process are given by Christensenand Harrison [1993] and Ruff et al. [1997]. Visible-Near IRmeasurements were made on a Cary-14 Diffuse ReflectanceSpectrometer. For details on the instrument and procedure,see Morris et al. [2000].[18] TEM images were acquired on ASU’s Phillips
CM200 FEG microscope run at a 200 kV potential. It isequipped with a field emission gun and a side entrance stageand has a supertwin objective lens for imaging and diffrac-
tion. Samples were prepared by dispersing a powderedsample in acetone and covering a holey-carbon-film-covered grid with the dispersed sample.[19] Powder X-ray diffraction spectra were collected on
Johnson Space Center’s Scintag XDS2000 with a Cu-Kasource. X-ray patterns were collected over a range of 2qangles from 2–70 degrees.[20] Transmission Mossbauer spectra were acquired at
room temperature on Johnson Space Center’s RangerScientific spectrometers [Morris et al., 1985, 1989] witha 57Co(Rh) source at an intensity of �25 mCi. Velocitycalibration was done with a laser interferometer. Absorberswere made by dispersing powdered samples in epoxy to adensity of 50–100 kg/m2 of Fe. Mossbauer parameterswere derived by an in-house computer program (JSCFIT)using theoretical line shapes to fit folded spectra.Derived parameters are the isomer shift (IS) relativeto the midpoint of the spectrum of metallic iron foil at293 K, quadrupole shift (QS), hyperfine field strength(Bhf), and full widths at half maximum intensity(FWHM). Typical uncertainties are ±0.01 mm/s for ISand QS, ±0.2 T for Bhf, and ±0.02 mm/s for FWHM[Morris et al., 2000].
4. Results
4.1. Visible and Near-IR (VNIR) Measurements
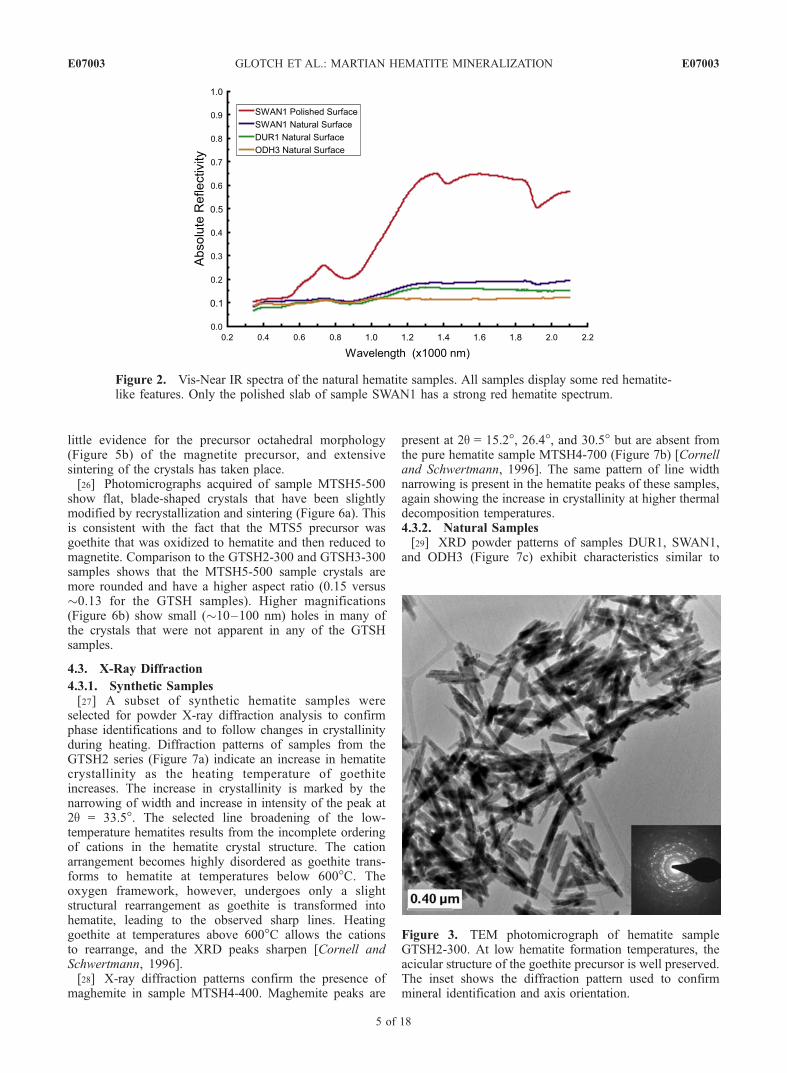
[21] Vis-Near IR spectra were acquired for the threenatural gray hematite samples (Figure 2). All of the naturalsurfaces exhibit a weak red hematite spectral signature. Incontrast, the surface of SWAN1 obtained by sawing andpolishing with 60 grit paper has a strong red hematitespectral signature. The pressed synthetic samples arepurple-red to the eye and presumably would also havespectral signatures characteristic of red hematite.
4.2. TEM
[22] In general, our TEM observations of air-heated finepowders of goethite and magnetite parallel the results ofprevious studies summarized by Cornell and Schwertmann[1996]. We summarize our observations below.4.2.1. GTSH Series[23] TEM photomicrographs and selected-area electron
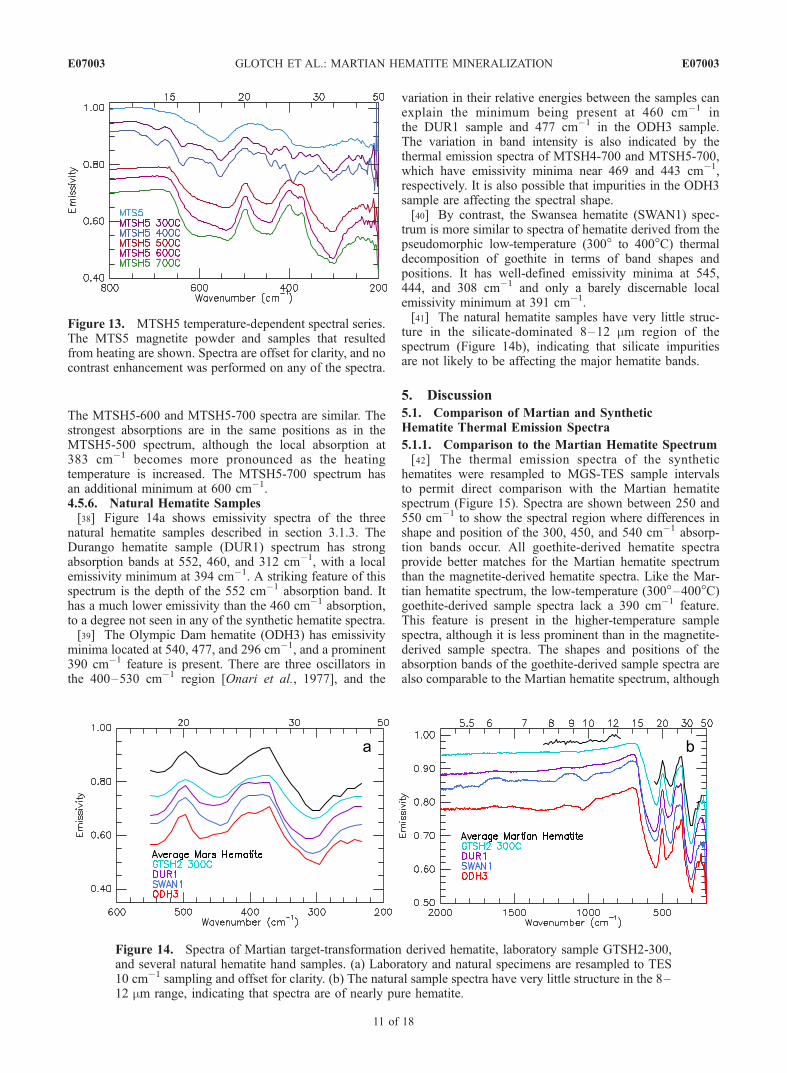
diffraction patterns were acquired for several synthetichematite samples that were chosen to represent the broadrange of precursor minerals and formation temperaturesused in this study. Images of samples GTSH2-300(Figure 3) and GTSH3-300 show hematite crystals thatare pseudomorphic after goethite. Inspection shows thatthese hematite crystals are the same size and shape as theprecursor goethite crystals. Indexing of the diffractionpattern indicates pure hematite with the [001] axis perpen-dicular to the plane of the bladed (lath-shaped) crystals.[24] In contrast to the low-temperature GTSH samples,
the high-temperature samples show evidence of recrystalli-zation and sintering (Figures 4a and 4b). Very little evidenceof original goethite morphology is present. Individualhematite crystals appear to be rod shaped and are muchsmaller (<0.5 mm) than the goethite precursor crystals.4.2.2. MTSH Series[25] Photomicrographs of sample MTSH4-700 (Figure 5a)
show small equant euhedral to anhedral crystals. There is
E07003 GLOTCH ET AL.: MARTIAN HEMATITE MINERALIZATION
4 of 18
E07003
little evidence for the precursor octahedral morphology(Figure 5b) of the magnetite precursor, and extensivesintering of the crystals has taken place.[26] Photomicrographs acquired of sample MTSH5-500
show flat, blade-shaped crystals that have been slightlymodified by recrystallization and sintering (Figure 6a). Thisis consistent with the fact that the MTS5 precursor wasgoethite that was oxidized to hematite and then reduced tomagnetite. Comparison to the GTSH2-300 and GTSH3-300samples shows that the MTSH5-500 sample crystals aremore rounded and have a higher aspect ratio (0.15 versus�0.13 for the GTSH samples). Higher magnifications(Figure 6b) show small (�10–100 nm) holes in many ofthe crystals that were not apparent in any of the GTSHsamples.
4.3. X-Ray Diffraction
4.3.1. Synthetic Samples[27] A subset of synthetic hematite samples were
selected for powder X-ray diffraction analysis to confirmphase identifications and to follow changes in crystallinityduring heating. Diffraction patterns of samples from theGTSH2 series (Figure 7a) indicate an increase in hematitecrystallinity as the heating temperature of goethiteincreases. The increase in crystallinity is marked by thenarrowing of width and increase in intensity of the peak at2q = 33.5�. The selected line broadening of the low-temperature hematites results from the incomplete orderingof cations in the hematite crystal structure. The cationarrangement becomes highly disordered as goethite trans-forms to hematite at temperatures below 600�C. Theoxygen framework, however, undergoes only a slightstructural rearrangement as goethite is transformed intohematite, leading to the observed sharp lines. Heatinggoethite at temperatures above 600�C allows the cationsto rearrange, and the XRD peaks sharpen [Cornell andSchwertmann, 1996].[28] X-ray diffraction patterns confirm the presence of
maghemite in sample MTSH4-400. Maghemite peaks are
present at 2q = 15.2�, 26.4�, and 30.5� but are absent fromthe pure hematite sample MTSH4-700 (Figure 7b) [Cornelland Schwertmann, 1996]. The same pattern of line widthnarrowing is present in the hematite peaks of these samples,again showing the increase in crystallinity at higher thermaldecomposition temperatures.4.3.2. Natural Samples[29] XRD powder patterns of samples DUR1, SWAN1,
and ODH3 (Figure 7c) exhibit characteristics similar to
Figure 2. Vis-Near IR spectra of the natural hematite samples. All samples display some red hematite-like features. Only the polished slab of sample SWAN1 has a strong red hematite spectrum.
Figure 3. TEM photomicrograph of hematite sampleGTSH2-300. At low hematite formation temperatures, theacicular structure of the goethite precursor is well preserved.The inset shows the diffraction pattern used to confirmmineral identification and axis orientation.
E07003 GLOTCH ET AL.: MARTIAN HEMATITE MINERALIZATION
5 of 18
E07003

those of the synthetic hematite samples, along with peaksfrom additional oxide and nonoxide phases. The XRDpattern of sample DUR1 shows sharp peaks, indicatingthe presence of well-crystalline hematite. Sample ODH3is composed largely of well-crystalline hematite, alongwith minor peaks for quartz (2q = 21.0� and 26.8�), a
phyllosilicate (2q = 8.9�), and, tentatively, a sulfide (2q =46.9�).[30] The XRD pattern of sample SWAN1 was acquired
from a sample representative of the bulk rock. It is domi-nated by quartz, the main component of the host rock uponwhich the hematite rind occurs. The hematite peaks resemble
Figure 4. TEM photomicrographs of hematite sample GTSH2-700. At higher formation temperatures,the hematite recrystallizes into small (<1 mm) crystallites that are sintered together. (a) A high-magnification image of the sintered hematite crystallites. (b) At lower magnification the hematite appearsas a coarse crystalline mass.
Figure 5. TEM photomicrographs of sample MTSH4-700 and precursor magnetite. (a) Hematitesample MTSH4-700. The octahedral structure of the magnetite precursor is poorly preserved, and somecrystals are sintered together. (b) Magnetite sample MTS5. Note the octahedral crystal habit and the sharpedges of the crystals.
E07003 GLOTCH ET AL.: MARTIAN HEMATITE MINERALIZATION
6 of 18
E07003

those in sample GTSH2-300, with broad and narrow peaksoccurring at 2q = 33.5� and 35.8�, respectively. A minorgoethite component is also present, as shown by the broadpeak at 2q = 21.7�.
4.4. Mossbauer Spectra
4.4.1. Synthetic Samples[31] A subset of the synthetic hematite samples were
selected for Mossbauer analysis. Mossbauer spectra of thesynthetic goethite and magnetite precursors and the hematitesamples derived from them are shown in Figure 8a. Theisomer shift (IS), quadrupole splitting (QS), magnetic hyper-fine field (Bhf), and the full width half maximum intensity ofthe first and sixth lines of the sextets (FWHM) are summa-rized in Table 2 along with corresponding parameters for thenatural hematites analyzed in this study and three synthetichematites reported by Morris et al. [1985]. HMS3 wasprepared by direct precipitation from solution, and HMS12and HMS14 were synthesized, like the samples in this study,by heating goethite and magnetite precursors, respectively.Except for MTSH4-700, which has a somewhat high value ofBhf, the values of IS, QS, and Bhf are the same within errorand in agreement with literature values for hematite [e.g.,Stevens et al., 1998]. The larger values of FWHM, particu-larly for samples heated at 300�–400�C, are consistent with apoorly ordered cation framework for these samples as ob-served in the XRD spectra. In agreement with our thermalemission and XRD results, the Mossbauer spectrum ofMTSH4-400 has a second sextet whose Mossbauer param-eters implymaghemite. On the basis of peak areas, the sampleis�40%maghemite. Residual precursor phases (goethite andmagnetite) were not detected in any of the heated samples.4.4.2. Natural Samples[32] The Mossbauer spectra of the natural hematite sam-
ples examined in this study are shown in Figure 8b. In
addition, IS, QS, Bhf, and FWHM are reported in Table 2.Sample DUR1 has values of IS, QS, Bhf, and FWHMconsistent with well-ordered hematite. These values aresimilar for sample ODH3, although it is apparent from theMossbauer spectrum that some impurities are present in thesample. Similar to the synthetic samples heated at 300�–400�C, SWAN1 has a large FWHM value, consistent withpoorly ordered hematite. An additional doublet in theSWAN1 Mossbauer spectrum is consistent with minor(superparamagnetic) goethite. Like the sample used for theXRD analysis, the sample of SWAN1 used for Mossbaueranalysis is representative of the bulk rock, and not just thehematite rind.
4.5. Thermal Emission Spectra
4.5.1. GTSH2 Series[33] Previous work [Rendon and Serna, 1981] has
shown that IR absorption spectra of goethite-derivedhematite depend greatly on the temperature of transforma-tion. Our work shows that this is also the case for thermalemission spectra. Emission spectra of the GTSH2 seriesare shown in Figure 9, and significant changes in spectralshape with increasing dehydroxylation temperature areobserved. For this and subsequent figures the 800–1200 cm�1 region of the spectrum is not shown becausecoarse-particulate oxide minerals do not have featuresthere [Christensen et al., 2000; Lane et al., 2002]. TheGTS2 precursor and sample GTSH2-250 (GTS2 precursor,heated to 250�C) have similar spectra. Both the GTS2 andthe GTSH2-250 spectra have emissivity minima at 893and 795 cm�1, consistent with goethite, that are not presentin hematite spectra. These two bands represent O-Hbending modes in the goethite crystal [Cambier, 1986].As the goethite loses water in its transformation tohematite, these bands disappear. Additional emissivity
Figure 6. TEM photomicrographs of hematite sample MTSH5-500. (a) The acicular structure of themagnetite precursor (formed by reduction of goethite) is evident, but not as well preserved as hematiteformed from goethite at low temperatures. (b) At high magnification the hematite laths have a spongytexture. Note that the linear structure on the far left of the image is not a hematite lath, but a carbon fiber.
E07003 GLOTCH ET AL.: MARTIAN HEMATITE MINERALIZATION
7 of 18
E07003

minima are present at 600, 468, 427, 406, and 268 cm�1 ineach spectrum, although the 600 cm�1 minimum is veryweak in the GTSH2-250 spectrum. There is no indicationof hematite spectral features in either the GTS2 or GTSH2-250 spectra. The lowest heating temperature at whichhematite features appear in the emissivity spectra is300�C (sample GTSH2-300). The absorption bands at893 and 795 cm�1 seen in the GTSH2 and GTSH2-250spectra are not present in the GTSH2-300 spectrum. Astrong absorption band is also present at 541 cm�1 in theGTSH2-300 spectrum. Additionally, the broad absorptionsat 468 and 406 cm�1 in the GTS2 and GTSH2-250 spectraare replaced by a single emissivity minimum at 444 cm�1
in the GTSH2-300 spectrum. The minimum at 268 cm�1
seen in the GTS2 and GTSH2-250 spectra is replaced by a305 cm�1 minimum, with a resultant shift of the emissivitymaximum from 310 to 371 cm�1 in the GTSH2-300
spectrum. For samples GTSH2-500 and higher-temperaturesamples, an absorption at 385 cm�1 appears and becomesmore pronounced as the temperature of dehydroxylationincreases. An additional effect of the increasing heatingtemperature is the effective broadening of the absorptionband at 541 cm�1.4.5.2. GTSH3 Series[34] Emission spectra of the GTSH3 series are shown
in Figure 10. The results of heating the GTS3 precursorare similar to the results obtained by heating the GTS2precursor. As with the GTSH2 series, spectral variationsoccur with heating temperature (250� to 700�C). The GTS3precursor and sample GTSH3-250 have similar spectra.Both have emissivity minima at 893 and 795 cm�1 thatare not present in hematite spectra. Additional emissivityminima are present at 595, 471, 429, 432, 402, and268 cm�1, although the minimum at 595 cm�1 is veryweak in the GTSH3-250 spectrum. There is no indication ofhematite spectral features in the GTSH3-250 spectrum.Emissivity spectra indicate that the first sample completelytransformed to hematite is GTSH3-300. The minima pres-ent at 893 and 795 cm�1 in the GTS3 and GTSH3-250spectra are not present in the GTSH3-300 spectrum. Amajor absorption band appears at 541 cm�1 in the GTSH3-300 spectrum. Additionally, the broad bands at 471 and402 cm�1 in the GTS3 and GTSH3-250 spectra arereplaced by a single minimum at 444 cm�1 in theGTSH3-300 spectrum. The minimum at 268 cm�1 seen inthe GTS3 and GTSH3-250 spectra is replaced by a310 cm�1 minimum with a resultant shift of the emissivitymaximum from 309 to 371 cm�1 in the GTSH3-300spectrum. For samples GTSH3-500 and higher an absorp-tion at 381 cm�1 appears and becomes more pronounced asthe temperature of dehydroxylation increases. As seen inthe GTSH2 series, an additional effect of the increasingheating temperature is the effective broadening of theabsorption band at 541 cm�1.4.5.3. GTSH4 Series[35] Emission spectra of the GTSH4 series are shown in
Figure 11. The results of heating the GTS4 precursor are
Figure 7. X-ray diffraction patterns of selected synthetichematite samples. (a) X-ray diffraction patterns of goethite-derived samples GTSH2-300 and GTSH2-700. The diffrac-tion pattern of GTSH2-300 has broad peaks, indicating adisordered nature. The GTSH2-700 pattern has narrowpeaks, indicating a more ordered crystal structure. (b) X-raypatterns for samples MTSH4-400 and MTSH4-700. Thepeaks present in the MTSH4-400 pattern that are not seenin the MTSH4-700 pattern are indicative of maghemite.The MTSH4-700 pattern has much narrower hematitepeaks than the MTSH4-400 sample, indicating greatercrystallinity. (c) X-ray patterns for natural samples DUR1,ODH3, and SWAN1. Sample DUR1 is almost pure well-crystalline hematite. Sample ODH3 is primarily well-crystalline hematite but contains impurities identified asphyllosilicates and sulfide minerals. Sample SWAN1 hasabundant quartz because of the hematite coating’s hostrock. A small goethite peak is present, and some of thehematite peaks are broad, as was seen in synthetic sampleGTSH2-300.
E07003 GLOTCH ET AL.: MARTIAN HEMATITE MINERALIZATION
8 of 18
E07003

similar to the results obtained by heating the GTS2 andGTS3 precursors. The GTS4 precursor and sample GTSH4-250 have similar spectra, but there are more differencesbetween these two samples than seen for the correspondingsamples in the GTSH2 and GTSH3 series. Both the GTS4and GTSH4-250 spectra have emissivity minima at 891 and795 cm�1 that are not present in hematite spectra. Addi-
tional emissivity minima are present at 468, 406, and271 cm�1, although the absorption centered at 271 cm�1
is shallower in the GTSH4-250 spectrum than in the GTS4spectrum. Despite the differences between the GTS4 andGTSH4-250 spectra, there is still no indication of hematitespectral features in the GTSH4-250 spectrum. Emissivityspectra show that the first sample completely transformed tohematite is GTSH4-300. The minima at 891 and 795 cm�1
in the GTS4 and GTSH4-250 spectra are not present in theGTSH4-300 spectrum. Additionally, a strong absorptionappears at 541 cm�1 in the GTSH4-300 spectrum, and thebroad absorptions at 468 and 406 cm�1 in the GTS4 andGTSH4-250 spectra are replaced by a single minimum at445 cm�1. As the dehydroxylation temperature increasesfurther, the minimum at 271 cm�1 seen in the GTS4 andGTSH4-250 spectra is replaced by a 310 cm�1 minimumwith a resultant shift of the emissivity maximum from 326to 371 cm�1. For samples GTSH4-400 and higher anFigure 8. (a) Mossbauer spectra (293 K) of samples
GTSH2-300, MTSH4-400, MTSH4-700, and MTSH5-700.All samples are characterized by the hematite sextet, exceptfor MTSH4-400, which also shows a contribution frommaghemite. For reference, spectra of goethite GTS2,magnetite MTS4, and hematite HMS3 [Morris et al.,1985] are also shown. The vertical dashed lines are locatedat the positions of the outer lines of the hematite sextet.(b) Mossbauer spectra (293 K) for the three natural samplesDUR1, ODH3, and SWAN1. Their spectra are dominatedby the hematite sextet. The relaxed nature of the SWAN1hematite sextet suggests poor crystallinity as also observedin XRD data.
Figure 9. GTSH2 temperature-dependent spectral series.The GTS2 goethite powder and samples that resulted fromheating are shown. Spectra are offset for clarity, and nocontrast enhancement was performed on any of the spectra.
Table 2. Summary of Mossbauer Spectral Parameters for Selected
Synthetic Hematite Samples
Sample IS, mm/s QS, mm/s Bhf, T FWHM(1,6), mm/s
Synthetic Samples (This Study)GTSH2-300 0.37 �0.22 50.8 0.39GTSH3-300 0.38 �0.19 50.7 0.39GTSH4-300 0.38 �0.19 50.7 0.41MTSH4-400a 0.37 �0.20 51.1 0.38MTSH4-700 0.38 �0.19 51.7 0.31MTSH5-700 0.37 �0.21 51.4 0.27
Synthetic Hematite Samples From Morris et al. [1985]HMS3 0.37 �0.22 51.1 0.25HMS12 0.36 �0.22 51.3 0.25HMS14 0.36 �0.22 51.2 0.25
Natural Samples (This Study)DUR1 0.36 �0.19 51.2 0.33ODH3 0.36 �0.19 51.3 0.29SWAN1 0.38 �0.21 51.2 0.55Error 0.01 0.01 0.2 0.02
aMaghemite also present in this spectrum. Derived spectral parametersfor modeled maghemite are IS = 0.28, QS = 0.09, Bhf = 49.3, and FWHM =0.49.
E07003 GLOTCH ET AL.: MARTIAN HEMATITE MINERALIZATION
9 of 18
E07003

absorption at 384 cm�1 appears and becomes more pro-nounced as the temperature of dehydroxylation increases.As seen in the GTSH2 and GTSH3 series, an additionaleffect of the increasing dehydroxylation temperature is thebroadening of the absorption at 541 cm�1. The effect iscomparable to that seen in the other goethite precursorseries.4.5.4. MTSH4 Series[36] Emission spectra of the magnetite precursor MTSH4
series are shown in Figure 12. The MTS4 precursor has anoverall negative slope with decreasing wave numbers withemissivity minima centered at 558 and 343 cm�1. SamplesMTSH4-300 and MTSH4-400 have similar spectra. Modi-fication of the magnetite is seen in the 300 degree and highersamples, as evidenced by the addition of several bands.Strong absorption bands resulting from hematite occur at554, 442, and 301 cm�1. The additional feature at 391 cm�1
is also consistent with hematite. Weak absorptions caused by
the presence of maghemite (confirmed by XRD andMossbauer) occur at 694 and 640 cm�1. The strongabsorptions correspond to hematite, but the additionalminima indicate that at 300� and 400�C, the transition tohematite is still incomplete. Although a weak maghemiteabsorption is present at 694 cm�1, the MTSH4-500 spectrumindicates that this sample is composed largely of hematite.Particularly, the strong absorptions at 442 and 301 cm�1 arebetter defined than in the spectra for the previously describedsamples in this series. The spectra of samples MTSH4-600and MTSH4-700 are very similar, and they mark anothermajor change in the series. The strong absorption bands aremuch broader and flat-bottomed. The emissivity minimashift to 561 and 457 cm�1, and the 318 cm�1 feature is adoublet with emissivity minima occurring at 335 and297 cm�1. The doublet is likely the result of the expressionof both Ekc and E?c emission [Onari et al., 1977]. Thedoublet nature is more pronounced in the MTSH4-700spectrum than in the MTSH4-600 spectrum. Both samplespectra have absorptions at 388 cm�1 resulting from a (100)face emission contribution [Lane et al., 2002].4.5.5. MTSH5 Series[37] Emission spectra of the MTSH5 series are shown in
Figure 13. The MTS5 precursor has an overall negativeslope with major absorption bands at 554 and 350 cm�1 anda shallow local minimum at 441 cm�1. Samples MTSH5-300 and MTSH5-400 have similar spectra. Numerousabsorptions centered at 698, 640, 553, 479, 441, 421,393, 366, 346, 303, and 258 cm�1 occur in both samplespectra, although the depths of some of these minima differbetween the two spectra. The 553 cm�1 absorption resultsfrom the presence of magnetite. By analogy with sampleMTSH4-400, the absorptions at 698 and 640 cm�1 areassigned to maghemite. The other absorptions are tentativelyassigned to maghemite, as the conversion from magnetite tohematite is not complete at this stage of the heating process.The spectrum for the sample heated at 500�C (MTSH5-500)is the first in the series that resembles a hematite spectrum.Emissivity minima occur at 540, 451, and 305 cm�1,and an additional local minimum is present at 383 cm�1.
Figure 10. GTSH3 temperature-dependent spectral series.The GTS3 goethite powder and samples that resulted fromheating are shown. Spectra are offset for clarity, and nocontrast enhancement was performed on any of thespectra.
Figure 11. GTSH4 temperature-dependent spectral series.The GTS4 goethite powder and samples that resulted fromheating are shown. Spectra are offset for clarity, and nocontrast enhancement was performed on any of thespectra.
Figure 12. MTSH4 temperature-dependent spectral series.The MTS4 magnetite powder and samples that resultedfrom heating are shown. Spectra are offset for clarity, andno contrast enhancement was performed on any of thespectra.
E07003 GLOTCH ET AL.: MARTIAN HEMATITE MINERALIZATION
10 of 18
E07003
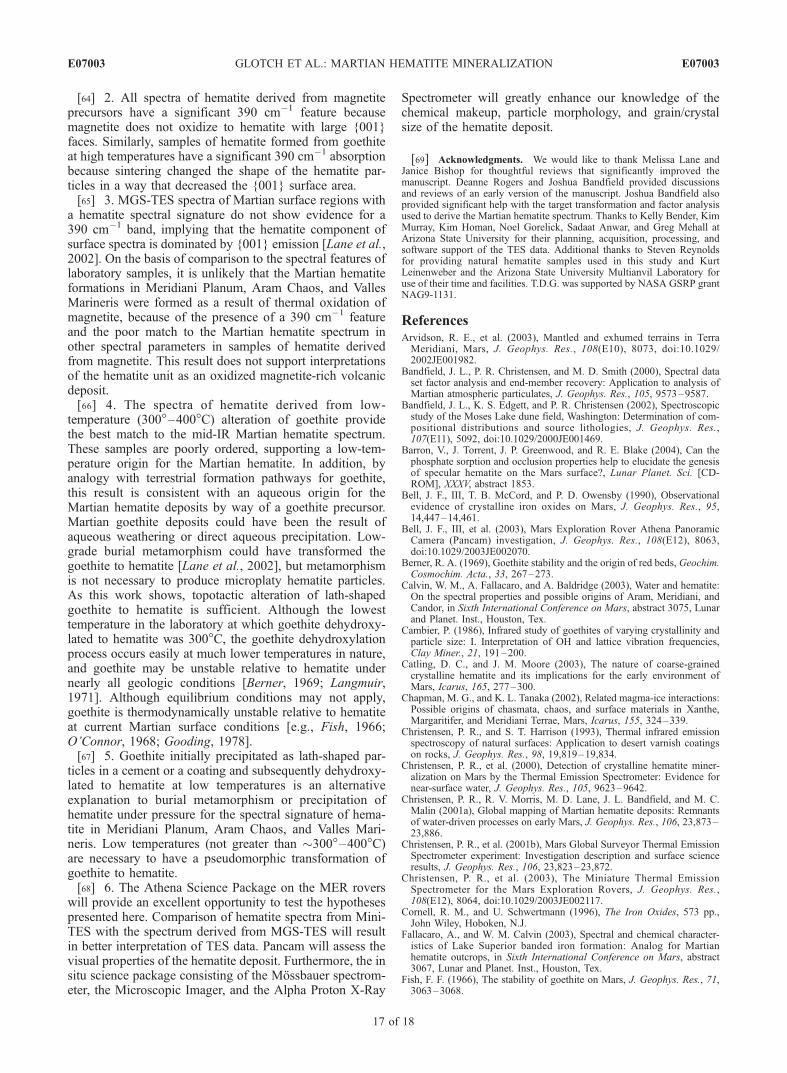
The MTSH5-600 and MTSH5-700 spectra are similar. Thestrongest absorptions are in the same positions as in theMTSH5-500 spectrum, although the local absorption at383 cm�1 becomes more pronounced as the heatingtemperature is increased. The MTSH5-700 spectrum hasan additional minimum at 600 cm�1.4.5.6. Natural Hematite Samples[38] Figure 14a shows emissivity spectra of the three
natural hematite samples described in section 3.1.3. TheDurango hematite sample (DUR1) spectrum has strongabsorption bands at 552, 460, and 312 cm�1, with a localemissivity minimum at 394 cm�1. A striking feature of thisspectrum is the depth of the 552 cm�1 absorption band. Ithas a much lower emissivity than the 460 cm�1 absorption,to a degree not seen in any of the synthetic hematite spectra.[39] The Olympic Dam hematite (ODH3) has emissivity
minima located at 540, 477, and 296 cm�1, and a prominent390 cm�1 feature is present. There are three oscillators inthe 400–530 cm�1 region [Onari et al., 1977], and the
variation in their relative energies between the samples canexplain the minimum being present at 460 cm�1 inthe DUR1 sample and 477 cm�1 in the ODH3 sample.The variation in band intensity is also indicated by thethermal emission spectra of MTSH4-700 and MTSH5-700,which have emissivity minima near 469 and 443 cm�1,respectively. It is also possible that impurities in the ODH3sample are affecting the spectral shape.[40] By contrast, the Swansea hematite (SWAN1) spec-
trum is more similar to spectra of hematite derived from thepseudomorphic low-temperature (300� to 400�C) thermaldecomposition of goethite in terms of band shapes andpositions. It has well-defined emissivity minima at 545,444, and 308 cm�1 and only a barely discernable localemissivity minimum at 391 cm�1.[41] The natural hematite samples have very little struc-
ture in the silicate-dominated 8–12 mm region of thespectrum (Figure 14b), indicating that silicate impuritiesare not likely to be affecting the major hematite bands.
5. Discussion
5.1. Comparison of Martian and SyntheticHematite Thermal Emission Spectra
5.1.1. Comparison to the Martian Hematite Spectrum[42] The thermal emission spectra of the synthetic
hematites were resampled to MGS-TES sample intervalsto permit direct comparison with the Martian hematitespectrum (Figure 15). Spectra are shown between 250 and550 cm�1 to show the spectral region where differences inshape and position of the 300, 450, and 540 cm�1 absorp-tion bands occur. All goethite-derived hematite spectraprovide better matches for the Martian hematite spectrumthan the magnetite-derived hematite spectra. Like the Mar-tian hematite spectrum, the low-temperature (300�–400�C)goethite-derived sample spectra lack a 390 cm�1 feature.This feature is present in the higher-temperature samplespectra, although it is less prominent than in the magnetite-derived sample spectra. The shapes and positions of theabsorption bands of the goethite-derived sample spectra arealso comparable to the Martian hematite spectrum, although
Figure 13. MTSH5 temperature-dependent spectral series.The MTS5 magnetite powder and samples that resultedfrom heating are shown. Spectra are offset for clarity, and nocontrast enhancement was performed on any of the spectra.
Figure 14. Spectra of Martian target-transformation derived hematite, laboratory sample GTSH2-300,and several natural hematite hand samples. (a) Laboratory and natural specimens are resampled to TES10 cm�1 sampling and offset for clarity. (b) The natural sample spectra have very little structure in the 8–12 mm range, indicating that spectra are of nearly pure hematite.
E07003 GLOTCH ET AL.: MARTIAN HEMATITE MINERALIZATION
11 of 18
E07003

the depth of the 300 cm�1 absorption tends to increasefor the higher-temperature sample spectra, causing a decreasein the quality of the fit to the Martian hematite spectrum.[43] Eachmagnetite-derived sample spectrum (Figures 15d
and 15e) deviates significantly from the Martian hematitespectrum. Large differences are apparent in absorption bandpositions, shapes, and relative emissivities. Specifically,each magnetite-derived sample spectrum has a prominent390 cm�1 feature, and in some cases the 300 cm�1
emissivity minimum is replaced by a doublet. In general,the MTSH5 series provides slightly better fits to the Martian
spectrum than the MTSH4 series. This may be attributableto the fact that the MTS5 magnetite precursor was originallygoethite. Additionally, crystal size differences between theMTS4 and MTS5 series and maghemite impurities in theMTS5 series may contribute to spectral differences betweenthe two series. Each spectrum of the series has a prominent390 cm�1 absorption, and especially at the higher temper-atures, the band shapes are poor fits for the Martian hematitespectrum.[44] Series GTSH2, and in particular sample GTSH2-300,
provides the overall best fit for the Martian hematite
Figure 15. Spectra of the Martian target transformation derived hematite and laboratory hematitesresampled to TES 10 cm�1 sampling. The Martian hematite spectrum is the top spectrum in each plot.Spectra are offset for clarity. (a) Comparison of the GTSH2, (b) GTSH3, (c) GTSH4, (d) MTSH4, and(e) MTSH5 hematite series with the Martian hematite spectrum. GTSH2-300 is the best overall fit for theMartian hematite.
E07003 GLOTCH ET AL.: MARTIAN HEMATITE MINERALIZATION
12 of 18
E07003

spectrum. Each of these samples lacks a 390 cm�1 feature,and the 540 cm�1 emissivity minimum in each spectrum ishigher than that of the 450 cm�1 minimum. This is the casefor the Martian hematite spectrum, but not for the othergoethite-derived series or the magnetite derived series.[45] The lack of a 390 cm�1 feature in the spectra of
hematites derived topotaxially from goethite at the lowestdecomposition temperatures indicates that the total-samplethermal emission is dominated by the {001} faces ofhematite particles [Onari et al., 1977; Querry, 1985; Laneet al., 2002]. Lane et al. [2002] interpret this characteristicas evidence for microplaty hematite particles on Marsbecause this morphology has very large {001} faces. Ourdata show that an alternate interpretation is that the hematiteparticles are lath shaped, as occurs when hematite is derivedfrom the dehydroxylation of goethite.5.1.2. Measurement of Spectral Parameters[46] Spectral parameters can be calculated for thermal
emission spectra and used to quantitatively compare theMartian hematite spectrum to those obtained for terrestrialand analog hematite samples (Figure 16). The minimumemissivity value of the 540, 450, and 300 cm�1 absorptionbands were measured. In order to directly compare the bandshapes with the average Martian hematite spectrum, thewidths of the 450 and 300 cm�1 absorption bands weremeasured at 0.85 and 0.71 emissivity (the FWHM valuesfor the average Martian hematite spectrum), respectively, foreach hematite spectrum. The baseline for the FWHMmeasurement was taken from the lower emissivity maxi-mum corresponding to each emissivity minimum. To accu-rately compare the band widths of the spectra, the spectralcontrast of each spectrum was set equal to the value for theMartian hematite spectrum. When the Lane et al. [2002]samples were set to the Martian spectral contrast, theminimum emissivities of the 300 cm�1 bands were above0.71, so these samples are not plotted in the figures thatcontain that parameter. Band width errors are estimated tobe about ±1 cm�1. Errors in band minimum position areestimated to be ±0.1 cm�1, and errors in minimum emis-sivity are estimated to be ±0.001. In addition to themeasured spectral parameters, the spectral root mean squareerror (RMS) between the Martian hematite spectrum, eachsample spectrum (adjusted for contrast), and the five single-crystal (001) face hematite spectra from Lane et al. [2002]was calculated. The RMS values for each sample spectrumand the Lane et al. [2002] spectra are shown in Table 3. Thelower-temperature goethite-derived samples tend to havethe lowest RMS errors, while the single-crystal (001) faceand higher-temperature goethite-derived and magnetite-derived samples have the highest RMS errors.[47] The plots of spectral parameters (Figure 16) show
clear trends in the properties of measured hematite spectrarelative to the Martian hematite spectra based on theirprecursor mineralogy, temperature of formation, and, indi-rectly, crystallinity. In Figure 16a, Martian hematite clusterswith the low-temperature (300�–400�C) goethite-derivedlaboratory hematite samples. The highest-temperaturegoethite-derived samples tend to plot farther away fromthe Martian spectrum than the lower-temperature goethite-derived samples. There is a large scatter in the magnetite-derived hematites, and the Olympic Dam natural hematiteplots far away from the Martian hematite. The Swansea and
Durango hematites fall in between the synthetic magnetite-and goethite-derived hematites. Figure 16b shows a muchtighter cluster among all of the measured samples. TheMartian hematite spectrum plots closest to a singlemagnetite-derived hematite. Otherwise, the goethite-derived hematitesplot closest to the Martian spectrum. Again, there is a largescatter in the magnetite-derived samples. The Swanseahematite plots within the goethite-derived cluster, and theDurango hematite plots closest to a magnetite-derivedhematite, although some high-temperature goethite-derivedhematites are also nearby. Figure 16c shows the largestscatter among all of the samples. The Martian hematite has ahigher e450 cm�1/e300 cm�1 parameter than any measuredsample. The Lane et al. [2002] c face samples have thelowest value of this parameter. There is an overall largerscatter in the positions of the goethite-derived hematites.The Swansea hematite is the natural sample that plotsclosest to the Martian hematite. Magnetite-derived hema-tites and the other natural hematite samples plot far awayfrom the Martian hematite. Figure 16d again shows a tightcluster among the measured samples. The main differencebetween the Lane et al. [2002] c face samples and the othermeasured samples is the low e450 cm�1/e300 cm�1 param-eter, although these samples also have a higher 450 cm�1
band width parameter. In Figure 16e, Martian and SWAN1hematites plot within the trend defined by the low- andhigh-temperature synthetic hematites derived from goethite.Magnetite-derived hematites and the other natural hematitesplot far away from the Martian hematite. In Figure 16fthe Martian and Swansea hematites plot at the low end ofa trend defined by the low- and high-temperature goethite-derived hematites. The magnetite-derived hematitesand the other natural samples plot at the high end ofthis trend because of a generally higher value of thee450 cm�1/e540 cm�1 parameter. The Lane et al. [2002]c face samples plot away from the trend because of highervalues for the 450 cm�1 band width parameter.[48] A general observation from Figure 16 is that the
spectral parameters for the spectra from the hematite derivedpseudomorphically and topotaxially from goethite at lowtemperatures (<400�C) and SWAN1 are the most consis-tently similar to the spectral parameters for the Martianspectrum. For both the Martian surface and these terrestrialsamples, the 390 cm�1 feature is not readily apparent in theemissivity spectra, and the band widths and relative banddepths are comparable, although the Martian hematite spec-trum does have a higher value of the e450 cm�1/e540 cm�1
parameter than any measured sample. Higher-temperature(500�–700�C) goethite-derived sample spectra plot increas-ingly farther away from the Martian hematite spectrum interms of the 450 cm�1 band width parameter. These samplespectra have distinct 390 cm�1 features which have a strongeffect on this parameter.[49] The spectra of the {001} faces of large single crystals
of hematite [Lane et al., 2002], with a few exceptions, plotfar away from the Martian hematite. While these samples areanalogs for theMartian hematite in that they have large {001}faces, and therefore no 390 cm�1 feature, their other spectralparameters are poorer matches for the Martian hematite.A characteristic of the goethite-derived hematite samplesthat are good matches to the Martian hematite spectrumis that they are all finely crystalline (�0.5–2 mm). This may
E07003 GLOTCH ET AL.: MARTIAN HEMATITE MINERALIZATION
13 of 18
E07003

be an important property with regards to the hematite spectralsignature.[50] In only rare cases do spectral parameters for hematites
derived from a synthetic magnetite precursor plot close to the
Martian hematite spectrum. This observation also holds forthe natural sample that has a magnetite precursor (DUR1).The spectral parameters for sample ODH3 are anomalous,except in Figure 16d, where it plots in a cluster with the low-
Figure 16
E07003 GLOTCH ET AL.: MARTIAN HEMATITE MINERALIZATION
14 of 18
E07003

temperature goethite-derived hematites. Both ODH3 andSWAN1 were deposited by hydrothermal solutions, but thelikely differences in the actual depositional environments,and the likelihood that SWAN1 had a goethite precursor,could be responsible for the differences in the spectralparameters of these two samples.[51] In summary, by visual inspection, spectral RMS
calculation, and quantitative spectral parameter analysis,the thermal emission spectra of natural hematite SWAN1and synthetic hematites derived from goethite precursors bythermal dehydroxylation at T � 300�C are the best match tocorresponding Martian hematite spectra. Synthetic sampleGTSH2-300 (goethite GTS2 precursor dehydroxylated at300�C in a pseudomorphic and topotactic transformation)provides the best overall fit. Its cation ordering is poor(XRD and Mossbauer data), and the largest crystal surfaceis the (001) face.
5.2. Implications for Mars
[52] Several lines of evidence presented here indicate thatthe hematite-rich units on Mars were deposited initially in arelatively low temperature aqueous environment, possibly asgoethite, and are in the form of fine-grained cements, coat-ings, and/or massive deposits. The emissivity spectra oflower-temperature (300�–400�C) goethite-derived hematitesamples provide good fits to the Martian hematite spectrum.Infrared spectra of synthetic samples show that blade-shapedhematite samples derived from goethite lack a 390 cm�1
absorption feature, which is also missing from the Martianhematite spectrum. As the temperature of dehydroxylationof goethite to hematite increases, the 390 cm�1 featureappears and becomes more prominent. TEM photomicro-graphs show that the cause of this is growth of hematitecrystals in random orientations. As sintering and recrystal-lization occur, the hematite {001} faces contribute less to theinfrared spectrum, leading to the presence of the 390 cm�1
band. Both here and in Lane et al. [2002], the absence of the390 cm�1 band is taken to imply that emission is dominatedby {001} face emission from hematite.[53] Of the natural hematite samples studied, the black
hematite on sample SWAN1 provides the best thermalinfrared spectral fit to the Martian hematite. The XRDpattern of this sample contains a small goethite peak andsome broad hematite lines like those seen in synthetichematite produced from goethite at temperatures below600�C. The presence of both the goethite peak and the broadhematite lines indicates that the SWAN1 hematite sample isconsistent with a goethite precursor mineralogy. Note thatthe Mossbauer and XRD spectra are applicable to the rind,because they were obtained on powders of bulk sample.[54] In terms of band shapes, positions, and relative
emissivities, infrared spectra of magnetite-derived hematite
(both synthetic and natural) provide poor fits for the Martianhematite spectrum. Every magnetite-derived hematite sam-ple spectrum has a strong 390 cm�1 absorption band notpresent in the Martian spectrum. TEM diffraction patternsindicate that emission from these samples is not dominatedby the crystallographic {001} face. These data do notsupport previous suggestions [Christensen et al., 2000;Hynek et al., 2002; Chapman and Tanaka, 2002; Arvidsonet al., 2003] that the Martian crystalline hematite depositsare formed by water-free thermal oxidation of a magnetite-rich ash or lava.[55] Christensen et al. [2000, 2001a] argued that hematite
like that in Meridiani Planum was coarsely crystalline withdiscrete particles having diameters greater than �10 mm. Atsmaller diameters the hematite becomes red in color [Laneet al., 1999] and therefore not compatible with VNIRobservations of the region. Because coarse-particulatehematite has a much greater spectral contrast than fine-particulate hematite in thermal emission spectra of pure
Figure 16. Hematite spectral parameters plotted against each other to quantitatively show how the laboratory and naturalhematite samples compare to the Martian hematite spectrum. (a) 300 cm�1 FWHM band width plotted against the 450 cm�1
FWHM band width. (b) Ratio of the 450 cm�1 and 300 cm�1 band minimum emissivities plotted against the 300 cm�1
FWHM band width. (c) Ratio of the 450 cm�1 and 300 cm�1 band minimum emissivities plotted against the ratio of the450 cm�1 and 540 cm�1 band minimum emissivities. (d) Ratio of the 450 cm�1 and 300 cm�1 band minimum emissivitiesplotted against the 450 cm�1 band width. (e) Ratio of the 450 cm�1 and 540 cm�1 band minimum emissivities plottedagainst the 300 cm�1 band width. (f ) Ratio of the 450 cm�1 and 540 cm�1 band minimum emissivities plotted against the450 cm�1 band width.
Table 3. Spectral RMS Error of Hematite Samples Deconvolved
With the Martian Hematite Spectrum
Sample RMS, %
This StudyGTSH2-300 1.56GTSH4-300 1.56GTSH2-500 1.75SWAN1 1.76GTSH2-600 1.83MTSH4-500 1.87GTSH3-300 1.88GTSH4-500 1.88GTSH3-600 1.89GTSH2-700 1.92MTSH5-500 1.92GTSH4-600 1.96GTSH3-500 1.98MTSH5-700 2.11GTSH2-400 2.19MTSH4-600 2.22GTSH4-400 2.26GTSH3-400 2.33MTSH5-600 2.34MTSH4-700 2.36GTSH4-700 2.44ODH3 2.44DUR1 2.50GTSH3-700 2.56MTSH4-400 2.77
Lane et al. [2002] Single-Crystal c Face SamplesHMRUS1 3.28HMMG3 3.76HMMG1 4.02HMBB1 4.27HMBME2 4.50
E07003 GLOTCH ET AL.: MARTIAN HEMATITE MINERALIZATION
15 of 18
E07003

phases, deconvolution algorithms model the Martian hema-tite regions as roughly 10% coarse-particulate hematite or60–70% fine-particulate, unpacked red hematite. Becausehaving such a large amount of fine-particulate red hematiteover areas as large as the deposits in Meridiani Planum andAram Chaos was judged geologically unlikely and notcompatible with the VNIR data [Singer et al., 1979;McCord et al., 1982; Bell et al., 1990; Mustard and Bell,1994; Murchie et al., 2000], the coarse-particulate hematitewas the preferred conclusion. The synthetic samples in thisstudy are all red hematites, and even the ‘‘gray’’ naturalsamples exhibit a weak red spectral signature in the VNIR.For these samples to be consistent with the Martian hema-tite, either an additional stage of alteration (e.g., burialmetamorphism [Lane et al., 2002]) is required to makespectrally neutral hematite or the red VNIR spectral signa-ture must be masked by other phases. Because the naturalsamples have a weak VNIR spectral signature, the latteralternative is more likely for the natural than the syntheticsamples. Alternatively, precursor goethite on Mars couldhave been coarser than the material used in our study.[56] Lane et al. [2002] further showed that the Martian
hematite emissivity spectrum is consistent with emissiondominated by the {001} faces of hematite because no390 cm�1 absorption feature is present. All hematite sam-ples used in their study that exhibited a Martian-like naturewere very coarsely crystalline and had large {001} facesrelative to their {100} faces because of microplaty-shapedparticles. While these samples [Lane et al., 2002, Figure 11]accurately reproduce the Martian hematite spectrum near390 cm�1, the shapes and positions of the major absorptionsat 300 and 540 cm�1 are less similar than our low-temperature goethite-derived hematite samples to those seenin the Martian hematite spectra.[57] Like the samples discussed by Lane et al. [2002], the
low-temperature goethite-derived hematite samples pre-sented here have large {001} faces. These samples alsoaccurately reproduce the shapes and positions of majorabsorption bands at 300, 450, and 540 cm�1. These sam-ples, like those discussed by Kirkland et al. [2004], consistof particles that are significantly smaller than the 10 mmcoarse hematite. The spectra of the ‘‘fine intimate’’ hematitecoatings discussed by Kirkland et al. [2004], however, donot accurately reproduce the relative spectral depths be-tween the major hematite spectral bands that are seen in theaverage Martian hematite spectrum. Specifically, the factthat the hematite coating 540 cm�1 band has a loweremissivity than the 450 cm�1 band is inconsistent withthe average Martian hematite spectrum. Our work hasshown this parameter to be important in identifying possibleanalogs to the Martian hematite.[58] Higher-temperature synthetic hematite samples and
natural coarsely particulate (>10 mm) samples presentedhere do not provide the same high-quality match to theMartian hematite emissivity spectrum over the range offeatures discussed. It is important to note, however, that thesynthetic samples discussed here have crystal sizes (0.5–2 mm) that are still greater by an order of magnitude or morethan nanophase hematite thought to be responsible for thecolor of the Martian dust [Morris et al., 1989, 2000; Morrisand Lauer, 1990; Bell et al., 1990]. In summary, the datapresented here suggest that the Martian hematite is crystal-
line, with crystal sizes on the order of �0.5 to 2 mm thathave large {001} faces. This is consistent with the aqueousdeposition of goethite and later pseudomorphic thermaltransformation at low temperature to hematite.
5.3. MER Instrumental Analysis
[59] The arrival of one of NASA’s Mars ExplorationRovers (MER) and its suite of science instruments to theMeridiani Planum landing site will provide a unique oppor-tunity to ‘‘ground truth’’ remote observations made byMGS-TES and the interpretations thereof with respect tothe presence of hematite and its particle morphology anddegree of crystallinity and purity. While the MGS-TESobservations of the surface made from orbit must excludethe 540–772 cm�1 region because of the 667 cm�1 atmo-spheric CO2 fundamental absorption, the MER Mini-TES[Christensen et al., 2003] will be able to collect data in thisrange because it will be looking through a significantlysmaller atmospheric column. The 540 cm�1 hematite ab-sorption lies in this range, and as shown by our laboratorymeasurements, detailed characterization of this absorptionband will provide additional information concerning themorphology, size, and distribution of Martian hematite andconstrain its formation processes.[60] The MER Mossbauer spectrometer [Klingelhofer et
al., 2003] can detect minor iron oxide phases at much lowerlevels than is possible with Mini-TES. The presence ofgoethite, magnetite, or the other possible precursor minerals(e.g., ferrihydrite and maghemite) would also significantlyconstrain the interpretations of hematite formational mech-anisms. Additionally, the measured Mossbauer parameters(IS, QS, and Bhf) and line shapes and intensities can becompared directly to the laboratory data, providing anothertest of the fidelity of the laboratory samples to the Martianhematite.[61] Pancam will acquire multispectral data (�400–
1000 nm) of the hematite deposit, and the MicroscopicImager (�30 mm/pixel) will provide direct photographicevidence of the particle size and morphology of the hematite[Bell et al., 2003; Herkenhoff et al., 2003]. The accuratedetermination of these parameters will have significantimpact on the interpretation of the TES, Mini-TES, andlaboratory emissivity spectra.
6. Conclusions
[62] Comparison of laboratory hematite spectra with theMartian hematite spectrum has resulted in the followingconclusions:[63] 1. Hematite spectral features vary significantly, and
in a predictable way, with precursor mineralogy, temper-ature of formation, and crystal size (or degree of sinter-ing). The presence and depth of a 390 cm�1 feature, aswell as the width and relative depth of absorptions at 450and 540 cm�1, vary among the samples studied. Samplesthat have predominantly {001} face emission, whichincludes the lath-shaped hematite particles formed atlow dehydroxylation temperatures from goethite (thisstudy) and microplaty hematite particles formed by heat-ing of iron oxides or hydroxides under high pressures[Lane et al., 2002], show no 390 cm�1 absorption inthermal emission spectra.
E07003 GLOTCH ET AL.: MARTIAN HEMATITE MINERALIZATION
16 of 18
E07003
[64] 2. All spectra of hematite derived from magnetiteprecursors have a significant 390 cm�1 feature becausemagnetite does not oxidize to hematite with large {001}faces. Similarly, samples of hematite formed from goethiteat high temperatures have a significant 390 cm�1 absorptionbecause sintering changed the shape of the hematite par-ticles in a way that decreased the {001} surface area.[65] 3. MGS-TES spectra of Martian surface regions with
a hematite spectral signature do not show evidence for a390 cm�1 band, implying that the hematite component ofsurface spectra is dominated by {001} emission [Lane et al.,2002]. On the basis of comparison to the spectral features oflaboratory samples, it is unlikely that the Martian hematiteformations in Meridiani Planum, Aram Chaos, and VallesMarineris were formed as a result of thermal oxidation ofmagnetite, because of the presence of a 390 cm�1 featureand the poor match to the Martian hematite spectrum inother spectral parameters in samples of hematite derivedfrom magnetite. This result does not support interpretationsof the hematite unit as an oxidized magnetite-rich volcanicdeposit.[66] 4. The spectra of hematite derived from low-
temperature (300�–400�C) alteration of goethite providethe best match to the mid-IR Martian hematite spectrum.These samples are poorly ordered, supporting a low-tem-perature origin for the Martian hematite. In addition, byanalogy with terrestrial formation pathways for goethite,this result is consistent with an aqueous origin for theMartian hematite deposits by way of a goethite precursor.Martian goethite deposits could have been the result ofaqueous weathering or direct aqueous precipitation. Low-grade burial metamorphism could have transformed thegoethite to hematite [Lane et al., 2002], but metamorphismis not necessary to produce microplaty hematite particles.As this work shows, topotactic alteration of lath-shapedgoethite to hematite is sufficient. Although the lowesttemperature in the laboratory at which goethite dehydroxy-lated to hematite was 300�C, the goethite dehydroxylationprocess occurs easily at much lower temperatures in nature,and goethite may be unstable relative to hematite undernearly all geologic conditions [Berner, 1969; Langmuir,1971]. Although equilibrium conditions may not apply,goethite is thermodynamically unstable relative to hematiteat current Martian surface conditions [e.g., Fish, 1966;O’Connor, 1968; Gooding, 1978].[67] 5. Goethite initially precipitated as lath-shaped par-
ticles in a cement or a coating and subsequently dehydroxy-lated to hematite at low temperatures is an alternativeexplanation to burial metamorphism or precipitation ofhematite under pressure for the spectral signature of hema-tite in Meridiani Planum, Aram Chaos, and Valles Mari-neris. Low temperatures (not greater than �300�–400�C)are necessary to have a pseudomorphic transformation ofgoethite to hematite.[68] 6. The Athena Science Package on the MER rovers
will provide an excellent opportunity to test the hypothesespresented here. Comparison of hematite spectra from Mini-TES with the spectrum derived from MGS-TES will resultin better interpretation of TES data. Pancam will assess thevisual properties of the hematite deposit. Furthermore, the insitu science package consisting of the Mossbauer spectrom-eter, the Microscopic Imager, and the Alpha Proton X-Ray
Spectrometer will greatly enhance our knowledge of thechemical makeup, particle morphology, and grain/crystalsize of the hematite deposit.
[69] Acknowledgments. We would like to thank Melissa Lane andJanice Bishop for thoughtful reviews that significantly improved themanuscript. Deanne Rogers and Joshua Bandfield provided discussionsand reviews of an early version of the manuscript. Joshua Bandfield alsoprovided significant help with the target transformation and factor analysisused to derive the Martian hematite spectrum. Thanks to Kelly Bender, KimMurray, Kim Homan, Noel Gorelick, Sadaat Anwar, and Greg Mehall atArizona State University for their planning, acquisition, processing, andsoftware support of the TES data. Additional thanks to Steven Reynoldsfor providing natural hematite samples used in this study and KurtLeinenweber and the Arizona State University Multianvil Laboratory foruse of their time and facilities. T.D.G. was supported by NASA GSRP grantNAG9-1131.
ReferencesArvidson, R. E., et al. (2003), Mantled and exhumed terrains in TerraMeridiani, Mars, J. Geophys. Res., 108(E10), 8073, doi:10.1029/2002JE001982.
Bandfield, J. L., P. R. Christensen, and M. D. Smith (2000), Spectral dataset factor analysis and end-member recovery: Application to analysis ofMartian atmospheric particulates, J. Geophys. Res., 105, 9573–9587.
Bandfield, J. L., K. S. Edgett, and P. R. Christensen (2002), Spectroscopicstudy of the Moses Lake dune field, Washington: Determination of com-positional distributions and source lithologies, J. Geophys. Res.,107(E11), 5092, doi:10.1029/2000JE001469.
Barron, V., J. Torrent, J. P. Greenwood, and R. E. Blake (2004), Can thephosphate sorption and occlusion properties help to elucidate the genesisof specular hematite on the Mars surface?, Lunar Planet. Sci. [CD-ROM], XXXV, abstract 1853.
Bell, J. F., III, T. B. McCord, and P. D. Owensby (1990), Observationalevidence of crystalline iron oxides on Mars, J. Geophys. Res., 95,14,447–14,461.
Bell, J. F., III, et al. (2003), Mars Exploration Rover Athena PanoramicCamera (Pancam) investigation, J. Geophys. Res., 108(E12), 8063,doi:10.1029/2003JE002070.
Berner, R. A. (1969), Goethite stability and the origin of red beds, Geochim.Cosmochim. Acta., 33, 267–273.
Calvin, W. M., A. Fallacaro, and A. Baldridge (2003), Water and hematite:On the spectral properties and possible origins of Aram, Meridiani, andCandor, in Sixth International Conference on Mars, abstract 3075, Lunarand Planet. Inst., Houston, Tex.
Cambier, P. (1986), Infrared study of goethites of varying crystallinity andparticle size: I. Interpretation of OH and lattice vibration frequencies,Clay Miner., 21, 191–200.
Catling, D. C., and J. M. Moore (2003), The nature of coarse-grainedcrystalline hematite and its implications for the early environment ofMars, Icarus, 165, 277–300.
Chapman, M. G., and K. L. Tanaka (2002), Related magma-ice interactions:Possible origins of chasmata, chaos, and surface materials in Xanthe,Margaritifer, and Meridiani Terrae, Mars, Icarus, 155, 324–339.
Christensen, P. R., and S. T. Harrison (1993), Thermal infrared emissionspectroscopy of natural surfaces: Application to desert varnish coatingson rocks, J. Geophys. Res., 98, 19,819–19,834.
Christensen, P. R., et al. (2000), Detection of crystalline hematite miner-alization on Mars by the Thermal Emission Spectrometer: Evidence fornear-surface water, J. Geophys. Res., 105, 9623–9642.
Christensen, P. R., R. V. Morris, M. D. Lane, J. L. Bandfield, and M. C.Malin (2001a), Global mapping of Martian hematite deposits: Remnantsof water-driven processes on early Mars, J. Geophys. Res., 106, 23,873–23,886.
Christensen, P. R., et al. (2001b), Mars Global Surveyor Thermal EmissionSpectrometer experiment: Investigation description and surface scienceresults, J. Geophys. Res., 106, 23,823–23,872.
Christensen, P. R., et al. (2003), The Miniature Thermal EmissionSpectrometer for the Mars Exploration Rovers, J. Geophys. Res.,108(E12), 8064, doi:10.1029/2003JE002117.
Cornell, R. M., and U. Schwertmann (1996), The Iron Oxides, 573 pp.,John Wiley, Hoboken, N.J.
Fallacaro, A., and W. M. Calvin (2003), Spectral and chemical character-istics of Lake Superior banded iron formation: Analog for Martianhematite outcrops, in Sixth International Conference on Mars, abstract3067, Lunar and Planet. Inst., Houston, Tex.
Fish, F. F. (1966), The stability of goethite on Mars, J. Geophys. Res., 71,3063–3068.
E07003 GLOTCH ET AL.: MARTIAN HEMATITE MINERALIZATION
17 of 18
E07003

Gooding, J. L. (1978), Chemical weathering on Mars, Icarus, 33, 483–513.Greenwood, J. P., R. E. Blake, V. Barron, and J. Torrent (2004), P/Fe as anaquamarker for Mars, Lunar Planet. Sci. [CD-ROM], XXXV, abstract1839.
Haynes, D. W., K. C. Cross, R. T. Bills, and M. H. Reed (1995), OlympicDam ore genesis: A fluid mixing model, Econ Geol., 90, 281–307.
Herkenhoff, K. E., et al. (2003), Athena Microscopic Imager Investigation,J. Geophys. Res., 108(E12), 8065, doi:10.1029/2003JE002076.
Hynek, B. M., R. E. Arvidson, and R. J. Phillips (2002), Geologic settingand origin of Terra Meridiani hematite deposit on Mars, J. Geophys. Res.,107(E10), 5088, doi:10.1029/2002JE001891.
Johnson, J. R., P. G. Lucey, K. A. Horton, and E. M. Winter (1998),Infrared measurements of pristine and disturbed soils 1. Spectral contrastdifferences between field and laboratory data, Remote Sens. Environ., 64,34–46.
Kirkland, L. E., K. C. Herr, and P. M. Adams (2004), A different perspec-tive for the Mars rover ‘‘Opportunity’’ site: Fine-grained, consolidatedhematite and hematite coatings, Geophys. Res. Lett., 31, L05704,doi:10.1029/2003GL019284.
Klingelhofer, G., et al. (2003), Athena MIMOS II Mossbauer spectrometerinvestigation, J. Geophys. Res., 108(E12), 8067, doi:10.1029/2003JE002138.
Lane, M. D., R. V. Morris, and P. R. Christensen (1999), The spectralbehavior of hematite at visible/near infrared and midinfrared wave-lengths, in Fifth International Conference on Mars, LPI Contrib. 972,abstract 6085, Lunar and Planet. Sci., Houston, Tex.
Lane, M. D., R. V. Morris, S. A. Mertzman, and P. R. Christensen (2002),Evidence for platy hematite grains in Sinus Meridiani, Mars, J. Geophys.Res., 107(E12), 5126, doi:10.1029/2001JE001832.
Langmuir, D. (1971), Particle size effect on the reaction goethite =hematite + water, Am. J. Sci., 271, 147–156.
Lyons, J. I. (1988), Volcanogenic iron oxide deposits, Cerro de Mercadoand vicinity, Durango, Mexico, Econ. Geol., 83, 1886–1906.
McCord, T. B., R. N. Clark, and R. B. Singer (1982), Mars: Near-infraredspectral reflectance of surface regions and compositional implications,J. Geophys. Res., 87, 3021–3032.
Morris, R. V., and H. V. Lauer Jr. (1981), Stability of goethite (a-FeOOH)and lepidocrocite (g-FeOOH) to dehydration by UV radiation: Implica-tions for their occurrence on the Martian surface, J. Geophys. Res., 86,10,893–10,899.
Morris, R. V., and H. V. Lauer Jr. (1990), Matrix effects for reflectivityspectra of dispersed nanophase (superparamagnetic) hematite with appli-cation to Martian spectral data, J. Geophys. Res., 95, 5101–5109.
Morris, R. V., H. V. Lauer Jr., C. A. Lawson, E. K. Gibson Jr., G. A. Nace,and C. S. Stewart (1985), Spectral and other physiochemical properties ofsubmicron powders of hematite (a-Fe2O3), maghemite (g-Fe2O3), mag-netite (Fe3O4), goethite (a-FeOOH), and Lepidocrocite (g-FeOOH),J. Geophys. Res., 90, 3126–3144.
Morris, R. V., D. G. Argresti, H. V. Lauer Jr., J. A. Newcomb, T. D.Shelfer, and A. V. Murali (1989), Evidence for pigmentary hematiteon Mars based on optical, magnetic, and Mossbauer studies of super-paramagnetic (nanocrystalline) hematite, J. Geophys. Res., 94, 2760–2778.
Morris, R. V., et al. (2000), Mineralogy, composition, and alteration of MarsPathfinder rocks and soils: Evidence from multispectral, elemental, andmagnetic data on terrestrial analogue, SNC meteorite, and Pathfindersamples, J. Geophys. Res., 105, 1757–1817.
Murchie, S., L. Kirkland, S. Erard, J. Mustard, and M. Robinson (2000),Near-infrared spectral variations of Martian surface materials from ISMimaging spectrometer data, Icarus, 147, 444–471.
Mustard, J. F., and J. F. Bell III (1994), New composite reflectance spectraof Mars from 0.4 to 3.14 mm, Geophys. Res. Lett., 21, 353–356.
O’Connor, J. T. (1968), Mineral stability at the Martian surface, J. Geophys.Res., 73, 5301–5311.
Onari, S., T. Arai, and K. Kudo (1977), Infrared lattice vibrations anddielectric dispersion in a-Fe2O3, Phys. Rev. B, 16, 1717–1721.
Oreskes, N., and M. T. Einaudi (1992), Origin of hydrothermal fluids atOlympic Dam: Preliminary results from fluid inclusions and stable iso-topes, Econ. Geol., 87, 64–90.
Querry, M. R. (1985), Optical Constants, contractor report, U.S. ArmyChem. Res. and Dev. Eng. Cent., Aberdeen Proving Ground, Md.
Rendon, J. L., and C. J. Serna (1981), IR spectra of powder hematite:Effects of particle size and shape, Clay Miner., 16, 375–381.
Roddy, M. S., S. J. Reynolds, B. M. Smith, and J. Ruiz (1988), K-meta-somatism and detachment-related mineralization, Harcuvar Mountains,Arizona; with Suppl. Data 88-22, Geol. Soc. Am. Bull., 100, 1627–1639.
Ruff, S. W., P. R. Christensen, P. W. Barbera, and D. L. Anderson (1997),Quantitative thermal emission spectroscopy of minerals: A laboratorytechnique for measurement and calibration, J. Geophys. Res., 102,14,899–14,913.
Salisbury, J. W., and A. E. Wald (1992), The role of volume scattering inreducing spectral contrast of restrahlen bands in spectra of powderedminerals, Lunar Planet. Sci., XXIII, 1205–1206.
Scott, I. R. (1987), The development of an ore reserve methodology for theOlympic Dam copper-uranium-gold deposit, paper presented at Re-sources Reserves Symposium, Sydney Branch, Australasian Inst. ofMining and Metall., Sydney, Nov.
Singer, R. B., T. B. McCord, R. N. Clark, J. B. Adams, and R. L. Huguenin(1979), Mars surface composition from reflectance spectroscopy: A sum-mary, J. Geophys. Res., 84, 8415–8426.
Spencer, J. E., and J. W. Welty (1989), Geology of mineral deposits in theBuckskin and Rawhide Mountains, Bull. 198, pp. 223–254, Geol. Surv.Branch, Bur. of Geol. and Miner. Technol., State of Ariz., Tucson.
Stevens, J. G., A. Khasanov, J. W. Miller, H. Pollack, and Z. Li (1998),Documentation and evaluation of Mossbauer data for minerals, HyperfineInteract., 117, 71–81.
Wilkins, J., Jr., R. E. Beane, and T. L. Heidrick (1986), Mineralizationrelated to detachment faults: A model, Ariz. Geol. Soc. Digest., 16,108–117.
�����������������������P. R. Christensen, T. D. Glotch, and T. G. Sharp, Department of
Geological Sciences, Arizona State University, Tempe, AZ 85287-6305,USA. ([email protected]; [email protected]; [email protected])R. V. Morris, NASA Johnson Space Center, Code SR, Houston, TX
77058, USA. ([email protected])
E07003 GLOTCH ET AL.: MARTIAN HEMATITE MINERALIZATION
18 of 18
E07003