effect of polishing and glazing on the color and …s-space.snu.ac.kr/bitstream/10371/83761/1/j...
TRANSCRIPT

296
Effect of polishing and glazing on the color and spectral distribution of monolithic zirconia
Hee-Kyung Kim, DDS, MSD, Sung-Hun Kim, DDS, PhD, Jai-Bong Lee*, DDS, MSD, PhD, Jung-Suk Han, DDS, MSD, PhD, In-Sung Yeo, DDS, MSD, PhD Department of Prosthodontics and Dental Research Institute, School of Dentistry, Seoul National University, Seoul, Republic of Korea
PURPOSE. The aim of this study was to evaluate the effect of polishing and glazing on the color and spectral distribution of monolithic zirconia. MATERIALS AND METHODS. Forty-five monolithic zirconia specimens (16.3 mm × 16.4 mm × 2.0 mm) were fabricated and divided into 5 groups according to the number of A2-coloring liquid applications (Group I to V). Each group was divided into 3 subgroups according to the method of surface treatments (n=3): N: no treatment; P: polishing; G: glazing. Color and spectral distribution of five different areas of each specimen were measured according to CIELAB color space in the reflectance mode relative to the standard illuminant D65 on a reflection spectrophotometer. Data were analyzed using one-way ANOVA followed by Tukey’s HSD test, Pearson correlation and regression analysis (α=.05). RESULTS. There was a significant difference in CIE L* between Subgroup N and P, and in CIE b* between Subgroup P and G in each group. Spectral reflectance generally decreased in Subgroup P and G in comparison with Subgroup N. Color differences between Subgroup P and G were within the perceptibility threshold (ΔE*ab< 3.7) in most groups. Highly significant correlation was found between CIE b*and each subgroups as the number of coloring liquid applications increased (R2>0.88, P<.001). CONCLUSION. A perceptible color difference can be detected after polishing of monolithic zirconia. Polishing decreases the lightness, and glazing also decreases the lightness, but increases the yellowness of monolithic zirconia. [ J Adv Prosthodont 2013;5:296-304]
KEY WORDS: Zirconia-based ceramic; Color; Dental polishing; Surface properties
http://dx.doi.org/10.4047/jap.2013.5.3.296http://jap.or.kr J Adv Prosthodont 2013;5:296-304
INTRODUCTION
Metal-ceramic restorations have been introduced since 19621 and has been used widely in fixed dental prostheses for many decades as an esthetic restoration. Further consid-erations to improve esthetics and biocompatibility have led to the use of all-ceramic materials in dentistry.2 However,
brittleness was exhibited as a major drawback with limited clinical use of all-ceramics.3 Since the advent of high strength zirconia in dentistry,4 zirconia-based material com-bined with CAD/CAM technology has broaden the range of their applications in dentistry. Due to its white opaque color, it has to be veneered with feldspathic porcelain for more acceptable esthetic outcome, but cohesive failure of the veneering porcelain have been identified as a main com-plication.5,6 In an attempt to reinforce the veneering porce-lain, several trials, such as high strength CAD/CAM-fabrication of veneering porcelain,7 high strength heat-pressed ceramic,8 and “double veneering” technique,9 have been performed. Other approach to control the veneering failure could be a fabrication of monolithic zirconia which consists of a single zirconia material without any veneering.
To improve the esthetic appearance of ceramic restora-tions, there are two common surface treatment methods, such as polishing and glazing. Sequential polishing proce-dures using various diamond points, rubber wheels, and
Corresponding author: Jai-Bong LeeDepartment of Prosthodontics and Dental Research Institute, School of Dentistry, Seoul National University, 275-1, Yeongeon-dong, Jongno-gu, Seoul, 110-768, Republic of KoreaTel. 82220722661: e-mail, [email protected] April 12, 2013 / Last Revision August 13, 2013 / Accepted August 14, 2013
© 2013 The Korean Academy of ProsthodonticsThis is an Open Access article distributed under the terms of the Creative Commons Attribution Non-Commercial License (http://creativecommons.org/licenses/by-nc/3.0) which permits unrestricted non-commercial use, distribution, and reproduction in any medium, provided the original work is properly cited.

The Journal of Advanced Prosthodontics 297
abrasive pastes may give a luster to the surface.10 Glazing can be created either by firing a small coating of transpar-ent glass onto the surface or by heating the restoration up to glazing temperature for 1 or 2 minutes to get shiny gloss surfaces.10 Several studies11-13 have compared glazing with different polishing techniques for ceramic restorations regarding surface texture. They demonstrated that polishing on feldspathic porcelain could be used as an alternative method for glazing. Other studies14-16 investigated the effect of surface treatments on the color of porcelain restora-tions. According to these studies, surface treatments includ-ing glazing and polishing could affect the color of porcelain restorations.
Monolithic zirconia can be colored in a pre-sintered state to match the adjacent teeth. To achieve a natural look-ing appearance and smooth surface texture, monolithic zir-conia can be either glazed or polished. However, there have been no reported studies that have investigated the effects of surface treatments on the color of monolithic zirconia.
The purpose of this study was to investigate the effect of polishing and glazing on the color and spectral distribu-tion of monolithic zirconia. The null hypothesis to be test-ed was that there was no significant difference in color parameters and spectral reflectance between monolithic zir-conia ceramics with the different surface treatments.
MATERIALS AND METHODS
Monolithic zirconia-based ceramic specimens were used for this study (Table 1). Forty-five square-shaped, pre-sintered zirconia blocks (20.0 mm × 20.0 mm × 2.7 mm) were pre-pared using a cutting machine (618 slicer, Harig, Niles, IL, USA).
The coloring liquid (Table 1) was applied according to the manufacturer’s recommendations with a brush (2850-B, Babara, Kobe, Japan). These specimens were divided into five groups according to the number of coloring liquid applications.
•GroupI:Onetimeof application•GroupII:Twotimesof application•GroupIII:Threetimesof application•GroupIV:Fourtimesof application•GroupV:Fivetimesof application
All specimens were then sintered in a zirconia sintering furnace (LHT 0217, Nabertherm GmbH, Bahnhofstr, Germany). The sintering cycle was controlled as the follow-ings: The temperature was raised to 950℃ for 1.5 hours and maintained for 2 hours, and then raised up to 1,550℃ for 1.5 hours and maintained for 3 hours. After sintering pro-cess, the shrinkage of specimens was circa 20%. The mean size of sintered specimens was 16.3 mm × 16.4 mm, veri-fied with a Vernier caliper (Mitutoyo, Tokyo, Japan).
The grinding procedure was performed on the opposite side of colored surface of each specimen to adjust the final thickness to 2.0 mm by the horizontal grinding machine (HRG-150, AM Technology, Kyunggi-Do, Korea). Final thickness was checked with a digital height gauge (Digimicro ME-50HA, Nikon Corp, Tokyo, Japan) with the accuracy of 1 µm on five different sites (center and each corner of specimen) of each specimen. The specimen thickness ranged from 1.90 mm to 2.02 mm. Nine specimens of each group were assigned to three subgroups according to the surface treatment (n = 3).
•Subgroup*-N(Controlgroup):Notreatment•Subgroup*-P:Polishing•Subgroup*-G:Glazing *: I, II, III, IV or V
In Subgroup P, specimens were polished with a sequence of three diamond-impregnated silicone discs (green: coarse grit, blue: medium-coarse grit and yellow: super-fine grit, Edenta AG, Hauptstrasse, Switzerland) for 60 seconds each. Then, specimens were polished using a felt wheel (Super-Snap Buff,Shofu Inc., Kyoto, Japan) with diamond polishing paste (Legabril Diamond, Metalor Dental AG, Biel/Bienne, Switzerland) for 60 seconds each consecutively. Details of polishing instrument were described in Table 2.
In Subgroup G, specimens were glazed in vacuum in a ceramic furnace (Austromat3001, DEKEMA Dental-Keramiköfen GmbH, Freilassing, Germany) using a glazing paste (IPS e.max Ceram Glaze, Ivoclar Vivadent AG, Schaan, Liechtenstein) (Table 3) for each, following the protocol: The temperature was raised up to 950℃ at the firing rate of 30℃/min, and maintained for 30 seconds, and then cooled down to 300℃ at 15℃/min. Subgroup N indicating no sur-face treatment served as a control. All specimens were
Table 1. Materials investigated in this study
Type Brand name Composition Lot No. Manufacturer
Monolithic zirconia block BruxZirYttria-stabilized tetragonal zirconia
polycrystalB 84942
Glidewell Laboratories, Newport Beach, CA, USA
Coloring liquid Tanaka ZirColor (A2)(R)-p-mentha-1,8-diene, 50-75%
Stoddard solvent, 10-25%50003 Tanaka Dental, Skokie, IL, USA
Effect of polishing and glazing on the color and spectral distribution of monolithic zirconia

298
ultrasonically cleaned in distilled water for 5 minutes before testing.
Colors were measured according to Commission Internationale de l’Eclairage (CIE) 1976 L*a*b* color space (CIELAB) in the reflectance mode relative to the standard i l luminant D65 on a ref lection spectrophotometer (CM-3500d, Minolta, Osaka, Japan), which was equipped with an integrating sphere. Illuminating and viewing config-urations of this instrument were CIE diffuse/8-degree geometry and the 10° CIE 1964 supplementary standard colorimetric observer was selected. The aperture diameter of the measuring port of the spectrophotometer (Target Mask CM-A 121, Minolta, Osaka, Japan) was 3 mm. White calibrating plate (CM-A120, Minolta, Osaka, Japan) was performing for the white calibration standard for reflec-tance measurements, and zero calibration box (CM-A 124, Minolta, Osaka, Japan) was for zero calibration for reflec-tance measurements. CIE L*, a* and b* values were mea-sured over a zero calibrating box (CM-A 124, Minolta, Osaka, Japan, CIE L* = 0.1099, a* = 0.2107 and b* = -0.4292) with specular component excluded (SCE) under ultraviolet light excluded conditions and spectral reflectance over the white background (CM-A120, Minolta, Osaka, Japan, CIE L*= 96.6880, a*= -0.1755 and b*= -0.1236) were measured in the range of visible wavelengths of 400 to 700 nm at 10 nm intervals. All measurements were per-formed on five different areas of each specimen including the center of specimen by moving it to each quadrant
direction slightly.Color coordinates, CIE L*, a* and b*, were determined
from the reflectance data using a computer software (Spectra-Magic version 1.01, Minolta, Osaka, Japan). Average L*, a* and b* values were used to calculate CIE 1976a,b(CIELAB)colordifference,ΔE*ab of each group-set using the following equation.17
ΔE*ab=[(ΔL*)2+(Δa*)2+(Δb*)2]1/2
where, the L* coordinate represents the brightness of an object, the a* value represents the red or green chroma, and the b* value represents the blue or yellow chromas and ΔL*,Δa*andΔb* indicate the differences between the CIE L*, a* and b* color parameters of two specimen groups.
SPSS software (version 20.0, SPSS Inc., Chicago, IL, USA) was used for statistical analyses and the probability levelforstatisticalsignificancewassetatα=.05.Thediffer-ences in the color values were determined by means of one-way analysis of variance (ANOVA) combined with Tukey’s multiple comparison test. The correlation between CIE L*, a* and b* values of each surface treatment and the number of coloring liquid applications was found out by using the Pearson correlation coefficient. The linear regres-sion was fitted to analyze the influences of the number of coloring liquid applications on CIE L*, a* and b* values of each surface treatment.
Table 2. Polishing instrument used
Instruments Lot No. Grit/Contents RPM Manufacturer
CeraGloss 310 HP (Green) P04.002 Coarse grit/ diamond particles 5,000Edenta AG, Hauptstrasse 7,
CH-9434 AU/SG, SwitzerlandCeraGloss 3010 HP (Blue) R09.003 Medium-coarse grit/ diamond particles 5,000
CeraGloss 30010HP (Yellow) T02.001 Super-fine grit/ diamond particles 5,000
Legabril Diamond 08052307 Diamond pasteMetalor Dental AG, Rue de Boujean 122
CH-2501 Biel/Bienne, Switzerland
RPM: Revolutions per minute
Table 3. Glazing material used
Type Brand name Composition (%) Lot No. Manufacturer
Glazing paste IPS e.max Ceram Glaze
SiO2,61.0 - 68.0
R85911 Ivoclar Vivadent AG, Schaan, Liechtenstein
Al2O3, 5.0 - 8.0
Na2O, 5.0 - 8.0
K2O, 5.0 - 8.0
ZnO, 2.0 - 4.0
Other oxides, 3.5 - 17.0
Pigments, 0.0 - 1.0
Glycerine, 20.0 - 25.0
1,3-Butandiol, 15.0 - 20.0
J Adv Prosthodont 2013;5:296-304

The Journal of Advanced Prosthodontics 299
RESULTS
Mean and standard deviation of L*, a* and b* values over a zero calibrating box in the reflectance mode within each group as a function of surface treatment are listed in Table 4. As for L* value, there was a significant difference between Subgroup N and P in each group, and between Subgroup N and G in each group except Group I. There was no significant difference between Subgroup P and G in Group I, III and V. As for a* value, there was a significant difference between Subgroup N and P in Group II, IV and V and between Subgroup P and G in Group IV and V. There was a significant difference between Subgroup N and G except Group V. As for b* value, there was no significant difference between Subgroup N and P in Group II, IV and V. There was a significant difference between Subgroup P and G in each group, and between Subgroup N and G in each group except Group I.
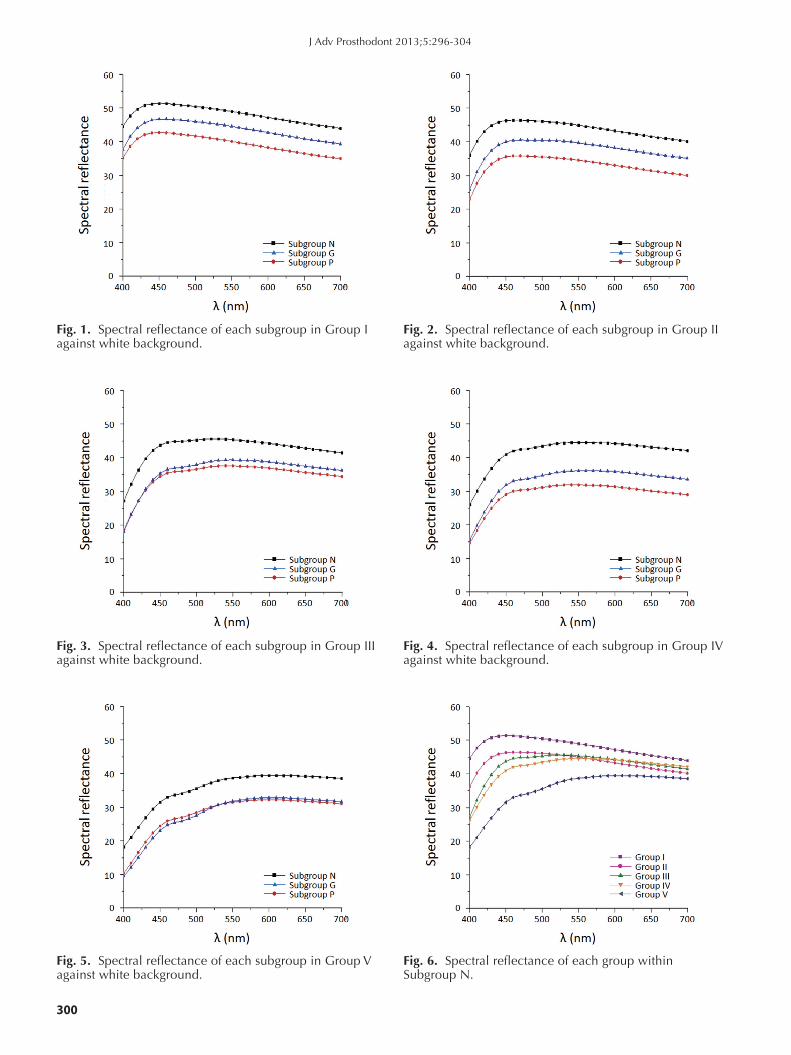
Fig. 1 to Fig. 8 show the spectral reflectance against the white background of specimens within groups. Each sur-face treatment exhibited similar spectral behavior through the entire spectrum in the range of 400 to 700 nm, but the values of spectral reflectance in Subgroup P and G were generally lower than those in Subgroup N (Fig. 1 to Fig. 5). There was no significant difference between Subgroup P and G in Group I, III and V (Fig. 1, Fig. 3 and Fig. 5). There was significant difference between each surface treat-
ment in Group II and IV (Fig. 2 and Fig. 4), representing the highest value in Subgroup N and the lowest value in Subgroup P except for the short wavelengths of circa 400 nm (α=.05). Fig. 6 toFig. 8 presented the spectral reflec-tance of each group within Subgroup N, P and G. There was tendency for gradual decrease of spectral reflectance as the number of coloring liquid applications increased in Subgroup N, P and G especially for the short wavelengths.
Colordifferences (ΔE*ab) between each pair of surface treatments within groups are shown in Table 5. Color dif-ference between Subgroup N and P showed the highest val-ues in comparison with the other pairs of surface treat-mentsfortheentiregrouprangedfrom5.13to9.79ΔE*ab units,which are clinically perceptible (ΔE*ab > 3.7). Color difference between Subgroup N and G was in the range from2.91 to 6.72ΔE*ab units. A perceptible color differ-ence was obtained between Subgroup N and G in Group III, IV and V. Color differences between Subgroup P and G are within the range of perceptibility threshold except Group II. Color differences between each group set in Subgroup N, P and G were shown in Table 6. Color differ-ence between each pair of groups was in the range from1.85 to 13.04 in Subgroup N, from 4.53 to 14.84 in Subgroup P, from 2.48 to 17.55 in Subgroup G, respective-ly. In general, a perceptible color difference was obtained in each group set.
Correlations between the number of coloring liquid
Table 4. Means and standard deviations in parentheses for CIE L*, a* and b* values over a zero calibration box in the reflectance mode within each group as a function of surface treatment
Surface treatmentGroup
I II III IV V
L*
N73.49a 70.49 70.92 71.17 66.37
(3.52) (3.33) (0.41) (2.22) (1.94)
P67.57b 63.35 65.94a 61.42 61.31a
(3.82) (2.47) (2.87) (1.45) (3.07)
G70.61a,b 67.04 66.97a 64.58 61.27a
(4.44) (3.20) (3.64) (2.33) (2.77)
a*
N-1.75c -2.12 -2.68b -2.33 -1.94b
(0.14) (0.20) (0.11) (0.15) (0.28)
P-2.02c,d -2.66a -2.83b,c -3.07 -2.44
(0.29) (0.18) (0.19) (0.15) (0.33)
G-2.10d -2.67a -2.90c -2.90 -2.13b
(0.45) (0.34) (0.21) (0.25) (0.28)
b*
N-2.87e -1.80b 2.03 3.83a 9.10c
(0.75) (0.68) (0.73) (0.73) (1.02)
P-3.65f -1.71b 3.47 3.43a 9.80c
(0.24) (0.73) (1.01) (0.47) (1.51)
G-2.72e -0.61 4.39 5.06 12.13
(0.15) (0.70) (0.70) (0.87) (0.70)
Means with the same superscript letter in each group column are not significantly different from each other based on multiple comparison Tukey’s HSD test (P>.05).
Effect of polishing and glazing on the color and spectral distribution of monolithic zirconia
300
Fig. 1. Spectral reflectance of each subgroup in Group I against white background.
Fig. 2. Spectral reflectance of each subgroup in Group II against white background.
Fig. 3. Spectral reflectance of each subgroup in Group III against white background.
Fig. 4. Spectral reflectance of each subgroup in Group IV against white background.
Fig. 5. Spectral reflectance of each subgroup in Group V against white background.
Fig. 6. Spectral reflectance of each group within Subgroup N.
J Adv Prosthodont 2013;5:296-304

The Journal of Advanced Prosthodontics 301
applications and CIE L*, a* or b* values in each surface treatment were identified. In all subgroups, CIE L* tended to be decreased and CIE b* value tended to be increased as the number of coloring liquid applications increased. There was a significant correlation between the number of color-ing liquid applications and CIE b* value indicating r value to be 0.960 and R2 to be 0.922 in Subgroup N, r value to be 0.948 and R2 to be 0.899 in Subgroup P, and r value to be 0.962 and R2 to be 0.925 in Subgroup G, respectively (Fig. 9). There was a negative correlation between the number of coloring liquid applications and CIE L* value in each sur-face treatment (Fig. 10), whereas no significant correlation was found between the number of coloring liquid applica-tions and CIE a* value (Fig. 11).
Fig. 7. Spectral reflectance of each group within Subgroup P.
Fig. 8. Spectral reflectance of each group within Subgroup G.
Table 6. Color differences between each groupset
Subgroup Group set ΔE*ab
N I-II 3.21
I-III 5.61
I-IV 7.12
I-V 13.94
II-III 3.89
II-IV 5.68
II-V 11.66
III-IV 1.85
III-V 8.45
IV-V 7.14
P I-II 4.70
I-III 7.35
I-IV 9.44
I-V 14.84
II-III 5.80
II-IV 5.51
II-V 11.69
III-IV 4.53
III-V 7.85
IV-V 6.40
G I-II 4.19
I-III 8.03
I-IV 9.87
I-V 17.55
II-III 5.01
II-IV 6.18
II-V 14.00
III-IV 2.48
III-V 9.64
IV-V 7.85
ΔE*abdenotes CIE 1976a,b (CIELAB) color difference.
Table 5. Color differences between each groupset
Group Subgroupset ΔE*ab
I N-P 5.98
N-G 2.91
P-G 3.17
II N-P 7.17
N-G 3.69
P-G 3.85
III N-P 5.19
N-G 4.61
P-G 1.38
IV N-P 9.79
N-G 6.72
P-G 3.56
V N-P 5.13
N-G 5.93
P-G 2.35
ΔE*ab denotes CIE 1976a,b (CIELAB) color difference.
Effect of polishing and glazing on the color and spectral distribution of monolithic zirconia

302
DISCUSSION
This study was aimed to investigate the effect of polishing and glazing on the color and spectral distribution of mono-lithic zirconia. Color can be modified by various optical properties, such as scattering, transmission, absorption, reflection and refraction. Furthermore, surface gloss and fluorescence can also have an effect on color modifica-tions.18 With regards to surface texture, smooth surface could induce more light reflection,18 whereas rough surface could cause the deviation of the reflection of specular component.19 Obregon et al.18 investigated the porcelain samples with different degrees of surface roughness on the color shift. They demonstrated that different surface tex-tures produced significant differences in hue, chroma and value. Value represented the most significant changes fol-lowing the modification of surface texture with the smooth surface increasing the value. In addition, there was a shift in hue toward the yellow-red scale with the highly glazed sur-face. Chung20 evaluated the effect of polishing procedures on the color and surface roughness of resin composite. In his study, polishing procedures produced a decrease in sur-face roughness and an increase in lightness value. Lee et al.19 evaluated the effect of surface conditions on the color of dental resin composites with two different measuring geometries, i.e., specular component included (SCI) and specular component exclude (SCE). They found that CIE L* values increased after polishing with the SCE. In the study of Kim et al.,14 surface topography influenced espe-cially CIE L* value of porcelain specimens. CIE L* value of glazed surface was lower than that of polished surface whereas, CIE a* and b* values increased after glazing. Color
Fig. 9. Linear regression of CIE b* values of each subgroup over a zero calibration box in the reflectance mode as a function of the number of coloring liquid applications.
Fig. 11. Linear regression of CIE a* values of each subgroup over a zero calibration box in the reflectance mode as a function of the number of coloring liquid applications.
Fig. 10. Linear regression of CIE L* values of each subgroup over a zero calibration box in the reflectance mode as a function of the number of coloring liquid applications.
J Adv Prosthodont 2013;5:296-304

The Journal of Advanced Prosthodontics 303
differences between polished and glazed surfaces were clini-callyperceptible(ΔE*ab> 3.7). In the present study, CIE L* values decreased after polishing and glazing. CIE L* values showed the lowest values after polishing even though there were no statistically significant differences between polish-ing and glazing in some groups. For several studies with resin composites19,20 and feldspathic porcelains,14,18 polish-ing or glazing procedures resulted in smooth surfaces which could reflect a greater amount of light than a rough sur-face. As a result of reflection of incident light, lightness value increased.21 On the other hand, in the present study, polishing or glazing decreased lightness value. Light scatter-ing could be an important factor in determining translucen-cy of the material.22 Zirconia is polycrystalline structure which can induce maximum scattering effect.23 Thus, zirco-nia has an opaque appearance to visible light. Based on the results of the present study, surface treatments, such as pol-ishing and glazing, seemed to reduce light scattering of zir-conia surface. Therefore, spectral reflectance decreased after polishing or glazing and lightness value decreased accordingly. Further study should be required to determine whether polishing or glazing procedure affect translucency and opalescence of monolithic zirconia materials.
In the present study, polishing or glazing demonstrated a shift in CIE a* value toward green which is contrary to the previous reports.14,18 There was no statistical difference in CIE a* value between polishing and glazing in Group I, II and III, but polishing showed lower CIE a* value than glazing in Group IV and V. It seemed that there might be a difference in red-green color between glazing and polishing when the number of coloring liquid applications was beyond four times.
In the present study, glazing increased yellowness when the number of coloring liquid applications was beyond two times. Contrary to glazing, polishing exhibited relatively sta-ble yellow-blue color axis. Glazing procedure demonstrated more color deviation which might be related with any chemical breakdown at elevated temperature.18 Additional firing might cause any structural changes of monolithic zir-conia. This needs to be evaluated in further studies. Moreover, the degree of glossiness after glazing can be controlled either by firing time or by the furnace tempera-ture.24 Modification of color after glazing might be differ-ent according to different glazing procedures.
Color differences between no treatment and polishing was higher than between no treatment and glazing. This would be caused by the higher difference of lightness value between no treatment and polishing. This is in accordance with Chung’s study20 which demonstrated that color differ-ence was mainly determined by the lightness rather than the hue and chroma. In the present study, based on the criteri-on of clinically perceptible color difference by Johnston and Kao,25 color differences between no treatment and pol-ishing can be perceived in a clinical setting (ΔE*ab> 3.7). Color difference between no treatment and glazing can also be detectable in a clinical setting. Thus, surface treatment, whether glazing or polishing, could modify the color inter-
pretation. However, there were no perceptible color differ-ences between polishing and glazing in most groups, which means that human eye cannot detect the color difference between these two procedures.
In this study, there were highly significant correlations between CIE b* value and each subgroup as a function of the number of coloring liquid applications. There were neg-ative correlations between CIE L* value and each sub-group, whereas there were no significant correlations between CIE a* value and Subgroup N and G. Hence, the lightness decreased and the yellowness increased as the number of coloring liquid applications increased, and this tendency was not changed even after polishing or glazing procedure.
According to the result of the present study, the null hypothesis could be rejected because there were significant differences in CIE L*, a* or b* value and spectral reflec-tance between different surface treatments.
There are several limitations of this study. Uniform degree of glazing on the specimen surface was difficult to achieve. Uniform application of glazing paste without any void would be a sensitive technique. There might be tem-perature fluctuation inside the furnace. In addition, the aperture diameter of spectrophotometer used in this study was 3 mm and possible edge loss would affect color mea-surement.
For a perfect color match of monolithic zirconia resto-rations, clinicians should take into account the possible col-or deviations after polishing or glazing at the time of shade selection. Furthermore, different shade guides considering any color changes following surface treatments can be help-ful for monolithic zirconia restorations.
CONCLUSION
Within the limitations of this study, the following conclu-sions can be drawn. A perceptible color difference can be detectable after polishing of monolithic zirconia. Polishing decreases the lightness, and glazing also decreases the light-ness, but increases the yellowness of monolithic zirconia. The increased number of coloring liquid applications makes monolithic zirconia darker and more yellowish, which is also applied after polishing or glazing procedure.
REFERENCES
1. Weinstein M, Katz S, Weinstein AB. Fused porcelain-to-metal teeth. US patent No 3052, 982. 1962.
2. Pröbster L, Diehl J. Slip-casting alumina ceramics for crown and bridge restorations. Quintessence Int 1992;23:25-31.
3. Vult von Steyern P, Carlson P, Nilner K. All-ceramic fixed partial dentures designed according to the DC-Zirkon tech-nique. A 2-year clinical study. J Oral Rehabil 2005;32:180-7.
4. Tinschert J, Natt G, Mautsch W, Augthun M, Spiekermann H. Fracture resistance of lithium disilicate-, alumina-, and zirconia-based three-unit fixed partial dentures: a laboratory study. Int J Prosthodont 2001;14:231-8.
Effect of polishing and glazing on the color and spectral distribution of monolithic zirconia
304
5. Al-Amleh B, Lyons K, Swain M. Clinical trials in zirconia: a systematic review. J Oral Rehabil. 2010;37:641-52.
6. Ha SR, Kim SH, Han JS, Yoo SH, Jeong SC, Lee JB, Yeo IS. The influence of various core designs on stress distribution in the veneered zirconia crown: a finite element analysis study. J Adv Prosthodont 2013;5:187-97.
7. Beuer F, Schweiger J, Eichberger M, Kappert HF, Gernet W, Edelhoff D. High-strength CAD/CAM-fabricated veneering material sintered to zirconia copings-a new fabrication mode for all-ceramic restorations. Dent Mater 2009;25:121-8.
8. Aboushelib MN, Kleverlaan CJ, Feilzer AJ. Microtensile bond strength of different components of core veneered all-ce-ramic restorations. Part II: Zirconia veneering ceramics. Dent Mater 2006;22:857-63.
9. Aboushelib MN, Kleverlaan CJ, Feilzer AJ. Microtensile bond strength of different components of core veneered all-ce-ramic restorations. Part 3: double veneer technique. J Prosthodont 2008;17:9-13.
10. Wiskott HWA. Fixed prosthodontics: principles and clinics. London; Quintessence publishing Co. Ltd; 2011. p. 670-1.
11. Klausner LH, Cartwright CB, Charbeneau GT. Polished ver-sus autoglazed porcelain surfaces. J Prosthet Dent 1982;47: 157-62.
12. Brewer JD, Garlapo DA, Chipps EA, Tedesco LA. Clinical discrimination between autoglazed and polished porcelain surfaces. J Prosthet Dent 1990;64:631-4.
13. Scurria MS, Powers JM. Surface roughness of two polished ceramic materials. J Prosthet Dent. 1994;71:174-7.
14. Kim IJ, Lee YK, Lim BS, Kim CW. Effect of surface topog-raphy on the color of dental porcelain. J Mater Sci Mater Med 2003;14:405-9.
15. Sarac D, Sarac YS, Yuzbasioglu E, Bal S. The effects of por-celain polishing systems on the color and surface texture of feldspathic porcelain. J Prosthet Dent 2006;96:122-8.
16. Yilmaz C, Korkmaz T, Demirköprülü H, Ergün G, Ozkan Y. Color stability of glazed and polished dental porcelains. J Prosthodont 2008;17:20-4.
17. Commission Internationale de l’Eclairage (CIE). Colorimetry, CIE 015. 3rd ed. Vienna: CIE Central Bureau; 2004.
18. Obregon A, Goodkind RJ, Schwabacher WB. Effects of opaque and porcelain surface texture on the color of cera-mometal restorations. J Prosthet Dent 1981;46:330-40.
19. Lee YK, Lim BS, Kim CW. Effect of surface conditions on the color of dental resin composites. J Biomed Mater Res 2002;63:657-63.
20. Chung KH. Effects of finishing and polishing procedures on the surface texture of resin composites. Dent Mater 1994;10: 325-30.
21. Knispel G. Factors affecting the process of color matching restorative materials to natural teeth. Quintessence Int 1991; 22:525-31.
22. Heffernan MJ, Aquilino SA, Diaz-Arnold AM, Haselton DR, Stanford CM, Vargas MA. Relative translucency of six all-ce-ramic systems. Part I: core materials. J Prosthet Dent 2002; 88:4-9.
23. Baldissara P, Llukacej A, Ciocca L, Valandro FL, Scotti R. Translucency of zirconia copings made with different CAD/
CAM systems. J Prosthet Dent 2010;104:6-12.24. Rosenstiel SF, Baiker MA, Johnston WM. Comparison of
glazed and polished dental porcelain. Int J Prosthodont 1989; 2:524-9.
25. Johnston WM, Kao EC. Assessment of appearance match by visual observation and clinical colorimetry. J Dent Res 1989; 68:819-22.
J Adv Prosthodont 2013;5:296-304