effect of plasma irradiation on biocompatibility and cell ... · effect of plasma irradiation on...
TRANSCRIPT

Research Article 1(2)146-155 Advanced Materials Proceedings
Copyright © 2016 VBRI Press 146
Effect of plasma irradiation on biocompatibility and cell adhesion of polyaniline / chitosan nanocomposites towards Hep G2 and PBMC cells Ashok Kumar*, Rajiv Borah
Materials Research Laboratory, Department of Physics, Tezpur University, Tezpur, 784028, India
*Corresponding author, E-mail: [email protected]; Tel: (+91) 3712275553
Received: 24 March 2016, Revised: 09 August 2016 and Accepted: 30 August 2016
DOI: 10.5185/amp.2016/206
www.vbripress.com/amp
Abstract
Surface modification of polymeric biomaterials for tissue engineering applications has drawn considerable research
interest. In this work, the surface of polyaniline (PAni) nanofibers/chitosan nanocomposites has been modified by
plasma irradiation technique to improve its biocompatibility. The average diameter of PAni nanofibers determined
by HRTEM is 35.66 nm, whereas FESEM images depict interconnected network of nanofibers dispersed uniformly
throughout the chitosan matrix. XRD patterns of PAni/Chitosan nanocomposites after plasma treatment indicate
increase in amorphous nature. The alterations in surface morphology after plasma treatment have been confirmed
with the help of SEM analysis. The surface chemistry of the samples after plasma treatment has been investigated by
means of ATR-FTIR and contact angle measurements. The ATR-FTIR spectra and surface energy measurements
show incorporation of polar functional groups after oxygen (O2) and nitrogen (N2) plasma treatment. Preliminary
biocompatibility assessments of the plasma treated PAni/Chitosan nanocomposites have been accomplished using
Alamar Blue assay with Hep G2 and Primary peripheral blood mononuclear (PBMC) cells. Both assays show
maximum enhancement in cell viability for O2 and N2 plasma treated samples, comparing to the pristine one,
whereas least cell viability was observed for Ar plasma treated samples. This study depicts that gas plasma treatment
can effectively enhance the bioactivity of PAni/Chitosan nanocomposites and can make them attractive for tissue
engineering applications. Copyright © 2016 VBRI Press.
Keywords: Surface modification, biomaterials, plasma irradiation, biocompatibility, cell viability.
Introduction
Tissue and organ failure, caused due to injury or
other types of damage, is a major challenge in health
care across the world. With the recent advancement
in medical science, there are options for treatment
which include transplantation, surgical repair,
artificial prostheses, mechanical devices and drug
therapy. However, these methods can neither repair
nor recover of a severely damaged tissue or organ in
satisfactory way. Moreover, transplant rejection,
during which the body has an immune response to the
transplanted organ, possibly leading to transplant
failure. A distinctive feature of tissue engineering is
to regenerate patient's own tissues and organs that are
entirely free of poor biocompatibility and low
biofunctionality as well as severe immune rejection
[1-3].
Tissue engineering, which focuses on regeneration
of neotissues from cells with the support of
biomaterials and growth factors, is emerging as a
significant potential alternative or complementary
solution, whereby tissue and organ failure is
addressed by implanting natural, synthetic, or semi
synthetic tissue and organ mimics that are fully
functional from the start, or that grow into the
required functionality. The fundamentals of tissue
engineering involve the cell sources, scaffolds for
cell expansion and differentiation and carriers for
growth factors [1-5]. To fulfill the functions of a
scaffold in tissue engineering, the scaffold should
meet a number of requirements. First, it should be
biocompatible and biodegradable and have
interconnected micropores, so that numerous cells
can be seeded, migrate into the inside, increase the
cell number and should be supplied by sufficient
amounts of nutrients. The absorption kinetics of
scaffold material will profoundly affect the success
rate of tissue engineering [1-5].
The scaffold should mimic the structure and
biological function of native extracellular matrix
(ECM) as much as possible, both in terms of
chemical composition and physical structure [4]. In

Research Article 1(2)146-155 Advanced Materials Proceedings
Copyright © 2016 VBRI Press 147
spite of the amazing diversity of ECM structures
caused by different biomacromolecules and the way
they are organized, a well-known feature of native
ECM is the nanoscaled dimensions of their physical
structure. In a typical connective tissue, structural
protein fibers such as collagen fibers and elastin
fibers have diameters ranging from several ten to
several hundred nanometers. Adhesive proteins such
as fibronectin and laminin, which provide specific
binding site for cell adhesion, also exist as
nanoscaled fibers in ECM [7-8]. The fibers, pores,
ridges, and grooves on the basement membrane are
all nanoscaled, from several to more than 100 nm.
Cells attach to and organize around fibers with
diameters smaller than that of the cells [9].
Nanoscaled surface roughness with dimensions
ranging from 20 to 50 nm produced by chemical
etching on silicon wafers enhanced neural cell
adhesion and hydroxylase activity [10] Nanoscaled
surface topography has also been found to promote
osteoblast adhesions [11]. One study reported that
osteoblast adhesion, proliferation, alkaline
phosphatase activity, and ECM secretion on carbon
nanofibers increased with deceasing fiber diameter in
the range of 60–200 nm, whereas the adhesion of
other kinds of cells such as chondrocytes, fibroblasts,
and smooth muscle cells was not influenced [12].
Polymeric nanofiber nonwoven matrix is among the
most promising biomaterials for native ECM analogs
[13].
Moreover, electroactive biomaterials as scaffolds
allow direct delivery of electrical, electrochemical
and electromechanical stimulation to cells [14].
Regarding the electrical properties of cells, electrical
signals strongly affects cell behavior, affecting ion
influx across the cell membrane, altering the
membrane potential and conditioning the intracellular
signal transduction pathways [15]. Thus, electrical
charges and electrical fields have beneficial healing
effects on various tissues, including bone, cartilage,
skin and connective tissue, cranial and spinal nerves
and peripheral nerves. Conducting polymers (CPs)
allow excellent control of the electrical stimulus,
possess very good electrical and optical properties,
have a high conductivity/weight ratio and can be
made biocompatible, biodegradable and porous [14]
Furthermore, a great advantage of conductive
polymers is that their chemical, electrical and
physical properties can be tailored to the specific
needs of their application by incorporating
antibodies, enzymes and other biological moieties
[14] Thus, strategies designed to enhance the
regeneration of a responsive cell might employ
electrically conducting polymers.
The most important parameter of cell biomaterials
interaction through adsorption of proteins is the
surface hydrophilicity, which in fact allows covalent
attachment of proteins atop materials’ surface and
presents normal bioactivity to the biomolecules
[16,17]. On the other hand, CPs are often considered
as synthetic hydrophobic materials. Therefore, it is
necessary to increase the hydrophilicity of the surface
of CPs. It can be achieved through incorporation of
polar groups like hydroxyl, carboxylic, aldehyde,
amino and sulphate groups atop materials’ surface.
The alteration of the presence and density of polar
groups on the material’s surface can be used to tailor
its wettability and surface free energy and hence to
adjust surface biocompatibility in accordance with
the application [16, 17].
Plasma-surface modification is an effective and
economical technique, applicable for many materials
and of growing interest in the biomaterials field. The
main advantage of plasma modification techniques is
that the surface properties can be enhanced
selectively, while the bulk attributes of the materials
remain unchanged. Plasma based treatments have
been largely used for medical applications with
different aims, such as the introduction of new
functionalities, enhancement of surface wettability,
increase of the surface oxygen concentration and
improvement of the interfacial adhesion [18-21]
Depending on the conditions and the plasma species,
the polymer surface properties such as
hydrophobicity, morphology and the adhesion can be
altered [22]. O2 plasma is often used to impart
oxygen containing functional groups to polymer
surfaces such as PCL, PE and PET [18, 23-26]. N2
plasma has been used to impart amine groups to the
surface of PTFE and PS [18, 27, 28]. Inert gases can
be used to introduce radical sites on the polymer
surface.18
Plasma technique has a major advantage
over the conventional wet chemical process in terms
of reduction of waste and pollution problems and
conservation of chemicals, water, energy, and time.
Polyaniline (PAni) is one of the most mesmerizing
CPs due to its diverse structural forms, ease of
synthesis, high environmental stability and excellent
charge transport property by doping/dedoping
process. However, some serious issues like
biocompatibility, biodegradability including
unexpected side effects of bioactivity are of critical
concern during biomedical application of these
materials. Mattioli-Belmonte et al. were the first to
demonstrate that this polymer is biocompatible in
vitro and in vivo [29]. It has been reported PAni
derivatives were found to be able to function as
biocompatible substrates, upon which both H9c2
cardiac myoblasts and PC-12 pheochromocytoma
cells can adhere, grow and differentiate well [30].
Recently, to overcome the poor biodegradability and
biocompatibility, PAni has been blended with natural
and synthetic biopolymers for various biomedical
applications like tissue engineering [31, 32],
biosensing [33], drug delivery [34] etc.
The subject matter of the present research includes
synthesis and surface modification of bioactive and
biodegradable 1D nanostructured electroactive
conducting polymer based nanocomposites. Based on
the unique ability of CPs to respond to electrical or
electromagnetic stimuli, they can act as an interface
between the external and physiological environments
of a connective tissue such as bone, which is capable
of undergoing repair and regeneration on exposure to

Research Article 1(2)146-155 Advanced Materials Proceedings
Copyright © 2016 VBRI Press 148
the same stimuli [15]. 1D CP nanostructures can be
functionalized through incorporation of polar
functional groups such as carboxyl, amino, hydroxyl
groups onto their surface. Intrinsically biodegradable
biomaterials can also be achieved by blending
conducting polymer nanostructures with natural
biopolymers such as collagen, chitosan and gelatin.
There are only a few reports of proliferation of cancer
cells on PAni based biomaterial so far [35]. and
effect of gas plasma treatment on biocompatibility of
PAni nanofibers/Chitosan nanocomposites has not
been investigated yet. We are attempting here to
modify the surface of PAni nanofibers/Chitosan
nanocomposites by O2, N2 and Ar plasma treatment
to study its effect on biocompatibility towards human
liver hepatocellular carcinoma cell line (Hep G2)
cells and peripheral human blood mononuclear cells
(PBMC). Consequent effect of surface modification
on surface hydrophilicity of the nanocomposites has
been investigated with the help of attenuated total
reflectance fourier transform (ATR-FTIR)
spectroscopy and surface energy calculations using
contact angle measurement along with the chemical
mechanisms of incorporations of polar functionality
after plasma surface modification. The results were
correlated to the improved cell biomaterial
interactions. This research is intended to make an
attempt to explore the potential application oriented
possibilities of surface modified nanostructured
conducting polymer based materials as a scaffold for
cancer cell growth for therapy as an alternative to the
conventional metal based technologies.
Experimental
Materials
Aniline (p.a. Merck Germany, ≥99.5%) was distilled
under reduced pressure before use. Ammonium
peroxydisulfate (p.a. Merck Germany, ≥98%) and
Hydrochloric acid (p.a. Sigma Aldrich, 37% AR
grade) were used without further purification.
Deionised water (12 MΩ cm) used for the synthesis
was obtained from a Milli-Q system. Chitosan
extrapure (p.a. SRL India, ≥99%) were as used as
obtained. Acetic acid (p.a. Sigma Aldrich, ≥99.85%).
All other chemicals and reagents were of analytical
grade and used as received.
Analytical techniques
Transmission electron microscopy was accomplished
using a JEOL JEM 200 CX transmission electron
microscope (TEM) installed at SAIF, NEHU,
Shillong. Morphological characterizations were
carried out using Sigma VP G8 Advanced modeled
scanning electron microscope at IASST, Guwahati,
India before surface modification and JSM 6390LV
JEOL, JAPAN at Department of Physics, Tezpur
University after surface modification. ATR FTIR
spectra were recorded using a Nicolet Impact I-410
Spectrometer, Department of Chemistry, Tezpur
University. Contact angle measurement before and
after plasma treatment were carried out using contact
angle measurement system from Data physics
instrument GmbH, Germany, model OCA 15 EC at
Department of Physics, Tezpur University. Contact
angles of two polar liquids: water and ethylene glycol
and a non-polar liquid: diiodomethane, were
measured using sessile drop method on PAni
nanofibers/Chitosan nanocomposites films before and
after modification at room temperature. Contact angle
data were recorded three times for each liquid and
here, the averages of those have been presented with
S.D. Absorbance data were acquired during Alamar
blue assay using plate reader from Multiskan™ GO,
Thermo Scientific, USA at Department of MBBT,
Tezpur University.
Synthesis of Polyaniline (PAni) nanofibers
PAni nanofibers were synthesized using dilute
polymerization method described by N. R. Chiou
[36]. Briefly solution of 1M HCl (dopant acid) was
prepared and the monomer aniline was dissolved in a
small portion of that solution. Ammonium
peroxydisulfate (oxidizing agent) was dissolved in
the remaining portion of the dopant acid solution.
The initial concentration of aniline in the reaction
mixture was kept at 8 mM and the molar ratio of the
monomer to the oxidant was maintained at 2:1. The
monomer solution was then carefully transferred to
the solution of APS. The reaction was allowed to take
place in a magnetic stirrer at a very slow stirring rate
at room temperature for about 24 h till the whole
mixture became dark green. The whole mixture was
then filtered and washed with deionized water and
methanol for several times. For the purpose of film
preparation, emeraldine base (EB) form of PAni has
been obtained by further washing the mixture by 15%
ammonia solution followed by several times with
deionized water until the filtrate became colorless.
Synthesis of Polyaniline nanofibers/chitosan
nanocomposites
Chitosan solution is prepared in 2 % (v/v) acetic acid
solution. PAni nanofibers is added to chitosan
solution at a concentration of 4% (w/v) and ultra-
sonicated the mixture for one hour. The resultant
solution is then casted on glass slide using a pasteur
pipette and dried at 60°-70°C for 4 hours. After that
films are removed by immersing the glass slides in
water for 5-10 minutes.
Surface modification of Polyaniline (PAni)
nanofibers/chitosan nanocomposites by gas plasma
treatment
Surface modification of PAni nanofibers/Chitosan
nanocomposites by plasma treatment was carried out
in a stainless steel horizontal cylindrical chamber of
30 cm diameter and 100 cm length. The pressure
inside the vacuum chamber is maintained at 1×10⁻³
mbar using a rotary pump and measured by a
Research Article 1(2)146-155 Advanced Materials Proceedings
Copyright © 2016 VBRI Press 149
capacitance manometer. O2, N2 and Ar gases (purity
> 99.9%) are separately fed into the vacuum chamber
through a flat cylindrical gas shower plate and the
flow rate of each gas is monitored by mass flow
controller. The sample is placed on the surface of the
RF electrode and the particular gas (O2, N2 or Ar) is
introduced into the chamber. Uniform and stable
plasma discharge is obtained using an RF generator
(Seren, 0–300 W, USA) that is connected to a water
cooled RF electrode through an L-type matching
network. In the present wok, surface treatment of
PAni nanofibers/Chitosan nanocomposites was
carried out for 5 minutes at RF power value of 5 W
and working pressure of 2×10⁻¹
mbar.
Surface energy calculations
Surface energy parameters including total surface
energy of both the samples were calculated according
to AB method of Van Oss–Chaudhury–Good theory
[23, 37]as this method distinguishes the acid–base
(AB) interactions as a component of the surface free
energy as follows:
(sLW
lLW)
0.5+ (
s+
l−)
0.5+ (
s−
l+)
0.5=
0.5l(1 +
cosθ) (1)
sLW +
sAB =
s (2)
sAB = 2(
s+
s−)
0.5 (3)
where sLW and
lLW =surface energy corresponding
to Lifshitz–Van der Waals forces or dispersive
components of solid and liquid
respectively; s+ and
l+ = Lewis acid components of
solid and liquid respectively; s− and
l− = Lewis base
components of solid and liquid
respectively; sAB =contribution of acid base
interaction also refers to the polar component of solid
surface.
It was performed by using contact angle data of
three probe liquids: water
(LW = 21.8 mNm−1 , + = 25.5 mNm−1, − =25.5 mNm−1 ), ethylene glycol (LW =29 mNm−1 , + = 1.92 mNm−1 , − =47.0 mNm−1 and diiodomethane (LW = 50.8 mNm−1 , + = 0.01 mNm−1 , − = 0).
Results and discussion
Electron microscopy
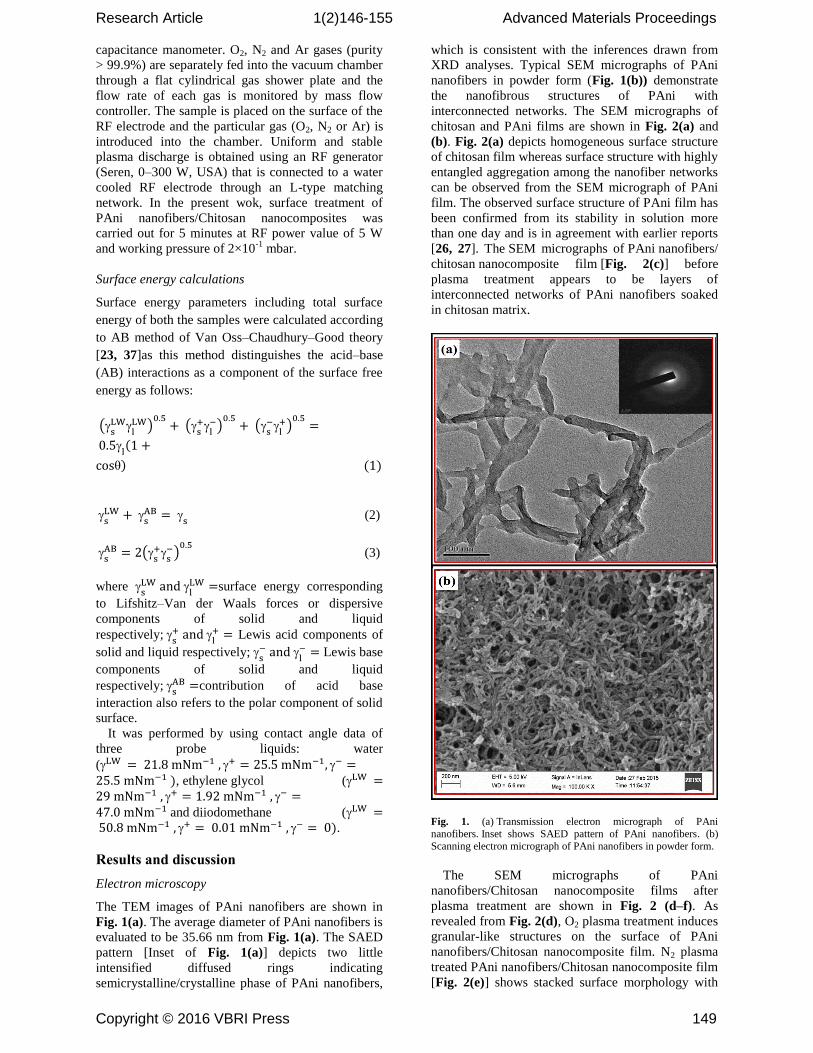
The TEM images of PAni nanofibers are shown in
Fig. 1(a). The average diameter of PAni nanofibers is
evaluated to be 35.66 nm from Fig. 1(a). The SAED
pattern [Inset of Fig. 1(a)] depicts two little
intensified diffused rings indicating
semicrystalline/crystalline phase of PAni nanofibers,
which is consistent with the inferences drawn from
XRD analyses. Typical SEM micrographs of PAni
nanofibers in powder form (Fig. 1(b)) demonstrate
the nanofibrous structures of PAni with
interconnected networks. The SEM micrographs of
chitosan and PAni films are shown in Fig. 2(a) and
(b). Fig. 2(a) depicts homogeneous surface structure
of chitosan film whereas surface structure with highly
entangled aggregation among the nanofiber networks
can be observed from the SEM micrograph of PAni
film. The observed surface structure of PAni film has
been confirmed from its stability in solution more
than one day and is in agreement with earlier reports
[26, 27]. The SEM micrographs of PAni nanofibers/
chitosan nanocomposite film [Fig. 2(c)] before
plasma treatment appears to be layers of
interconnected networks of PAni nanofibers soaked
in chitosan matrix.
Fig. 1. (a) Transmission electron micrograph of PAni
nanofibers. Inset shows SAED pattern of PAni nanofibers. (b)
Scanning electron micrograph of PAni nanofibers in powder form.
The SEM micrographs of PAni
nanofibers/Chitosan nanocomposite films after
plasma treatment are shown in Fig. 2 (d–f). As
revealed from Fig. 2(d), O2 plasma treatment induces
granular-like structures on the surface of PAni
nanofibers/Chitosan nanocomposite film. N2 plasma
treated PAni nanofibers/Chitosan nanocomposite film
[Fig. 2(e)] shows stacked surface morphology with

Research Article 1(2)146-155 Advanced Materials Proceedings
Copyright © 2016 VBRI Press 150
fewer defects than that observed in Fig. 2(d). On the
other hand, stacked surface along with distinct
cavities is observed in Ar plasma treated PAni
nanofibers/Chitosan nanocomposite film [Fig. 2(f)].
The findings thus reveal significant reactive ion
etching on the surface of PAni nanofibers/Chitosan
nanocomposite film induced by O2 and N2 plasma
and dominant sputtering induced by Ar plasma. An
enhanced surface roughness may be considered to
have advantageous influence on cell adhesion and
proliferation, felicitated by surface modification
through plasma etching as well as sputtering [13].
Fig. 2. Scanning electron micrographs of (a) Chitosan, (b) PAni
nanofibers, (c) PAni nanofibers/Chitosan nanocomposites before
plasma treatment and after (d) O2 plasma (e) N2 plasma and (f) Ar plasma treatment.
X-ray diffraction
Fig. 3. XRD patterns of (a) PAni nanofibers/Chitosan
nanocomposites before plasma treatment (black).
Inset shows XRD patterns of Chitosan (black) and
Polyaniline nanofibers (red). (b) Comparison of XRD
pattern of PAni nanofibers/Chitosan nanocomposites
before (black) and after O2 plasma treatment (red), N2
plasma treatment (blue) and Ar plasma treatment
(purple).
The XRD pattern of Cs shown in inset depicts a
broad hump at around 22° indicating amorphous
structure of chitosan [38]. Two peaks at around 20°
and 25° appearing in the XRD pattern of PAni (inset)
are characteristics of its amorphous emeraldine base
form [39]. The XRD pattern of PAni
nanofibers/Chitosan nanocomposites before plasma
treatment shows two peaks at around 20° and 22° that
can be attributed to the regular arrangement within
the nanocomposites through strong intermolecular
hydrogen bonding between amine groups of PAni
and amino/hydroxyl groups of chitosan [38].
Fig. 3. XRD patterns of (a) PAni nanofibers/Chitosan
nanocomposites before plasma treatment (black). Inset shows XRD
patterns of Chitosan (black) and Polyaniline nanofibers (red). (b) Comparison of XRD pattern of PAni nanofibers/Chitosan
nanocomposites before (black) and after O2 plasma treatment (red),
N2 plasma treatment (blue) and Ar plasma treatment (purple).
The broadening of the above peaks in PAni
nanofibers/Chitosan nanocomposites films after
plasma treatment (Fig. 3(b)) can be attributed to
dissociation of the intermolecular hydrogen bonds as
well as dissociation and abstraction of weak bonds,
due to bombardment of energetic ions that are
generated in the plasma. The broadening of the peaks
is more pronounced for the samples treated in O2
plasma than that can be observed for samples treated
in N2 and Ar plasma. A shoulder peak appearing
around 11° in the XRD patterns of PAni
nanofibers/Chitosan nanocomposites after plasma
treatment is originally a characteristic peak
associated with chitosan. The appearance of the peak
may be attributed to formation of some new bonds
leading to growth of new crystalline regions in the
nanocomposites as a result of plasma treatment. The
higher amorphous nature of PAni
Research Article 1(2)146-155 Advanced Materials Proceedings
Copyright © 2016 VBRI Press 151
nanofibers/Chitosan nanocomposites after plasma
treatment can be well corroborated with the results
obtained from SEM analyses.
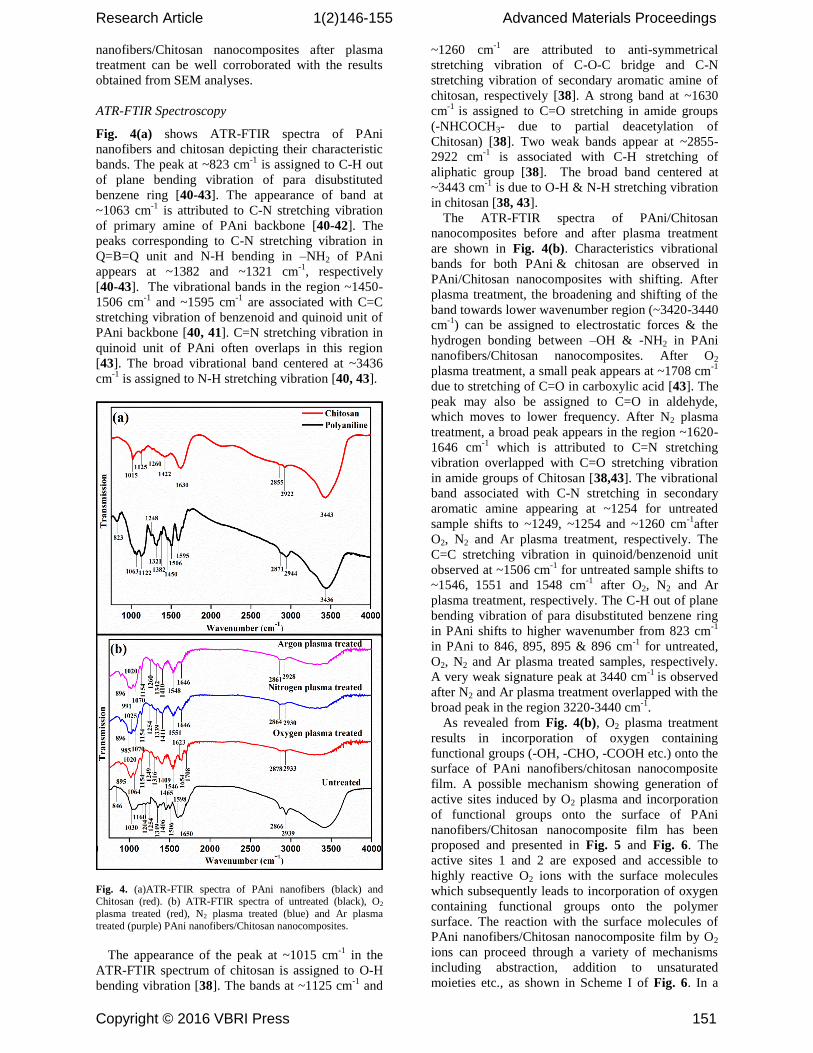
ATR-FTIR Spectroscopy
Fig. 4(a) shows ATR-FTIR spectra of PAni
nanofibers and chitosan depicting their characteristic
bands. The peak at ~823 cm-1
is assigned to C-H out
of plane bending vibration of para disubstituted
benzene ring [40-43]. The appearance of band at
~1063 cm-1
is attributed to C-N stretching vibration
of primary amine of PAni backbone [40-42]. The
peaks corresponding to C-N stretching vibration in
Q=B=Q unit and N-H bending in –NH2 of PAni
appears at ~1382 and ~1321 cm-1
, respectively
[40-43]. The vibrational bands in the region ~1450-
1506 cm-1
and ~1595 cm-1
are associated with C=C
stretching vibration of benzenoid and quinoid unit of
PAni backbone [40, 41]. C=N stretching vibration in
quinoid unit of PAni often overlaps in this region
[43]. The broad vibrational band centered at ~3436
cm-1
is assigned to N-H stretching vibration [40, 43].
Fig. 4. (a)ATR-FTIR spectra of PAni nanofibers (black) and Chitosan (red). (b) ATR-FTIR spectra of untreated (black), O2
plasma treated (red), N2 plasma treated (blue) and Ar plasma
treated (purple) PAni nanofibers/Chitosan nanocomposites.
The appearance of the peak at ~1015 cm-1
in the
ATR-FTIR spectrum of chitosan is assigned to O-H
bending vibration [38]. The bands at ~1125 cm-1
and
~1260 cm-1
are attributed to anti-symmetrical
stretching vibration of C-O-C bridge and C-N
stretching vibration of secondary aromatic amine of
chitosan, respectively [38]. A strong band at ~1630
cm-1
is assigned to C=O stretching in amide groups
(-NHCOCH3- due to partial deacetylation of
Chitosan) [38]. Two weak bands appear at ~2855-
2922 cm-1
is associated with C-H stretching of
aliphatic group [38]. The broad band centered at
~3443 cm-1
is due to O-H & N-H stretching vibration
in chitosan [38, 43].
The ATR-FTIR spectra of PAni/Chitosan
nanocomposites before and after plasma treatment
are shown in Fig. 4(b). Characteristics vibrational
bands for both PAni & chitosan are observed in
PAni/Chitosan nanocomposites with shifting. After
plasma treatment, the broadening and shifting of the
band towards lower wavenumber region (~3420-3440
cm-1
) can be assigned to electrostatic forces & the
hydrogen bonding between –OH & -NH2 in PAni
nanofibers/Chitosan nanocomposites. After O2
plasma treatment, a small peak appears at ~1708 cm-1
due to stretching of C=O in carboxylic acid [43]. The
peak may also be assigned to C=O in aldehyde,
which moves to lower frequency. After N2 plasma
treatment, a broad peak appears in the region ~1620-
1646 cm-1
which is attributed to C=N stretching
vibration overlapped with C=O stretching vibration
in amide groups of Chitosan [38,43]. The vibrational
band associated with C-N stretching in secondary
aromatic amine appearing at ~1254 for untreated
sample shifts to ~1249, ~1254 and ~1260 cm-1
after
O2, N2 and Ar plasma treatment, respectively. The
C=C stretching vibration in quinoid/benzenoid unit
observed at ~1506 cm-1
for untreated sample shifts to
~1546, 1551 and 1548 cm-1
after O2, N2 and Ar
plasma treatment, respectively. The C-H out of plane
bending vibration of para disubstituted benzene ring
in PAni shifts to higher wavenumber from 823 cm-1
in PAni to 846, 895, 895 & 896 cm-1
for untreated,
O2, N2 and Ar plasma treated samples, respectively.
A very weak signature peak at 3440 cm-1
is observed
after N2 and Ar plasma treatment overlapped with the
broad peak in the region 3220-3440 cm-1
.
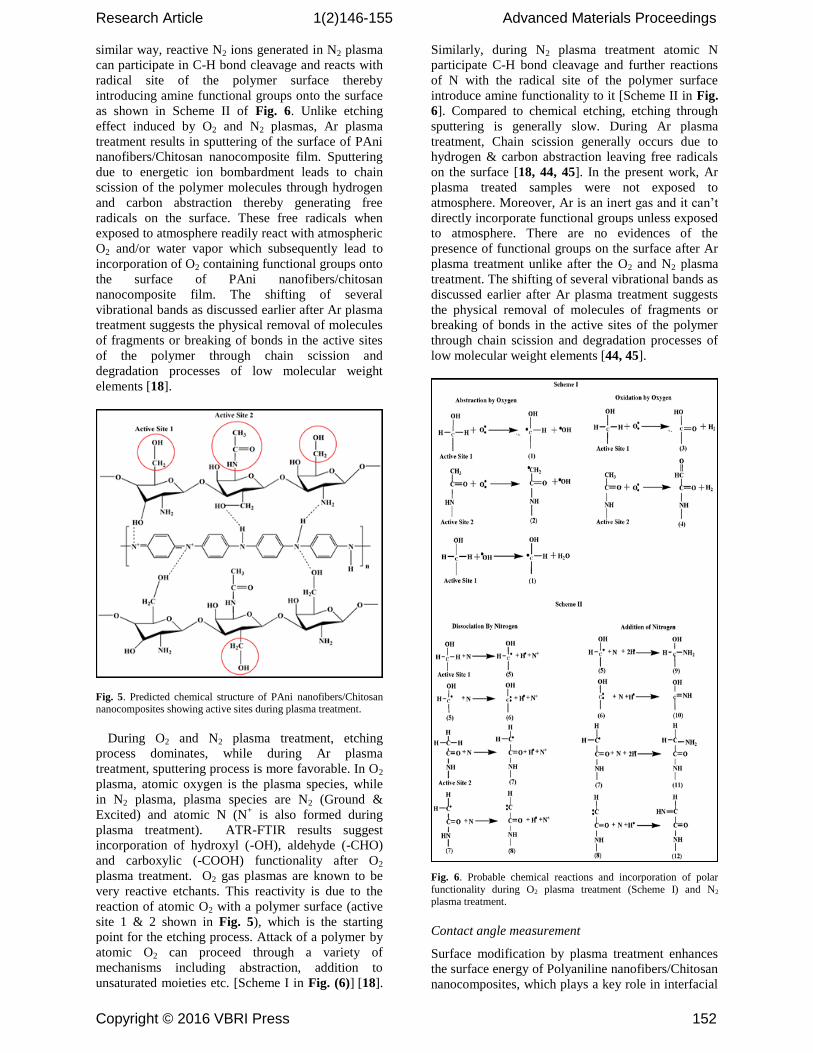
As revealed from Fig. 4(b), O2 plasma treatment
results in incorporation of oxygen containing
functional groups (-OH, -CHO, -COOH etc.) onto the
surface of PAni nanofibers/chitosan nanocomposite
film. A possible mechanism showing generation of
active sites induced by O2 plasma and incorporation
of functional groups onto the surface of PAni
nanofibers/Chitosan nanocomposite film has been
proposed and presented in Fig. 5 and Fig. 6. The
active sites 1 and 2 are exposed and accessible to
highly reactive O2 ions with the surface molecules
which subsequently leads to incorporation of oxygen
containing functional groups onto the polymer
surface. The reaction with the surface molecules of
PAni nanofibers/Chitosan nanocomposite film by O2
ions can proceed through a variety of mechanisms
including abstraction, addition to unsaturated
moieties etc., as shown in Scheme I of Fig. 6. In a
Research Article 1(2)146-155 Advanced Materials Proceedings
Copyright © 2016 VBRI Press 152
similar way, reactive N2 ions generated in N2 plasma
can participate in C-H bond cleavage and reacts with
radical site of the polymer surface thereby
introducing amine functional groups onto the surface
as shown in Scheme II of Fig. 6. Unlike etching
effect induced by O2 and N2 plasmas, Ar plasma
treatment results in sputtering of the surface of PAni
nanofibers/Chitosan nanocomposite film. Sputtering
due to energetic ion bombardment leads to chain
scission of the polymer molecules through hydrogen
and carbon abstraction thereby generating free
radicals on the surface. These free radicals when
exposed to atmosphere readily react with atmospheric
O2 and/or water vapor which subsequently lead to
incorporation of O2 containing functional groups onto
the surface of PAni nanofibers/chitosan
nanocomposite film. The shifting of several
vibrational bands as discussed earlier after Ar plasma
treatment suggests the physical removal of molecules
of fragments or breaking of bonds in the active sites
of the polymer through chain scission and
degradation processes of low molecular weight
elements [18].
Fig. 5. Predicted chemical structure of PAni nanofibers/Chitosan nanocomposites showing active sites during plasma treatment.
During O2 and N2 plasma treatment, etching
process dominates, while during Ar plasma
treatment, sputtering process is more favorable. In O2
plasma, atomic oxygen is the plasma species, while
in N2 plasma, plasma species are N2 (Ground &
Excited) and atomic N (N+ is also formed during
plasma treatment). ATR-FTIR results suggest
incorporation of hydroxyl (-OH), aldehyde (-CHO)
and carboxylic (-COOH) functionality after O2
plasma treatment. O2 gas plasmas are known to be
very reactive etchants. This reactivity is due to the
reaction of atomic O2 with a polymer surface (active
site 1 & 2 shown in Fig. 5), which is the starting
point for the etching process. Attack of a polymer by
atomic O2 can proceed through a variety of
mechanisms including abstraction, addition to
unsaturated moieties etc. [Scheme I in Fig. (6)] [18].
Similarly, during N2 plasma treatment atomic N
participate C-H bond cleavage and further reactions
of N with the radical site of the polymer surface
introduce amine functionality to it [Scheme II in Fig.
6]. Compared to chemical etching, etching through
sputtering is generally slow. During Ar plasma
treatment, Chain scission generally occurs due to
hydrogen & carbon abstraction leaving free radicals
on the surface [18, 44, 45]. In the present work, Ar
plasma treated samples were not exposed to
atmosphere. Moreover, Ar is an inert gas and it can’t
directly incorporate functional groups unless exposed
to atmosphere. There are no evidences of the
presence of functional groups on the surface after Ar
plasma treatment unlike after the O2 and N2 plasma
treatment. The shifting of several vibrational bands as
discussed earlier after Ar plasma treatment suggests
the physical removal of molecules of fragments or
breaking of bonds in the active sites of the polymer
through chain scission and degradation processes of
low molecular weight elements [44, 45].
Fig. 6. Probable chemical reactions and incorporation of polar
functionality during O2 plasma treatment (Scheme I) and N2 plasma treatment.
Contact angle measurement
Surface modification by plasma treatment enhances
the surface energy of Polyaniline nanofibers/Chitosan
nanocomposites, which plays a key role in interfacial

Research Article 1(2)146-155 Advanced Materials Proceedings
Copyright © 2016 VBRI Press 153
interactions between cell and the biomaterial [47,48].
Increase in Lewis basicity or basic component of
surface energy calculated by AB method, is observed
after plasma treatment, which is also a key factor for
surface biocompatibility [49].
Table. I. Average Contact angle values for PAni nanofibers/Chitosan nanocomposites films before plasma
treatment.
Table. II. Average surface energy and its components calculated
by AB (water, ethylene glycol and diiodomethane) methods before
plasma treatment.
It was addressed earlier that surface properties of a
material like wettability which is an important
phenomenon for binding or adherence between two
materials, can be evaluated by calculating surface
energy of that material using contact angle values of
different polar and apolar test liquids on it. Usually,
the high energy surfaces due to nature of the
chemical bonds (viz. covalent, ionic) hold them
together, possess higher wettability. Thus, the
presence of chemical groups on the surface of a
material defines the wettability, which is one of the
most prerequisite parameters for cell-biomaterial
interfacial interactions. So far as, we have
demonstrated directly the incorporation polar
functional groups onto the surface of PAni
nanofibers/Chitosan nanocomposites after O2 and N2
plasma treatment with the help of ATR-FTIR
spectroscopy, there are no such direct method to
calculate the total surface energy or surface tension
except some indirect or semi-empirical methods. The
Van Oss-Chaudhury-Good method, also known as
Acid Base (AB) method offers the advantage over
others in the sense that it can provide a complete
scenario along with acidic and basic character of the
surface beyond the total surface energy and
dispersive and polar components.
Water contact angle values of PAni
nanofibers/Chitosan nanocomposites before and after
plasma surface modification with three different test
liquids are shown in Table I. Decrease in water
contact angle value upto 43°, 55° and 54° after O2, N2
and Ar plasma treatment, respectively, reveals the
improved wettability of the material surface.
Surface energy calculations of PAni
nanofibers/Chitosan nanocomposites before and after
plasma treatment are performed by AB method using
three test liquids: water, ethylene glycol and
diiodomethane and presented in Table I. In fact, the
“polar” term designate three classes of compound
viz. hydrogen bonding compounds, dipolar
compounds and the compounds that interact with
Lewis acid and base.23,49
This AB method reported by
Van oss et al., distinguishes this acid base
interactions as a component of surface energy
denoted by AB. As seen from Table II, the Lifshitz-
Van der Waals components of PAni
nanofibers/Chitosan nanocomposites after O2 and N2
plasma treatment are significantly decreased to 38.39
and 38.88 mNm-1
from 39.14 mNm-1
observed before
plasma treatment. But, the most important
observation is the increase in acid-base components
of surface energy after plasma treatment which
ultimately leads to the improved hydrophilicity of the
surface. It was found that γsAB has been enhanced
upto 14.31 and 9.80 mNm-1
from 6.44 mNm-1
after
O2 and N2 plasma treatment. To speak more
specifically, the Lewis base component (s−) of O2
and N2 plasma treated samples is enhanced by a large
difference than that of untreated as observed from
Table II, which indicates the improved basic
character of plasma modified surface. The improved
acid and basic character of the surface after Oxygen
plasma treatment can be attributed due to the
enrichment of the surface with carboxyl (-COOH)
and hydroxyl (-OH), aldehyde (-CHO) functionality
as depicted in the probable chemical interactions of
plasma species of atomic O2 with the active site 1 &
2 of PAni nanofibers/Chitosan nanocomposites
[Scheme I in Fig. 6]. Similarly, the improved basicity
of the surface after N2 plasma treatment is addressed
due to the incorporation of amine (-NH2)
functionality as shown in the predicted chemical
interactions between the atomic Nitrogen plasma
species and the active site 1 & 2 of Polyaniline
nanofibers/Chitosan nanocomposites [Scheme II in
Fig. 6].
On the other hand, the enhancement in surface
energy after Ar plasma treatment can be assigned due
to the formation of radical sites on the surface leading
to dangling bonds or unsaturation. There are no
evidences of introduction of functional groups after
Ar plasma treatment from ATR-FTIR results. The
unsaturation caused by Ar plasma may be due to the
formation of radical sites through carbon and
hydrogen abstraction making the surface highly
reactive. The modified surface absorbs water more
easily notably due to the improved reactivity of the
surface, which may be the reason for enhanced
wettability and surface energy.
The enhancement in total surface energy value
along with polar components specifically Lewis base
Material Water
Contact
angle (°)
Ethylene Gly
col Contact
angle (°)
Diiodomethane
Contact angle
(°)
Untreated 730.07 620.22 470.07
Oxygen treated 430.10 480.01 520.17
Nitrogen
treated 550.04 520.03 500.19
Argon treated 540.06 570.12 500.13
Material AB method
s/mN
m-1
LWs/m
Nm-1
ABs/m
Nm-1
+s/m
Nm-1
-s/mNm-1
Untreated 45.59
0.43
39.140
.50
6.44 2.790
.75
3.720.41
O2 treated 52.71
0.30
38.390
.67
14.31 3.090
.25
16.570.4
4
N2 treated 48.68
0.54
38.880
.38
9.80 2.810
.21
8.550.61
Ar treated 50.23
0.14
41.790
.53
8.43 5.790
.35
3.070.12

Research Article 1(2)146-155 Advanced Materials Proceedings
Copyright © 2016 VBRI Press 154
component value after surface functionalization is
correlated to the improved biocompatibility of
plasma treated samples in the following section.
Cell viability study
The Alamar Blue assay was used to compare cell
proliferation on different biomaterials based on
detection of metabolic activity of viable cells through
reduction of Alamar Blue. Fig. 7(b) depicts improved
viability of PBMC cells on O2 and N2 plasma treated
samples than as compared to the untreated and Ar
plasma treated samples. Similar observations are also
made in case of HepG2 cells. In case of the both cell
types, it has been found that proliferation proceeded
more significantly on O2 and N2 plasma treated
samples than as compared to tissue culture plate
(TCP).
Fig. 7. Cell viability in terms of absorbance value of reduced form of Alamar Blue a function of sample concentration with (a) PBMC
(Lymphocytes) and (b) HepG2 cells before and after plasma
treatment. Absorbance data were recorded at 570 nm (experimental
wells) and 600 nm (culture medium background as reference) and
expressed as difference in absorbance at 570 nm and 600 nm SD
for n = 4.
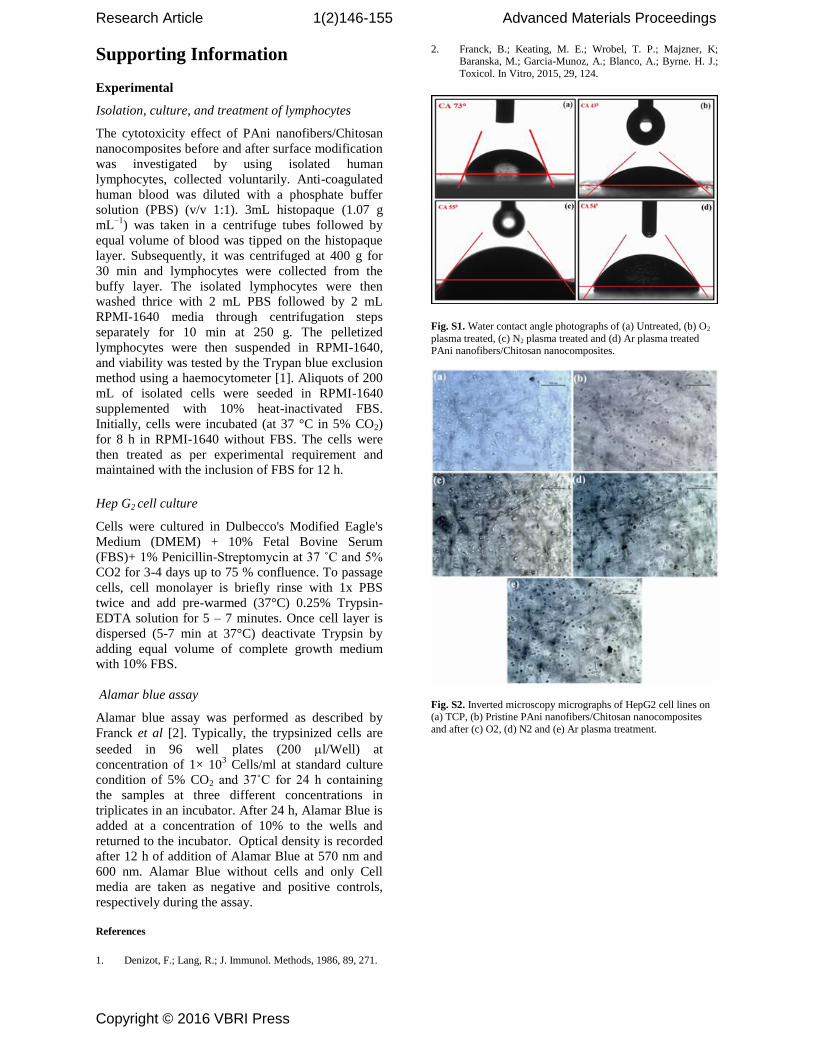
The optical micrographs of HepG2 cells on TCP,
untreated and modified materials after 2 days of
culture were shown in Fig.S2 in the Supporting
Information. It can be observed that O2 and N2
plasma treated samples demonstrate very good
adherence towards Hep G2 cells [Fig.S2(c) & (d)], as
the cells are nicely elongated on the surface. On the
otherhand, less number of viable cells and no
significant elongation of cells was observed on
pristine and Ar plasma treated nanocomposites film
[Fig. S2(b) & (e)]. These treatments appear to render
the surface of PAni nanofibers/Chitosan
nanocomposites with the appropriate physico-
chemical properties for adherence and proliferation
of Hep G2 cells.
The improved cell viability with both HepG2 and
PBMC cells after O2 and N2 plasma treatment can be
attributed to the enhanced surface hydrophilicity
through introduction of polar functional like
hydroxyl(-OH), aldehyde (-CHO), carboxyl (-
COOH) and amine (-NH2) functionality, as revealed
from ATR-FTIR results and Surface energy
calculations. The improved hydrophilic nature of
PAni nanofibers/Chitosan nanocomposites after O2
and N2 plasma treatment enable it to interact with
receptor proteins on the cell surface, which can
mediate the cell growth along with other cellular
activities. The reduced cell viability observed after
Argon plasma treatment may be due to the creation of
free radicals on the surface, which is generally
considered as harmful to cells.
Conclusion
Plasma treatment comes out to be an effective
technique for surface modification of PAni
nanofibers/Chitosan nanocomposites. Scanning
electron microscopy indicates increase in surface
roughness due to etching during Oxygen and
Nitrogen plasma treatment and due to sputtering
during Argon plasma treatment. X-ray diffraction
pattern shows broadening of the diffraction peaks
around 19˚ & 25˚ after plasma treatment indicating
increase in amorphocity of the nanocomposites.
Surface hydrophilicity of PAni nanofibers/Chitosan
nanocomposites has been successfully improved after
Oxygen and Nitrogen plasma treatment through
incorporation of polar functionality like hydroxyl (-
OH), aldehyde (-CHO), carboxyl (-COOH) and
amino (-NH2) groups, respectively, as evident from
ATR-FTIR and Contact angle measurements.
Enhancement in wettability after plasma treatment is
also supported by increase in surface roughness and
amorphicity. Finally, O2 and N2 plasma treated
samples are found to be more cytocompatible than
the untreated and Argon plasma treated sample by
Alamar Blue assay accomplished with Hep G2 cells
and PBMC (Lymphocytes). Improved cell-
biomaterial interaction is observed after O2 and N2
plasma treatment owing to its improved surface
hydrophilicity, which mediates cell behaviour
through interaction with receptor proteins on cell
surface. O2 and N2 plasma treated PAni
nanofibers/Chitosan nanocomposites can act as
artificial Extracellular Matrix (ECM) as they promote
cellular activities and therefore, can be suitable
biomaterial for various biomedical applications like
tissue engineering, drug delivery and enzyme
immobilization for biosensing applications. Improved
bioactivity of PAni nanofibers/Chitosan

Research Article 1(2)146-155 Advanced Materials Proceedings
Copyright © 2016 VBRI Press 155
nanocomposites after O2 and N2 plasma treatment
towards Hep G2 cells may render them attractive as
scaffolds for cancer cell growth for therapy and
research, which may be an alternative to the
conventional metal based technologies.
Acknowledgements
The authors cordially acknowledged Department of Science &
Technology (DST), Govt. of India, for financial support through Inspire Fellowship Scheme. The authors also gratefully
acknowledged the help extended by Dr. Arup Jyoti Choudhury,
Department of Physics, Tezpur University and Dr. Anand Ramteke and Mr. Manoj Kumar Das, Department of Molecular Biology and
Biotechnology, Tezpur University during this research work.
References
1. Ikada, Y.; J. R. Soc. Interface, 2006, 3, 589. 2. Ikada, Y.; Tissue engineering: fundamentals and
applications; Academic Press: Belgium, 2011.
3. Patrick, C. W.; Antonios, G. M.; McIntire, L. V. (Eds.); Frontiers in tissue engineering; Elsevier: USA, 1998.
4. Vacanti, J. P.; Langer, R. J.-Lancet, 1999, 354, 32.
5. Spira, M.; Fissette, J.; Hal, C. W.; Hardy, S. B.; Gerow, F. J. J. Biomed. Mater. Res. 1969, 3, 213.
6. Giardino, R.; Aldini N. N.; Torricelli, P.; Fini, M; Giavaresi,
G.; Rocca, M.; Martini, L.; Int J Artif Organs, 2000, 23, 331. 7. Ma, Z.; Kotaki, M.; Inai, R.; Ramakrishna, S. Tissue Eng.
2005, 11, 101.
8. Goldberg, M.; Langer, R.; Jia, X. J. Biomater. Sci., Polym. Ed. 2007, 18, 241.
9. Gentile, F.; Medda, R..; Cheng, L.; Battista, E.; Scopelliti, P.
E.; Milani, P.; Cavalcanti-Adam, E. A.; Decuzzi, P. Sci. Rep. 2013, 3, 1461.
10. Lloyd, N.; Ncube, S.; Sibanda, P.; Akankwasa, N. T. Mater.
Sci.: Indian J. 2012, 12, 218. 11. Webster, T. J.; Ejiofor, J. U. Biomaterials. 2004, 25, 4731.
12. Hosseinkhani, M.; Mehrabani, D.; Karimfar, M. H.; Bakhtiyari, S.; Manafi, A.; Shirazi, R. World J. Plast. Surg.
2014, 3, 3.
13. Sell, S. A.; Wolfe, P. S.; Garg, K.; McCool, J. M.; Rodriguez,
I. A.; Bowlin, G. L. Polymers. 2010, 2, 522.
14. Balint, R.; Cassidy, N. J.; Cartmell, S. H. Acta Biomater.
2014, 10, 2341. 15. Ghasemi‐ Mobarakeh, L.; Prabhakaran, M. P.; Morshed, M.;
Nasr‐ Esfahani, M. H.; Baharvand, H.; Kiani, S.; Al‐ Deyab
S. S.; Ramakrishna, S. J. Tissue Eng. Regener. Med. 2011, 5, 17.
16. Ma, Z.; Mao, Z.; Gao, C. Colloids Surf., B. 2007, 60, 137.
17. Dai, L.; Mau, A. W. H. J. Phys. Chem. B. 2000, 104, 1891. 18. Olde Riekerink, M. B.; Structural and chemical modification
of polymer surfaces by gas plasma etching; University
Twente: Netherlands, 2001. 19. Gomathi, N.; Neogi, S. Appl. Surf. Sci., 2009, 255, 7590.
20. Svirachev, D. M.; Tabaliov, N. A. Bulg. J. Phys. 2005, 321,
22. 21. Castro Vidaurre, E. F.; Achete, C. A.; Gallo, F.; Garcia, D.;
Simão, R.; Habert, A. C. Mater. Res. 2002, 5, 37.
22. Liston, E. M.; Martinu, L.; Wertheimer, M. R. J. Adhes. Sci. Technol. 1993, 7, 1091.
23. López-Pérez, P. M.; Marques, A. P.; da Silva, R. M.;
Pashkuleva, I.; Reis, R. L. J. Mater. Chem. 2007, 17, 4064. 24. Oyane, A.; Uchida, M.; Yokoyama, Y.; Choong, C.; Triffitt,
J.; Ito, A. J. Biomed. Mater. Res., Part A. 2005, 75, 138.
25. Kong, J. S.; Lee, D. J.; Kim, H. D. J. Appl. Polym. Sci. 2001, 82, 1677.
26. Kim, Y. J.; Kang, I. K.; Huh, M. W.; Yoon, S. C.
Biomaterials, 2000, 21, 121. 27. Siow, K. S.; Britcher, L.; Kumar, S.; Griesser, H. J. Plasma
Processes Polym. 2006, 3, 392.
28. Chen, M.; Zamora, P. O.; Som, P.; Peña, L. A.; Osaki, S. J. Biomater. Sci., Polym. Ed. 2003, 14, 917.
29. Mattioli-Belmonte, M.; Giavaresi, G.; Biagini, G.; Virgili, L.;
Giacomini, M.; Fini, M.; Giantomassi, F.; Natali, D;
Torricelli, P; Giardino, R. Int. J. Artif. Organs. 2003, 26, 1077.
30. Anderson, J. M. Annu. Rev. Mater. Res., 2001, 31, 81.
31. Petrov, P.; Mokreva, P.; Kostov, I.; Uzunova, V.; Tzoneva, R. Carbohydr. Polym. 2016, 140, 349.
32. Xu, D.; Fan, L.; Gao, L.; Xiong, Y.; Wang, Y.; Ye, Q.; Yu,
A.; Dai, H.; Yin, Y.; Cai, J.; Zhang, L. ACS Appl. Mater. Interfaces, 2016, 8, 17090.
33. Miao, Z.; Wang, P.; Zhong, A.; Yang, M.; Xu, Q.; Hao, S.; Hu, X. J. Electroanal. Chem. 2015, 756, 153.
34. Pérez-Martínez, C.J.; Chávez, S.D.M.; del Castillo-Castro,
T.; Ceniceros, T.E.L.; Castillo-Ortega, M.M.; Rodríguez-Félix, D.E.; Ruiz, J.C.G. React. Funct. Polym. 2016, 100, 12.
35. Min, Y.; Yang, Y.; Poojari, Y.; Liu, Y.; Wu, J.C.; Hansford,
D.J.; Epstein, A.J. Biomacromolecules. 2013, 14, 1727. 36. Chiou, N. R.; Epstein, A. J. Adv. Mater. 2005, 17, 1679.
37. Van Oss, C. J; Roberts, M. J.; Good, R. J.; Chaudhury, M. K.
Colloids Surf. 1987, 23, 369. 38. Ayad, M. M.; Salahuddin, N. A.; Minisy, I. M.; Amer, W. A.
Sens. Actuators, B. 2014, 202, 144.
39. Pouget, J. P.; Jozefowicz, M. E.; Epstein, A. E. A.; Tang, X.; MacDiarmid, A. G. Macromolecules. 1991, 24, 779.
40. Furukawa, Y.; Ueda, F.; Hyodo, Y.; Harada, I.; Nakajima, T.;
Kawagoe, T. Macromolecules. 1988, 21, 1297. 41. Sariciftci, N. S.; Kuzmany, H.; Neugebauer, H.; Neckel, A. J.
Chem. Phys. 1990, 92, 4530.
42. Quillard, S.; Louarn, G.; Lefrant, S.; MacDiarmid, A. G. Phys. Rev. B. 1994, 50, 12496.
43. Pavia, D. L.; Lampman, G. M.; Kriz, G. E.; Introduction to
spectroscopy; Thomson Learning: USA, 2008. 44. Wagner, A. J.; Fairbrother, D. H.; Reniers, F. Plasmas
Polym. 2003, 8, 119.
45. France, R. M.; Short, R. D. Langmuir. 1998, 14, 4827. 46. Wang, C.; Chen, J. R. Appl. Surf. Sci. 2007, 253, 4599.
47. Liu, L.; Chen, S.; Giachelli, C. M.; Ratner, B. D.; Jiang, S. J.
Biomed. Mater. Res., Part A. 2005, 74, 23. 48. Kaelble, D. H.; Moacanin, J. Polymer. 1977, 18, 475.
49. Ostuni, E.; Chapman, R. G.; Holmlin, R. E.; Takayama, S.;
Whitesides, G. M. Langmuir. 2001, 17, 5605.
Research Article 1(2)146-155 Advanced Materials Proceedings
Copyright © 2016 VBRI Press
Supporting Information
Experimental
Isolation, culture, and treatment of lymphocytes
The cytotoxicity effect of PAni nanofibers/Chitosan
nanocomposites before and after surface modification
was investigated by using isolated human
lymphocytes, collected voluntarily. Anti-coagulated
human blood was diluted with a phosphate buffer
solution (PBS) (v/v 1:1). 3mL histopaque (1.07 g
mL−1
) was taken in a centrifuge tubes followed by
equal volume of blood was tipped on the histopaque
layer. Subsequently, it was centrifuged at 400 g for
30 min and lymphocytes were collected from the
buffy layer. The isolated lymphocytes were then
washed thrice with 2 mL PBS followed by 2 mL
RPMI-1640 media through centrifugation steps
separately for 10 min at 250 g. The pelletized
lymphocytes were then suspended in RPMI-1640,
and viability was tested by the Trypan blue exclusion
method using a haemocytometer [1]. Aliquots of 200
mL of isolated cells were seeded in RPMI-1640
supplemented with 10% heat-inactivated FBS.
Initially, cells were incubated (at 37 °C in 5% CO2)
for 8 h in RPMI-1640 without FBS. The cells were
then treated as per experimental requirement and
maintained with the inclusion of FBS for 12 h.
Hep G2 cell culture
Cells were cultured in Dulbecco's Modified Eagle's
Medium (DMEM) + 10% Fetal Bovine Serum
(FBS)+ 1% Penicillin-Streptomycin at 37 ˚C and 5%
CO2 for 3-4 days up to 75 % confluence. To passage
cells, cell monolayer is briefly rinse with 1x PBS
twice and add pre-warmed (37°C) 0.25% Trypsin-
EDTA solution for 5 – 7 minutes. Once cell layer is
dispersed (5-7 min at 37°C) deactivate Trypsin by
adding equal volume of complete growth medium
with 10% FBS.
Alamar blue assay
Alamar blue assay was performed as described by
Franck et al [2]. Typically, the trypsinized cells are
seeded in 96 well plates (200 l/Well) at
concentration of 1× 10³ Cells/ml at standard culture
condition of 5% CO2 and 37˚C for 24 h containing
the samples at three different concentrations in
triplicates in an incubator. After 24 h, Alamar Blue is
added at a concentration of 10% to the wells and
returned to the incubator. Optical density is recorded
after 12 h of addition of Alamar Blue at 570 nm and
600 nm. Alamar Blue without cells and only Cell
media are taken as negative and positive controls,
respectively during the assay.
References
1. Denizot, F.; Lang, R.; J. Immunol. Methods, 1986, 89, 271.
2. Franck, B.; Keating, M. E.; Wrobel, T. P.; Majzner, K; Baranska, M.; Garcia-Munoz, A.; Blanco, A.; Byrne. H. J.;
Toxicol. In Vitro, 2015, 29, 124.
Fig. S1. Water contact angle photographs of (a) Untreated, (b) O2
plasma treated, (c) N2 plasma treated and (d) Ar plasma treated
PAni nanofibers/Chitosan nanocomposites.
Fig. S2. Inverted microscopy micrographs of HepG2 cell lines on (a) TCP, (b) Pristine PAni nanofibers/Chitosan nanocomposites
and after (c) O2, (d) N2 and (e) Ar plasma treatment.