effect of influent organic content on …
TRANSCRIPT
1
EFFECT OF INFLUENT ORGANIC CONTENT ON DIGESTED SLUDGE
EXTRACELLULAR POLYMER CONTENT AND DEWATERABILITY
JENNIFER I. HOUGHTON and TOM STEPHENSON*
School of Water Sciences, Cranfield University, Cranfield, Bedfordshire, UK MK43 0AL
*Author to whom all correspondence should be addressed.
Tel: +44 (0) 1234 750111 ext. 4054
Fax: +44 (0) 1234 751671
e-mail: [email protected]
Short title for page headings: Digested sludge dewaterability
Abstract- The organic composition of the feed sludge to six laboratory-scale anaerobic
digesters was adjusted by substituting a proportion of the primary sludge for glucose or
propionic acid solution. Substitution with glucose caused an increase in the microbial
extracellular polymer content of the digested sludge, which altered the particle size
distribution of the sludge and increased the sludge dewaterability. Substitution with
propionic acid gave similar results to the control. The relationship between the digested
sludge extracted extracellular polymer yield and sludge filtrability determined using the
capillary suction time test was significant at the P = 0.01 level. The level of
extracellular polymer for optimum sludge dewaterability was calculated as 17.2 mg g-1
SS. The protein and carbohydrate composition of the extracted polymer did not appear
to affect the sludge dewaterability. Results present will allow predictions to be made
into the effect that changes in the influent sewage composition has on essential
downstream processes.
2
key words- anaerobic digestion; dewaterability; extracellular polymer; organic
amendment; particle size distribution; sludge
INTRODUCTION
Anaerobic digestion is currently the most common process used for sludge minimisation
and stabilisation (Hudson and Lowe, 1996), with 50 % of the sludge produced in the
European Union being treated in this way (Hall, 1995). The process of anaerobic
digestion occurs in a number of discrete stages, the main ones being hydrolysis,
acidogenesis and methanogenesis. Each stage is dependent on a different bacterial
population, with all of the separate bacterial species living together in direct or indirect
symbiotic associations (Gujer and Zehnder, 1983). Prior to disposal digested sludge is
generally dewatered, giving a further reduction in the sludge volume and thereby
decreasing disposal costs. The reported impact of anaerobic digestion on sludge
dewaterability to date is mixed, with some studies indicating that digestion generally
improves sludge dewaterability, (Rudolfs and Heukelekian, 1934; Brooks, 1970; Lawler
et al., 1986) whilst other studies have reported that digestion degrades sludge
dewaterability (Pearson and Buswell, 1931; Karr and Keinath, 1978; Yan et al., 1987;
Houghton et al., 2000a).
During anaerobic digestion organic debris is broken down resulting in a change in the
particle size distribution (Karr and Keinath, 1978; Lawler et al., 1986; Nellenschulte
and Kayser, 1997). The sludge particle size distribution has been shown to be one of
the key factors in controlling sludge dewaterability (Karr and Keinath, 1978). Reported
differences in the affect of digestion on sludge dewaterability may therefore be related
3
to the biodegradability of the sludge used and differences in digester efficiency
affecting the particle size.
Another parameter that can have an impact on the sludge dewaterability is the sludge
microbial extracellular polymer (ECP) content (Ryssov-Nielsen, 1975; Novak et al.,
1977; Kang et al., 1989). Microbial ECP is an organic polymer produced by bacterial
cells and is frequently responsible for binding cells and other particulate matter together
(Wingender et al., 1999). Microbial ECP is highly hydrated and may contain up to 99
% water by weight (Costerton et al., 1981) thereby retaining a high level of water in the
sludge. By binding cells and particulate matter together it also changes the particle size
distribution of the sludge, which again affects the dewatering process.
Investigations into the effect of microbial ECP on digested sludge dewaterability have
been limited to date. Extraction and analysis of ECP from sludge samples obtained
from both full-scale (Houghton et al., 2000a) and laboratory-scale (Houghton et al.,
2000b) anaerobic digesters has indicated a positive correlation between increasing ECP
yield and sludge becoming more difficult to dewater, but the relationship was not
always significant at the P = 0.05 level.
Poxon and Darby, (1997) found no simple relationship between the quantity of ECP
present and sludge dewaterability, though in this case the level of ECP present was
quantified using an in situ dye adsorption method and the sludge dewaterability
calculated using a filterability index based on the capillary suction time (CST) test.
Any trend that was present appeared to be dependent on the digester feed composition,
with increased quantities of ECP associated with high carbohydrate feed. In this case,
the composition of the ECP produced was not investigated. The same trend was also
noticed when different individual substrates were used as feed for anaerobic digestion,
with glucose consistently producing a sludge with higher levels of extractable microbial
4
products than acetate, butyrate or propionate (Noguera et al., 1994; Jia et al., 1996; Kuo
et al., 1996). The impact on the sludge dewaterability was not determined in any of
these studies.
The composition of the ECP also altered with the type of substrate, with ECP extracted
from digested sludge fed glucose containing more protein and carbohydrate than the
other substrates (Jia et al., 1996). These results indicate that the acidogenic bacteria
that utilise glucose in the first stage of the digestion process produce more ECP than the
acetogenic bacteria that utilise butyrate or propionate, or the methanogenic bacteria that
utilise acetate.
By adjusting the organic composition of the feed sludge to a series of laboratory-scale
anaerobic digesters, the aim of this paper was to determine the impact that these
alterations had on the digested sludge in terms of microbial ECP yield and composition,
particle size distribution and sludge dewaterability. Simultaneous evaluation of each of
these sludge parameters will allow predications to be made into the effect that changes
in the influent sewage composition has on essential downstream processes.
MATERIALS AND METHODS
Digester feed
The digester feed consisted of either 100 % primary sludge or a mixture of primary
sludge and a known quantity of either glucose or propionic acid. Settled primary sludge
was collected from Saffron Walden municipal wastewater treatment works (Anglian
Water plc., UK). After collection, the sludge was divided into 0.5 and 1.0 l aliquots and
blended (Phillips Type: HR2845/AM) for 1 min, before being stored at -20 oC. Before
5
use, the sludge was defrosted for 24 h at room temperature, followed by heating to ~ 35
oC in a water bath. The mean COD of the collected primary sludge was 67.6 g l-1.
Glucose and propionic acid solutions (0.45 M and 0.67 M respectively) containing the
same COD as the primary sludge were prepared and used as a substitute for a proportion
of the primary sludge. The initial quantity of glucose or propionic acid used in the feed
was 10 % by volume. This was increased by a further 5 % by volume every other day
until a final volume of 40 % was reached by day 13, after which the feed composition
remained constant until day 40. Seed sludge for the digesters was obtained from Milton
Keynes municipal wastewater treatment works (Anglian Water plc., UK).
Experimental set-up
Six laboratory scale anaerobic digesters were constructed from 5 l Quickfit®
fermentation vessels as detailed previously (Houghton et al., 2000b). The digesters
were operated as matched pairs using the following feed composition: 100 % primary
sludge; primary sludge with glucose; primary sludge with propionic acid. Operating
temperature of the digesters was 35 oC at a hydraulic retention time (HRT) of 20 d, with
sludge wasted/fed once pre day. The digesters were operated for 2 full HRT before
being dismantled and the sludge analysed.
Extracellular polymer extraction
Extraction of ECP was carried out using a heat extraction process similar to that of
Morgan et al. (1990). Samples of sludge (500 ml) were rinsed and then re-suspended in
0.25-strength Ringer’s solution, heated to 80 oC for 1 h and cooled. After cooling to
room temperature, the polymer was separated from the solid material by centrifugation
(1800 G for 20 min followed by 5000 G for 20 min). The extracted polymer was
6
removed from the supernatant using solvent (3 vol acetone:1 vol ethanol) precipitation,
overnight at 4 oC, followed by centrifugation at 5000 G for 20 min. The collected
polymer was evaporated to dryness and the yield related to the sludge suspended solids
(SS) content.
Dewaterability tests
Sludge filtrability was determined using the capillary suction time (CST) test (Triton
CST filtrability tester, model 200, Triton Electronics Ltd., Essex, UK) with standard
filter papers (Part No. 815095) supplied by Triton Electronics. Each sludge was
analysed 5 times and the results averaged, before being standardised to a SS
concentration of 1 g l-1 as detailed in Standard Methods (APHA, 2000).
Sludge drainability was determined using a gravity drainage test (IWPC, 1981). A 200
ml sludge sample was poured into a Hartley pattern buchner funnel and allowed to drain
under gravity through a section of belt press filter cloth (Material: 100 % poluester;
Wire diameter: 0.35 mm warp, 0.80 mm weft; Yarn count: 40/cm warp, 8.5/cm weft;
Weave type: twill; Weight: 1200 g m2; Air permeability: 2790 l m2 s-1 200 pa; Simon-
Hartley Ltd. [now discontinued]). The volume of filtrate was measured and recorded at
30 s intervals over a 4 min period. Each sludge was analysed 3 times and the results
averaged.
Particle size analysis
The particle size distribution was determined using laser diffraction. Analysis was
carried out on a Malvern Mastersizer 2000® (Malvern Instruments Ltd., Malvern, UK)
at the following settings: stirrer speed 350; pump speed 500; ultrasonic off. The results
were recorded as the particle volume percent in 70 discrete size ranges between 0.45
7
and 2000 μm. All samples were diluted approximately 500-fold in tap water before
being analysed 10 times and the results averaged to produce the particle size
distribution.
Analytical methods
Total solids (TS), volatile solids (VS) and SS were determined in accordance with
Standard Methods (APHA, 2000). Chemical oxygen demand and volatile acid (VA)
concentration were determined using HACH Methods 8000 and 8196 respectively
(Camlab Ltd., Cambridge, UK). Digester gas was collected over acidifed water (0.1 M
H2SO4), and the volume produced in a set time period measured. All gas measurements
were normalised to standard temperature and pressure (stp).
The extracted ECP was re-suspended in distilled water at a concentration of 1 mg ml-1,
before being analysed for both protein and carbohydrate content. Protein analysis was
carried out using the method of Lowry et al. (1951) with bovine serum albumin as the
standard. Carbohydrate analysis was carried out using the method of Dubois et al.
(1956) with glucose as the standard. The organic fraction of the extracted ECP was
determined gravimetrically after ashing the dried ECP in a furnace at 550 oC for 4 h.
RESULTS
The characteristics for each type of feed used are listed in Table 1. As part of the
primary sludge was substituted with glucose or propionic acid, the TS decreased. All of
the digesters performed satisfactorily for the 40 d of operation, with a mean operating
temperature of 35.1 - 35.5 oC and a mean pH of 7.02 - 7.21 (Table 2). The VS loading
rate of each digester varied, depending on the feed type used. Substituting part of the
8
primary sludge with glucose increased the VS content of the feed, whilst substitution
with propionic acid reduced the VS content (Tables 1 and 2). This was most apparent
when propionic acid was used (Table 1).
The control digesters fed 100 % primary sludge had a mean volatile solids reduction
(VSR) of approximately 55 %. The VSR increased to 61 - 63 % when the feed sludge
was partially substituted for pure glucose, and decreased to 39 - 41 % when the feed
sludge was partially substituted for propionic acid (Table 2). The greatest quantity of
gas produced per g VSR occurred when propionic acid was used as part of the influent
feed, whereas the lowest level of gas production occurred in the control digesters fed
100 % primary sludge (Table 2).
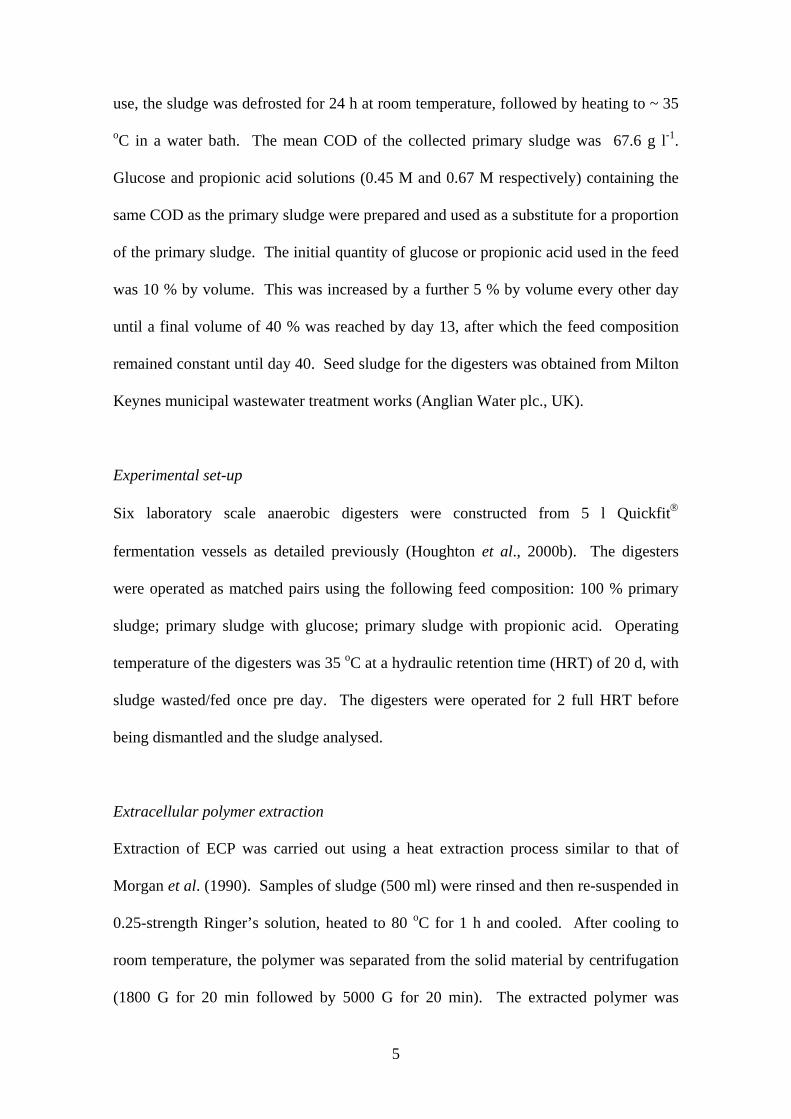
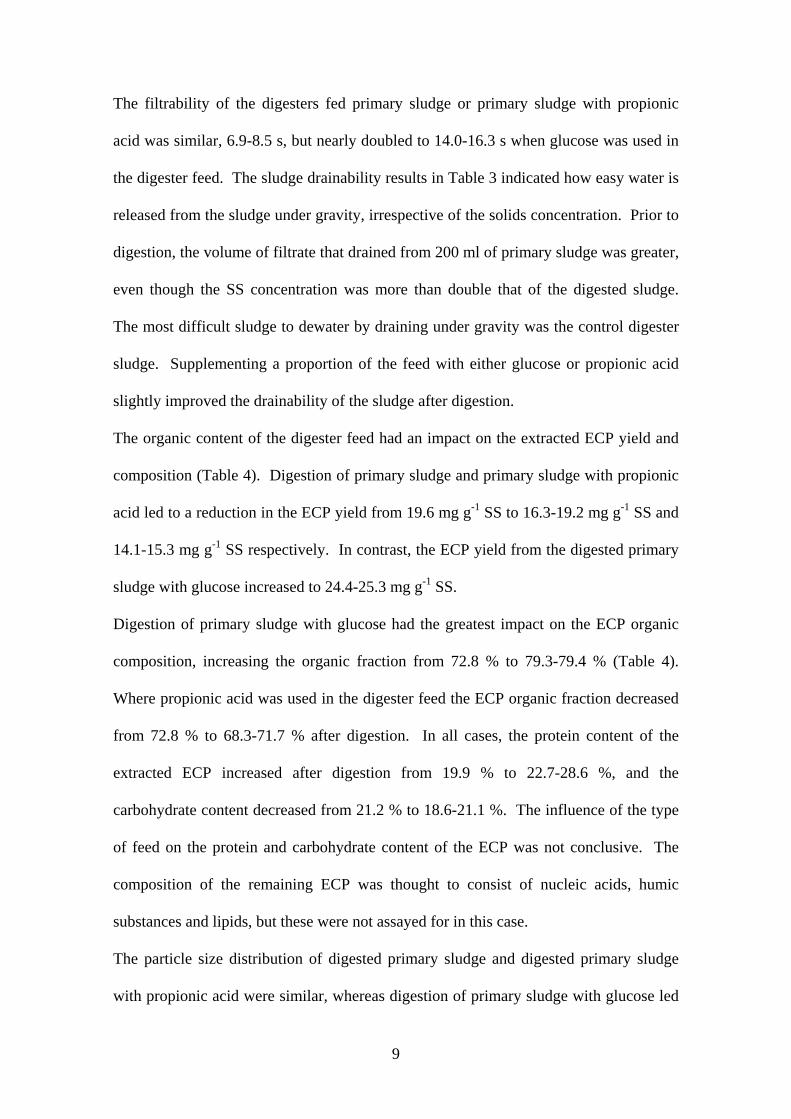
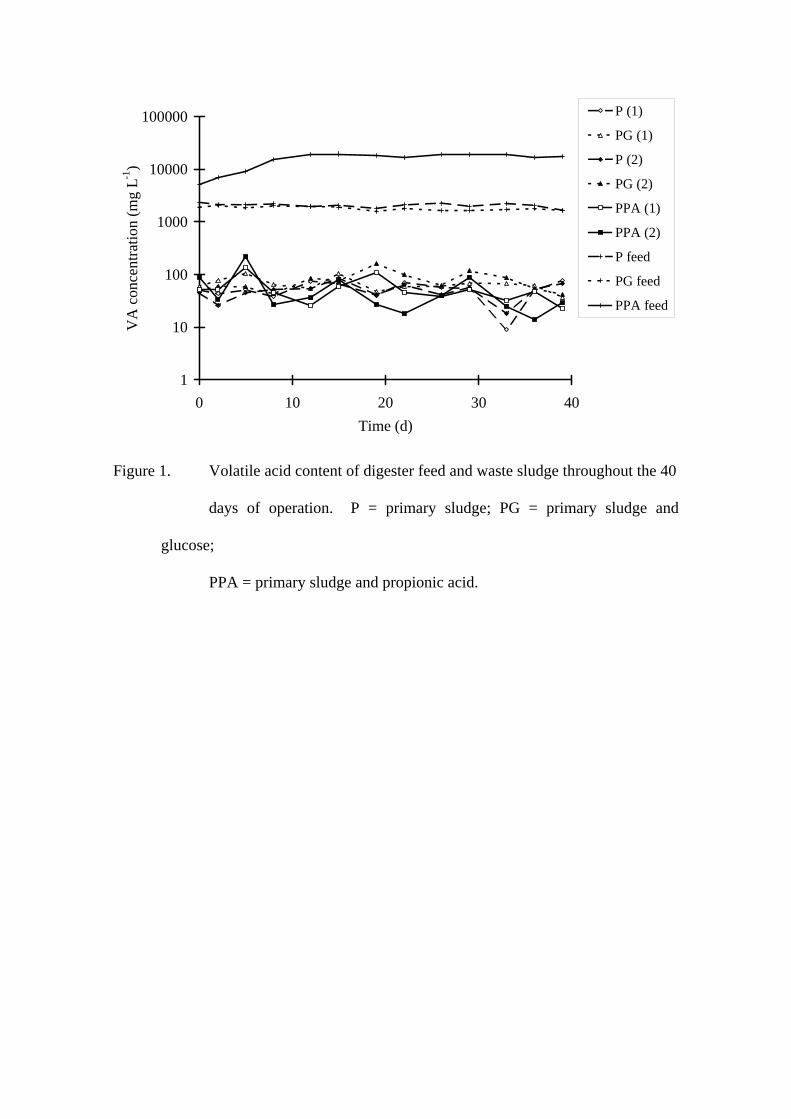
The VA content of the digester feed varied between the different treatments. The
primary sludge and primary sludge with glucose had similar VA concentrations at
approximately 2,000 mg l-1, but the VA concentration of the primary sludge with
propionic acid increased as the proportion of propionic acid increased (Figure 1). The
final concentration of VA in the primary sludge with propionic acid feed was
approximately 20,000 mg l-1. High levels of VA did not appear to affect the digester
operation, with the waste sludge from each digester having VA concentrations of 12 -
220 mg l-1.
Digestion reduced the dewaterability of the primary sludge, both in terms of filtrability
and drainability. At the same time, the SS content of the sludge decreased from
36.8 g l-1 to 13.5 - 16.7 g l-1 (Table 3). The final SS content of the digested sludge was
dependent on the feed type, the highest concentration (16.4 - 16.7 g l-1) determined in
digested primary sludge, and the lowest concentration (13.5 - 13.6 g l-1) in digested
primary sludge with propionic acid.
9
The filtrability of the digesters fed primary sludge or primary sludge with propionic
acid was similar, 6.9-8.5 s, but nearly doubled to 14.0-16.3 s when glucose was used in
the digester feed. The sludge drainability results in Table 3 indicated how easy water is
released from the sludge under gravity, irrespective of the solids concentration. Prior to
digestion, the volume of filtrate that drained from 200 ml of primary sludge was greater,
even though the SS concentration was more than double that of the digested sludge.
The most difficult sludge to dewater by draining under gravity was the control digester
sludge. Supplementing a proportion of the feed with either glucose or propionic acid
slightly improved the drainability of the sludge after digestion.
The organic content of the digester feed had an impact on the extracted ECP yield and
composition (Table 4). Digestion of primary sludge and primary sludge with propionic
acid led to a reduction in the ECP yield from 19.6 mg g-1 SS to 16.3-19.2 mg g-1 SS and
14.1-15.3 mg g-1 SS respectively. In contrast, the ECP yield from the digested primary
sludge with glucose increased to 24.4-25.3 mg g-1 SS.
Digestion of primary sludge with glucose had the greatest impact on the ECP organic
composition, increasing the organic fraction from 72.8 % to 79.3-79.4 % (Table 4).
Where propionic acid was used in the digester feed the ECP organic fraction decreased
from 72.8 % to 68.3-71.7 % after digestion. In all cases, the protein content of the
extracted ECP increased after digestion from 19.9 % to 22.7-28.6 %, and the
carbohydrate content decreased from 21.2 % to 18.6-21.1 %. The influence of the type
of feed on the protein and carbohydrate content of the ECP was not conclusive. The
composition of the remaining ECP was thought to consist of nucleic acids, humic
substances and lipids, but these were not assayed for in this case.
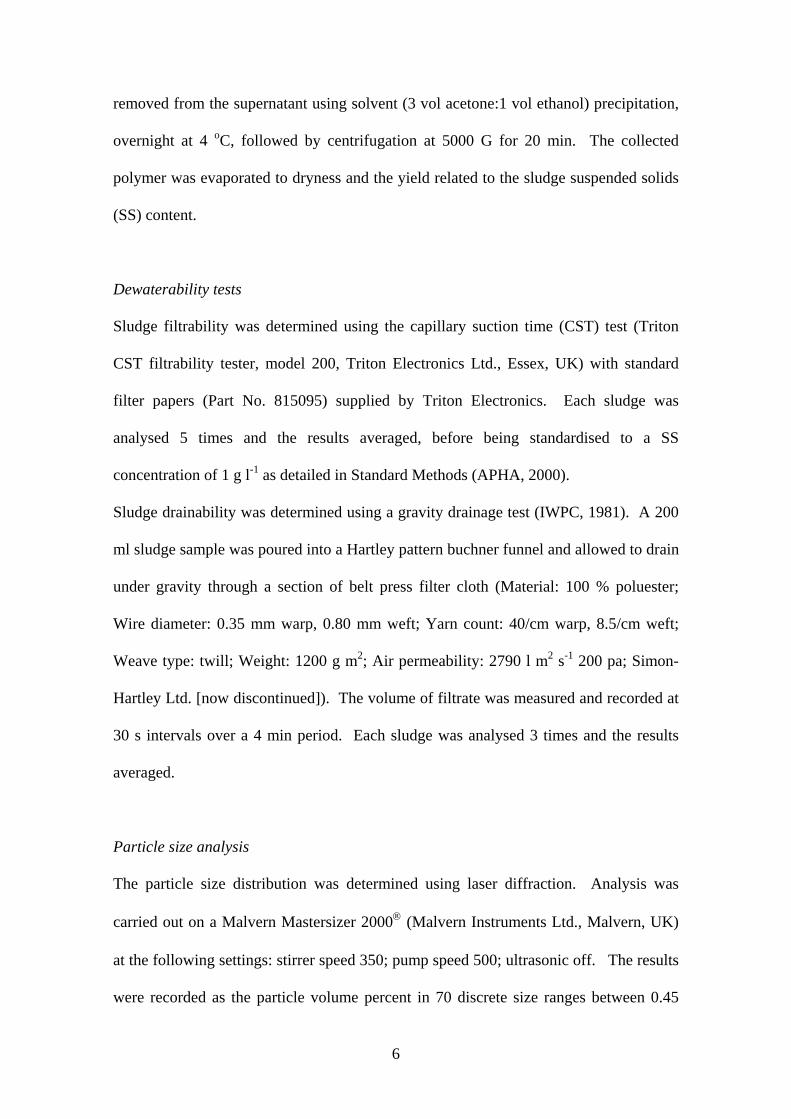
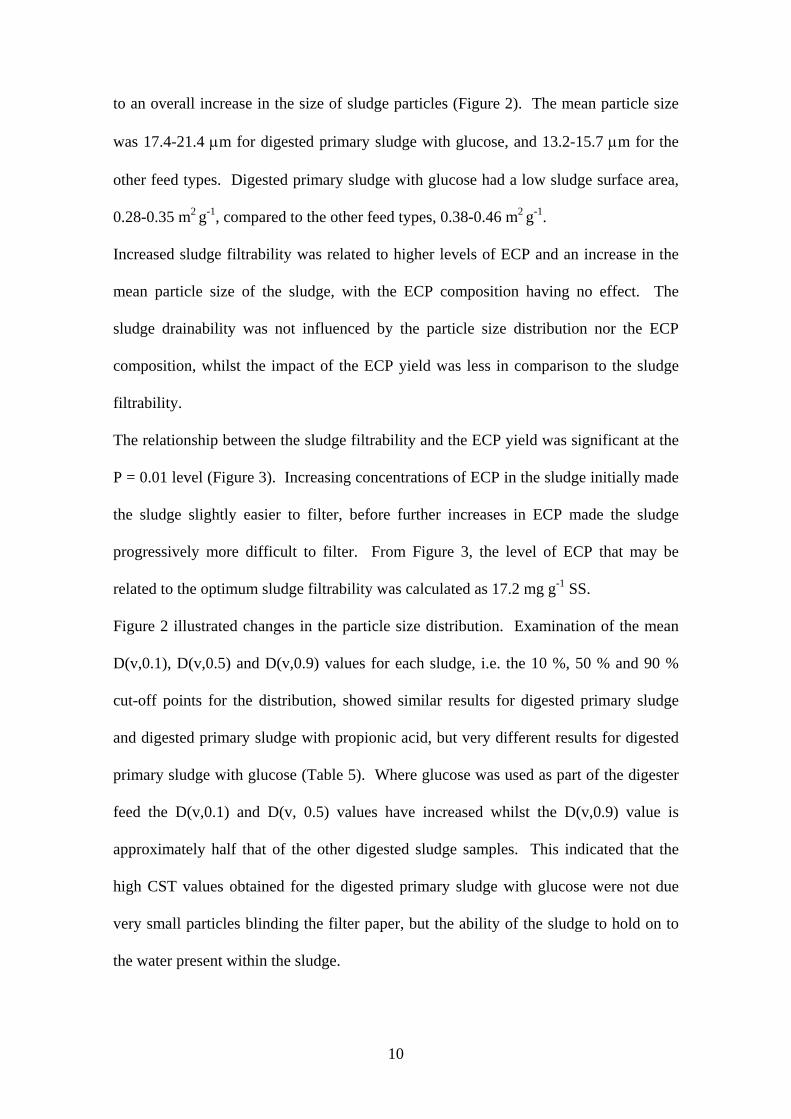
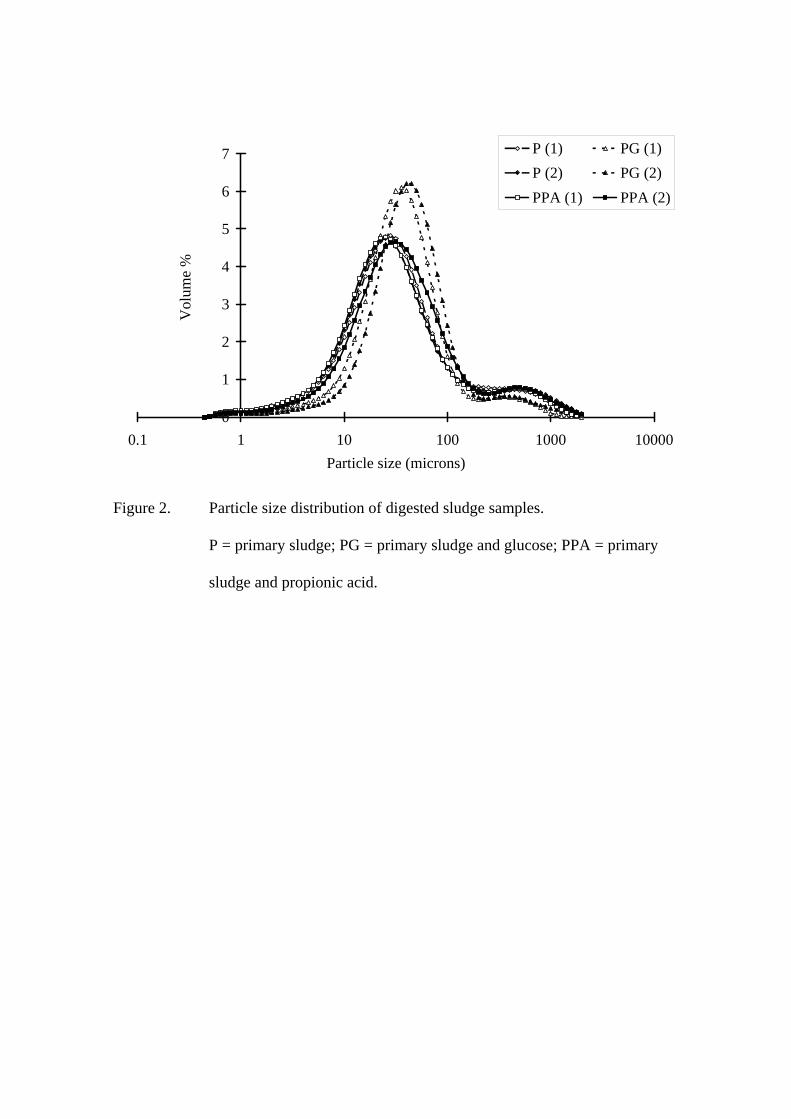
The particle size distribution of digested primary sludge and digested primary sludge
with propionic acid were similar, whereas digestion of primary sludge with glucose led
10
to an overall increase in the size of sludge particles (Figure 2). The mean particle size
was 17.4-21.4 μm for digested primary sludge with glucose, and 13.2-15.7 μm for the
other feed types. Digested primary sludge with glucose had a low sludge surface area,
0.28-0.35 m2 g-1, compared to the other feed types, 0.38-0.46 m2 g-1.
Increased sludge filtrability was related to higher levels of ECP and an increase in the
mean particle size of the sludge, with the ECP composition having no effect. The
sludge drainability was not influenced by the particle size distribution nor the ECP
composition, whilst the impact of the ECP yield was less in comparison to the sludge
filtrability.
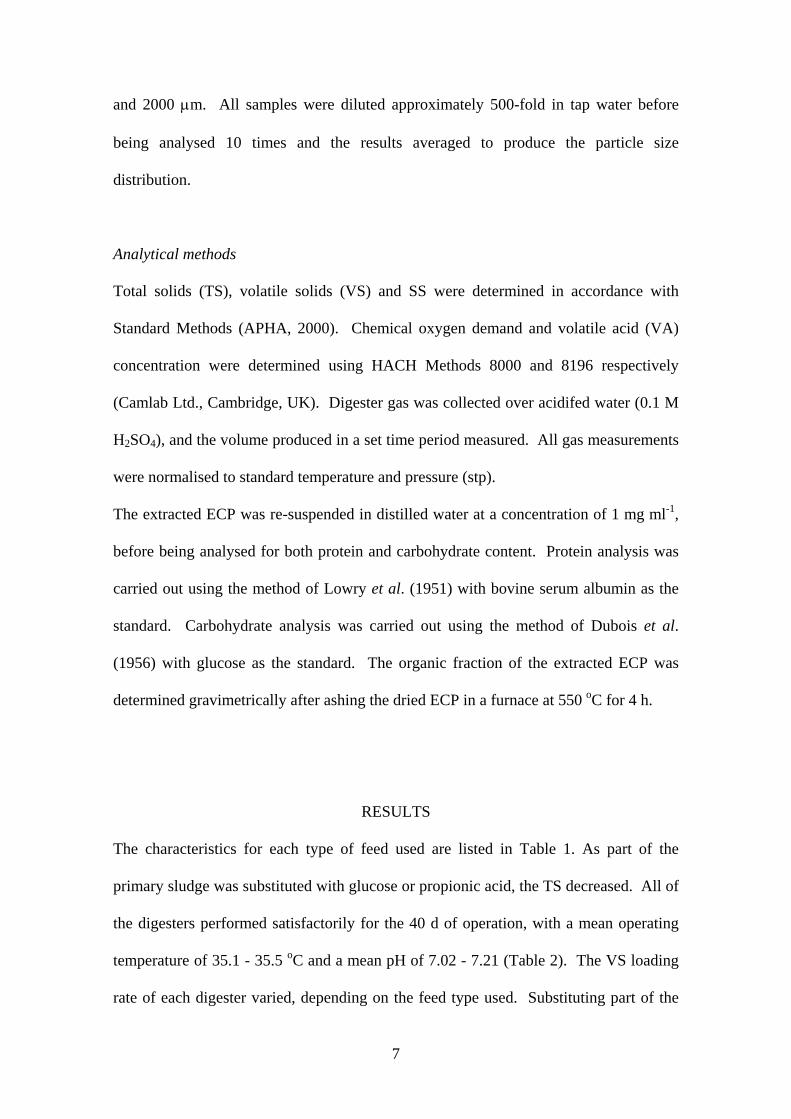
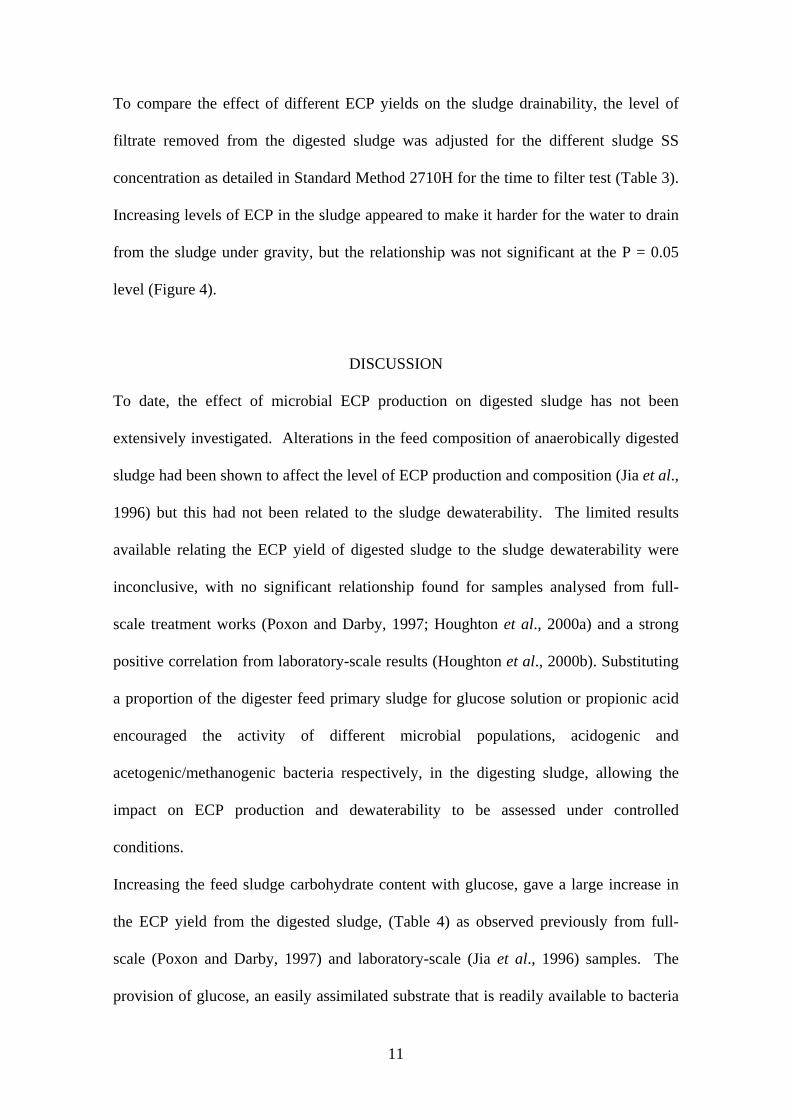
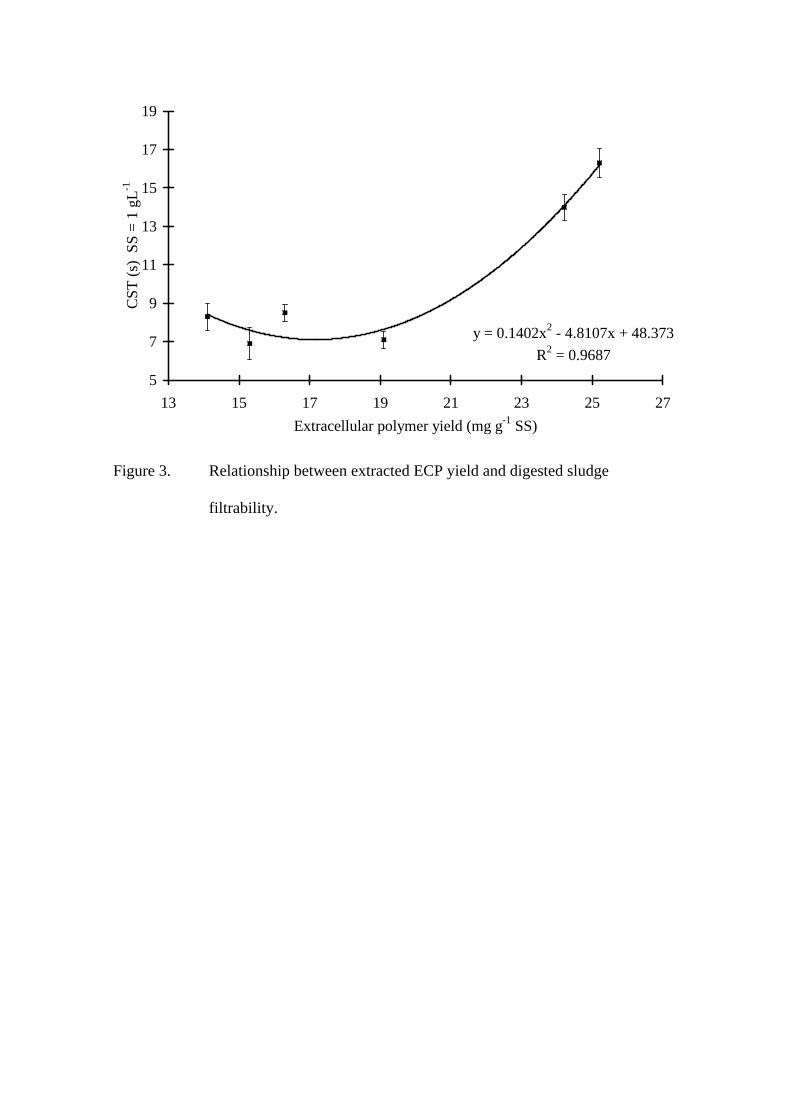
The relationship between the sludge filtrability and the ECP yield was significant at the
P = 0.01 level (Figure 3). Increasing concentrations of ECP in the sludge initially made
the sludge slightly easier to filter, before further increases in ECP made the sludge
progressively more difficult to filter. From Figure 3, the level of ECP that may be
related to the optimum sludge filtrability was calculated as 17.2 mg g-1 SS.
Figure 2 illustrated changes in the particle size distribution. Examination of the mean
D(v,0.1), D(v,0.5) and D(v,0.9) values for each sludge, i.e. the 10 %, 50 % and 90 %
cut-off points for the distribution, showed similar results for digested primary sludge
and digested primary sludge with propionic acid, but very different results for digested
primary sludge with glucose (Table 5). Where glucose was used as part of the digester
feed the D(v,0.1) and D(v, 0.5) values have increased whilst the D(v,0.9) value is
approximately half that of the other digested sludge samples. This indicated that the
high CST values obtained for the digested primary sludge with glucose were not due
very small particles blinding the filter paper, but the ability of the sludge to hold on to
the water present within the sludge.
11
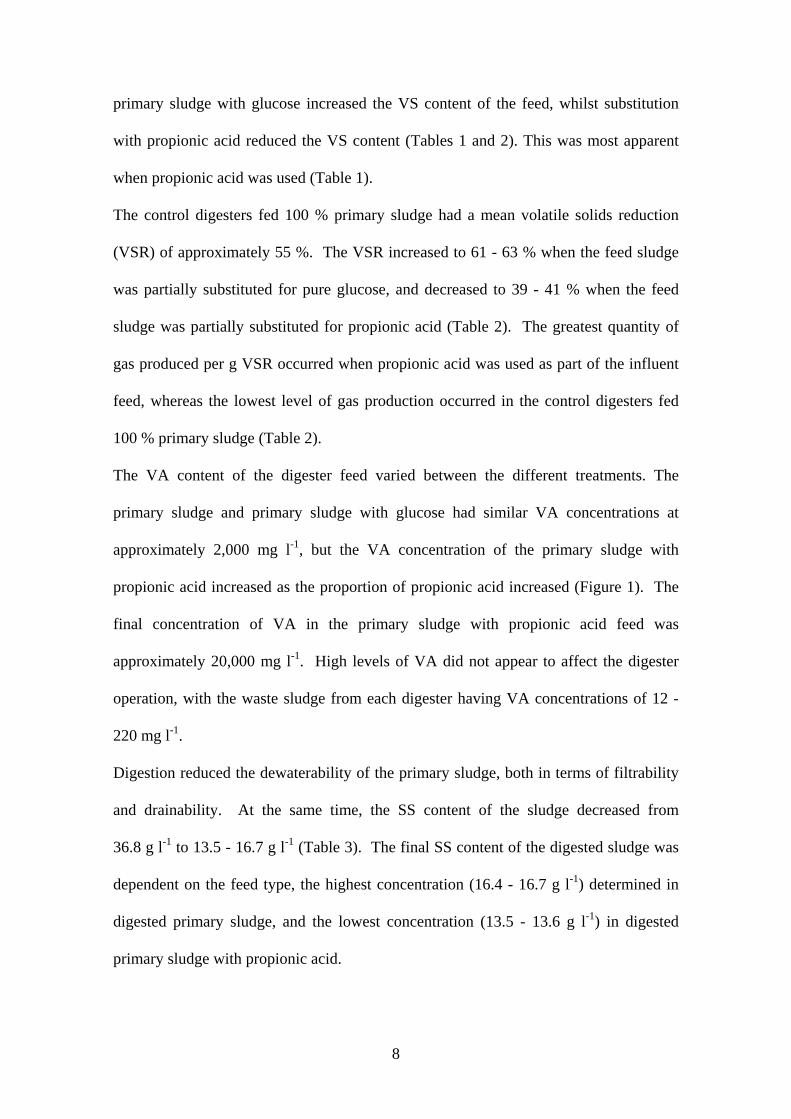
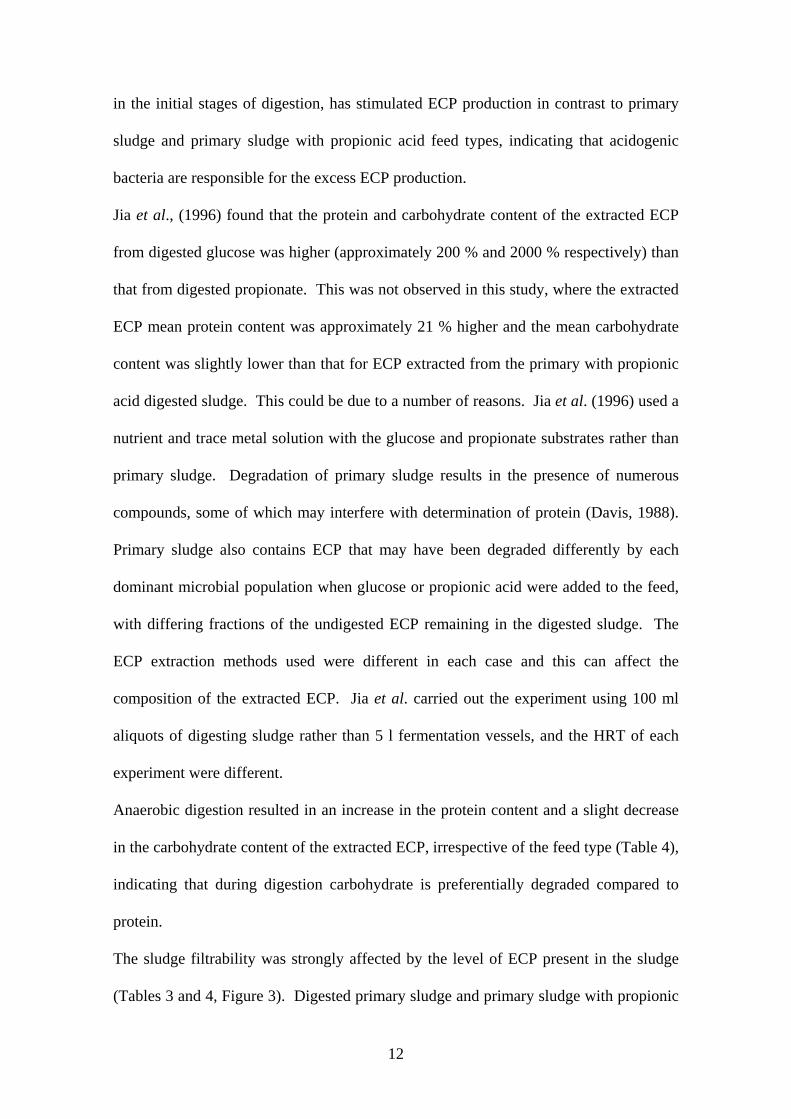
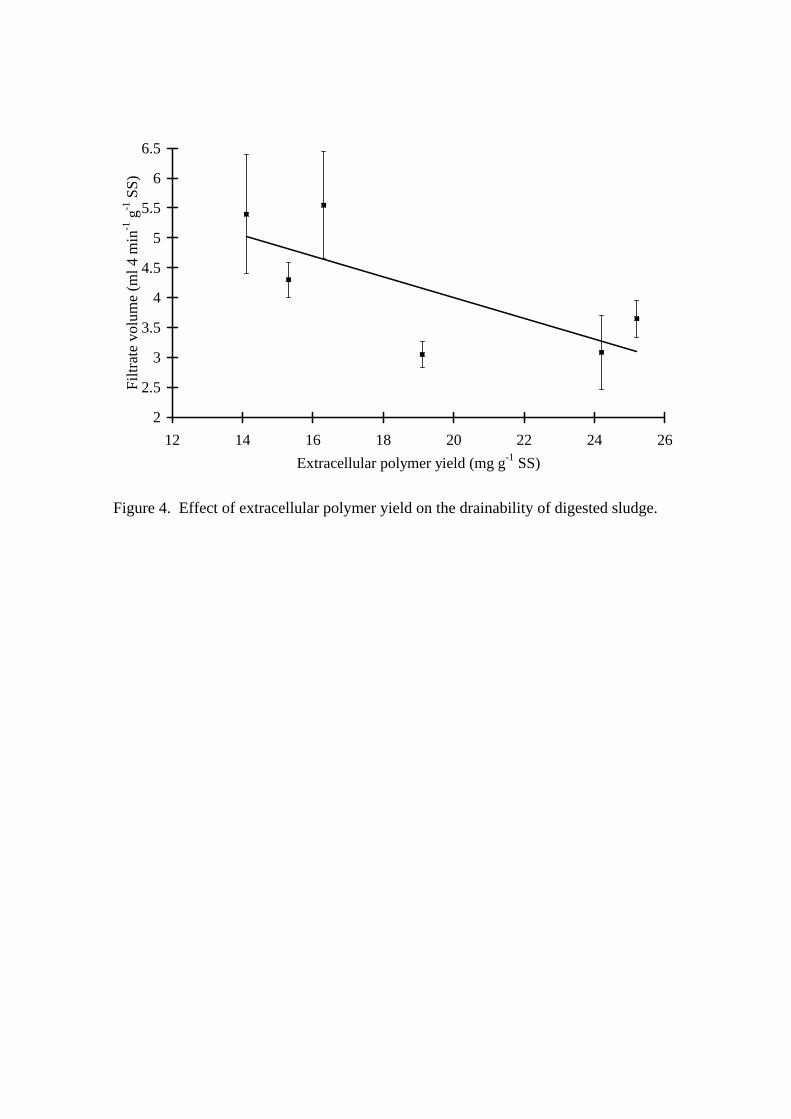
To compare the effect of different ECP yields on the sludge drainability, the level of
filtrate removed from the digested sludge was adjusted for the different sludge SS
concentration as detailed in Standard Method 2710H for the time to filter test (Table 3).
Increasing levels of ECP in the sludge appeared to make it harder for the water to drain
from the sludge under gravity, but the relationship was not significant at the P = 0.05
level (Figure 4).
DISCUSSION
To date, the effect of microbial ECP production on digested sludge has not been
extensively investigated. Alterations in the feed composition of anaerobically digested
sludge had been shown to affect the level of ECP production and composition (Jia et al.,
1996) but this had not been related to the sludge dewaterability. The limited results
available relating the ECP yield of digested sludge to the sludge dewaterability were
inconclusive, with no significant relationship found for samples analysed from full-
scale treatment works (Poxon and Darby, 1997; Houghton et al., 2000a) and a strong
positive correlation from laboratory-scale results (Houghton et al., 2000b). Substituting
a proportion of the digester feed primary sludge for glucose solution or propionic acid
encouraged the activity of different microbial populations, acidogenic and
acetogenic/methanogenic bacteria respectively, in the digesting sludge, allowing the
impact on ECP production and dewaterability to be assessed under controlled
conditions.
Increasing the feed sludge carbohydrate content with glucose, gave a large increase in
the ECP yield from the digested sludge, (Table 4) as observed previously from full-
scale (Poxon and Darby, 1997) and laboratory-scale (Jia et al., 1996) samples. The
provision of glucose, an easily assimilated substrate that is readily available to bacteria
12
in the initial stages of digestion, has stimulated ECP production in contrast to primary
sludge and primary sludge with propionic acid feed types, indicating that acidogenic
bacteria are responsible for the excess ECP production.
Jia et al., (1996) found that the protein and carbohydrate content of the extracted ECP
from digested glucose was higher (approximately 200 % and 2000 % respectively) than
that from digested propionate. This was not observed in this study, where the extracted
ECP mean protein content was approximately 21 % higher and the mean carbohydrate
content was slightly lower than that for ECP extracted from the primary with propionic
acid digested sludge. This could be due to a number of reasons. Jia et al. (1996) used a
nutrient and trace metal solution with the glucose and propionate substrates rather than
primary sludge. Degradation of primary sludge results in the presence of numerous
compounds, some of which may interfere with determination of protein (Davis, 1988).
Primary sludge also contains ECP that may have been degraded differently by each
dominant microbial population when glucose or propionic acid were added to the feed,
with differing fractions of the undigested ECP remaining in the digested sludge. The
ECP extraction methods used were different in each case and this can affect the
composition of the extracted ECP. Jia et al. carried out the experiment using 100 ml
aliquots of digesting sludge rather than 5 l fermentation vessels, and the HRT of each
experiment were different.
Anaerobic digestion resulted in an increase in the protein content and a slight decrease
in the carbohydrate content of the extracted ECP, irrespective of the feed type (Table 4),
indicating that during digestion carbohydrate is preferentially degraded compared to
protein.
The sludge filtrability was strongly affected by the level of ECP present in the sludge
(Tables 3 and 4, Figure 3). Digested primary sludge and primary sludge with propionic
13
acid had similar CST results, 6.9-8.5 s, and extractable ECP yields, 14.1-19.2 mg g-1 SS.
Adding glucose to the primary sludge increased the digested sludge ECP yield to > 24
mg g-1 SS and doubled the CST to 14.0-16.3 s. The CST is also affected by the particle
size distribution, with an increase in surface area increasing the frictional resistance to
the withdrawal of water (Lawler et al., 1986). The digested primary sludge with
glucose had fewer fine particles (Table 5) and hence a lower surface area than the other
digested feed types. This indicated that it was likely that the extra ECP present in the
digested primary sludge with glucose that was making it harder to remove water from
the sludge (Wu et al., 1982), rather than the increased frictional resistance of the
particles (Lawler et al., 1986). The gravity drainage test also indicated that the presence
of extra ECP in the digested sludge made the sludge harder to drain (Figure 4) but the
result was not significant at the P = 0.05 level.
The effect of the different feed types on the particle size of the digested sludge clearly
showed the different level of activity of the separate microbial groups. Digested
primary sludge with glucose had an increased particle size at the low end (D(v,01) and
D(v,0.5)) of the distribution. This correlated with increased levels of ECP, which was
likely to result in flocculation of the smallest particles present (Wingender et al., 1999).
In contrast, the mean D(v,0.9) was nearly half that of the digested primary sludge and
primary sludge with propionic acid. The first stage in anaerobic digestion is hydrolysis,
using hydrolytic enzymes to break down the large particles of organic matter into
compounds that can then be assimilated by the bacteria and degraded further (Gujer and
Zehnder, 1983). The availability of an easily assimilated substrate, glucose, has
increased this initial stage of digestion, reducing the largest particles present in the
sludge in comparison to the other treatments.
14
Previous work has indicated that the particle size distribution of digested sludge has the
greatest impact on the sludge dewaterability (Karr and Keinath, 1978; Lawler et al.,
1986). This may be true when similar levels of ECP are present in the sludge, but the
results presented here indicate that when the ECP content of a sludge is increased to a
high concentration, it appears to have a direct impact on the sludge dewaterability that
is not related to the size distribution of the particles.
CONCLUS1ONS
The use of a high carbohydrate feed had a significant impact on the ECP content and
dewaterability of digested sludge: the extractable ECP yield doubled; the measured CST
doubled; the mean gravity drainage time increased; the particle size distribution altered
with fewer fine particles and a reduction in the largest particle size.
Substitution of part of the primary sludge feed with propionic acid had no impact on the
digested sludge ECP content and dewaterability compared to the control digesters fed
100 % primary sludge.
The relationship between the extracted ECP yield and sludge filtrability was significant
at the P = 0.01 level. For the sludge produced, a calculated ECP yield of 17.2 mg g-1 SS
appeared to be necessary for optimum sludge dewaterability.
ACKNOWLEDGEMENTS
JIH is supported by a UK Engineering and Physical Sciences research Council (EPSRC)
Grant GR/L 87255 and supported by Anglian Water plc. The authors thank Tina
Rowney of Malvern Instruments Limited, UK, for assistance in the particle size analysis
of the sludge samples.
15
REFERENCES
APHA (2000) Standard Methods for the Examination of Water and Water Water, 18th
ed. American Public Health Association/American Water Works Association/Water
Environment Federation, Washington DC, USA.
Brooks R. B. (1970) Heat treatment of sewage sludge. Water Pollut. Contr., 69, 92-
99.
Costerton J. W., Irvin R. T. and Cheng K.-J. (1981) The bacterial glycocalyx in nature
and disease. Ann. Rev. Microiol., 35, 299-324.
Davis E. M. (1988) Protein assays: a review of common techniques. Am. Biotechnol.
Lab., 6, 28-37.
Dubois M., Gilles K. A., Hamilton J. K., Reberd P. A. and Smith F. (1956)
Colourimetric method for determination of sugars and related substances. Anal. Chem.,
28(3), 350-356.
Gujer W. and Zehnder A. J. B. (1983) Conversion processes in anaerobic digestion.
Wat. Sci. Tech., 15, 127-167.
Hall J. E. (1995) Sewage sludge production, treatment and disposal in the European
Union. J. Chart. Inst. Wat. Environ. Manage., 9, 335-343.
Houghton J. I., Stephenson T. and Quarmby J. (2000a) The impact of digestion on
sludge dewaterability. Trans IChemE, Part B, 78, 153-159.
Houghton J. I., Stephenson T. and Quarmby J. (2000b) The impact of digester
retention time on microbial extracellular polymer production and sludge dewaterability.
Environ. Technol., 21, 1157-1165.
Hudson J. A. and Lowe P. (1996) Current technologies for sludge treatment and
disposal. J. Chart. Inst. Wat. Environ. Manage., 10, 436-441.
16
IWPC (1981) Manuals of British practice in Water Pollution Control. Sewage Sludge
II: Conditioning, Dewatering and Thermal Drying. The Institute of Water Pollution
Control, Ledson House, 53 London Road, Maidstone, Kent, UK.
Jia X. S., Furumai H. and Fang H. H. P. (1996) Yield of biomass and extracellular
polymers in four anaerobic sludges. Environ. Technol., 17, 283-291.
Kang S.-M., Kishimoto M., Shioya S., Yoshida T., Suga K.-I. and Taguchi H. (1989)
Dewatering characteristics of activated sludges and effect of extracellular polymer. J.
Ferment. Bioeng., 68(2), 117-122.
Karr P. R. and Keinath T. M. (1978) Influence of particle size on sludge
dewaterability. J. Water Pollut. Contr. Fed., 50, 1911-1930.
Kuo W.-C., Sneve M. A. and Parkin G. F. (1996) Formation of soluble microbial
products during anaerobic treatment. Wat. Environ. Res., 68(3), 279-285.
Lawler D. F., Chung Y. J., Hwang S.-J., and Hull B. A. (1986) Anaerobic digestion:
effects on particle size and dewaterability. J. Wat. Pollut. Contr. Fed., 58(12), 1107-
1117.
Lowry O. H., Rosebrough N. J., Farr A. L. and Randell R. J. (1951) Protein
measurement with the folin phenol reagent. J. Biol. Chem., 193, 263-275.
Morgan J. W., Forster C. F. and Evison L., (1990) A comparative study of the nature
of biopolymers extracted from anaerobic and activated sludges. Wat. Res., 24(6), 743-
750.
Nellenschulte T. and Kayser R. (1997) Change of particle structure of sewage sludges
during mechanical and biological processes with regard to the dewatering result. Wat.
Sci. Tech., 36(4), 293-306.
Noguera D. R., Araki N. and Rittmann B. E. (1994) Soluble microbial products (SMP)
in anaerobic chemostats. Biotechnol. Bioengeer., 44, 1040-1047.
17
Novak T., Becker H. and Zurow A. (1977) Factors influencing activated sludge
properties. J. Environ. Engineer., 103, 815-828.
Pearson E. L. and Buswell A. M. (1931) Sludge ripeness studies. Indust. Engineer.
Chem. Anal., 3, 359-360.
Poxon T. L. and Darby J. L. (1997) Extracellular polyanions in digested sludge:
measurement and relationship to sludge dewaterability. Wat. Res., 31(4), 749-758.
Rudolfs W. and Heukelekian H. (1934) Relation between drainability of sludge and
degree of digestion. Sew. Works J., 6, 1073-1081.
Ryssov-Nielsen H. (1975) The role of natural extracellular polymers in the
bioflocculation and dewatering of sludge (literature survey). Vatten, 31(1), 33-39.
Wingender J., Neu T. R. and Flemming H.-C. (1999) What are bacterial extracellular
polymeric substances? In: Microbial extracellular polymeric substances, Wingender J.,
Neu T. R. and Flemming H.-C. (ed.), pp. 1-19, Springer-Verlag, Berlin, Germany.
Wu Y. C., Smith E. D. and Novak R. (1982) Filterability of activated sludge in
response to growth conditions. Journal WPCF, 54(5), 444-456.
Yan L., Barile G., Loré F., Lotito V. and Spinosa L. (1987) Influence of digestion on
sewage sludge stability and dewaterability. Environ. Technol. Lett., 8, 249-259.
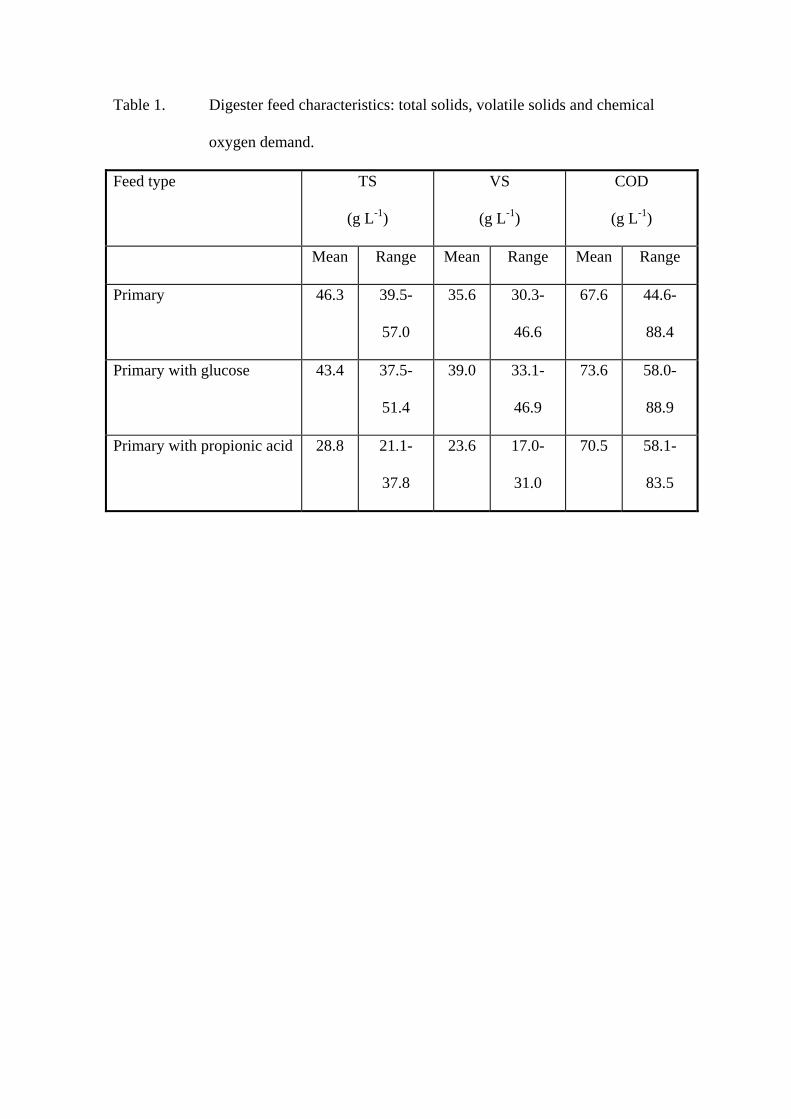
Table 1. Digester feed characteristics: total solids, volatile solids and chemical
oxygen demand.
Feed type TS
(g L-1)
VS
(g L-1)
COD
(g L-1)
Mean Range Mean Range Mean Range
Primary 46.3 39.5-
57.0
35.6 30.3-
46.6
67.6 44.6-
88.4
Primary with glucose 43.4 37.5-
51.4
39.0 33.1-
46.9
73.6 58.0-
88.9
Primary with propionic acid 28.8 21.1-
37.8
23.6 17.0-
31.0
70.5 58.1-
83.5
1
10
100
1000
10000
100000
0 10 20 30 40Time (d)
VA
con
cent
ratio
n (m
g L-1
)P (1)
PG (1)
P (2)
PG (2)
PPA (1)
PPA (2)
P feed
PG feed
PPA feed
Figure 1. Volatile acid content of digester feed and waste sludge throughout the 40
days of operation. P = primary sludge; PG = primary sludge and
glucose;
PPA = primary sludge and propionic acid.
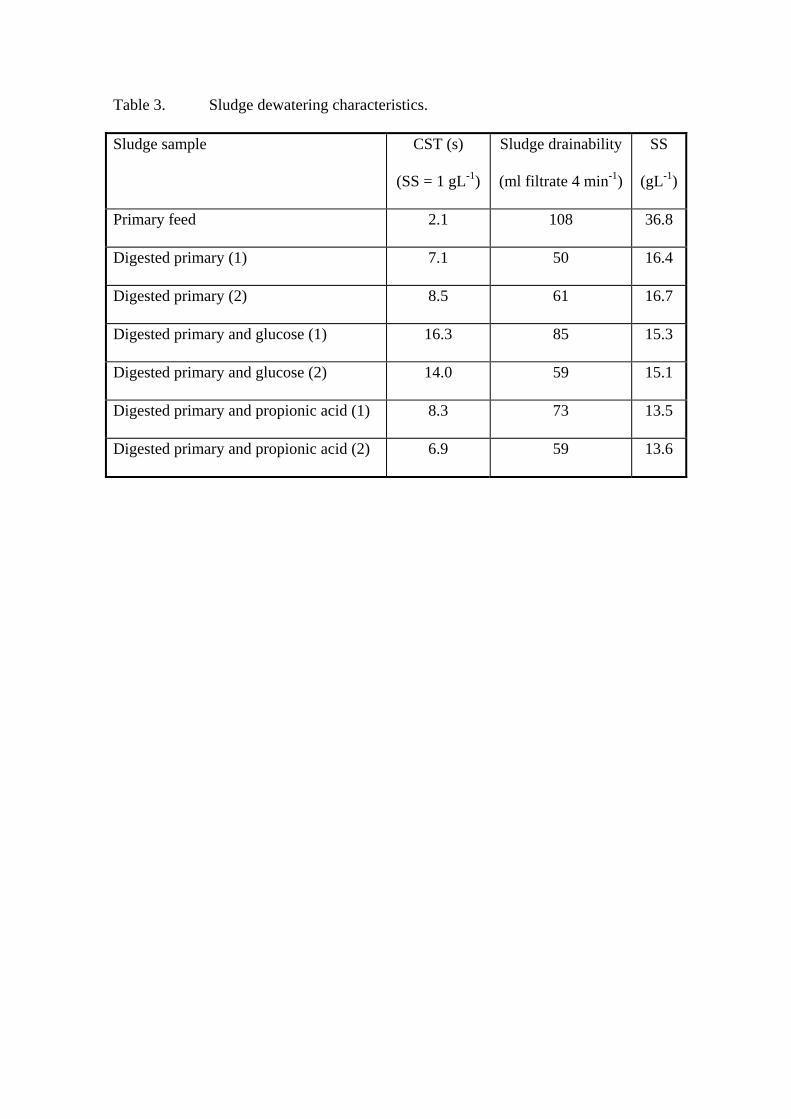
Table 3. Sludge dewatering characteristics.
Sludge sample CST (s)
(SS = 1 gL-1)
Sludge drainability
(ml filtrate 4 min-1)
SS
(gL-1)
Primary feed 2.1 108 36.8
Digested primary (1) 7.1 50 16.4
Digested primary (2) 8.5 61 16.7
Digested primary and glucose (1) 16.3 85 15.3
Digested primary and glucose (2) 14.0 59 15.1
Digested primary and propionic acid (1) 8.3 73 13.5
Digested primary and propionic acid (2) 6.9 59 13.6

Table 4. Sludge extracellular polymer yield and organic composition.
nd = not determined; P = primary sludge; PG = primary sludge with
glucose; PPA = primary sludge with propionic acid.
Sludge sample ECP yield
(mg g-1 SS)
Organic
fraction (%)
Analysis of organic fraction
Protein
(%)
Carbohydrate
(%)
nd
(%)
Primary 19.6 72.8 19.9 21.2 58.9
Digested P (1) 19.2 71.6 28.6 21.1 50.3
Digested P (2) 16.3 75.0 24.6 18.6 56.8
Digested PG (1) 25.3 79.4 27.3 19.8 52.9
Digested PG (2) 24.4 79.3 27.9 20.8 51.3
Digested PPA (1) 14.1 71.7 22.7 18.9 58.4
Digested PPA (2) 15.3 68.3 23.0 20.1 56.9
0
1
2
3
4
5
6
7
0.1 1 10 100 1000 10000Particle size (microns)
Vol
ume
%
P (1) PG (1)P (2) PG (2)PPA (1) PPA (2)
Figure 2. Particle size distribution of digested sludge samples.
P = primary sludge; PG = primary sludge and glucose; PPA = primary
sludge and propionic acid.
y = 0.1402x2 - 4.8107x + 48.373R2 = 0.9687
5
7
9
11
13
15
17
19
13 15 17 19 21 23 25 27Extracellular polymer yield (mg g-1 SS)
CST
(s)
SS =
1 g
L-1
Figure 3. Relationship between extracted ECP yield and digested sludge
filtrability.
2
2.5
3
3.5
4
4.5
5
5.5
6
6.5
12 14 16 18 20 22 24 26Extracellular polymer yield (mg g-1 SS)
Filtr
ate
volu
me
(ml 4
min
-1 g
-1 S
S)
Figure 4. Effect of extracellular polymer yield on the drainability of digested sludge.

Table 5. Digested sludge mean particle size: 10, 50 and 90 percentile values.
Feed type Mean particle size (μm)
D(v,0.1) D(v,0.5) D(v,0.9)
Digested primary (1) 7.49 28.22 226.4
Digested primary (2) 7.09 26.83 240.2
Digested primary and glucose (1) 11.02 33.08 101.6
Digested primary and glucose (2) 14.02 39.86 125.3
Digested primary and propionic acid (1) 7.03 25.98 191.4
Digested primary and propionic acid (2) 8.65 32.24 224.1

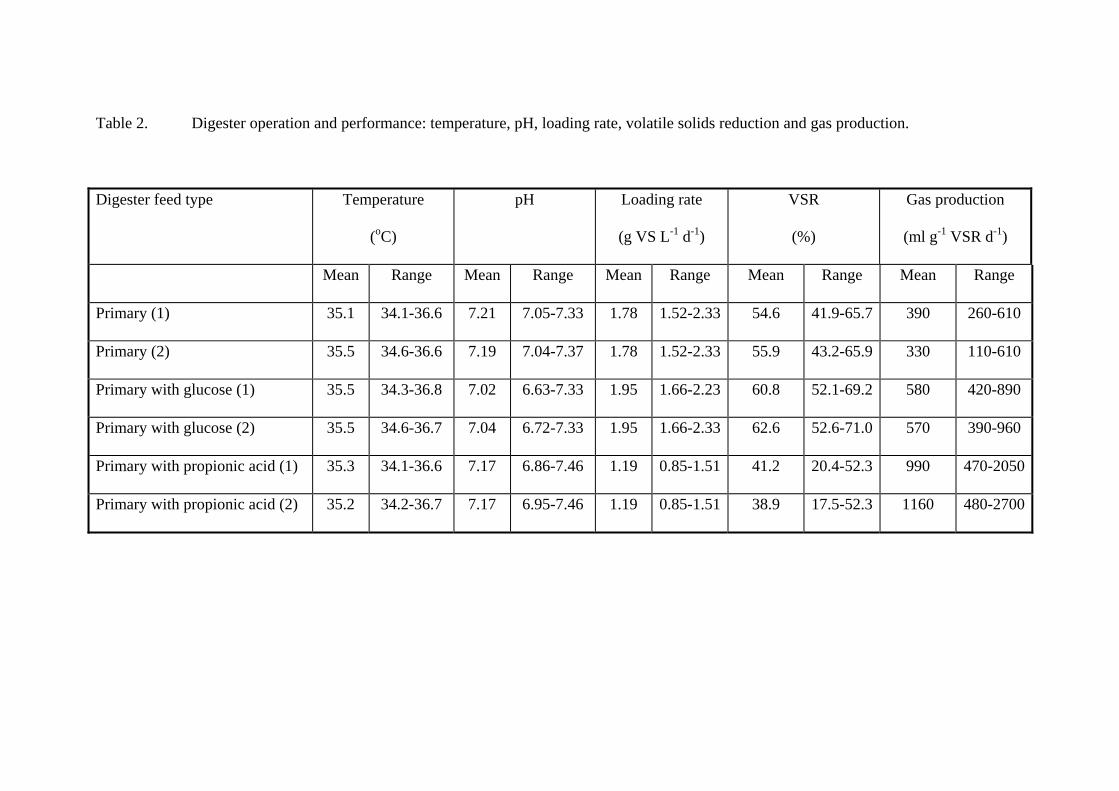
Table 2. Digester operation and performance: temperature, pH, loading rate, volatile solids reduction and gas production.
Digester feed type Temperature
(oC)
pH Loading rate
(g VS L-1 d-1)
VSR
(%)
Gas production
(ml g-1 VSR d-1)
Mean Range Mean Range Mean Range Mean Range Mean Range
Primary (1) 35.1 34.1-36.6 7.21 7.05-7.33 1.78 1.52-2.33 54.6 41.9-65.7 390 260-610
Primary (2) 35.5 34.6-36.6 7.19 7.04-7.37 1.78 1.52-2.33 55.9 43.2-65.9 330 110-610
Primary with glucose (1) 35.5 34.3-36.8 7.02 6.63-7.33 1.95 1.66-2.23 60.8 52.1-69.2 580 420-890
Primary with glucose (2) 35.5 34.6-36.7 7.04 6.72-7.33 1.95 1.66-2.33 62.6 52.6-71.0 570 390-960
Primary with propionic acid (1) 35.3 34.1-36.6 7.17 6.86-7.46 1.19 0.85-1.51 41.2 20.4-52.3 990 470-2050
Primary with propionic acid (2) 35.2 34.2-36.7 7.17 6.95-7.46 1.19 0.85-1.51 38.9 17.5-52.3 1160 480-2700