effect of hf and hno3 concentration on etching rate of
TRANSCRIPT

Effect of HF and HNO3 Concentration on Etching Rate of Each Componentin Waste Crystalline Silicon Solar Cells
Kei Takami1,+1, Masatoshi Kobashi2,+2, Yuki Shiraga2,+3,Md.Azhar Uddin1, Yoshiei Kato1,+4 and Shengji Wu3
1Department of Material and Energy Science, Graduate School of Environmental and Life Science,Okayama University, Okayama 700-8530, Japan2Department of Environmental Chemistry and Materials, Faculty of Environmental Science and Technology,Okayama University, Okayama 700-8530, Japan3Department of Environmental Science and Engineering, Hangzhou Dianzi University, Hangzhou 310018, China
In order to maximize the recovery of silicon wafer in waste crystalline silicon solar cells, chemical treatment has been carried out by usingthe mixed solution of hydrofluoric acid (HF) and nitric acid (HNO3). The effect of HF and HNO3 concentrations on etching rates of severalcomponents such as silver (Ag), aluminum (Al), anti-reflection film made of silicon nitride (AR) and silicon (Si) in the solar cells has been madeclear. The etching rates of Ag, Al and Si are held almost constant with time and become larger with the increasing HF concentration and theetching temperature. All of the etching rates of Al, AR and Si have peaked at the HF mole fraction of about 0.8. The dependency of HFconcentration on Al, AR and Si etching rates becomes larger than that of HNO3. As the best solution composition for the Si recovery yield, thefollowing relation has been found in this study: (number of AR moles)/(number of Al moles) = 7.62 © 10¹4 CHNO3
0.59CHF0.74 where CHNO3,
CHF: HNO3, HF concentration (kmol/m3). [doi:10.2320/matertrans.M2015293]
(Received July 15, 2015; Accepted September 3, 2015; Published November 25, 2015)
Keywords: solar cell, silicon, photovoltaic cell, recycling, etching, hydrofluoric acid, nitric acid
1. Introduction
Due to the increase in photovoltaic (PV) market in theworld, the recovery of end-of-pipe or rejected PV moduleshas been also much in demand. It is particularly important toestablish the reusing or recycling system of crystalline siliconsolar cell which accounts for PV modules above 80% in theworld. A typical recycling flow17) of crystalline silicon solarcells is shown in Fig. 1. Frames made of aluminum aredetached, polymer encapsulants made of ethylene vinylacetate (EVA) and glasses are removed, and silicon solar cellsare etched chemically. Both of the frames and the glasses areusually recovered for reusing or recycling. However, the solarcells do not always recover due to the crack in cases of theseparation of the EVAs and the glasses from the PV modules.
There are a variety of investigations on chemical treatmentof silicon solar cells. The etching targets are the surfaceelectrode made of silver, the anti-reflection film (AR)including silicon nitride, the back electrode made ofaluminum and the p-n junction part in the silicon wafer. Inorder to dissolve each target efficiently, various etchingsolutions were used sequentially as follows: HNO3-HCl-HF/HNO3,3) HCl-HF/HNO3,3) NaOH-HF,3) HF/HNO3/CH3-COOH,8) HF/H2SO4/CH3COOH,8) HF/HNO3-KOH,9)
H3PO4-HF/HNO3,9) HF/HNO3/CH3COOH,10,11) HF/HNO3/Br2,10,11) HF/HNO3/AgNO3,12,13) NOHSO4/HF/H2SO4
12,13) and HF/HNO3/CH3COOH/Br.14) However,there was little study on the etching rate of each component
in the silicon solar cell when concentration of etchingsolution was varied widely. In addition, the relationshipbetween the silicon wafer recovery yield and the etching rateswas not analyzed sufficiently, although it depends on theetching rates of silver, aluminum and AR film covering thesilicon wafer. The present work is intended to propose theetching procedure to obtain the maximum silicon recoveryyield by studying the effect of the composition in hydrogenfluoride (HF)-nitric acid (HNO3) solution on the etching rateof each component of the silicon solar cells.
2. Experimental Procedure
2.1 Experimental procedureFigure 2 shows a schematic diagram of multicrystalline
silicon solar cell used for experiment. The sample surfacearea was 0.031 © 0.031m2 and the thicknesses were 1.6 ©10¹4m for the silicon wafer (silicon, Si), 8.0 © 10¹8m for the
Fig. 1 A typical recycling flow of crystalline silicon solar cells.
+1Graduate Student, Okayama University. Present address: ShimanePrefecture, Okinoshima 685-8601, Japan
+2Undergraduate Student, Okayama University. Present address: TorayIndustries Inc., Tokyo 103-8666, Japan
+3Undergraduate Student, Okayama University. Present address: OkayamaPrefecture Police, Okayama 700-0824, Japan
+4Corresponding author, E-mail: [email protected]
Materials Transactions, Vol. 56, No. 12 (2015) pp. 2047 to 2052©2015 The Japan Institute of Metals and Materials

anti-reflection film (Si3N4), 3.3 © 10¹5m for the surfaceelectrode (silver, Ag) and 3.1 © 10¹5m for the back electrode(aluminum, Al). The sample was dipped into the etchingsolution prepared by mixing 26.45 kmol/m3 of hydrofluoricacid, 13.00 kmol/m3 of nitric acid and deionized water byhanging from the top. The etching rate was calculated fromthe perfect dissolution time measured by visual observations,assuming that each component of the sample was dissolveduniformly and layer by layer.
The effect of etching solution amount on the etching rate ofeach component was studied when the solution volume wasvaried from 1 © 10¹5 to 2.0 © 10¹4m3, and HF and HNO3
concentrations were kept constant at 6.61 and 3.25 kmol/m3,respectively. The etching temperature was fixed to 298K.The temporal change in etching amount before the perfectdissolution was measured under two kinds of HF and HNO3
concentrations (kmol/m3) such as HF/HNO3 = 2.38/5.33,4.36/4.33 for Ag and Al, and HF/HNO3 = 1.32/5.85, 2.64/5.20 for Si. The solution volume was fixed to 1.00 © 10¹4m3
and the etching temperature was 298 and 323K. On the otherhand, to study the effect of the solution concentration on theetching rate, 14 kinds of concentrations were prepared withthe etching temperature of 298K and the solution volume of1.00 © 10¹4m3 as shown in Fig. 3.
2.2 Quantitative analysis of components in solar cellsSilver, aluminum and silicon concentrations in the etching
solution were analyzed quantitatively in order to find thetemporal change in weight of each component in the solarcell. Silver etching amount was obtained from measuring
weight of AgCl precipitate after putting excess NaCl into theetching solution. Aluminum concentration in the etchingsolution was measured by the chelate titration method usingEDTA as titrant and Cu-PAN as indicator. To determine thesilicon concentration,15) K2SiF6 was precipitated by addingKCl and ethanol into the H2SiF6-contained etching solution,and then K2SiF6 precipitate was dissolved by adding NaOHsolution as K2SiF6 + 4OH¹ ¼ Si(OH)4 + 2K+ + 6F¹.
3. Results and Discussion
3.1 Relationship between etching time of solar cell andacid residual ratio
The etching reaction equations of Ag, Al, Si3N4 and Si inHF/HNO3 solution are as follows:
Agþ HF ! AgFþ Hþ þ e ð1Þ3Agþ 4HNO3 ! 3AgNO3 þ 2H2Oþ NO ð2ÞAlþ 3HF ! AlF3 þ 3Hþ þ 3e ð3ÞSi3N4 þ 18HFþ 4Hþ ! 3H2SiF6 þ 4NH4
þ ð4Þ3Siþ 18HFþ 4HNO3 ! 3H2SiF6 þ 4NOþ 8H2O ð5Þ
As the weights of Ag, Al, AR(Si3N4) and Si in the samplewere 3.1 © 10¹5, 3.2 © 10¹5, 2.6 © 10¹7 and 3.7 © 10¹4 kg,respectively, mole numbers of HF and HNO3 used to etch theabove components were calculated as 0.083 and 0.018mol,respectively. Consumption of HF and HNO3 for Ag etchingexpressed by eqs. (1) and (2) was distributed accordingto molar ratio of HF/HNO3 = 6.61/3.25 as shown insection 2.1. Hydrogen fluoride consumed by Si etching were0.079mol (95% of total HF), whereas nitric acid were0.018mol (78% of total HNO3).
The etching times of Al, AR and Si in the sample areshown in Fig. 4 where CHF and CHNO3 are defined as HF andHNO3 concentration (kmol/m3), respectively. Here, theetching time means the time from the charge of sample intothe etching solution to the perfect dissolution of eachcomponent. The Al and AR etching times were keptapproximately constant over 1.0 © 10¹5m3 solution volume.However, the Si etching time at 1.0 © 10¹5m3 solutionvolume became larger due to a decrease in HF and HNO3
Fig. 3 Hydrofluoric acid, nitric acid and deionized water concentrationsused for experiment.
Fig. 4 Effect of acid solution volume on etching time of elements in solarcells.
Fig. 2 A schematic diagram of solar cell cross-section used for experiment.
K. Takami et al.2048

concentrations which contributed to the etching reaction rateas described in 3.4 and it became almost constant over5.0 © 10¹5m3, that is, HF:0.33mol and HNO3:0.16mol. Asstoichiometric HF and HNO3 amounts used for the sampleetching were 0.083 and 0.018mol, respectively, 0.33/0.083 = 4.0 times of HF and 0.16/0.018 = 8.9 times ofHNO3 were necessary to maintain the constant etching timeof sample.
Figure 5 shows the residual ratios of HF and HNO3 in theetching solution. The residual ratio is defined as the remainedHF or HNO3 concentration after the complete dissolution ofsample normalized by the initial condition. When the etchingtime of sample became almost constant over 5.0 © 10¹5m3
solution volume as seen in Fig. 4, over 0.86 of HF and 0.75of HNO3 remained in the etched solution. It was found thatthese residual ratios have little effect on the etching time.
3.2 Temporal change in etching rate of each componentin solar cells
Temporal changes in Ag, Al and Si weights in the sampleare shown in Figs. 6, 7 and 8, respectively. The slopes oftemporal change in weight were recognized to be almostconstant, although the data have slight variances. It meansthat each component in the sample dissolves at a constantrate. The weight decreasing rate of each component, that is,the etching rates of Ag, Al and Si became larger with theincreases in HF concentration and the etching temperature.As shown in Fig. 6, the increase of Ag etching rate withincreasing HF concentration suggests that Ag etching iscontrolled by eq. (1) instead of eq. (2). A difference ofetching rate between Ag and Al at the same condition ofsolution concentration indicated in Figs. 6 and 7 seems to bedue to a difference of each rate constant for etching reaction.As Si wafer is covered with Ag and AR, Si etching starts aftera complete dissolution of either Ag or AR, which generallycomplicates the Si etching behavior. However, the Si etchingrate in Fig. 8 was almost kept constant. It is because the Agand Ar etching times are much more rapid than Si and havelittle effect on the Si etching behavior.
3.3 Effect of HF and HNO3 concentrations on etchingrate of each component in solar cells
A schematic diagram of solar cell etching procedure isshown in Fig. 9. Both Al and AR dissolve initially and Sietching starts on one side after complete dissolution of Al or
AR, and follows on both sides of the sample after completedissolution of AR and Al. The etching rate, rSi (nm/s), of Sion one side is expressed by using ti: complete dissolutiontime (s) of component i (= Al, AR, Si), µSi: Si density
Fig. 5 Relationship between residual ratio of acids and solution volumeafter dissolution of solar cells. Fig. 6 Temporal change in residual silver in solar cells.
Fig. 7 Temporal change in residual aluminum in solar cells.
Fig. 8 Temporal change in residual silicon in solar cells.
Fig. 9 A schematic diagram of solar cell etching procedure.
Effect of HF and HNO3 Concentration on Etching Rate of Each Component in Waste Crystalline Silicon Solar Cells 2049
(kg/m3), SSi: cross-sectional area (m2) of Si wafer anddSi: thickness (nm) of Si wafer.A. when tAR > tAl,
ð�rSiÞðtAR � tAlÞµSiSSi þ 2ð�rSiÞðtSi � tARÞµSiSSi¼ dSiµSiSSi ð6Þ
B. when tAl > tAR,
ð�rSiÞðtAl � tARÞµSiSSi þ 2ð�rSiÞðtSi � tAlÞµSiSSi¼ dSiµSiSSi ð7Þ
Both of eqs. (6) and (7) results in eq. (8).
� rSi ¼ dSi=ð2tSi � tAl � tARÞ ð8ÞWhen dAl (nm) and dAR (nm) are defined as thickness of Al
and AR, respectively, Al etching rate, rAl (nm/s) and ARetching rate, rAR (nm/s) are given by eqs. (9) and (10),respectively.
� rAl ¼ dAl=tAl ð9Þ� rAR ¼ dAR=tAR ð10Þ
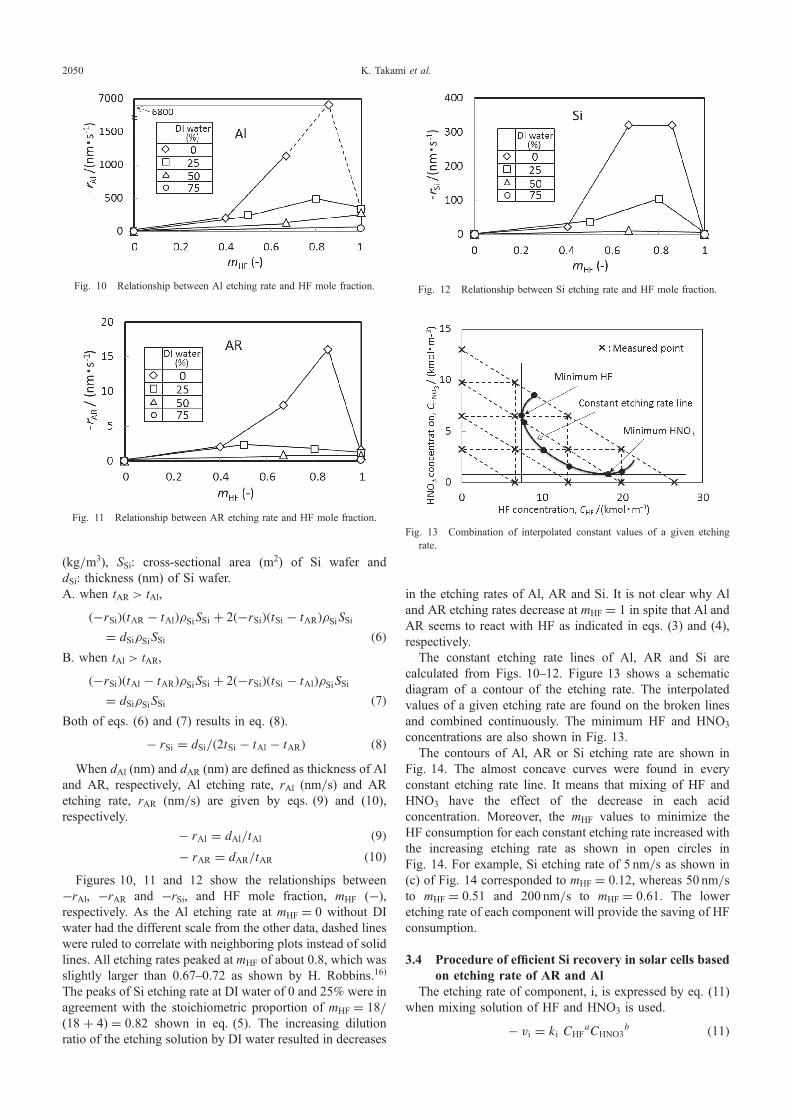
Figures 10, 11 and 12 show the relationships between¹rAl, ¹rAR and ¹rSi, and HF mole fraction, mHF (¹),respectively. As the Al etching rate at mHF = 0 without DIwater had the different scale from the other data, dashed lineswere ruled to correlate with neighboring plots instead of solidlines. All etching rates peaked at mHF of about 0.8, which wasslightly larger than 0.670.72 as shown by H. Robbins.16)
The peaks of Si etching rate at DI water of 0 and 25% were inagreement with the stoichiometric proportion of mHF = 18/(18 + 4) = 0.82 shown in eq. (5). The increasing dilutionratio of the etching solution by DI water resulted in decreases
in the etching rates of Al, AR and Si. It is not clear why Aland AR etching rates decrease at mHF = 1 in spite that Al andAR seems to react with HF as indicated in eqs. (3) and (4),respectively.
The constant etching rate lines of Al, AR and Si arecalculated from Figs. 1012. Figure 13 shows a schematicdiagram of a contour of the etching rate. The interpolatedvalues of a given etching rate are found on the broken linesand combined continuously. The minimum HF and HNO3
concentrations are also shown in Fig. 13.The contours of Al, AR or Si etching rate are shown in
Fig. 14. The almost concave curves were found in everyconstant etching rate line. It means that mixing of HF andHNO3 have the effect of the decrease in each acidconcentration. Moreover, the mHF values to minimize theHF consumption for each constant etching rate increased withthe increasing etching rate as shown in open circles inFig. 14. For example, Si etching rate of 5 nm/s as shown in(c) of Fig. 14 corresponded to mHF = 0.12, whereas 50 nm/sto mHF = 0.51 and 200 nm/s to mHF = 0.61. The loweretching rate of each component will provide the saving of HFconsumption.
3.4 Procedure of efficient Si recovery in solar cells basedon etching rate of AR and Al
The etching rate of component, i, is expressed by eq. (11)when mixing solution of HF and HNO3 is used.
� vi ¼ ki CHFaCHNO3
b ð11Þ
Fig. 10 Relationship between Al etching rate and HF mole fraction.
Fig. 11 Relationship between AR etching rate and HF mole fraction.
Fig. 12 Relationship between Si etching rate and HF mole fraction.
Fig. 13 Combination of interpolated constant values of a given etchingrate.
K. Takami et al.2050

where vi: etching rate of component, i, (mol/s), ki: etchingconstant of component, i. When Al and AR are etched by HFalone shown in Figs. 1011, the etching rate is given byeq. (12).
� vi ¼ ki CHFa ð12Þ
The multi-regression analysis of eqs. (11) and (12) byusing data in section 3.3 led to the following equations.A. for mixed solution of HF and HNO3,
� vAl ¼ 7:48� 10�9CHF3:07CHNO3
0:48 ð13Þ� vAR ¼ 5:70� 10�12CHF
2:32CHNO31:07 ð14Þ
� vSi ¼ 8:36� 10�9CHF3:17CHNO3
0:94 ð15ÞB. for HF solution alone,
� vAl ¼ 3:42� 10�7CHF1:40 ð16Þ
� vAR ¼ 2:62� 10�11CHF1:57 ð17Þ
As shown in eqs. (13)(17), CHF dependency on Al, ARand Si etching rates was larger than CHNO3. The comparisonbetween the calculated etching rate, ¹vcalc. (mol/s), and theexperimental one, ¹vexp. (mol/s), is shown in Fig. 15. It wasfound that the regression calculation explained the experi-ment.
The maximum Si recovery is achieved when the AR layeron the surface and the Al layer on the opposite side in thesolar cell complete their etching at the same time. Therefore,the etching rates of AR and Al affects the Si recovery. Whenti: perfect etching time (s), µi: density (kg/m3), Mi: molecularweight, di: thickness (nm), Si: cross-sectional area (m2) ofcomponent i, eqs. (18)(19) are given, based on eqs. (13)(14).
�rAl ¼ ð106µAl=MAlÞðdAl=109ÞSAl=tAl¼ 7:48� 10�9CHF
3:07CHNO30:48 ð18Þ
�rAR ¼ ð106µAR=MARÞðdAR=109ÞSAR=tAR¼ 5:70� 10�12CHF
2:32CHNO31:07 ð19Þ
Therefore, eq. (20) is given when tAl is equal to tAR.
ðµARdARSAR=MARÞ=ðµAldAlSAl=MAlÞ¼ 7:62� 10�4CHNO3
0:59=CHF0:74 ð20Þ
Applying the sample dimension in this study describedin chapter 2 to eq. (20), the following equations areobtained:
ð106µAl=MAlÞðdAl=109ÞSAl ¼ 1:19� 10�3 ð21Þð106µAR=MARÞðdAR=109ÞSAR ¼ 1:71� 10�7 ð22Þ
Substituting eqs. (21) and (22) into eq. (20), the followingrelationship was obtained:
CHNO3 ¼ 0:060CHF1:26 ð23Þ
Not only the relation of eq. (23) but also the newlyexperimental conditions to verify the Si recovery ratio areshown in Fig. 16. The newly experimental conditionsindicated by Nos. 1, 2, 3 and 4 were on the curve ofeq. (20) and compared with existing experimental conditionssuch as Nos. 5 and 6. The Si recovery yield after the completeetching times of Al and AR is shown in Table 1. The newlyexperimental conditions achieved higher Si yield than theexisting ones out of eq. (20). It has been recognized that therelation of eq. (20) is generally applicable to chemical
Fig. 14 Contours of Al, AR and Si etching rates.
Fig. 15 Relationship between calculated and observed etching rates.
Effect of HF and HNO3 Concentration on Etching Rate of Each Component in Waste Crystalline Silicon Solar Cells 2051

etching of the waste crystalline silicon solar cell with mixedsolution of HF and HNO3.
4. Conclusions
Chemical treatment of multicrystalline silicon solar cellwas carried out by using mixed solution of hydrofluoric andnitric acids.(1) The etching time of silicon solar cell became almost
constant when masses of HF and HNO3 remained over86% and 75%, respectively, relative to the initialconditions in the etching solution.
(2) The etching rates of Ag, Al and Si were kept almostconstant and became larger with the increasing HFconcentration and the etching temperature.
(3) All of the etching rates of Al, AR and Si peaked at theHF mole fraction of about 0.8.
(4) The dependency of HF concentration on Al, AR and Sietching rates was larger than that of HNO3 dependency.
(5) To maximize the Si recovery yield in the solar siliconcell, it was desirable to keep the relationships betweenHF and HNO3 concentration as (mole number of AR)/(mole number of Al) = 7.62 © 10¹4 CHNO3
0.59CHF0.74,
where CHNO3: HNO3 concentration (kmol/m3), CHF: HFconcentration (kmol/m3).
Acknowledgements
This work was supported by JFE 21st Century Foundation.
REFERENCES
1) A. Muller, K. Wambach and E. Alsema: Mater. Res. Symp. Proc.,(Materials Research Society, 2006) 0895-G03-07.
2) E. Bomback, I. Rover, A. Muller, S. Schlenker, K. Wambach, R.Kopecek and E. Wefringhaus: Proc. 21st EU-PVSEC, (2006)pp. 20482053.
3) New Energy and Industrial Technology Development Organization(NEDO) Report, (2006) pp. 3740.
4) K. Okajima and Y. Uchiyama: J. Life Cycle Assess. Japan 5 (2009)521528.
5) E. Radziemska, P. Ostrowski, A. Cenian and M. Sawczak: Ecol. Chem.Eng. S 17 (2010) 385391.
6) E. Klugmann-Radziemska: Chem. Didact. Ecol. Metrol. 17 (2012) 8995.
7) M. Kimura and T. Motoji: Taiyo Energy 38 (2012) 17.8) S. Kang, S. Yoo, J. Lee, B. Boo and H. Ryu: Renew. Energy 47 (2012)
152159.9) J. Park and N. Park: RSC Adv. 4 (2014) 3482334829.10) E. Radziemska, T. Seramak and P. Ostrowski: Adv. Mater. Sci. 8 (2008)
2834.11) E. Klugmann-Radziemska and P. Ostrowski: Renew. Energy 35 (2010)
17511759.12) S. Patzig, G. Roewer, E. Kroke and I. Rover: Verlag der Zeitschrift fur
Naturforschung (2007) 14111421.13) S. Patzig-Klein, G. Roewer and E. Kroke: Mater. Sci. Semicond.
Process. 13 (2010) 7179.14) E. Klugmann-Radziemska, P. Ostrowski, K. Drabczyk, P. Panek and M.
Szkodo: Solar Energy Mater. Solar Cells 94 (2010) 22752282.15) J. Acker and A. Herbge: Talanta 72 (2007) 15401545.16) H. Robbins and B. Schwartz: J. Electrochem. Soc. 106 (1959) 505
508.
Table 1 Si recovery yield.
No. CHF (kmol/m3) CHNO3(kmol/m3) Si recovery yield (%)
1 7.94 0.81 95.8
2 10.58 1.17 96.2
3 13.23 1.55 95.3
4 14.11 1.68 95.1
5 6.63 3.25 86.7
6 13.25 3.25 84.3
Fig. 16 Relationship between HNO3 and HF concentrations to minimize Sietching (©: experimental condition to obtain the multiple regressionequation, : newly experimental condition to find Si recovery ratio).
K. Takami et al.2052