effect of hcv treatment response on insulin resistance: a
TRANSCRIPT

EXPERIMENTAL AND THERAPEUTIC MEDICINE 18: 3568-3578, 20193568
Abstract. Sustained virological response (SVR) in hepatitis C virus (HCV) patients treated with pegylated interferon α-2a and ribavirin is associated with reduced insulin resistance (IR), measured as a reduction of homeostasis model assess-ment (HOMA) scores after 24 weeks of therapy, and reduced fasting serum insulin and serum glucose levels. The present meta-analysis aimed to evaluate the effect of HCV treat-ment response on IR in HCV patients who achieved SVR and those who did not (non-SVR) after receiving interferon (IFN)-based therapy. The PubMed, Cochrane and Embase databases were searched using combinations of the following search terms: ‘HCV’, ‘hepatitis C’, ‘interferon’, ‘antiviral’, ‘treatment response’ and ‘insulin resistance’. The incidence of IR, HOMA-IR and HOMA-β, as well as fasting glucose and fasting insulin levels, were summarized in terms of basal values and values after the end of treatment for each study. A total of 8 studies were included in the final analysis. There was no significant difference in the reduction in IR between the SVR and non-SVR groups (odds ratio, 0.995; 95% CI=0.613-1.616; P=0.984). However, the SVR group had a
significantly higher mean reduction in HOMA‑IR (difference in means=-0.485; 95%CI=-0.713 to -0.256; P<0.001) and HOMA-β (difference in means=-15.448; 95%CI=-23.326 to -7.570; P<0.001) compared to the non-SVR group. In conclu-sion, HCV patients who achieved SVR after IFN-based therapy exhibited improvement in HOMA-IR and HOMA-β. The present results suggest that clinical management of IR and serum glucose levels may be an important way to impact the therapeutic response in HCV patients.
Introduction
Hepatitis C virus (HCV) infection has been detected in ~170 million patients worldwide, and chronic hepatitis C (CHC) infection is a major risk factor for cirrhosis and hepatocellular carcinoma, which are associated with high morbidity and mortality (1,2). The traditional standard of care, interferon (IFN)-based therapies, may achieve sustained virological response (SVR) rates of ~50%, and have serious side effects (3). Direct-acting anti-virals (DAAs) are replacing IFN-based therapy as the standard of care, with SVR rates of >90% (4). However, the recurrence rate in DAA-treated patients remains significant (5,6).
Approximately two-thirds of HCV patients experience extra-hepatic manifestations in the cardiovascular, renal and central nervous systems, including mixed essential cryoglobulinemia, non-Hodgkin's lymphoma and glomeru-lonephritis (7-9). Almost 415 million individuals worldwide have diabetes mellitus. According to statistics, one patient succumbs to its complications every six seconds (10). CHC patients also have a higher prevalence of insulin resistance (IR) and type 2 diabetes mellitus (T2DM), and IR improve-ment can increase the positive response to antiviral therapy regardless of HCV genotype (11-14). CHC patients with IR have higher rates of liver fibrosis (15) and 20% lower rates of SVR compared to patients without IR (16). Of note, patients with T2DM have an elevated risk of acquiring HCV infec-tion (17). This may be due to lower immunity in patients with T2DM. Therefore, for patients with T2DM patients,
Effect of HCV treatment response on insulin resistance: A systematic review and meta‑analysis
JING-HONG HU1, MING-LING CHANG2-4, NAI-JEN LIU4, CHAU-TING YEH2-4 and TUNG-JUNG HUANG5
1Division of Gastroenterology and Hepatology, Department of Internal Medicine, Chang Gung Memorial Hospital, Yunlin 63862; 2Department of Gastroenterology and Hepatology, Liver Research Center, Chang Gung Memorial Hospital, Linkou 33305; 3Department of Medicine,
College of Medicine, Chang Gung University, Taoyuan 33378; 4Department of Gastroenterology and Hepatology, Chang Gung Memorial Hospital, Linkou 33305; 5Division of Thoracic Medicine, Department of Internal Medicine and Department of Medicine, Chang Gung Memorial Hospital, Yunlin 63862, Taiwan, R.O.C.
Received January 28, 2019; Accepted August 8, 2019
DOI: 10.3892/etm.2019.7995
Correspondence to: Professor Jing-Hong Hu, Division of Gastroenterology and Hepatology, Department of Internal Medicine, Chang Gung Memorial Hospital, 1500 Gongye Road, Mailiao, Yunlin 63862, Taiwan, R.O.C.E-mail: [email protected]
Abbreviations: CHC, chronic hepatitis C; CI, confidence interval; DAA, direct-acting antiviral; EOT, end of treatment; HCV, hepatitis C virus; HOMA, homeostasis model assessment; IR, insulin resistance; RCT, randomized controlled trial; SD, standard deviation; SVR, sustained virological response; T2DM, type 2 diabetes mellitus
Key words: hepatitis C virus, insulin resistance, HOMA-IR, HOMA-β, sustained viral response, meta-analysis

HU et al: INSULIN RESPONSE AND GLUCOSE AFFECT HCV PATIENTS 3569
avoiding the need to share needles can reduce the risk of HCV infection.
IR in HCV patients has been reported to be mediated by the HCV core protein, which interferes with glucose metabolism and insulin signaling by inhibiting the expression of insulin receptor substrate (IRS)1 and IRS2 (13,18-20). HCV-induced IR in the tissue of HCV-infected patients and animal models has also been indicated to be mediated via a number of cytokines, including tumor necrosis factor-α (21).
Viral clearance in HCV patients treated with pegylated interferon α-2a and ribavirin has been associated with reduced IR [measured as a reduction in homeostasis model assess-ment (HOMA) scores after 24 weeks of therapy] and reduced fasting serum insulin and serum glucose levels (20,22,23). By contrast, elevated HOMA-IR scores were indicated to be asso-ciated with a 3-fold increase in the risk of failure to achieve SVR in HCV patients treated with pegylated interferon plus ribavirin (24). SVR was associated with a reduction in HOMA-IR in patients with HCV genotype 1 infection, but not in patients infected with genotypes 2 or 3 (25), suggesting that viral factors have an important role in modulating the insulin signaling pathway. However, non-diabetic, non-cirrhotic patients with HCV genotype 1 infection treated with pegylated (Peg-)IFN plus ribavirin exhibited a reduction in IR, indepen-dent of the virological outcome (26). A recent meta-analysis reported that achieving SVR was associated with reduced IR at the follow-up visit, and also protected against the incidence of diabetes (27). However, this study was limited by the lack of randomized data comparing SVR to non-SVR patients.
Despite the discrepancies arising from differences in study design and variables evaluated, these results, along with the result that SVR was associated with a significant reduction in mean fasting glucose levels and fasting serum insulin levels (22,28), suggest that SVR is linked to improved glycemic control in HCV patients. The present meta-analysis aimed to evaluate the effect of HCV treatment response on IR by comparing the reduction in IR among HCV patients who achieved SVR and those who did not (non-SVR group) after receiving IFN-based therapy.
Materials and methods
Literature search strategy. The PRISMA guidelines were followed for the processes and reporting in the present systematic review and meta-analysis (29). To identify relevant studies for inclusion in the present meta-analysis, the PubMed, Cochrane and Embase databases were searched using combi-nations of the following search terms: ‘HCV’, ‘hepatitis C’, ‘interferon’, ‘antiviral’, ‘treatment response’ and ‘insulin resistance’. The search strategy for PubMed included the terms ‘insulin resistance’ AND (‘hepatitis C’ OR ‘HCV’) AND (‘antiviral’ OR ‘interferon’); the search filters were as follows: Abstract available; English language. The search included studies published in the time window from inception until December 19, 2017.
Selection of studies. The inclusion criteria for the meta-anal-ysis were as follows: i) Prospective and retrospective studies; ii) studies on HCV patients who received IFN-based therapy; iii) studies in which IR was evaluated in SVR patients and
non-SVR patients; and iv) studies reporting quantitative outcomes. Exclusion criteria were as follows: i) Publication type: Reviews, letters, commentaries, editorials, case reports, personal communications; ii) studies in which patients received other interventions; and iii) studies which did not report quantitative primary outcomes.
A 2-step screening process was used to identify studies that would be included in the meta‑analysis. The first step involved an evaluation of the title and abstract of each article, and citations not meeting the inclusion criteria and meeting the exclusion criteria were discarded. The second step involved the evaluation of full-text copies of the remaining citations to iden-tify those that met all of the inclusion criteria and none of the exclusion criteria. The screening process and identification of eligible studies were performed by two independent reviewers JHH and NJL. A third reviewer, MLC, was consulted if there were any uncertainties regarding eligibility. The reference lists of the relevant studies were hand-searched to identify further studies that met the inclusion criteria.
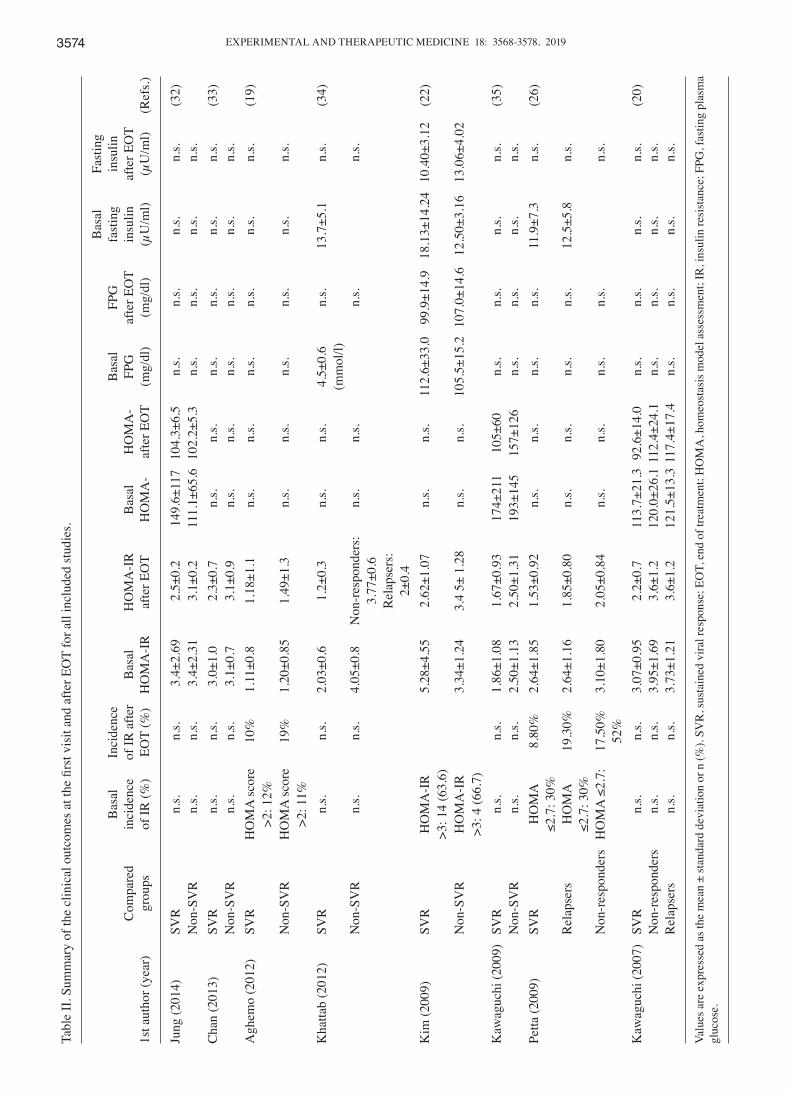
Data extraction and analysis. Data were extracted from the eligible studies by two independent reviewers. Regarding the presentation of patient characteristics in the studies selected, parameters including age were expressed as the mean ± standard deviation (SD) and information regarding gender as the percentage of males in the given groups. For the clinical outcomes, the incidence of IR and scores/levels of HOMA-IR, HOMA-β, fasting glucose and fasting insulin were summarized in terms of basal values and values at the end of treatment (EOT) for each of group, if available. Data were summarized as the percentage of affected patients regarding the incidence of IR and as the mean ± standard deviation for other categorical data. The effect size was set as the reduction of the incidence rate of IR, HOMA-IR scores and HOMA-β scores from the basal value to the value after EOT for the SVR and non-SVR groups from each study. For studies reporting on non-responders and relapsers, these data were combined into the non-SVR group. The reduction in the incidence rate of IR was defined as the difference in the reduction in the incidence rate of IR with a 95% confidence interval (95%CI; lower limit, upper limit) and P-value for comparison between the SVR and non-SVR groups; the reduction of HOMA-IR and HOMA-β scores was defined as the difference in reduction of the mean HOMA-IR and HOMA-β scores from the basal value to the value after EOT with 95%CI and P-value for comparison between the SVR and non-SVR groups; a combined effect was calculated for those studies with completed measurements.
For the effect size of reduction in the incidence rate of IR, a difference in the reduction of the IR incidence rate >0 indicated that the SVR group had a greater reduction in the IR incidence rate than the non-SVR group; reduction in the IR incidence rate <0 indicated that the SVR group had a smaller reduction in the IR incidence rate than the non-SVR group; reduction of IR incidence rate=0 indicated that the SVR and non-SVR groups had similar reduction rates. For the effect size of reduction in HOMA-IR and HOMA-β scores, an effect size of outcomes <0 indicated that the SVR group had a greater reduction than the non-SVR group; an effect size of outcomes >0 indicated that the non-SVR group had a greater reduction than the SVR group; and an effect size of

EXPERIMENTAL AND THERAPEUTIC MEDICINE 18: 3568-3578, 20193570
outcomes=0 indicated that the SVR and non-SVR groups had a similar reduction in outcomes.
Study heterogeneity was evaluated using χ2-based Cochran's Q and I2 statistics. A random-effects model (DerSimonian-Laird method) was considered for the meta-analysis if Q statistics with P<0.10 or I2>50% were obtained; otherwise, a fixed‑effects model (Mantel‑Haenszel method) was employed for the meta-analysis. Regarding the Q statistics, P<0.10 was considered to indicate statistical significance regarding heterogeneity. For the I2 statistics, heterogeneity was assessed as follows: I2=0-25% indicated no heterogeneity, I2=25-50% moderate heterogeneity, I2=50-75% high heterogeneity and I2=75-100% very high heterogeneity. A two-sided P<0.05 was considered to indicate statistical significance. Sensitivity analysis was performed using a leave-one-out approach. According to Sterne et al (30) study, when the number of studies in the meta-analysis is <10, funnel plot asymmetry should not be used. Therefore, in the current study, publication bias was not assessed due to the limitation in the number of studies. All statistical analyses were performed using the statistical software Comprehensive Meta-Analysis, version 2.0 (Biostat).
Quality assessment. The Quality In Prognosis Studies tool was used to assess the quality of included studies (31). The tool comprises six areas: Participation, attrition, measurement of prognostic factors, measurement of and controlling for confounding variables, measurement of outcomes and analytic approaches. The quality of included studies was independently appraised by two reviewers JHH and NJL. Any discrepancies were resolved by a third reviewer MLC.
Results
Study selection. A flow chart of the study selection process is presented in Fig. 1. A total of 431 studies were initially identified, of which 52 were evaluated for selection for the meta-analysis. After excluding 44 studies (5 studies did not report primary outcomes; 34 had different objectives; 1 was a commentary; 2 were duplicates; and 2 did not have full texts available), a total of 8 studies were included in the final analysis (19,20,22,26,32-35).
Study characteristics. The present meta-analysis included 5 prospective studies, 2 retrospective studies and 1 random-ized controlled trial (RCT). The analysis included a total of 533 subjects in the SVR group and 346 subjects in the non-SVR group. The age of study subjects ranged from 40.4 to 63.2 years, and the percentage of males ranged from 45.5 to 85.2%. The follow-up time was 6 months after EOT in 7 studies, while one study had a follow-up time of 24 months after EOT (Table I). A comparison of the incidence rate of IR, as well as HOMA-IR scores, HOMA-β scores, fasting glucose levels and fasting insulin levels between the baseline and EOT is provided in Table II.
Meta‑analysisReduction in incidence of IR. Only the two studies which reported complete data for the IR rate (basal value and value after EOT) were considered for the meta-analysis (19,26). A
fixed‑effect model was applied according to the heterogeneity test [Q-value=0.002; degrees of freedom (df)=1; P=0.969; I2=0%]. The combined analysis indicated that the SVR and non-SVR groups had a similar reduction in IR rate (odds ratio=0.995; 95%CI=0.613-1.616; P=0.984; Fig. 2).
Reduction in mean HOMA‑IR. All of the 8 studies reported a change in HOMA-IR between the basal value and the value after EOT, and were therefore considered for meta-analysis. A random-effects model was applied according to the hetero-geneity test (Q-value=16.991; df=7; P=0.017; I2=58.80%). The combined analysis indicated that the SVR group had a significantly higher mean reduction in HOMA‑IR compared with the non-SVR group (difference in means=-0.485; 95%CI=-0.713 to -0.256; P<0.001). In addition, subgroup analysis indicated similar changes in Asian and non-Asian studies (Asian: Difference in means=-0.475; 95%CI=-0.806 to -0.144; P=0.005; non-Asian: Difference in means=-0.483; 95%CI=-0.782 to -0.183; P=0.002; Fig. 3). Table SI summa-rizes the meta-analysis for studies with genotypes 1/2. The results indicated that the SVR group had a higher mean reduction in HOMA-IR as compared with the non-SVR group (difference in means=-0.403; P=0.007). However, the change in HOMA-IR was similar between the SVR and non-SVR groups after removing the study by Kawaguchi et al (20) from 2007 (difference in means=-0.233, P=0.241; Table SI).
Reduction in mean HOMA‑β. Only three studies reported the complete data for the change in HOMA-β scores between the basal value and the value after EOT and were considered for meta‑analysis (20,32,35). A fixed‑effects model was used according to the heterogeneity test (Q-value=0.521; df=2; P=0.771; I2=0%). The combined analysis indicated that the SVR group had a significantly higher mean reduction in HOMA-β scores compared with that in the non-SVR group (difference in means=-15.448; 95%CI=-23.326 to -7.570; P<0.001; Fig. 4). Table SI summarizes the results of a subgroup analysis for genotypes 1/2. The results suggested that the SVR group had a higher mean reduction in HOMA-β scores than
Figure 1. Flow chart of study selection.

HU et al: INSULIN RESPONSE AND GLUCOSE AFFECT HCV PATIENTS 3571
Tabl
e I.
Sum
mar
y of
stud
y ch
arac
teris
tics o
f the
eig
ht st
udie
s inc
lude
d in
the
met
a-an
alys
is.
Com
pare
d Tr
eatm
ent p
roto
col
Age
M
ales
G
enot
ype
Fo
llow
-up
1st a
utho
r (ye
ar)
Stud
y de
sign
St
udy
perio
d of
pat
ient
s N
umbe
r gr
oups
(d
ose,
dur
atio
n)
(yea
rs)
(%)
(n)
Cou
ntry
tim
e
(Ref
s.)
Jung
(201
4)
Ret
rosp
ectiv
e Ja
n 5
2005
to D
ec 2
011
49
SVR
n.
s. 48
±11.
2 n.
s 1/
non-
1:
Kor
ea
6 m
onth
s (3
2)
28
/21
af
ter E
OT
11
N
on-S
VR
56.6
±9.9
1/no
n-1:
8/
3C
han
(201
3)
Pros
pect
ive
2003
‑200
7 48
SV
R
All
but fi
ve p
atie
nts
42±1
0 24
(50)
1/
2/3:
A
ustra
lia
6 m
onth
s (3
3)
rece
ived
PEG
-IFN
-2a
24/6
/17
af
ter E
OT
an
d w
eigh
t-bas
ed R
BV
th
erap
y (1
,000
mg
for
pa
tient
s with
BW
<75
kg
or
1,2
00 m
g da
ily fo
r
patie
nts w
ith a
BW
>75
kg)
.
The
rem
aini
ng 5
rece
ived
PE
G-I
FN-2
b an
d w
eigh
t-
base
d R
BV
ther
apy.
Tr
eatm
ent d
urat
ion
was
ge
noty
pe-d
epen
dent
(1
2 m
onth
s for
gen
otyp
e 1
an
d 6
mon
ths f
or
geno
type
s 2 a
nd 3
)
38
Non
-SV
R
21 (5
5)
1/2/
3:
20
/4/1
3A
ghem
o (2
012)
R
CT
MIS
T su
b-st
udy
230
SVR
C
ombi
natio
n of
PEG
-IFN
-2a
1/4:
78
Italy
24
mon
ths
(19)
(1
80 g
/wee
k) a
nd R
BV
2/
3: 1
52
af
ter E
OT
(8
00-1
,200
mg/
day)
or a
co
mbi
natio
n of
PEG
-IFN
-2b
(1
.5 g
/kg/
wee
k) a
nd d
aily
R
BV
(800
-1,2
00 m
g) fo
r a
stan
dard
dur
atio
n ba
sed
on
the
HC
V g
enot
ype.
12
4 N
on-S
VR
n.s.
n.s.
1/4:
94
2/3:
30

EXPERIMENTAL AND THERAPEUTIC MEDICINE 18: 3568-3578, 20193572Ta
ble
I. C
ontin
ued.
Com
pare
d Tr
eatm
ent p
roto
col
Age
M
ales
G
enot
ype
Fo
llow
-up
1st a
utho
r (ye
ar)
Stud
y de
sign
St
udy
perio
d of
pat
ient
s N
umbe
r gr
oups
(d
ose,
dur
atio
n)
(yea
rs)
(%)
(n)
Cou
ntry
tim
e
(Ref
s.)
Kha
ttab
(201
2)
Pros
pect
ive
Feb
2008
to Ja
n 20
11
61
SVR
Pe
g-IF
Nα-
2a (1
80 g
/wee
k)
40.4
±5.8
52
(85.
2)
4: 1
07
Egyp
t 6
mon
ths
(34)
or
a c
ombi
natio
n of
af
ter E
OT
Pe
g-IF
Nα-
2b (1
.5 g
/kg/
wee
k)
and
RB
V (1
,000
mg
or
1,20
0 m
g/da
y fo
r BW
≤ or
>7
5 kg
, res
pect
ivel
y) d
urin
g
the
stud
y pe
riod
for 4
8 w
eeks
in
depe
nden
t of t
he ra
pid
vi
rolo
gica
l res
pons
e.
46
Non
-SV
R
42
.8±5
.1
34 (7
3.9)
Kim
(200
9)
Pros
pect
ive
May
200
4 to
Nov
200
6 22
Su
stai
ned
Com
bina
tion
of P
eg-I
FNα-
2a
57.6
±8.9
10
(45.
5)
1b/2
a:
Kor
ea
6 m
onth
s (2
2)
R
espo
nder
s (1
80 µ
g) a
nd R
BV
9/
13
af
ter E
OT
(8
00-1
,000
mg/
day,
acc
ordi
ng
to th
e ge
noty
pe o
f HC
V)
6
Non
-res
pond
er
50.8
±9.6
4
(66.
7)
1b/2
a:
6/0
Kaw
aguc
hi (2
009)
Ret
rosp
ectiv
e Ja
n 20
02 to
Aug
200
7 48
SV
R
Patie
nts w
ith a
hig
h vi
ral
(3
5)
load
or p
ast h
isto
ry o
f IFN
tre
atm
ent r
ecei
ved
6 or
10
MU
of I
FN-2
b th
ree
times
a
wee
k fo
r 24
wee
ks p
lus
R
BV
600
-1,0
00 m
g/da
y an
d
wer
e tre
ated
with
Peg
-IFN
-2b
1.
5 m
g/kg
/wee
k pl
us R
BV
da
ily fo
r 48
wee
ks (g
enot
ype
1)
or 2
4 w
eeks
(gen
otyp
e 2)
.
Patie
nts w
ith a
low
vira
l loa
d
rece
ived
5-1
0MU
of n
atur
al
IFN
thre
e tim
es a
wee
k fo
r
24 w
eeks
or 6
MU
of I
FN d
aily
fo
r 8 w
eeks
and
wer
e tre
ated
w
ith P
eg-I
FNα-
2a 1
80 m
g/w
eek
fo
r 24-
48 w
eeks
or t
he
abov
e-m
entio
ned
IFN
regi
men
. 52
.3±1
2.1
35 (7
2.9)
1/
2:
Japa
n 6
mon
ths
31/1
7
afte
r EO
T

HU et al: INSULIN RESPONSE AND GLUCOSE AFFECT HCV PATIENTS 3573
the non-SVR group (difference in means=-15.179; P<0.001). However, the change in HOMA-β scores was similar between the SVR and non-SVR groups after excluding the study by Kawaguchi et al (20) (difference in means=-33.0; P=0.445; Table SI).
Sensitivity analysis. Sensitivity analyses were performed for HOMA-IR reduction using a leave-one-out approach (Fig. 5). There was no significant difference in the direction and magnitude of the combined estimates with the removal of any one study, indicating that the meta-analysis had good reliability and that the data were not overly influenced by any given study.
Quality assessment. In general, the quality of the analysis was good, with a low risk of bias in terms of study participation, study attrition, measurement of prognostic factors, measure-ment of outcomes and analytic approaches (Fig. 6). The risk of bias regarding confounding was unclear in all included studies.
Discussion
The present meta-analysis evaluated data from 8 studies comparing the reduction in IR between SVR and non-SVR groups of HCV patients treated with IFN-based therapy. The pooled analysis indicated no significant difference in the reduc-tion of IR between the SVR and non-SVR groups. However, patients who achieved SVR had a significantly higher mean reduction in HOMA-IR and HOMA-β scores compared to patients in the non-SVR group.
The HOMA-IR score has been indicated to be a predictor of liver fibrosis and may be used as a surrogate marker for SVR at EOT (33). A previous meta-analysis of 13 studies reported that elevated HOMA-IR (regardless of cut-off value, as well as with the cut-off value set at >2) was associated with lower SVR rates after IFN-based therapy in patients infected with HCV of the genotype 1, 2 or 3 (36). Another study indicated that SVR was associated with a reduction in the mean HOMA-IR in patients with genotype 1 of HCV, but not in those with geno-types 2 or 3 (25). In addition, HOMA-IR continued to decrease at the end of the follow-up in patients with genotype 4 HCV who achieved SVR, but remained unchanged in non-SVR patients (34). In the present study, a subgroup analysis was only performed for genotypes 1/2. The mean reduction of HOMA-IR and HOMA-β scores was higher in patients who achieved SVR. However, the results became insignificant after removing the study by Kawaguchi et al (20) from 2007. To further confirm and clarify the present results, further studies are required. A more complete understanding of the role of the genotype of HCV in the interaction between IR and SVR is needed, since the genotype impacts SVR rates (37).
The baseline HOMA-IR score is considered an important determinant of viral response, since it was demonstrated to be lower in responders than in non-responders (16,32). HCV patients who failed to achieve SVR exhibited an increase in mean post-treatment HOMA-IR scores compared to the base-line value (19). In addition, the mean pre-treatment HOMA-IR score was indicated to be similar in the SVR and non-SVR groups, although the HOMA‑IR scores significantly improved at the EOT only in the SVR group (33). It was recently reported
Tabl
e I.
Con
tinue
d.
Com
pare
d Tr
eatm
ent p
roto
col
Age
M
ales
G
enot
ype
Fo
llow
-up
1st a
utho
r (ye
ar)
Stud
y de
sign
St
udy
perio
d of
pat
ient
s N
umbe
r gr
oups
(d
ose,
dur
atio
n)
(yea
rs)
(%)
(n)
Cou
ntry
tim
e
(Ref
s.)
24
N
on-S
VR
56.1
±8.1
13
(54.
2)
1/2:
21/
3
Pe
tta (2
009)
Pr
ospe
ctiv
e M
ay 2
005
to N
ov 2
006
46
SVR
n.
s. 47
.0±1
2.6
30 (6
5.2)
1:
83
Italy
6
mon
ths
(26)
afte
r EO
T
20
Rel
apse
rs
54
.7±1
1.9
17 (4
5.9)
17
N
on-r
espo
nder
s
K
awag
uchi
(200
7)
Pros
pect
ive
n.s.
29
SVR
n.
s. 58
.5±8
.6
19 (6
5.5)
1/
2: 1
1/18
Ja
pan
6 m
onth
s (2
0)
af
ter E
OT
48
N
on-r
espo
nder
s
61.7
±7.7
27
(56.
2)
1/2:
42/
6
12
Rel
apse
rs
63
.2±6
.1
8 (1
.5)
1/2:
10/
2
Valu
es a
re e
xpre
ssed
as t
he m
ean
± st
anda
rd d
evia
tion
or n
(%).
SVR
, sus
tain
ed v
iral r
espo
nse;
EO
T, e
nd o
f tre
atm
ent;
Peg-
IFN
, peg
ylat
ed in
terf
eron
; RB
V, ri
bavi
rin; M
U, m
illio
n un
its; B
W, b
ody
wei
ght;
HC
V, h
epat
itis C
viru
s; n
.s., n
ot sp
ecifi
ed.
EXPERIMENTAL AND THERAPEUTIC MEDICINE 18: 3568-3578, 20193574Ta
ble
II. S
umm
ary
of th
e cl
inic
al o
utco
mes
at t
he fi
rst v
isit
and
afte
r EO
T fo
r all
incl
uded
stud
ies.
Bas
al
Fast
ing
Bas
al
Inci
denc
e
Bas
al
FPG
fa
stin
g in
sulin
Com
pare
d in
cide
nce
of IR
afte
r B
asal
H
OM
A-I
R
Bas
al
HO
MA
- FP
G
afte
r EO
T in
sulin
af
ter E
OT
1st a
utho
r (ye
ar)
grou
ps
of IR
(%)
EOT
(%)
HO
MA
-IR
af
ter E
OT
HO
MA
- af
ter E
OT
(mg/
dl)
(mg/
dl)
(µU
/ml)
(µU
/ml)
(R
efs.)
Jung
(201
4)
SVR
n.
s. n.
s. 3.
4±2.
69
2.5±
0.2
149.
6±11
7 10
4.3±
6.5
n.s.
n.s.
n.s.
n.s.
(32)
N
on-S
VR
n.
s. n.
s. 3.
4±2.
31
3.1±
0.2
111.
1±65
.6 1
02.2
±5.3
n.
s. n.
s. n.
s. n.
s. C
han
(201
3)
SVR
n.
s. n.
s. 3.
0±1.
0 2.
3±0.
7 n.
s. n.
s. n.
s. n.
s. n.
s. n.
s. (3
3)
Non
-SV
R
n.s.
n.s.
3.1±
0.7
3.1±
0.9
n.s.
n.s.
n.s.
n.s.
n.s.
n.s.
Agh
emo
(201
2)
SVR
H
OM
A sc
ore
10
%
1.11
±0.8
1.
18±1
.1
n.s.
n.s.
n.s.
n.s.
n.s.
n.s.
(19)
>2: 1
2%
Non
-SV
R
HO
MA
scor
e
19%
1.
20±0
.85
1.49
±1.3
n.
s. n.
s. n.
s. n.
s. n.
s. n.
s.
>2
: 11%
Kha
ttab
(201
2)
SVR
n.
s. n.
s. 2.
03±0
.6
1.2±
0.3
n.s.
n.s.
4.5±
0.6
n.s.
13.7
±5.1
n.
s. (3
4)
(m
mol
/l)
Non
-SV
R
n.s.
n.s.
4.05
±0.8
N
on-r
espo
nder
s:
n.s.
n.s.
n.
s.
n.s.
3.
77±0
.6
Rel
apse
rs:
2±
0.4
Kim
(200
9)
SVR
H
OM
A-I
R
5.
28±4
.55
2.62
±1.0
7 n.
s. n.
s. 11
2.6±
33.0
99
.9±1
4.9
18.1
3±14
.24
10.4
0±3.
12
(22)
>3: 1
4 (6
3.6)
N
on-S
VR
H
OM
A-I
R
3.
34±1
.24
3.4
5± 1
.28
n.s.
n.s.
105.
5±15
.2 1
07.0
±14.
6 12
.50±
3.16
13
.06±
4.02
>3
: 4 (6
6.7)
Kaw
aguc
hi (2
009)
SV
R
n.s.
n.s.
1.86
±1.0
8 1.
67±0
.93
174±
211
105±
60
n.s.
n.s.
n.s.
n.s.
(35)
N
on-S
VR
n.
s. n.
s. 2.
50±1
.13
2.50
±1.3
1 19
3±14
5 15
7±12
6 n.
s. n.
s. n.
s. n.
s. Pe
tta (2
009)
SV
R
HO
MA
8.
80%
2.
64±1
.85
1.53
±0.9
2 n.
s. n.
s. n.
s. n.
s. 11
.9±7
.3
n.s.
(26)
≤2.7
: 30%
R
elap
sers
H
OM
A
19.3
0%
2.64
±1.1
6 1.
85±0
.80
n.s.
n.s.
n.s.
n.s.
12.5
±5.8
n.
s.
≤2
.7: 3
0%
Non
‑res
pond
ers
HO
MA
≤2.
7:
17.5
0%
3.10
±1.8
0 2.
05±0
.84
n.s.
n.s.
n.s.
n.s.
n.
s.
52%
Kaw
aguc
hi (2
007)
SV
R
n.s.
n.s.
3.07
±0.9
5 2.
2±0.
7 11
3.7±
21.3
92.
6±14
.0
n.s.
n.s.
n.s.
n.s.
(20)
N
on-r
espo
nder
s n.
s. n.
s. 3.
95±1
.69
3.6±
1.2
120.
0±26
.1 1
12.4
±24.
1 n.
s. n.
s. n.
s. n.
s.
Rel
apse
rs
n.s.
n.s.
3.73
±1.2
1 3.
6±1.
2 12
1.5±
13.3
117
.4±1
7.4
n.s.
n.s.
n.s.
n.s.
Valu
es a
re e
xpre
ssed
as t
he m
ean
± st
anda
rd d
evia
tion
or n
(%).
SVR
, sus
tain
ed v
iral r
espo
nse;
EO
T, e
nd o
f tre
atm
ent;
HO
MA
, hom
eost
asis
mod
el a
sses
smen
t; IR
, ins
ulin
resi
stan
ce; F
PG, f
astin
g pl
asm
a gl
ucos
e.

HU et al: INSULIN RESPONSE AND GLUCOSE AFFECT HCV PATIENTS 3575
that viral clearance improved insulin sensitivity in CHC patients with baseline IR, while it increased the HOMA-IR in patients without baseline IR (38). One explanation may be that baseline IR is due to HCV infection, which is known to impair the host's glucose metabolism (39).
Of note, although a recent meta-analysis of 17 studies concluded that IR was associated with a 3-fold higher risk of failure to achieve SVR, regardless of viral genotype, certain studies included failed to demonstrate an association between IR and SVR (24). This result was attributed to a
number of factors, including differences between the studies in calculating and interpreting HOMA-IR scores, inclusion of easy-to-cure cohorts and the presence of other variables strongly associated with IR (24). The present meta-analysis indicated no significant difference in the reduction of IR rates between the SVR and non-SVR groups, although the SVR group had a significantly higher mean reduction in HOMA-IR scores compared to the non-SVR group. It is important to note that only 2 studies included in the present meta-analysis provided complete data for IR rates (19,26).
Figure 4. Meta-analysis for determining the difference in reduction in HOMA-β scores between SVR and non-SVR groups. Lower limit and upper limit refer to the 95%CI. HOMA, homeostasis model assessment; SVR, sustained virological response; Diff, difference; df, degrees of freedom.
Figure 3. Meta-analysis for determining the difference in reduction in HOMA-IR scores between SVR and non-SVR groups. Lower limit and upper limit refer to the 95%CI. HOMA, homeostasis model assessment; IR, insulin resistance; SVR, sustained virological response; Diff, difference; df, degrees of freedom.
Figure 2. Meta-analysis for determining the difference in reduction in IR rate between SVR and non-SVR groups. Lower limit and upper limit refer to the 95%CI. IR, insulin resistance; SVR, sustained virological response; EOT, end of treatment; df, degrees of freedom.

EXPERIMENTAL AND THERAPEUTIC MEDICINE 18: 3568-3578, 20193576
In addition, each study used a different HOMA-IR cut-off value. The present results suggest that it may be necessary to evaluate baseline IR in order to elucidate the impact of SVR on IR. It may also be useful to analyze the rates of de‑novo IR development, since it has been previously reported that non-diabetic CHC patients who achieved SVR after IFN-based therapy had lower rates of de‑novo IR compared to non-SVR patients (19).
The present meta-analysis included three studies reporting on the HOMA-β score in the SVR and non-SVR
groups (20,32,35). These studies all indicated that patients who achieved SVR had a significant reduction in their HOMA‑β values compared with the non-SVR group. The results of the pooled analysis (combined effect) were consistent with the individual analysis results of the individual studies. This suggested that HOMA-β, a measure of insulin secretion in the pancreas, had a significantly higher mean reduction after EOT vs. baseline in the SVR group compared with that in the non-SVR group. These results further support that SVR is not merely a surrogate marker of therapeutic efficacy, but an actual aim to pursue in most HCV-infected patients. The present results also suggest that clinical management of IR and serum glucose levels may be an important way to impact the therapeutic response in HCV patients. Furthermore, L-arginine supplementation was reported to improve insulin sensitivity in rats fed a high‑fat diet, and might be beneficial in the treatment of HCV patients in the future (40).
The present study has several strengths and limitations. Of note, it is the first systematic review and meta‑analysis to indi-cate that HCV patients who achieved SVR after IFN therapy had improved HOMA-IR and HOMA-β scores. Furthermore, the present study followed the PRISMA guidelines, which enables transparent and complete reporting (29). Regarding the limitations, only one RCT was included. In addition, the study did not include any subgroup analysis for HCV geno-types 3/4 or different HOMA-IR cut-off scores. Furthermore, other factors correlated with IR, e.g. insulin-like growth factor-1, were not evaluated (41). Finally, the number of studies analyzing IR rates and HOMA-β was small.
In conclusion, the present study revealed that HCV patients who achieved SVR after IFN-based therapy exhibited improve-ment in HOMA-IR and HOMA-β scores. However, since no reduction in IR rates was determined, it is important to inter-pret the results with caution. Further studies are required to evaluate the complex association between SVR and IR.
Acknowledgements
Not applicable.
Funding
No funding was received.
Figure 5. Sensitivity analysis for the difference in reduction in HOMA-IR scores between SVR and non-SVR groups. Lower limit and upper limit refer to the 95%CI. HOMA, homeostasis model assessment; IR, insulin resistance; SVR, sustained virological response; Diff, difference.
Figure 6. Quality assessment. (A) Risk of bias for each included study. (B) Summary of bias of the 8 studies.

HU et al: INSULIN RESPONSE AND GLUCOSE AFFECT HCV PATIENTS 3577
Availability of data and materials
The datasets analyzed during the present study are available from the corresponding author on reasonable request.
Authors' contributions
JHH made substantial contributions to research concept, screening process, identification of eligible studies and manu-script preparation. MLC performed data analysis and prepared the manuscript. NJL screened, identified eligible studies, and analyzed the data. CTY carried out data extraction and data quality evaluation. TJH conceived the research study and supervised the other authors to ensure integrity of the analysis. All authors reviewed the manuscript.
Ethics approval and consent to participate
Not applicable.
Patient consent for publication
Not applicable.
Competing interests
The authors declare that they have no competing interests.
References
1. Lavanchy D: The global burden of Hepatitis C. Liver Int 29 (Suppl 1): S74-S81, 2009.
2. Axley P, Ahmed Z, Ravi S and Singal AK: Hepatitis C virus and hepatocellular carcinoma: A narrative review. J Clin Transl Hepatol 6: 79-84, 2018.
3. Pawlotsky JM: New Hepatitis C therapies: The toolbox, strate-gies, and challenges. Gastroenterology 146: 1176-1192, 2014.
4. Crouchet E, Wrensch F, Schuster C, Zeisel MB and Baumert TF: Host-targeting therapies for Hepatitis C virus infection: Current developments and future applications. Therap Adv Gastroenterol 11: 1756284818759483, 2018.
5. Averhoff FM, Glass N and Holtzman D: Global burden of Hepatitis C: Considerations for healthcare providers in the United States. Clin Infect Dis 55 (Suppl 1): S10-S15, 2012.
6. Dhingra A, Kapoor S and Alqahtani SA: Recent advances in the treatment of Hepatitis C. Discov Med 18: 203-208, 2014.
7. Zignego AL, Ferri C, Pileri SA, Caini P and Bianchi FB; Italian Association of the study of liver commission on Extrahepatic manifestations of HCV infection: Extrahepatic manifesta-tions of Hepatitis C Virus infection: A general overview and guidelines for a clinical approach. Dig Liver Dis 39: 2-17, 2007.
8. Cacoub P, Gragnani L, Comarmond C and Zignego AL: Extrahepatic manifestations of chronic Hepatitis C virus infec-tion. Dig Liver Dis 46 (Suppl 5): S165-S173, 2014.
9. White DL, Ratziu V and El-Serag HB: Hepatitis C infection and risk of diabetes: A systematic review and meta-analysis. J Hepatol 49: 831-844, 2008.
10. Nadolnik K, Skrypnik D, Skrypnik K and Bogdański P: Diabetic nephropathy in the elderly-clinical practice. Rocz Panstw Zakl Hig 69: 327-334, 2018.
11. Moucari R, Asselah T, Cazals-Hatem D, Voitot H, Boyer N, Ripault MP, Sobesky R, Martinot-Peignoux M, Maylin S, Nicolas-Chanoine MH, et al: Insulin resistance in chronic Hepatitis C: Association with genotypes 1 and 4, serum HCV RNA level, and liver fibrosis. Gastroenterology 134: 416‑423, 2008.
12. Wang CS, Wang ST, Yao WJ, Chang TT and Chou P: Hepatitis C virus infection and the development of type 2 diabetes in a community-based longitudinal study. Am J Epidemiol 166: 196-203, 2007.
13. Kralj D, Virović Jukić L, Stojsavljević S, Duvnjak M, Smolić M and Čurčić IB: Hepatitis C virus, insulin resistance, and steatosis. J Clin Transl Hepatol 4: 66-75, 2016.
14. El-Zayadi AR and Anis M: Hepatitis C virus induced insulin resistance impairs response to anti viral therapy. World J Gastroenterol 18: 212-224, 2012.
15. Petta S, Cammà C, Di Marco V, Alessi N, Cabibi D, Caldarella R, Licata A, Massenti F, Tarantino G, Marchesini G and Craxì A: Insulin resistance and diabetes increase fibrosis in the liver of patients with genotype 1 HCV infection. Am J Gastroenterol 103: 1136-1144, 2008.
16. Deltenre P, Louvet A, Lemoine M, Mourad A, Fartoux L, Moreno C, Henrion J, Mathurin P and Serfaty L: Impact of insulin resistance on sustained response in HCV patients treated with pegylated interferon and ribavirin: A meta-analysis. J Hepatol 55: 1187-1194, 2011.
17. Guo X, Jin M, Yang M, Liu K and Li JW: Type 2 diabetes mellitus and the risk of hepatitis C virus infection: A systematic review. Sci Rep 3: 2981, 2013.
18. Sheikh MY, Choi J, Qadri I, Friedman JE and Sanyal AJ: Hepatitis C virus infection: Molecular pathways to metabolic syndrome. Hepatology 47: 2127-2133, 2008.
19. Aghemo A, Prati GM, Rumi MG, Soffredini R, D'Ambrosio R, Orsi E, De Nicola S, Degasperi E, Grancini V and Colombo M: Sustained virological response prevents the development of insulin resistance in patients with chronic hepatitis C. Hepatology 56: 1681-1687, 2012.
20. Kawaguchi T, Ide T, Taniguchi E, Hirano E, Itou M, Sumie S, Nagao Y, Yanagimoto C, Hanada S, Koga H and Sata M: Clearance of HCV improves insulin resistance, beta-cell func-tion, and hepatic expression of insulin receptor substrate 1 and 2. Am J Gastroenterol 102: 570-576, 2007.
21. Kawaguchi Y and Mizuta T: Interaction between hepatitis C virus and metabolic factors. World J Gastroenterol 20: 2888-2901, 2014.
22. Kim HJ, Park JH, Park DI, Cho YK, Sohn CI, Jeon WK and Kim BI: Clearance of HCV by combination therapy of pegylated interferon alpha-2a and ribavirin improves insulin resistance. Gut Liver 3: 108-115, 2009.
23. Delgado-Borrego A, Jordan SH, Negre B, Healey D, Lin W, Kamegaya Y, Christofi M, Ludwig DA, Lok AS and Chung RT; Halt-C Trial Group: Reduction of insulin resistance with effec-tive clearance of hepatitis C infection: Results from the HALT-C trial. Clin Gastroenterol Hepatol 8: 458-462, 2010.
24. Eslam M, Aparcero R, Kawaguchi T, Del Campo JA, Sata M, Khattab MA and Romero-Gomez M: Meta-analysis: Insulin resistance and sustained virological response in hepatitis C. Aliment Pharmacol Ther 34: 297-305, 2011.
25. Thompson AJ, Patel K, Chuang W L, Lawitz EJ, Rodriguez-Torres M, Rustgi VK, Flisiak R, Pianko S, Diago M, Arora S, et al: Viral clearance is associated with improved insulin resistance in genotype 1 chronic hepatitis C but not genotype 2/3. Gut 61: 128-134, 2012.
26. Petta S, Cammà C, Di Marco V, Cabibi D, Ciminnisi S, Caldarella R, Licata A, Massenti MF, Marchesini G and Craxì A: Time course of insulin resistance during antiviral therapy in non-diabetic, non-cirrhotic patients with genotype 1 HCV infec-tion. Antivir Ther 14: 631-639, 2009.
27. Cacoub P, Desbois AC, Comarmond C and Saadoun D: Impact of sustained virological response on the extrahepatic manifestations of chronic hepatitis C: A meta-analysis. Gut 67: 2025-2034, 2018.
28. Ciancio A, Bosio R, Bo S, Pellegrini M, Sacco M, Vogliotti E, Fassio G, Bianco Mauthe Degerfeld AGF, Gallo M, Giordanino C, et al: Significant improvement of glycemic control in diabetic patients with HCV infection responding to direct-acting antiviral agents. J Med Virol 90: 320-327, 2018.
29. Liberati A, Altman DG, Tetzlaff J, Mulrow C, Gøtzsche PC, Ioannidis JP, Clarke M, Devereaux PJ, Kleijnen J and Moher D: The PRISMA statement for reporting systematic reviews and meta-analyses of studies that evaluate health care interven-tions: Explanation and elaboration. J Clin Epidemiol 62: e1-e34, 2009.
30. Sterne JA, Sutton AJ, Ioannidis JP, Terrin N, Jones DR, Lau J, Carpenter J, Rucker G, Harbord RM, Schmid CH, et al: Recommendations for examining and interpreting funnel plot asymmetry in meta-analyses of randomised controlled trials. BMJ 343: d4002, 2011.
31. Hayden JA, van der Windt DA, Cartwright JL, Côté P and Bombardier C: Assessing bias in studies of prognostic factors. Ann Intern Med 158: 280-286, 2013.

EXPERIMENTAL AND THERAPEUTIC MEDICINE 18: 3568-3578, 20193578
32. Jung HJ, Kim YS, Kim SG, Lee YN, Jeong SW, Jang JY, Lee SH, Kim HS and Kim BS: The impact of pegylated interferon and ribavirin combination treatment on lipid metabolism and insulin resistance in chronic hepatitis C patients. Clin Mol Hepatol 20: 38-46, 2014.
33. Chan CH, Hansen RD, Gilliver RS and Jones BE: Sustained virological response following chronic hepatitis C treatment is associated with improvement in insulin resistance. Intern Med J 43: 656-662, 2013.
34. Khattab MA, Eslam M, Shatat M, Abd-Aalhalim H, Mousa YI, Samir F, Aly H, Shaker O and Shaker Y: Changes in adipocyto-kines and insulin sensitivity during and after antiviral therapy for hepatitis C genotype 4. J Gastrointestin Liver Dis 21: 59-65, 2012.
35. Kawaguchi Y, Mizuta T, Oza N, Takahashi H, Ario K, Yoshimura T, Eguchi Y, Ozaki I, Hisatomi A and Fujimoto K: Eradication of hepatitis C virus by interferon improves whole-body insulin resistance and hyperinsulinaemia in patients with chronic hepatitis C. Liver Int 29: 871-877, 2009.
36. Laurito MP and Parise ER: Association between insulin resistance and sustained virologic response in hepatitis C treatment, genotypes 1 versus 2 and 3: Systematic litera-ture review and meta-analysis. Braz J Infect Dis 17: 555-563, 2013.
37. Fried MW, Jensen DM, Rodriguez-Torres M, Nyberg LM, Di Bisceglie AM, Morgan TR, Pockros PJ, Lin A, Cupelli L, Duff F, et al: Improved outcomes in patients with hepatitis C with difficult‑to‑treat characteristics: Randomized study of higher doses of peginterferon alpha-2a and ribavirin. Hepatology 48: 1033-1043, 2008.
38. Chang ML, Kuo CJ, Pao LH, Hsu CM and Chiu CT: The evolving relationship between adiponectin and insulin sensitivity in hepatitis C patients during viral clearance. Virulence 8: 1255-1264, 2017.
39. Chang ML: Metabolic alterations and hepatitis C: From bench to bedside. World J Gastroenterol 22: 1461-1476, 2016.
40. Miczke A, Suliburska J, Pupek-Musialik D, Ostrowska L, Jabłecka A, Krejpcio Z, Skrypnik D and Bogdański P: Effect of L-arginine supplementation on insulin resistance and serum adiponectin concentration in rats with fat diet. Int J Clin Exp Med 8: 10358-10366, 2015.
41. Kujawska-Luczak M, Szulinska M, Skrypnik D, Musialik K, Swora-Cwynar E, Kregielska-Narozna M, Markuszewski L, Grzymislawska M and Bogdanski P: The influence of orlistat, metformin and diet on serum levels of insulin-like growth factor-1 in obese women with and without insulin resistance. J Physiol Pharmacol 69: 2018.
This work is licensed under a Creative Commons Attribution-NonCommercial-NoDerivatives 4.0 International (CC BY-NC-ND 4.0) License.