effect of gravity on self-pressurization of spherical liquid-hydrogen
TRANSCRIPT

EFFECT OF GRAVITY O N SELF-PRESSURIZATION OF SPHERICAL LIQUID-HYDROGEN TANKAGE
by John C. AydeZott
Lewis Reseurch Center C ZeveZund, Ohio
I ' h.1:: p-,'
NATIONAL AERONAUTICS AND SPACE ADMINISTRATION WASHINGTON, D. 6 . = DECEMBER 1967
I I
https://ntrs.nasa.gov/search.jsp?R=19680002177 2018-04-10T23:34:27+00:00Z

TECH LIBRARY KAFB. NM
E F F E C T OF GRAVITY ON SELF-PRESSURIZATION OF SPHERICAL
LIQUID- HYDROGEN TANKAGE
By John C. Aydelott
Lewis R e s e a r c h C e n t e r Cleveland, Ohio
NATIONAL AERONAUTICS AND SPACE ADMINISTRATION
For sale by the Clearinghouse for Federal Scientific and Technical Information Springfield, Virginia 22151 - CFSTl price $3.00

EFFECT OF GRAVITY ON SELF-PRESSURIZATION OF SPHERICAL
LIQUID-HYDROGEN TANKAGE
by John C. Aydelott
Lewis Research Center
SUMMARY
The information obtained from several experimental programs was examined in order to understand better the thermodynamic history of spherical, 9 -inch- (23-cm-) diameter liquid-hydrogen tankage at both normal and reduced gravities. The rate of pressure rise in the hydrogen container was lower under reduced-gravity conditions than under normal- gravity conditions because of the increase in the liquid-wetted wall area and the increased boiling. The location of the sources of heat relative to the hydrogen liquid and vapor was the most important factor in determining the rate of pressure r ise .
INTRODUCTION
The space exploration program of the NASA is heavily dependent on the use of liquid hydrogen as a rocket fuel. Hydrogen is very attractive for use as a rocket fuel because of the high specific impulse it produces either when reacted with an oxidizer or when used as a heated expellant a s in a nuclear rocket.
its low density, i t is practical, for space missions, to store hydrogen only as a liquid. The low equilibrium temperature of liquid hydrogen at atmospheric pressure makes it very difficult to insulate a storage container sufficiently to prevent a net heat gain. Under these conditions, the pressure will eventually r ise until venting is required, with an ac- companying propellant loss. Also of particular interest is the low thermal conductivity of hydrogen, which makes it possible for subcooled liquid and highly superheated vapor to coexist in the same container. This situation occurs when a closed system is exposed to heat, which causes an increase in the system pressure. The interface between the liquid and vapor phases remains at the saturation temperature corresponding to the increasing total system pressure. The average liquid temperature may increase at a slower rate, and thus the liquid bulk becomes subcooled; the average vapor temperature may increase
Hydrogen has many properties which set it apart from common liquids. Because of

at a faster rate, and thus the vapor becomes superheated. As a consequence, simple thermodynamic analysis often can not predict the rate of pressure rise in a closed system containing liquid hydrogen.
An excellent review of the work in this field can be found in reference 1. The major- ity of the work has been restricted to cylindrical tanks with heating only on the side walls. Therefore, natural convection theory for vertical plates could be used to predict the heat and mass transfer within the liquid phase. In general, direct heating of the vapor was not considered. In this investigation, both the geometry of the hydrogen container and the basic heat-transfer mechanisms were different. Consequently, no attempt was made to correlate the resulting data with existing analyses, and no detailed discussion of other work is included.
.
Many variables affect the rate of pressure rise in a closed cryogenic container. The most important a r e container geometry and size, heat-transfer ra te and distribution, per- cent liquid filling, and gravity level as it affects both the liquid-vapor configuration and the heat-transfer mechanisms involved.
For the past several years, the Lewis Research Center has been engaged in a pro- gram of zero-gravity research. Part of this research effort was conducted in the 2.2-second drop tower research facility to determine the static and dynamic behavior of both cryogenic and noncryogenic fluids under reduced-gravity conditions (refs. 2 to 4). Simultaneously, a ser ies of experiments was conducted using Aerobee sounding rockets and an Atlas Scientific Passenger Pod. These studies were conducted to determine the dynamic behavior and thermodynamic history (pressure and temperature as a function of time) of liquid hydrogen under reduced-gravity conditions when contained in a closed 9-inch- (23-cm-) diameter sphere (refs. 5 to 9). A ser ies of self-pressurization tests was conducted by the author to determine the thermodynamic history of a 9-inch- (23-cm-) diameter sphere under normal-gravity conditions (ref. 10). Various combina- tions of the variables percent liquid filling, heat-transfer rate, and heat-transfer distri- bution were studied.
and reduced gravities, as it applies to the prediction of the thermodynamic history of spherical, 9-inch- (23-cm-) diameter, liquid-hydrogen tankage.
This report presents a review of the research performed at Lewis, at both normal
ANALYSIS
Theoret ical P r e s s u r e Rise
The first law of thermodynamics is
Q = A U + I P d V
2

where
Q
U total system internal energy
P absolute pressure
V total system volume
total energy input to system under consideration
For a closed, constant-volume system, all the heat absorbed by the system manifests itself in a change in the total internal energy of the system (i. e., for dV = 0, Q = AU). If the system is a tank containing a liquid and its vapor, a knowledge of how the added heat affects the internal energy distribution and, thus, the temperature distribution within the tank makes possible prediction of the total system pressure. For a two-phase mix- ture, temperature and pressure are dependent variables at the interface between the liq- uid and the vapor.
The temperature distribution in a cryogenic storage tank is highly complex and is affected by many variables. The most important of these a r e tank geometry and size, gravity level, percent filling, heat-transfer rate, and heat-transfer distribution.
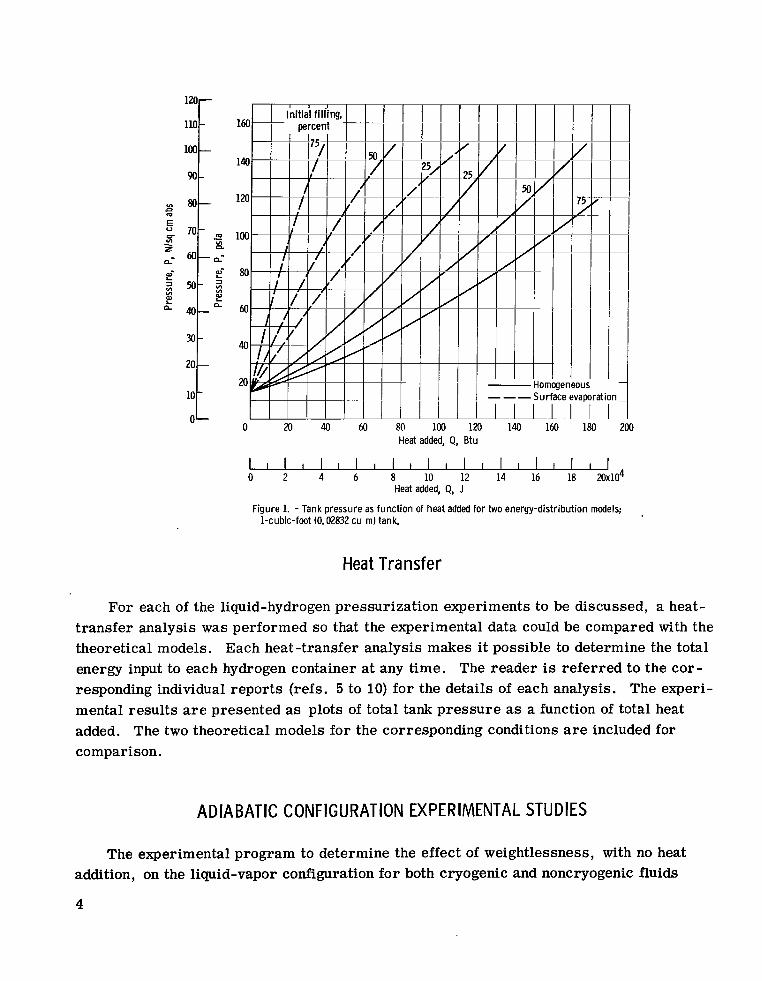
This report presents two simple pressure-rise models for a nonventing hydrogen container. These models are not intended to describe the process that actually takes place but a r e intended to be a means of comparing one set of experimental data with another. The position that experimental data assume in relation to the theoretical models on a plot of pressure against heat added is a qualitative indication of how energy is being distributed within the hydrogen container.
the hydrogen container and is a common calculation that is performed to compare data of this type. The second model assumes that all the energy absorbed by the hydrogen con- tainer goes into evaporating the liquid and maintaining the vapor at the saturation temper- ature corresponding to total system pressure. The liquid-phase temperature remains constant at the saturation temperature corresponding to the sealoff pressure. Appendix B of reference 10 contains the development of these theoretical models based on the first law of thermodynamics.
distribution models. The plot is for a 1-cubic-foot- (0.02832-cu-m-) container with ini- tial liquid fillings of 25, 50, and 75 percent by volume. The reader may approximate the energy input, as determined by these models, that will cause a specified change in pres- sure for any tank size o r filling. This approximation is possible by interpolating to de- termine the effect of the percent filling and by multiplying the heat added by the volume of the tank in cubic feet since. the energy input is a linear function of the tank volume.
The first model assumes homogeneous conditions (saturation temperature) throughout
Figure 1 is a plot of tank pressure as a function of heat added for the two energy-
3
110
100
90-
s m E =: 70-
i 2 50-
VI - z d
VI a L - 30-
20
10
Heat added, 9, Btu
120-
-
-
80-
.- m n VI
60- d E- ; E L
40-
-
-
0-
1 1 1 1 1 1 1 1 1 1 1 1 1 1 1 1 ~ 0 2 4 6 8 10 12 14 16 ’ :8 ’ 20?104 Figure 1. - Tank pressure as function of heat added for two energy-distribution models;
Heat added, 4, J
. 1-cubic-foot (0.02832 cu m) tank.
Heat Transfer
For each of the liquid-hydrogen pressurization experiments to be discussed, a heat- transfer analysis was performed so that the experimental data could be compared with the theoretical models. Each heat-transfer analysis makes it possible to determine the total energy input to each hydrogen container at any time. The reader is referred to the cor- responding individual reports (refs. 5 to 10) for the details of each analysis. The experi- mental results a r e presented as plots of total tank pressure as a function of total heat added. The two theoretical models for the corresponding conditions are included for comparison.
AD IA BATlC CONFlG URATION EX PER IMENTAL STU DIES
The experimental program to determine the effect of weightlessness, with no heat addition, on the liquid-vapor configuration for both cryogenic and noncryogenic fluids
4
contained in spherical tanks was conducted in the Lewis 2.2-second drop tower. More detailed information about the research facility and the experiment packages can be found in references 2 and 3.
gravity, the liquid-vapor interface configuration for these fluids is a spherical vapor bub- ble that has no preferred location in the interior of the liquid. This configuration results from the attempt of the liquid-vapor interface to maintzia its characteristic contact angle with the glass wall; this could not be accomplished because of the continuous curvature of the wall. The resulting spherical vapor bubble is the equilibrium configuration resulting from a minimization of the surface energy.
The fluids studied have static zero-degree contact angles with glass. In zero
LlQU I D -HY DROGEN PRESS U R IZATION EX PER IMENTAL STUDIES
Apparatus and Procedure
Simultaneously with the drop tower studies, two programs were undertaken to de- termine the effects of reduced gravity and heat addition on the rate of pressure rise in
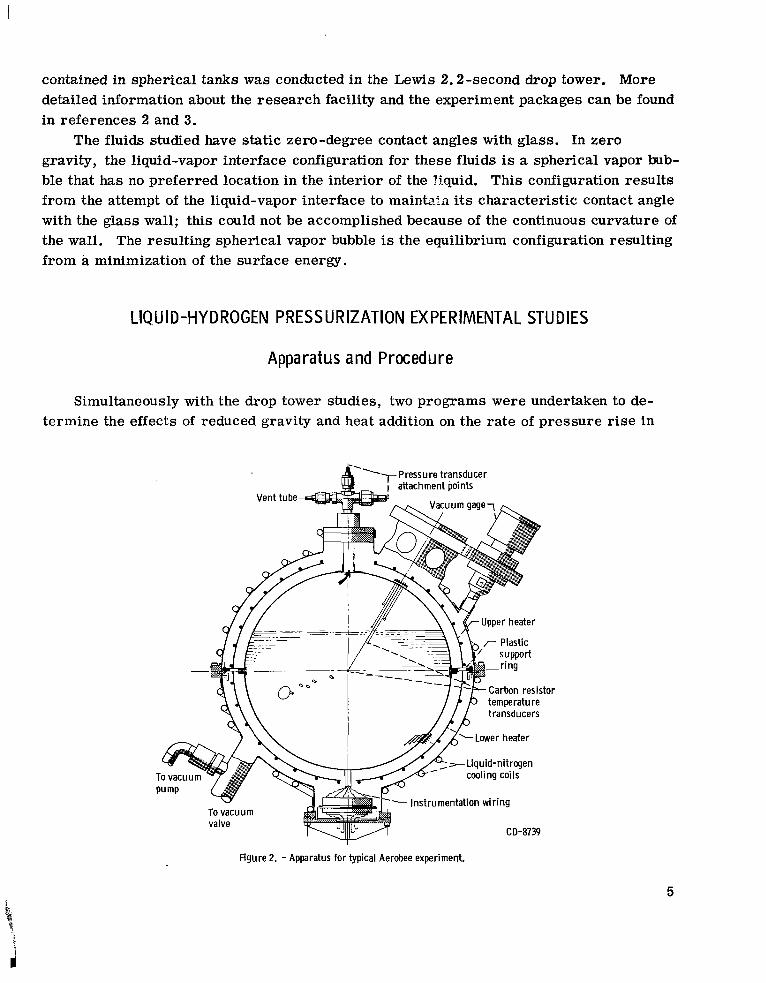
Figure 2. - Apparatus for typical Aerobee experiment.
5

9-inch- (23-cm-) diameter spherical liquid-hydrogen tanks. For one of the programs, Aerobee sounding rockets were used to obtain approximately 5 minutes of time in a reduced-gravity environment for a series of experiments. A good description of the Aerobee rocket and its use in reduced-gravity research is contained in reference 6. The second program (ref. 9) used an Atlas Scientific Passenger Pod to obtain 21 minutes of reduced-gravity environment.
three concentric spheres; the inner sphere contained the liquid hydrogen, the interme- diate sphere had electric heating coils mounted on the exterior surface, and the outer sphere served as a vacuum jacket. The primary energy input to the inner sphere was ra - diant exchange from the intermediate sphere. A typical experiment designed to be car- ried by the Aerobee rocket is shown in figure 2. The experiment for the At las pod is shown in figure 3. Each experiment was designed to explore the effect of a different combination of the variables percent filling, heat-transfer distribution, and heat-transfer rate. The difference between each of the Aerobee experiments and the Atlas pod experi- ment was primarily limited to instrumentation.
using liquid hydrogen contained in a modified Aerobee experimental apparatus (ref. 10).
The experimental apparatus for both programs were similar in that they consisted of
More recently a series of tests was performed under normal-gravity conditions,
Vacuum
\ gage-,
Liquid-hydrogen fill Liquid-hydrogen vent
nstrumentation flange
TO vacuum valve and pump
electrically controlled
Carbon resistor temper- ature transducers
Figure 3. - Apparatus for Atlas Scientific Passenger Pod experiment
6

In addition to having instrumentation designed to meet the needs of normal-gravity testing, the intermediate sphere was designed so that either hemisphere could be removed to change the heating configuration. The hydrogen container was subjected to various com- binations of the variables percent filling, heat-transfer rate, and heat-transfer distribu- tion (top, bottom, o r uniform heating).
lift-off and allowed to self-pressurize for the duration of the flight. For the normal- gravity tests, the experiment was sealed at a convenient time and allowed to self- pressurize to a maximum pressure of 100 psia (68.95 N/sq cm abs). The inner sphere pressure, the vacuum-jacket pressure, and the surface temperatures of the three concen- t r ic spheres were measured in all the studies. In addition, the experiments of references 7 to 10 had carbon resistor temperature transducers inside the inner sphere to determine the temperature of the hydrogen liquid and vapor. A detailed discussion of the instrumen- tation used on each experiment, instrumentation calibration, data recording, chill-down, filling and operating procedure, is included in references 5 to 10. An analysis of the e r r o r associated with the temperature and pressure transducers can be found in refer- ence 10.
For the Aerobee and the Atlas pod programs, the hydrogen container was sealed at
Nor ma I - Gravity Test Res u Its
Twenty-one quiescent tests were performed under normal-gravity conditions (ref. 10). Average heat fluxes ranged from 15.5 to 128.6 Btu per hour per square foot (49 to 405 W/sq m) and the percent liquid filling ranged from 29.3 to 80.4 percent by vol- ume. The effects of uniform heating, bottom heating, and top heating were explored.
Effect of heat-transfer rate and distribution. - Figure 4(a) shows the effects of heat- transfer rate and distribution on the pressure as a function of heat added. The tank was approximately 50 percent full for these quiescent tests. The 50-percent filling was chosen since it represents the least complicated geometric situation, where the liquid-vapor in- terface and the division between the upper and lower heaters are approximately in the same horizontal plane.
heat-transfer rate on the slope of the pressure against heat added data. The heat-transfer rate had the least effect on the slope for the bottom-heating tests. This influence in- creased for the uniform-heating and top-heating tests. However, the heat-transfer rate was definitely secondary in importance to the heating configuration.
The two coordinates, pressure and heat added, as plotted in figure 4(a), are the in- tegrals over time of the pressure-rise rate and the heat-transfer rate. coincident test data on this plot would indicate a linear relation between the pressure-rise rate and the
Figure 4(a) shows that the heating configuration has a much greater effect than the
I
7

v)
E- E 3 n
Hombgeneobs; filling,
percent
4.9 '
3. 9 /
6. 5
I
Cn E /
I I
V
o D 0 n 4 0 I
n
percent 47.7 Top 51.2 Top 50.5 Top 50.7 Uniform 48.9 Uniform 51.4 Uniform 47.8 Bottom 49.0 Bottom
I I I I
38.2 27.6 17. 1
111.6 65.0 18.2 75.2 44.6 I I
M 24 28 16 Heatadded, 4, Btu
I I I I 2 3x10⁴
Heat added, Q, J (a) Effect of heat-transfer rate and distribution.
/ /
/
16
/ /
/
Heat added, 9, Btu
I I I
0 1 Heat added, 4, J
(b) Effect of percent filling.
/ i
/
/ /
/
32
percent 0 7 6 . 5 72.6 (229) 0 48.9 65.0 (205) - G 34.9 59.9 (189)
I I I I I 20 24 28
I 2
I I 3x10⁴
Figure 4. - Pressure as function of total heat added for normal-gravity quiescent tests.
8

heat-transfer rate; that is, doubling the heat-transfer rate doubles the pressure-rise rate. For the bottom-heating tes ts this linear relation was followed almost exactly, but the uniform-heating tests and, to a greater degree, the tests with top heating only began to deviate. This difference indicates that the energy distribution in the liquid was unaf- fected by the rate of energy input. However, the rate of energy input to the vapor greatly affected the temperature or energy distribution.
Reference 10 concludes that the mode of heat transfer in the liquid in a spherical tank is either turbulent convective currents throughout the bulk or boiling. An essentially uni- form temperature would be anticipated in the liquid bulk for either turbulent-convection o r boiling heat transfer. Because a uniform temperature was experimentally observed in the liquid bulk, it was concluded that at the lower heat fluxes the heat-transfer mechanism was dominated by turbulent convection. A t the higher heat fluxes, some boiling was encoun- tered. The heat-transfer processes which take place in the vapor are not clearly under- stood, but the primary mode of energy transfer may be intermolecular (i. e. , conduction and diffusion).
The theoretical surface-evaporation line (saturated vapor, no liquid bulk heating) and the homogeneous line (uniform-temperature liquid and vapor) are plotted in figure 4(a) to permit comparison of the experimental data with these models. The top-heating tests ap- proach the surface-evaporation model in one respect; the liquid is heated a very slight amount, but superheating the vapor pushes the experimental data above the theoretical surface-evaporation line. The bottom-heating tests approach the homogeneous model in one respect; the liquid is nearly saturated, but some heating of the vapor causes super- heating, and the experimental data lie above the theoretical homogeneous line. The uniform-heating tests combine some heating of the liquid with superheating of the gas; the resulting data lie between the two extremes of top heating and bottom heating.
pressure as a function of heat added for three uniform-heating tests. These three tests were chosen to demonstrate the effect of the percent filling because the average heat flux was nearly the same. Here again, the experimental data a r e compared with the theoreti- cal models. Based on figure 4(a.), if the average heat flux had been the same, the experi- mental data would have been somewhat closer together than those shown in figure 4(b). The conclusion to be drawn from figure 4(b) is that the rate of pressure rise was only slightly affected by varying the percent filling when the heating was uniform. However, a trend toward higher rates of pressure rise resulted from higher fillings.
creased filling, similar to the theoretical surface-evaporation model. This increase in pressure is a result of the increasing unheated liquid mass and the decreasing vapor vol- ume which must absorb the incoming energy. The bottom-heating tests exhibited de- creasing rates of pressure rise with increased filling, similar to those for the theoreti- cal homogeneous model. This decrease in pressure results from the increased, nearly
Effect of percent filling. - Figure 4(b) shows the effect of the percent filling on the
The top-heating tests (ref. 10) exhibited increasing rates of pressure rise with in-
9

saturated, liquid mass which is available to absorb the incoming energy. Evidently, the uniform-heating tests are slightly dominated by the heating of the vapor, which causes a small increase in the rate of pressure rise with increased filling.
Reduced- Gravity Test Res u I ts
Effect of heat-transfer _ . rate and distribution. - The effect of heat-transfer rate on the thermodynamic history of two reduced-gravity experiments is shown in figure 5(a). Both of the experiments were flown on Aerobee sounding rockets, so that approximately 5 min- utes of test time was available. The data of reference 5 are from an experiment with a uniform heat flux of 150 Btu per hour per square foot (473 W/sq m) and an initial liquid filling of 34.3 percent by volume. An acceleration field of less than g was exper- ienced while the rocket and the experiment were in free fall. The data of reference 7 a r e from an experiment with a uniform heat flux of 23 Btu per hour per square foot (72.5 W/ s q m) and an initial liquid filling of 36.0 percent. The corresponding free-fall accelera- tion was less than g. The random gravity forces experienced by both experiments were small enough so that the liquid hydrogen was in the capillary dominated region.
same test time because of the lower heat-transfer rate. A s might have been expected from the adiabatic studies, the liquid hydrogen in the experiment with the lower heat- transfer rate quickly wetted the tank walls following entry into the low-gravity environ- ment. The resulting vapor bubble was nearly centrally located, although it may have been held in that position by the carbon resistor temperature transducers. The resistors were designed to measure the liquid temperature but could also have acted as small surface- tension baffles. A s a result, al l the incoming energy passed through the liquid-wetted walls and produced a nearly homogeneous mixture. This situation is similar to the normal-gravity bottom-heating tests, where only the liquid was heated and nearly homo- geneous conditions were observed.
The experiment at a higher heat-transfer rate (ref. 5) also resulted in complete wetting of the tank walls upon entering reduced gravity. However, the vapor bubble drifted to one end of the tank, and shortly thereafter a dry spot appeared. The dry area was initially where the f i l l and vent tube is attached, the area of the highest localized heat-transfer rate. A s time progressed, the dry a rea continued to grow until only one- half of the inner sphere was wet. This spreading of the dry area results from the local- ized energy input to the inner sphere evaporating the liquid hydrogen faster than capillary flow can replace it. The resulting liquid-vapor interface then begins to approach a normal-gravity configuration. The direct heating of the vapor causes the rate of pressure rise to be greater than homogeneous, as in the uniform-heating normal-gravity tests.
In the case of reference 7, there was less total heat added during approximately the
10

0
In i t ia l
I l l
Surface evapor 34.3 percent f i l l i n
5 72.5 7
. . Average heat f lux, Reference
fi l l ing, Btul(hr)(sq ft); (Wlsq m) percent neous,
I--- 34.3 150 473 36.0 23
-- -36.0 I r e n t f i l l i ng
Theoretical I l l
16 20 24 28 32 I I L - I I I I I
8 12 .- m
e- 0 1 2 3 h 4 3 Heat added, Q, J I
Heat added, Q, Btu v) a.
a- I 1 I I
VI . V I a
a z-
(a) Effect of heat-transfer rate. 3 111
Theoretical I I I I
16 20 24 28 32 I I I I 1 1 - 1 I I I
0 4 8 12 Heat add%d, Q, B tu
I 1 2 1 2 3x10⁴
I 0
Heat added, Q, J
(b) Effect of percent f i l l ing.
Figure 5. - Pressure as func t i on of total heat added for reduced-gravity tests. Uni form heating configuration.
11

80-
70 -
60-
M-
40-
30-
20 -
10 -
8 0- lu
u 0- VI - E
z d e- 3 Ln VI
2? n
20
10 36.0 percent filling - Theoretical -
I I I I I I I
12

This effect was also reported in reference 6 which presents the data for a low percent filling, unsymmetrically heated experiment. The average rate of energy input was ap- proximately the same as that reported in reference 7 (23 Btu/(hr)(sq ft); 72.5 W/sq m). The vapor bubble moved to the area of maximum heat addition and drying occurred. The experimental results are nearly identical to those of reference 5 shown in figure 5(a). The unsymmetrical heating caused nearly the same degree of nonhomogeneity as sym- metrical heating (ref. 5), but at a lower heat-transfer rate.
two reduced-gravity experiments is shown in figure 5(b). The data obtained from refer- ence 8 are compared with the data from reference 5. The data of reference 8 are for an experiment with a uniform heat flux of 145 Btu per hour per square foot (457 W/sq m) and an initial liquid filling of 78.3 percent by volume. The acceleration field was nominally
g fo r the first portion of the flight, which is shown in figure 5(b). The latter portion of the flight is discussed in connection with figure 5(c). The data of reference 5 were for approximately the same heat f lux and gravity level, but for a lower liquid filling of 34.3 percent.
The rate of pressure rise was slightly less for the test with a higher percent filling. The container walls in the high-filling experiment were completely wetted for the entire reduced-gravity period. The vapor bubble was near the top of the container during the first part of the flight, but liquid separated the vapor from the tank wall. Consequently, all the energy entered the hydrogen container through liquid-wetted walls. For this high- filling test, the internal instrumentation may have acted as a surface-tension baffle, as previously discussed in connection with reference 7. These carbon resistor temperature transducers measured the liquid temperature and were located in a pattern of concentric spheres.
The heat fluxes which were employed in the flight experiments are above the normal- gravity incipient boiling point. In reduced gravity, convective heat transfer diminishes so that nucleate boiling is the primary mode of energy exchange. For the low-filling and low-heat-transfer-rate case (ref. 7, fig. 5(a)), the resulting energy distribution was nearly homogeneous. For the high-filling and high-heat-transfer-rate case (ref. 8), the resulting energy distribution was definitely not homogeneous even though both experiments had completely wetted walls. A possible explanation of these results is that bubbles formed on the wall of the tank and did not penetrate very far into the liquid bulk. The bubbles may condense close to the wall and thus heat only a small portion of the liquid volume. Also, the lower heat-transfer rate associated with reference 7 makes it pos- sible for more energy to be conducted into the liquid away from the wall. These conclu- sions are supported by the liquid temperature gradients, which were much greater for the high-filling test than for the low-filling test. These large temperature gradients then explain the nonhomogeneous pressure rise shown in figure 5(b), since a homogeneous pressure rise results from a uniform-temperature system.
Effect of percent filling. - The effect of liquid filling on the thermodynamic history of
13

.., .- . , . . . .. .. . 1111 111111 11111111.1 I I 111,,-,, I I II I I 8 . I .I .I
Effect of disturbances. - A s the flight of reference 8 continued, the gravity level de- creased to a final value of approximately 2X10⁻⁴ g. A t about the middle of the test, the vapor bubble moved because of this reduction in gravity level and possibly because of the surface-tension effect of the internal instrumentation. This motion of the bubble caused a general mixing of the liquid in the tank, and a reduction in the rate of pressure r i se re- sulted, as shown in figure 5(c).
Also shown in figure 5(c) are some previously unpublished data from an earlier test. Because the Aerobee rocket is spin stabilized during the boost phase, it is necessary to keep the experiment from rotating by using a despin table. Following the boost phase, a small nozzle system is used to despin the rocket casing so that no disturbances due to misalinement of the rocket and experiment centers of gravity will be transmitted to the experiment during the coast phase of the flight. This despin system failed on the first attempt to determine the effect of higher fillings on the thermodynamic history of a spher- ical hydrogen container. The resulting accelerations of the experiment were *6X10⁻² g and caused a mixing action to take place in the hydrogen container. The resulting rate of pressure rise was lower than that of reference 8. These experiments were identical, but the despin system operated satisfactorily in the case of reference 8 . The conclusion to be drawn from figure 5(c) is that random disturbances cause a general mixing of the liquid hydrogen and thus a more nearly homogeneous condition.
Effect of small unidirectional acceleration. - - In contrast to the previous conclusion is the effect of a small undirectional acceleration presented in figure 5(d). reference 7 a r e again shown and compared with the results of the Atlas Scientific Passen- ger Pod experiment (ref. 9).
ence 7 with the exception of having available a longer period of reduced gravity. The heat-transfer rates , the percent liquid filling, and the internal instrumentation were nearly identical. When the pod was separated from the launch vehicle, the ejection sys- tem malfunctioned and caused the pod to tumble. The resulting centrifugal acceleration, due to the location of the experiment relative to the center of gravity of the pod, was cal- culated to be a constant This low-gravity field moved the liquid to the bottom of the tank and the vapor to the top.
After approximately 1 minute in this 10-3-g field, the inner sphere began to dry in the region of the fill and vent tubes. A s time progressed, this dry area increased to approxi- mately 25 percent of the inner sphere. Exposing this increasing area of vapor to the in- coming energy slowly increased the rate of pressure rise. This result is similar to that obtained in reference 5, where a higher heat-transfer rate was employed.
The data from
The Atlas Pod experiment was performed under the same test conditions a s refer-
g acting in the same direction a s a normal gravity field.
14

Comparison of Nor ma I - and Reduced- Gravity Test Results
Figure 6 is a plot of pressure as a function of heat added for the reduced-gravity tests reported in references 5 and 8 and for two normal-gravity tests of reference 10. A l l these tests were performed a t relatively high heat-transfer rates. For the high-filling tests, the rate of pressure rise is greater for the normal-gravity test than for the reduced-gravity test. For the low-filling tests, the rate of pressure rise is initially greater for the normal-gravity test than for the reduced-gravity test. With increasing time, the reduced-gravity, low-filling experiment experiences wall drying so that even- tually the slopes of the normal-gravity and the reduced-gravity test data are approxi- mately the same.
as the gravity level is reduced, there is a transition from convective heat transfer to In general, the liquid-wetted wall area increased with decreasing gravity level. Also,
12t 80
lo(
60
n L
I I I I T - I I I I I I I
Initial Average heat flux, Gravity Data from - filling, Btu/(hr)(sq ftl; (Wlsq m) level, percent 9 d A 77.2 129 (406) 1 Ref. 10 36.8 102 (321) 1 Ref. 10 - 78.3 145 (457) lo? Ref. 8 34.3 150 (473) <2xlO-j Ref. 5 -
Theoretical
15
3

more active boiling, which mixes the liquid bulk. Both the decreasing dry wall area and the increased boiling reduced the temperature gradients in the hydrogen and thus lowered the rate of pressure rise.
SUMMARY OF RESULTS
The information obtained from several experimental programs was examined in order to understand better the thermodynamic history of spherical, 9-inch- (23-cm-) diameter liquid-hydrogen tankage. These programs included a series of Aerobee Sounding Rocket experiments, an At las Scientific Passenger Pod experiment, and data obtained from the Lewis drop tower. This review yielded the following results.
completely cover the walls of a spherical tank. The resulting spherical vapor bubble has no preferred location within the interior of the liquid.
2. Under normal-gravity nonadiabatic conditions
tion relative to the liquid location, being greatest for top heating and least for bottom heating.
b. The rate of pressure r i se increased almost linearly with increasing heat- transfer rate.
c. For the uniform-heating tests, the rate of pressure r i s e was only slightly affected by varying the percent filling. 3. Under reduced-gravity uniform-heating conditions
a. The rate of pressure rise was greatly affected by the liquid configuration. Totally liquid-wetted walls produced the lowest ra te of pressure rise.
b. The liquid configuration was dependent on the surface tension of the test fluid, on the heat-transfer rate and distribution, on the percent liquid filling, and possibly, in some cases, on the internal instrumentation. High heat-transfer rates and low percent liquid filling decreased the wetted wall area and increased the rate of pres- sure rise.
c. Oscillatory or random disturbances decreased the rate of pressure rise. d. A small unidirectional acceleration tended to decrease the area of the liquid-
1. Under zero-gravity adiabatic conditions, a zero-degree-contact-angle liquid will
a. The rate of pressure r i se was affected most by the location of the heat addi-
wetted wall and to increase the rate of pressure rise. 4. In general, the rates of pressure rise under normal-gravity conditions were
a. The liquid-wetted wall area increased with decreasing gravity level. greater than those under reduced-gravity conditions for the following reasons:
16

b. A s the gravity level is reduced, convective heat transfer is diminished and boiling is enhanced. The increased bubble population acts to cause more complete mixing of the liquid bulk.
Lewis Research Center, National Aeronautics and Space Administration,
Cleveland, Ohio, June 21, 1967, 124-09-03-01-22.
REFERENCES
1. Clark, J. A . : A Review of Pressurization, Stratification, and Interfacial Phenomena. International Advances in Cryogenic Engineering. Vol. 10, Sect. M-U, K. D. Timmerhaus, ed., Plenum Press, 1965, pp. 259-283.
2. Petrash, Donald A . ; Nussle, Ralph C. ; and Otto, Edward W. : Effect of Contact Angle and Tank Geometry on the Configuration of the Liquid-Vapor Interface During Weightlessness. NASA TN D-2075, 1963.
3. Siegert, Clifford E. ; Petrash, Donald A. ; Otto, Edward W. : Behavior of Liquid- Vapor Interface of Cryogenic Liquids During Weightlessness. NASA TN D-2658, 1965.
4. Otto, E. W. : Static and Dynamic Behavior of the Liquid-Vapor Interface During Weightlessness. AiChE Chem. Eng. Progr. Symp. Ser., vol. 62, no. 61, 1966,
. pp. 158-177.
5. Nunamaker, Robert R. ; Corpas, Elias L. ; and McArdle, Jack G. : Weightlessness Experiments With Liquid Hydrogen in Aerobee Sounding Rockets; Uniform Radiant Heat Addition - Flight 3. NASA TM X-872, 1963.
6. Regetz, John D., Jr. ; Conroy, Martin J. ; and Jackson, Robert G. : Weightlessness Experiments With Liquid Hydrogen in Aerobee Sounding Rockets; Nonuniform Radiant Heat Addition - Flight 4. NASA TM X-873, 1964.
7. Aydelott, John C. ; Corpas, Elias L. ; and Gruber, Robert P. : Comparison of Pres- sure Rise in a Hydrogen Dewar for Homogeneous, Normal-Gravity Quiescent, and Zero-Gravity Conditions - Flight 7. NASA TM X-1006, 1964.
8. Aydelott, John C. ; Corpas, Elias L. ; and Gruber, Robert P. : Comparison of Pres- sure Rise in a Hydrogen Dewar For Homogeneous, Normal-Gravity Quiescent, and Zero-Gravity Conditions - Flight 9. NASA TM X-1052, 1965.
17
c
9. Abdalla, Kaleel L . ; Frysinger, Thomas C. ; and Andracchio, Clarles R. : Pressure- Rise Characteristics for a Liquid-Hydrogen Dewar For Homogeneous, Normal- Gravity Quiescent, and Zero-Gravity Tests.. NASA TM X-1134, 1965.
10. Aydelott, John C. : Normal Gravity Self-Pressurization of 9-Inch- (23-cm) Diameter Spherical Liquid Hydrogen Tankage. NASA TN D-4171, 1967.
18 NASA-Langley, 1967 - 12 E-3822

“The aeronautical and space actiuitier of the United States shall be conducted so as to contribute . . . to the expansion of human Knowl- edge of phenomena in the atmosphere and space. The Administration shall provide for the widest practicable and appropriate dissemination of information concerning its activities and the results thereof .”
-NATIONAL AERONAUTICS AND SPACE ACT OF 1958
NASA SCIENTIFIC AND TECHNICAL PUBLICATIONS
TECHNICAL REPORTS: Scientific and technical information Considered important, complete, and a lasting contribution to existing knowle&e.
TECHNICAL NOTES: Information less broad in scope but nevertheless of importance as a contribution to existing knowledge.
TECHNICAL MEMORANDUMS: Information receiving limited distribu- tion because of preliminary data, security classification, or other reasons.
CONTRACTOR REPORTS: Scientific and technical information generated under a NASA contract or grant and considered an important contribution to existing knowledge.
TECHNICAL TRANSLATIONS: Information published in a foreign language considered to merit NASA distribution in English.
SPECIAL PUBLICATIONS: Information derived from or of value to NASA activities. Publications include conference proceedings, monographs, data compilations, handbooks, sourcebooks, and special bibliographies.
TECHNOLOGY UTILIZATION PUBLICATIONS: Information on tech- nology used by NASA that may be of particular interest in commercial and other non-aerospace applications. Publications include Tech Briefs, Technology Utilization Reports and Notes, and Technology Surveys.
Derails on the availability of these publications moy be obtained from:
SCIENTIFIC AND TECHNICAL INFORMATION DIVISION
. NATIONAL AERONAUTICS AND SPACE ADMINISTRATION
Washingion, D.C. PO546