effect of grain size and moisture on the reflectance of … · keywords: ger-1500...
TRANSCRIPT

UNDERGRADUATE RESEARCH PROJECT
Submitted to:
Department of Geology
Submitted by:
Johanna N. García Rodríguez Department of Geology,
University of Puerto Rico, Mayagüez, Puerto Rico
Effect of Grain Size and Moisture on the Reflectance of Beach Sand
Principal Investigators: ________________________ Johanna N. García Rodríguez Fernando Gilbes, Ph.D. Undergraduate Student Professor of Environmental Department of Geology Remote Sensing Department of Geology

2
Abstract: A GER-1500 spectroradiometer was used to collect reflectance measurements in several laboratory experiments with sand from five beaches of the western part of Puerto Rico. Sand samples were analyzed with sieving and XRD to characterize the grain size and composition. A Thetaprobe ML2x sensor was used to take moisture measurements in the sand and evaluate changes in magnitude of the reflectance when the sand is dry or wet. Results indicate all studied aspects of sand, grain size, composition and humidity affect the magnitude of the reflectance. Higher magnitude correlates with fine grain size and carbonate composition material and lower magnitudes with bigger grain size and higher composition of dark minerals. The reflectance curves are reduced with high water content. The reflectance showed a major change in the curve between 700 to 800 nanometers that is present in all five beaches. Keywords: GER-1500 spectroradiometer, reflectance, sand, grain size, water content Introduction and Statement of the Problem: Several investigations have been performed in different beaches of the West and Southwest of Puerto Rico, but only have related the spectral signature to the characteristic of the sand. Cameron (2003) investigated the “Spectral Analyses and Sedimentation of the West Coast of Puerto Rico”. He correlated the reflectance from the GER 1500 spectroradiometer with the sediments characteristic such as grain size, sand composition and mineralogy along the west coast of Puerto Rico. Chiques (2005) performed another research titled “Spectral Characterization of Sandy Beaches in Western Portion of Puerto Rico”. She developed a database of the reflectance curves for several types of the sandy beaches in the west coast of Puerto Rico. She also determined how the texture and composition affect the shape and magnitude of the reflectance curve of beach sand. These two investigations have helped to understand the spectral response of beach sand and are providing important information for future application of satellite remote sensing to beach studies. The main objective of this project is to follow up the previous works of Cameron (2003) and Chiqes (2005) and perform specific experiments to better understand the effect of grain size and moisture over the reflectance curve. The remote sensing investigations in Puerto Rico coastlines it’s have been limited by low spatial resolution of the available images and lack of appropriate equipment for field validation. For this reason the study in beaches with remote sensing it’s difficult to realize. Remote sensing was used for mapping the changes in the coast line through time and with this results compared the changes and prevent possible environmental changes in coasts. The remote sensing it’s an important method to study the environment and how the environment changed with the past of the years.

3
Figure 1 Geologic Map of Puerto Rico
Geology of the Study Area: This research considered beaches from the southwest part of Puerto Rico (Figure 2), from Aguadilla (Crashboat) to Guanica (Tamarindo). The coastal areas in Puerto Rico show different sand composition and grain size. In 1978 Morelock described the beaches around Puerto Rico as fallow: West Coast The structural mountains dominated the coast from Aguadilla to Cabo Rojo, the coast are dominated by the effect of structural mountain ridges separated by broad alluvial valleys. The ridges from a rocky coast and sandy beaches occupy the shoreline bordering the alluvial valley (Morelock, 1978). Aguadilla – Crashboat beach is isolated bounded by rocky shoreline. The beach sediments are composed of approximately equal parts of carbonate shell material, quartz and light minerals, and igneous rock fragments. Mani – the dominant component is igneous rocks fragments with quartz, light minerals and some carbonates grain. Guanajibo – Mayaguez bay is composed of igneous fragments, magnetite, other dark mineral grains, and minor amounts of light minerals grains. Cabo Rojo – El Faro beach composed of carbonates and quartz has a unique circulation patterns in the bay Southwest Coast The limestone outcrops form a rocky coast with small local sand or gravel beaches. In many places, the growth of mangroves altered the coast (Morelock, 1978). Tamarindo – there is no evidence of communication and passage of sand from one beach to another. The calcium carbonates grains derived from erosion of the limestone cliffs compose these beaches (Morelock, 1978).

4
El Faro N
Figure 2: Study Area Literature Review: Cameron (2003) presented a spectral analysis and sedimentation of the west coast of Puerto Rico. In his research he used remote sensing techniques to correlate spectral measurements as the reflectance to the sediments characteristics such as grain size, sand composition and mineralogy along the west coast of Puerto Rico. The samples were taken in Punta Algarrobo, Punta Güanajibo, Punta Ensenada and Playa Azul. The sediments characteristics were tested using the sieving method, XRD and percentage of carbonates. The field data in this research indicates that reflectance intensity changes during variations of carbonate material. Chiques (2005) discussed the spectral characterization of sandy beaches in western portion of Puerto Rico. In her research she collected reflectance measurements in 15 sandy beaches using a field spectroradiometer. The samples in the beaches were analyzed in the laboratory to determine the composition of the sand sediments. The results indicated a change in magnitude in the reflectance curve compared with the composition. Higher magnitude correlated with more carbonate material concentration in the sand and lower magnitude correlate with higher concentration of dark mineral. The reflectance shows a change in the slope of the reflectance curve between 450 to 550 nanometers that is present in all 15 beaches. This literature review mentioned before is the most important in this research, because only these investigations are realized in the spectral analysis of sandy beaches in Puerto Rico.
Tamarindo
Guanajibo
Mani
Crashboat
5
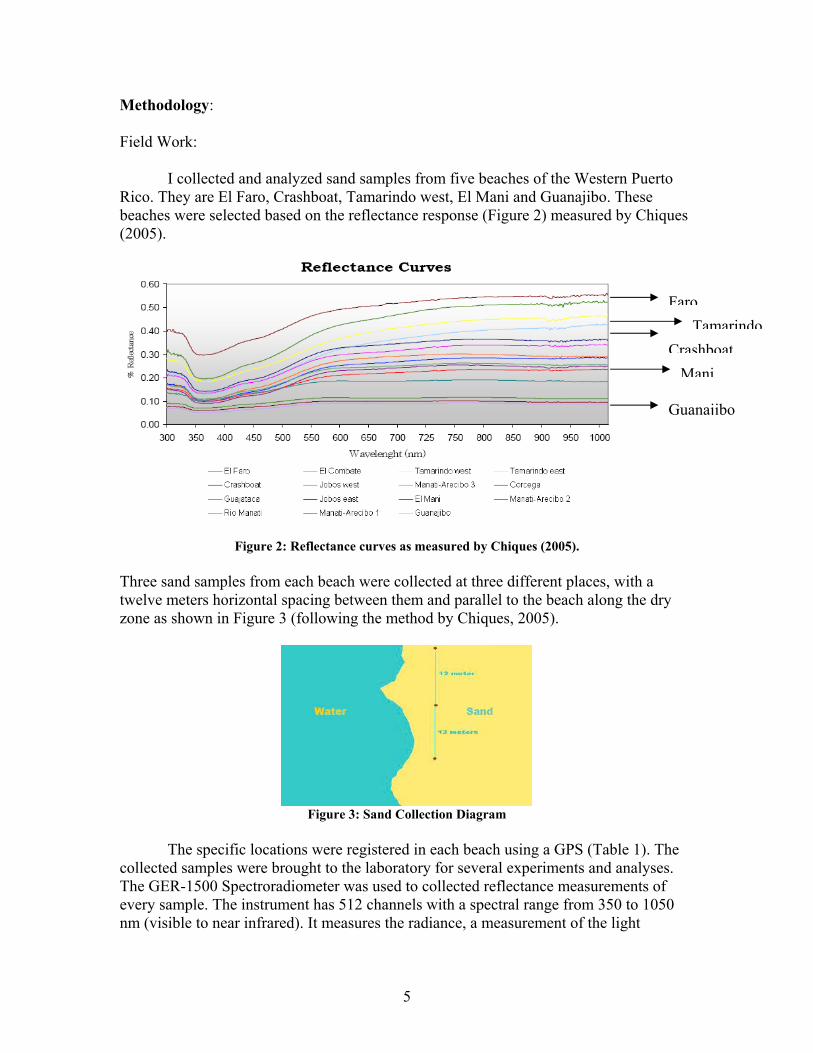
Methodology: Field Work: I collected and analyzed sand samples from five beaches of the Western Puerto Rico. They are El Faro, Crashboat, Tamarindo west, El Mani and Guanajibo. These beaches were selected based on the reflectance response (Figure 2) measured by Chiques (2005).
Figure 2: Reflectance curves as measured by Chiques (2005).
Three sand samples from each beach were collected at three different places, with a twelve meters horizontal spacing between them and parallel to the beach along the dry zone as shown in Figure 3 (following the method by Chiques, 2005).
Figure 3: Sand Collection Diagram
The specific locations were registered in each beach using a GPS (Table 1). The collected samples were brought to the laboratory for several experiments and analyses. The GER-1500 Spectroradiometer was used to collected reflectance measurements of every sample. The instrument has 512 channels with a spectral range from 350 to 1050 nm (visible to near infrared). It measures the radiance, a measurement of the light
Faro
Guanajibo
TamarindoCrashboat
Mani

6
reflected by the surface of the object. The equation used to convert from radiance to reflectance was:
( )
( ) 1002tan
% xdardsL
sandLR =
Where the standard used is a gray card that reflects 50% of the incoming light.
Table 1: Latitude and Longitude of Sand Sample Station
Beach Location Latitude Longitude Crashboat 18° 27’ 35.6 67° 09’ 54.4 El Mani 18° 14’ 52.1 67° 10’ 32.0
Guanajibo 18° 10’ 07.5 67° 10’ 48.4 El Faro 17° 56’ 06.8 67° 11’ 26.2
Tamarindo 17° 57’ 11.0 66° 50’ 53.0
The collected samples were analyzed using different laboratory techniques: Sieving and X-Ray diffractometer. The sieving analysis helped to determine the grain size distribution of the samples, and the X-Ray diffractometer helped to determine the principal minerals in the samples. Laboratory Work: To determine the grain size of the samples I used sediment sieving, a nest set of sieves placed from the size of the mesh progressively smaller down the stack (Figure 4). The grade scale most commonly used for sediments is the Wentworth (1922) scale which is a logarithmic scale in that each grade limit is twice al large as the next smaller grade limit (Folk, 1974). The sizes of the mesh in this study went from 1.0mm (0.0 Φ) coarse sand to .0625mm (4.0Φ) very fine sand. The mesh measures for this study are in table 2.
Figure 4: Nest set of sieves

7
Table 2: Wentworth grain size scale
X-Ray Diffractometer (XRD) was used to determinate the mineral composition in the sand sample. The sand was pulverized and placed in specific plates used for the instrument. Reflectance measurements were collected with the GER-1500 spectroradiometer from sand of different sizes from the 5 beaches. The different experiments realized are: Dry sand reflectance measurements:
• The sand samples are divided in grain size from 4.0Φ to 0.0Φ • Recollected reflectance measurements with a GER-1500 spectroradiometer to
each dry grain size sand samples (Figure 5)
Figure 5: Dry sand reflectance measurements Wet sand samples experiments
• Add 4.0ml of water to the grain size sand samples and collected reflectance measurements to each samples
• Add 8.0ml of water to the grain size sand samples of every beach and repeat the previous process (Figure 6)
Φ Mm 0.0 1.0 .50 .50 .75 .40 1.0 .35 1.5 .26 2.0 .180 2.5 .120 3.0 .09 4.0 .0625

8
Figure 6: wet sand with 4.0ml of water content
• Make sand moisture measurements with the Thetaprobe ML2x moisture sensor
(Figure 7)
Figure 7: Thetaprobe ML2x moisture sensor
• Take the 2.0Φ sand sample from El Faro beach, El Mani beach, Crashboat beach
and Guanajibo beach, because is the most representative size sample in all the beaches and realized the different measurements
• Wet the sand samples of every beach with a lot of water and take the moisture measurements with the Thetaprobe sensor (Figure 8)
• Take the reflectance measurements for each beach
Figure 8: Moisture measurements

9
Results: The sieve analyses were useful to characterize the distribution of grain size in the selected beaches. It also helped to measure the reflectance of different grain sizes of the sand. The distributions of the grain size are presented in Figure 9.
Figure 9: Distribution of Grain Size in 5 Beaches of Puerto Rico
Grain Size (Guanajibo)
0
5
10
15
20
25
30
35
0 0.5 0.75 1 1.5 2 2.5 3 4 panGrain Size (phi)
Wei
gth
% (g
)
Grain Size (Mani)
0
5
10
15
20
25
30
35
40
0 0.5 0.75 1 1.5 2 2.5 3 4 panGrain Size (phi)
Wei
ght %
(g)
Grain Size (Faro)
0
5
10
15
20
25
30
35
40
45
0 0.5 0.75 1 1.5 2 2.5 3 4 panGrain Size ( phi)
Wei
gth
(g)
Grain size (Crashboat)
0
5
10
15
20
25
30
35
40
45
0 0.5 0.75 1 1.5 2 2.5 3 4 panGrain Size (phi)
Wei
gth
% (g
)
Grain Size (Tamarindo)
0
5
10
15
20
25
30
35
40
45
50
0 0.5 0.75 1 1.5 2 2.5 3 4 panGrain Size (phi)
Wei
gth
% (g
)

10
Guanajibo beach showed a grain size distribution from 0.0Φ to 4.0Φ with a peak concentration at 2.0Φ (.180mm). In Mani beach the grain size distribution range from 0.0Φ to 4.0Φ with a peak concentration at 2.0Φ (.180mm). El Faro beach showed a range from 0.5Φ to 4.0Φ with a maximum in 2.0Φ (.180mm). Crashboat beach showed a grain size distribution from 0.0Φ to 3.0Φ with a peak in 1.0Φ (.35mm). Tamarindo beach showed a grain size distribution from 0.0Φ to 2.0Φ with a peak in 0.5Φ (.5mm). These analyses showed that in three of the five beaches the maximum grain size distribution range in 2.0Φ, one beach in 1.0Φ and the last one in 0.5Φ. The Chiques results are very similar with my results in every beach. The different that I note is because she used more sediments sieve in the analysis and this caused that the sediment divided and scatter more than in my experiments. The XRD analyses found Quartz, Albite and Calcite magnesian in four beaches Crashboat, Guanajibo, Faro and Mani beaches. The composition of Tamarindo beach is Aragonite and Calcite magnesium. Although the composition of the sand is basically the same in all five beaches, the sand is very different in color and easily to recognize. El Faro beach is lighter and the Guanajibo beach is very dark. Tamarindo, Crashboat and Mani are more similar but the Tamarindo have more carbonates than the other two. The composition of light minerals in the sand increases the reflectance curve and the composition of dark minerals decrease the reflectance curve in the sand (Chiques, 2005). When I compared this analysis with the Chiques analysis, obtained that the results are the same in both researches, because the minerals composition is the same in the 5 beaches. The reflectance curves for different grain seizes from the studied beaches are shown in Figure 10. The results showed significant changes in the curves due to the particle size and the mineral composition.
Grain Size Reflectance Curve (Faro)
0
10
20
30
40
50
60
70
400 500 600 700 800 900Wavelength
% R
efle
ctan
ce
4Φ3Φ2.5Φ2Φ1.5Φ1Φ.75Φ.5Φ
Grain SizeReflectance Curve (Guanajibo)
0
2
4
6
8
10
12
400 500 600 700 800 900Wavelength
% R
efle
ctan
ce
4Φ3Φ2.5Φ2Φ1.5Φ1Φ.75Φ.5Φ0Φ

11
Figure 10: Reflectance curves of Different Grain Size at Studied Beaches
The reflectance curves showed a high magnitude in the small grains in three of the five beaches: El Faro, Tamarindo and Guanajibo. The curve of the Guanajibo beach showed the highest reflectance in the 4.0Φ size and the lower in 0.0Φ and the major changed in the curve was in the infrared wavelength 700-800nm. El Faro beach showed the highest reflectance at 2.0Φ and the lower reflectance at 0.5Φ. Other beache that has a major reflectance in the small grains size was Tamarindo beach, the highest reflectance was at 3.0Φ and the lower was at 1.0Φ. Crashboat beach had its highest reflectance curve at 0.0Φ and the lower reflectance curve at 4.0Φ. El Mani beach had a high reflectance at 0.75Φ and the lower reflectance in the pan sample. However, in this beach these grain sizes don’t have a significant amount and the next curve with a major % was at 1.5Φ and the minor with a significance amount was 0.0Φ. The reflectance curves for dry sand of all beaches was also determined (Figure 11). These graphs showed the behavior in the curve at different grain size.
Grain Size Reflectance Curve (Mani)
0
5
10
15
20
25
30
400 500 600 700 800 900Wavelength
% R
efle
ctan
ce
pan4Φ3Φ2.5Φ2Φ1.5Φ1Φ.75Φ.5Φ0Φ
Grain Size Reflectance Curve (Crashboat)
0
10
20
30
40
50
60
400 500 600 700 800 900Wavelength
% R
efle
ctan
ce
4Φ3Φ2Φ1.5Φ1Φ.75Φ.5Φ0Φ
Grain Size Reflectance Curve (Guanica)
0
10
20
30
40
50
60
400 500 600 700 800 900Wavelength
% R
efle
ctan
ce
4Φ3Φ2.5Φ2Φ1.5Φ1Φ.75Φ.5Φ0Φ

12
Dry sand reflectance curve (4.0 phi)
0
10
20
30
40
50
60
400 500 600 700 800 900Wavelength
% R
efle
ctan
ce
Faro GuanajiboCrashboatGuanicaMani
Dry sand reflectance curve (3.0 phi)
0
10
20
30
40
50
60
400 500 600 700 800 900Wavelength
% R
efle
ctan
ce
FaroGuanajibo CrashboatGuanicaMani
Dry sand reflectance curve (2.5phi)
0
10
20
30
40
50
60
400 500 600 700 800 900Wavelength
% R
efle
catn
ce
Faro GuanajiboGuanicaMani
Dry sand reflectance curve (2phi)
0
10
20
30
40
50
60
70
400 500 600 700 800 900Wavelength
% R
efle
ctan
ce
Faro GuanajiboCrashboatGuanicaMani
Dry sand reflectance curve (1.5phi)
0
10
20
30
40
50
60
70
400 500 600 700 800 900Wavelength
% R
efle
ctan
ce
FaroGuanajiboCrashboatGuanicaMani
Dry sand reflectance curve (1.0phi)
0
10
20
30
40
50
60
400 500 600 700 800 900Wavelength
% R
efle
ctan
ce
FaroGuanajiboCrashboatGuanicaMani
Dry sand reflectance Curve (0.75phi)
0
10
20
30
40
50
60
400 500 600 700 800 900Wavelength
% R
efle
ctan
ce
FaroGuanajiboCrashboatGuanicaMani

13
Figure 11: Reflectance curves of dry sand for studied beaches at different grain size
The shape of the reflectance curves is similar for dry sand in all studied grain size. The curves showed a maximum magnitude in El Faro beach and less magnitude in the Guanajibo beach. These results corroborates that the reflectance of the sand is highly affected by its composition and color. However the grain size also contributes because small sizes have a maximum reflectance. El Faro beach have a great quantity of quartz and light minerals, while the Guanajibo beach have a great quantity of lithic fragments and dark minerals. The reflectance of sand with different water content was also determined for different grain sizes (Figures 12 and 13).
Dry sand reflectance curve (0.5phi)
0
10
20
30
40
50
60
400 500 600 700 800 900Wavelength
% R
efle
ctan
ce
FaroGuanajiboCrashboatGuanicaMani
Dry sand reflectance curve (0.0phi)
0
10
20
30
40
50
60
400 500 600 700 800 900Wavelength
% R
efle
ctan
ce
GuanajiboCrashboatGuanaicaMani
Humidity 4.0ml - (4.0 phi)
0
5
10
15
20
25
30
35
40
45
50
400 500 600 700 800 900Wavelength
% R
efle
ctan
ce FaroGuanajiboCrashboatMani
Water content 4.0ml - (3.0 phi)
0
5
10
15
20
25
30
35
40
45
50
400 500 600 700 800 900Wavelength
% R
efle
ctan
ce
FaroGuanajiboCrashboatMani

14
Water content 4.0ml - (2.5phi)
0
5
10
15
20
25
30
35
40
45
50
400 500 600 700 800 900Wavelength
% R
efle
ctan
ce
FaroGuanajiboMani
Water content 4.0ml - (2phi)
0
10
20
30
40
50
60
400 500 600 700 800 900Wavelength
% R
efle
ctan
ce
FaroGuanajiboCrashboatGuanicaMani
Water content 4.0ml - (1.5phi)
0
10
20
30
40
50
60
400 500 600 700 800 900Wavelength
% R
efle
ctan
ce
FaroGuanajiboCrashboatGuanicaMani
Water content 4.0ml - (1.0phi)
0
10
20
30
40
50
60
400 500 600 700 800 900Wavelength
% R
efle
ctan
ce
FaroGuanajiboCrashboatGuanicaMani
Water Content 4.0ml - (.75phi)
0
5
10
15
20
25
30
35
40
45
400 500 600 700 800 900Wavelength
% R
efle
ctan
ce
FaroGuanajiboCrashboatGuanicaMani
Water content 4.0ml - (0.5phi)
0
5
10
15
20
25
30
35
40
45
400 500 600 700 800 900Wavelength
% R
efle
ctan
ce
FaroGuanajiboCrashboatGuanicaMani

15
Figure 12: Reflectance curves of sand with a water content of 4.0 ml and different grain size
Sand with water content of 4.0 ml showed less magnitude in the reflectance curve than the others experiments, but the shape of the curve is very similar. When the grain size is 4.0Φ the magnitude is reduced and when the grain size is 0.5Φ the magnitude is increased in all the beaches. It was also found that the dry sand reflectance is higher than the wet sand (with 4.0 ml of water content). The shape of the reflectance curves with 8.0 ml of water content was similar to dry sand and wet sand with 4.0 ml of water content. El Faro beach showed the highest reflectance and the Guanajibo beach the lower reflectance. Although the reflectance in these conditions was less than in the other two. The result showed that the water content reduces the reflectance of the sand.
Water content 4.0ml - (0.0phi)
0
5
10
15
20
25
30
35
40
400 500 600 700 800 900Wavelength
% R
efle
ctan
ce
GuanajiboCrashboatGuanicaMani
Water content 8.0ml - (4phi)
0
5
10
15
20
25
30
35
40
45
400 500 600 700 800 900Wavelength
% R
efle
ctan
ce FaroGuanajiboMani
Water content 8.0ml - (3phi)
0
5
10
15
20
25
30
35
40
45
400 500 600 700 800 900Wavelength
% R
efle
ctan
ce
FaroGuanajiboCrashboatMani

16
Water content 8.0ml - (2.5phi)
0
5
10
15
20
25
30
35
40
45
50
400 500 600 700 800 900Wavelength
% R
efle
ctan
ce FaroGuanajiboMani
Water content 8.0ml (2.0phi)
0
10
20
30
40
50
60
400 500 600 700 800 900Wavelength
% R
efle
ctan
ce
FaroGuanajiboCrashboatGuanicaMani
Water content 8.0ml - (1.5phi)
0
10
20
30
40
50
60
400 500 600 700 800 900Wavelength
% R
efle
ctan
ce
FaroGuanajiboCrashboatGuanicaMani
Water content 8.0ml - (1.0phi)
0
5
10
15
20
25
30
35
40
45
50
400 500 600 700 800 900Wavelength
% R
efle
ctan
ce
FaroGuanajiboCrashboatGuanicaMani
Water content 8.0ml - (0.75phi)
0
5
10
15
20
25
30
35
40
45
400 500 600 700 800 900Wavelength
% R
efle
ctan
ce
FaroGuanajiboCrashboatGuanicaMani
Water content 8.0ml - (0.5phi)
0
5
10
15
20
25
30
35
40
45
400 500 600 700 800 900Wavelength
% R
efle
ctan
ce
FaroGuanajiboCrashboatGuanicaMani

17
Figure 13: Reflectance curves of sand with a water content of 8.0 ml and different grain size
A final experiments was performed with dry and wet sand and measuring the actual humidity with the Thetaprobe ML2x moisture sensor. The measured humidity is presented in Table 3.
Table 3: Per cent (%) humidity measured during the experiments of reflectance
Beach Dry Sand Wet Sand El Faro 1.2 33.4
Guanajibo 4.4 43.7 Crashboat 2.4 36.8
Mani 4.3 39.4 As found in the other experiments, this experiment demonstrated that the reflectance is higher when the sand is dry and lower when it is wet (Figure 14). These measurements were taken in 2.0Φ grain size for every beach. The highest reflectance curve was shown by El Mani beach with a 7% of reflectance when the sand is dry. The major change in the curves is for Guanajibo beach, this beach showed around 21% of reflectance when the sand was dry and 4% of reflectance when it was wet.
Water content 8.0ml - (0.0phi)
0
5
10
15
20
25
30
35
40
400 500 600 700 800 900Wavelength
% R
efle
ctan
ce
GuanajiboCrashboatGuanicaMani
Dry sand vs. Wet sand (Faro)
0
10
20
30
40
50
60
70
400 500 600 700 800 900Wavelength
% R
efle
ctan
ce
dry sand 1.2% vol humiditywet sand 33.4% vol
Dry sand vs. Wet sand (Guanajibo)
0
5
10
15
20
25
400 500 600 700 800 900Wavelength
% R
efle
ctan
ce
dry sand 4.4% volwet sand 43.7% vol

18
Figure 14: Reflectance for dry and wet sand with 2.0Φ grain size
Discussion and Interpretation: The collected data for the five beaches showed that the grain size and the composition affect the magnitude of the reflectance curves. In the visible region of the spectrum the finer material will have higher magnitude in the reflectance curve (Vincent, 1997). Decreasing the grain size will increase the number of mirrors of which the light reflects (Vincent, 1997); hence finer material will reflect more. This projects shows that those samples with fine grains and clear color have a high magnitude in the reflectance curve, and those with large grains and dark colors show a low magnitude in the curve. The performed experiments revealed that fine grains have a high reflectance magnitude than large sand material. It was also found that beaches with aragonite, quartz and calcite sand composition, like El Faro beach, have a high magnitude in the curve. Guanajibo beach has a lower magnitude because is composed of igneous material and the grain size is bigger than other beaches. The water content experiments show that the magnitude of the reflectance curve is affected by humidity in all the beaches. High water content produces a reduction in the magnitude of the curve. These results of water content showed that the grain sizes samples and the humidity in the sand samples does not have relation because de finer grains have the highest magnitude in the wet reflectance curves. The last experiments also showed that dry sand reflects more light than the wet sand. The composition of the sand is a very important factor for the magnitude of the reflectance curve. El Faro beach is composed by Quartz, Calcite, Aragonite and Calcite magnesium. All these minerals are good source to have a high magnitude in the reflectance curve, because the colors of this minerals is light and reflect more light tom the spectrum. Tamarindo beach showed the second higher magnitude in the reflectance curve and its sand composition is very similar to El Faro beach. The Tamarindo beach is composed by carbonate, aragonite and calcite material. Guanajibo beach showed the lower magnitude in the reflectance curve and it is composed by quartz, albite, hematite, calcite magnesium, magnesiofferite and a lot of dark material. The darks minerals have
Dry sand vs. Wet sand (Crashboat)
0
10
20
30
40
50
60
400 500 600 700 800 900Wavelength
% R
efle
ctan
ce
dry sand 2.4% volwet sand 36.8% vol
Dry sand vs. Wet sand (Mani)
0
5
10
15
20
25
400 500 600 700 800 900Wavelength
% R
efle
ctan
ce
dry sand 4.3% volwet sand 39.4% vol

19
the lowest reflectance magnitudes, this minerals reflects less light, according to the reflectance (Chiques, 2005). The results for El Mani and Crashboat beaches are different because they have finer grain size, while their minerals compositions are quartz, albite and calcite magnesium. These minerals reflect less light than the carbonates that composed the other studied beaches. The results in this several experiments are useful for the following investigations with remote sensing, because in the next works in this study area the people have an idea for the behavior of many beaches in the west coast of Puerto Rico and how they affected the collection of data with satellite images. Conclusion: This research showed that the grain size have an important effect in the magnitude of the reflectance curve of sandy beaches. The finer materials increase the magnitude of the reflectance curve and the larger materials reduce the magnitude. El Faro beach has a high magnitude in the reflectance curve because its sand is very fine and have a large amount of materials that reflect light. The Guanajibo beach has a lower magnitude in the reflectance curve because the sand particles are bigger than other and the igneous composition of the particles reduces the reflection of light. The results of this research also showed that the water content of the sand affects the magnitude of the reflectance curve. Beaches with high humidity in the sand will show lower magnitude in the reflectance curve. Future studies will have to analyze the effect of grain size and humidity in the spectral slope of these reflectance curves. References: Cameron, A., 2003, Spectral Analyses and Sedimentation of the West Coast Beaches of Puerto Rico: Mayaguez Campus, University of Puerto Rico, Department of Geology, Unpublished Undergraduate paper, 14p Chiques, G., 2005, Spectral Characterization of Sandy Beaches in Western Portion of Puerto Rico: Mayaguez Campus, University of Puerto Rico, Department of Geology, Unpublished Graduate paper, 65p Morelock, J., 2000, Coastal Morphology and the Shoreline of Puerto Rico webpage http://geology.uprm.edu/Morelock/GEOLOCN_/cstln.htm Vincent, R. K., 1997 Geological and Environmental Remote Sensing. Prentice Hall, Upper Saddler River, NJ, 357pp

20
Acknowledgments: I would like to thank to my advisor, Dr. Fernando Gilbes for answering all my question. I have to thank to the Marine Science graduate student Patric Reyes for helped in the collected of reflectance measurements to all the samples.

21
Appendix:

22

23

24

25

26