effect of geogrid reinforcement on railroad ballast ... proceedings/2013... · effect of geogrid...
TRANSCRIPT

1
Effect of Geogrid Reinforcement on Railroad Ballast Performance Evaluated
through Triaxial Testing and Discrete Element Modeling
Yu Qian1, Erol Tutumluer2, M. ASCE, Debakanta Mishra3 and Hasan Kazmee4
1Graduate Research Assistant, Department of Civil and Environmental Engineering, University of
Illinois at Urbana-Champaign, Urbana, IL, 61801, [email protected] 2Professor and Corresponding Author, Department of Civil and Environmental Engineering,
University of Illinois at Urbana-Champaign, Urbana, IL, 61801, 217-333-8637, [email protected] 3Post-Doctoral Research Associate, Department of Civil and Environmental Engineering, University of
Illinois at Urbana-Champaign, Urbana, IL, 61801, [email protected] 4Graduate Research Assistant, Department of Civil and Environmental Engineering, University of
Illinois at Urbana-Champaign, Urbana, IL, 61801, [email protected]
ABSTRACT: Geogrids have been found to effectively improve the performance of
unbound aggregate layers in transportation applications by providing confinement
and arresting movement through interlock between individual aggregate particles and
their apertures. Geogrid reinforcement offers an effective remedial measure when
railroad track structures are susceptible to track geometry defects resulting from
excessive movement and particle reorientation within the ballast layer. This paper
presents an ongoing research study at the University of Illinois aimed at quantifying
the effects of geogrid reinforcement on the shear strength and permanent deformation
behavior of railroad ballast. Geogrids with triangular, rectangular, and square
apertures were tested in the laboratory experiments. Cylindrical ballast specimens
were prepared and tested with geogrids placed at different heights within the
specimen using a large-scale triaxial apparatus. An imaging based Discrete Element
Method (DEM) modeling approach was developed to model triaxial test results and
investigate geogrid reinforcement mechanisms. With the capability to create actual
ballast aggregate particles as three-dimensional polyhedron elements having the same
particle size distributions and imaging quantified average shapes and angularities, the
DEM simulations were able to capture the ballast behavior with and without geogrid
reinforcement reasonably accurately.
INTRODUCTION
Geogrids are commonly used in railway track construction for ballast and sub-
ballast stabilization purposes. Due to the particulate nature of ballast particles,
geogrids can be placed within the ballast layer to improve strength and modulus
properties of ballast layer, limit lateral movement of ballast particles, and reduce
vertical settlement through effective geogrid-aggregate interlocking. What dictates
the geogrid location within a ballast/subballast layer in the field is often the depth
below which tamping arms or tines of ballast tamping equipment cannot reach during
routine railroad maintenance activities. However, the optimal location to install
geogrids in ballast layer has not been thoroughly studied.
Previous studies have already concluded biaxial geogrids, often with rectangular
or square apertures, to be quite effective for improving bearing capacity of the track

2
substructure through laboratory tests or numerical simulations (Bathurst and
Raymond 1987, Shin et al. 2002, Raymond and Ismail 2003, Indraratna et al. 2006,
Brown et al. 2007, Kwon and Penman 2009, Qian et al. 2011a). However, biaxial
geogrids only have high tensile strength properties mainly in two directions, machine
direction and cross-machine direction, which limits the benefit of reinforcement.
More recently, geogrids with triangular shaped apertures have also been developed
with the claims to provide more uniform reinforcement in all directions. An early
work on comparative modeling evaluation of the reinforcement benefits of geogrids
with rectangular and triangular geogrids was offered by Tutumluer et al. (2009a)
through discrete element modeling simulations of direct shear tests. Recent research
efforts have also focused on evaluating performance improvements of triangular
geogrid reinforced transportation systems (Qian et al. 2011b, Qian et al. 2013,).
This paper describes preliminary findings from an ongoing research study at the
University of Illinois focusing on triaxial testing of geogrid-reinforced ballast
specimens using a large scale triaxial test device and modeling the micromechanical
interlock behavior of geogrid-aggregate systems with the Discrete Element Method
(DEM). Ballast specimens reinforced with geogrids having triangular or square
apertures were tested under three different configurations to evaluate the
reinforcement benefits through improved stress-strain behavior and strength
properties. Ballast specimens reinforced by a single layer of geogrid at middle of the
specimen were tested to evaluate the reinforcement benefits through repeated loading
and permanent deformation tests. Unreinforced ballast specimens were also tested as
the control samples for the strength and permanent deformation evaluations. To
simulate the triaxial tests and investigate geogrid reinforcement mechanisms, a
numerical modeling approach based on the DEM was adopted with the capability to
create actual ballast aggregate particles as three-dimensional polyhedron elements
having the same particle size distributions and imaging quantified average shapes and
angularities. Both the triaxial strength tests and the DEM simulation results are
presented to evaluate the reinforcement benefits and mechanisms governing behavior
of the ballast specimens reinforced with different aperture geogrids.
TRIAXIAL TESTS OF BALLAST SPECIMENS
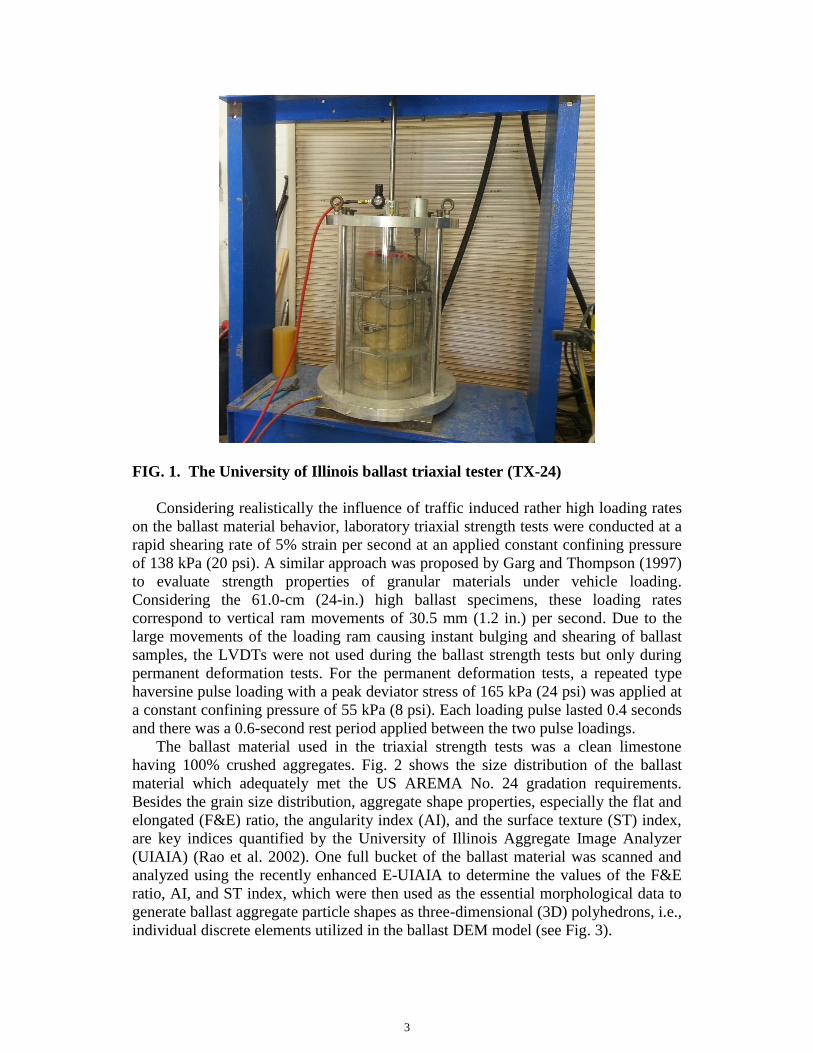
A large scale triaxial test device (The University of Illinois Ballast Triaxial Tester
or TX-24) was recently developed at the University of Illinois for testing specifically
ballast size aggregate materials. The test specimen dimensions are 30.5 cm (12 in.) in
diameter and 61.0 cm (24 in.) in height. An internal load cell (Honeywell Model 3174)
with a capacity of 89 kN (20 kips) is placed on top of the specimen top platen. Three
vertical LVDTs are placed around the cylindrical test specimen at 120-degree angles
between each other to measure the vertical deformations of the specimen from three
different side locations. Another LVDT is mounted on a circumferential chain
wrapped around the specimen at the mid-height to measure the radial deformation of
the test specimen. Fig. 1 shows a photo of the TX-24 setup having an instrumented
ballast specimen ready for testing.
3
FIG. 1. The University of Illinois ballast triaxial tester (TX-24)
Considering realistically the influence of traffic induced rather high loading rates
on the ballast material behavior, laboratory triaxial strength tests were conducted at a
rapid shearing rate of 5% strain per second at an applied constant confining pressure
of 138 kPa (20 psi). A similar approach was proposed by Garg and Thompson (1997)
to evaluate strength properties of granular materials under vehicle loading.
Considering the 61.0-cm (24-in.) high ballast specimens, these loading rates
correspond to vertical ram movements of 30.5 mm (1.2 in.) per second. Due to the
large movements of the loading ram causing instant bulging and shearing of ballast
samples, the LVDTs were not used during the ballast strength tests but only during
permanent deformation tests. For the permanent deformation tests, a repeated type
haversine pulse loading with a peak deviator stress of 165 kPa (24 psi) was applied at
a constant confining pressure of 55 kPa (8 psi). Each loading pulse lasted 0.4 seconds
and there was a 0.6-second rest period applied between the two pulse loadings.
The ballast material used in the triaxial strength tests was a clean limestone
having 100% crushed aggregates. Fig. 2 shows the size distribution of the ballast
material which adequately met the US AREMA No. 24 gradation requirements.
Besides the grain size distribution, aggregate shape properties, especially the flat and
elongated (F&E) ratio, the angularity index (AI), and the surface texture (ST) index,
are key indices quantified by the University of Illinois Aggregate Image Analyzer
(UIAIA) (Rao et al. 2002). One full bucket of the ballast material was scanned and
analyzed using the recently enhanced E-UIAIA to determine the values of the F&E
ratio, AI, and ST index, which were then used as the essential morphological data to
generate ballast aggregate particle shapes as three-dimensional (3D) polyhedrons, i.e.,
individual discrete elements utilized in the ballast DEM model (see Fig. 3).

4
FIG. 2. Particle size distribution of limestone ballast aggregate compared to U.S.
AREMA No. 24 specifications
FIG. 3. Conceptual approach for aggregate imaging based railroad ballast
particle generation for discrete element method (DEM) simulations
Approximately 68 to 73 kg (150 to 160 lbs) of ballast material was poured into an
aluminum split mold in several lifts, and compacted using a 27.2-kg (60-lb.) electric
jack hammer for approximately 16 seconds. The thickness of each lift and
corresponding compaction time were calculated to ensure uniform and even
compaction based on where geogrid was placed. After compaction of specimen to
desired depth, geogrid was placed into the test specimen. Fig. 4 shows the aluminum
split mold, geogrids used in this study with their locations marked in a prepared
0%
20%
40%
60%
80%
100%
10100
Cum
ula
tive
Per
centa
ge
Pas
sing
Sieve Size (mm)
Limestone
Ballast
Processed
through UIAIA
Ability to Quantify
Ballast Shape
• Flatness and Elongation
• Angularity Index
• Surface Texture Index
• Surface area
• Volume
3D Polyhedrons
used in DEM
Enhanced UIAIA
TOP
SIDE FRONT
Particle

5
specimen ready for test, and geogrids placed in the specimen. During the permanent
deformation test, only a single layer of geogrid was placed at the middle of the
specimen, which is also referred to as configuration (a). At the end of placing all lifts
and geogrid(s), each test specimen was checked for the total height and leveling of
the top plate. The void ratios (e) computed were consistently around 0.68. Although
placing two layers of geogrid within the ballast layer is not often practical and may
not be cost effective in the field, the two layers of geogrids installed in the test
specimens were intended to investigate in the laboratory the aggregate-geogrid
interlock mechanism and sample bulging behavior through DEM modeling. The
detailed properties of the geogrids used, ballast gradation and the average values of
the limestone ballast UIAIA shape indices are given in Table 1.
TABLE 1. Properties of Ballast Aggregate and Geogrids Used
Ballast Material (Limestone) Properties
Angularity Index
(AI) in degrees
Flat & Elongation
(F&E) Ratio
Surface Texture (ST)
Index Cu Cc
440 2.3 2 1.46 0.97
Geogrid Properties
Square Aperture Rectangular Aperture Triangular Aperture
Side Machine
Direction
X-Machine
Direction Longitudinal Diagonal
Aperture Dimensions (mm) 65 46 64 60 60
Ultimate QC Strength (kN/m) 30
Junction Efficiency (percentage) 93 93
Aperture Stability Modulus(m-N/deg) 0.58
Radial stiffness (kN/[email protected]% strain) 350
FIG. 4. Aluminum split mold, test specimen, and geogrids used in this study
61
.0 c
m
25
.4 c
m
15
.0 c
m
30
.5 c
m
Triangular aperture geogrid
Square aperture geogrid
Geogrid configurations:
a) One layer at middle
b) Two layers at 25.4 cm from each end
c) Two layers at 15.0 cm from each end
a
b
b
c
c

6
DEM SIMULATIONS OF THE TRIAXIAL TESTS
DEM model preparation
Discrete Element Method (DEM) is one of the most suitable numerical simulation
approach to simulate a granular system that consisting of discrete particle. The DEM
has already been successfully applied to simulate ballast behavior by using spherical
elements or element clusters to represent ballast particles (Indraratna et al. 2010, Lu
and McDowell 2010). The DEM simulation approach developed at the University of
Illinois adopts real polyhedral particles and has the capability to create actual ballast
aggregate particles as 3D polyhedron elements having the same particle size
distributions and imaging quantified average shapes and angularities. This DEM
approach was calibrated by the laboratory large scale direct shear test results for
ballast size aggregate application (Tutumluer et al. 2006), and has been successfully
utilized to simulate complex ballast behavior, such as: effects of multi-scale
aggregate morphological properties, gradation, and fouling. (Tutumluer et al. 2006,
2007, 2008, 2009b). A successful field validation study was also completed to
conclude that the DEM approach was quite adequate and reasonably accurate for
predicting actual ballast layer deformation behavior (Tutumluer et al. 2013).
FIG. 5. Flexible membrane shown on left to model one layer geogrid reinforced
triaxial ballast specimen established as a DEM simulation
Lee et al. (2012) recently used rigid rectangular cuboid discrete elements
positioned in a cylindrical arrangement to simulate a flexible membrane with
BLOKS3D DEM program. A similar approach was used in this study. A total of 96
rectangular cuboid discrete elements (in eight-layers) were used to form a cylindrical
chamber to confine the ballast specimen as shown in Fig. 5. Each layer had 12 equal
Membrane
Element
60.9
6 c
m
30.48 cm
Triangular Aperture
Geogrid
30.48 cm

7
sized elements and the dimension of each single element was 20.3 cm (8 in.) long,
10.2 cm (4 in.) wide, and 7.6 cm (3 in.) high. These membrane elements were only
allowed translational movement in radial direction. Rotation and translation
movement in other directions were restricted to replicate the deformation of the
specimen membrane. In order to simulate the membrane behavior without applying
extra confinement, the contact between membrane elements and the friction between
the membrane elements and the ballast particles in contact were both ignored. The
DEM simulations followed the same specimen preparation and loading steps of the
laboratory tests. Due to brevity, only the triangular aperture-geogrid reinforced ballast
tests simulated are presented in this paper.
LABORATORY TESTS AND DEM SIMULATION RESULTS
Fig. 6 presents the results of the large scale triaxial strength tests on the limestone
ballast cylindrical specimens for up to 10% axial strain. All the test specimens
showed similar stress-strain behavior at the initial small strain stage of the strength
tests and this was primarily due to the fact that geogrids were not yet fully mobilized
early on. When axial strain levels increased, the geogrid was mobilized and the
interlock between geogrid and aggregate particles prevented lateral movement or
specimen bulging. The zigzag shapes of the stress-strain curves at high axial strain
levels indicate sudden strength drops. This can be explained by damaged geogrid due
to observed broken ribs and/or particles reorienting themselves from the interlocked
positions. Immediately afterwards, the geogrid-reinforced ballast was back to fully
restrained condition again with new interlocks formed between aggregate particles
and the geogrid and accordingly, the strength of the specimen was restored upon
completion of the particle rearrangement. The DEM simulation results presented in
Fig.6 (a) showed good agreement with the observed trends in the experiments.
It is very interesting to note that both the triangular and the square aperture
geogrids present the same reinforcement configurations corresponding to the different
configurations of geogrids placed in the specimens. Two geogrid layers placed at 25.4
cm from bottom and top of the specimen, respectively, presented the best
performance from the experiments. However, no significant strength improvement
was observed when two layers of geogrids were placed at 15.0 cm from bottom and
top of the specimen, respectively. This confirmed that the reinforcement effect highly
depends on the position where geogrid is placed in the specimen during the triaxial
tests. Due to the interlock of the geogrid and aggregate particles, a local “stiffened or
reinforced” zone can form in the location where the geogrid is placed (Qian et al
2011a). During triaxial shearing, the most severe bulging took place in the mid-
specimen height for the unreinforced ballast sample. When the geogrid was placed in
the mid-specimen height, the reinforcement effect was quite significant especially at
large axial strain levels. However, if geogrid was placed too far away from the critical
location, i.e., the mid-specimen, the specimen could not be effectively reinforced.

8
(a) Strength tests and DEM simulation results with triangular aperture geogrid
(b) Strength tests and DEM simulation results with square aperture geogrid
FIG. 6. Laboratory triaxial ballast strength tests and DEM simulation results
0
100
200
300
400
500
600
700
800
900
0.0 2.0 4.0 6.0 8.0 10.0
Dev
iato
r S
tres
s (k
Pa)
Axial Strain (%)
Lab_Unreinforced
Lab_Triangular aperture geogrid-configuration (a)
Lab_Triangular aperture geogrid-configuration (b)
Lab_Triangular aperture geogrid-configuration (c)
DEM_Unreinforced
DEM_Triangular aperture geogrid-configuration (a)
DEM_Triangular aperture geogrid-configuration (b)
DEM_Triangular aperture geogrid-configuration (c)
0
100
200
300
400
500
600
700
800
900
0.0 2.0 4.0 6.0 8.0 10.0
Dev
iato
r S
tres
s (k
Pa)
Axial Strain (%)
Lab_Unreinforced
Lab_Square aperture geogrid--configuration (a)
Lab_Square aperture geogrid--configuration (b)
Lab_Square aperture geogrid--configuration (c)

9
Fig. 7 presents the preliminary results of the ballast permanent deformation tests
performed in the laboratory for up to 10,000 cycles. For the first several hundred
loading cycles, the vertical and circumferential permanent deformations increased
rapidly, which was primarily due to the initial rapid “shakedown” of the ballast
material. After around 1,000 loading cycles, the permanent deformation accumulated
much slower and became relatively stable, and so did the circumferential or
radial/horizontal deformations. All the unreinforced and geogrid reinforced test
specimens accumulated similar magnitudes of permanent deformation during the first
one hundred load cycles and this was primarily due to the fact that geogrids were not
yet fully mobilized at that time. With a single layer of geogrid placed in the middle
of the test specimen, the geogrid reinforced test specimens accumulated less
permanent deformation compared to the unreinforced case as the load cycles
increased. When the reinforced test specimens accumulated a certain amount of
deformation, the geogrid reinforcement effect was fully mobilized and the achieved
interlock between geogrid and aggregate particles prevented specimen further bulging.
This caused the specimen to stiffen and made it more resistant to deformation
accumulation upon loading. Triangular aperture geogrid reinforced test specimen
accumulated the smallest permanent deformation compared with the unreinforced as
well as the specimen with rectangular aperture geogrid. This indicates that the
triangular aperture geogrid better arrested aggregate movement with improved
interlocking in all horizontal directions which can be confirmed from circumferential
or radial/horizontal deformations, which happen to be of similar magnitude. Note that
the triangular aperture geogrid also has thicker ribs and much higher radial stiffness
when compared to the rectangular one.
(a) Specimen permanent deformation in axial (vertical) direction
0
1
2
3
4
5
6
7
0 2000 4000 6000 8000 10000
Per
man
ent
Def
orm
ati
on
(m
m)
No. of Cycles
Unreinforced
Rectangular aperture geogrid reinforced
Triangular aperture geogrid reinforced

10
(b) Circumferential deformation at middle
FIG. 7. Ballast permanent deformations from repeated load triaxial tests
Fig. 8 presents permanent deformation predictions as computed by the DEM
simulations for up to 100 load cycles. As the purpose of the DEM simulations was to
qualitatively investigate the relative performance of geogrids with different aperture
shapes, due to the long DEM run times associated with each loading case, the DEM
simulations for the permanent deformation predictions here considered only up to 100
cycles of the load application. Although the permanent deformations for the first
hundred load cycles were somewhat similar for the unreinforced and different
geogrid reinforced specimens during the laboratory testing (see Fig. 7), with better
control in compaction during specimen preparation in DEM simulations and the
significantly high number of aggregate particle contact forces computed and checked
for global granular assembly equilibrium at each iterative time step, a relatively low
number of initial load cycles, such as 100 achieved here for three different simulation
cases studied, was deemed to be sufficient for identifying the main reinforcement
mechanisms and interlocking trends also identified in the experiments. Clearly, with
DEM simulations of only up to 100 load cycles, the differences among the different
ballast triaxial tests were apparent. The geogrid reinforced ballast specimens similarly
yielded less permanent deformations compared to the unreinforced ballast specimen.
The rectangular aperture geogrid did provide considerable reinforcement, but the
triangular aperture geogrid with more uniform reinforcement in all horizontal
0
1
2
3
4
5
6
7
8
0 2000 4000 6000 8000 10000
Cir
cum
fere
nti
al
Def
orm
ati
on
at
Mid
dle
(m
m)
No. of Cycles
Unreinforced
Triangular aperture geogrid reinforced
Rectangular aperture geogrid reinforced

11
directions provided the most significant improvement as indicated in Fig. 8. These
results from DEM simulations agree well with the trends observed in the laboratory
experiments. It is interesting to note that the first five DEM simulation load cycles
also yielded similar magnitude deformations for all the unreinforced and geogrid
reinforced test specimens, which means the geogrids were not fully mobilized yet.
However, as the load cycles increased, the triangular aperture geogrid started to show
improvement at around the 8th loading cycle during the simulation, while, the
rectangular geogrid started to take effect at around the 16th loading cycle (see Fig. 8).
Again, the DEM simulations were intended to qualitatively compare the relative
performances of geogrids with different aperture shapes using the minimum
computational time. The intention has never been to match the predicted permanent
deformation rates or the magnitudes at the different load cycles with the experimental
results directly.
FIG. 8. DEM simulation results of permanent deformation tests
CONCLUSIONS
This paper focused on the shear strength and permanent deformation test results
of geogrid reinforced ballast specimens as obtained from a large scale triaxial test
device in the laboratory. Triangular, square, and rectangular aperture geogrids were
used for ballast reinforcement. Numerical simulation was performed with an imaging
based Discrete Element Method (DEM) modeling approach to demonstrate the
capability of studying geogrid-aggregate interlock reinforcement mechanism and the
0
2
4
6
8
10
12
0 20 40 60 80 100
Per
man
ent
Def
orm
ati
on
(m
m)
No. of Cycles
Simulation-Unreinforced
Simulation-Rectangular aperture geogrid reinforced
Simulation-Triangular aperture geogrid reinforced

12
optimal reinforcement location of cylindrical test specimens in order to maximize
strength properties. The following conclusions can be drawn from this study:
The location of geogrid placement in a uniform sized aggregate assembly, such as
railroad ballast, influences significantly the stress-strain behavior of cylindrical
test specimen through creating different local “stiffened zones” and therefore
reinforcement effects. Placing a single layer of geogrid at mid-specimen height,
or two layers of geogrid close to the middle of the specimen where bulging takes
place, provides better reinforcement benefits when compared to placing geogrid
towards top and bottom, i.e., away from the middle of the test specimen, during
triaxial strength testing. Both triangular aperture geogrid and square aperture
geogrid presented the same reinforcement effect during monotonic strength test
related to the different locations where geogrid was placed.
Both rectangular and triangular aperture geogrids were found to effectively
reduce the permanent deformation accumulations of ballast materials. Triangular
aperture geogrid with uniform resistance in all horizontal directions yielded the
lowest permanent deformation. More studies are needed to fully investigate
aperture shape effects on the overall geogrid reinforcement mechanism.
The aggregate imaging based DEM simulation platform developed at the
University of Illinois could model the stress-strain behavior of ballast specimens
under both monotonic and repeated load triaxial tests. The DEM simulation
successfully captured the stress-strain behavior and deformation trends of the
geogrid-reinforced ballast specimens by addressing adequately the initial
condition of the laboratory tests. The DEM simulation platform currently being
further developed has the potential for quantifying individual effects of various
geogrid properties, such as aperture shape and size and rib dimensions, on the
aggregate assembly.
REFERENCES
Bathurst, R. J. and Raymond, G. P., 1987. Geogrid Reinforcement of Ballasted Track.
Transportation Research Record. No. 1153: 8-14.
Brown, S. F., Kwan, J. and Thom, N. H., 2007. Identifying the Key Parameters that
Influence Geogrid Reinforcement of Railway Ballast. Geotextiles and
Geomembranes, 25(6):326-335.
Garg, N. and Thompson, M.R., 1997. Triaxial Characterization of Minnesota Road
Research Project Granular Materials. Journal of the Transportation Research
Board. No.1577:27-36.
Indraratna, B., Khabbaz, H., Salim, W. and Christie, D., 2006. Geotechnical
Properties of Ballast and the Role of Geosynthetics in Rail Track Stabilisation.
Journal of Ground Improvement, 10(3): 91-102.
Indraratna, B., Thakur, P.K., and Vinod, J.S., 2010. Experimental and Numerical
Study of Railway Ballast Behavior under Cyclic Loading. International Journal of
Geomechanics, ASCE, 10(4):136-144.

13
Lee, S. J., Hashash, Y.M.A., and Nezami E.G., 2012. Simulation of Triaxial
Compression Test with Polyhedral Discrete Elements. Computers and
Geotechnics, in press.
Lu, M. and McDowell, G.R., 2010. Discrete Element Modelling of Railway Ballast
under Monotonic and Cyclic Triaxial Loading. Geotechnique, 60(6):459-467.
Kwon, J. and Penman, J., 2009. The Use of Biaxial Geogrids for Enhancing the
Performance of Sub-Ballast and Ballast Layers—Previous Experience and
Research. 8th International Conference on Bearing Capacity of Roads, Railways
and Airfields. June 29-July 2, Champaign, Illinois, USA.
Qian, Y., Tutumluer, E., and Huang, H., 2011a. A Validated Discrete Element
Modeling Approach for Studying Geogrid-Aggregate Reinforcement Mechanisms.
Geo-Frontiers 2011, ASCE Geo-Institute, March 13-16, Dallas, Texas.
Qian, Y., Han, J., and Pokharel, S.K., and Parsons, R.L., 2011b. Stress Analysis on
Triangular Aperture Geogrid-Reinforced Bases over Weak Subgrade under Cyclic
Loading - An Experimental Study. Journal of the Transportation Research Board,
No. 2204, Low-Volume Roads, Vol. 2, Proceedings of the 10th International
Conference on Low-Volume Roads, July 24–27, Lake Buena Vista, Florida, USA,
83-91.
Qian, Y., Han, J., and Pokharel, S.K., and Parsons, R.L., 2012. Performance of
Triangular Aperture Geogrid-Reinforced Base Courses over Weak Subgrade
under Cyclic Loading. Journal of Materials in Civil Engineering, in press.
Rao, C., Tutumluer, E. and Kim, I.T., 2002. Quantification of Coarse Aggregate
Angularity Based on Image Analysis. Transportation Research Record. No. 1787,
193-201.
Raymond, G. and Ismail, I., 2003. The Effect of Geogrid Reinforcement on Unbound
Aggregates. Geotextiles and Geomembranes, 21(6): pp.355-380.
Tutumluer, E., Huang, H., Hashash, Y.M.A., and Ghaboussi, J., 2006. Aggregate
Shape Effects on Ballast Tamping and Railroad Track Lateral Stability. In
Proceedings of the AREMA Annual Conference, Louisville, Kentucky, USA,
September 17-20.
Tutumluer, E., Huang, H., Hashash, Y.M.A., and Ghaboussi, J., 2007. Discrete
Element Modeling of Railroad Ballast Settlement. In Proceedings of the AREMA
Annual Conference, Chicago, Illinois, September 9-12.
Tutumluer, E., Huang, H., Hashash, Y.M.A., and Ghaboussi, J., 2008. Laboratory
Characterization of Coal Dust Fouled Ballast Behavior. In Proceedings of the
AREMA Annual Conference, Salt Lake City, Utah, September 21-23.
Tutumluer, E, Huang, H., and Bian, X. 2009a. Research on the Behavior of Geogrids
in Stabilization Applications, Proc., Jubilee Symposium on Polymer Geogrid
Reinforcement, September 8, 2009, London, UK.
Tutumluer, E., Huang, H., Hashash, Y.M.A., and Ghaboussi, J., 2009b. AREMA
Gradations Affecting Ballast Performance Using Discrete Element Modeling
(DEM) Approach. In Proceedings of the AREMA Annual Conference, Chicago,
Illinois, September 20-23.
Tutumluer, E., Qian, Y., Hashash, Y.M.A., Ghaboussi, J., and David, D.D., 2011.
Field Validated Discrete Element Model for Railroad Ballast. In Proceedings of
the AREMA Annual Conference, Minneapolis, Minnesota, September 18-21.