effect of gas barrier imperfections on vitamin c
TRANSCRIPT

Master’s Thesis 2016 30 ECTS Faculty of Chemistry, Biotechnology and Food Science NMBU, Ås
Effect of gas barrier imperfections on Vitamin C deterioration in chilled orange juice stored in EVOH gable top cartons
Andreas Fredrik ThoresenFood Science


I
ACKNOWLEDGMENTS This thesis is the concluding project in a Master program in Food Science, with focus on
production and product development at NMBU, Department of Chemistry, Biotechnology and
Food Science. The thesis was written in collaboration with Elopak, Spikkestad.
I want to thank my supervisors, professor Marit Kvalvåg Pettersen at Nofima, André Dybvik
at Elopak and professor Hanne Larsen at Nofima. You always provided me with insight and
assistance when needed. Thank you for your guidance.
I want to direct my gratitude to the laboratory employees at Elopak in Spikkestad; Fernanda
Branco Shinagawa, Åse Nodland, Sara Lisboa, Elisabeth Olsen and Liv-Bente Strandos.
Also, Project Engineer Andreas Irgens. It has been a pleasure working alongside you for five
months, as you treated me like a colleague. You always had a moment for answering
questions or assisting me in resolving any challenges that appeared during my project.
Thank you to my friends and fellow students at NMBU, for making my time at the university
the best it could possibly be.
Ås, December 12. 2016
Andreas Fredrik Thoresen


III
ABSTRACT Gas barrier imperfections in gable top cartons can lead to oxygen from the ambience
permeating a carton, causing deterioration of vitamin C in fruit juices. Barrier imperfections
in relation to vitamin C in orange juice have not yet been investigated in any scientific paper.
Neither have imperfections in the gas barrier in Ethylene Vinyl Alcohol (EVOH)- or
aluminum barrier cartons in relation to oxygen Transfer Rate (OTR) been investigated in a
scientific paper.
In this thesis, gable top cartons with an EVOH or an aluminum gas barrier was
investigated to find the effect barrier imperfections had on deterioration of vitamin C in chill
stored orange juice. This project attempted to quantify and describe gas barrier imperfections
in the gas barrier in gable top cartons with available methods and investigate if there was a
relation to degradation of vitamin C in orange juice, and to develop a practical method for
measuring OTR of a gable top carton with perforations with the Ambient oxygen Ingress Rate
(AOIR)-method.
Perforations and barrier imperfections were generated in the gas barrier in gable top
cartons and the cartons filled with juice. During storage for 8 weeks, sampling investigated
headspace oxygen concentration, dissolved oxygen content in the juice and vitamin C
deterioration. Cartons were also tested with dye-testing and investigated in microscope to
describe gas barrier imperfections. Also, a practical method for measuring OTR of a gable top
carton with the AOIR-method was developed.
Aluminum barrier cartons retained more vitamin C than EVOH barrier cartons. Some,
but not all seal barrier imperfections affected vitamin C degradation in orange juice. Of the 7
different perforations generated in EVOH cartons, 4 did not have statistically different
vitamin C content than a reference without perforations, after 8 weeks.
Dissolved oxygen does not equalize in orange juice, as there was measured a higher
concentration in the top of the orange juice and less in the bottom, creating a gradient in the
juice. The area of color penetration from a dye test did not correlate with vitamin C content or
OTR. Neither did vitamin C deterioration correlate with OTR measured with AOIR. An
EVOH gable top carton does not have to be free of barrier imperfections to retain vitamin C
content in orange juice, as certain perforations did not cause greater deterioration of vitamin
C. Further work is needed to complete and validate the AOIR method for use in Cartons.

ACKNOWLEDGMENTS I
ABSTRACT III
1. INTRODUCTION 1
1.1 PURPOSE 1
1.2 GABLE-TOP CARTONS 2
1.3 GAS BARRIER IMPERFECTIONS 6
1.4 VITAMIN C IN ORANGE JUICE 7
1.5 AOIR 8
2. MATERIALS AND METHODS 9
2.1 CREATION OF SEAL IMPERFECTIONS 9
2.2 FILLING MACHINE SETTINGS 11
2.3 ORANGE JUICE 12
2.4 PROCESSING AND FILLING 12
2.5 INCUBATION 13
2.6 CARTON HEADSPACE OXYGEN CONCENTRATION 13
2.7 DISSOLVED OXYGEN CONTENT IN JUICE 14
2.8 VITAMIN C CONTENT IN JUICE 14
2.9 AOIR 15
2.9.1 VOLUME OF GABLE TOPS 16
2.9.2 GABLE TOP PREPARATION FOR AOIR 16
2.10 DYE FLUID TEST 17
2.11 MICROSCOPY 18
2.13 SENSORY ANALYSIS 18
2.12 STATISTICAL ANALYSIS 18
3. RESULTS 19
3.1 TEMPERATURE LOGGERS 19
3.2 HEADSPACE OXYGEN CONCENTRATION 20
3.3 DISSOLVED OXYGEN CONCENTRATION 22
3.3.1 Dissolved oxygen with and without mixing of juice in carton 24
3.4 VITAMIN C CONTENT 25
3.5 AOIR 27
3.5.1 Volume determination of gable tops 27
3.6 DYE TEST AREA 28

3.6.1 Correlation of vitamin C content and area of dye penetration 28
3.7 MICROSCOPY OF MANUAL MADE BARRIER IMPERFECTIONS 28
3.8 SENSORY ANALYSIS 29
3.9 BALANCED ANOVA 30
3.10 CORRELATION OF VITAMIN C-CONTENT, DISSOLVED OXYGEN CONTENT AND HEADSPACE
OXYGEN CONCENTRATION 31
4. DISCUSSION 33
4.1 VITAMIN C CONTENT IN ORANGE JUICE AT DAY 0 33
4.2 VITAMIN C DETERIORATION 33
4.3 HEADSPACE OXYGEN CONCENTRATION 35
4.4 DISSOLVED OXYGEN CONTENT 36
4.5 AOIR 37
4.5.1 Removal of board on gable tops 40
4.6 MICROSCOPY OF GAS BARRIER IMPERFECTIONS 41
4.7 JUICE FILLING BARRIER IMPERFECTIONS 42
5. CONCLUSION 42
6. SUGGESTIONS FOR FURTHER WORK 43
REFERENCES 45
APPENDIX I
ATTACHMENT 1: I
ATTACHMENT 2: VI
ATTACHMENT 3: IX
ATTACHMENT 4: XV
ATTACHMENT 5: XVI


1
1. INTRODUCTION 1.1 PURPOSE This thesis aimed to associate the results of the most used methods in the industry to evaluate
the quality of orange juice and the barrier integrity of gable top cartons, in addition to,
developing a practical method for measuring Oxygen Transfer Rate (OTR) of a gable top
carton using the Ambient Oxygen Ingress Rate (AOIR)-method.
This included investigating the effect of gas barrier imperfections on Vitamin C
content development, headspace oxygen development and dissolved oxygen development in
gable top cartons with an Ethylene Vinyl Alcohol (EVOH) and aluminum gas barrier filled
with orange juice and stored in a refrigerated environment.
Developing a procedure for using Ambient Oxygen Transfer Rate (AOIR)-method,
developed by Hanne Larsen and others in 2000 (Larsen et al. 2000), for measuring oxygen
transfer rate (OTR) in gable top cartons with barrier imperfections. Also, discuss if AOIR is a
suitable method for measuring OTR in gable top cartons with barrier imperfections.
Find if there is a correlation between carton headspace oxygen concentration,
dissolved oxygen content and vitamin C content. Find if there is a correlation between
vitamin C content in a carton or OTR measured with the AOIR-method and the current
destructive liquid test method using ethanol and blue dye. Find if there is a correlation
between vitamin C content in a carton and OTR measured with the AOIR-method.
The AOIR-method, headspace oxygen concentration measurement, dissolved oxygen
concentration measurement, the dye test method and microscopy were used to relate
properties of gas barrier damages to the deterioration of vitamin C in orange juice. Gas barrier
imperfections in gable top cartons can lead to oxygen from the ambience permeating a carton
and cause deterioration of vitamin C in orange juice. Barrier imperfections in relation to
vitamin C in orange juice has not yet been investigated in any scientific paper published.
Neither has imperfections in the gas barrier in EVOH- or aluminum barrier cartons in relation
to OTR been investigated in a scientific paper (Larsen, Liland 2013).
There is an extensive amount of knowledge about barrier imperfections in gable top
cartons in the R/D-departments at the packaging producers, but many of the effects has been
observed and not documented in a scientific paper. The hypothesis being that there is a
relation between character of gas barrier imperfections, headspace O2, dissolved O2, OTR,
dye-penetration area and vitamin C content. If a correlation could be found between the
values for each method and vitamin C content the methods for testing juice quality and carton

2
integrity could be further reassured. In the packaging industry, the financial and
environmental aspect of the package is a driver to utilize the least amount of material to
produce each package. This in turn makes the knowledge of the different package properties
under different conditions crucial.
Quality testing tools for gable top cartons used today in the industry are visual
inspections after dye testing or in a microscope. There is no documented knowledge if dye
penetration area on the board in a carton can be used as a tool to assess the severity of a
barrier imperfection. Dye testing is today used as a tool to identify if a barrier imperfection in
a gable top carton is present after filling. OxTran is used to test permeation in gable top
cartons today, but is limited to an OTR of 1.5 ml O2/package/day (Sara Lisboa, Elopak,
8.12.16). Developing AOIR as a usable method for gable top cartons with high OTR (>1.5 ml
O2/package/day) could be an opportunity to describe the permeation in a carton with
perforations, that perhaps does not affect vitamin C degradation. Vitamin C content
measurements in orange juice is used today as a tool to determine orange juice quality and can
reflect carton barrier quality. Although possible correlations between different quality testing
methods are not known.
1.2 GABLE-TOP CARTONS A gable top carton is built from two fundamental materials, wood fiber and polymers, which
can undergo multiple production steps and treatments from raw material to finished product.
The structure and strength is provided by a wood fiber board, commonly made from pine or
spruce, but also other wood fibers. (Eie 2007). Fiber board can be prepared by mechanical or
chemical processing of wood fiber, where mechanical processing can be assisted by steam or
small amounts of chemicals. Mechanical processing can create a higher amount of damaged
fibers and few free single fibers compared to a purely chemical process. Today the processing
is adjusted to fit the result to the needed capabilities of the board (Eie 2007).
Different polymers have gas permeability properties ranging from high to low, thus
the barrier and protective layers are chosen from different types of polymers, to achieve the
desired barrier capabilities (Siracusa 2012, Hussein et al. 2015). Several layers of polymer can
be included to provide the fiber board with protection from moisture and the product
protection from ambient gases. The manufacturing process, by applying stress to the material
can have an influence on the final permeability properties of a gable top carton, by causing
gas barrier imperfections (Del-Valle et al. 2004, Siracusa 2012).

3
The most common polymer in a gable top carton is polyethylene (PE). The main
purpose for using PE as a barrier in a gable top carton is as a liquid barrier and for sealing the
carton due to melting properties (Eie 2007). Polyethylene subsist of nonpolar high molecular
weight hydrocarbons, where the alignment of polymer chains relative to each other
(crystallinity), determines density and chemo-mechanical stability (Carraher 2005). Non-
polarity causes polyethylene to absorb almost no water but gases such as oxygen and carbon
dioxide can pass a PE gas barrier with little resistance du to molecular structure (Eie 2007).
EVOH is a copolymer of ethylene and vinyl alcohol. EVOH is a strong barrier to
oxygen that can be used as the gas barrier in a gable top carton. In a carton for storage of
liquids, An EVOH-barrier must be protected between layers of PE, since the high amount of
–OH-groups cause EVOH to interact with water. EVOH is a strong barrier against oxygen,
nitrogen, carbon dioxide and helium (Hussein et al. 2015).
An aluminum barrier carton is a construction similar to an EVOH-carton, but where
aluminum is used as the gas barrier. An aluminum barrier will have a low permeation, at a
hundredth of that measured in an EVOH barrier carton (correspondence with Elopak
employees).
The cartons used in the thesis was an EVOH-barrier carton and a carton with an
aluminum-gas barrier. The EVOH carton consisted of several layers with various purposes.
The outer layer of PE in a gable top carton is a protective layer for the board against moisture
as well as a surface for printing information. The board layer provides strength and stability
and defines the shape of the carton. The second layer of PE is the first layer on the inside of
the carton and ensures all crevasses in the board are filled and that the surface is even for
application of the remaining layers. The EVOH polymer layer is the gas barrier to prevent
oxygen from entering the package. The innermost PE layer is the main moisture barrier.
The “aluminum” cartons used are also a construction of multiple layers. Several layers
in the order of: PE, Aluminum, PE, board and PE, from the outside to the inside. In the
aluminum carton, the aluminum has the function as a gas barrier. (Eie 2007)
A gable top carton production process follows several steps that can all have an influx
on the properties of the final product. First the board is made from the pulp of pine, spruce or
other wood fibers. The flat board can either be naturally brown like the wooden fibers, and
provide natural sunlight protection, or it can be bleached. Bleaching of the board is when
performed strictly for changing the esthetics of the carton. Next, multiple layers of polymer
will be applied to both sides of the fiber board to provide the desired package properties. The
desired carton blank shape is cut from the board to make the flat blank, illustrated in Figure 1.

4
with names for relevant structural components. This first step also uses a press to add creasing
lines in the board to ease folding at later stages. The flat bank is then put through the first
heating process in a converter illustrated in Figure 2. to weld the 1. panel to the 5. panel of the
flat blank, either by heating with hot air or a gas flame.
Further production steps that may affect the blank structure will be carried out at the
juice manufacturer in a filling machine, illustrated in Figure 3, where top seal heating is the
most likely point of failure. Blanks will be inserted into a filling machine which will form, fill
and seal a carton with a closure.
Figure 1: Illustration of a gable top carton flat blank. Terms for relevant structural components are indicated.

5
Figure 2: Illustration of a converter line for gable top carton flat blanks. A feeder moves flat blanks to a pre-sealing section where ½ of outer board along the fifth panel is removed and remaining polymer is folded around itself. In the side sealing section the 1. panel and 5. panel is joined by heating of PE and application of pressure. The collator applies pressure to the edges of the blank for pre-folding, as to ease processing in filling machine.
The filling process can be separated in seven steps; 1. Folding the blank open by
applying pressure to the folded edges of the. 2. Fold the bottom edges to provide a flat bottom
and weld with heated air. 3. Apply the closure and seal the closure with heat generated by
ultrasonic vibration. 4. Flush the carton with hot hydrogen peroxide (H2O2) to disinfect the
carton. 5. Fill the carton with product. 6. Heat the top seal of the carton with hot air. 7. Fold
and seal the top of the gable on the carton with a water-cooled press. The full production
process submits the carton blank to stress and can under the unideal conditions provide a
carton that has damages in the barrier layers. Even under the right conditions, microscopic
holes can form in folds and welding areas. These and other perforations will from here on
now be referred to as barrier imperfections.
Figure 3: Illustration of processing steps for filling product in a filling machine for gable top cartons. Operating sections described.

6
1.3 GAS BARRIER IMPERFECTIONS
A perforation formed in the polymer layers in a carton during production or filling is
not desired as it can increase the amount of oxygen to permeate the package and thereby have
the potential to decrease the quality of the orange juice. Perforations in gable top cartons
usually occurs in one of two ways. Either in the crease lines caused by stress in the folding
process, or by over- or underuse of heat in one of the welding processes. Both can create
barrier imperfections that are highly irregular in shape and size that can be difficult to locate
on the board. The variance in size, shape and placement of barrier imperfections affect the
permeation of oxygen (Larsen & Liland, 2013, Allan-Wojtas et al. 2008). For explaining
differences in gas permeation in varying packages it is necessary to describe the
microstructure and geometric features of the barrier perforations in the material. (Larsen,
Liland, 2013, Disimile et al. 1998).
The most common tool in the industry to investigate carton integrity in a production
facility, is with the use of the dye-test method. A dye-test exposes the finished package to a
solvent with a coloring agent added to reveal possible perforations. A dye penetrant solution
is either poured into a part of a finished carton or applied to a carton surface. After contact
with dye penetrant for a minimum specified time the carton will be rinsed with water and the
inside and outside of the carton is inspected visually for dye spots on the board. If
perforations are discovered the carton could be further inspected in a microscope to attempt to
clarify the cause of the formation of the perforation.
In a production facility, the situation usually demands rapid responses if imperfections
appear. If perforations are caused by a filling machine, operating personnel can change filler
heater and mechanical settings until no dye spots are present in a specified selection of
cartons. Which machine settings to change and why are usually dependent on experience in
the operators of the filling machines (Own observations).
The irregularity of a barrier imperfection in a gable top carton can be caused by the
way the carton is constructed. In a carton with several layers of polymers with different
melting points the combination of physical stress can form barrier imperfections differently in
the layers and be extremely difficult to locate. Thus, the cause of and shape of a barrier
imperfection could also be difficult to determine (Larsen & Liland, 2013).

7
1.4 VITAMIN C IN ORANGE JUICE
Vitamin C is an essential nutrient and consumption is related to several health benefits
with lowering the risk of cancers, cardiovascular diseases and aging. Consumption of vitamin
C also prevents scurvy, a deadly disease caused by the lack of vitamin C in the diet. This is a
condition that is no longer common in the developed world, but can still be prevalent in third
world populations (Gabriel et al. 2015, Plaza et al. 2005). Vitamin C functions as an
antioxidant by directly scavenging singlet oxygen, hydrogen peroxide and hydroxyl radicals.
Women and men need 75 and 90 mg vitamin C each day, respectively, which is easily
consumed with a balanced western diet. A very common source of Vitamin C in the diet of an
average adult is fruit juices, with the most common being orange juice. A glass of orange
juice can, depending of Vitamin C-content, provide 30-80% of the recommended daily intake
(Klimczak et al. 2006).
With consumers relying on orange juice to cover their regular vitamin C intake it is
essential that the orange juice sold in stores, even close to the expiration date, contains as
much vitamin C as is claimed by the manufacturer of the product. The regulations concerning
the labelling of nutritional values of food in Norwegian markets are decided by the EU
commission of Health and Consumers Directorate. EU regulation 1169/2011, state that for
goods that contain more than 7,5% of the required daily intake of a nutritional compound in a
drinkable product, must label this information on the package. The regulation applying to
vitamin C states that the labelling must show never more than 35% under and 50% over and
the actual value in the product for the entire shelf life. Although an exception has been made
for vitamin C in drinkable products, where it is accepted to exceed the +50% limit. These
limits include measuring uncertainty. For example, regulation (EU) No 1169/2011 then
allows for a minimum level of 19,5 mg/100 ml orange juice during the entire shelf life if the
carton is branded with 30 mg/100 ml on the label. The regulation allows for rounding of the
values when measuring with two decimals (Regulation (EU) No 1169/2011).
Figure 4: Ascorbic acid (vitamin C) oxidation route in a liquid.

8
Oxygen from air incorporated into orange juice that occurs during preparation, filling
and transport are the reasons for vitamin C loss. In addition to dissolved oxygen in the orange
juice there is an amount of oxygen in the headspace of the carton, that contributes to vitamin
C deterioration over time. The pathway for degradation of vitamin C in the presence of
oxygen is illustrated in Figure 4. Dehydroascorbic acid (DHA) and diketugulonic acid (DKA)
are formed as products during oxidation of vitamin C in a liquid. DHA contributes to
antiascorbic activity, unlike DKA, resulting in the total antiascorbic activity in juice being a
combination of AA- and DHA-content. Where DHA contributes a share of ≈1-2% (Zerdin et
al. 2002) (Nagy 1980).
1.5 AOIR Transmission rate is the measurement of the quantity of gas that passes through a
material with a known area over a given time. The rate of gas flow is determined by
temperature and the gas concentration difference between the atmosphere and the headspace
in the package. In perforated packages tested in this study the total OTR will be the sum of
gas movement through perforations and the polymeric barriers.
The AOIR method (Larsen 2000) is based on measuring the O2 concentration in the
headspace of a package two times with a given interval and let the PermMate-system
calculate the OTR of the package based on measurement interval, time of measurements and
package volume. This method has been proven to work for packages with low permeability
(0.06 to 1.4 ml O2/pack/day), but no publications validate the method on packages with higher
OTR levels. AOIR as developed by Hanne Larsen and made available for use in the
PermMate-system made by PBI Dansensor was to be investigated as a possible method for
determining the OTR of gable top cartons. The AOIR method was chosen because of the
major limitations of the OxTran-system widely used today. OxTran has an upper sensitivity
limit of 5 ml O2/package/day per the user manual for Mocon OxTran 2/61. Although the
upper limit of detection for the OxTran has been measured to 1,5 ml O2/package/day in
laboratory tests at Elopak (Sara Lisboa, Elopak, 8.12.16), which is too low for a package with
perforations. The AOIR method also allows for testing samples at low temperatures, while
OxTran has a lower temperature limit of 20°C
(http://www.mocon.com/assets/documents/oxtran261.pdf/ 1.12.16). In 2000 the AOIR-
method was proven to work in comparison to OxTran with a repeatability of 2.6% for
packages with low permeability (Larsen 2000).

9
The transfer rates of different gases vary for perforated and non-perforated films. In
non-perforated films, CO2 will travel 2 to 8 times faster than O2 through the film (Allan-
Wojtas et al. 2008). Allan-Wojtas et al. (2008) also found that microperforations with a
diameter between 30 µm and 100 µm had a gas transfer rate directly proportional to the area
of the perforation under calm conditions. They also found that for >55 µm diameter of the
perforation the diffusion rate was no longer predictable due to convection.
Larsen and Liland (2013) found no increase in permeability in packages with 75-90 µm
diameter perforations when increasing temperature from 5°C to 23°C. While in packages with
no perforations the O2 permeability increased by a factor of 2.4.
The basis of OTR calculation in the AOIR-method is the following equation:
(1)
V is the volume of the package tested, , tf is the time of final gas concentration measurement
ti the time of the first gas concentration measurement, Cair the concentration of gas in the
ambient atmosphere, Cf is the concentration of gas in the package at the final measurement,
Ci is the concentration of gas in the package at the first measurement. Cair 0.21 O2 (Larsen &
Liland 2013).
The volume increase effect is caused by O2 permeating faster through a membrane
than N2 at a relation of 4:1. This will result in O2 entering a carton package faster than N2 can
permeate out of the package and increase the volume and/or pressure in the carton (Moyls
2004).
2. MATERIALS AND METHODS 2.1 CREATION OF SEAL IMPERFECTIONS
The irregularity of naturally formed damage to gas barriers complicated the task of
creating perforations with dimensions and properties that were comparable to perforations
formed in production. The perforations or barrier imperfections produced in the carton blanks
originated from two different methods.
1. Manually perforating the gas barrier of the carton from the inside with a thin needle
fixed with a butterfly-bolt in an in-house made cylinder. The length of the needle tip to
perforate the material could be adjusted by increments of 100 µm with separator rings on top
of a steel plate. Perforation tool pictured in Figure 5. When perforating gas barriers in the

10
cartons that were investigated in this thesis, three separator rings were used to get a theoretical
total penetration depth of 300 µm. This was to achieve a hole diameter of 100 µm, as the
needle was cylindrical. The needle was a common sewing needle. The 100 µm barrier
imperfections were only applied to EVOH cartons and 5 barrier imperfections were stamped
in each carton blank.
The 500 µm perforation were made with another tool made in-house at Elopak. A
metal rod with a marginally larger than 500 µm diameter had been drilled and hollowed out to
an inner diameter of 500 µm. The cylinder could then be used as a stamping tool to lift out the
material cut out in the center. Perforation tool pictured in Figure 5. 500 µm perforations were
created in EVOH-barrier and aluminum-barrier cartons.
Figure 5: Tools used to manually perforate gas barrier in EVOH- and aluminum-barrier gable top cartons. From the left steel plate with needle perforation depth adjustment rings, cylinder for holding needle, stamping tool for moving needle in the cylinder and tool for creating 500 µm perforations. Made in workshop at Elopak, Spikkestad. 2. The second method for producing barrier imperfections in the carton material was through
the use of too much or too little heat in the standard process for preparing a blank in the
Elopak blank factory or in the filling machine. In the process of creating a blank from the flat-
blank, as previously described, the 1. panel is welded to the 5. panel by heating the PE
polymer. This process was performed in a manually controlled converting machine and the
temperature was increased until barrier imperfections were visible along the 1. panel or the 5.
panel after a dye-test. Along the first panel the heat was adjusted until approximately 10
barrier imperfections appeared along the 1. panel above the top major horizontal crease line.
Then heat was adjusted further until a continuous row of barrier imperfections appeared along
the 1. panel. Lastly/finally the heater for the 5. panel welding was adjusted until

11
approximately 10 perforations appeared along the 5. panel above the top major horizontal
crease line. During filling the top-sealer heater was adjusted to over-heat until one or more
barrier imperfections appeared on the gable top seal area with a 10-minute dye test.
Furthermore, heat was lowered until a complete weld was not achieved and a dye-test
indicated imperfections in gas barrier under the gable top seal. These heating errors were all
created on EVOH-cartons. A complete overview of the cartons with barrier imperfections and
reference cartons with no imperfections are presented in Table 1.
Table 1: Sample numbering and gas barrier imperfections investigated in the thesis. EVOH- and aluminium-barrier cartons were 1 liter. Barrier imperfections along 1. and 5. panels as well as overheated and underheated gable tops were machine made. Perforations with diameter 100 µm and 500µm were manually made. Sample number Gas barrier Failures 1
EVOH Reference with no barrier imperfections.
2 EVOH
5 barrier imperfections, 100 µm.
3 EVOH
1 barrier imperfection, 500 µm.
4 EVOH
Barrier imperfections along the 1. panel.
5
EVOH
Continuous barrier imperfections along the 1. panel.
6 EVOH
Barrier imperfections along the 5. panel.
7 EVOH
Over-heated gable top.
8 EVOH
Under-heated gable top.
9 Aluminum
Reference with no barrier imperfections.
10 Aluminum
1 barrier imperfection, 500 µm.
2.2 FILLING MACHINE SETTINGS In the days leading up to filling of product in cartons, the filling machine, S-
PSF65UC, Shikoku, Japan was tested with carton blanks to be used in the experiment. Testing
was performed to find optimal temperature settings in filling machine for the references of the
different materials and the temperature for the over-heated and the under-heated gable tops in
the EVOH barrier cartons. The temperatures used are presented in Table 2.

12
Table 2: Carton top heater settings in filling machine for EVOH- and aluminum gas barrier cartons. Filler 1 is top sealer heater and filler 2 is top sealer pre-heater. Heater settings Temperature 1 Temperature 2
Reference EVOH 300°C 300°C
Under-heated gable top EVOH 270°C 220°C
Over-heated gable top EVOH 450°C 400°C
Aluminum 390°C 390°C
2.3 ORANGE JUICE The juice was prepared from concentrate packed and delivered by Medibel in Holland
and produced from of juice from Brazil. The specifications of the juice tested at Medibel are
specified in table in attachment 4.
2.4 PROCESSING AND FILLING Orange juice concentrate was thawed for four days in a refrigerated room at 8°C. The
concentrate was then pumped into a mixing tank and diluted with cold water until a final
sugar content of 11.3 °Bx. At this point the total volume was 1350 liters made from 250 kg of
concentrate. The mixed juice was pasteurized in a tubular heat exchanger at 93°C for 30
seconds. Filling was performed at 13-17°C. The density was measured to 1041g/1000 ml.
Each series of 60 cartons were filled in runs of 10 cartons and placed manually on a rolling
container. Filling order and filler settings are presented in table 3. A separate automatic
printer (Domino A300, Domino Amjet inc., Illinois, USA) was placed after the filling
machine and programmed to mark all cartons with a sample number. Filling order instruction
used by filling machine operator presented in Table 3.
Table3: Filling order and filler temperature settings for all EVOH- and aluminum-barrier cartons used on day of filling by operating personnel.
Order Carton Comments Amount H 1 H 2 1 EVOH Reference 60 300°C 300°C 2 EVOH 5 x 100 µm 60 300°C 300°C 3 EVOH 1 X 500 µm 60 300°C 300°C 4 EVOH Perforations 1. panel 60 300°C 300°C 5 EVOH Continuous 1. panel 60 300°C 300°C 6 EVOH Perforations 5. panel 60 300°C 300°C 7 EVOH Under-heated top 60 270°C 220°C 8 Aluminum Reference 60 390°C 390°C 9 EVOH Over-heated top 60 450°C 400°C 10 Aluminum 1 x 500 µm 60 390°C 390°C
13
2.5 INCUBATION Immediately after filling, cartons were placed in a dark refrigerated room set to 8°C in
standard rolling containers. A temperature logger (Testo 176 T4, Testo, Germany) was placed
with the samples as well as two temperature loggers (Steril Disk Probe, Technosoft, Italy)
placed inside the product in two separate cartons in separate locations in the storage room.
Temperature loggers were set at a 15-minute recording interval.
Samples were taken out for testing six times during storage. At 28.09.16, 05.10.16,
21.10.16, 02.11.16, 16.11.16 and 30.11.16. At the dates of outtake dissolved oxygen content,
headspace oxygen concentration in carton and Vitamin C content in the juice was tested.
AOIR preparation and dye-test of gable tops was performed the days following.
2.6 CARTON HEADSPACE OXYGEN CONCENTRATION Headspace oxygen concentration (%) was analyzed at Elopak according to Elopak
Company Method ECM10201 Headspace gas analysis of CO2 and O2 using a Micro Gas
Chromatograph, with some modifications (Attachment 2 in appendix).
The oxygen concentration in the headspace was analyzed with a CheckMate II O2 and
CO2 analyzer built by PBI-Dansensor A/S in Ringsted, Denmark. The CheckMate II
instrument has a zirconia-based O2-sensor and a Non-Dispersive Infrared CO2 sensor. The
process was adapted to each carton series, depending of the type of error on the carton gable-
top. In sample series 1, 4, 5, 6, 7, 8, 9 and 10 the board was removed on the first panel, above
the top major horizontal crease line. In series 2 and 3 with manual made barrier imperfections
on the first panel the septum was placed on the cap and later fixed with epoxy glue.
Aluminum-barrier cartons used where of the traditional variety with no screw-top closure,
which allowed for removal of board on the gable top without interfering with perforations.
Board removal procedure is described in chapter 2.9.2. After attachment of septum on either
EVOH-barrier or aluminum-barrier after board removal or on the cap, a syringe needle with
0,8 mm diameter was inserted through the septum and the PermMate software was used to
read O2 level with the CheckMate II.
The zirconia sensor in the CheckMate II system, for measuring O2 concentration, can
measure with a resolution of 0,1% in the range above 10% with an absolute accuracy of ±1%
relative in the range over 1% (Larsen, 2000).
14
2.7 DISSOLVED OXYGEN CONTENT IN JUICE The dissolved oxygen content was analyzed at Elopak per Elopak Company Method
ECM10209 Dissolved oxygen analysis in water and fruit juices by using a Micro O2 Logger,
with some modifications to the process (Attachment in 1 appendix).
After headspace oxygen was measured and logged the gable top was cut
approximately 5 mm under the upper horizontal creasing line from the first panel and around
the carton. Cutting was performed with a sharp snap-off blade kept in water when not in use
to prevent buildup of orange juice and corrosion to dull the blade. The Mettler Toledo Seven
Go Pro SG9 (Schwerzenbach, Switzerland) was calibrated with deionized water and placed
immediately in the juice carton after cutting. The sensor was placed approximately 7 cm
under the juice surface. The sensor was moved to a new sample as soon as the previous
reading was done. The results were noted by operator.
At week 8, all samples were tested two times. One measurement performed as
described, with no mixing of the juice. In addition, one measurement was performed after
carefully mixing the juice with a glass rod until all sediment from the bottom of the juice was
distributed evenly.
2.8 VITAMIN C CONTENT IN JUICE The content of vitamin C was analyzed at Elopak per Elopak Company Method
ECM10212 Vitamin C in juices (2,6-dichlorophenol-indophenol titrimetric method
(Attachment 2. in appendix). The method is based on Vitamin C reducing oxidation-reduction
indicator dye, 2,6-diclorphenol-indophenol, to a colorless solution. At the endpoint, the excess
unreduced dye was rose pink in an acid solution.
The equipment used for titration was:
- 716 DMS Titrino, Methrom, Herisau Switzerland.
- 730 sample changer, with 15 slots, Methrom, Herisau Switzerland.
- A redox electrode, Methrom, 6.0451.100, Herisau Switzerland.
- Tiamo 2.5 software for Windows, Methrom, Herisau Switzerland.
- PH meter, PHM92, Radiometer, Copenhagen, Denmark
- Balance, Mettler Toledo, AX105, DeltaRange, Schwerzenbach, Switzerland.
- Magnetic stirrer with heater.
- 8 liters HPO3 and potassium hydroxide buffer at pH 3,5-4, Merck, Germany.

15
- 2,6-dichlorphenolindophenol Na-salt dihydrate standard solution, Merck, Germany.
- 50 mg/100 ml solution of ascorbic acid in buffer.
The juice sample was titrated in the presence of meta-phosphoric acid solution to
prevent auto-oxidation of the ascorbic acid at high pH. One day before vitamin C analysis, 8
liters of buffer solution and 500 ml Indophenol standard solution was prepared. This
modification to the process was chosen to conserve time, as to be able to perform vitamin C
analysis for up to 50 samples in one day. On the day of testing the juice was transferred to a
1000 ml beaker for mixing the content of the carton thoroughly to measure a correct average
of the vitamin C content in the orange juice for the entire carton. This was not done at week 1
and 2. 10 ml sample was transferred to a 150 ml beaker with a 10 ml full pipette.
Immediately, 120 ml of buffer was added to prevent oxidation in the sample.
When the standard solution was made the day before analysis the flask was kept
wrapped in aluminum foil to avoid light exposure. Vitamin C standard solution was made the
same day as the analysis. Testing was performed in accordance with standard procedure in the
Tiamo software. Tiamo 2.5 software calculated the vitamin C content automatically and
stored the data. Mg ascorbic acid/ 100 ml juice = T * EP1 *10, where T = factor from
standardization and EP1 = ml indophenol standard solution used.
A test was performed at week 4 to investigate if there was a difference in vitamin C
content in the bottom and the top of the juice in one carton. One sample was taken from the
bottom of a carton, one from the top and one after mixing the juice. The results, described in
chapter 3.3, prompted a decision to retest all samples at outtake week 4. This caused a two
day delay of testing at week 4.
2.9 AOIR The AOIR solution from PBI Dansensor is comprised of a CheckMate II system
combined with a PermMate (PBI-Dansensor, Ringsted, Denmark) system combined with the
PermMate 2.0 software (PBI-Dansensor, Ringsted, Denmark) on Windows XP. The method
utilized flushing of the package with Nitrogen and measure change in oxygen concentrations
over time to calculate OTR. Precut gable tops were fixed to a metal foil with epoxy glue. The
metal foil was taped to steel plates too keep the foil flat and prevent the glue from becoming
unfastened. Epoxy glue was applied to the edge of the board to prevent gas seepage through
the carton fiber raw edge. The foil had previously been measured to have an oxygen
transmission rate below 0,05 ml/pack/day, with an OxTran-system at Elopak (Sara Lisboa,
16
Elopak, 15.11.16). Instructions in the PermMate 2.0 software were followed and the gable
tops flushed to a concentration 5% O2. The gable tops were set in a refrigerator at 8°C for the
duration of storage. Calculation of OTR with the AOIR-method demanded measuring oxygen
concentration two times, with a minimum increase in oxygen concentration in the package to
ensure accuracy. Minimum oxygen concentration increase in a package between
measurements described in Table 4.
Table 4: Minimum increase in oxygen concentration in a package between measurements for use of the AOIR-method with PermMate II, described in PBI-Dansensor manual.
OTR Minimum increase
Low OTR: <0.01 ml O2/pack/day >0.05%
Medium OTR: 0.01-0.1 ml O2/pack/day >0.03%
High OTR: >0.1 ml O2/pack/day >0.1%
2.9.1 VOLUME OF GABLE TOPS The AOIR-method demands that the volume (ml) of packages for testing are known.
The gable tops were cut manually of the carton with a break-of knife and therefore subject to
some variation in volume. It was decided to determine the volume of a selection of gable tops
and in further investigations use the average volume in the calculations of the OTR. Volumes
were determined with the PermMate-system.
2.9.2 GABLE TOP PREPARATION FOR AOIR In gable tops from series 1, 4, 5, 6, 7, 8, 9 and 10 a portion of the outer board and PE
was removed to place septum directly in the gas barrier, as shown in Figure 6. Septum
placement on the closure was used as an alternative placement option in gable tops from
cartons in series 2 and 3. Board and PE removal was accomplished by cutting a square in the
outer PE-layer with a sharp blade and tearing of the PE, adding water to the exposed board to
soften fiber and scraping the board until all fiber was removed. The gas barrier of the carton
would be preserved as the EVOH barrier was protected against the water with a layer of PE.

17
Figure 6: Exposure of EVOH gas barrier after removal of outer PE and board layer on gable top carton for allowing septum placement directly on gas barrier. 2.10 DYE FLUID TEST
After completion of AOIR measurements the gable tops were removed from the foil.
The gable tops were placed upside-down on a rack and filled to approximately 50% of total
volume with an ethanol solution with E131 Patentblue. After 10 minutes the gable tops were
rinsed with water and inspected for dye spots on the inside and the outside. The area (mm2) of
individual dye spots was measured and logged. Images of representative dye spots for each of
the generated barrier imperfections are presented in figure 7.
Figure 7: A representation of dye spot penetration in gable top cartons with EVOH and aluminum gas barrier perforations tested in samples 2, 3, 4, 5, 6, 7, 8 and 10, from top left to bottom right.

18
2.11 MICROSCOPY The parts of the board with manual made perforations were cut out from the gable top, the
board layers were separated and submerged in regular soap for 30 minutes. The board and
polymer was then placed in 60% NaOH for 30 minutes to dissolve the board. The samples
were rinsed and dried before perforations were photographed in a Nikon SMZ 1270 stereo
microscope (Nikon, Japan).
2.13 SENSORY ANALYSIS A sensory analysis was performed at week 8 to test if a panel was able to detect a difference
in taste or smell in samples with a low and high degree of vitamin C deterioration in orange
juice. Two triangle tests were set up with a 10-person panel. Samples were tested under red
light to prevent panel inspecting color. Samples were presented with 3-digit sample codes and
were randomized in presentation order. As test 1. was completed the panelist was served test
2. Samples were served at 12°C. Previous tests at Elopak experienced a limit of detection of
difference in a triangle test, at a vitamin C content difference of 10 mg/100 ml (Liv Bente
Strandos, Elopak, 5.10.16).
1. Sample 9 (Aluminum reference) (x 2) and sample 4 (x 1) (barrier imperfections along the 1.
panel).
2. Sample 1 (EVOH reference) (x 2) and sample 4 (x 1) (barrier imperfections along the 1.
panel).
2.12 STATISTICAL ANALYSIS The software used for statistical analysis was MINITAB 7 provided by NMBU, Ås.
A) A Tukey test for statistical difference was performed for headspace oxygen concentration,
dissolved oxygen concentration and vitamin C content. The test provided letters, where
samples described with the same letter were not significantly different.
B) A balanced ANOVA was conducted to examine the effect of responses and main effects
BI (Barrier Imperfection), WN (Storage time) and interaction BI*WN in EVOH cartons with
barrier imperfections.
C) A balanced ANOVA test was performed for the effect of responses and main effects BI
(Barrier Imperfection), WN (Storage time) and interaction BI*WN in EVOH an aluminum
barrier cartons with no perforations

19
D) A balanced ANOVA test was performed for the effect of responses and main effects BI
(Barrier Imperfection), WN (Storage time) and interaction BI*WN in EVOH an aluminum
barrier cartons with 500 µm perforations.
C) An analysis of correlation was performed for all samples to reveal possible correlation
between Vitamin C/Headspace O2, Vitamin C/Dissolved O2, and dissolved O2/Headspace O2.
D) Correlation tests were performed for dissolved oxygen content in orange juice measured
with and without mixing and vitamin C content in orange juice at week 8.
C) An analysis of correlation was performed for revealing possible correlation between dye
test area (mm2) and AOIR, dye test area (mm2) and vitamin C content as well as AOIR and
vitamin C content.
E) A Tukey test for statistical difference was performed for AOIR measurements. The test
provided letters, where samples described with the same letter were not significantly different.
3. RESULTS 3.1 TEMPERATURE LOGGERS Table 5: Temperature averages with standard deviations for temperature loggers in cooling room and logger 1 and 2 in products. 8 weeks of storage, measurement every 15. minute.
Placement of logger Average temperature with SD
Cooling chamber 7,78 ± 0,64°C
Product 8,25 ± 0,28°C
Product 7,52 ±0,31°C
Temperature recorded in the cooling chamber, presented in Table 5, was close to the 8°C set
temperature at 7,78 ± 0,64°C. Temperature recorded in product 1 and 2 had a difference of
0,73°C at 8,25 ± 0,28°C and 7,52 ± 0,31°C.

20
3.2 HEADSPACE OXYGEN CONCENTRATION
Figure 8: Headspace oxygen concentration development in gable top cartons with and without barrier imperfections over the duration of 8 weeks. Each parallel represents an average of 5 cartons tested. Development in gable top headspace oxygen concentration is presented in Figure 8, showing
a reduction in sample 1, 8 and 9. All other samples retained a concentration of oxygen over
18% in the gable top, except for sample 10 at week 2 and sample 2 at week 6. Table 6
contains numeric values for oxygen concentration measured over 8 weeks, with standard
deviation. Letters in Table 6 represents statistical significant difference (Tukey test, CI =
95%), where samples presented with the same letter are not different.
6
7
8
9
10
11
12
13
14
15
16
17
18
19
20
0 1 2 3 4 5 6 7 8
%O2
WEEKS
#1 #2 #3 #4 #5 #6 #7 #8 #9 #10

21
Table 6: Headspace oxygen concentration in gable top cartons with and without barrier
imperfections, with standard deviation. Samples tested over 8 weeks, each value represents an
average of 5 cartons tested. Letters represent statistical significant difference tested with a
Tukey-test at 95% significance. Samples presented with the same letter are not different
Sample Start Week 1 Week 2 Week 4 Week 6 Week 8
#1 17,93±0,21
18,42±0,44
B
16,22±1,07
BC
11,91±0,95
C
11,58±0,94
C
8,70±0,67
C
#2 17,93±0,21
19,66±0,06
A
18,84±1,27
AB
19,03±0,30
A
17,60±3,80
AB
18,22±3,53
A
#3 17,93±0,21
18,84±1,27
AB
19,72±0,04
A
19,51±0,04
A
19,64±0,04
A
19,92±0,03
A
#4 17,93±0,21
19,10±0,82
AB
19,35±0,24
AB
19,38±0,47
A
19,27±0,20
A
19,48±0,41
A
#5 17,93±0,21
19,56±0,29
AB
18,78±1,46
AB
19,18±0,32
A
19,37±0,21
A
19,54±0,27
A
#6 17,93±0,21
19,66±0,09
A
18,60±1,53
AB
19,37±0,14
A
18,78±0,39
A
18,38±1,56
A
#7 17,93±0,21
19,52±0,27
AB
18,62±0,86
AB
18,32±1,34
AB
18,46±1,73
A
19,24±0,43
A
#8 17,93±0,21
18,58±0,23
AB
17,04±0,52
AB
17,09±0,91
B
14,77±0,63
B
12,78±1,32
B
#9 17,93±0,21
15,36±0,34
C
13,98±0,22
C
11,66±0,20
C
8,85±0,37
C
6,36±0,34
C
#10 17,93±0,21
18,52±0,30
AB
17,86±2,30
AB
19,4±0,05
A
19,43±0,05
A
19,4±1,00
A

22
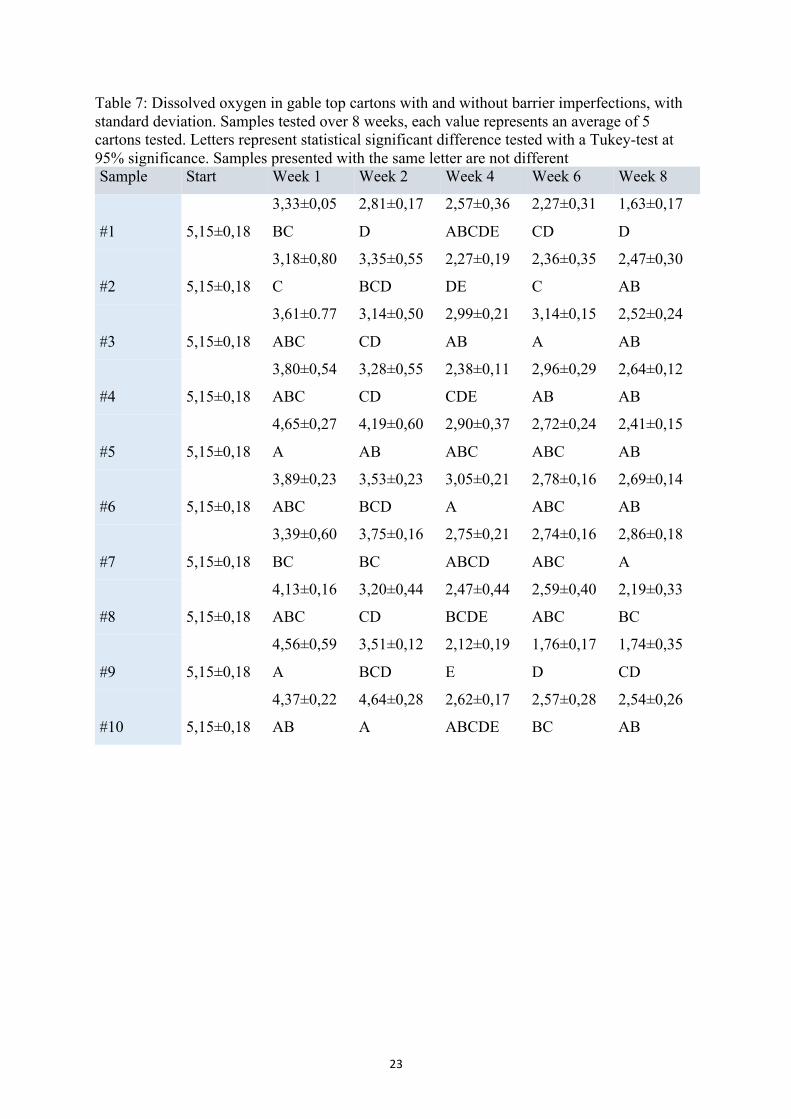
3.3 DISSOLVED OXYGEN CONCENTRATION
Figure 9: Dissolved oxygen content development in juice stored in gable top cartons with and without barrier imperfections over the duration of 8 weeks. Each parallel represents an average dissolved oxygen content in 5 cartons tested.
Development in orange juice dissolved oxygen content is presented in Figure 9. All samples
displayed a reduction in dissolved oxygen content, with the lowest content found in sample 1
and 9 at 8 weeks of storage. Table 7 contains numeric values for dissolved oxygen content
measured over 8 weeks, with standard deviation. Letters in Table 7 represents statistical
significant difference (Tukey test, CI = 95%), where samples presented with the same letter
are not different.
1,2
1,7
2,2
2,7
3,2
3,7
4,2
4,7
5,2
0 1 2 3 4 5 6 7 8
PPMO
2
WEEKS
#1 #2 #3 #4 #5 #6 #7 #8 #9 #10
23
Table 7: Dissolved oxygen in gable top cartons with and without barrier imperfections, with standard deviation. Samples tested over 8 weeks, each value represents an average of 5 cartons tested. Letters represent statistical significant difference tested with a Tukey-test at 95% significance. Samples presented with the same letter are not different Sample Start Week 1 Week 2 Week 4 Week 6 Week 8
#1 5,15±0,18
3,33±0,05
BC
2,81±0,17
D
2,57±0,36
ABCDE
2,27±0,31
CD
1,63±0,17
D
#2 5,15±0,18
3,18±0,80
C
3,35±0,55
BCD
2,27±0,19
DE
2,36±0,35
C
2,47±0,30
AB
#3 5,15±0,18
3,61±0.77
ABC
3,14±0,50
CD
2,99±0,21
AB
3,14±0,15
A
2,52±0,24
AB
#4 5,15±0,18
3,80±0,54
ABC
3,28±0,55
CD
2,38±0,11
CDE
2,96±0,29
AB
2,64±0,12
AB
#5 5,15±0,18
4,65±0,27
A
4,19±0,60
AB
2,90±0,37
ABC
2,72±0,24
ABC
2,41±0,15
AB
#6 5,15±0,18
3,89±0,23
ABC
3,53±0,23
BCD
3,05±0,21
A
2,78±0,16
ABC
2,69±0,14
AB
#7 5,15±0,18
3,39±0,60
BC
3,75±0,16
BC
2,75±0,21
ABCD
2,74±0,16
ABC
2,86±0,18
A
#8 5,15±0,18
4,13±0,16
ABC
3,20±0,44
CD
2,47±0,44
BCDE
2,59±0,40
ABC
2,19±0,33
BC
#9 5,15±0,18
4,56±0,59
A
3,51±0,12
BCD
2,12±0,19
E
1,76±0,17
D
1,74±0,35
CD
#10 5,15±0,18
4,37±0,22
AB
4,64±0,28
A
2,62±0,17
ABCDE
2,57±0,28
BC
2,54±0,26
AB

24
3.3.1 DISSOLVED OXYGEN WITH AND WITHOUT MIXING OF JUICE IN CARTON
Figure 10: Dissolved oxygen content measured in juice stored in gable top cartons with and without barrier imperfections. Each value represents an average of 5 cartons tested, and the far right an average of all 50 samples, with standard deviation. Measurement performed before (blue) and after (orange) mixing of the same juice in each carton.
Mixing the juice in the samples caused a decrease in the measured dissolved oxygen
content in all cartons. Measured average value for 50 cartons displayed a decrease in
dissolved oxygen content of 48% and a decrease in standard deviation of 56%. Figure 10
shows results of dissolved oxygen measurement in 50 juice cartons before and after mixing.
Table 8: Correlation test, dissolved oxygen content measurement before and after mixing orange juice, stored in gable top carton for 8 weeks and vitamin C-content measured in the same 50 samples. Dissolved O2 without
mixing juice Dissolved O2 with mixing juice
Dissolved O2 with mixing juice
C: 0,827 P: 0,000
Vitamin C-content C: -0,478 P: 0,000
C: -0,454 P: 0,001
A correlation test between dissolved oxygen content measurement before and after mixing the
orange juice, and vitamin C-content in 50 samples at week 8 was performed, presented in
table 8. Mixing the juice did not change the relationship between measurements of dissolved
oxygen measured in one of two ways. Measuring with and without mixing the juice displayed
strong correlation (P = 0,000).
0
0,5
1
1,5
2
2,5
3
1 2 3 4 5 6 7 8 9 10 All
PPMO
2
Withoutmixing Withmixing

25
3.4 VITAMIN C CONTENT
Figure 11: Vitamin C-content development in orange juice, stored in gable top cartons with and without barrier imperfections over the duration of 8 weeks. Each parallel represents an average of 5 cartons tested. Development in vitamin C content measured in orange juice is presented in Figure 11. All
samples displayed a reduction in vitamin C content, with the lowest content found in sample
4, 5 and 6 at 8 weeks of storage. Samples 4, 5 and 6 were cartons with barrier imperfections
along the 1. or 5. panel. Table 9 contains numeric values for dissolved oxygen content
measured over 8 weeks, with standard deviation. Letters in Table 7 represents statistical
significant difference (Tukey test, CI = 95%), where samples presented with the same letter
are not different.
11
16
21
26
31
0 1 2 3 4 5 6 7 8
MGAA/100ML
WEEKS
#1 #2 #3 #4 #5 #6 #7 #8 #9 #10
26
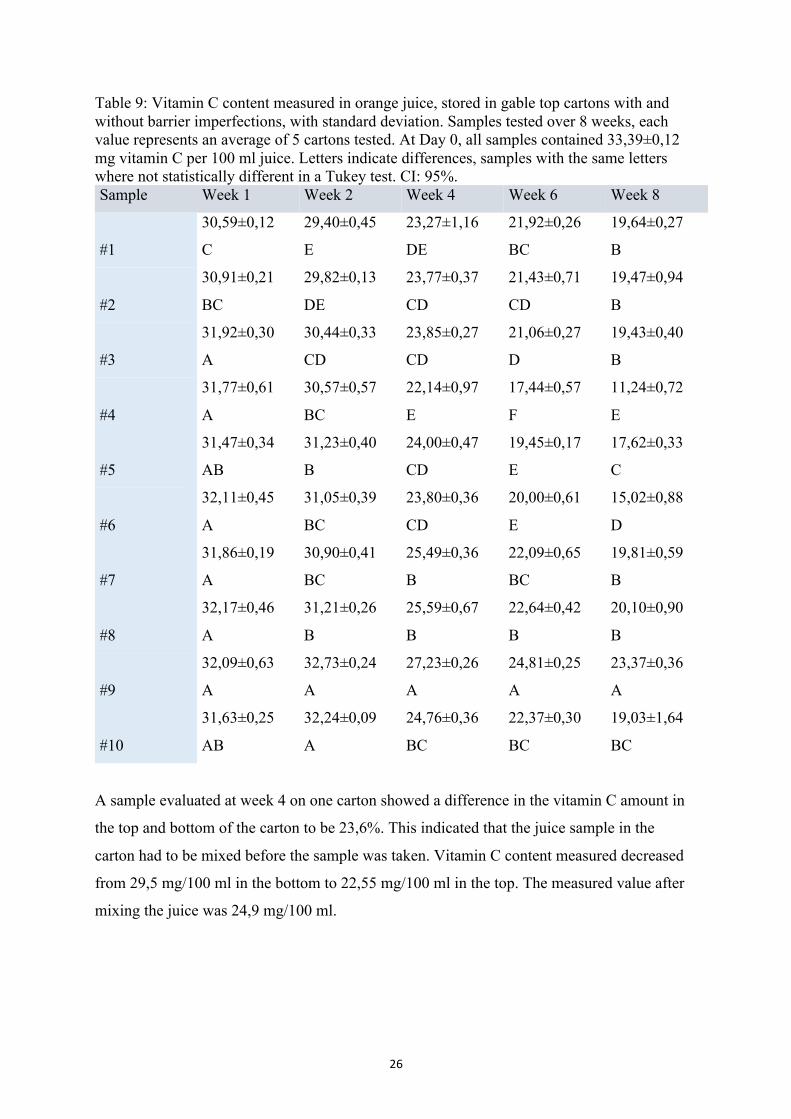
Table 9: Vitamin C content measured in orange juice, stored in gable top cartons with and without barrier imperfections, with standard deviation. Samples tested over 8 weeks, each value represents an average of 5 cartons tested. At Day 0, all samples contained 33,39±0,12 mg vitamin C per 100 ml juice. Letters indicate differences, samples with the same letters where not statistically different in a Tukey test. CI: 95%. Sample Week 1 Week 2 Week 4 Week 6 Week 8
#1
30,59±0,12
C
29,40±0,45
E
23,27±1,16
DE
21,92±0,26
BC
19,64±0,27
B
#2
30,91±0,21
BC
29,82±0,13
DE
23,77±0,37
CD
21,43±0,71
CD
19,47±0,94
B
#3
31,92±0,30
A
30,44±0,33
CD
23,85±0,27
CD
21,06±0,27
D
19,43±0,40
B
#4
31,77±0,61
A
30,57±0,57
BC
22,14±0,97
E
17,44±0,57
F
11,24±0,72
E
#5
31,47±0,34
AB
31,23±0,40
B
24,00±0,47
CD
19,45±0,17
E
17,62±0,33
C
#6
32,11±0,45
A
31,05±0,39
BC
23,80±0,36
CD
20,00±0,61
E
15,02±0,88
D
#7
31,86±0,19
A
30,90±0,41
BC
25,49±0,36
B
22,09±0,65
BC
19,81±0,59
B
#8
32,17±0,46
A
31,21±0,26
B
25,59±0,67
B
22,64±0,42
B
20,10±0,90
B
#9
32,09±0,63
A
32,73±0,24
A
27,23±0,26
A
24,81±0,25
A
23,37±0,36
A
#10
31,63±0,25
AB
32,24±0,09
A
24,76±0,36
BC
22,37±0,30
BC
19,03±1,64
BC
A sample evaluated at week 4 on one carton showed a difference in the vitamin C amount in
the top and bottom of the carton to be 23,6%. This indicated that the juice sample in the
carton had to be mixed before the sample was taken. Vitamin C content measured decreased
from 29,5 mg/100 ml in the bottom to 22,55 mg/100 ml in the top. The measured value after
mixing the juice was 24,9 mg/100 ml.

27
3.5 AOIR Figure 12: Oxygen transfer rate (OTR, ml O2/pack/day) measured in EVOH and aluminum gas barrier gable tops with and without gas barrier imperfections. Average with standard deviation.
Table 10: Tukey pairwise comparison test of OTR (ml O2/pack/day) measured in EVOH and aluminum gas barrier gable tops with and without barrier imperfections. Samples grouped with the same letter was not different at 95% confidence.
Sample Mean Grouping 1 0,40 ± 0,28 E 2 13,46 ± 5,16 D 3 36,97 ± 4,22 A 4 22,64 ± 2,31 BC 5 27,84 ± 5,94 AB 6 15,38 ± 7,87 CD 7 25,98 ± 10,24 B 8 2,52 ± 2,17 E 9 0,19 ± 0,30 E 10 10,75 ± 1,63 CDE
A correlation test of AOIR and vitamin C resulted in no significant correlation (P = 0,264). There was observed a significant difference in OTR measured with the AOIR-method
in several samples. Samples 1, 8, 9 and 10 were not significantly different.
3.5.1 VOLUME DETERMINATION OF GABLE TOPS
The PermMate system was used to measure the gable top carton volume. An average
of 10 gable tops had a volume of 73,84 ml, with a relative standard deviation of 5,4%. This
value was then used in all gable tops for calculating AOIR.
0
5
10
15
20
25
30
35
40
1 2 3 4 5 6 7 8 9 10
OTR
(ml O
2/Pa
ck/d
ay)
Sample

28
3.6 DYE TEST AREA Table 11: Measured dye fluid penetration area on board in EVOH gable top cartons (mm2)
Sample Dye area (mm2) SD 2 628,20 211,39 3 1851,60 1590,58 4 69,77 41,71 5 74,33 30,92 6 43,03 18,13 7 1,12 0,4 8 0,76 0,37
A correlation test of AOIR and dye spot area(mm2) resulted in no significant correlation (P = 0,169). Measured area of dye fluid penetration (mm2) on board in gable tops 2, 3, 4, 5, 6, 7 and 8 are presented in table 11. Sample 1 and 9 did not display any dye spots (A = 0,0 mm2). 3.6.1 CORRELATION OF VITAMIN C CONTENT AND AREA OF DYE PENETRATION A correlation test between dye penetration area in gable top and vitamin C in 15 cartons was
performed. Samples used were 2, 3, 4, 5 and 6 with 3 gable tops from each sample.
The test returned a significant result with P = 0,036 and a weak correlation of 0,484. Meaning
that a larger dye penetration area correlated with a higher content of vitamin C.
3.7 MICROSCOPY OF MANUAL MADE BARRIER IMPERFECTIONS
Figure 13: 100 µm manual made barrier imperfections in EVOH barrier layer in 3 EVOH gas barrier cartons after removal of board. Line: 100 µm.
Figure 14: 500 µm manual made barrier imperfections in EVOH barrier layer in 3 EVOH gas barrier cartons after removal of board. Line: 500 µm.
29
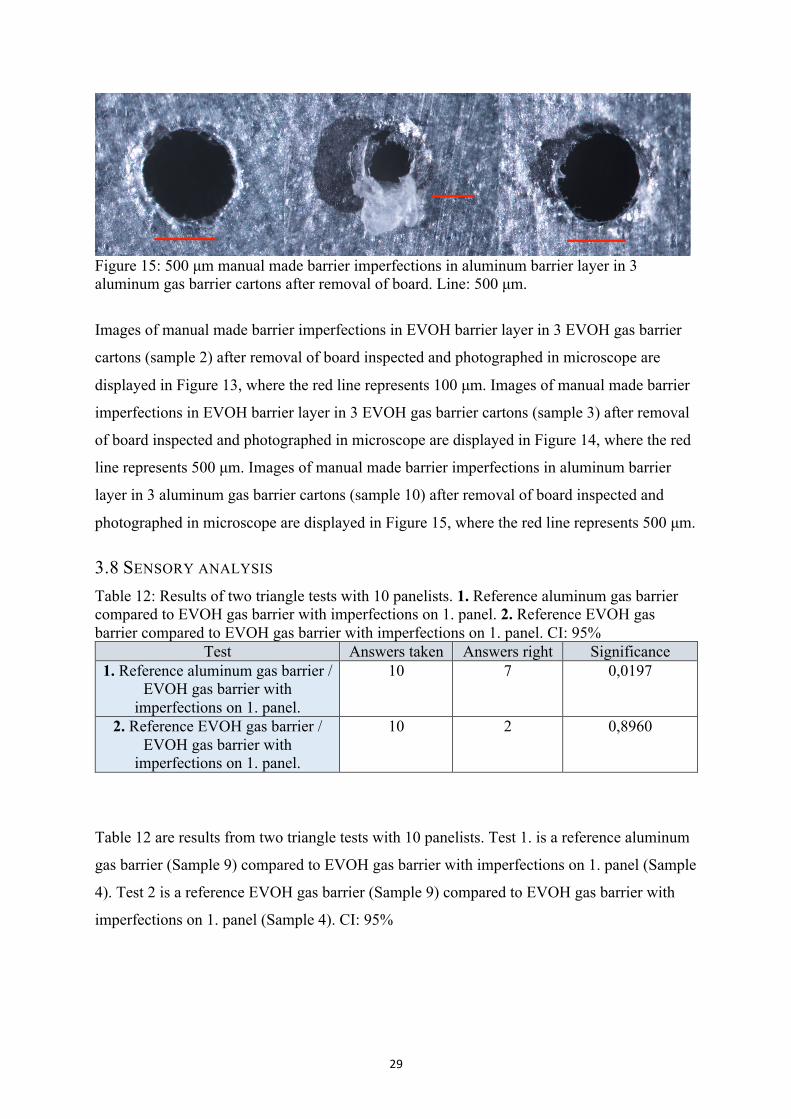
Figure 15: 500 µm manual made barrier imperfections in aluminum barrier layer in 3 aluminum gas barrier cartons after removal of board. Line: 500 µm.
Images of manual made barrier imperfections in EVOH barrier layer in 3 EVOH gas barrier
cartons (sample 2) after removal of board inspected and photographed in microscope are
displayed in Figure 13, where the red line represents 100 µm. Images of manual made barrier
imperfections in EVOH barrier layer in 3 EVOH gas barrier cartons (sample 3) after removal
of board inspected and photographed in microscope are displayed in Figure 14, where the red
line represents 500 µm. Images of manual made barrier imperfections in aluminum barrier
layer in 3 aluminum gas barrier cartons (sample 10) after removal of board inspected and
photographed in microscope are displayed in Figure 15, where the red line represents 500 µm.
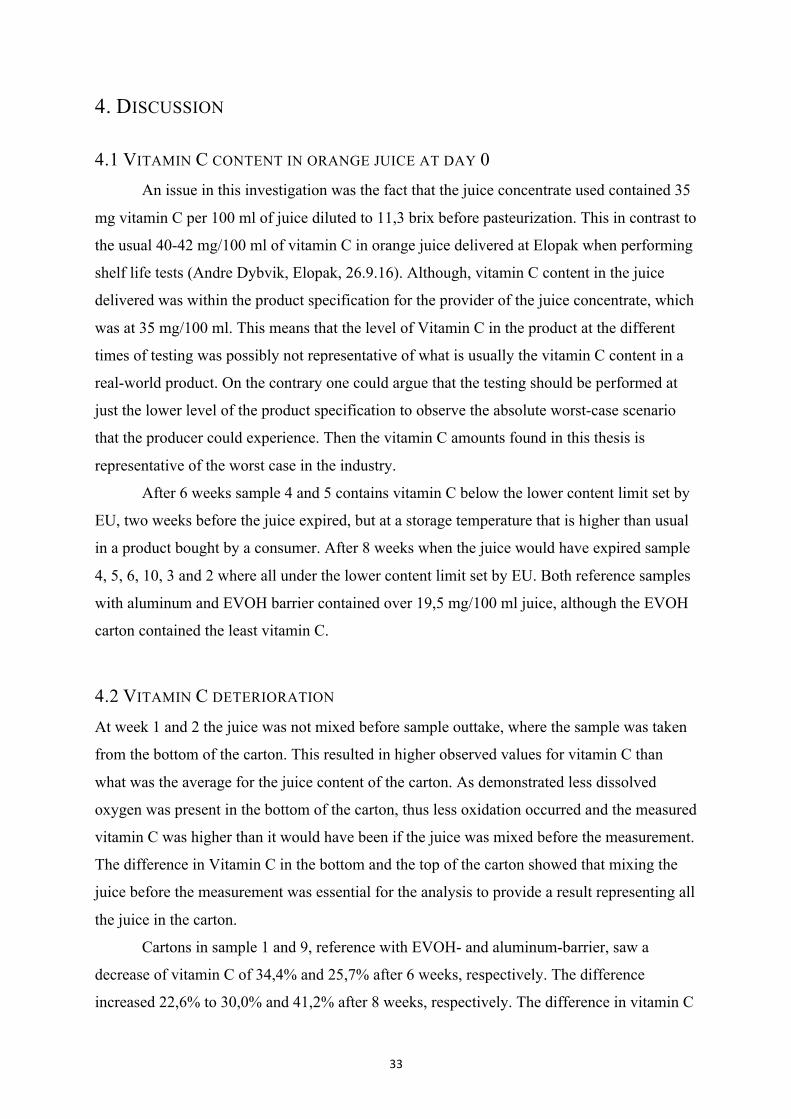
3.8 SENSORY ANALYSIS Table 12: Results of two triangle tests with 10 panelists. 1. Reference aluminum gas barrier compared to EVOH gas barrier with imperfections on 1. panel. 2. Reference EVOH gas barrier compared to EVOH gas barrier with imperfections on 1. panel. CI: 95%
Test Answers taken Answers right Significance 1. Reference aluminum gas barrier /
EVOH gas barrier with imperfections on 1. panel.
10 7 0,0197
2. Reference EVOH gas barrier / EVOH gas barrier with
imperfections on 1. panel.
10 2 0,8960
Table 12 are results from two triangle tests with 10 panelists. Test 1. is a reference aluminum
gas barrier (Sample 9) compared to EVOH gas barrier with imperfections on 1. panel (Sample
4). Test 2 is a reference EVOH gas barrier (Sample 9) compared to EVOH gas barrier with
imperfections on 1. panel (Sample 4). CI: 95%

30
3.9 BALANCED ANOVA In EVOH-gable top cartons with barrier imperfections the type of barrier imperfection
explained 3,51% of the effect and storage time explained 91,18% of the effect on the change
in vitamin C. Interaction effect (BI*WN) was low, and explained only 4,6% of the effect. A
higher effect was found in type of barrier for dissolved oxygen with 12,88% of the effect
caused by type of barrier imperfection. The barrier effect on headspace oxygen concentration
was 55,18%, with little effect of week number (storage time).
Table 13: Overview of balanced ANOVA results for the responses and main effects BI (Barrier Imperfection), WN (Storage time) and interaction BI*WN in EVOH carton samples with barrier imperfections (8*5). The numbers are explained variance (in %). All values were significant for a 5% significance level. Vitamin C Dissolved O2 Headspace O2 Type of barrier imperfection (BI)
3,51 % 12,88% 55,18%
Week number (WN) 91,18% 51,56% 7,31% BI*WN 4,60% 13,11% 22,48% Residuals 0,71% 22,43% 14,96% R2 adj. 99,12% 72,09% 81,34%
An effect from type of barrier was significant on the vitamin C and dissolved oxygen content
in orange juice as well as headspace oxygen concentration. Although most of the effect on
vitamin C content, dissolved oxygen content and headspace oxygen concentration was
accounted to the storage time, with 85,43%, 75,93% and 86,90%, respectively.
12,56% of the effect on vitamin C deterioration in orange juice could be accounted to the
variation in permeability in EVOH and aluminum barrier gable top cartons.
Table 14: Overview of balanced ANOVA results for the responses and main effects BI (Barrier Imperfection), WN (Storage time) and interaction BI*WN in EVOH and aluminum carton samples with no barrier imperfections (2*5). The numbers are explained variance (in %). All values were significant for a 5% significance level. Vitamin C Dissolved O2 Headspace O2 Type of barrier imperfection (BI)
12,56% 1,28% 8,72%
Week number (WN) 85,43% 75,93% 86,90% BI*WN 1,00% 12,58% 1,85% Residuals 0,99% 10,15% 2,47% R2 adj. 98,78% 87,54% 96,96%

31
In EVOH and aluminum gas barrier cartons with 500 µm manual made barrier imperfections
the effect of the different samples was low for vitamin C and dissolved oxygen content. The
samples had an higher effect on headspace oxygen, with 9,06%.
Table 15: Overview of balanced ANOVA results for the responses and main effects BI (Barrier Imperfection), WN (Storage time) and interaction BI*WN in EVOH and aluminum carton samples with 500 µm manual made barrier imperfections. (2*5). The numbers are explained variance (in %). All values were significant for a 5% significance level. Vitamin C Dissolved O2 Headspace O2 Type of barrier imperfection (BI)
0,42% 2,81% 9,06%
Week number (WN) 97,80% 58,00% 16,35% BI*WN 0,71% 23,06% 10,22% Residuals 1,05% 16,00% 64,31% R2 adj. 98,70% 80,29% 21,19%
3.10 CORRELATION OF VITAMIN C-CONTENT, DISSOLVED OXYGEN CONTENT
AND HEADSPACE OXYGEN CONCENTRATION Significant strong correlation between vitamin C content and dissolved oxygen content in the
juice was found in sample 1, 5, 6, 8, 9 and 10. Significant moderate correlation was found in
sample 2, 4 and 7. Sample 3 displayed weak correlation of vitamin C content and dissolved
oxygen content.
Significant strong correlation between vitamin C content and headspace oxygen concentration
was found in sample 1, 8 and 9. Other samples displayed low correlation in headspace oxygen
concentration and vitamin C content, where only sample 3 and 10 were significant.
Significant strong correlation between headspace oxygen concentration and dissolved oxygen
content were found in sample 1, 8 and 9.
Table 16: Correlation analysis of vitamin C content, dissolved Oxygen content and headspace oxygen concentration 10 sample parallels during storage for 8 weeks. Gable top cartons with EVOH and aluminum gas barrier samples. Significant strong correlation indicated in dark green and significant medium correlation indicated in light green.
Sample 1 Vitamin C Dissolved O2 Dissolved O2 Correlation: 0,814
P-value: 0,000
Headspace O2 Correlation: 0,956 P-value: 0,000
Correlation: 0,824 P-value: 0,000

32
Sample 2 Vitamin C Dissolved O2 Dissolved O2 Correlation: 0,620
P-value: 0,001
Headspace O2 Correlation: 0,156 P-value: 0,455
Correlation: 0,317 P-value: 0,123
Sample 3 Vitamin C Dissolved O2 Dissolved O2 Correlation: 0,533
P-value: 0,006
Headspace O2 Correlation: -0,398 P-value: 0,049
Correlation: 0,010 P-value: 0,961
Sample 4 Vitamin C Dissolved O2 Dissolved O2 Correlation: 0,615
P-value: 0,001
Headspace O2 Correlation: -0,268 P-value: 0,195
Correlation: 0,019 P-value: 0,929
Sample 5 Vitamin C Dissolved O2 Dissolved O2 Correlation: 0,905
P-value: 0,000
Headspace O2 Correlation: -0,173 P-value: 0,409
Correlation: 0,120 P-value: 0,567
Sample 6 Vitamin C Dissolved O2 Dissolved O2 Correlation: 0,895
P-value: 0,000
Headspace O2 Correlation: 0,263 P-value: 0,204
Correlation: 0,296 P-value: 0,151
Sample 7 Vitamin C Dissolved O2 Dissolved O2 Correlation: 0,677
P-value: 0,000
Headspace O2 Correlation: 0,064 P-value: 0,763
Correlation: 0,148 P-value: 0,481
Sample 8 Vitamin C Dissolved O2 Dissolved O2 Correlation: 0,791
P-value: 0,000
Headspace O2 Correlation: 0,831 P-value: 0,000
Correlation: 0,689 P-value: 0,000
Sample 9 Vitamin C Dissolved O2 Dissolved O2 Correlation: 0,866
P-value: 0,000
Headspace O2 Correlation: 0,952 P-value: 0,000
Correlation: 0,875 P-value: 0,000
Sample 10 Vitamin C Dissolved O2 Dissolved O2 Correlation: 0,902
P-value: 0,000
Headspace O2 Correlation: -0,435 P-value: 0,030
Correlation: -0,453 P-value: 0,023
33
4. DISCUSSION 4.1 VITAMIN C CONTENT IN ORANGE JUICE AT DAY 0
An issue in this investigation was the fact that the juice concentrate used contained 35
mg vitamin C per 100 ml of juice diluted to 11,3 brix before pasteurization. This in contrast to
the usual 40-42 mg/100 ml of vitamin C in orange juice delivered at Elopak when performing
shelf life tests (Andre Dybvik, Elopak, 26.9.16). Although, vitamin C content in the juice
delivered was within the product specification for the provider of the juice concentrate, which
was at 35 mg/100 ml. This means that the level of Vitamin C in the product at the different
times of testing was possibly not representative of what is usually the vitamin C content in a
real-world product. On the contrary one could argue that the testing should be performed at
just the lower level of the product specification to observe the absolute worst-case scenario
that the producer could experience. Then the vitamin C amounts found in this thesis is
representative of the worst case in the industry.
After 6 weeks sample 4 and 5 contains vitamin C below the lower content limit set by
EU, two weeks before the juice expired, but at a storage temperature that is higher than usual
in a product bought by a consumer. After 8 weeks when the juice would have expired sample
4, 5, 6, 10, 3 and 2 where all under the lower content limit set by EU. Both reference samples
with aluminum and EVOH barrier contained over 19,5 mg/100 ml juice, although the EVOH
carton contained the least vitamin C.
4.2 VITAMIN C DETERIORATION At week 1 and 2 the juice was not mixed before sample outtake, where the sample was taken
from the bottom of the carton. This resulted in higher observed values for vitamin C than
what was the average for the juice content of the carton. As demonstrated less dissolved
oxygen was present in the bottom of the carton, thus less oxidation occurred and the measured
vitamin C was higher than it would have been if the juice was mixed before the measurement.
The difference in Vitamin C in the bottom and the top of the carton showed that mixing the
juice before the measurement was essential for the analysis to provide a result representing all
the juice in the carton.
Cartons in sample 1 and 9, reference with EVOH- and aluminum-barrier, saw a
decrease of vitamin C of 34,4% and 25,7% after 6 weeks, respectively. The difference
increased 22,6% to 30,0% and 41,2% after 8 weeks, respectively. The difference in vitamin C

34
in the reference EVOH- and aluminum-barrier cartons suggested a difference in permeability
in the different barriers, as oxygen in the headspace and dissolved in the orange juice was the
same at day 0. EVOH with no barrier imperfections contained significantly more vitamin C at
8 weeks than sample 4, 5 and 6 wile sample 9 contained significantly more vitamin C. The
EVOH-reference then contained an amount of vitamin C, not significantly different from
sample 2, 3, 7, 8 and 10. This indicated that the barrier imperfections in samples 2, 3, 7, 8 and
10 did not have an impact on the vitamin C-content compared to a carton with no
imperfections.
At 8 weeks, sample 4, 5, and 6 contained significant less vitamin C than the other EVOH-
barrier cartons. These cartons had barrier imperfections that were produced by heat on the 1.
or 5. panel in a converter, indicating a more severe contribution to OTR from the barrier
imperfections produced by heating the gas barrier, compared to barrier imperfections made
manually. The results of sample 3 indicated no difference from the reference at week 4 and 8,
although a marginal difference at week 6. This means that even a 500 µm perforation in the
EVOH gas barrier in a carton does not deteriorate vitamin C-content.
The sensory analysis at week 8 indicated that it would be highly difficult to taste a
difference of 8,4 mg vitamin C/100 ml, tested on EVOH-barrier cartons with the most and
least vitamin C at week 8. Although, 8 out of 10 panelists tasted a difference in the triangle
test comparing sample 9 and sample 4. This implied that the difference in two samples most
consumers could taste was between 8,40 and 12,13 mg vitamin C per 100 ml juice.
Correlation of area on board after dye testing and vitamin C content of juice in the
sample displayed a positive, although weak, correlation (P = 0,036). This indicated that when
the dye spot increased in area the vitamin C content in the sample could be expected to
increase. As a larger dye spot area was associated with a more severe barrier imperfection, the
results were inverse of what was expected. A possible explanation could be the different
behavior of dye fluid in a manual made and naturally formed barrier imperfection. The
correlation test pooled natural and manual made perforations. Manual made perforations
created a channel directly to the board through all polymer layers inside the carton whereas
natural formed perforations were created by heat, and were irregular. The irregularity could
be caused by different melting temperatures in polymers and marginally different thickness in
different areas. This could form channels through the polymers varying in size, shape and
direction, decreasing dye penetration.
Temperature recorded in 2 products had an average difference of 0,73°C. This was not
enough for significantly affecting the vitamin C content in the samples per previous tests at

35
Elopak (Elin Margrethe Johansen, Elopak, 2.12.16). The average temperature recorded in the
cooling chamber of 7,78±0,64°C was satisfactory as it was close to the target temperature.
4.3 HEADSPACE OXYGEN CONCENTRATION As vitamin C in the juice is oxidized by dissolved oxygen, oxygen in headspace would
migrate to the orange juice to achieve equilibrium, reducing the concentration of Oxygen in
the headspace atmosphere, it there were no barrier imperfections. In a carton with perforations
in the gas barrier, oxygen would migrate from the ambient atmosphere and little to no
reduction in oxygen concentration in the gable top would occur.
The oxygen concentration in the gable tops decreased as expected in the references,
sample 1 and 9. The difference in sample 1 and 9 indicated that an aluminum barrier
possesses better barrier capabilities than a EVOH-barrier.
oxygen concentration in the headspace of gable tops in all the cartons with perforations
remained over 17,5%, except from sample 8. In sample 8 the standard deviation indicated that
the effect was systematic. Under-heating of a gable top during production can be one of the
less serious problems regarding carton integrity. In samples 4, 5, 6, 7 and 8 it could be
expected to be fluctuations because of the irregular nature of natural forming barrier
imperfections. The barrier imperfections could be different from carton to carton, due to
plastics melting irregularly under heat treatment or due to product filling perforations.
Headspace oxygen concentration in perforated cartons indicated a high enough contribution to
the total permeability of the carton from the perforations, that the orange juice had a
practically unlimited supply of O2.
Samples 1, 9, 4 and 10 where expected to be predictable and systematic as the 500 µm
perforations never where observed to be plugged by elements in the juice. Although as
microscopy of perforations revealed, there could be differences in the structure of perforations
from carton to carton, that could have had an influence on permeability.
Sample 4 and 10 had the highest average headspace oxygen concentration week 4 and 6. The
low value and high standard deviation of sample 10 at week 2 was explained with an outlier
in the five parallels without proper perforation.
For headspace oxygen concentration to decrease during storage the permeation of the
carton with possible barrier imperfections must be lower than oxygen consumed by oxidation
of vitamin C in the orange juice. At a higher temperature, where Vitamin C deterioration

36
would be greater (Klimczak et al. 2006) the headspace oxygen concentration could possibly
be reduced compared to this test.
4.4 DISSOLVED OXYGEN CONTENT Per Elopak method the concentration of dissolved oxygen was measured with the
sensor static in the juice and with no stirring or mixing prior or during the measurement. In a
paper investigated where dissolved oxygen was measured in juice, the juice was mixed
carefully while the sensor was in the juice either during or before the measurement of
dissolved oxygen (Solomon, Svanberg, 1995). A test with 10 samples was performed week 6
where dissolved oxygen was measured with static juice and again after mixing carefully in the
carton with a glass rod. The difference in results indicated that further testing was necessary.
In the 50 samples tested week 8 the average decrease in dissolved oxygen (48%) from all the
measurements indicated a higher content of dissolved oxygen in the upper part of the juice in
the carton and less in the bottom of the carton. Dissolved oxygen in static juice appears to not
even out towards the bottom of the fluid as oxygen dissolves in the top of the fluid. This then
created a gradient from the top to the bottom of the juice in the carton with less dissolved
oxygen further down, perhaps caused by the viscosity of the orange juice. The dissolved
oxygen gradient can may be assumed to be opposite of vitamin C content, where the highest
content of vitamin C can be found in the bottom of the fluid.
The measurements in this project was performed with no mixing of the juice and was
therefore subject to random mixing of the juice during transport of the juice to the lab from
cold storage and handling of the carton before the measurement. The values were probably
higher than the average for the entire juice content and can then only be interpreted as
indications of the dissolved oxygen levels. This also explains the cartons where it was
observed an increase in the dissolved oxygen level from week 4 to week 6. This effect
appeared as strong in cartons with low and high permeation in the package. A package with
less O2 in the gable top, by flushing in production, could possibly see a lower gradient of
dissolved O2 from the top to the bottom of the fluid level in an intact carton.
The strong correlation of dissolved oxygen content before and after mixing of 0,827 (P
= 0,000) indicated that measurements of dissolved oxygen before mixing could be used to
explain possible differences in samples, but not the content of dissolved oxygen in the sample.
The strong correlation of dissolved oxygen and vitamin C deterioration in sample 1, 2,
4, 5, 6, 7, 8, 9 and 10 was in accordance to what was expected (P = 0.000 (2 & 4: P = 0,001)).
As vitamin C oxidized, less oxygen would be present in the orange juice. Lack of strong

37
correlation in sample 3 could be due to dissolved oxygen content measurement not being
accurate, as the measured content increased from week 4 to week 6. Sample 1 and 9, where
headspace oxygen concentration decreased to under 9% had a strong correlation with vitamin
C deterioration (P = 0,000). This was expected as oxygen in headspace migrated to the orange
juice due to reduced content in the juice, to maintain equilibrium. And per the dye test with no
faults, little to no oxygen could permeate the packages after filling. Cartons with perforations
did not show a correlation between vitamin C content and headspace oxygen, due to oxygen
permeating barrier imperfections as oxygen in the headspace dissolved in the juice.
4.5 AOIR There are multiple factors to discuss concerning development of an AOIR-procedure for a
gable top carton;
1. Data recorded with the AOIR method in this thesis.
Results of OTR measurements showed a high degree of irregularity. This was to an extent
expected, as the perforations were irregular, as determined visually with dye testing.
The high relative standard deviation (sample 1: 70% and sample 9: 157%) in cartons with no
barrier imperfections was not expected as the method has been confirmed to provide values
with low standard deviation in plastic films and thermoformed plastic trays (Larsen et al.
2000, Larsen et al. 2002). The method was able to differentiate the average permeability of
the cartons, although the high standard deviation indicated a high sample selection should be
chosen when using the method. The lack of significant correlation between measured OTR
and vitamin C content indicated that there could have been permeability differences in the
cartons below fluid level, that the method of measuring gable tops only would not register.
This was due to the assumption that perforations below fluid level did not high degree
influence the permeability of the package.
2. Storage temperature, with and without barrier imperfections.
When testing a carton gable top with barrier imperfections with the AOIR method the sample
might not need to be stored at cooling temperature during conditioning as it is not likely to
have an impact on the OTR, based on the findings of Hanne Larsen (2004). This eliminates
one of the argued advantages of the AOIR-method compared to OxTran. In a carton with no
barrier imperfections, gas permeation through the gas barrier is the only route. In such a case
38
samples, should be stored in a temperature relevant to the test, as the temperature will have an
impact on the gas transmission rate (Larsen 2004).
3. Storage time having an influx on the measurements.
This method has been proven to work for packages of very low permeability (Larsen et al.
2000), but has not been validated properly on packages with higher OTR or gable top cartons.
With this taken into consideration the AOIR of a gable top was tested at different intervals
and a pattern of being provided with different results at different measurement intervals
appeared. A measurement from 2-4% oxygen in headspace resulted in a higher value than that
from for example 5-12% oxygen in headspace. This can perhaps be explained in part by the
curve in figure 14, although the formula is designed to take the nonlinearity of OTR
depending on concentration difference into account. For this experiment the gable tops had
perforations in the gas barrier and the filling of the cartons happened without flushing. This
means that the start oxygen-value in the headspace was ambient oxygen level. With the
perforations and the consequential high OTR this oxygen level never decreases much, except
from in the reference cartons. This information makes it possible to argue that the AOIR-
measurements most relevant to real-life should be performed at the highest interval possible
or at least above 12-15%.
The volume increase effect, where O2 migrates through a barrier at a ratio of 4:1
compared to N2 could decrease the relative concentration of oxygen in a package over time.
This argues that measurements should be performed as quickly as possible.
4. OTR in a gable top carton with and without orange juice.
The gas permeability in a “real life” situation with an oxidizing product in a carton can
perhaps be different from the measurements in a lab with an empty gable top. This because
the oxygen will oxidize Vitamin C and therefore the concentration in the juice will decrease.
Decreased dissolved oxygen in the orange juice will mean that the juice must absorb oxygen
from the headspace to achieve equilibrium. Lower oxygen concentration in the headspace will
move the permeability to the left on the curve in Figure 16. and therefore, possibly increase
gas transmission rate. It might be possible to take this into account in the calculation of OTR
if the amount of oxygen consumed by the product was known.
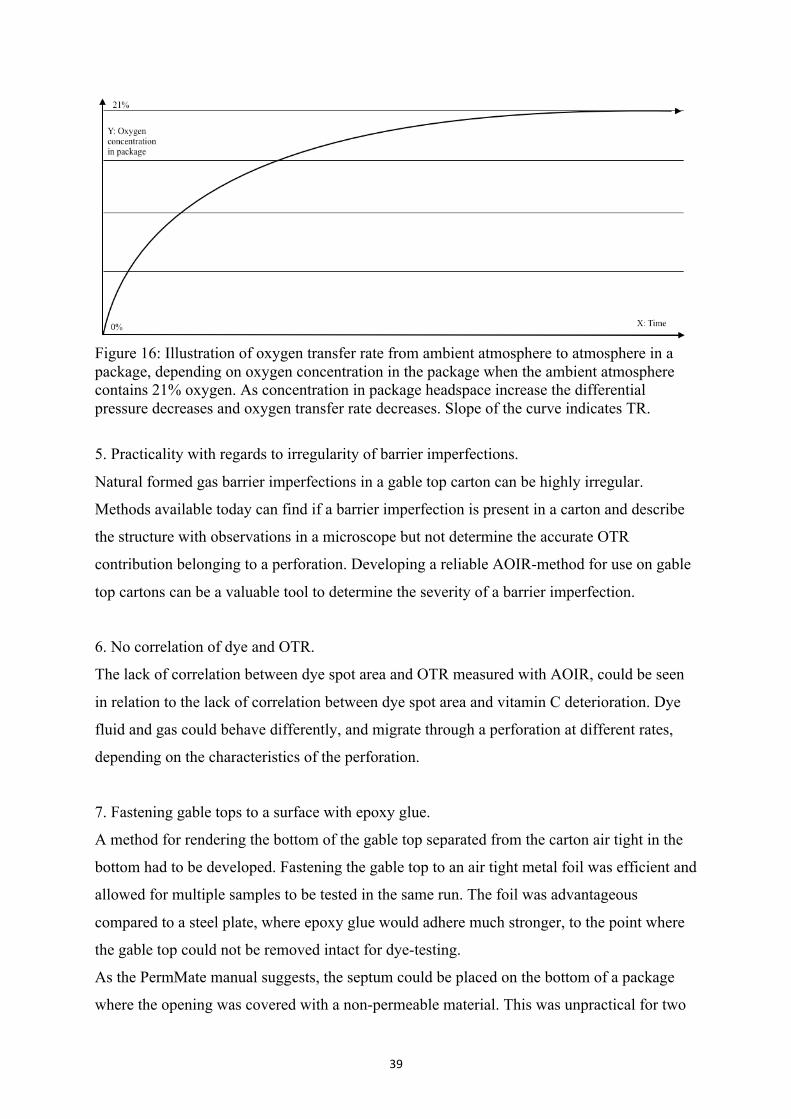
39
Figure 16: Illustration of oxygen transfer rate from ambient atmosphere to atmosphere in a package, depending on oxygen concentration in the package when the ambient atmosphere contains 21% oxygen. As concentration in package headspace increase the differential pressure decreases and oxygen transfer rate decreases. Slope of the curve indicates TR.
5. Practicality with regards to irregularity of barrier imperfections.
Natural formed gas barrier imperfections in a gable top carton can be highly irregular.
Methods available today can find if a barrier imperfection is present in a carton and describe
the structure with observations in a microscope but not determine the accurate OTR
contribution belonging to a perforation. Developing a reliable AOIR-method for use on gable
top cartons can be a valuable tool to determine the severity of a barrier imperfection.
6. No correlation of dye and OTR.
The lack of correlation between dye spot area and OTR measured with AOIR, could be seen
in relation to the lack of correlation between dye spot area and vitamin C deterioration. Dye
fluid and gas could behave differently, and migrate through a perforation at different rates,
depending on the characteristics of the perforation.
7. Fastening gable tops to a surface with epoxy glue.
A method for rendering the bottom of the gable top separated from the carton air tight in the
bottom had to be developed. Fastening the gable top to an air tight metal foil was efficient and
allowed for multiple samples to be tested in the same run. The foil was advantageous
compared to a steel plate, where epoxy glue would adhere much stronger, to the point where
the gable top could not be removed intact for dye-testing.
As the PermMate manual suggests, the septum could be placed on the bottom of a package
where the opening was covered with a non-permeable material. This was unpractical for two

40
reasons; 1. The light adhesion of epoxy to the metal foil suggested it could loosen during
manipulation for performing measurements. 2. Stacking and moving gable tops upside-down
could present with further challenges.
8. The formula
(1)
The formula (1) the AOIR-method is based on could possibly be used for calculating OTR of
gable top cartons without the use of a PermMate II-system, but this would require further
research, as there was not sufficient time to compare the two methods.
4.5.1 REMOVAL OF BOARD ON GABLE TOPS Several options for attachment of the septum to the gable top was explored as the AOIR-
method was not previously used on a gable top carton. Placement on the outer PE-layer was
not an option as gas will travel through the PE and board, under the septum and through the
perforation in the EVOH-gas barrier. Illustrated in figure 15. Determined in a preliminary test,
measured OTR decreased to a hundredth with removal of the board and PE. The most secure
and reliable attachment of the septum was determined to be directly in the gas barrier under
the board after the board was completely removed.
Figure 15: Illustration of gas route in carton layers under septum without removal of outer PE
and board layer to the left. To the right septum placement after board and PE removal.
Air flow
1: PE2: Board3: PE4: EVOH5: PE
Septum
Needle perforation
!" = − %&' − &(
×*+ ,-.(/ − -'-.(/ − -(0

41
Attachment on the closure was used as an alternative method so the removal of board would
not interfere with the dye test or AOIR at a later time. The glue on the septum did not affix
properly to the lid and epoxy had to be used to secure the attachment. Although with the
introduction of several insertions of the needle the brittle epoxy could break of the lid and
cause leakage. A leakage would be visible on the lid and the problem could be solved by
adding more glue.
The removal of the board and PE could have influenced the OTR measured with
AOIR, depending on the characteristics of the perforations. If a barrier imperfection was in
the vicinity of the area where the board and PE was removed, gas could possibly gain another
route with less resistance to perforations in the gas barrier. This could be an argument for
always placing the septum on the gable top lid when working with cartons, to stay as close to
the original package properties as possible.
4.6 MICROSCOPY OF GAS BARRIER IMPERFECTIONS Images of 100 µm barrier imperfections in EVOH-cartons exhibited irregularities in the
barrier perforation size and shapes. This could influence the permeability of each perforation.
The oblong barrier imperfections may be caused by the needle tip being slightly bent during
operation causing the irregular perforations. Previous needles where observed in microscope
to be slightly bent after use. Per Allan-Wojitas et al., (2008) material residue in barrier
imperfections may cause differences in OTR for a plain plastic film. Irregularities in hole
structure and material residue partially blocking the perforations was the case for some of the
barrier imperfections in this study, as seen in Figures 13, 14 and 15. The difference in the
structure and size of the perforations might have had an impact on the OTR contribution of
the barrier imperfections on the total OTR. Although in this project the barrier imperfections
was not directly exposed to air and the findings of Allan-Wojtas et al. might not be applicable.
As Allan-Wojtas et al. found in 2008, Barrier imperfections larger than 55 µm in
diameter may not have a predictable OTR as smaller barrier imperfections had. A barrier
imperfection with an area of 6500 µm2 had previously been measured to result in an OTR of
115-135 in a film (Wojtas et al., 2008). In this test the barrier imperfections was a part of the
structure in a gable top carton and not in direct contact with the atmosphere. A layer of board
as well as an outer layer of PE was still intact on the outside of the carton and the OTR might
be lower because of this.

42
4.7 JUICE FILLING BARRIER IMPERFECTIONS An effect that had to be taken into consideration during the experimental design phase was the
fact that elements in the orange juice could potentially “plug” barrier imperfections in the
inner layers in the carton. Experimentation with this effect and different sized barrier
imperfections found that 100 µm barrier imperfections could be sealed just by contact with
the juice. Meanwhile 500 µm barrier imperfections where never filled in testing in this case.
Therefore, it was deduced that the barrier imperfection size that was the smallest possible,
while at the same time not plugged by juice were in the interval 100-500 µm. A tool to
produce barrier imperfections in the carton material reliably and consistently between those
extremes could not be produced in the timeframe available. Further experiments to find the
cut-off size where a barrier imperfection always stays open in contact with material in juice
would be recommended in the future. What materials in the juice that are filling barrier
imperfections in the carton material are assumed to be sugars in the orange juice. Related to
this issue is also the assumption that barrier imperfections that are below the fluid level in the
carton will have little to no effect on the total permeability of the package and therefore no
effect on the quality of the product. This effect could be studied by filling a carton with
barrier imperfections at different heights along the carton with a de-aerated fluid and
comparing the OTR with that of an identical carton with no fluid inside. This protection
provided by the product in the carton is also important for the EVOH-carton experimented
with in this project, as the bottom Japan-type seal is not always gas-tight.
5. CONCLUSION A certain amount of barrier imperfections does not influence the vitamin C content in juice
stored in a EVOH gas barrier gable top carton, even after 8 weeks of storage. Suggesting a
EVOH gas barrier carton does not need to be perfect to retain vitamin C content. This implies
that a EVOH gas barrier carton could present with a positive result in a dye test in a
production facility and still retain the desired content of vitamin C in orange juice up to the
expiration date. A spot from dye test can still result in a perfect product if the perforation
stays open. Suggesting the area of a dye spot cannot be used as an indicator of the severity of
a barrier imperfection but only as a quantitative analysis in the future.
Measuring OTR with AOIR could prove promising as a method for determining
permeability of a gable top carton as tests with the PermMate did provide different results in
43
multiple samples. The selection of barrier imperfections in the project were not ideal for
verification of the method as there was a high degree of variation in the permeations tested.
Test setup and time constraints, limited the possibility of further testing of the AOIR-method
for adjustments to the procedure or verification.
As barrier perforations that form in cartons have a high degree of variation and are highly
unpredictable, it is difficult to emulate real barrier imperfections.
The registered content of dissolved oxygen in the orange juice in this project, was
different than the actual dissolved oxygen content for an average of the juice content. This
indicated that the dissolved oxygen content could not be considered when assessing the
absolute quality of the juice, only the quality of the samples relative to each other. This was
confirmed by the strong correlation between measurement of dissolved oxygen before and
after mixing the orange juice.
In preparation of a project where the objective is to study gable top cartons, the
primary concern should be to obtain the maximum amount of knowledge possible about the
functionality and characteristics of the carton before planning of the test scheme. In this
thesis, new information and realizations about the carton and orange juice characteristics
changed the premises of some tests after testing had commenced. A different quality in the
data collected could be achieved with further knowledge of the carton and orange juice
characteristics before commencing the practical work. Still a great amount of data was
collected, which could prove useful for further understanding of the mechanics of a gable top
carton.
6. SUGGESTIONS FOR FURTHER WORK
If cartons with a linear increase in permeability caused by perforations were tested for vitamin
C degradation in orange juice over time, this could determine a cut off level of OTR
contribution from perforations in EVOH gas barrier for vitamin C deterioration to increase.
Test for correlation between vitamin C content and the permeability of an entire
EVOH gas barrier carton, measured with the AOIR-method. This could confirm or deny the
assumption that barrier imperfections below fluid level does not affect the deterioration of
vitamin C in orange juice during storage.
Test the difference in results when OTR is calculated with the use of the formula (1)
the AOIR-method is based upon and when calculated with the PermMate system.

44
(1)
Dissolved oxygen development at different depths in orange juice in cartons with and without
barrier imperfections could be investigated in relation to the practice of flushing gable top
headspace with H2 during filling.
!" = − %&' − &(
×*+ ,-.(/ − -'-.(/ − -(0

45
REFERENCES Allan-Wojtas, P., Forney, C., Moyls, L. & Moreau, D. (2008). Structure and Gas Tansmission
Characteristics of Microperforations in Plastic Films. 25 p.
Charles E. Carraher Jr. (ed.) (2005). Seymour/Carraher's Polymer Chemistry. College of
Science, Florida Atlantic University. 6. Edition, 913 p.
Del-Valle, V., Almenar, E., Hernández-Munoz, P., Lagarón, J. M., Catala, R. & Gavara, R.
Volatile organic compound permeation through porous polymeric films for modified
atmosphere packaging of foods. (2004).
Disimile, P. J., Fox, C. W. & Lee., C., P. (1998) An experimental investigation of the airflow
characteristics of laser drilled holes.
Gabriel, A., Usero, J., Rodriguez, K., Diaz, A. & Tiangson-Bayaga, C. (2015). Estimation of
ascorbic acid reduction in heated simulated fruit juice systems using predictive model
equations. 8 p.
Hussein, Z., Caleb, O. & Opara, U. (2015), Perforation-mediated modified atmosphere
packaging of fresh and minimally processed produce – A review. 14 p.
Klimczak, I., Malecka, M., Szlachta, M. & Gliszczynska-Swiglo, A., (2006). Effect of storage
on the content of polyphenols, vitamin C and the antioxidant activity of orange juices. 10 p.
Larsen, H., Kohler A. & Magnus, E. (2000). Ambient Oxygen Ingress Rate Method-An
Alternative Method to Ox-Tran for Measuring Oxygen Transmission Rate of Whole
Packages. 9 p.
Larsen, H., Kohler A. & Magnus, E. (2002). Predicting Changes in Oxygen Concentration in
the headspace of nitrogen flushed Packages by the Ambient Oxygen Ingress Method. 8 p.
Larsen, H. & Liland, K. (2013). Determination of O2 and CO2 transmisson rate of whole
packages and single perforations in micro-perforated packages for fruit and vegetables. 6 p.

46
Larsen, H. (2004). Oxygen Transmission Rates of Packages at Ambient, Chill and Freezing
Temperatures measured by the AOIR method. 6 p.
Mocon OxTran specification, localized 1.12.16
http://www.mocon.com/assets/documents/oxtran261.pdf
Moyls, L. (2004). Whole bag method for determining oxygen transmission rate.
Plaza, L., Sánchez-Moreno, C., Elez-Martínez, P., Ancos, B., Martín-Bellos,o O. & Cano, M.
(2006) Effect of refrigerated storage on vitamin c and antioxidant activity of orange juice
processed by high pressure or pulsed electric fields with regard to low pasteurization. 7 p.
Regulation (EU) No. 1169/2011 of the European Parliament and of the Council of 25 October
2011 on the provision of food information to consumers. Text with EEA relevance. Localized
15.11.2016 at http://eur-lex.europa.eu/eli/reg/2011/1169/oj
Siracusa, V. (2012) Food Packaging Permeability Behaviour: A Report.
Solomon, O. & Svanberg, U. (1994). Effect of Oxygen and fluorescent light on the quality of
orange juice during storage at 8°C. 6 p.
Thomas Eie. (ed.) (2007) Emballering av næringsmidler, bind 1, Innføring i emballasje- og
emballeringsteknologi, Matforsk. (Title translation: Food packaging, Introduction in
packaging and packaging technology).
Vitamin C degradation illustration, localized 10.12.16
http://patentimages.storage.googleapis.com/EP2413118A1/imgb0001.png
Zerdin, K., Rooney, M. & Vermue, J. (2002), The vitamin C content of juice packed in an
oxygen scavenger material. 9 p.

47
-

i
APPENDIX
ATTACHMENT 1:
Dissolved oxygen analysis with OptiOx optical sensor
1. Why do we have this method? This method is used to measure dissolved oxygen in liquid samples. 2. When to use this method? The method is typically used in chemical shelf life analysis of products. Oxygen in the head space of Pure-Pak cartons and dissolved oxygen in the product will aim for equilibrium. Dissolved O2 decrease over time as it takes part in degradation reactions in the product, e.g. in degradation of ascorbic acid (vitamin C). 3. Who to use this method? This method is to be used by personnel in Food & Material Science Department with required competence. 4. Principle The InLab OptiOx optical dissolved oxygen instrument is a self contained portable instrument, which measures dissolved oxygen in liquid samples. The instrument records temperature and compensates for air pressure. It consists of an InLab OptiOx optical dissolved oxygen sensor connected to a Mettler Toledo SevenGo proTM SG9 that has a display and is controlled by soft keys on the front of the instrument. In addition there is a calibration tube. The InLab OptiOx optical dissolved oxygen sensor is based on Rugged Dissolved Oxygen (RDO) technology. The micro-optical technology incorporated in the RDO sensor centers around the methodology of Lifetime-based Luminescent Dissolved Oxygen detection. This solid-state method uses LEDs to excite a fluorescent material, while an optical receptor gauges the duration, or lifetime, of the event. The duration of fluorescence is inversely proportional to the ambient amount of dissolved oxygen in the water. Because the oxygen is not chemically consumed during the measurement, stirring is superfluous.
ii
5. Equipment
• SevenGoproTMSG9withInLabOptiOxopticaldissolvedoxygensensorfromMettlerToledo.• Calibrationtube
6. How to perform? Under equilibrium conditions, the partial pressure of oxygen in air-saturated water is equal to the partial pressure of oxygen in water-saturated air. The OptiOx sensor calibrated in water-saturated air will correctly read the partial pressure of oxygen in water samples. When measuring low concentration samples (< 1mg/L, 1 ppm), a second calibration with a zero oxygen standard may be done (Annex 1). It should, however, be taken into consideration that zero-point calibrations frequently are a source of error. Due to the very low zero current of the sensors, a zero-point calibration is unnecessary even for measurements at low oxygen concentrations. 6.1 Daily calibration procedure The first point of a DO calibration is done in water-saturated air (100% O2).
• Removethecalibrationtubecapandremovethesponge• Saturatethespongewithdistilledwaterandsqueezetheexcesswateroutofthesponge• Reassemblethecalibrationtube• Makesurethatnowaterdropletsareonthesurfaceofthesensorcap• Slidethecalibrationtubeoverthefrontofthesensoruntilthecalibrationtubeisfirmlyconnectedto
thesensor• Allowatleastfiveminutesforthetemperaturetostabilizepriortocalibration• PressCAL
o Cal1appearsonthedisplayo Themeterendpointsaccordingtothepreselectedendpointmode,automaticallyafterthe
signalhasstabilizedorafterpressingREAD.Thestandardvalueisshownonthedisplay.• PressEndtoacceptthecalibrationandreturntosamplemeasurement
o Thecalibrationresultisshownonthedisplay• Torejectthecalibration,pressExit

iii
6.2 Measurement of samples
• Placethesensorinthesample.o MakesurethatboththeDOsensorandthetemperaturesensorareimmergedinthe
solution.(Thetemperaturesensoristhesmallmetaldiscfoundapproximately3.5cmfromthesensortip).
• PressREADtostartameasuremento Theendpointformatblinks,indicatingameasurementinprogresso Assoonasthemeasurementisstableaccordingtotheselectedstabilitycriterion,the
stabilityicon(/¯)appears.• Themeasurementcanbepresentedindifferentunits(mg/L,ppmand%)bypressingMODE.
• An“A”presentingtheendpointformatonthedisplay,indicatesthatan“automaticendpoint”is
selected.Ifanautomaticendpointisselected,themeasurementstopsassoonasthestabilityiconappearsoverthe“A”.
• Ifthe“manualendpoint”formatisselected,pressREADtomanuallystopthemeasurement.Theendpointsymbolwillthenappearoverthe“M”.
• Ifthe“timedendpoint”formatisselected,pressREADtomanuallystopthemeasurement.Theendpointsymbolwillthenappearoverthe“T”.
• TheendpointformatcanbechangedbypressingMENUandselectEndpointformats.
6.3 Temperature compensation If the temperature prove is connected and working, “ATC” (automatic temperature compensation) and the sample temperature are displayed. If “MTC” shows in the display, the temperature should be entered manually. To set the temperature manually, press MENU and select Temperature settings. The menu settings are further described in the Operating instructions. TABLE1:SENSORSPECIFICATIONLIMITS
Measuring range
Resolution Accuracy
Dissolved oxygen (mg/L, ppm)
0.00 – 50.00 0.01 ± 0.1 mg/L from 0 – 8 mg/L ± 0.2 mg/L from 8 – 20 mg/L ± 10 % from 20 – 50 mg/L
Saturation (%) 0 – 500 0.1 Temperature DO (°C) 0 – 50.0 0.1 ± 0.1 °C Pressure (mbar) 500 – 1100 1 ± 1 mbar

iv
6.4 Storage after use and general maintenance
(a) Meter Never unscrew the two halves of the housing. (b) OptiOx sensor Cleaning
• Donotremovethesensorcap• Rinsethesensorwithdistilledwaterdailyafteruse
o Gentlywipewithasoftclothifbiofoulingispresent.o Ifextensivemineralbuild-upispresent,soakthecapinvinegarfor15mino Soakthesensorinde-ionizedwaterfor15minandblotitdrywithalint-freetissueo Aftercleaningthesensor,a1-pointcalibrationshouldbeperformed
• Donotuseorganicsolventsorsoapstocleanthecap.
Storage • Putthesensorinabeakerwithdistilledwaterorinthecalibrationtube,makingsuretowetthe
spongewithdistilledwater• Keepthesensorawayfromdirectsunlightduringstorage• Donotremovethesensorcap
Maintenance ThesensorcapforInLab®OptiOxoxygensensorsprovidesreliableresults365daysoftheyear.Themeterwilldisplayamessage“sensorcapexpired”whenthecapneedtobereplaced.Forreplacement,oldcapscansimplybe removedandnewones fitted.Theprocedure isdescribed in theOperatingInstructions(p.38).Troubleshooting TABLE2:EXAMPLESOFTROUBLESHOOTINGFORTHESEVENGOPROTMSG9WITHINLABOPTIOXOPTICALDISSOLVEDOXYGENSENSOR.
Issue Recommended Action Unable to calibrate Verify the calibration setup and procedure. Make sure
that no water droplets are on the surface of the cap. Measurements are unstable
Measurements may take longer if the solution temperature is unstable
Measurements is too low Salt may be present in the sample. Set the salinity factor in the meter.
Wrong temperature displayed
Verify that the temperature sensor is immersed in the solution
• Rinsethesensorthoroughlyindistilledwater,blotitdrywithalint-freetissueandexaminethecapfor
scratchesordiscoloration• Removethecapfromthesensorandmakesurethatthereisnowaterinsidethecap,theoptical
windowiscleanandcleartheO-ringsareintactandhaveathincoatingofsiliconegreaseandthespringcontactsareundamaged
• Ifreadingscontinuetobeerraticandunstable,areplacementofthecapmaybenecessary.

v
Error messages are displayed next to the warning triangle and are described in the Operating Instructions. 7. Reporting of results A minimum of three, preferably five, parallels should be done of each variable. The results from the dissolved oxygen analysis should be registered in FOR13020 Shelf Life Test Result Form and a report should be written (normally an overall report is written for a chemical and sensory shelf life test). Statistical analysis where the results are tested for significance on 95% level (e.g. ANOVA General Linear Model (GLM)) should be done. 8. Specification There is no specification of the dissolved oxygen content in products. 9. Validation This method is not validated internally. 10. References
• MettlerToledoSevenGoproTM/OptiOxTMOperatingInstructions• FOR13020ShelfLifeTestResultForm
11. Revisions This method has been revised because the Micro O2 logger is replaced by the Mettler Toledo SevenGo proTM SG9 instrument with InLab OptiOx optical dissolved oxygen sensor, which gives more stable readings without consumption of the product. 12. History
Created date: 2005-12-20 Created by: Elin M. Johansen Revised date: 2011-12-14 Revised by: Elin M. Johansen
Created / modified Approved by / date:
Date: 2013-09-17 Date: 2013-09-17
Name: Elin M. Johansen Name: Jorunn Bjørnstad
Position: Laboratory engineer Position: Manager Food & Material Laboratories
Sign: Sign:
Responsible department: Food & Material Sciences

vi
13. Annex 1 Procedure for a 2-point calibration The second point of a DO calibration is done with a zero oxygen solution.
• Forthefirstpoint,followthestepsonhowtomakea1-pointcalibration,butdonotpressEnd.• Afterremovingthesensorfromthecalibrationtubeandrinsingthesensorwithde-ionizedwater,
placetheInLabOptiOxinazerooxygensolution.• Allowatleastfiveminutesforthesensortoequilibratepriortocalibration.• PressCAL
o Cal2appearsonthedisplayo Themeterendpointsaccordingtothepreselectedendpointmode,automaticallyafterthe
signalhasstabilizedorafterpressingREAD.Therelevantstandardvalueisshownonthedisplay.
• PressEndtoacceptthecalibrationandreturntosamplemeasuremento Thecalibrationresultisshownonthedisplay
• Torejectthecalibration,pressExit• Thoroughlyrinsethesensorunderrunningwaterandblotitdrywithalint-freetissue
If the sensor is sluggish or inaccurate after a zero point calibration, not all of the zero oxygen was removed from the sensor. A very thorough soaking and rinsing of the sensor in distilled water is required to remove all of the zero oxygen solution and restore the sensor performance
ATTACHMENT 2:
Head space gas analysis of O2 and CO2 by using Check Mate II
1. Why do we have this method? The purpose of the method is to analyze the concentration of O2 and CO2-gas in head space of Pure-Pak cartons. 2. When to use this method? The method is typically used in:
• Chemicalshelflifeanalysisofproducts.• AnalysisofeffectofN2-gasflushingofheadspaceafterfillinginasepticfillingmachines.• Analysisofgastightnessinheadspaceofcartons.• Possiblemicrobiologicalgrowthinproduct(productionofCO2).
Measuring range: 0 – 100% Zirkonia sensor (O2) accuracy: + 0.01% absolute in range below 1% + 1% relative in range above 1%

vii
Zirkonia sensor (O2) resolution: 0.1% absolute in range above 10% 0.01% absolute in range above 1% 0.001% absolute in range below 1% CO2 sensor accuracy: + 0.5% absolute + 1.5% of reading CO2 sensor resolution: + 0.1% absolute 3. Who to use this method? This method is used by personnel in Food & Material Science Department with the required competence. 4. Principle O2 (g) in head space and dissolved O2 in the product will aim for equilibrium. Dissolved O2 decrease over time as it takes part in degradation reactions in the product. This leads to a simultaneously decrease in head space O2. Analyzing head space O2 can therefore be used as a parameter in evaluation of chemical shelf life of a product over time and to evaluate gas tightness of cartons. In aseptic cartons, the head space is normally flushed with N2-gas directly after filling to a level below 5%. The effect of the N2-gas flushing can be evaluated by analyzing the head space oxygen content. If the product is contaminated by microorganisms, production of CO2 might occur. Analyzing head space CO2 can therefore be done as an initial test to investigate for microbial growth. This has to be confirmed by microbiological analysis of the product. 5. Equipment The Check Mate II instrument has a Zirkonia based O2 sensor and Non Dispersive Infrared CO2 sensor. Both sensors are compensated for temperature- and pressure in the soft ware. Sample volume: 6 ml Sample time: 10 sec Heating time (at start-up): 10 min Operating conditions: 0 to +45oC, less than 95% RH, non condensing. Storage conditions: -20 to + 60oC, less than 95% RH, non condensing. 6. How to perform? Check Mate II is based on an ‘all-in-one’ concept with a ‘state-of-the-art’ sensor technology. This means that the instrument perform self diagnostics and demonstrate normal user failures. No internal calibration is needed. An external calibration should be performed once a year by Nordic Supply AS.
1. Beforestartingwiththeanalysis,itshouldbecheckedthattheneedle,tubingandfilersarecorrectlyattachedtotheinstrument.

viii
2. Theinstrumentisnormallysetto‘sleepmode’whenatestisfinished.Tostart-uptheinstrumentagain,pusharandombutton.Theinstrumentwillautomaticallystart.Aselftestandheatingisdone.Thistakesapproximately10minutes.
3. Performatestmeasurementofthesurroundingair.Theresultshouldbe20.9-21.0%O2and0.04%CO2.
4. PlacearoundseptumonthetopofthecartonasshowninpictureX.
5. Sticktheneedleintotheseptumandthecarton.Note:heldtheneedleinahorizontalpositionsothat
productisnotsuckedupandintotheinstrument.
6. Pushthestartbutton.
7. Theresultmightbestoredintheinstrument,butisnormallywrittendownbytheoperator.
8. Theinstrumentisnormallysetto‘sleepmode’inthemenuwhenatestisfinished.
9. Theinstrumentiscalibratedexternallyonceayear.TheplanforthenextcalibrationcouldbefoundintheJournalofmaintenanceforthechemicallaboratory.
7. Reporting of results The results should be reported in FOR13020 Shelf life test result form. ANOVA analysis (e.g. General Linear Model) should be done on the results to evaluate possible significant differences on 95% level between the variables throughout the storage period. The head space gas analysis of O2 and CO2 is normally a part of a chemical shelf life test, and the results are included in a final report together with the other results from the test. 8. Specification For aseptic cartons flushed with N2-gas the concentration of head space O2 should be less than 5%. For all cartons in a shelf life test, the concentration of head space O2 should decrease over time, otherwise the carton might not be gas tight. 9. Validation This method is not validated internally. 10. References
• CheckMateIIBrugerguide05/2009,PBIDansensor 11. Revisions This method has been revised because the Varian CP-4900 Micro-GC has been replaced by the check Mate II instrument. Check Mate Ii has been proven to give faster readings and the instrument needs less maintenance than the Micro-GC.

ix
12. History Created date: 2005-12-23 Created by: Anne Ebbesen Revised date: 2011-12-14 Revised by: Elin M. Johansen
Created / modified Approved by / date:
Date: 2013-09-16 Date: 2013-09-16
Name: Elin M. Johansen Name: Jorunn Bjørnstad
Position: Laboratory engineer Position: Manager Food & Material Laboratories
Sign: Sign:
Responsible department: Food & Material Sciences
ATTACHMENT 3:
VITAMIN C (ASCORBIC ACID) IN JUICES
1. Why do we have this method? This method is used to analyze the content of vitamin C (in this method designated as ascorbic acid) in fruit juices. Vitamin C content is an important quality parameter in juices as it will be degraded in presence of oxygen. The process is dependent on temperature and time. Vitamin C analysis is an important analysis in chemical shelf life studies of fruit juices. 2. When to use this method? This method is used to determine ascorbic acid content in single strength juices and reconstituted concentrates provided they do not contain ferrous Fe, stannous Sn, cuprous, sulfite or thiosulfate ions. 3. Who to use this method? This method is to be used by personnel in Food & Material Science Department with required competence. 4. Principle
x
Ascorbic acid reduces oxidation-reduction indicator dye, 2,6-dichlorophenol-indophenol, to colorless solution. At endpoint, excess unreduced dye is rose ping in acid solution. Titration is performed in presence of meta-phosphoric acid solution to avoid auto-oxidation of ascorbic acid at high pH. Linear Range1: 5 – 50 mg/100 ml Detection limit: 5 mg/100 ml Precision: 50 mg/100 ml, %RSD 0.11
25 mg/100 ml, %RSD 0.36 10 mg/100 ml, %RSD 0.96
Accuracy: 99% 1. Application book 716 DMS Titrino
5. Equipment 4 L glass beaker 2 L glass bottle 250 ml Erlenmeyer flask 150 ml glass beaker 500 ml (1000 ml) graduated flask 100 ml graduated flask Glass funnel Volumetric pipettes, 5 ml and 10 ml Measuring equipment Analytical balance Magnetic stirrer pH meter Titrator, Metrohm 716 DMS Titrino equipped with 730 Sample Changer Redox electrode, 6.0451.100 (Pt ring) or 6.0452.100 (Au ring) The titrator and the keyboards connected to it and the sample changer are presented in Appendix 1. 6. Reagents All reagents must be of analytical grade. Use only de-ionized water.
• meta-Phosphoric acid (Merck 1.00546.0500) • Vitamin C (L(+)-ascorbic acid, Merck 1.00127) • 2,6-Dichlorophenolindophenol sodium salt dihydrate (Merck 1.03028.0025) • Potassium hydroxide pellets (Merck 1.05029.1000) • De-ionized water
7. How to perform?
xi
7.1 Preparation of reagents (a) Acid solution
• Dissolve60gHPO3(meta-phosphoricacid)in4Ldistilled/de-ionizedwater.Usemagneticstirring.• AdjustpHto3.5-4.0withpotassiumhydroxidepellets.Add1tablespoonfulatfirst,andthenad1-
2pelletsuntilyouhavetherightpH.• Transferthesolutiontoaclosablecontainer. The solution remains satisfactory in refrigerator for 7-10 days
(b) Indophenol standard solution
• Dissolve0.500g2.6-DichlorophenolindophenolNa-saltinapproximately100mlde-ionizedwaterinanErlenmeyerflask.
• CovertheErlenmeyerflaskwithAlu-foiltopreventfumesandsplashing,andheatthesolutiontoabout60°Cundermagneticstirring.
• CoolthesolutiontoroomtemperaturestillcoveredwithAlu-foil.Thesolutionislightsensitive.• Filterthesolutionthroughablackribbonfilterintoa500mlvolumetricflask.Toensurethemost
accurateconcentration,useaspraybottlewithde-ionizedwaterto“wash”thefilter.• Makeuptovolumewithde-ionizedwater.Transferimmediatelytotheamberglassbottlethatis
connectedtothetitrator.• Replacethede-ionizedwaterintheburettewiththefreshsolutionbyemptyingtheburette3-4
times.Makesurethattheburettetipisplacedinawastebeaker.Theburetteisemptiedbypressingdownthe“DOS”buttononthetitrator.Refilltheburettebypressing“START/fill”,andrepeattheprocedure.TheDOSdispensingratecanbecontrolledbytheturningthedV/dtknobonthetitrator(10ismax).
Make a fresh solution each time, do not store. Empty the burette of indophenol solution after use. The solution can crystallize and damage the piston and glass and thus cause inaccurate. Fill the burette with de-ionized water.
(c) Standard ascorbic acid solution
Hint: 500 ml indophenols standard solution is usually enough in most shelf-life studies (up to 12 samples). If more than 12 samples are to be tested, 1000 ml of the solution should be made
Hint: Take precautions against inhalation of the fine powder. Use protective gloves and safety goggles!
Hint: If crystallization is observed in the burette, it can be washed with ethanol.

xii
Weigh exactly 50 mg (0.050 g) pure ascorbic acid and transfer quantitatively into a 100 ml volumetric flask. Dissolve and make up to volume with acid solution. Make the solution just before standardization. Do not store.
7.2 Preparations of the Metrohm 716 DMS Titrino titrator and the 730 Sample Changer
• Controlthatthecanistercontainsenoughde-ionizedwaterfortheautomaticrinsinginbetweenthesamples.
• Placetheburettetipinthecorrectpositioninthetitrationhead.• Controlthattheelectrodecontainsenoughelectrolyte.Theliquidlevelshouldreachtoapprox.0.5cm
underneaththeelectrolytefillhole.• Rinsetheelectrodewithde-ionizedwaterandcheckthePt-orAu-ringforoxidation.• Rubtheringanddiaphragmcarefullywithawetsofttissuetoremovepotentialresidue.• Placetheelectrodeinthetitrationhead.
7.3 Standardization of indophenol solution
• Transferbyusingafullpipette5mlofascorbicacidsolutionintoa150mlbeakerandaddacidsolutionuntil the beaker contains approximately 140ml liquid.Make sure that the liquid level is above thediaphragmontheelectrode.
• Placeabeakerwithapprox.120mlde-ionizedwaterintorackposition16.• Choosemethod“STANDARD”bypressing“usermeth”onthekeypad.“>recallmethod”appearsinthe
display.Press“enter”andrepeatpressing“select”until“STANDARD”appearsinthedisplay,thenpress“enter”again.Thelightfor“statisticson”willappear.
• Titraterapidlytheascorbicacidsolutionbypressing“START”ontheSCcontrollerkeypadconnectedtothesamplechanger.Alwaysrunthesampleintriplicate.Theaverageofthesethreesamplesisthedyetiter. Verify the number of samples registered in the sample changer by pressing “PARAM” until“numberofsamples:X”appears.(Xisthenumberofsamples,max15).Changethenumberofsamplesbyenteringthecorrectnumberand“ENTER”.
Calculation of dye titer: This calculation is done automatically by the Titrino, since it’s stored in the STANDARD method. Dye titer (factor) = T = CO1/EP1 Where CO1 = 2.5 (mg ascorbic acid) EP1 = the number of ml of indophenol solution Formula entered in saved titration method: RS1 = CO1/EP1
Sample validation: To ensure that the juice measurements give accurate values, it is recommended to test the instrument against a defined sample of ascorbic acid. An addition of 10 mL standard in a beaker should give 50 mg/100 mL ascorbic acid. It is recommended to test this sample together with the juice samples.

xiii
7.4 Ascorbic acid in juice
• Take out 10 ml sample by using a full pipette and transfer to a beaker. Add acid solution to approximately 120 ml. It is important that the liquid level is above the diaphragm on the electrode. Run two parallels from each carton.
• Choosemethod“VitC”bypressing“usermeth”onthekeypad.“>recallmethod”appearsinthedisplay.Press“enter”andrepeatpressing“select”until“VitC”appearsinthedisplay,thenpress“enter”again.Thelightfor“statisticson”willdisappear.
• Press “C-fmla” and enter the dye titer result from the standardization (CO1). Press “enter” and “CO2: 10” will appear in the display. Press “enter” again or “QUIT” to exit.
• Verifythenumberofsamplesregisteredinthesamplechangerbypressing“PARAM”until“numberofsamples:X”appears.(Xisthenumberofsamples,max15).Changethenumberofsamplesbyenteringthecorrectnumberand“ENTER”.
• Titrate immediately with indophenol solution by pressing “START” on the on the SC controller keypad connected to the sample changer.
Calculation, Content of ascorbic acid in mg/100 ml juice The ascorbic acid content is calculated by the Titrino when the formula is stored in the method. mg ascorbic acid/ 100 ml juice = T * EP1 * 10 Where
T = Mean dye titer from standardization EP1 = the number of ml of indophenol solution
Formula entered in the saved titration method: RS1 = CO1·EP1·CO2
Where
CO1 = Mean dye titer from standardization CO2 = 10 EP1 = the number of ml of indophenol solution
Hint: The titrator will automatically start with the sample in position 1. If the first sample is placed in another position, the start position can be entered manually by pressing “SAMPLE” or “7” on the SC controller keypad, then enter the position of the first sample. Confirm by pressing ENTER.
Hint: Prior to titration of samples with high ascorbic acid concentrations, the start volume can be altered, in order to save time. This is done by pressing “parameters” on the DMS Titrino Keyboard and pressing “enter” until “start V” appears for the second time. The desired start volume is entered and confirmed by pressing “enter”. Press “QUIT” to exit.
xiv
8. Reporting of results A minimum of three, preferably five, parallels should be done of each variable. The results from the ascorbic acid analysis should be registered in FOR13020 Shelf Life Test Result Form and a report should be written (normally an overall report is written for a chemical and sensory shelf life test). Statistical analysis where the results are tested for significance on 95% level (e.g. ANOVA General Linear Model (GLM)) should be done. 9. Specification There is no limit for the vitamin C/ascorbic acid content in fruit juices according to Commission Directive 2009/106/EC, but many customers have declared their own limit on the cartons. 10. Validation This method is not validated internally. 11. References
1. Applicationbook716DMSTitrino2. VitaminCinVitaminPreparationsandJuices,AOAC967.213. Fruits,vegetablesandderivedproducts–Determinationofascorbicacidcontent,ISO6557/2-1984(E)4. DeterminationofL-Ascorbicacid,IFUMethod175. CommissionDirective2009/106/ECof14August2009amendingCouncilDirective2001/112/ECrelating
tofruitjuicesandcertainsimilarproductsintendedforhumanconsumption.6. FOR13020ShelfLifeTestResultForm
12. Revisions This method has been revised to better explain the performance of Metrohm 716 DMS Titrino. 13. History
Created date: 2002-07-26 Created by: Anne Ebbesen Revised date: 2011-12-14 Revised by: Elin M. Johansen
Created / modified Approved by / date:
Date: 2011-12-14 Date:
Name: Elin M. Johansen Name:
Position: Laboratory engineer Position:

xv
Sign: Sign:
Responsible department: Food & Material Sciences
Appendices 1. Titrator, Methrom 716 DMS Titrino set up The settings presented below are stored in the respective methods. They can be reentered by following the procedure described in the instruction manual p. 6, but choosing mode “MET” instead of “DET”, and “Ipol” instead of “pH”, as presented in the example. It is not necessary to perform the test titration described in the procedure, nor entering sample size. The report settings are “curve; full”.
ATTACHMENT 4:
Table X: Not measured by me, brix not the same as in thesis Analysis Value in
concentrate
Unit Value in 11,18 brix
diluted concentrate
Unit
Titrable acid ( pH 7
tart.a) (IFU Nr. 3)
55.63 g/kg 9.44 g/l
Titrable acid (pH
8,1 cit.a.) (IFU Nr.
3)
49.32 g/kg 8.37 g/l
Total acid pH 8,1
(IFU No. 3)
770.6 meq/kg 130.8 meq/l
L-malic acid (IFU
No. 21)
14.98 g/kg 2.54 g/l
Citric acid (IFU
No. 22)
49.01 g/kg 8.32 g/l
Iso-citric acid (IFU
No. 54)
399 mg/kg 68 mg/l
Ascorbic acid (IFU
No. 17a)
2172 mg/kg 369 mg/l
Sucrose (IFU No.
56)
268.3 g/kg 45.5 g/l

xvi
Glucose (IFU No.
55)
111 g/kg 18.8 g/l
Fructose (IFU No.
55)
121.1 g/kg 20.6 g/l
Potassium (IFU
No. 33)
12.04 g/kg 2.04 g/l
Sodium (IFU No.
33)
98 mg/kg 17 mg/l
Calcium (IFU No.
33)
604 mg/kg 103 mg/l
Magnesium (IFU
No. 33)
625 mg/l 106 mg/l
Phosphate (IFU
No. 35)
3361 mg/kg 571 mg/l
Total phosphorous
(P) (IFU No. 35)
1098 mg/kg 186 mg/l
Nitrate (IFU No.
48)
3 mg/kg traces
Proline (IFU No.
49)
3945 mg/kg 670 mg/l
ATTACHMENT 5: Table 8: Balanced ANOVA-analysis, 8*5 different EVOH samples stored for 8 weeks. ANOVA was conducted to examine the effect of the type of barrier imperfection on the vitamin C content in juice over 8 weeks, as well as the interaction effect of the type of barrier imperfection and storage time.
Source DF SS MS F P
Type of barrier
imperfection
(BI)
7 224,59 32,08 113,88 0,00
Week no. (WN) 4 5829,04 1457,26 5172,17 0,00
BI*WN 28 293,99 10,50 37,27 0,00
Error 160 45,08 0,28
Total 199 6392,70
S: 0,53 (Model description of response) R^2: 99,12% (Variation in response explained by the
model)

xvii
Table 9: Balanced ANOVA-analysis, 8*5 different EVOH samples stored for 8 weeks. ANOVA was conducted to examine the effect of the type of barrier imperfection on the dissolved O2 content in juice over 8 weeks, as well as the interaction effect of the type of barrier imperfection and storage time.
Source DF SS MS F P
Type of barrier
imperfection
(BI)
7 12,53 1,79 13,13 0,00
Week no. (WN) 4 50,16 12,54 91,92 0,00
BI*WN 28 12,76 0,46 3,43 0,00
Error 160 21,83 0,14
Total 199 97,28
S: 0,37 R^2: 72,09%
Table 10: Balanced ANOVA-analysis, 8*5 different EVOH samples stored for 8 weeks. ANOVA was conducted to examine the effect of the type of barrier imperfection on the headspace Oxygen concentration in a juice carton over 8 weeks, as well as the interaction effect of the type of barrier imperfection and storage time.
Source DF SS MS F P
Type of barrier
imperfection
(BI)
7 814,80 116,40 84,08 0,00
Week no. (WN) 4 108,03 27,01 19,51 0,00
BI*WN 28 332,09 11,86 8,57 0,00
Error 160 221,50 1,38
Total 199 1476,43
S: 1,17 R^2: 81,34%
Table 11: Balanced ANOVA-analysis. 2*5 aluminum and EVOH barrier cartons. ANOVA conducted to find possible material effect on vitamin C content in in juice stored in gable top cartons with no barrier imperfections, over 8 weeks storage.
Source DF SS MS F P
Type of barrier
imperfection
(BI)
1
118,58 118,58 504,09 0,00
Week no. (WN) 4 806,45 201,61 857,07 0,00
BI*WN 4 9,50 2,37 10,09 0,00
Error 40 9,41 0,24
Total 49 943,93

xviii
S: 0,49 R^2: 98,78%
Table 12: Balanced ANOVA-analysis. 2*5 aluminum and EVOH barrier cartons. ANOVA conducted to find possible material effect on headspace oxygen concentration in gable top cartons with no barrier imperfections, over 8 weeks storage.
Source DF SS MS F P
Type of barrier
imperfection
(BI)
1
56,47 56,47 140,72 0,00
Week no. (WN) 4 562,69 140,67 350,56 0,00
BI*WN 4 12,01 3,00 7,48 0,00
Error 40 16,51 0,40
Total 49 647,22
S: 0,63 R^2: 96,96%
Table 11: Balanced ANOVA-analysis. 2*5 aluminum and EVOH barrier cartons. ANOVA conducted to find possible material effect on vitamin C content in in juice stored in gable top cartons with 500 µm holes in gas barrier, over 8 weeks storage.
Source DF SS MS F P
Type of barrier
imperfection
(BI)
1
5,54 5,54 15,93 0,00
Week no. (WN) 4 1284,00 321,00 923,22 0,00
BI*WN 4 9,41 2,35 6,77 0,00
Error 40 13,91 0,35
Total 49 1312,86
S: 0,59 R^2: 98,70%
Table 12: Balanced ANOVA-analysis. 2*5 aluminum and EVOH barrier cartons. ANOVA conducted to find possible material effect on headspace oxygen concentration in gable top cartons with 500 µm holes in gas barrier, over 8 weeks storage.
Source DF SS MS F P
Type of barrier
imperfection
(BI)
1
4,57 4,57 5,64 0,00
Week no. (WN) 4 8,24 2,06 2,54 0,00
BI*WN 4 5,16 1,29 1,59 0,00
Error 40 32,40 0,81
Total 49 50,36

xx