effect of foreign direct investment and exchange rate on
TRANSCRIPT

1
Effect of Foreign Direct Investment and Exchange Rate on Economic
Growth in Nigeria
By
1George, A., KOKUMO-OYAKHIRE.
2Monday, O., OLEGHE. 3Grace, A., IGELE.
1M.Sc Finance Student at University of Benin, Edo State. Email: [email protected].
Mobile Number: 07061807598 _____________________________________________________________________________
Abstract
Various empirical studies on foreign direct investment (FDI) and exchange rate on Nigeria’s economic growth have yielded indefinite results. However, we did not come across any study that examined the relationship between FDI and exchange rate on Nigeria’s Economic growth. The low level of FDI into Nigeria during the recession of 2016 and the significant fall in the value of the Naira motivated this study. The ordinary least squares regression technique was employed to estimate the relationship between Nigeria economic growth as measured by her gross domestic product and the value of FDI, exchange rate and inflation rate using time series data from 1981 to 2010. The analysis started with the test of statistical significance of the variables there after, testing for Auto-correlation of the independent variables was carried out. Diagnostic Criteria results showed that the model used was linear and statistically significant. The regression results showed that economic growth in Nigeria is influenced positively and significantly by foreign direct investment and exchange rate amongst other variables that were not measured in the study but were measured by other researched as stated in the empirical review of literature, like the market size of the host country, deregulation, and political instability.
Key Words: Foreign Direct Investment, Exchange Rate, Gross Domestic Product, Nigeria. 1. INTRODUCTION
The role of foreign direct investment (FDI) in the development of Nigerian economy cannot be over emphasized. It provides capital for investment, enhances job creation and managerial skills, and possibly technology transfer (Obida & Nurudeen, 2010). A fixed exchange rate system also called a pegged exchange rate is one in which exchange rates are maintained at fixed levels. In this system, most countries tend to fix its currency against another currency or to another measure of value, such as gold. As in the case of Nigeria, the United States Dollar (USD). A fixed exchange rate regime is normally used to stabilize the value of a currency by directly fixing its value in a predetermined ratio to a different, more stable (as in the case of developing economies) or more internationally prevalent currency (or currencies), to which the value is pegged. In doing so, the exchange rate between the currencies would not change based on market conditions, as in the case of floating currencies. This makes trade and investments between the two currency areas easier and more predictable. In Nigeria, the term foreign exchange has become a house hold expression due to the activities of the street hawkers of this very fundamental commodity. The quantum of foreign exchange available at any point in time constitutes foreign exchange resources or restores. The volatility and continued depreciation of exchange rate of the Naira is principal caused by the expansionary liquidity and the resultant persistent excess liquidity in the banking system supply of inelastic of both domestic production and the foreign exchange market with its further destabilizing speculative activities need to be managed ineffectively (GT Bank, 2015).

2
In Nigeria, 1986 marked the beginning of deregulation era. In an attempt to create a suitable friendly environment for investment and growth in economy, the Nigerian government introduced the structural adjustment programme (SAP) in July 1986. The programme incorporated trade and exchange reforms reinforced by monetary and fiscal measures that enabled diversification in the economy’s mono-export base. The SAP was expected to improve the economy more especially, the sharp exchange rate depreciation which was anticipated to discourage importation and make export oriented multinational gain on their investment. During this period, Nigerian economy recorded wide instability in exchange and inflation rate uncertainly up till 2010. After the introduction of SAP, there were intense political conflicts in the country and this paralyzed every sphere of the Nigerian economy. This development limited the achievements of the reform programme under SAP. This era was characterized by the era of military rule in the country. The return of democracy on May 29, 1999 raised hopes of redressing socio-economic damages of the military rule (Njogo, 2013). Since the 1980s, flows of investment have increased dramatically all over the world. Total world outflows of capital in that decade grew at an average rate of almost 30 percent, more than three times the rate of world exports at that time, with further growth experienced in the 1990s (Kosteletou & Panagiotis, 2000). Despite the increased flow of investment to developing countries, Olumuyiwa (2003) stated that most Sub-Sahara African (SSA) countries still lag behind other regions in attracting foreign direct investment (FDI). Since the move to floating exchange rate system in 1973, the effects of dramatic movement of exchange rate have continued to generate series of responses. Many analysts of international economics concur that the generalized floating of system in operation since the post Bretton Wood period have engendered substantial volatility in both developed and developing economies. Following the collapse of the pre-1973 system, exchange rates fluctuated beyond book-makers’ expectation. At firm level, exchange rate movements and its volatility can mean the difference between prosperity and close down of naturally competitive firms, depending on the level of exchange rate pass-through (Olumuyiwa, 2003). In the opinion of Murtala (2017), foreign direct investment (FDI) is perceived to have a positive impact on economic growth of a host country through various direct and indirect channels. It augments domestic investment, which is essential to the realization of continuous economic growth and development. Nigeria’s foreign investment can be traced back to the colonial era, when the colonial masters had the intention of exploiting resources for the development of their economy. There was little investment by these colonial masters with the research and discovery of oil, but since then, Nigeria’s foreign investment has not been stable. The Nigerian governments have recognized the importance of FDI in enhancing economic growth and development (Macaulay, 2011). Since Nigeria became a democratic republic in 1999, the government has taken a number of measures crucial to attract foreign investors into Nigeria. According to Shiro (2009), these measures includes the repeal of laws that are inimical to foreign investment growth, promulgation of investment laws, various oversea trips for image laundry by the country presidents among others. One of the many influences on FDI activity is the performance of exchange rates. Exchange rate is determined by how many unit of a domestic currency can be change with another nation’s currency unit. The demand and supply of currency actually are the main element of exchange rate instability in the case of a floating exchange rate. Exchange rate instability directly affects the decision makers to decide how much import and export is favorable or otherwise. It also tells that how much things should be manufactured, imported, exported, money taken reserve and balance of payment. Exchange rates can influence both the total amount of foreign direct investment that takes place and the allocation of this investment spending across a range of countries (Javed & Farooq, 2009). The following hypotheses for this research are stated in the null form: I. There is no relationship between FDI and GDP
II. Exchange rate does not a significant effect on GDP

3
Data availability has always been the main limitation of most research works, and this study is not an exception. Data collected from Central Bank of Nigeria and National Bureau of Statistics and even various volumes of Statistical Bulletins sometimes conflict with one another especially in the area of GDP. Despite these limitations, the correctness and significance of this study are not affected. 2. LITERATURE REVIEW
Foreign Direct Investment
Yang, Groenewold, and Tcha (2000) concluded that interest rate and inflation were positive and significant to FDI. Other variables such as host GDP, exchange rate and transport costs were not found to be significant at all, while the coefficient on wage rate changes, openness and industrial disputes even had an unexpected sign.
Iyoha, (2001) in his economic study of the main determinants of foreign investment in Nigeria, examined the effects of microeconomic instability and uncertainty, economic size and external debt on foreign direct investment inflows. The result shows that market size attracts FDI to Nigeria whereas inflation discourages it. In contrast to this, Dinda (2008) used time series econometric technique on annual data of Nigeria in examining the effect of the country’s natural resource export, along with openness, market size and microeconomic risk variables like inflation and foreign exchange rate on FDI inflow during 1970-2006 and was of the opinion that in a long run, market size is not the significant factor for attracting FDI to Nigeria and this contradicts the existing literature. Isabel (2005) in conformity with Iyoha (2001) found out that market size makes Australia a more attractive place to invest and FDI is driven by longer term considerations and its determinants could not be fully explained by any single theoretical model. Olajide, (2010) used OLS in examining foreign direct investment and its determinants in an open economy and found out that Nigerian’s potential market size, the degree of export orientation human capital, providing enabling environment through the provision of infrastructural facilities, and macroeconomic stability are important determinant of FDI flows. Also, government consumption expenditure, openness to international trade and human capital are complementary to economic growth. In Nigeria, it has been observed that, the rate of FDI inflow is low despite incentives been offered to foreign investors. Many Foreign investors are adamant to come to Nigeria. This may not be unconnected to the lingering problem, the Boko-Haram issue that constitutes general insecurity in the country at the movement and of course the enveloping indiscipline that is becoming the order of the day in the Nigerian economy (Njogo, 2013). Exchange Rates
Exchange rate means how much of nations domestic currency can be changed for one unit of another nations’ currency. Simply it is change of one country currency into the other country currency. The demand and supply of currency actually are the main element of exchange rate instability. Exchange rate instability directly affects the decision makers to decide how much import and export is favourably (Javed & Farooq, 2009). Exchange rate movements and exchange rate uncertainty tend to be important factors investors consider in their decision to invest abroad. It has been observed that country with weak currency attracts FDI inflows. If the exchange rate of a country depreciates, it attracts FDI since foreign firms may merge with or acquire domestic industries (Masayki and Ivohasinam, 2005). Evidences have over the years shown that despite significant increase in the flow of foreign direct investment to developing countries, Sub-Saharan Africa countries have continued to be at disadvantage in terms of proportion of flow into the region. Olumuyiwa (2003) estimated the relationship between the behavior of exchange rate, as one of the most important anchor of recent

4
global economic process, and foreign direct investment (FDI) with respect to Nigeria. He concluded that parallel market exchange rate is an important driver of real economic process in Nigeria. Empirical Review On FDI and Economic Growth
These reviews are on studies that have being carried out on developing countries due to the fact that Nigeria is a developing country. It focuses on the relationship between FDI and Economic growth. Borensztein, De Gregrio, and Lee (1998), studied how FDI affects Growth with particular reference to developing countries. The main regression results indicate that FDI has a positive and significant overall effect on economic growth, although the magnitude of the effect depends on the stock of human capital available in the host economy. The cross-country regression also shows that FDI exerts a positive effect on domestic investment. They have observed that the direct effect of FDI differs for countries depending on each country’s level of human capital development. Saqib, Masnoon & Rafique (2013) studied the impact of Foreign Direct Investment on Economic Growth of Pakistan for the period 1981 to 2010. Using five variables, with GDP as their dependent variable while FDI, Total debt Service, Gross Domestic Savings, Inflation, as independent variables. Findings from the study indicated that FDI and dependent variable (GDP) have a negative and significant relationship. Also Debt, Inflation and Trade exhibited negative relationship with GDP. They further stated that Domestic Investment will be more beneficial and that dependency on FDI should be limited. They recommended that the Government should encourage domestic savings and investment. However, the opposite was the case in Malaysia when Wai-Mun, Kai-Lin, and Kar-Mun (2008) did a study to establish FDI and Economic Growth Relationship in Malaysia. They employed the Augmented Dickey-Fuller (ADF) Unit root tests, Phillips-Peron (PP) test and Ordinary Lest Square (OLS) regression analysis and the results showed that there is a positive and significant relationship between FDI and economic growth in Malaysia. Thereafter, recommending government to encourage FDI, but should also adopt policies to encourage domestic producers to adopt the technology brought in through FDI. In Africa, particularly Ghana, Antwi, Atta-Mills, Atta-Mills, & Zhao (2013) did an empirical study on the impact of FDI on economic growth of Ghana. They used simple Ordinary Least Squares (OLS) regressions and concluded that FDI has continued to play a positive significant role in economic growth of Ghana. They advised that government should encourage the inflow of FDI which brings with it capital inflow, technology transfer and creation of employment. Macaulay (2011) was able to study FDI and the performance of the Nigerian Economy. He was of the opinion that FDI has a positive significant effect on economic growth, but observed that FDI has a negative impact of capital flight. Onu (2012) studied the impact of FDI on Economic Growth in Nigeria for the period 1986-2007. Employing the multiple regression analysis to determine the impact of FDI on economic growth in Nigeria, he however concluded that FDI is an engine of economic growth. And that the great potentials of FDI for accelerating the pace of economic progress of Nigeria cannot be over emphasized. Empirical Review On Exchange Rate and Economic Growth
Thomas, (1997) in his study of 86 developing countries examined data on terms of trade, real exchange rates, and property rights and concluded that while factors including credit, availability and the quality of physical and human infrastructure are important influences, uncertainty in the foreign exchange rate was negatively related to private investment in sub-Saharan countries. Elijah and Festus (2008) examined the effect of exchanged rate volatility and inflation uncertainty on foreign direct investment in Nigeria for the period of 1970-2005. Using the GARCH model, the estimated results indicated that exchanged rate volatility and inflation uncertainty exerted significant

5
negative effect on foreign investment during the period. In addition, the results show that infrastructure development, appropriate size of the government sector and international competitiveness are crucial determinants of FDI inflow to the country. Bakare (2011) carried out an analysis of the consequences of the foreign exchange rate reforms on the performances of private domestic investment in Nigeria. Using ordinary least square multiple regression analytical method and testing the statistical significance of the variables (private domestic investment, Floating exchange rate system as the ratio of Nigeria currency in term of US dollar, Nominal public investment as a percentage of nominal GDP, Infrastructures: proxied by power supply, savings Rate), results showed that there was a significant but negative relationship between floating foreign exchange rate and private domestic investment in Nigeria. He however concluded that there is the need for the government to dump the floating exchange regime and adopt purchasing power parity which has been considered by researchers to be more appropriate in determining realistic exchange rate for naira and contribute positively to macroeconomic performances in Nigeria. In finding out the relationship between foreign exchange rate and foreign direct investment (FDI) and the impact of FDI on the gross domestic product (GDP) in Nigeria, Murtala (2017) analyzed data of FDI, exchange rate, and GDP obtained from the Central Bank of Nigeria (CBN) website using regression and correlation analysis techniques. Findings from the analysis show that there is a strong positive relationship between FDI and exchange rate in Nigeria on one hand and there is a weak positive relationship between FDI and GDP on the other hand. He also found that there was a significant inflow of FDI from 2005-2014 due to raise in exchange rate in the same period. The study concludes that exchange rate, FDI, and GDP are positively correlated. Ali, Mohamed and Zahir (2017) carried out a research on the Impact of Change in Exchange Rate on Foreign Direct Investment in Somalia. In explaining the influence of exchange rate on foreign direct investment in Somali, they applied multiple regression models under OLS method. The results showed that there is a negative and significant relationship between exchange rate and FDI, while, a positive and significant relationship is observed between inflation and domestic investment on FDI, and a negative but insignificant relationship is observed between lack of government and FDI. It was however recommended that there is need for the government to retain tight monetary and fiscal policies in order to stable exchange rate in the Somalia. 3. METHODOLOGY
This study consists of the following variables: Foreign Direct Investment, exchange rate, Inflation rate and Gross Domestic Product. Where FDI, exchange rate and inflation rate are the Independent variables and GDP is the dependent variable. Foreign Direct Investment (FDI): Foreign direct investment as an independent variable using data from Central Bank of Nigeria Statistical bulletin. Exchange rate (EXR): Obtained from Central Bank of Nigeria, this measures the worth of the Naira in terms of US dollar from 1981 to 2010. It is necessary in order to show how the strength of Nigeria’s currency affects her GDP. Inflation Rate (INFR): This would serve as a control variable. It is held constant in order to assess or clarify the relationship between the other variables. This variable is particularly not of interest to this research but it however relates to the dependent variable. Gross Domestic Product (GDP): This is measured as the real gross domestic product (RGDP). It measures the size of the Nigerian economy after adjustments for inflation. Research Design
This study adopts the Ex-post facto method of research. This is because data needed for analysis already exists. The study will cover Nigeria‘s economy with time series rather than cross-sectional data being used. Model specification
To examine the impact Foreign Direct investment and exchange rate has on the economic growth of Nigeria; this study employed descriptive statistics to analyze the trend and flows of the variables.

6
Ordinary least square statistical technique is adopted because it is simple and gives the best linear unbiased estimates. The functional form of the model is: GDP = ƒ ( FDI, EXR, INFR)
The model expressed as an econometric function is thus: GDP = β0 + β1FDI + β2EXR + β3INFR + U
Where FDI, EXR, INFR and GDP are defined above β0 = constant U = error term. β1, β2, β3, are the coefficient of the parameter estimate. This model was adapted from Ali, et al. (2017) as stated below: FDI = β1 + β2ER + β3INF + β4GCF + αLG + ε
Where: FDI: foreign direct investment inflow. INF: GDP deflator. GCF: gross capital formation LG: dummy variable lack of government ε: Error term A-priori Expectations
From the model, the a-priori expectation may be mathematically denoted by: β1>0, β2>0 and β3>0
It is expected that Foreign Direct Investment will have a positive impact on Gross domestic product. Thus, the coefficient of Foreign Direct Investment might be positive i.e. β1>0. We also expect Exchange rate to have a positive relationship with Gross domestic product. Thus, the coefficient of exchange rate might be positive i.e. β2>0. Data for the study was sourced secondarily from the publications of the Central bank of Nigeria (CBN) like the Statistical Bulletin, Bullions, Occasional Papers, Economic and Financial Review, Annual Report and Statistics for the period of 30 years (1981-2010). 4. Data Presentation And Analysis
Descriptive Statistics
RGDP FDI EXR INFR
MEAN 7532.496 1221.167 56.11090 21.13800 MEDIAN 3448.405 78.30000 21.88610 13.36000 MAXIMUM 54612.26 9088.800 150.2980 72.80000 MINIMUM 94.33000 0.150000 0.610000 5.400000 STD. DEV. 11651.52 2543.823 58.24855 18.06714 SKEWNESS 2.503502 2.030812 0.457545 1.367507 KURTOSIS 9.997495 5.840852 1.385623 3.876178
JARQUE-BERA 92.54377 30.70903 4.304503 10.30999 PROBABILITY 0.000000 0.000000 0.116222 0.005771
SUM 225974.9 36635.00 1683.327 634.1400 SUM SQ. DEV. 3.94E+09 1.88E+08 98393.91 9466.225 OBSERVATIONS 30 30 30 30

7
Table 4.1: Descriptive Statistics for the model. Source: Eviews 2017
Unit Test Result at Level
RGDP
Null Hypothesis: RGDP has a unit root Exogenous: Constant Lag Length: 3 (Automatic - based on SIC, maxlag=7)
t-Statistic Prob.* Augmented Dickey-Fuller test statistic 6.893214 1.0000
Test critical values: 1% level -3.711457 5% level -2.981038 10% level -2.629906 *MacKinnon (1996) one-sided p-values.
Table 4.2: Unit Test Result at Level for GDP. Source: Eviews 2017
RGDP does not have a unit root problem as test statistics is greater than the critical value at all levels. FDI
Null Hypothesis: D(FDI) has a unit root Exogenous: Constant Lag Length: 0 (Automatic - based on SIC, maxlag=7)
t-Statistic Prob.* Augmented Dickey-Fuller test statistic -3.460554 0.0171
Test critical values: 1% level -3.689194 5% level -2.971853 10% level -2.625121 *MacKinnon (1996) one-sided p-values.
Table 4.3: Unit Root Test at First Difference For FDI. Source: Eviews 2017
FDI does not have a unit root problem as test statistics is greater than the critical value at 5% level (i.e absolute value). EXR
Null Hypothesis: D(EXR) has a unit root Exogenous: Constant Lag Length: 0 (Automatic - based on SIC, maxlag=7)
t-Statistic Prob.* Augmented Dickey-Fuller test statistic -5.038922 0.0003
Test critical values: 1% level -3.689194 5% level -2.971853 10% level -2.625121 *MacKinnon (1996) one-sided p-values.
Table 4.4: Unit Root Test at First Difference For EXR. Source: Eviews 2017
EXR does not have a unit root problem as test statistics is greater than the critical value at all levels (i.e absolute value).

8
INFR
Null Hypothesis: D(INFR) has a unit root Exogenous: Constant Lag Length: 1 (Automatic - based on SIC, maxlag=7)
t-Statistic Prob.* Augmented Dickey-Fuller test statistic -5.201932 0.0002
Test critical values: 1% level -3.699871 5% level -2.976263 10% level -2.627420 *MacKinnon (1996) one-sided p-values.
Table 4.5: Unit Root Test at First Difference For INFR. Source: Eviews 2017
INFR does not have a unit root problem as test statistics is greater than the critical value at all levels (i.e absolute value). The regression result of the data used in the analysis is presented below, which is in accordance with the model specified as stated earlier.
Dependent Variable: RGDP Method: Least Squares Date: 10/18/17 Time: 10:55 Sample: 1981 2010 Included observations: 30
Variable Coefficient Std. Error t-Statistic Prob. C 257.6593 1600.145 0.161022 0.8733
FDI 3.428106 0.399596 8.578938 0.0000 EXR 52.90583 18.04934 2.931178 0.0070 INFR 5.674837 44.44063 0.127695 0.8994
R-squared 0.892099 Mean dependent var 7532.496
Adjusted R-squared 0.879649 S.D. dependent var 11651.52 S.E. of regression 4042.096 Akaike info criterion 19.57048 Sum squared resid 4.251008 Schwarz criterion 19.75731 Log likelihood -289.5572 Hannan-Quinn criter. 19.63025 F-statistic 71.65420 Durbin-Watson stat 2.000550 Prob(F-statistic) 0.000000
Table 4.6: Regression result for the model. Source: Eviews 2017
Model Summary
RGDP = 257.6593C + 3.428106FDI + 52.90583EXR + 5.674837INFR (t= 0.161022) (t= 8.578938) (t= 2.931178) (t= 0.127695) Interpretation of Regression Results
The co-efficient of Determination, R-Squared (R2) and Durbin-Watson (DW) are used in the interpretation of Results. Our results would be interpreted at 3 levels as follows:
a. Diagnostic Criteria b. Econometric Criteria c. Individual Criteria

9
Diagnostic Criteria
Adjusted R2: The regression result as show in Table 4.1 indicates that 88 percent (88%) of the value of GDP (dependent variable) is caused by the independent variables. (Prob)F-Statistics: With the F-statistics of 71.65420, it means that the above result is statistically significant at a probability level of 0.00 with a 1% level of error. It however explains that the relationship between GDP and the independent variables are linear and the model stated earlier is useful.
Econometric Criteria
Durbin-Watson Statistics (DW): With a DW of 2.0, its shows that there is absence of auto-correlation in the regressed independent variables (FDI, EXR and INFR). Individual Criteria
1. GDP and FDI. A coefficient of 3.428106 indicates that there is a positive relationship between Gross domestic product and foreign direct investment. Therefore, a unit change in FDI tends to increase GDP by 34%. This is however significant at 1%. 2. GDP and EXR Exchange rate like foreign direct investment has a positive relationship with GDP, and accounts for over 54% increase in the value of GDP as compared to other variables. This result is however statistically significant at 1%. 3. GDP and INFR Results indicate that Gross domestic product and inflation rate have a positive relationship. A unit change in inflation rate tends to affect GDP by 56%. However, this result is not statically significant at 5%.
Discussion of Findings
As stated in the Apriori expectation, all independent variables where expected to have a positive relationship with Gross domestic product. Analysis of the result however shows that FDI, EXR and INFR have a positive relationship with GDP. Foreign Direct investment is an important determinate of Economic growth as measured by GDP because its accounts for at least 34% of the value of GDP in Nigeria between the time frame of this study. Macaulay (2011) is also of opinion that FDI has a positive and significant effect of economic growth in Nigeria. We however, reject the Null Hypothesis “There is no relationship between FDI and GDP” and accept the alternate. The Higher the value of FDI in Nigeria, the Higher tends to be the rate of her GDP assuming all things being equal. FDI reflects the situation in the Nigeria’s oil sector that has continued to attract more foreign investment regardless of the political situation in the country. Like FDI, exchange rate has a positive and significant relationship with economic growth in Nigeria as measured by RGDP. When Exchange rates are High (that is the value to which the Naira exchange to the USD is high) more foreigners tend to invest more in the country as they are able of buy more Naira with lesser USD. The Null hypothesis is however rejected subject to the results as showed above, and the alternate “Exchange rate has a significant effect on GDP” is accepted. This findings are in line with Bakare (2011), suggesting that a floating exchange rate has a negative impact on economic growth and suggested that a fixed exchange rate on the other hand would have a positive relationship with economic growth in Nigeria. 5. CONCLUSION AND RECOMMENDATIONS
Conclusion
This study has investigated the effect exchange rate and foreign direct investment has on economic growth in Nigeria for the period which spanned between 1981 and 2010. Using the Ordinary Least Square (OLS) techniques to ascertain the relationship between various macroeconomic variable and Economic growth in Nigeria, We have come to the conclusion that FDI and Exchange rate have a positive relationship with economic growth as measured by Real Gross domestic product (GDP), and tend to contribute towards economic growth in Nigeria.

10
Recommendations
To facilitate diversification of the economy, government should decentralized power and make polices that would task state governments in generating revenue for their states while taking advantages of the resources in each state. This would reduce the dependence of state government on Federal allocation. In a long run, this should create more industries, jobs and increase the value of our exports as well as contribute to economic growth and development. The government should create a favorable environment that would encourage a steady flow of foreign direct investment (FDI) and make complimentary policies that would ensure that Nigeria does not over rely on FDI to improve the economy. Government and domestic investors should be aware the increasing value of the Naira (Exchange rate) would also go a long way to improve the Nigeria economy domestically, despite the fact that FDI may also be needed. In a nut shell, we encourage a balance between FDI and internally generated economic growth.

11
REFERENCES
Ali, Y.S., Mohamed, I.,I, & Zahir, M.O. (2017). Impact of Change in Exchange Rate on Foreign Direct Investment: Evidence from Somalia. Journal of Economics and Sustainable Development. 8(8).
Antwi, Atta-Mills E., Atta-Mills G., & Zhao, X. (2013). Impact Of Foreign Investment On Economic
Growth: Empirical Evidence From Ghana. International Journal of Academic Research in Accounting, Finance and Management Science 3(1).
Bakare, A.S. (2011). The Consequences Of Foreign Exchange Rate Reforms On The Performances
Of Private Domestic Investment In Nigeria. International Journal of Economics And Management Sciences. ISSN: 2162-6359. 1(1), 25-31.
Borensztein, E., De Gregrio, & Lee, J.W. (1998). How Does Foreign Direct Investment Affect
Economic Growth? Journal of International Economics, 45. 115-135 Dinda, S. (2008). Role Of National Resource In Determining FDI Inflow To Nigeria During 1970-
2006. UNU-WIDER conference 2008 at Johannesburg, South Africa. Elijah, U. & Festus, O. (2008). Exchange Rate Volatility, Inflation Uncertainty And Foreign Direct
Investment In Nigeria. BOJE: Botswana Journal of Economic. 1 . GT Bank. (2015, February 23): Foreign Exchange in Nigeria. Retrieved from:
http://635.gtbank.com/2015/02/foreign-exchange-in-nigeria/ Isabel, F. (2005). Determinants Of FDI In Australia: Which Theory Can Explain It Best?. Retrived
from: Njogo, B., O. (2013). Foreign Direct Investment Determinants In Pre And Deregulated Nigerian Economy. Thesis Presented To The Department Of Banking And Finance, Faculty Of Business Administration, University Of Nigeria Nsukka, Enugu Campus.
Iyoha, M. A. (2001). An Econometric Study Of The Main Determinants Of Foreign Investment In
Nigeria. The Nigeria. Economic and financial review 6(2) December 2001. Javed, Z. & Farooq, M. (2009). Economic Growth And Exchange Rate Volatility In Case Of Pakistan.
Pakistan journal of life and social sciences, 2, 112-118. Kosteletou, N., & Panagiotis, L. (2000). Foreign Direct Investment and Real Exchange Inter linkages.
Open Economies Review 11: 135-48. Macaulay, E.D. (2011). Foreign Direct Investment And The Performance Of The Nigerian Economy.
Journal of Educational and Social Research 1(5) Masayuki, H. & Ivohasina, F. (2005). The Determinants of Foreign Direct Investment into Japan.
Retrived from: Njogo, B., O. (2013). Foreign Direct Investment Determinants In Pre And Deregulated Nigerian Economy. Thesis Presented To The Department Of Banking And Finance, Faculty Of Business Administration, University Of Nigeria Nsukka, Enugu Campus.
Murtala, Z. (2017). The Impact of Exchange Rate Fluctuations on Foreign Direct Investment in
Nigeria. Journal of Finance and Accounting. 5 (4), 165-170. doi: 10.11648/j.jfa.20170504.17 Njogo, B., O. (2013). Foreign Direct Investment Determinants In Pre And Deregulated Nigerian
Economy. Thesis Presented To The Department Of Banking And Finance, Faculty Of Business Administration, University Of Nigeria Nsukka, Enugu Campus.
Obida, G., W. & Nurudeen, A. (2010). Determinants of Foreign Direct Investment in Nigeria: An
Empirical Analysis. Retrieved from:

12
https://www.researchgate.net/publication/265627570_Determinants_of_Foreign_Direct_I vestment_in_Nigeria_An_Empirical_Analysis [accessed Oct 14 2017].
Olajide,S. (2010). Foreign Direct Investment (FDI) Determinants and Growth Effects in a Small
Open Economy. The International Journal of Business and Finance Research. 4(4). Olumuyiwa, B.A. (2003). Exchange Rate Uncertainty and Foreign Direct Investment in Nigeria.
Trade Policy Research and Training Programme (TPRTP) Department Of Economics University Of Ibadan. Ibadan Nigeria.
Saqib, N., Masnoon M. & Rafique. (2013). Impact of FDI on Economic Growth of Pakistan. Advances
in Management and Applied Economics 3(1) 35-45. Shiro, A. A. (2009). The Impact of FDI on the Nigerian Economy. Paper Delivered At The 2nd
National Conference Organized By The Department Of Finance, University Of Lagos, Lagos State. Retrieved from: www.unilag.edu.ng/researchview.
Thomas, R. L. (1997). Modern Econometrics, An Introduction. As Cited in: Bakare A.S. (2011). The
Consequences Of Foreign Exchange Rate Reforms On The Performances Of Private Domestic Investment In Nigeria. International Journal of Economics And Management Sciences. ISSN: 2162-6359. 1(1), 25-31.
Wai-Mun H, Kai-Lin, and Kar-Mun. (2008). FDI and Economic Growth Relationship: An Empirical
Study of Malaysia. International Business Research 1(2), 11-18, SSRN. Yang, J., Groenewold, N., & Tcha, M. (2000). The Determinants of Foreign Direct Investment in
Australia. Retrived from: Njogo, B., O. (2013). Foreign Direct Investment Determinants In Pre And Deregulated Nigerian Economy. Thesis Presented To The Department Of Banking And Finance, Faculty Of Business Administration, University Of Nigeria Nsukka, Enugu Campus.

13
APPENDIX I
VARIOUS DATA USED FOR THE ANALYSIS
Source: Central Bank of Nigeria Statistical Bulletin (2015)
YEAR RGDP FDI EXR INFR
1981 94.33 0.33 0.61 20.81
1982 101.01 0.29 0.67 7.7
1983 110.06 0.26 0.72 23.21
1984 116.27 0.36 0.76 17.82
1985 134.59 0.43 0.89 7.44
1986 134.6 0.15 2.02 5.72
1987 193.13 2.45 4.12 11.29
1988 263.29 1.72 4.54 54.51
1989 382.26 13.88 7.39 50.47
1990 472.65 4.69 8.04 7.36
1991 545.67 6.92 9.91 13.01
1992 875.34 14.46 17.3 44.59
1993 1,089.68 29.66 22.05 57.17
1994 1,399.70 22.2 21.87 57.03
1995 2,907.36 75.9 21.87 72.84
1996 4,032.30 111.3 21.87 29.27
1997 4,189.25 110.5 21.87 8.53
1998 3,989.45 80.7 21.87 10
1999 4,679.21 92.8 92.69 6.62
2000 6,713.57 116 102.11 6.93
2001 6,895.20 132.4 111.94 18.87
2002 7,795.76 225.2 120.97 12.88
2003 9,913.52 258.4 129.36 14.03
2004 11,411.07 248.2 133.5 15
2005 14,610.88 3,432.50 132.15 17.86
2006 18,564.59 4,007.50 128.65 8.24
2007 20,657.32 4,403.80 125.83 5.38
2008 24,296.33 6,041.80 118.57 11.58
2009 24,794.24 8,111.40 148.88 11.54
2010 54,612.26 9,088.80 150.3 13.72

14
Cross-border Expansion and Firm Performance: A Survey of Nigerian Banks
Godwin Chukwuka
Department of Accounting, Benson Idahosa University, Benin City _____________________________________________________________________________
Abstract This paper examines the performance of Nigerian banks that have expanded their business operations across the borders of Nigeria to other African countries in order to determine if there was any merit in undertaking cross-border expansion. The scope of the study covered a 14-year period from 2002 to 2015, which was divided into two segments: pre cross-border expansion era (2002 – 2008) and post cross-border expansion era (2009 – 2015). A representative sample of ten (10) quoted indigenous Nigerian deposit money banks: 5 cross-border banks and 5 domestic banks were purposefully selected. Two (2) research hypotheses were formulated to examine whether there are significant differences in the performance indicators of Nigeria’s cross-border banks prior to and after cross-border expansion; and whether there are significant differences between the performance indicators of Nigeria’s cross-border banks and those of their domestic counterparts. For each hypothesis, five (5) performance indicators, namely profitability, liquidity, share price growth, solvency and deposit growth were examined. With the aid of the Statistical Package for Social Sciences (SPSS), independent samples t-test was used to test the hypotheses. Although the study outcome shows that cross-border expansion has some positive effect on the profitability, liquidity and deposit growth of the studied Nigerian banks, it was concluded that mere venturing into cross-border expansion does not guarantee better firm performance. The study recommends, among other things, that cross-border banks should strengthen their supervision and performance evaluation systems in order to improve performance which will subsequently enhance share price growth and solvency.
Key words:
Cross-border expansion, firm performance, Nigerian banks, pan-African banks
INTRODUCTION Over the last seven (7) years, Nigerian banks expanded significantly across their borders. The 2005 Nigerian banking sector consolidation policy resulted in the emergence of twenty-four (24) well capitalised banks out of eighty-nine (89) banks that existed before the policy. Further reconsolidations have reduced the number of full-fledged deposit-money banks in Nigeria to twenty-one (21). With their strong capital base, these banks started expansion into other African countries by opening subsidiaries and in some instances foreign branches. According to Beck, Fuchs, Singer and Witte (2014), cross-border banking has become an increasingly important characteristic of African financial systems and this trend has rapidly increased in the past decade. African banks have not only significantly increased their geographic footprints on the continent, but have also become economically important beyond their home countries and of systemic importance in the continent. The existing literature has focused attention on the impact of cross-border banking on regulatory supervision and reforms. Lukonga and Chung (2010) studied the trends and features of Africa’s cross-border banks and analyzed the stability risks that the groups pose. Moreover, Kodongo, Natto and Biekpe (2014) investigated the drivers of cross-border expansion of East-Africa’s banks and observed that the need to exploit the benefits of their relative efficiency arising from regional expansion was paramount. Furthermore, IMF (2015) found that the top four PABs had higher profitability and lower loan-to-deposit ratios than the four foreign banking groups; and that capital adequacy ratios and asset quality have not deteriorated significantly. However, no Nigerian studies have empirically shown whether cross-border expansion may have some effect on firm performance. It is against the background that the study seeks to examine cross-border expansion and firm performance with special focus on the Nigerian banking industry.
Based on the foregoing, it is important to evaluate the effect of cross-border expansion on the Nigerian banks’ performance. There is little evidence that researchers and academicians have paid

15
serious attention to the effect of cross-border expansion on banks’ performance in Nigeria so far. However, several conceptual works have tried to examine the drivers, rationale, benefits and challenges of cross-border expansion among banks (Detragiache, Gupta & Tressel, 2006; Rieche, 2016; Alade, 2014; Berger, DeYoung, Genay & Udell, 2000 and Ukeje, 2012). Detragiache, Gupta, and Tressel (2008) as cited in Beck, Fuchs, Singer & Witte (2014) asserted that banks might venture into cross-border expansion because of the quest for comparative advantage, market share, follow-the-customer hypothesis, and risk diversification. The study covered a 14-year period, beginning from 2002 to 2015. This was further broken down into two (2) periods: the pre cross-border expansion era (2002 – 2008) and the post cross-border expansion era (2009 to 2015). The objective of this study was to assess the effect of cross-border expansion on the performance of Nigerian banks. Based on the research questions, the specific objectives are to: i) assess whether there is significant difference between the performance indicators of Nigeria’
cross-border banks prior to and after cross-border expansion; and ii) assess whether there is a significant difference between the performance indicators of Nigeria’s
cross-border banks and those of their domestic counterparts. The sub-objectives reflect the following measures of performance: (a) profitability, (b) share price growth, (c) liquidity, (d) solvency and (e) deposit growth rate. It is based on these that hypotheses were developed. This paper is organised in five (6) sections. The next section (Section II) dwells on literature review and hypothesis development. Section III outlines the research method while Section IV provides the data analysis, results and discussion. The last section (Section V) contains the conclusion and recommendations.
LITERATURE REVIEW
Conceptual Framework
Cross-border expansion seems to be a complex term in the business world. It can be viewed from two different broad perspectives. Firstly, it denotes the means by which businesses across the globe are continuously exploiting opportunities across different countries bordering their countries of incorporation. Secondly, cross-border expansion means a strategy whereby a business strategically expands it business globally. Cross-border expansion can be defined as an international expansion strategy whereby a firm establishes the presence of her business in other countries surrounding its geographical location. The concept of cross-border expansion is related to cross-border mergers and acquisition which have changed the face of international business. However, unlike cross border mergers and acquisitions, there is a paucity of literature on cross-border expansion. The term cross-border expansion can also be described as a strategy of extending the international network and presence of an organisation throughout or across a continent. Twarowska and Kakol (2013) related it to international expansion, which means a strategy whereby an international firm makes a direct investment in a production unit in a foreign market. The firm may merge with or acquire another company in the foriegn country. However, cross-border expansion entails directly investing in countries bordering it by establishing one own company(ies) there. On the other hand, by cross-border mergers and acquisitions, we mean all forms of business combinations, takeovers and related issues of corporate restructuring, corporate control and changes in the ownership structure of firms. (Lucks & Meckl, 2002). With respect to the banking industry, the extant literature on cross-border expansions dwells on the concepts of international banking, cross-border mergers and acquisitions, multinational banking and global banking which are all interwoven and interrelated. These are all strategies for international expansion that are borne out of drives for revenue maximisation and cost minimisation in pursuit of shareholders’ wealth maximisation. According to Arbuckle (2016), the term international banking can be defined as any type of banking that takes place across international borders. The online

16
Cambridge Dictionary refers to international banking as the activity of banks that make financial arrangements, such as lending money for companies and banks in other countries. Moreover, Davis (2010) defined international banking as banking transactions crossing national boundaries. Therefore, cross-border banking can be referred to as the internationalisation of banks and can be viewed from two different perspectives of internationalisation (Drogendijk & Hadjikhani, 2008). In the first instance, international banking denotes the exchange in terms of import and export of banking services and transactions in foreign currency. The second aspect is somewhat related to the strategy of banks when internationalising (Vasiliadis, 2009). More so, another related concept, multinational banking, can be seen as a system whereby a deposit money bank physically operates in many countries of the world. From there, the world is going towards what can be termed global banking. Based on this, a conceptual framework for this research was developed and is depicted in Figure 1.
Figure 1: Concepts, Drivers, Models and Benefits of Cross-Border Banking
(Source: Adapted from IMF (2015) and (Beck, et. al. 2014).) The Origin and Historical Development of Cross-Border Banking
The origin of cross-border banking can be traced to the history of international banking across the globe. Arbuckle (2016) stated that international banking is an old practice that originated in the Renaissance as lenders loaned money to foreign kings. In the contemporary world, the term international banking is used by individuals and companies seeking favourable banking conditions in the global marketplace. Similarly, Davis (2010) wrote that the historical evolution of cross-border banking, which he referred to as international banking, is related to the origin in Renaissance (lending to kings). He added that there has been active international lending since the 19th century, which was then known as trade financing. More so, the waves of international banking is said to have witnessed some declines in the 1920s and 30s as government placed some restrictions. However, globalisation and the development of multinationals, alongside the emergence of Euromarkets in the 1960s revolutionalised cross-border expansion. Leon (2015) reported that banking systems in Africa have witnessed profound structural changes in recent years with the penetration of regional cross-border banks. A number of these banks hold significant proportion of the total assets in host country’s financial systems and can be regarded as major players. In Africa, cross-border banking has been identified as a vital part of her financial history since colonial times. In fact, the period after independence saw a wave of nationalization
• Global
banking
•International
banking
•Multinational
banking
•Cross-border
merger and
acquisition
Potential
growth
opportunitie
s
Regulatory
challenges
in home
country
Risk
diversifiction
Financial
stability
Branch
model
Subsidiary model Cross-Border Banking
Enhanced
liquidity
Deposit base
growth
Diversified
risk
Share price
growth
Profitability

17
across the continent, with many of the colonial banks exiting; this trend was reversed in the 1980s with the coming of financial liberalization. Failing state-owned and private banks were sold mostly to global investors or multinational banks. Regional economic integration and the deregulation of the banking industry further increased the number of foreign banks and between 2005 - 2010 many African banking systems were still under the control of foreign banks (Beck, et al. 2014). By the end of 2009, there were at least 18 banks of Sub-Sahara Africa (SSA) origin that had cross border operations in four (4) or more countries (See Table 1). That year (2009) signalled the period of significant cross-border expansions across the African continent. In Nigeria, United Bank for Africa was categorised as a ‘global bank’, Access Bank was recognised as a pan-African bank while four (4) banks were classified as sub-regional banks, namely Guaranty Trust Bank, Bank PHB, Oceanic Bank and Zenith Bank. Lukonga and Chung (2010) found that the cross border operations have been mostly concentrated in the Africa region, but some selected financial groups have expanded to other regions, including Europe, Asia and the Americas.
Table 1: Geographical Coverage of Major African Banks as at 2009
Source: Lukonga and Chung (2010) *Oceanic Bank was later acquired by Ecobank.

18
Table 2: Geographical Coverage of Major African Banks as at 2015
Source: IMF (2015)
Table 2 shows the updated status of PABs that are shaping the African financial system.
Theoretical Framework
In the literature, there are various theoretical underpinnings of cross-border expansion in the banking industry. a. International Banking Theory
One of the relevant theories for this study is the International Banking Theory which explains how banks are able to establish abroad and what may be the motives behind cross-border expansions as well as mergers and acquisitions. It attempts to explain the reasons behind a bank’s choice of location for establishing its subsidiaries and branches (Aliber, 1984 as cited in Ostlund & Lindblad, 2008). Aliber explained that these reasons include maximising competitive advantage, exploiting arbitrage opportunities and risk diversification.
b. Portfolio Theory
The Portfolio Theory argues that firms always strive to diversify their business risks by spreading their investment into different sectors or segments. According to Niepmann (2013) portfolio models of cross-border banking assume that banks invest abroad to diversify their assets. In other words, this theory holds that businesses tend to expand internationally in order to diversify business risks since different countries have differing rates and intensities of business risks.
c. Scale Boundary Theory
The scale boundary theory actually reviews enterprise growth strategies from an economic point of view. By enterprise growth, we mean the development process of enterprise from small to big and from weak to strong (Mao, 2009). It is more or less based on the transaction cost theory propounded by Coase (1937) that tries to explain the reasons for companies’ expansion drives and defining the rate thereof.
d. Follow-the-customer Hypothesis
Furthermore, the literature has argued that banks follow their customers abroad (Goldberg & Saunders, 1991). This is generally known as the follow-the-customer hypothesis. The follow-the-customer hypothesis assumes that banking institutions tend to expand outside their base country because of their desire to follow large clients abroad, to strengthen their domestic franchise and to improve their competitive position. According to Gray and Gray (1981), this theory generally holds that one of the main motivations for cross-border banking movement is following banks’ clients’ multinational expansion. With globalisation, banks may need to
19
establish their presence internationally beyond borders and geographical barriers in order to follow their customers and extend their market share.
Based on the theories reviewed, the follow-the-customer hypothesis was selected as the most relevant theory for the study. This is because the main motive for cross-border expansion is usually to grow the customers’ deposit base which is required to increase market value. It is around these theoretical underpinning that the study was built.
Hypothesis Development
In order to achieve the objectives stated in the introductory section of this paper, the following research hypotheses, stated in the null form, were developed: Hypothesis One: H01: There is no significant difference between the performance indicators of Nigerian banks in
the pre and the post cross-border expansion era. Hypothesis Two: H02a: There is no significant difference between the performance indicators of Nigeria’s cross-
border banks and their domestic counterparts. For each hypothesis, five (5) performance indicators, namely profitability, liquidity, share price growth, solvency and deposit growth were examined Review of Empirical Studies
In recent times, the assessment of banks performance has received increased attention from both scholars and industry experts given the high level of bank failures and adoption of new strategies. According to Kumbirai and Webb (2009), there are two major approaches used to measure banks’ performance, namely: the accounting approach that makes use of financial ratios and the econometric approach. In Nigeria, accounting ratios have been greatly used by several empirical studies to assess the effect of mergers and acquisitions brought about by consolidation of the Nigerian banking industry (Adebayo & Olalekan, 2012; Adegboyega, 2012; Ebimobowei & Sophia, 2011; Sabiu, 2011; and Onaolapo & Ajala, 2012). However, there exists a gap in the literature as to the effect of cross-border expansion of Nigeria’s pan-African banking group on their financial performance.
Cross-border Expansion and Profitability of Nigerian Banks
Profitability ratios have remained the most important financial statement ratios in assessing performance (Kowalewski, 2014). Improving profitability, being one of the major motives for cross-border expansion, can easily be evaluated given the several possible ratios that can be used such as return on assets (ROA), return on equity, net profit margin, etc. IMF (2015) survey revealed that pan-African banks with extensive cross-border expansion had higher profitability ratios than the foreign banks that came from outside Africa. The comparative study by Nicholson and Salabar (2013) showed that firms may have higher profitability when they engage in cross-border expansion, especially in developing countries. The evidence found can be related to the Nigerian experience for which empirical studies have revealed positive relationships between mergers and acquisitions and profitability. Cross-border Expansion and Liquidity of Nigerian Banks
Liquidity ratios are used to evaluate a bank’s ability to pay its current obligations. Basically, the higher the liquidity ratio, the greater the margin of safety, which is required to meet short-term obligations (Adam, 2014). Schnabl (2010) found that some cross-border banks are net cross-border liquidity providers relative to their home countries. This implies that cross-border expansion to some extent has an effect on liquidity levels in the banking industry. Hills and Hoggarth (2013) also alluded to the fact that cross-border banks credits have some relationships with liquidity which affect financial stability. Further still, Lukonga and Chung (2010) argued that cross-border expansion

20
has begun to help pan-African banks in better managing liquidity risks. As it has been highlighted earlier, empirical studies on bank consolidation in Nigeria have found similar relationships as well. Cross-border Expansion and Solvency Risks of Nigerian Banks
The ability of a company to meet long-term obligations is measured by the solvency ratio (Yesilyurt, 2012). In banking, this ratio is usually called “capital adequacy ratio”; for which the Central Bank will set a minimum requirement. More so, insolvency was one of the main reasons that necessitated the bank consolidation policy of the Central Bank of Nigeria. This therefore suggests that cross-border expansion might be pursued in order to better diversify or manage solvency risks in the banking industry. The soundness and strength of any bank largely depends on its long-term solvency which determine the status of its going concern. Cross-border Expansion, Share Price Growth and Bank Deposits Level
The follow-the-customer hypothesis holds that banks venture into cross-border expansion in order to increase their market share in the industry. This implies that they want to grow their customers’ deposit base as well as maximise their shareholders’ wealth. Studies by IMF (2015) found that cross-border banks usually hold a significant share of the total bank deposits in the host country. Usually, they have more than 10% of the total customers’ deposits within the host economy. As banks grow their bank deposits, they are more able to give out loans, which tend to increase total earnings and consequently facilitate share price growth and better price earnings (P.E.) ratios. Boateng, et. al. (2008) as well as Lin, Lin, and Wang (2016) in their studies on Chinese firms found some relationships between cross-border mergers and acquisitions and share price growth. Generally, these two research variables (share price growth/ P.E. ratio and deposit growth rates) are not usually directly studied in most empirical studies. However, there seem to be a relationship amidst them in relation to the cross-border expansion in the banking industry.
RESEARCH METHOD
Population, Sample and Sampling Technique
The population of the study consists of all Nigerian deposit-money banks quoted on Nigerian Stock Exchange (NSE). There are eighteen (18) deposit-money banks in Nigeria engaged in universal banking business (CBN, 2016). However, only fifteen (15) of such banks were quoted on the NSE as at 31st December, 2015. Ten (10) quoted banks were judgmentally selected for the purpose of this research. The sample size of 10 was used; this is because it constitutes 75% of the total number of quoted banks. This is a representative sample that can permit reasonable generalisation. Judgmental (or purposeful) sampling technique was used in order to meet the purpose of the comparative study. Out of the quoted banks on the NSE, five (5) domestic banks that have no subsidiaries or branches outside Nigeria were selected and another group of five (5) banks with cross-border presence in at least four (4) other countries of the world (See Appendix 1) were also selected. Foreign banks were excluded from the sample of the study since the focus is on indigenous deposit money banks.
Methods of Data Analysis
Average was used to analyse the collated data for descriptive statistics. The method of data analysis used was adopted from those of Adebayo and Olalekan (2012) and Ajao and Emmanuel (2013) who used t-tests to examine the performance of Nigerian banks prior to and after merger and acquisition. The level of significance was set at 95% and the analysis was run using the Statistical Package for Social Sciences (SPSS) software, version 21.
Decision Rule:
If the p-value (sign (2-tailed)) is less than the level of significance, α (which is 5%) then the study will reject the null hypothesis, while the alternative hypothesis is accepted. Otherwise, accept the null hypothesis and reject the alternate hypothesis.
21
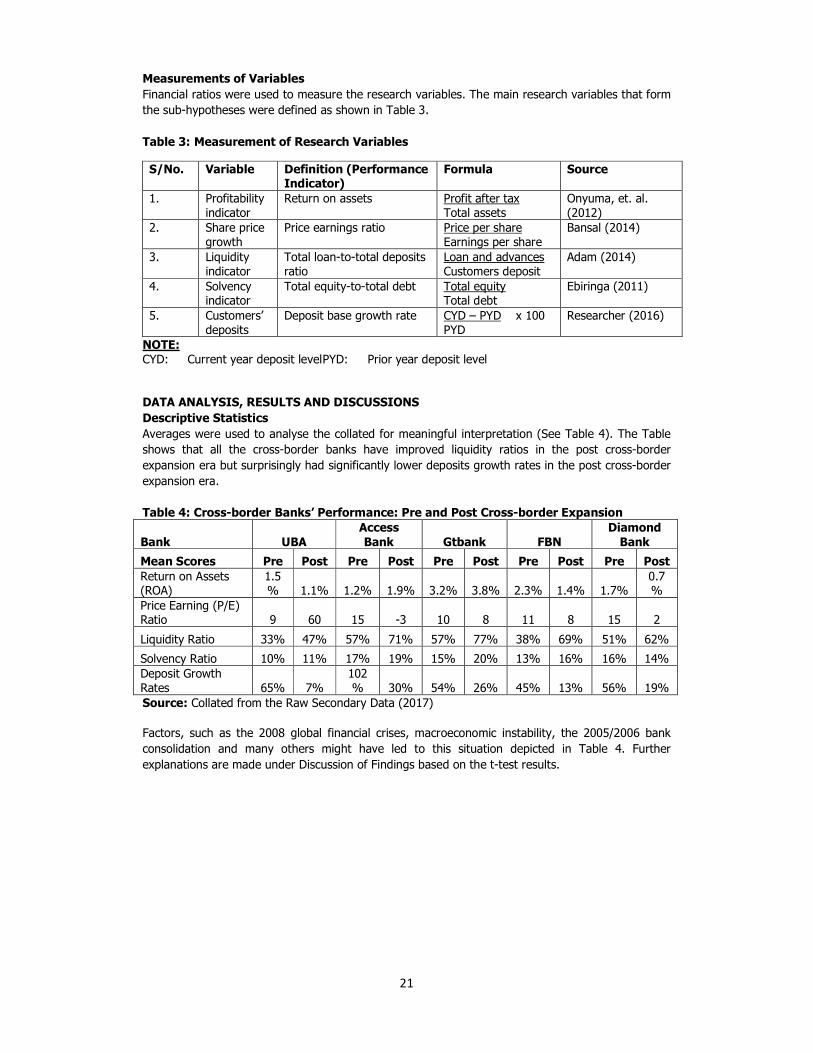
Measurements of Variables
Financial ratios were used to measure the research variables. The main research variables that form the sub-hypotheses were defined as shown in Table 3.
Table 3: Measurement of Research Variables
S/No. Variable Definition (Performance Indicator)
Formula Source
1. Profitability indicator
Return on assets Profit after tax Total assets
Onyuma, et. al. (2012)
2. Share price growth
Price earnings ratio Price per share Earnings per share
Bansal (2014)
3. Liquidity indicator
Total loan-to-total deposits ratio
Loan and advances Customers deposit
Adam (2014)
4. Solvency indicator
Total equity-to-total debt Total equity Total debt
Ebiringa (2011)
5. Customers’ deposits
Deposit base growth rate CYD – PYD x 100 PYD
Researcher (2016)
NOTE:
CYD: Current year deposit level PYD: Prior year deposit level DATA ANALYSIS, RESULTS AND DISCUSSIONS
Descriptive Statistics
Averages were used to analyse the collated for meaningful interpretation (See Table 4). The Table shows that all the cross-border banks have improved liquidity ratios in the post cross-border expansion era but surprisingly had significantly lower deposits growth rates in the post cross-border expansion era. Table 4: Cross-border Banks’ Performance: Pre and Post Cross-border Expansion
Bank UBA
Access
Bank Gtbank FBN
Diamond
Bank
Mean Scores Pre Post Pre Post Pre Post Pre Post Pre Post
Return on Assets (ROA)
1.5% 1.1% 1.2% 1.9% 3.2% 3.8% 2.3% 1.4% 1.7%
0.7%
Price Earning (P/E) Ratio 9 60 15 -3 10 8 11 8 15 2
Liquidity Ratio 33% 47% 57% 71% 57% 77% 38% 69% 51% 62%
Solvency Ratio 10% 11% 17% 19% 15% 20% 13% 16% 16% 14% Deposit Growth Rates 65% 7%
102% 30% 54% 26% 45% 13% 56% 19%
Source: Collated from the Raw Secondary Data (2017) Factors, such as the 2008 global financial crises, macroeconomic instability, the 2005/2006 bank consolidation and many others might have led to this situation depicted in Table 4. Further explanations are made under Discussion of Findings based on the t-test results.
1
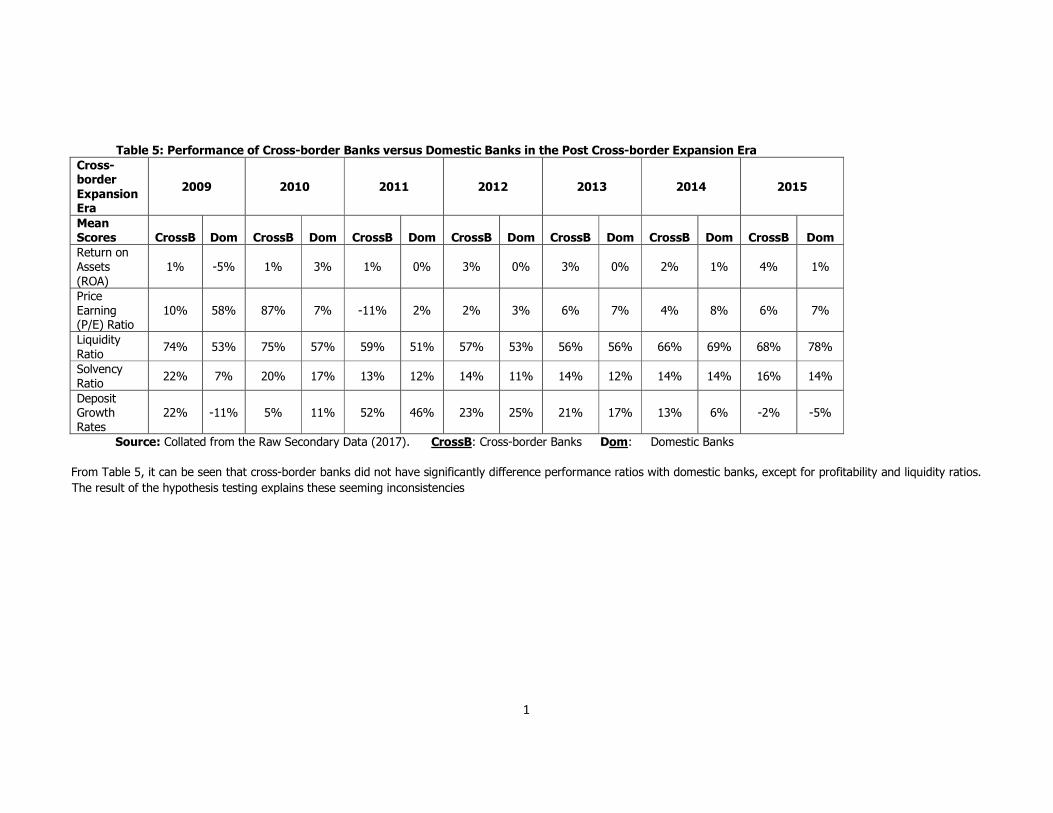
Table 5: Performance of Cross-border Banks versus Domestic Banks in the Post Cross-border Expansion Era
Cross-border
Expansion Era
2009 2010 2011 2012 2013 2014 2015
Mean Scores CrossB Dom CrossB Dom CrossB Dom CrossB Dom CrossB Dom CrossB Dom CrossB Dom
Return on Assets (ROA)
1% -5% 1% 3% 1% 0% 3% 0% 3% 0% 2% 1% 4% 1%
Price Earning (P/E) Ratio
10% 58% 87% 7% -11% 2% 2% 3% 6% 7% 4% 8% 6% 7%
Liquidity Ratio
74% 53% 75% 57% 59% 51% 57% 53% 56% 56% 66% 69% 68% 78%
Solvency Ratio
22% 7% 20% 17% 13% 12% 14% 11% 14% 12% 14% 14% 16% 14%
Deposit Growth Rates
22% -11% 5% 11% 52% 46% 23% 25% 21% 17% 13% 6% -2% -5%
Source: Collated from the Raw Secondary Data (2017). CrossB: Cross-border Banks Dom: Domestic Banks
From Table 5, it can be seen that cross-border banks did not have significantly difference performance ratios with domestic banks, except for profitability and liquidity ratios. The result of the hypothesis testing explains these seeming inconsistencies

23
(Source: T-test Results from SPSS- See Appendix 2) From Table 6, only liquidity and deposit growth had p-value of less than the level of significance (0.05), this implies that cross-border expansion had significant effect only on liquidity ratios (p-value of 0.00) and deposit growth rates (p-value of 0.001) of the said Nigerian banks. However, there were no (statistically) significant differences in the profitability ratios, share price growth rates and solvency ratios of cross-border banks prior to and after cross-border expansion. On the other hand, in comparing the performance of Nigeria’s cross-border banks with their domestic counterparts, the study revealed that there were no significant differences in the performance indicators, except for profitability ratios with p-value of 0.008.
Discussions of Findings
With respect to profitability, the study revealed that although Nigeria’s cross-border banks tend to have better profitability ratios than domestic banks, the profitability ratio (return on assets) during the post cross-border expansion era have not been generally significantly higher. This suggests that mere venturing into cross-border expansion may not directly result to maximising returns on banks’ assets. This finding might have been due to the global financial crisis of 2008-2010 that seriously affected the Nigerian banking industry. This finding agrees with those of Lukonga and Chung (2010) and Atuanya (2014) who opined that certain hidden challenges usually hinder cross-border banks from improving profitability. It also validates the findings of Kiyota (2009) who found that small banks have higher profit efficiency than bigger banks such as Pan-African banks. The finding is also in accord with the findings of Olayinka and Farouk (2014) who evaluated the effect of bank consolidation on return on assets. Notwithstanding, profit maximisation motive remains one of the driving forces of cross-border expansion in the African continent. The study found that the P/E ratio of Nigeria’s cross-border banks averaged around 15 as against an average P/E ratio of 13 for domestic banks. Except for few exceptions (especially UBA and FCMB), the P/E ratios were relatively stable, mostly above the industry benchmark of 6.The slightly higher P/E ratios of cross-border banks may be because of better diversified portfolio as propounded in the portfolio theory. The t-test results also confirmed that cross-border expansion does not have a significant effect on share price growth. This finding is in line with the observation by IMF (2015) that Nigerian banks may not achieve the assumed objective of improving shareholders’ value and market share. This also concurs with the view of Onyuma, et. al. (2012) that there is no clear evidence of shareholder value maximisation in cross-border expansion programmes. Several economic and socio-political factors usually affect share price movement and earnings of firms operating across different geographical entities in today’s globalised business world. The decline in the performance of the Nigerian Capital Market that began since 2013 and the economic recession that started in the last quarter of 2015 may be responsible for the negative share price growth of the studied banks.
Table 6: Results of Hypothesis Testing
Performance Indicator (Research
Variables)
Difference between Pre and Post Cross-border Expansion
Difference between Cross-border Banks and Domestic Banks
P-value (sig (2-tailed)
Interpretation P-value (sig (2-tailed)
Interpretation
Profitability 0.332 None 0.008 Yes
Share Price Growth 0.17 None 0.31 None
Liquidity 0.00 Yes 0.156 None
Solvency 0.10 None 0.44 None
Deposit Growth 0.001 Yes 0.305 None

24
In addition, the study found that cross-border expansion has a significant effect on the liquidity ratios of Nigerian banks. Nigeria’s cross-border banks generally had significant improvements in their liquidity ratios during the post cross-border expansion era. This finding is similar to what Onyuma, et. al. (2012) discovered among banks with cross-border listing in East Africa. However, there was a slight reduction in the liquidity ratios of Nigeria’s cross-border banks in 2012 and a quick recovery afterwards. This might be due to the fact that most banks started complying with the International Financial Reporting Standards (IFRS) as mandated by the Financial Reporting Council of Nigeria (FRCN). Nevertheless, this research did not find any significant difference between the liquidity ratios of cross-border banks and those of domestic banks. This was so because the CBN closely monitors banks’ compliance to the minimum liquidity ratio standards given the peculiarity of the industry. More so, most banks have robust systems of liquidity risk management that ensure that they maintain a very stable liquidity position. Another finding was that although there is no clear-cut difference in the solvency ratios of cross-border and domestic banks. It was found that cross-border banks had slightly better solvency ratios in the post cross-border expansion era. This result is attributable to the challenges and risks encountered by cross-border banks. Besides, all banks in their effort to keep within CBN’s minimum capital adequacy ratio tended to have similar solvency ratios. This finding however contradicts the argument that is put forward by the portfolio theory proponents. Nevertheless, cross-border banks in Nigeria might have actually diversified solvency risks in terms of total debts or other leverage ratios that were dealt with in this study. Nigeria’s cross-border banks are generally expected to have significantly better solvency ratios compared to their domestic counterparts. Consequently, this outcome suggests that solvency risk still remains an important financial stability issue among financial institutions in Nigeria. The study also found that there is significant relationship between cross-border expansion and deposit growth rates. However, no statistically significant difference was found between the deposits growth rate of Nigeria’s cross-border banks and their domestic counterparts. This finding do not confirm the validity of the follow-the-customer hypothesis as expatiated by Gray and Gray (1981) as well as Goldberg and Saunders (1991), which posits that banks do follow their customers overseas and as they do, their deposits base tends to grow. The outcome of this result is also in consonance with the finding of IMF (2015) which noted that cross-border banks have the highest share of total deposits across the African continent, attributable to higher rates of deposits growth. However, the average deposit growth rates slowed down during the post cross-border expansion era. This was possibly due to the fact that the 2005 Nigeria banking sector consolidation significantly impacted on the customers’ deposit level prior to cross-border expansion. The 2008 global financial crises could have also contributed to this outcome.
CONCLUSION AND RECOMMENDATIONS
In the comparative analysis of the performance of Nigeria’s cross-border banks prior to and after cross-border expansion, the study found that cross-border expansion had significant effect on liquidity ratios and deposit growth rates of the said Nigerian banks. However, there were no (statistically) significant differences in the profitability ratios, share price growth rates and solvency ratios of cross-border banks prior to and after cross-border expansion. On the other hand, in comparing the performance of Nigeria’s cross-border banks with their domestic counterparts, the study revealed that there were no significant differences in the performance indicators, except for profitability ratios.
Conclusion
The study showed that cross-border expansion has no significant effect on share price growth and solvency, it implies that other managerial and macroeconomic factors in the business environment constitute major challenges to cross-border expansion. The decline of the Nigerian Capital Market in 2013 and dawn of economic recession in late 2015 are some of the major factors that affected the outcome of the study. In addition, this study has re-emphasised the need for proper planning before venturing into cross-border expansion by analysing their effects on profitability, liquidity,

25
solvency, share price growth and deposit growth. Generally, the study concluded that mere venturing into cross-border expansion does not guarantee better firm performance. Recommendations
Considering the fact that the performance of Nigeria’s cross-border banks was significantly different from those of their domestic counterparts only in terms of profitability, the study recommends that the other performance indicators (share price growth, liquidity, solvency and deposit growth) as identified in this study should not be ignored. Banks’ executives, especially the Chief Finance Officers, need to effectively strategise through consolidated supervision of cross-border subsidiaries or branches to ensure that performance and profitability are enhanced. This can be done by implementing comprehensive online real-time performance evaluation systems which would ensure that corrective actions are proactively taken so that targets are met. In addition, the study recommends that Nigeria’s domestic banks which aim to enhance profitability, (and possibly liquidity and deposit growth) should consider cross-border expansion. However, such banks should undertake a thorough strategic planning through rigorous cost-benefit analysis and feasibility studies, designed to ensure that the right host countries are selected. An integrated approach which puts all necessary factors into considerations must be adopted by continuously conducting country risk analysis prior to expanding into a given country.
For those Nigeria’s domestic banks whose primary motives include maximising shareholder wealth and enhancing solvency position, adequate controls should be put in place to mitigate potential stability risks. These controls would entail choosing an optimal cross-border banking model and ensuring that effective risk management systems are in place and regularly reviewed.

26
REFERENCES
Adam, M. H. (2014). Evaluating the financial performance of banks using financial ratios- A case study of Erbil Bank for Investment and Finance, European Journal of Accounting Auditing and Finance Research, 2(6), 162 – 177.
Adebayo, O. & Olalekan, O. (2012). An analysis of the impact of mergers and acquisitions on
deposit money banks’ performance in Nigeria, Research Journal of Finance and Accounting, 3 (7), 91 – 101.
Adegboyega, O. L. (2012). Mergers and acquisitions and banks performance in Nigeria, Journal of Research in National Development, 10 (2) 234-250.
Ajao, O. S. & Emmanuel, O. A. (2013). Banking industry consolidation and financial performance of selected quoted banks in Nigeria, Journal of Applied Finance & Banking, 3 (3), 219 – 238.
Alade, S. O. (2014). Cross-border expansion of Nigerian banks: has it improved the continent’s regulatory and supervisory frameworks? Research and Publications, Bank for International Settlements, Paper No. 76.
Arbuckle, D. (2016). The definition of international banking, Retrieved 15 November 2016 from http://www.ehow.com/about_5526334_definition-international-banking.html
Atuanya, P. (2014). Banks face cross-border regulatory challenges in Africa expansion, BusinessDayonline- Retrieved 15 November 2016 from http://businessdayonline.com/2014/02/banks-face-cross-border-regulatory-challenges-in-africa-expansion-2/
Bansal, R. (2014). A comparative analysis of the financial ratios of selected banks in the India for the period of 2011 – 2014, Research Journal of Finance and Accounting, 5 (19), 153 -167.
Beck, T., Fuchs, M., Singer, D. & Witte, M. (2014). Making cross-border banking work for Africa. Eschborn, Germany: Deutsche Gesellschaftfür Internationale Zusammenarbeit (GIZ) GmbHand International Bank for Reconstruction and Development / The World Bank.
Berger, A. N., DeYoung, R., Genay, H. & Udell, G. F. (2000). Globalisation of financial institutions: evidence from cross-border banking performance, Brooking-Wharton Papers on Financial Services, 3 (1).
Boateng, A., Qian, W. & Tianle, Y. (2008). Cross-border M & As by Chinese firms: an analysis of strategic motives and performance, An Online Research Paper, International Business, University of Nottingham.
Central Bank of Nigeria (2016). List of financial institutions- Deposit-money banks: Excel version, Retrieved 15 November 2016 from http://www.cenbank.org/Supervision/Inst-DM.asp.
Coase, R. (1937). The nature of the firm, Economics, 4 (16), 386–405.
Davis (2010). International banking, Retrieved from 15 November 2016 http://www.ephilipdavis.com/5007-10.pdf
Detragiache, E., Gupta, P. & Tressel, T. (2006).Foreign banks in poor countries: theory and evidence, IMF Working Papers, 6 (18).
Drogendijk, R. & Hadjikhani, A. (2008). Internationalisation of bank enterprises in new emerging markets: the case of penetration and expansion into Eastern European countries, International Journal Business and Emerging Markets, 1(1), 80-104.
Ebimobowei, A. & Sophia, J. M. (2011). Mergers and acquisitions in the Nigerian banking industry: An explorative investigation, Medwell Journals- Social Sciences, 6 (3), 213 – 220.
Ebiringa, O. T. (2011). Benchmarking incidence of distress in the Nigerian banking industry on Atlman scale, Serbian Journal of Management, 6 (2), 221- 230.
Goldberg, L. G. & Saunders, A. (1991).The determinants of foreign banking activity in the United States, Journal of Banking and Finance, 5 (1), 17 – 32.
27
Gray, J. M. & Gray, H. P. (1981). The multinational bank: A financial MNC? Journal of Banking and Finance, 5 (1), 33 – 63.
Hills, B. & Hoggarth, G. (2013). Cross-border bank credit and global financial stability, Quarterly Bulletin, Retrieved from www.bankofengland.co.uk/publications/Documents/.../2013/qb130204.pdf
International Monetary Fund. (2015). Pan African Bank: Opportunities and challenges for cross-border oversight- Edited by Enoch, C., Mathieu, P. and Mecagni, M. African Department and Monetary and Capital Market Development, Retrieved 15 November 2016 from https://www.imf.org/external/pubs/ft/dp/2015/afr1503.pdf
Kiyota, H. (2009). Efficiency of deposit-money banks in Sub-Saharan Africa: A comparative analysis of domestic and foreign banks, A paper presentation at the CSAE conference on “Economic Development in Africa” held at the University of Oxford. Retrieved December 2, 2016 from https://pdfs.semanticscholar.org/8467/4acf10c55b05612158e3266bc25de7b66962.pdf.
Kodongo, O., Natto, D.& Biekpe, N. (2014). Explaining cross-border bank expansion in East Africa, Journal of International Financial Markets, Institutions and Money, 36 (5) 71 – 84.
Kowalewski, O. (2014). Multinational banks and the performance of their subsidiaries abroad, Journal of Finance and Economics, 2 (3), 90 – 100.
Kumbirai, M. & Webb, R. (2009).A financial ratio analysis of deposit-money bank performance in South Africa, African Review of Economics and Finance, 2 (1), 30 – 53.
Leon, F. (2015). Does the expansion of regional cross-border banks affect competition in Africa? Indirect evidence, A Seminar Paper Presentation at the 31st International Symposium of Money, Banking and Finance (Lyon) and 2014 Paris Financial Management Conference, Retrieved 16 November 2016 from http://www.ferdi.fr/sites/www.ferdi.fr/files/evenements/presentations/2015_05_26_seminar_bdf_ferdi_competition_in_africa_-_leon.pdf
Lin, J., Lin, P. & Wang, B. (2016). Do cross-border acquisitions create value? Evidence from overseas acquisitions by Chinese firms, International Business Review, 25, 471 – 483.
Lucks, K. & Meckl, R. (2002).Interntionale mergers and acquisitions -derprozessorientierteansatz, 1st edition, Heidelberg: Springer Publishers.
Lukonga, I. & Chung, K. (2010). The cross-border expansion of African LCFIs: Implications for regional financial stability and regulatory reform, A IMF research paper, Retrieved 15 November 2016 from http://www.afdb.org/fileadmin/uploads/afdb/Documents/Knowledge/Session%20I.1.3_2.%20The%20Cross%20Border%20Expansion%20of%20African%20LFCIs.pdf
Mao, H. (2009). Review on enterprise growth theories, International Journal of Business and Management, 4 (8), 20 -23, Retrieved 15 November 2016 from http://www.ccsenet.org/journal/index.php/ijbm/article/viewFile/3351/3019
Nicholson, R. R. & Salabar, J. (2013).The motives and performance of cross-border acquirers from emerging economies: Comparison between Chinese and Indian firms, International Business Review, Retrieved 16 November 2016 from https://www.researchgate.net/publication/259139356
Niepmann, F. (2013). Banking across borders, A research paper, New York: Federal Reserve Bank of New York, Research and Statistics Group, Retrieved December 2, 2016 from https://www.newyorkfed.org/medialibrary/media/research/staff_reports/sr576.pdf.
Olayinka, T. T. & Farouk, M. A. (2014).The impact of consolidation on the performance of banks in Nigeria, Global Advanced Research Journal of Management and Business Studies, 2 (10) 479 -485.
Onaolapo, A. A. & Ajala, O. A. (2012). Effects of merger and acquisition on the performance of selected deposit-money banks in Nigeria, International Journal of Business and Social Research, 2 (7), 148 – 157.

28
Onyuma, S. O., Mugo R. K.& Karuiya, J. K. (2012). Does cross-border listing (still) improve firm financial performance in Eastern Africa? Journal of Business, Economics and Finance,1 (1), 92 – 109.
Ostlund, A. & Lindblad, P. (2008).Cross-border mergers and acquisitions in the banking sector- A Swedish perspective, A Bachelor Thesis, Retrieved 15 November 2016 from http://www.diva-portal.org/smash/get/diva2:142183/FULLTEXT01.pdf
Sabiu, M. O. (2011). The impact of merger and acquisition on financial intermediation: Empirical evidence from Nigerian banking industry, Journal of Business, University of Johannesburg, South Africa, Retrieved December 2, 2016 from https://www.econrsa.org/system/files/workshops/papers/2013/saibu.pdf.
Schnabl, P. (2010). Financial globalization and the transmission of bank liquidity shocks: Evidence from an emerging market, Journal of Finance.
Ukeje, S. A. (2012). Cross border banking, Understanding Monetary Policy Series No. 21, Anniversary Commemorative Edition, Abuja: Central Bank of Nigeria.
Vasiliadis, L. (2009). Greek banks’ internationalisation: a suggested modelling approach, EuroMed Journal of Business, 4(1), 88-103.

29
Audit Tenure and Audit Quality in Nigeria
Beauty Ekiomado EGUASA Ph.D Department of Accounting, Faculty of Social and Management Sciences, Benson
Idahosa University, Benin City e-mail: [email protected]/ [email protected]
And
Rosemary O. Obasi Ph.D
Department of Accounting, Faculty of Social and Management Sciences, Benson Idahosa University, Benin City
____________________________________________________________________________
Abstract
The broad objective of this study is to examine the effects of audit tenure and audit quality in Nigeria. The longitudinal research design was adopted for this study. The data used in the study were obtained from 540 firm-year observations, comprising of sixty (60) Nigeria listed companies listed from the period of 2007- 2015. Model on the input-based measure of audit quality was adopted in the study. Regression analysis was carried out with the aid of E-views 8.0. It was found that audit tenure had a negative but significant relationship with audit quality. We recommended that there should be a government regulation on mandatory audit firm rotation for all listed companies in Nigeria, similar to what is obtainable in the developed economy.
Key words:
Audit Tenure, Audit Quality 1.1 INTRODUCTION
The quality of audit will affect the reliability, credibility and acceptability of financial reports. The competence and integrity of auditors will determine the quality of work and of the audit report they present. Audit firms tend to play a major role in this aspect. The extent of audit quality is notably affected by the audit work carried out by the audit firm engaged.
Auditors need to find out an effectively competitive strategy to gain a competitive edge, with the increasing competition in the audit market. Since the 1990s, the international accounting firms have had to restructure their service line, and gradually move toward industry-specific development. One of the major issues concerning auditing regulations is the question of whether audit firm tenure impacts audit quality. Siregar, Amarullah, Wibowo and Anggraita (2012) are of the opinion that independence and objectivity is undermined in lengthy auditor tenure. While Nicholas and Smith (1983) and Nagy (2005) are of the opinion that long tenure increases auditor competence and knowledge. The wave of company failure in the capital market has also increased concerns about audit quality (Velury, 2005). If a company fails shortly after being audited, the auditors may be blamed for conducting an inferior audit (Dopuch, 1988). Existing studies tend to adopt similar methodologies (Danos and Eichenseher, 1986; Hogan and Jeter, 1999; Cairney and Young, 2006; Kallapur, Sankaraguruswamy and Zang, 2010; Velte, and Stiglbauer, 2012). This study differs from previous studies by contributing to audit tenure and audit quality nexus using the input-based model of audit quality. From the research problems stated above, the broad objective of this study is to examine the relationship between audit tenure and audit quality. The study will be outlined into the following sections; review of literature, review of theory, materials and methods, discussion of findings, conclusion and recommendations.

30
2.1 REVIEW OF LITERATURE
2.1.1 Audit Quality Financial reporting and auditing were mearnt to provide protection to investors. Francis (2004) describes audit quality as meeting or not meeting minimum legal and professional requirements. Titman and Trueman (1986) opine that audit quality is the accuracy of the information reported by auditors. The values of auditing services are broadened beyond professional competence and independence. The definitions identified above have been widely criticised because these definitions are difficult to operationalise (Francis, 2004). Users of financial statements are not capable of determining whether the audit report reflects the existence of material misstatements or that the accounts provide an accurate reflection of the company’s true state of affairs (Institute of Chartered Accountants of England and Wales, 2010). This is attributable to the fact that neither party is facilitated with an opportunity to access the evidence gathered or to the information audited throughout the audit process and thus cannot directly assess the degree of actual audit quality provided (Dang, 2004). Therefore, in the absence of a direct measure of actual audit quality, a variety of different proxies have been developed in an attempt to quantify audit quality. The Financial Reporting Council (FRC, 2008) states that audit quality is dynamic, the indicators and drivers of audit quality change over time. Therefore, the definition of DeAngelo (1981) might not be all-embracing anymore. Though, the Financial Reporting Council does not give a precise definition, yet, it gives five main drivers of audit quality: the audit firm’s culture and the personal qualities of auditor, skills of staff and audit partners; the audit process’ effectiveness; the usefulness and reliability of audit reporting; and factors that affect audit quality outside the audit firm’s control. DeFond and Zhang (2013) define audit quality as the assurance that the relevant information about the firm’s underlying economic conditions, the firm’s innate features and financial reporting practices are faithfully represented in the financial statement. It is important to note that the perception of audit quality can depend very much on the eyes through which we see the concept. Users, auditors, regulators and society-all stakeholders in the financial reporting process-may have varying opinions as regards the make-up of audit quality, which will influence the type of indicators one uses to evaluate audit quality. Therefore, in this study, we define audit quality operationally as a continuous construct that maps closely into financial reporting quality. The users of the financial report believe that high-quality audit means the absence of material misstatements. The auditor conducting the audit may define high-quality audit as satisfactorily completing all tasks required by the firm’s audit methodology. Regulators may view a high-quality audit as one that is in compliance with professional standards. Finally, society may consider a high-quality audit as one that prevents economic problems for an organisation. In the end, different suggestions were raised based on various proxies (Knechel, Krishnan, Pevzner, Shefechik & Velury, 2012).
2.1.2 Audit Tenure and Audit Quality
According to Oxera (2006), the process of choosing a company’s auditor might be influenced by four stakeholders: the audit committee; company management, including the company’s finance director, CEO, and/or chairman; shareholders; and external advisers, such as lawyers, brokers and investment bankers. Bedard and Johnstone (2010) opine that, several companies regarded a good relationship between the (potential) audit partner and the audit committee and other members of the board as important determinants of external auditor choice. According to (Oxera, 2006), several audit committee chairs and audit firms noted that, to choose an auditor, it is essential to have ‘the right chemistry’ with the audit partner. Some others pointed to the importance of having an auditor that can be trusted by the stakeholders (i.e. the audit committee chair, management and shareholder). Two other characteristics of the audit product are important in explaining market dynamics. Firstly, the ability to deliver the audit for a specific company takes time to develop and requires the auditor to learn about the detailed operations of the company. Secondly, the process of switching auditors

31
costs both the company and the audit firm significant amounts of time (and money); hence, both the company and the auditor benefit from building a long-term relationship.
There are several research opinions as to whether long audit tenure reduces audit quality. Some studies find that long tenure does not affect quality (Johnson, Khurana & Reynolds, 2002; Gul, Jaggi, & Krishnan, 2007); others find that quality improves with long tenure (Myers & Omer, 2003; Srinidhi, Leung & Gul, 2010); other studies find that quality reduces with long tenure (Raghunathan 1994; Davis, Soo, & Trompeter, 2009; Chu, Church, & Zhang, 2012). Knechel and Vanstraelen (2007) investigated the impact of auditor tenure upon audit quality by examining a sample of six hundred and eighteen (618) audit reports of private Belgian companies between 1992-1996. They concluded that auditor tenure had no impact on the auditor’s decision to issue a going concern opinion. Similarly, Jackson, Moldrich and Roebuck (2008), utilised the propensity to issue a going concern opinion to measure audit quality when they examined the voluntary switching patterns of publicly listed Australian firms between 1995-2003. Despite concluding that auditor tenure has a positive impact on audit quality, the authors highlight the inherent weaknesses associated with this measure, given that the likelihood of issuing a going concern opinion is contingent on a company requiring such a report. Audit tenure also can decrease audit quality when there is no mandatory audit firm’s rotation; a client has the same audit firm for a long period. This can impair the independency of the audit firm, who can become captive to the client (Francis, 2004). However, knowledge of the client is good and this knowledge might be gone when the client switches to another audit firm too frequently. Another factor that has an effect on audit quality, audit firm alumni, holds that there are alumni of the audit firm who fulfils management position as the audit client. This may impair audit firm’s objectivity and scepticism. Furthermore, the alumni can more easily deceive the audit company because they know the audit firm’s methodology (Francis, 2004). Enofe, Mgbame, Aderin and Ehi-Oshio (2013) analyse the determinants of audit quality in the Nigerian business environment. The researchers empirically examined the relationship between audit quality engagement and the firm-related features such as audit tenure, audit firm size, board independence and ownership structure. Using a regression model to analyse the existence of a significant relationship between audit quality and the firm audit related features. It was found that, audit firm size, board independence and ownership structure were positively related to audit quality. However, only board independence reflected a significant relationship with audit quality, while audit tenure showed a negative relationship with audit quality which was insignificant. Mgbame, Eragbhe and Osazuwa (2012) opine that there is a relationship between audit tenure and audit quality. The technique used in analysing the perceived relationship between the tenure of an auditor and the quality of the audit was the Binary Logistic Model estimation. Other explanatory variables considered in the study were the Returns on Asset (ROA), Board Independence, Director Ownership and Board Size. A negative and insignificant relationship between auditor tenure and audit quality was revealed from their study. There was an inverse relationship between other explanatory variables considered alongside auditor tenure and audit quality; except for Returns on Assets which had a positive effect. Onwuchekwa, Erah and Izedonmi (2012) carried out a study on the relationship between mandatory audit rotation and audit quality. Questionnaires were used to extract information from investors, lecturers, consultants, accountants and auditors in Southern Nigeria. From the hypothesis tested, mandatory audit rotation had no significant relationship on audit quality in Nigeria. A negative relationship between mandatory audit rotation and audit quality was revealed using the binary logistic ordered regression technique. Emphasis was laid on other measures of improving audit quality; by strengthening the board of audit committee and encouraging joint audit to avoid audit opinion monopoly. Siregar, Amarullah, Wibowo and Anggraita (2012) in their study in the Indonesian environment where rotation and appointments of public accountants was for every three (3) years and the appointment of public accounting firms every five (5) years is made compulsory by regulators. The objective of their study was to investigate the effects of auditor rotation and audit tenure of the

32
public accountant and the public accounting firm, on audit quality (considering the pre and post implementation of the mandatory auditor regulation). Mandatory auditor rotation did not increase audit quality from their result. Also, there was no increase in audit quality as it relates with shorter audit tenure (both partner and firm level). Al-Thuneibat, Al-Issa and Ata-Baker (2011) carried out a study on audit firm-client relationship and the size of the audit firm on audit quality in Jordan. With some modifications, the quadratic form approach was used to test their hypotheses. All firms whose stock was publicly traded on the Amman Stock Exchange throughout the years (2002-2006) made-up the population of the study. It was revealed that audit firm tenure affects the audit quality adversely (negatively) from the statistical analysis. As a result of the growth in the magnitude of discretionary accruals, audit quality deteriorated when audit firm tenure was extended. Audit firm size had no significant effect on the correlation between audit firm tenure and audit quality, from the result of data analysis. Hsieh (2011) opines that there is a relationship between evidence of reduced audit quality; proxied by audit partner tenure and estimated discretionary accruals, with a specific client. The Jones’ cross sectional model was used for his analysis. It was found that the estimated discretionary accrual is significantly and negatively related with the lead audit partner’s tenure; in consideration with a specific client. Audit quality was perceived to increase with increased partner tenure. This results as it relates to audit partner tenure was consistent with the findings of Geiger and Raghunandan (2002); Johnson, Khurana, and Reynolds (2002); Myers, Myers, and Omer (2003); and Nagy (2005) and their findings was further expanded by focusing on individual audit partners rather than on audit firms.
2.2 REVIEW OF THEORY
The rational expectation theory was propounded by John Muth in 1960. This theory is an economic ideology where the people make choices based on their rational outlook, available information and past experiences. The theory opines the current expectations in the economy are equivalent to what people think the future state of the economy will be. The theory of rational expectations holds that the value of the auditor’s report is derived from the expert nature of the auditor as an independent, competent professional. Broadly, this is a dynamic theory which holds that as the business community changes so the expectations it has of the auditors’ duty also changes (Millichamp & Taylor, 2012). The work carried out by the auditor should be governed by the rational expectations of those who use their reports so auditors should not disappoint those expectations. Further, auditors should not seek to raise those expectations more than the work they do justify. Limperg’s theory (1966) opines that, the usefulness of the auditor’s opinion is based on the general understanding the society has about the usefulness of audit. Legal considerations aside, the necessity and cost of an audit is borne by companies because of the need of investors and lenders for reliable information to aid their decision making. If the audit process changed so that it ceased to inspire a uniform level of confidence in society, but instead inspired different levels of confidence in different users, society’s confidence in the audit process would decline as the social usefulness of the audit is reduced. Limperg emphasised the social usefulness of auditors in meeting society’s expectations for reliable financial information. The auditor must meet the expectations of the reasonably well informed layman but should not create any greater expectations than can be justified by the work carried out. The auditor thus has a wider responsibility to society and is not simply a watchdog for the shareholders (Millichamp & Taylor, 2012). The demand for and the supply of audit services was addressed in Limperg (1966) Theory of inspired confidence. According to Hayes, Dansses, Schilder and Wattage (2005), the direct consequence of the participation of outside stakeholders in the company is dependent on the demand for audit services. Accountability is demanded by stakeholders in return for their contribution to the company. This is with regards to the level of audit assurance that auditors will provide (the supply side) the expected services. The auditor’s duties should be carried out in a manner that the expectations of stakeholders are not thwarted (Agostini & Favero, 2012).

33
3.1 MATERIALS AND METHODS
The research design adopted for this study was the longitudinal design. The population of this study comprised of all the 186 companies quoted on the floor of the Nigerian Stock Exchange as at 31st December 2015. The sample size of 127 companies was derived from Burley’s formula propounded and popularised by Yamane (1973) for the determination of sample size in a finite population. Further analysis was carried out using data filtering, based on the availability of the required information and at the end; a convenience sample of 60 quoted firms was employed in the study. The secondary source of data was relied upon in this study. The Panel data regression technique was used as data analyses method for the study.
3.2 Model Specification
From the model specified, it is expected that a functional relationship exists between audit industry specialisation, audit tenure and audit quality. The functional relationship is presented thus: AQ = F ( ADTEN)……………………………… (1) Equation (1) is transformed into econometric form as; AQit = β0 + β1 ADTENit + Uit……….(2) Apriori expectation: Presumptively, based on theory and extant literature, it is expected that the explanatory variable will increase the quality of audit. Therefore, β1 ≥ 0. Where: AQ = Audit Quality (The dependent variable) ADTEN = Auditor Tenure β0 = Regression constant β1 = Regression Coefficient i = Entity of each quoted companies at the time (t) t = Time (i.e 2007- 2015) The dependent variable for this study is audit quality. The input- based approach to measuring audit quality was adopted using one of the auditor-client contracting characteristics with emphasis on audit fees charged. The choice of the auditor-client contracting characteristics is based on the fact that it has direct bearing the audit process compared to financial reporting quality, which captures the quality of accounting information and not audit quality. Auditor Tenure shows the length of an auditor-client relationship. It was measured as a dummy variable with the value of one (1) if tenure is three (3) years or more and zero (0) if otherwise. In this study, audit firm was expected to charge higher audit fees over a long tenure. This measure of audit tenure was found in the work of (Ahmed, 2001; Bedard & Johnstone, 2010).
4.1 DATA PRESENTATION, ANALYSIS AND INTERPRETATION
The following table shows the data presentation, analysis and interpretation;
Table 4.1 Descriptive Statistics
AQ ADTEN Mean 21633.47 2.651852 Median 10000.00 3.000000 Maximum 537946.0 3.000000 Minimum 600.0000 1.000000 Std. Dev. 45730.00 0.639672 Skewness 6.689040 -1.623742 Kurtosis 63.76251 4.295912
Jarque-Bera 87098.76 275.0745 Probability 0.000000 0.000000
Sum 11682076 1432.000 Sum Sq. Dev. 1.13E+12 220.5481
Observations 540 540

34
Source: Researchers computation 2016
AQ is the dependent variable audit quality, ADTEN is a measure for audit tenure.
Table 4.1. Presents the result of the descriptive statistics of our balanced panel data of 540 firm-year observations, comprising of sixty (60) Nigerian listed companies over the period 2007 to 2015. The audit tenure (ADTEN) reported a mean value of 2.651852 which means on the average; the auditors spend an average of 2.65 years. Compared to the benchmark of three (3) years which we adopted in the study, it means the rate of switching is relatively low. The Jarque-Bera statistics are relatively large and the probabilities are statistically significant at P<0.05 [ 87098.76 (0.000000) for audit quality and 275.0745 (0.000000) for audit tenure] an indication that the regression variables follow the Gaussian normal distribution. With the exception of the audit fees variable, the standard deviation values are relatively small which shows smaller dispersion from their respective means and an indication of the quality of the regression data. The standard deviation of the variable of audit quality is 45730.00 and the variable of audit tenure reported a standard deviation of 0.639672.
4.2 Data Analysis This section presents the empirical results of the regression models of audit tenure and audit quality. The analysis is based on the input-based measures of audit quality. Considering the panel nature of our data, two basic specifications are allowable: The fixed effect model and the random effect model. The fixed effect model treats the individual effects as a fixed parameter requiring estimation, while the random effect treats individual effect as independent random drawings from a specific distribution. The choice between both effects is determined by the result of the Hausman test.
Table 4.2 Results of the panel regression using fixed and random effect models. FIXED EFFECT RANDOM
EFFECT POOLED
CONSTANT
19379.96 (2.417050)
14523.01 (1.836641)
7406.436 (0.904991)
ADTEN -722.6610 (-0.354857)
-1149.872 (-0.571136)
-1597.553 (-0.531739)
R-SQUARED
0.676955
0.019716
0.091153
ADJUSTED R-SQUARED
0.634199
0.012387
0.084358
F-STATISTIC
15.83302
2.690053
13.41446
PROBABILITY
0.000000
0.030492
0.000000
DURBIN WATSON STATISTIC
0.937657
0.904463
0.598450
HAUSMAN TEST STATISTIC
0.0052
TOTAL BALANCED OBSERVATION
540
540
540
Note* All regressions include a constant. The t-values are in parentheses. The basis of analyses is the 5% level of significance applicable to most management sciences research
The regression result is presented in Table 4.2. The result of the Hausman test rejects the equality of coefficients in the random effect model and the fixed effect model. Consistent with Brooks (2008), the test reveal preference for the fixed effect model with a probability value of 0.0052. The adjusted R-squared of the fixed effect model is 0.634199 which means that about 63% of the cross-

35
sectional systematic variation in the dependent variable of audit quality is accounted for by the explanatory variable of audit tenure (ADTEN). The F-statistic of 15.83302 and the associated probability value of (0.000000) is robust and statistically significant. It indicates that a significant linear relationship exist between the dependent variable and the explanatory variable.
4.3 Test of Hypothesis: Audit tenure is not significantly related to audit quality
Expectedly, the explanatory variable of audit tenure reported a negative coefficient of -722.6610 and a negative t-value of -0.354857. The implication of the result is that there is a negative relationship between audit tenure and audit quality, meaning that as the tenure of the auditor with a particular client increases, the quality of the audit exercise decreases. The result of the study could not reject the null hypothesis of no significant relationship between audit tenure and audit quality; hence the null hypothesis was accepted and the alternate hypothesis was rejected. This states that, audit tenure is not significantly related to audit quality.
4.4 Discussion of Results and Findings
The justification for the negative relationship is that the long auditor tenure in the particular industry may tend to reduce the attention and focus of the auditor due to over familiarisation. Because the auditor is familiar with the workings of the industry, he may be tempted to overlook details, and this may translate into lesser audit quality. The relationship between audit tenure and audit quality was negative, meaning that the more time or years the auditor spends with the client, the lower the audit quality. Our negative relationship corroborates extant literature on the relationship between audit tenure and audit quality (Chu, Church, & Zhang, 2012; Davis, Soo, & Trompeter, 2009; Enofe et al. (2013); Mgbame et al. (2012); Raghunathan, 1994). The justification of the negative relationship between audit tenure and audit quality is premised on so many factors. It is believed that longer period of audit services with a particular auditor may jeopardise the independence of the external auditor and this will, in turn, reduce the quality of the audit (Francis, 2004). To him, where a particular auditor spends too much time with a client, the auditor tends to become a hostage to the client and the objectivity of the audit process becomes doubtful. There is also the possibility of the auditor being financially dependent on the auditee. In the same vein, it is believed that the more time the auditor spends with a particular client, there is serious bonding which may not allow for an unbiased assessment of the activities of the auditee (Whittington, Gout & Jewitt, 1998). These factors will no doubt work together to reduce the quality of audit. The negative relationship, however, runs contrary to the belief that a long-standing relationship between the auditor and auditee will increase the auditor’s knowledge of the activities of the auditee through the theory of learning curve. This increased knowledge according to St. Pierre and Anderson (1984) will help the auditor deliver good quality audit. The positive relationship between audit tenure and audit quality is also supported by extant empirical literature (Myers & Omer, 2003 and Srinidhi, Leung, & Gul, 2010).
5.1 CONCLUSION AND RECOMMENDATION
Audit tenure and audit firm industry specialisation had a negative but significant relationship with audit quality. The justification for this is that as an auditor prolong his tenure in a particular industry; his attention on the audit tends to reduce due to familiarity. He may be tempted to overlook details which may translate to lower audit quality. It is recommended that there should be a switch between specialist and non-specialist. The non-specialist learning on the job is likely to do a more detailed job which will no doubt increase the quality of the audit. Or at the very best, the switch may be from one specialist audit to another. A government regulation on mandatory audit firm rotation for all listed companies in Nigeria should be adopted, similar to what is obtainable in the developed economy of the United States of America.

36
REFERENCES
Adeyemi, S. B., Okpala, O., & Dabor, E. L. (2012). The factors affecting audit quality in Nigeria. International Journal of Business and Social Science, 2(1), 198 – 209.
Agostini, M., & Favero, G. (2012). Accounting fraud, business failure and creative auditing: A micro-
analysis of the strange case of Sunbeam Corp. Working paper series. Department of Management. Ca’ Foscari University of Venice, Italy.
Al-Thuneibat, A. A., Al-Issa, R. T., & Ata-Baker, R. A. (2011). Do audit tenure and firm size contribute
to audit quality: Empirical evidence from Jordan. Managerial Auditing Journal, 26(4), 317-334.
Bain, J.S. (1956). Barriers to new competition. London, Harvard University Press. Bedard, J. C., & Johnstone, K.M. (2010). Audit partner tenure and audit planning and pricing.
Auditing: A Journal of Practice & Theory, 29(1), 45–70. Beattie, V. (2012). Competition commission statutory audit market investigation initial review of
relevant academic literature. Carey, P., & Simnett, R. (2006). Audit partner tenure and audit quality. The Accounting Review,
81(3), 653-676. Chu, L., Church, B., & Zhang, P., (2012). Does long tenure erode auditor independence? Working
paper, Wilfred Laurier University. Dang, L. (2004). Assessing Actual Audit Quality. Ph.D. Thesis, Faculty of Drexel University. DeAngelo, L. (1981a). Auditor independence, “low balling” and disclosure regulation. Journal of
Accounting and Economics, 3(1), 113-127. DeAngelo, L. E. (1981b). Auditor size and audit quality. Journal of accounting and economics, 3(3),
183-199. Defond M., & Zhang J. (2014). A review of archival auditing research. Journal of Accounting and
Economics. 58(2-3), 275-326. Enofe, A. O., Mgbame, C. O., Adeyemi, A., & Ehi – Oshio, O. U. (2013). Determinants of audit
quality in the Nigeria business environment. Research Journal of Finance and Accounting, 4(4), 36 – 43.
Financial Reporting Council (FRC) (2006). Promoting audit quality. Discussion Paper. London:
Financial Reporting Council. Francis, J.R. (2004). What do we know about audit quality? The British Accounting Review, 36(3), 45-68. Geiger, M.A., & Raghunandan, K. (2002). Auditor tenure and audit reporting failures. Auditing Journal, 21(1), 67-78. Gul, F.A., Yu Kit Fung, S., & Jaggi, B. (2009). Earnings quality: Some evidence on the role of
auditor tenure and auditors’ industry expertise. Journal of Accounting and Economics, 47(3), 265-287.
Hayes, R., Dansses, R., Schilder, A., & Wattage P. (2005). Principles of auditing. An introduction to
International Standards on Auditing, (2nd ed.): England. Pearson Education Limited.

37
Hsieh, M. T. (2011). Does audit partner tenure influence on audit quality? Asian Journal of Management, 123, 8(2), 11-26.
ICAEW (2010). Audit quality: Challenges for international consistency [Online]. Available at:
http://www.icaew.com/~/media/Files/Technical/Audit-and-assurance/audit-quality/audit-quality-forum/meeting-notes-2010/audit-quality-challenges-for-international-consistency-5-jul-10.pdf (Accessed 12 May 2016).
Jackson, A. B., Moldrich, M., & Roebuck, P. (2008). Mandatory audit firm rotation and audit Quality.
Managerial Auditing Journal, 23(5), 420–437. Johnson, V. E., Khurana, I. K., & Reynolds, K. J. (2002). Audit-firm tenure and the quality of
financial reports, in: Contemporary Accounting Research, 19(4), 637-660. Kallapur, S., Sankaraguruswamy, S., & Zang, Y. (2010). Audit market concentration and audit
quality. Working Paper, Indian School of Business, obtained at: http://ssrn.com/abstract-1546356.pdf accessed on 26/03/2016.
Krishnan, G.V. (2003). Audit quality and the pricing of discretionary accruals: Auditing. A Journal of
Practice & Theory, 22 (1), 213-225. Knechel, W. R., Krishnan, G. V., Pevzner, M., Shefchik, L., & Velury, U. (2012). Audit quality
indicators: Insights from the academic literature. Retrieved April 25 2016 from http://ssrn.com/abstract.
Limperg, T. (1966). Theory of values and cost. Abacus Journal, 2(1), 3-23. Mgbame, C. O., Eragbhe, E., & Osazuwa, N. P. (2012). Audit partner tenure and audit quality: An
empirical analysis. European Journal of Business and Management, 4(7), 154-162. Millichamp, A.H. & Taylor, J.R. (2012). Auditing: (9 th ed.). London: Cengage Learning. Myers J., Myers, L. A., & Omer, T. C. (2003). Exploring the term of auditor-client relationship and
the quality of earnings: A case for mandatory auditor rotation, The Accounting Review, 78(3), 779-799.
Nagy, A. (2005). Mandatory audit firm turnover, financial reporting quality, and client bargaining
power: The case of Arthur Andersen. Accounting Horizons, 19(2), 51-68. Onwuchekwa, J. C., Erah, D. O., & Izedonmi, F. (2012). Mandatory audit rotation and audit quality:
Survey of southern Nigeria. Research Journal of Finance and Accounting, 3(8), 70-77. Oxera Consulting (2006). Competition and choice in the U.K. audit market: Prepared for the
department of trade and industry and Financial Reporting Council. Oxera Consulting (Oxford, UK). Available online at http://www.frc.org.uk/images/uploaded/documents/ Competition%20and%20choice%20in%20the%20UK%20audit%20market1.pdf (accessed April, 2016).
Raghunandan, K. (2003). Non-audit services and share holder ratification of auditors, in: Auditing. A
Journal of Practice & Theory, 22 (1), 155-163. Siregar, S. V., Amarullah, F., Wibowo, A., & Anggraita, V. (2012). Audit tenure, auditor rotation and
audit quality: The case of Indonesia. Asian Journal of Business and Accounting, 5(1), 55-74. Titman, S., & Trueman, B. (1986). Information quality and the valuation of new issues. Journal of
Accounting and Economics, 8(2), 159 – 172.

38
Verbruggen, S., Christiaens, J., Reheul, A. & Caneghem, T. (2011). Audit Pricing in a Reformed Non – Profit Market. HUB Research Papers/2011/29 Economics & Management, November. Accessed on https://lirias.kuleuven.be 13th January, 2016
Velte, P., & Stiglbauer, M. (2012). Audit market concentration and its influence on audit quality.
International Business Research, 5(11), 146-161. World Bank (2006). Bank disclosure index. Global assessment of bank disclosure practices.
Retrieved from http://www.worldbank.org/ accessed.

39
APPENDIX:
INPUT-BASED AUDIT QUALITY MEASURE (LUFEE)
Dependent Variable: LUFEE Method: Panel Least Squares Date: 08/27/16 Time: 13:30 Sample: 2007 2015 Periods included: 9 Cross-sections included: 60 Total panel (balanced) observations: 540
Variable Coefficient Std. Error t-Statistic Prob. C 7406.436 8183.987 0.904991 0.3659
ADTEN -1597.553 3004.391 -0.531739 0.5951
R-squared 0.091153 Mean dependent var 21633.47
Adjusted R-squared 0.084358 S.D. dependent var 45730.00 S.E. of regression 43758.67 Akaike info criterion 24.21998 Sum squared resid 1.02E+12 Schwarz criterion 24.25972 Log likelihood -6534.395 Hannan-Quinn criter. 24.23552 F-statistic 13.41446 Durbin-Watson stat 0.598450 Prob(F-statistic) 0.000000
Dependent Variable: LUFEE Method: Panel Least Squares Date: 08/27/16 Time: 13:31 Sample: 2007 2015 Periods included: 9 Cross-sections included: 60 Total panel (balanced) observations: 540
Variable Coefficient Std. Error t-Statistic Prob. C 19379.96 8018.022 2.417050 0.0160
ADTEN -722.6610 2036.485 -0.354857 0.7229
Effects Specification Cross-section fixed (dummy variables) R-squared 0.676955 Mean dependent var 21633.47
Adjusted R-squared 0.634199 S.D. dependent var 45730.00 S.E. of regression 27658.17 Akaike info criterion 23.40412 Sum squared resid 3.64E+11 Schwarz criterion 23.91275 Log likelihood -6255.111 Hannan-Quinn criter. 23.60304 F-statistic 15.83302 Durbin-Watson stat 0.937657 Prob(F-statistic) 0.000000

40
Dependent Variable: LUFEE Method: Panel EGLS (Cross-section random effects) Date: 08/27/16 Time: 13:33 Sample: 2007 2015 Periods included: 9 Cross-sections included: 60 Total panel (balanced) observations: 540 Swamy and Arora estimator of component variances
Variable Coefficient Std. Error t-Statistic Prob. C 14523.01 7907.374 1.836641 0.0668
ADTEN -1149.872 2013.307 -0.571136 0.5681
Effects Specification S.D. Rho Cross-section random 33374.68 0.5928
Idiosyncratic random 27658.17 0.4072 Weighted Statistics R-squared 0.019716 Mean dependent var 5760.272
Adjusted R-squared 0.012387 S.D. dependent var 28110.01 S.E. of regression 27935.37 Sum squared resid 4.18E+11 F-statistic 2.690053 Durbin-Watson stat 0.904463 Prob(F-statistic) 0.030492
Unweighted Statistics R-squared 0.025993 Mean dependent var 21633.47
Sum squared resid 1.10E+12 Durbin-Watson stat 0.535552

41
Correlated Random Effects - Hausman Test Equation: Untitled Test cross-section random effects
Test Summary Chi-Sq. Statistic Chi-Sq. d.f. Prob. Cross-section random 14.777688 4 0.0052
Cross-section random effects test comparisons:
Variable Fixed Random Var(Diff.) Prob. ADTEN -722.661012 -1149.871859 93868.414824 0.1632
Cross-section random effects test equation: Dependent Variable: LUFEE Method: Panel Least Squares Date: 08/27/16 Time: 13:34 Sample: 2007 2015 Periods included: 9 Cross-sections included: 60 Total panel (balanced) observations: 540
Variable Coefficient Std. Error t-Statistic Prob. C 19379.96 8018.022 2.417050 0.0160
ADTEN -722.6610 2036.485 -0.354857 0.7229
Effects Specification Cross-section fixed (dummy variables) R-squared 0.676955 Mean dependent var 21633.47
Adjusted R-squared 0.634199 S.D. dependent var 45730.00 S.E. of regression 27658.17 Akaike info criterion 23.40412 Sum squared resid 3.64E+11 Schwarz criterion 23.91275 Log likelihood -6255.111 Hannan-Quinn criter. 23.60304 F-statistic 15.83302 Durbin-Watson stat 0.937657 Prob(F-statistic) 0.000000

42
The board composition and Financial Performance of the Listed Manufacturing Companies in Nigeria
Yakubu Yahaya
Department of Business Administration, School of Management Studies, Abubakar
Tafari Ali Polytechnic, P M B 009, Bauchi State [email protected]
_____________________________________________________________________________
ABSTRACT
This study was conducted to provide empirical evidence on the relationship that seems to exist between board composition and financial performance using data from the listed manufacturing companies in Nigeria. In this study, the board composition was proxy by board size, board diversity and board experience while financial performance was proxy with return on capital employed. The study used a sample of 30 companies drawn from the 74 listed manufacturing companies in Nigeria. Only secondary data was collected and analyzed using both descriptive and inferential statistics. The results of the data analysis revealed that Board size has an inverse relationship with the return on the capital employed. The relationship is statistically significant, necessitating the rejection of the null hypothesis that there is no significant relationship between the board composition measured by board size and financial performance measured by return on capital employed. Similarly, an inverse relationship was also found between the board experience and the return on capital employed. The only independent variable that shows a significant positive relationship with the dependent variable is board diversity. Key words:
Board composition, Board size, Board diversity, Board experience, Return on capital employed
1. INTRODUCTION
The debate on the board composition as a corporate governance mechanism has received steadfast attention in recent years from academics, market participants, and regulators. This steadfast debate is attributable to the perceived belief that the success of any organization is largely influenced by the quality of directors serving on the board of such organization (Kula, 2005). Also, as reported by Useem (2006), the steadfast interest in board research is sustained by such issues as the important governance oversight role that boards are expected to play, the presumed frequency with which they are negligent in this role, and their association with high-profile corporate failures. Additionally, large bloc investors such as public pensions may also serve as a magnet for researchers since their objection to board independence often captures mass media attention (Brickley, Coles, & Jarrell, 1997). However, despite the unwavering interest and voluminous research into the relationship between corporate boards and firm performance, empirical results display a remarkable lack of consensus (Zajac & Westphal, 1996). The literature outlined three categories of empirical finding to include little or no relationship (Adams & Ferreira, 2007; Harris & Raviv, 2008), negative relationship (Linck et al., 2006 & Coles et al., 2008) and, positive relationship (Kula, 2005 & Useen, 2006). Empirical evidences in favour of boards having little or no influence on financial performance is a confirmation of the age longed perception of board failure. For example, over seventy-five years ago Berle and Means (1932) posited that corporate boards had neither the incentive nor the ability to objectively represent the interests of shareholders. They argued that rather than provide independent oversight functions for top management decision making, corporate boards would simply affirm executive decisions. Decades later, Boulton (1978) postulated that boards had failed to evolve much beyond a passive, rubber-stamping committee for management, in essence being indolent. Barnhart, Marr, and Rosenstein (1994) found little evidence to suggest that board composition is important to the quality of overall firm performance.

43
Those who reported negative relationship between board composition and performance supported it with the evidence that a well composed board tends to be very large, thus, resulting in extra cost to the organization. In support of a positive relationship, Managenelli and Klein (1994) posited that a firm with a well-composed board immensely performed better than those that failed to incorporate a well composed board. Notably, numerous regulatory authorities including the International Corporate board Network (ICGN) and the Organization for Economic Corporation and Development (OECD) have, over the time, established frameworks for the composition of corporate board. This study is therefore set to provide empirical evidence on the relationship that seems to exist between board composition and financial performance using data from the listed companies in Nigeria. In this study, the board composition was proxy by board size, board diversity and board experience while financial performance was proxy with return on capital employed. 2. BOARD COMPOSITION AND FINANCIAL PERFORMANCE: AN EMPIRICAL REVIEW
The study by Meyer and Wet (2013) focuses on the role of the corporate board of directors and the relationship between the dynamics of board structure and the financial performance of listed South African companies. The research found that the proportion of independent non-executive directors had a significant positive effect on firm performance as measured by earnings per share and enterprise value, but had no significant effect on Tobin’s Q ratio. Board ownership had a significant negative correlation with firm performance as measured by earnings per share, enterprise value and Tobin’s Q ratio. The number of directors serving on the corporate board had a significant positive effect on firm performance as measured by earnings per share, enterprise value and Tobin’s Q ratio. The study suggests that greater independent non-executive director representation, lower board share-ownership and larger board sizes should be encouraged to enhance firm performance. In another study, Vincent, Peter, Martins and Eric (2015) surveyed forty-six companies listed at the Nairobi Securities Exchange. Using multivariate regression analysis on panel data, with Return on Assets, Return on Equity, and Dividend Yield as performance indicators, the study found out that independent board members had insignificant effect on financial performance, but gender diversity have significant positive effect on financial performance. Board size, on the other hand, had an inverse relationship with financial performance. These results are largely consistent with conceptual and empirical literature on corporate governance with respect to small board size (5 to 7) that is sufficiently diverse in terms of gender, skill, experience, industry networks, among other important attributes. Regarding outside directors, however, the findings of this study appear to contradict the long-held traditional view that outsiders confer superior performance to the board The study by Raymond, Paul and Jaeyoung (2010) also contributed to the existing body of knowledge on corporate governance. The purpose of the study was to examine the influence of corporate boards’ composition on firm financial performance in the new era of Sarbanes-Oxley (SOX). The study drew a sample of 200 companies on the US stock exchange listed companies. Integrating the key characteristics of the SOX regulations, they relate board compositions to firm performance by expanding the traditional one or two measures to five with the use of ordinary least square regression. They therefore reported that duality, occupational expertise, board size, and board tenure had significant influences on firm financial performance. Wetukha (2013) also established the relationship between board composition and financial performance of listed firms at the Nairobi Securities Exchange. Specifically, this study examined board size, gender diversity, board independence and CEO duality and how they affect the financial performance of listed firms in Kenya. Firm performance was measured using Return on Assets (ROA). A descriptive research design was adopted by the study and data was analyzed using a multiple linear regression model. The study population was all the firms quoted at the Nairobi Securities Exchange from January 2008 to December 2012. Secondary data were collected using documentary information from the Nairobi Securities Exchange Notebook for the periods 2008 to 2012. The study found a positive relationship between board independence, board size and CEO duality and the financial performance of companies listed at the NSE. Ammari, Kadria and Ellouze (2014) also examine whether board composition (board size, independence of its members and the cumulative functions of decision and control) influence

44
financial performance using a sample of 40 French companies listed on the SBF 120 for the period 2002-2009. To test the validity of the study hypothesis, which states that there is no significant relationship between the board structure and financial performance measured by four different ratios, namely return on assets, return on equity, Tobin's Q and Market to Book, they developed four dynamic panel system GMM approach to control for relevant sources of endogeneity (simultaneity, reverse causality and unobserved heterogeneity). Their results support the existing literature that board structure is a determinant factor for firm financial performance. Another study by Tukur and Abubakar (2014) whose major objective was to investigate the relationship between board diversity and financial performance of insurance companies in Nigeria, with specific reference to how gender diversity, ethnic diversity, board size, board composition and foreign directorship affect financial performance of insurance companies listed on the Nigerian Stock Exchange. The study selects 12 listed insurance companies using non-probability sampling method in the form of availability sampling technique for a period of 6 years i.e. 2004 to 2009. Using ROA, ROE and TOBIN’s Q as measures of firm performance and applying Feasible Generalized Least Squares (FGLS) and random effects estimators, the findings of this study reveal that gender diversity and foreign directors have a positive influence on insurance companies’ performance. But the findings indicate a negative and significant relationship between board composition and performance of insurance companies in Nigeria. Furthermore, the study by Uadiale (2010) examines the impact of board structure on corporate financial performance in Nigeria. It investigates variables such as the composition of boards of directors in Nigerian firms and analyses whether board structure has an impact on financial performance, as measured by return on equity (ROE) and return on capital employed (ROCE). Based on the extensive literature, four board characteristics (board composition, board size, board ownership and CEO duality) were identified by the researcher as possibly having an impact on corporate financial performance and these characteristics are set as the independent variables. The Ordinary Least Squares (OLS) regression was used to estimate the relationship between corporate performance measures and the independent variables. Findings from the study show that there is strong positive association between board size and corporate financial performance. Evidence also exists that there is a positive association between outside directors sitting on the board and corporate financial performance. However, a negative association was observed between directors’ stockholding and firm’s financial performance measures. In addition, the study reveals a negative association between ROE and CEO duality, while a strong positive association was observed between ROCE and CEO duality. 3. RESEARCH METHODOLOGY
3.1 Research Design
This study adopts descriptive research design. Orodho (2003) defines research design as the scheme outline or plan that is used to generate answers to research questions. Maxwell (2012) on the other hand states that a descriptive research design is useful when the researcher objectives include determining the degree to which one variable called dependent variable is influenced by other variables known as independent variable. Therefore, this research design will be selected for the reasons that, it helps to establish the effect of board composition on financial performance of listed manufacturing companies over a prescribed ten one-year period from January 2006 to December 2015. 3.2 Population
Burns and Grove (2003) describe population as all the elements that meet the criteria for inclusion in a study. A population is defined as total collection of elements about which we wish to make some inferences (Cooper & Schinder, 2011). Mcmillian and Schumacher (2010) define population as a large collection of subjects from where a sample can be drawn. Based on the above definitions of study population, the population for this study is all the listed 74 manufacturing companies in Nigeria from where a sample of 30 companies was purposively drawn.

45
3.3 Data Collection Instruments
This study will use secondary methods of data collection. The secondary data will be collected through the company’s published audited financial statements of the listed manufacturing companies in Nigeria in order to investigate whether board composition influences financial performance of listed manufacturing companies. 3.4 Data processing and analysis
Data analysis is the processing of data to make meaningful information. Saunders, Lewis and Thornhill (2009) defined data analysis as the mechanism for reducing and organizing data to produce findings that require interpretation by researcher. According to Hyndman (2008), data processing involves translating the answers on a questionnaire or data collection sheets into a form that can be manipulated to produce statistics. This involves coding, editing, data entry, and monitoring the whole data processing procedure. Data collected will be analyzed by editing, coding and categorizing through the use of statistical package for social sciences (SPSS) version 20.0 computer software. Descriptive and inferential statistics will be use to analyze and interpret the data collected for this research. Specifically, descriptive statistics related to means and standard deviation. Inferential statistics included correlation and regression analysis. 3.4.1 Model Specification
With regression analysis, the study will assess the effects of independent variable on the dependent variable. The Multivariate regression model is as laid below as the Equation shows the linear regression model of the independent variable against the dependent variable. ROCE = β0+ β1 (BSt )+ β2 (BDt)+ β3 (BEt ) + e Where: ROCE= Return on capital employed BSt= Board Size BDt= Board Diversity BEt= Board Experience β0 = regression output constant β1 - β3 = the coefficient of independent variables e = Error Term 4. RESULTS AND DISCUSSIONS
4.1 Descriptive Statistic
The summary statistics for the financial performance (return on capital employed) and board composition (board size, board diversity and board experience) were presented in table 1 for a sample of 30 companies selected for this study. The summary statistics include the mean, standard deviation, minimum value and maximum. As stated earlier, the board size represents the total number of board members on the board of each company. Board diversity was taken as the total number of female directors on the board, while the board experience was measured using the total number of board members serving on the board of other companies. As presented in table 1, the board size ranges from 5 to 19 with a mean value of 11.72 and standard deviation of 1.94 indicating a wide variation in the size of the board across different companies in the manufacturing sector of the Nigeria economy. For the board diversity, the average value is 2.99 while the least and the highest are 1 and 4 respectively. The results for board diversity also revealed that no significant variation exists in board gender practices for the sample selected for this study. It can also be observed from table 1 that the company with the least experience board has two of its member serving on the board of other companies, while the company with the highest experience board has nine of its members serving on the board of other companies. Similarly, the mean value for the return on capital employed is 1.03, while the standard deviation is 0.21 indicating more or less little or no variation in the return on capital employed of the companies

46
selected for the study. The minimum and maximum values are also not significantly different across the companies in this sector. Table 1 Summary Statistics for Dependent and Independent Variables
Mean Std. Dev Min. Max. No of Obs.
Board Size 11.72 1.94 5 19 300
Board Diversity 2.99 0.46 1 4 300
Board Experience 4.25 2.08 2 9 300
Return on Capital Employed 1.03 0.21 0.98 2.31 300 4.2 Inferential Statistic
In this study, Pearson correlation coefficient and ordinary least square regression were conducted to determine the strength of the relationship between the board composition and financial performance as well as the impact of board composition on the financial performance of the listed manufacturing companies in Nigeria. 4.2.1 Pearson Correlation Coefficient Results
Correlation matrix is used to determine the extent to which changes in the value of an attribute is associated with changes in another attribute. The correlation coefficient according to Kothari and Garg (2014) ranges from -1 to +1, with -1 indicating a perfect negative correlation, +1 indicating a perfect positive correlation, and 0 indicating no correlation at all. Table 2 revealed that a strong positive correlation exist between return on capital employed and board size at 0.572. The correlation between return on capital employed and board diversity was also positive and significant with a correlation coefficient of 0.568. In a similar manner, a significant correlation was also found between return on capital employed and board experience at 0.504. Also, in table 2, all the independent variables were found to have a positive correlation with one another. The highest correlation was found between the board size and board diversity with a correlation coefficient of 0.568, while the least correlation was found between board size and board experience. It can be inferred that there was no multicolinearity in the variable for this study since the highest correlation is 0.572, which is less than 0.8 recommended in the literature.
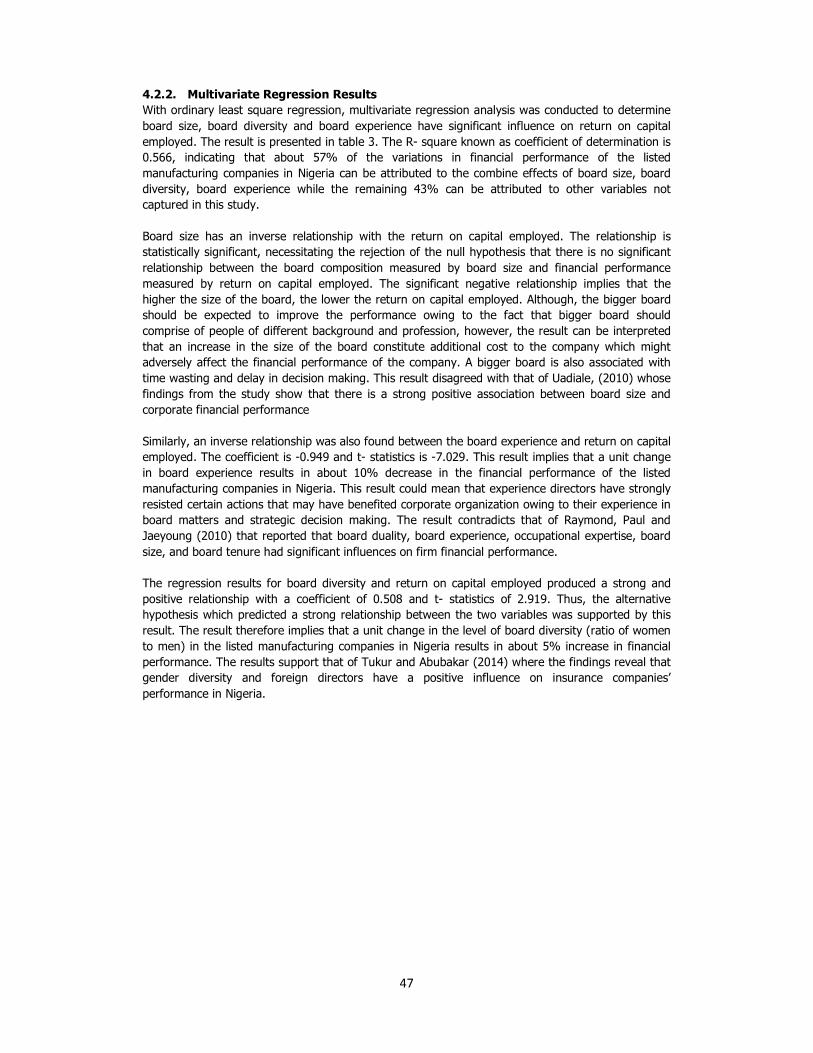
47
4.2.2. Multivariate Regression Results
With ordinary least square regression, multivariate regression analysis was conducted to determine board size, board diversity and board experience have significant influence on return on capital employed. The result is presented in table 3. The R- square known as coefficient of determination is 0.566, indicating that about 57% of the variations in financial performance of the listed manufacturing companies in Nigeria can be attributed to the combine effects of board size, board diversity, board experience while the remaining 43% can be attributed to other variables not captured in this study. Board size has an inverse relationship with the return on capital employed. The relationship is statistically significant, necessitating the rejection of the null hypothesis that there is no significant relationship between the board composition measured by board size and financial performance measured by return on capital employed. The significant negative relationship implies that the higher the size of the board, the lower the return on capital employed. Although, the bigger board should be expected to improve the performance owing to the fact that bigger board should comprise of people of different background and profession, however, the result can be interpreted that an increase in the size of the board constitute additional cost to the company which might adversely affect the financial performance of the company. A bigger board is also associated with time wasting and delay in decision making. This result disagreed with that of Uadiale, (2010) whose findings from the study show that there is a strong positive association between board size and corporate financial performance Similarly, an inverse relationship was also found between the board experience and return on capital employed. The coefficient is -0.949 and t- statistics is -7.029. This result implies that a unit change in board experience results in about 10% decrease in the financial performance of the listed manufacturing companies in Nigeria. This result could mean that experience directors have strongly resisted certain actions that may have benefited corporate organization owing to their experience in board matters and strategic decision making. The result contradicts that of Raymond, Paul and Jaeyoung (2010) that reported that board duality, board experience, occupational expertise, board size, and board tenure had significant influences on firm financial performance. The regression results for board diversity and return on capital employed produced a strong and positive relationship with a coefficient of 0.508 and t- statistics of 2.919. Thus, the alternative hypothesis which predicted a strong relationship between the two variables was supported by this result. The result therefore implies that a unit change in the level of board diversity (ratio of women to men) in the listed manufacturing companies in Nigeria results in about 5% increase in financial performance. The results support that of Tukur and Abubakar (2014) where the findings reveal that gender diversity and foreign directors have a positive influence on insurance companies’ performance in Nigeria.
48
Table 3: Regression Results for Board Composition and ROCE
5. CONCLUSION AND RECOMMENDATIONS
This study sets to provide empirical evidence on the relationship that seems to exist between board composition and financial performance using data from the listed manufacturing companies in Nigeria. In this study, the board composition was proxy by board size, board diversity and board experience, while financial performance was proxy with return on capital employed. The study relied heavily on the secondary data extracted from the audited financial statements of the 30 listed manufacturing companies selected for the study. Both descriptive and inferential statistics were conducted in this study. The descriptive statistics include the mean, standard deviation, minimum value and maximum while the inferential statistics are correlation and regression analysis. The results of the data analysis revealed that Board size has an inverse relationship with the return on the capital employed. The relationship is statistically significant, necessitating the rejection of the null hypothesis that there is no significant relationship between the board composition measured by board size and financial performance measured by return on capital employed. Similarly, an inverse relationship was also found between the board experience and return on capital employed. The only independent variable that shows a significant positive relationship with the dependent variable is board diversity. It is therefore recommended that listed manufacturing companies should avoid too large a board in order to improve their performance. They might also increase the ratio of women to men on the board as this was found to positively influence the financial performance.
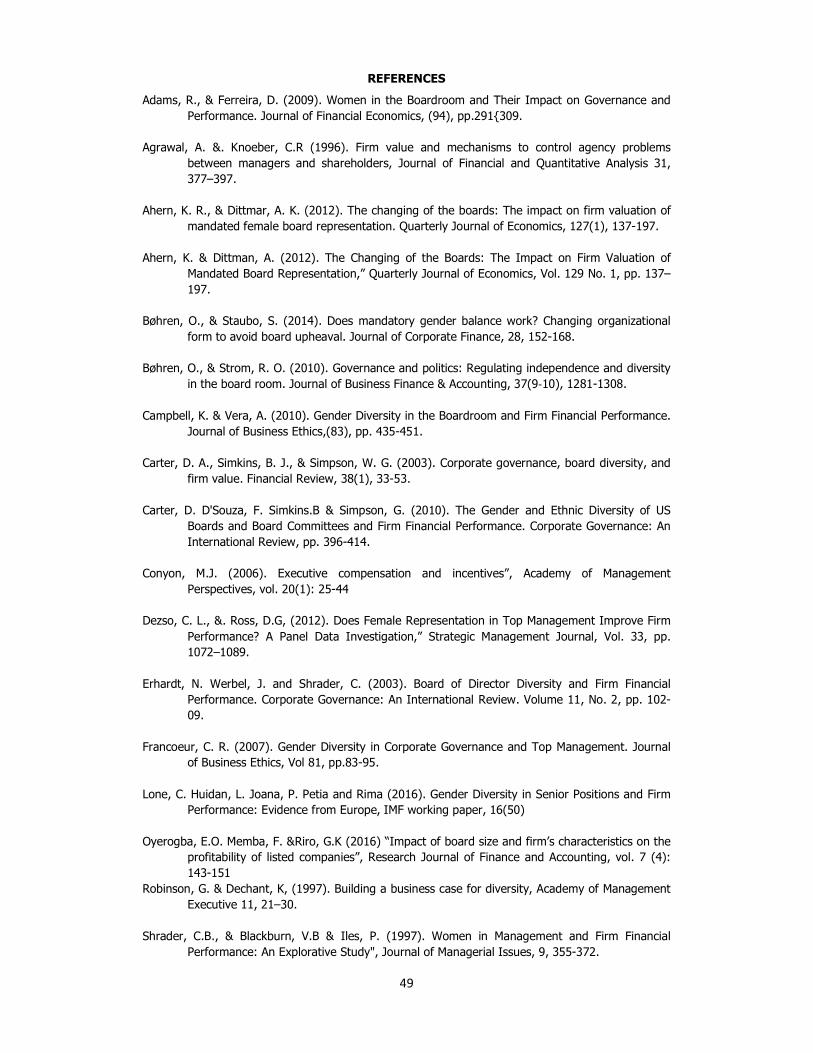
49
REFERENCES
Adams, R., & Ferreira, D. (2009). Women in the Boardroom and Their Impact on Governance and Performance. Journal of Financial Economics, (94), pp.291{309.
Agrawal, A. &. Knoeber, C.R (1996). Firm value and mechanisms to control agency problems
between managers and shareholders, Journal of Financial and Quantitative Analysis 31, 377–397.
Ahern, K. R., & Dittmar, A. K. (2012). The changing of the boards: The impact on firm valuation of
mandated female board representation. Quarterly Journal of Economics, 127(1), 137-197. Ahern, K. & Dittman, A. (2012). The Changing of the Boards: The Impact on Firm Valuation of
Mandated Board Representation,” Quarterly Journal of Economics, Vol. 129 No. 1, pp. 137–197.
Bøhren, O., & Staubo, S. (2014). Does mandatory gender balance work? Changing organizational
form to avoid board upheaval. Journal of Corporate Finance, 28, 152-168. Bøhren, O., & Strom, R. O. (2010). Governance and politics: Regulating independence and diversity
in the board room. Journal of Business Finance & Accounting, 37(9‐10), 1281-1308. Campbell, K. & Vera, A. (2010). Gender Diversity in the Boardroom and Firm Financial Performance.
Journal of Business Ethics,(83), pp. 435-451. Carter, D. A., Simkins, B. J., & Simpson, W. G. (2003). Corporate governance, board diversity, and
firm value. Financial Review, 38(1), 33-53. Carter, D. D'Souza, F. Simkins.B & Simpson, G. (2010). The Gender and Ethnic Diversity of US
Boards and Board Committees and Firm Financial Performance. Corporate Governance: An International Review, pp. 396-414.
Conyon, M.J. (2006). Executive compensation and incentives”, Academy of Management
Perspectives, vol. 20(1): 25-44 Dezso, C. L., &. Ross, D.G, (2012). Does Female Representation in Top Management Improve Firm
Performance? A Panel Data Investigation,” Strategic Management Journal, Vol. 33, pp. 1072–1089.
Erhardt, N. Werbel, J. and Shrader, C. (2003). Board of Director Diversity and Firm Financial
Performance. Corporate Governance: An International Review. Volume 11, No. 2, pp. 102-09.
Francoeur, C. R. (2007). Gender Diversity in Corporate Governance and Top Management. Journal
of Business Ethics, Vol 81, pp.83-95. Lone, C. Huidan, L. Joana, P. Petia and Rima (2016). Gender Diversity in Senior Positions and Firm
Performance: Evidence from Europe, IMF working paper, 16(50) Oyerogba, E.O. Memba, F. &Riro, G.K (2016) “Impact of board size and firm’s characteristics on the
profitability of listed companies”, Research Journal of Finance and Accounting, vol. 7 (4): 143-151
Robinson, G. & Dechant, K, (1997). Building a business case for diversity, Academy of Management Executive 11, 21–30.
Shrader, C.B., & Blackburn, V.B & Iles, P. (1997). Women in Management and Firm Financial
Performance: An Explorative Study", Journal of Managerial Issues, 9, 355-372.

50
SEC (2011). Code of corporate governance for public companies retrieved on 28th August, 2013 from http://www.sec.gov.ng/
Singh, V., & Vinnicombe S. (2004), "Why so FewWomen Directors in Top UK Boardrooms: Evidence
and Theoretical Explanations", Corporate Governance: An International Review, 12, 479-488.
Smith, N., V. Smith, & Verner, M (2005). Do Women in Top Management affect Firm Performance?
A Panel study of 2500 Danish Firms,” Discussion Paper August (Bonn: Institute for the Study of Labor).
Schwartz-Ziv, M., (2013). Does the Gender of the Directors Matter?” Working Paper No. 8, Edmond
J. Safra Center for Ethics Working Paper Series, Harvard. Terjesen, S., B. Couto, F. & Francisco, P.M (2015). Does the Presence of Independent and Female
Directors Impact Firm Performance? A Multi-Country Study of Board Diversity,” Journal of Management & Governance, DOI:10.1007/s10997-014-9307-8, pp. 1–37.
51
The Impact of Self Assessment System on Company Income Tax Revenue in Nigeria
ABUSOMWAN Rachael Eloho (Mrs.)
Department of Accounting Faculty of Social and Management Sciences Benson Idahosa University
Correspondence: [email protected], 07030982057, 08058192464
EKWUEME, .C. Mercilina (Ph.D) Lecturer: Department of Accounting, Nnamdi Azikiwe University, Awka, Anambra
State.
And
ATU, Oghogho Gina
Lecturer- Department of Accounting, Igbinedion University, Okada Correspondence: [email protected], +2348065796019
_____________________________________________________________________________
ABSTRACT
The objectives of this study are to investigate if there exist a significant relationship between revenue generation and company income tax in Nigeria and to ascertain if there exist a significant difference in company income tax revenue to government before and after SAS adoption. To provide answers to the stated objective, the research adopted a longitudinal survey research method using data collected from annual reports of FIRS and was analysed using regression analysis and variance analysis (ANOVA) with computer software SPSS and E.View 7.0. After the analysis, it was revealed that an increase in company income tax will result in an increase in tax revenue and that there is a significant difference in Company income tax revenue before and after SAS adoption. Based on the findings it was recommended that simple laws and regulations will facilitate self assessment and that tax administrators should adopt a service oriented attitude towards tax payers etc. Keywords:
Self Assessment, Tax Compliance, Tax Audit, Taxable Income 1.0. INTRODUCTION
Many countries have implemented various measures of increasing their tax revenue collection. One of such measures includes change of assessment system used for direct tax from direct assessment to Self Assessment System (SAS). Self Assessment System (SAS) involves the taxpayer preparing his annual returns, determining its tax liability and producing evidence of the tax paid based on tax liability at the time of filing his returns. The constitution of the Federal republic has provided freedom for implementation of self assessment. S24 (f) states that “It shall be the duty of every citizen to declare his income honestly to appropriate and lawful agencies and pay his tax promptly”. The self assessment system was introduced in Nigeria tax laws in 1991 and it became mandatory in 1998. However, it was not until 2011 that its implementation became effective. Self assessment system is aimed at shifting the duty of raising of assessment to taxpayer. The tax payer is expected to accompany his returns with assessment notice and an evidence of payment to Federal Inland Revenue Service through designated collecting banks. Self assessment can be based on information contained in taxpayers returns together with capital allowance computations along with audited accounts. There is also assessment based on best of judgment. The benefit of this system is to help tax payers to embrace voluntary tax compliance and this will enhance productivity hence increase in growth and development (Malik, 2010). The objective of self assessment system is to make payment of tax easy by allowing tax payers to access themselves to test the honesty and integrity of tax payers and make tax system more friendly.

52
1.1 Statement of the Problem
The assessment and collection of company’s income tax as at when due has been a problem. Thus, the adoption of SAS in a bid to improve tax compliance and facilitate revenue collection. SAS was anticipated to address shortcomings like delay in payment of tax. However, over the years, voluntary compliance has not been completely achieved from tax payers. Self assessment system has faced so many problems over the years like poor compliance rate, outdated tax laws, lack of tax education among tax payers, fraudulent under declaration of income, inadequate penalty provision for tax payers. The need to address these problems led to this study. This study will help the reader understand how prompt compliance can help to improve the society because when there is high revenue generation, the economy will be in a better state and there will be appropriate provision of infrastructure such as good roads, electricity etc. There are number of studies on tax compliance that has been carried out in Nigeria by various researchers in the likes of (Kiabel, 2007; Malik, 2010; Ogungbesan , 2011; Ebimobowei & Peter,2013; Onyegbule,2012;Usman & Anao,2013 ) but none has analysed the impact of self assessment regime on company income tax revenue in Nigeria with an exception to Usman & Anao,2013 who showed the significant difference in company income tax before and adoption of SAS by analyzing three periods, the pre-adoption (1990-1997), the adoption (1998-2010) and the post-adoption( 2011-2013) but this particular research will show the significant relationship that exists between revenue generation and company income tax alone as an element of taxation because it produces the 2nd largest aspect of tax revenue and would show if there is a significant difference in the company income tax revenue to government in the SAS periods by analyzing just two periods, the pre-adoption (1991-1997) and post-adoption (1998-2015). In relation to the theme of the conference: Issues in National Development and Economic Resurgence: Accounting and Finance perspectives, this research is important in order to educate the general public on the need to be honest in declaring and paying of their tax liability promptly and timely in order to boast the revenue generation of the country as tax remains one of the largest source of revenue in Nigeria which can be used for national development and economic resurgence. Also the research highlighted some recommendations to Tax Authorities and Governments that will facilitate Self- assessment and increase Compliance such as the need for the laws to be concise and precise, adopting of service- oriented attitude towards tax payers, effective utilization of tax revenue, and so on. These are recommended in the bid to increase tax revenue generation in the country which will be used for national development and boasting of Nigeria’s Economy.
1.2 Objectives of the Study
The primary objective of this study is to critically assess the impact of the adoption of self assessment system on company income tax revenue generation in Nigeria. The specific objectives are: 1. To investigate if there exist a significant relationship between revenue generation and
company income tax in Nigeria. 2. To ascertain if there exist a significant difference in company income tax revenue to
government before and after SAS adoption. 1.4 Research Hypotheses
The study on self assessment system impact on company income tax in Nigeria will statistically appraise the following hypothesis;
���: There is no significant relationship between revenue generation and company income tax in Nigeria.
���: There is no significant difference in company income tax revenue before and after SAS adoption.
2.0 CONCEPTUAL FRAMEWORK
2.1. Self-Assessment System SAS was introduced as a law in 1991 with operational effect in 1992 but was restricted to few selected taxpayers and was later extended to the rest of the taxpaying citizens in 1998. However it

53
was until 2011 that its implementation became effective, through a Project based system. The self-assessment tax regime is a system of tax administration whereby taxpayers are required to compute their tax liabilities based on applicable tax law provisions, and complete their tax return forms in the manner prescribed by the relevant tax authority (RTA). The tax Liability is paid at the designated bank and produces evidence of tax paid at the time of filing his tax return at the tax office. The completed forms are to be submitted to the relevant tax authority (RTA) on the due date of filing returns, while payment of all or part of the tax due is to be made within the statutory timeline for payment. The tax authority has the responsibility to ensure compliance with tax administration process by the tax payers. That is why Appah, 2013 opined that the self-assessment scheme is characterized by partnership and shared roles and responsibilities between the taxpayer and the tax authority. This Self assessment applies to employees, self employed, limited liability companies including oil and gas companies, agents/taxable persons, in the case of value added tax (VAT). Malik, (2010) identified key assumptions on which self-assessment scheme is based to include: the taxpayer is a stakeholder and a partner and should be treated courteously; the taxpayer is honest and indeed demonstrates this by signing a declaration on the correctness of the tax returns; the taxpayer runs the business and knows the right amount of profits and taxes payable. On the other hand, the role/function of the tax administrators under self-assessment is to assist the taxpayers to understand their rights and obligations under the tax law. This is because more responsibility is placed on taxpayers to correctly understand and interpret the tax law, as such greater attention should be given to educating and assisting taxpayers in understanding the relevant tax laws. The tax administration should also make it easy and as least costly as possible for taxpayers to meet their obligations. Also tax administrations should adopt a service-oriented attitude towards taxpayers. To facilitate self-assessment, Kiabel & Nwikpasi (2001), listed some incentives attached to self-assessment filers to include; Non-payment of provisional tax; Installment payment of tax due in not more than six installments to terminate latest by 30th November in the year of assessment; 1% of tax payable is allowed as bonus; Returns (Accounts and computations) can be filed within 8 months (an additional 2 months) of the company’s year end. The major difference between self assessment system and direct assessment is that in direct assessment, it is the tax payers duty to declare and present all the necessary particulars concerning his/ her income and expenses for that particular year of assessment and submit the necessary return with all required supporting documents to the tax administrator, after which it’s the tax administrators duty to access all tax returns and issue a notice stating the taxpayers liability. Whereas, under Self assessment system, the tax administrator’s responsibility of accessing tax returns and determining tax liabilities was shifted to tax payers making the taxpayers to be directly involved in the tax computation which will lead to better financial planning and cost effectiveness. This was further stressed by Kaibel & Nwikpasi (2001), with the suggestion that Self assessment system was anticipated to improve tax payers compliance rates and speed the processing of assessment, reduce compliance cost and facilitate revenue collection. A taxpayer who fails to comply with provision of tax law is liable to various sanctions such as fines, penalties, interest and imprisonment.
2.2 Concept of Tax Compliance Tax compliance could be based on trust or power of authority; Tax compliance based on trust is known as voluntary tax compliance while tax compliance based on force is known as enforced compliance. Hence, self assessment is based on voluntary compliance. Under SAS it’s the taxpayers that assess themselves to tax and pays the tax liabilities without any form of enforcement action (Saad, 2014). Furthermore, James & Alley, (2002) stressed that tax system built on SAS principles can be seen as successful, because successful tax administration is the one in which taxpayers pays willingly, without conspicuous investigation, enquiries, reminders, and or treats for legal or administration sanctions. Thus, it is these qualities of voluntary tax compliance that gives the SAS wider global acceptability. On the other hand, noncompliance is a situation where individuals underpaid (underreporting) or overpaid (over-reporting) their taxes, this could be that either

54
because he has made an honest mistake while filling his tax form, or because he wanted to evade his tax liabilities from the very beginning. Kelman’s (1965) identified three types of taxpayers known as Kelman’s tripartite types of taxpayers. “Compliers” they pay their taxes as at when due, and fear the consequence if they do not. “Identifiers” these set of people are influenced by social norms, beliefs and behavior of people close to them. “Internalizers” have a consistency between their beliefs and their behavior. Also According to Ogungbesan (2011), with the implementation of a Self Assessment Regime, non- compliance gap will be reduced significantly by firmly sanctioning non- compliant taxpayers. He opined that Self-assessment is hinged on the key assumption that the taxpayer is a stakeholder and a partner who should be treated courteously and if revenue collection is to be improved, then there is a need to accord taxpayers respect, and gain their trust and understanding. Enforcement and closures according to him only become necessary after all information and taxpayer education and support services fail to elicit voluntary compliance. It is only then that the tax authority has the moral justification to enforce compliance. Another key supposition is that the taxpayer is honest (at least, honest until proved otherwise) and demonstrates this by signing a declaration as to the correctness of the tax returns. It is also assumed that since the taxpayer runs his business himself, he is therefore in the best position to know the right amount of profits and taxes payable. Thus, to achieve higher Tax Compliance under Self Assessment System, it is necessary to have Stiffer Penalties for Non-Compliance, Effective, Utilization of Tax Revenue, Empowerment of Investigation and Intelligence Unit, Promotion of Anti-Avoidance Provision, Regular Amendment to the Tax/Laws (Gwangdi & Garba,2015).
2.3 Concept of Revenue Generation
According to Aguolu (2004), taxation is the most important source of revenue to the government, from the point of view of certainty, and consistency of taxation. Owing to the fact that government has powers to impose taxes, and as such, they are assured at all times of its tax revenue no matter the circumstances. This is supported by Sani (2007), who advocated that tax can be used as an instrument of social engineering to stimulate economic growth of a nation. Hence, taxation has a positive effect on the government. This is because revenue generated from taxes can be applied to identify sectors of the economy to stimulate such sectors. The sectors so identified must be those which have potentials for creating employment, developing the economy and creating wealth for the greater benefit of citizens and government. This is so, because the major indices of measuring economic development and growth are the amount of wealth, which is created by economic activities undertaken in that society; creation of employment in the society to enable citizens cater for themselves and also be able to pay their tax to government out of their income for national development. Hence, the necessity for tax revenue to be utilized by government in creating wealth and employment opportunities thereby sustaining the growth of the economy.
2.4. Empirical Review of Relevant Literature
Kiabel (2007) in his work “selected aspects of Nigerian Taxes” argued that self-assessment is a scheme in which the taxpayer is required to assess himself to tax and make payment by forwarding the assessment along with the cheque for the tax due to the tax authority. He further opined that the self-assessment scheme was actually introduced in order to encourage voluntary compliance, reduction of tax evasion and to provide taxpayer a challenge to be more responsible to his civic obligation. While Ebimobowei & Peter (2013) in their work “a casual analysis between tax audit and tax compliance in Nigeria” cited that tax compliance occurs when tax payers pays his tax based on correct declaration and computation of his tax liability and files his return on time. SAS imposes trust on taxpayers who are assumed to be responsible enough to comply voluntarily. This trust may sometimes be displaced. Also, Loo (2006) in his work “the influence of introduction of self assessment on compliance behavior of individual taxpayers in Malaysia” observes that the reasons for implementing SAS are to ease the tax collection system and increase voluntary compliance. Therefore, to drive this system into a meaningful and more effective tax mechanism compared to direct assessment system, appropriate and effective operational mechanisms must be infused into the system so that the SAS can be operated efficiently. Loo, Hansford and Mckerchar (2010) in their work “impact of self

55
assessment on compliance behavior of an individual” stated that for self assessment to be successful, it relies on high level of voluntary compliance by taxpayers i.e taxpayers need to have adequate knowledge of the tax system , its procedures compliance obligations and also be prepared to comply. Also related is the work of Usman & Anao (2013) in their work on self assessment opined that company income tax revenues accruing to government had improved with the institutionalization of self assessment regime. They said that the resort to self assessment was to achieve increased tax yield. They found that Self Assessment System should be retained in the company’s tax administrative system and strengthened to improve its effectiveness. Also, Onyegbule (2012) in his work “self assessment practice in Nigeria” opined that the self assessment system helps to guarantees payment of taxes due while filing of tax returns thus ending the era of best of judgment assessment and building of mutual trust between tax payers and tax officers. Song and Yarborough (1978) in his work “Tax ethics and taxpayers attitude” found that taxpayers with higher fiscal knowledge have a higher tax ethic than did those with lower fiscal knowledge. Similarly, Lewis, Eriksen & Fallan(1996) found that low fiscal knowledge correlated with negative attitudes towards taxation results in non-compliance and that attitudes towards tax could be improved by better tax knowledge. Smith and Stalan (1991) said that satisfaction with government and perceptions of fairness appear to play important roles in taxpayers’ attitude towards taxation. Consequently, Ritsema, Thomas & Ferrier (1997) discovered a positive relationship between taxpayers’ perception of fairness and their tax liabilities. Christensen, Weihrich and Newman (1994) found that increasing taxpayer education enhanced both the understanding and acceptance of tax law complexity While studies like Fischer, Wartick & Mark (1993) found a positive correlation between tax knowledge and compliance, Eriksen & Fallen (1996) disagreed on the existence of any direct relationship between tax knowledge and compliance. Lastly Baldry, (1999) recommended in his work that by reducing the complexity of tax laws, compliance among taxpayers will increase, because the law will be easily understood, and they will have greater knowledge on the tax structure, and the computation of their own tax liability.
3.0. METHODOLOGY
The study adopted a longitudinal survey design. The study represents the company income tax revenue collected for 24 years from the period of pre- adoption of SAS to the period of full implementation. The pre- adoption runs from (1991-1997). The post- adoption period runs from (1998-2015). Emphasis was made on secondary data including the CIT revenues for the twenty four years (1991-2015) which were obtained from annual reports of the FIRS. Journals, articles and internet sources were also used to give further substance to information obtained from the FIRS reports. The method of data analysis adopted in this study is the regression analysis and ANOVA. The first objective was analysed using regression analysis. It was used to estimate the relationship among the dependent and independent variables in the given model. The evaluation criteria involve the test that is performed to verify the theoretical and statistical validity of the parameter estimates derived from the regression result. To test the overall significance and assess the goodness of fit in this model, the following test was carried out:- the co-efficient of determination (R is used to measure goodness of fit of regression result, the adjusted R method allows for degree of freedom associated with the model, both tests explain the percentage of variations in dependent variables that can be explained in the independent variables; the t-test is used to determine whether or not an independent variable belongs to a particular equation, it measures the individual significance of the model; The F-test is used to measure the overall significance of an estimated model; The Durbin-Watson statistic is used to test for auto correlation in a model. The second objective was analysed using the one-way analysis of variance. It is used to show the variation that exists between two variables. Following the specification of ordinary least square and empirical variables in this study, the model contain federal government revenue as the dependent variable while tax compliance rate, tax evasion, tax avoidance, compliance enforcement are the independent variables. Specifically, the equation for estimation is: TTR=f(CIT) The equation can be written into an economic model as follows:

56
TTR=��+���+U Where,TTR= Total Tax Revenue CIT = Company Income Tax U=Error term and �� =intercept term; ��=co-efficient of independent variable as defined above. A Priori Expectations From the equation ��>0 Hence, �� is expected to be positive because an increase in Company Income Tax revenue will result in general increase in Total Tax Revenue. 4.0. DATA PRESENTATION ANALYSIS AND INTERPRETATION
4.1 Presentation of Data
Table 4.1 Descriptive statistics
Mean Median Maximum Minimum Std. Dev. Jarque-Bera Prob
CIT 15.3625 13.7 31.5 5.9 7.068821 3.452744 0.177929
TTR 55.5625 46 95 32 20.5943 4.898702 0.08635
Source: Researcher’s compilation (2017). Where CIT= Company income tax/ Total tax revenue ratio. TTR= Total tax revenue/ total federally collected revenue ratio From the descriptive statistics above, the mean for CIT is 15.362 which is an indication of the average CIT ratio over the period horizon. The maximum and minimum values stood at 13.7 and 31.5 respectively. The standard deviation of both CIT and TTR are 7.067 and 20.594 respectively indicative of the average dispersion of the distribution from their means. The Jarque-Bera statistics is also indicative of the normality status of the variable. Table 4.2: Unit root test Results
Unit root test at levels
Variable ADF-Test Statistic 95% Critical ADF Value Remark TTR -0.6238 -2.96 Non-stationary CIT -1.174 -2.96 ‘’
Unit root test at 1st difference
Variable ADF-Test Statistic 95% Critical ADF Value Remark
TTR -6.572 -2.96 Stationary
CIT -6.303 -2.96 ‘’ Source: Researchers compilation of E view 7.0 Output (2017) Table 4.2 presents the results of the ADF test in levels without taking into consideration the trend of the variables. The reason for this is that an explicit test of the trending pattern of the time series has not been carried out. In the result, the ADF test statistics for the variables is shown in the second column, while the 95% critical ADF value is shown in the third column. The result indicates that all of the variables at levels, have ADF values that are less than the 95% critical ADF value of 2.96. The implication of this is that the time series for these variables are non-stationary in their levels. Moving forward, we take the first differences of the respective variables and perform the unit root test on each of the resultant time series. The rationale behind this procedure is that the Box & Jenkins (1976) have argued that differencing non-stationary time series will make it attain stationarity. The result of the unit root test on these variables in first differencing shows that the ADF values in absolute terms is greater than the 95% critical ADF values. With these result, these variables are adjudged to be stationary. The implication of stationarity for the variables is that they are mean trending and thus the likelihood of the occurrence of spurious regressions arising from non-stationary data is reduced.
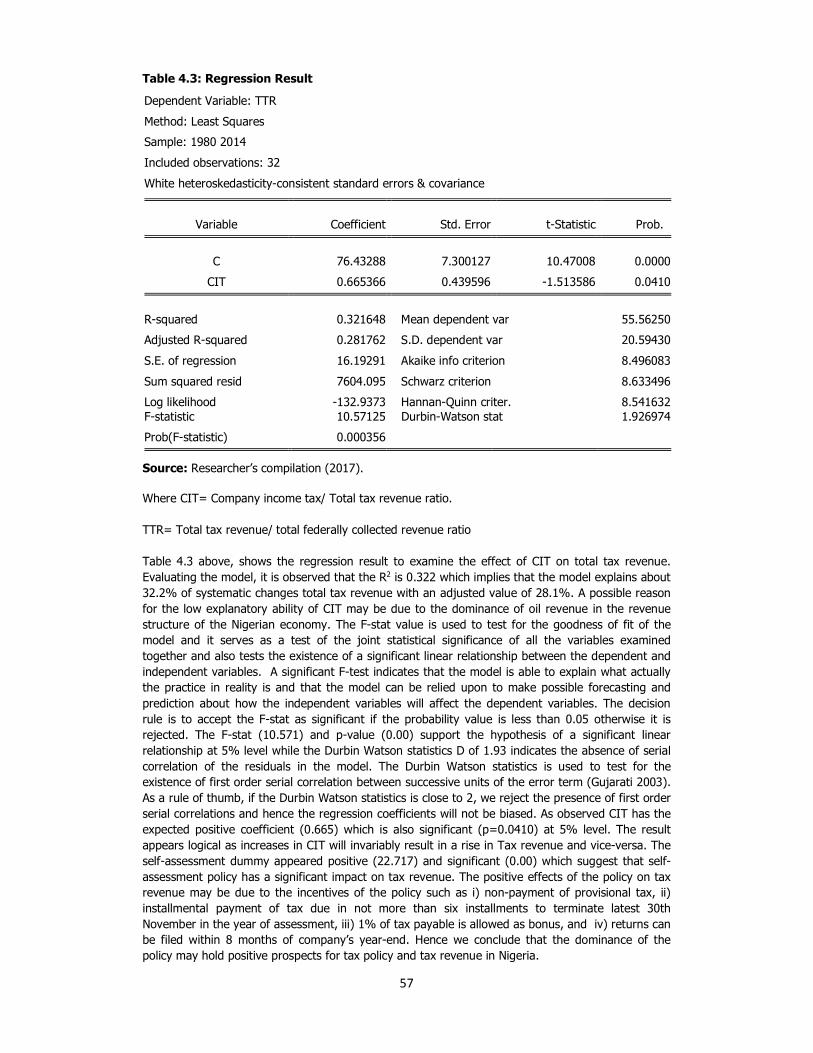
57
Table 4.3: Regression Result
Dependent Variable: TTR
Method: Least Squares
Sample: 1980 2014
Included observations: 32
White heteroskedasticity-consistent standard errors & covariance
Variable Coefficient Std. Error t-Statistic Prob. C 76.43288 7.300127 10.47008 0.0000
CIT 0.665366 0.439596 -1.513586 0.0410
R-squared 0.321648 Mean dependent var 55.56250
Adjusted R-squared 0.281762 S.D. dependent var 20.59430
S.E. of regression 16.19291 Akaike info criterion 8.496083
Sum squared resid 7604.095 Schwarz criterion 8.633496
Log likelihood -132.9373 Hannan-Quinn criter. 8.541632 F-statistic 10.57125 Durbin-Watson stat 1.926974
Prob(F-statistic) 0.000356
Source: Researcher’s compilation (2017). Where CIT= Company income tax/ Total tax revenue ratio. TTR= Total tax revenue/ total federally collected revenue ratio
Table 4.3 above, shows the regression result to examine the effect of CIT on total tax revenue. Evaluating the model, it is observed that the R2 is 0.322 which implies that the model explains about 32.2% of systematic changes total tax revenue with an adjusted value of 28.1%. A possible reason for the low explanatory ability of CIT may be due to the dominance of oil revenue in the revenue structure of the Nigerian economy. The F-stat value is used to test for the goodness of fit of the model and it serves as a test of the joint statistical significance of all the variables examined together and also tests the existence of a significant linear relationship between the dependent and independent variables. A significant F-test indicates that the model is able to explain what actually the practice in reality is and that the model can be relied upon to make possible forecasting and prediction about how the independent variables will affect the dependent variables. The decision rule is to accept the F-stat as significant if the probability value is less than 0.05 otherwise it is rejected. The F-stat (10.571) and p-value (0.00) support the hypothesis of a significant linear relationship at 5% level while the Durbin Watson statistics D of 1.93 indicates the absence of serial correlation of the residuals in the model. The Durbin Watson statistics is used to test for the existence of first order serial correlation between successive units of the error term (Gujarati 2003). As a rule of thumb, if the Durbin Watson statistics is close to 2, we reject the presence of first order serial correlations and hence the regression coefficients will not be biased. As observed CIT has the expected positive coefficient (0.665) which is also significant (p=0.0410) at 5% level. The result appears logical as increases in CIT will invariably result in a rise in Tax revenue and vice-versa. The self-assessment dummy appeared positive (22.717) and significant (0.00) which suggest that self-assessment policy has a significant impact on tax revenue. The positive effects of the policy on tax revenue may be due to the incentives of the policy such as i) non-payment of provisional tax, ii) installmental payment of tax due in not more than six installments to terminate latest 30th November in the year of assessment, iii) 1% of tax payable is allowed as bonus, and iv) returns can be filed within 8 months of company’s year-end. Hence we conclude that the dominance of the policy may hold positive prospects for tax policy and tax revenue in Nigeria.
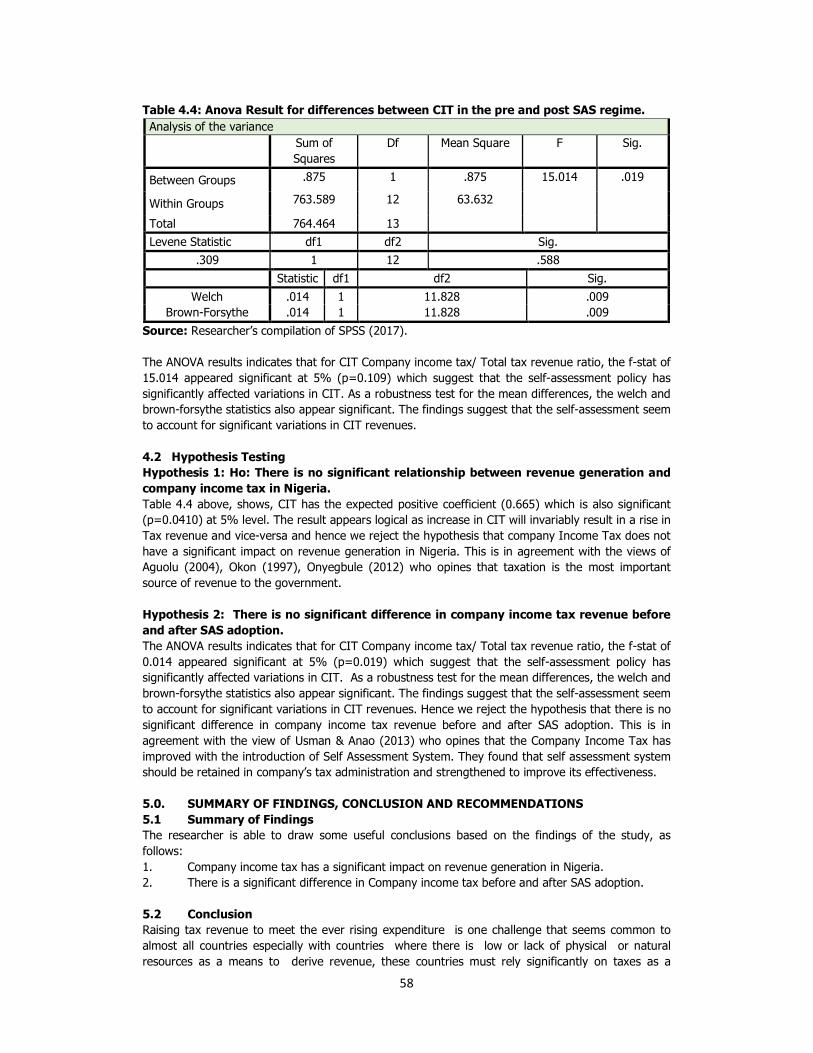
58
Table 4.4: Anova Result for differences between CIT in the pre and post SAS regime.
Analysis of the variance Sum of
Squares Df Mean Square F Sig.
Between Groups .875 1 .875 15.014 .019
Within Groups 763.589 12 63.632
Total 764.464 13
Levene Statistic df1 df2 Sig.
.309 1 12 .588
Statistic df1 df2 Sig.
Welch .014 1 11.828 .009 Brown-Forsythe .014 1 11.828 .009
Source: Researcher’s compilation of SPSS (2017). The ANOVA results indicates that for CIT Company income tax/ Total tax revenue ratio, the f-stat of 15.014 appeared significant at 5% (p=0.109) which suggest that the self-assessment policy has significantly affected variations in CIT. As a robustness test for the mean differences, the welch and brown-forsythe statistics also appear significant. The findings suggest that the self-assessment seem to account for significant variations in CIT revenues.
4.2 Hypothesis Testing
Hypothesis 1: Ho: There is no significant relationship between revenue generation and
company income tax in Nigeria.
Table 4.4 above, shows, CIT has the expected positive coefficient (0.665) which is also significant (p=0.0410) at 5% level. The result appears logical as increase in CIT will invariably result in a rise in Tax revenue and vice-versa and hence we reject the hypothesis that company Income Tax does not have a significant impact on revenue generation in Nigeria. This is in agreement with the views of Aguolu (2004), Okon (1997), Onyegbule (2012) who opines that taxation is the most important source of revenue to the government.
Hypothesis 2: There is no significant difference in company income tax revenue before
and after SAS adoption.
The ANOVA results indicates that for CIT Company income tax/ Total tax revenue ratio, the f-stat of 0.014 appeared significant at 5% (p=0.019) which suggest that the self-assessment policy has significantly affected variations in CIT. As a robustness test for the mean differences, the welch and brown-forsythe statistics also appear significant. The findings suggest that the self-assessment seem to account for significant variations in CIT revenues. Hence we reject the hypothesis that there is no significant difference in company income tax revenue before and after SAS adoption. This is in agreement with the view of Usman & Anao (2013) who opines that the Company Income Tax has improved with the introduction of Self Assessment System. They found that self assessment system should be retained in company’s tax administration and strengthened to improve its effectiveness.
5.0. SUMMARY OF FINDINGS, CONCLUSION AND RECOMMENDATIONS
5.1 Summary of Findings
The researcher is able to draw some useful conclusions based on the findings of the study, as follows: 1. Company income tax has a significant impact on revenue generation in Nigeria. 2. There is a significant difference in Company income tax before and after SAS adoption.
5.2 Conclusion Raising tax revenue to meet the ever rising expenditure is one challenge that seems common to almost all countries especially with countries where there is low or lack of physical or natural resources as a means to derive revenue, these countries must rely significantly on taxes as a

59
means of reducing the fiscal deficit gap. In Nigeria, the self-assessment system was adopted in a bid to improve tax compliance and facilitate revenue collection. It was anticipated to address shortcomings like delay in payment of tax. Self-assessment system is aimed at shifting the duty of raising of assessment to taxpayer. The objective of self-assessment system is to make payment of tax easy by allowing tax payer to access themselves to test the honesty and integrity of tax payer and make tax system friendlier. The focus of the study was to examine the effect of the assessment system on tax revenue in Nigeria. The study findings reveal CIT has the expected positive coefficient (0.665) which is also significant (p=0.0410) at 5% level. The result appears logical as increases in CIT will invariably result in a rise in Tax revenue. In addition, the ANOVA results indicates the f-stat of 15.014 appeared significant at 5% (p=0.019) which suggest that the self-assessment policy has significantly affected variations in CIT. As a robustness test for the mean differences, thewelch and brown-forsythe statistics also appear significant. The findings suggest that the self-assessment seem to account for significant variations in CIT revenues.
5.3 Recommendations Based on the research, the following recommendations are made to facilitate self assessment and increase compliance 1. Tax laws should be concise and precise. This can be done by rewriting the tax law to
reduce the volume of information and in clear and simple language to enable taxpayers know and understand their rights and obligations under the tax laws.
2. To facilitate Self-assessment, tax administrations needs to adopt a service-oriented attitude toward taxpayers. That is the ensuring that taxpayers are exposed to necessary information and support needed to meet their tax obligations. For example Tax forms must be simple and precise as much as possible, with clear instructions on how to complete them and the means of Filing of returns and payment of taxes should that which is convenient to taxpayers.
3. Another way to facilitate Self-assessment is through the use of Modern innovations that will improve the business environment and reduce the cost of compliance. Examples of new innovations in this area include e-filing and e-payment (internet and mobile banking).
4. Interests and Penalties for Non-Compliance is needed to facilitate tax compliance. However, such Interest and penalties must be neither too lenient nor too harsh, and must be applicable to all taxpayer groups.
5. Effective, Utilization of Tax Revenue, is also of utmost importance in the creation of wealth and employment for the citizens.
6. Also tax laws should be reviewed from time to time to cover any loopholes that may from time to time be devised by tax payers to avoid tax.

60
REFERENCES
Abdulrazaq, M.T. (1993). Principles and practice of Nigerian tax planningand management. Ilorin: Batay Publications Limited.
Abiola, James & Asiweh, M. (2012). Impact of tax Administration on
Government Revenue in a developing economy. A case study of Nigeria. International Journal of Business and Social Science, 3(8)
Aguolu, O. (2004). Taxation and Tax Management in Nigeria (3rd Ed), Enugu: Meridan
Associates. Ali, M. M., Cecil, H. W. , & Knoblett, J. A .(2001). The effects of tax law and policies on taxpayer
compliance: A study of self employed taxpayers. American Economic journal.2(1) Appah, E. (2013). Principles and Practice of Nigerian Taxation (2nd Ed), Port Harcourt: Ezevin
Printing and Publishing. Baldry, J.C (1999).Self assessed taxation in Australia: definition, costs and benefits. The
Chartered Secretary Malaysia,12(April/ May). Bordignon, M. (1993). A fairness approach to income tax evasion. Journal of Public Economic.
52, 345-362 Christensen, A.L., Weihrich S.G & M.D.G Newman, (1994).The impact of education on
perceptions of tax fairness. Advances in Taxation,6(63) Ebimobowei, A. & Peter, E.G. (2013). A casuality analysis between tax audit and tax
compliance in Nigeria, European Journal Of Business and management ,5(2) Eriksen & Fallan, L. (1996).Tax knowledge and attitudes towards taxation: a report on a
quasi-experiment’ Journal of Economic Psychology,17(3) Fischer, C. M., Wartick, M. & Mark M. (1992) Detection probability and taxpayer compliance: A
review of the literature. Journal of Accounting Literature ,11, 1-49. FIRS. (2012). Handbook on the implementation of self-assessment tax regime in Nigeria.
FIRS Nigeria. Friedland, N., Maital, S. & Ridge, M. (1978). A simulation study of income Income tax evasion.
Journal public economics,10(107) Grasmick, H. G. & Bursik, R. J. (1990). Conscience, significant others, and rational choice:
Extending the deterrence model. Law and Society Review, 24, 837-861. James, S. & Alley, C. (2002) Tax compliance, self-assessment and tax administration,journal of
finance and management in public services ,2(2), 27-42 Kelman, H. C. (1965). International behavior: A social psychological analysis, New York: Holt,
Rinehart and Wiston Kiabel, B. D. & Nwikpasi, N. (2001) Selected Aspects of Nigerian Taxes. Port Harcourt: Ngbaa
commercial enterprise. Lewis, H. B. (1971). Shame and guilt in neurosis, New York: International University Press Loo, E. C. (2006). Influence of the introduction of self assessment on the compliance behavior of
individual taxpayers in Malaysia at the university of Sydney (Unpublished PhD Thesis). University of Sydney, Australia
Loo, E. C., McKerchar, M., & Hansford, A. (2010). Findings on the impact of self-assessment
on the compliance behaviour of individual taxpayer in Malaysia: A case study approach. Journal of Australian Taxation,4(1),181-202

61
Malik, T. (2010) Achieving voluntary compliance through self assessment tax regime. Abuja: Self
assessment project of the Federal Inland Revenue Services Nigeria. Ogunbgesan, S.S. ( 2011) tax operations group “guage quarterly publication of FIRS” April-
June 2011,ISSN 2006-9677 Okon, E. (1997).company income tax in Nigeria at University of portharcourt (unpublished
monograph) University of port harcourt,Nigeria. Okpe, J. (1998). Taxation and Economic Development in Tropical Africa . Enugu: IMT press. Olotu, G.E. (2012) Welcome Address speech by the chairman, chartered institute of taxation
of Nigeria, 14th Annual Tax Conference. Onyegbule, C.N. (2012, June 25). Self assessment practice in Nigeria. Retrieved from
Vanguardngr.com. Polinsky, M. A. & Shavell, S. (2000). The economic theory of public enforcement of law.
Journal of Economic Literature, 38, 45-76. Ritsema, C. M., Thomas, D.W. & Ferrier, G.D. (2003,June). Economic and behavioral
determinants of tax compliance: evidence from the 1997 Arkansas tax penalty amnesty program. Paper presented at the IRS research conference, Washington DC, 10-11
Saad, N. (2014). Tax Knowledge, Tax Complexity and Tax Compliance: Taxpayers’ View. Procedia-
Social and Behavioral Sciences, 109, 1069-1075. Sanni, A. (2005). Contentious Issues in Tax Administration and Policy in Nigeria. A Paper
Presentation at the 1st National Retreat on Taxation (pp. 1-7) Sarker, T. K. (2003) Improving tax compliance in developing countries Via self assessment system.
What could Bangladesh learn from Japan? Asia-pacific tax. Sawkins, J. W. & Dickie, V. A. (2003) Modelling council tax non-payment In Scotland and
ales: preliminary results. Retrieved from http://www.scotecon.net Soyode, L. & Kajola, S.O (2006). Taxation Principals and Practice in Nigeria, Ibadan, Nigeria:
Solicon Publishers. Smith, K. W. & Stalans, L. J. (1991). Encouraging tax compliance with Positive incentives: a
conceptual framework and research Directions. Law and policy. Song, Y. & Yarbrough, T. E. (1978). Tax ethics and taxpayers’ attitudes: A survey. Public
Administrative Review, 38, 442-452. Summerfield, R.M. (1980). An Introduction to Taxation. Harcourt Brace: Jovanovich. Syndelle, S. (2009) Taxes- “Accountability and Revenue in Nigeria”. Nigeria Curiosity.
Retrieved from http://www.nigeriancuriosity.com . /2009/11/taxes- accountability- revenue- in-Nigeria. html. Accessed 10/4/2010.
Usman & Anao (2015) Impact of self assessment adoption for companies income taxation in Nigeria.
ICAN journal of Accounting and Finance ,4(1) Yitzhaki, S. (1974). Income tax evasion: A theoretical analysis. Journal of Public Economics.

62
APPPENDICES
APPENDIX A
DATA FOR REGRESSION Year Td
T% Tid T%
CIT TD%
TTR TFR%
1991 72 28 9 61
1992 72 28 9 43 1993 69 31 13.6 53 1994 56 44 20.7 52 1995 48 52 31.5 32 1996 52 48 21.2 38 1997 49 51 25.9 35 1998 50 50 30.5 47 1999 62 38 21.1 37 2000 79 21 9 40 2001 74 26 9.3 45 2002 64 36 17 34 2003 71 29 14.1 41 2004 78 22 9.7 42 2005 83 17 7.7 45 2006 85 15 10.6 43 2007 77 23 17.3 41 2008 84 16 12.7 48 2009 72 28 28.8 55 2010 76 24 24.1 44 2011
2012 81 17 21.5 43
2013 72 28 28.8 55 2014 74 25 26.4 44
2015 75 26 9.3 45
Where:
Td = Total direct tax as a percentage of total tax revenue TTR
Tid = Total indirect tax as percentage of total tax revenue TTR
PPT = Petroleum profit tax as a percentage of total direct tax Td
CIT = Company income tax as a percentage of total direct tax Td
TTR = Total tax revenue as a percentage of total federally collected revenue. TFR

63
APPENDIX B Dependent Variable: TTR Method: Least Squares Sample: 1980 2014 Included observations: 32 White heteroskedasticity-consistent standard errors & covariance
Variable Coefficient Std. Error t-Statistic Prob. C 76.43288 7.300127 10.47008 0.0000
CIT 0.665366 0.439596 -1.513586 0.0410
R-squared 0.321648 Mean dependent var 55.56250 Adjusted R-squared 0.281762 S.D. dependent var 20.59430 S.E. of regression 16.19291 Akaike info criterion 8.496083 Sum squared resid 7604.095 Schwarz criterion 8.633496 Log likelihood -132.9373 Hannan-Quinn criter. 8.541632 F-statistic 10.57125 Durbin-Watson stat 1.926974 Prob(F-statistic) 0.000356
APPENDIX C
Descriptives VAR00004 95%
Confidence Interval for
Mean
Minimum Maximum Between- Component
Variance
Upper Bound pre-self assessment 24.2384 9.00 31.50 post-self assessment 23.8467 7.70 28.80 Total 21.1062 7.70 31.50
Model Fixed Effects 21.3237 Random Effects 43.7674 -8.96534a
a. Warning: Between-component variance is negative. It was replaced by 0.0 in computing this random effects measure.
Test of Homogeneity of Variances VAR00004
Levene Statistic df1 df2 Sig. .309 1 12 .588
ANOVA
VAR00004 Sum of Squares Df Mean Square F Sig.
Between Groups .875 1 .875 15.014 .019 Within Groups 763.589 12 63.632 Total 764.464 13
Robust Tests of Equality of Means
VAR00004 Statistica df1 df2 Sig.
Welch .014 1 11.828 .009
Brown-Forsythe .014 1 11.828 .009

64
Capital Structure and Firm Financial Performance in Nigeria:
Empirical Evidence of the Causal Link
Agbonrha-Oghoye Imas IYOHA1& David UMORU2, AERC, FMNES 1Edo University, Iyamho Auchi-Abuja Expressway Edo State, Nigeria Department of Accounting, Faculty of Arts, Management & Social Sciences. Email: [email protected] Phone Number: +2347033226552, +2348123669633 2 Edo University, Iyamho Auchi-Abuja Expressway Edo State, Nigeria PhD (Economics), Associate Professor of Economics, Department of Economics, Dean, Faculty of Arts, Management & Social Sciences.
_____________________________________________________________________________ Abstract
The paper examines the link between capital structure and firm financial performance in Nigeria on basis of panel research design with secondary data spanning 2010-2014 financial year for seventy (75) sampled companies quoted in the Nigerian Stock Exchange. The data estimation technique was the Two Stage Least Square (2SLS) which is suitable in study perceived not be devoid of endogeneity. The result revealed that leverage as proxy by ratio of noncurrent liability to equity (NCLEQ) seems not to exhibit causality with financial performance (RETOA) vice-versa. However, there seems to be the presence of bidirectional causality between current liability expressed as a ratio to equity (CULEQ) and RETOA. Also, there is simultaneous causal link between Equity express as a ratio to overall assets (EQTTA) and RETOA. The study therefore concludes that capital structure (CULEQ and EQTTA) determines financial performance (RETOA) while simultaneously, financial performance determines capital structure in Nigeria. The study recommends that firms should have apposite capital structure mix, specifically ratio of NCLEQ to CULEQ and a good spread of both institutional and insider shareholdings. Key words: Leverage, equity, financial performance, bidirectional causality
1. INTRODUCTION
Corporate financing is an imperative decision made in financial management because it ultimately affects wealth of shareholders. One of the ways financial managers can maximize the financial performance of firms is by using lower cost of capital in its capital structure (Shah & Khan, 2007). Capital structure refers to the various sources of fund, debt or equity firms used in financing its operations. It is the proportion of debt and equity used by firms in financing their operations (Alfred, 2007). A reasonable proportional use of both sources reflects sound financial fitness which enhances financial performance, thus having a ripple effect in the economy. Financial managers strive to find the optimal capital structure, both in the short and long run (Tong & Green, 2005). The task of maximizing the firm financial performance can be achieved to a large extent once financial mangers identify the determinants of its capital structure, i.e. the cost associated with each class of fund. Debt holders have contracts (bonds) that have fixed interest charge in the future in exchange for their cash invested while equity holders provide retained earnings (internal equity provided by existing shareholders) or procurement of new shares (external equity provided by new shareholders) in return for claims on the residual earnings of the firm in the future.

65
Each of these investors is faced with varying degree of risk and as such expect different rate of return on fund provided. Knowledge of cost of capital and how it influences some key variables like financial leverage is useful in designing the firm’s debt policy/capital structure. An optimum capital structure mix enhances financial performance and shareholders wealth. For instance, a firm with high debt capital structure enjoys tax shield although with a fixed interest charge compared to capital structure with high equity base which does not enjoy tax shield. Giving the argument that optimum capital structure drives financial performance, it follows therefore that financial performance could also drive capital structure mix. For instance, retained earnings from a huge profit base in successive boom period becomes a key internal source of fund for companies thus alleviating interest on debt financing and a charge on earnings (external equity provided by new shareholders) that would ordinarily had occurred from an external source of fund. To the best of our knowledge, few studies have attempted this simultaneous approach but however restricted to equity ownership, and some were developed nation based (AL Farooque, Zijl, Duntan, & Karim, 2014; Loderer & Martin, 1997; Demsetz & Villalonga, 2001; Cho, 1998).Generally, prior researches do not take into account the possibility of financial performance impacting capital structure mix. If an optimal capital structure drives financial performance, failure to take the reverse causality into account may result in simultaneous-equations bias. The study seeks to evaluate the nature of causal link between capital structure and firm financial performance in Nigeria. The specific objectives are to: examine the existence of causal link between financial leverage and financial performance in listed firms in Nigeria; and to investigate the existence of causal link between equity ownership and financial performance in listed firms in Nigeria. Hence, we hypothesized absence of causal link between financial leverage and firm financial performance in listed companies in Nigeria and also absence of causal link between equity ownership and firm financial performance in listed companies in Nigeria. The paper proceeds as follows: preceding the introduction is section 2 which is on literature review; Section 3 is on the methodology of the study, section 4 is on estimation of results, hypotheses testing and discussion of findings while section 5concludes the study. 2. EMPIRICAL REVIEW OF LITERATURE
Several studies exists for both in the developed and developing economies in identifying optimum capital structure determinants ( Amah, & Ken-Nwachukwu, 2016; Ameen, & Shahzadi, 2017; Banafa, & Ngugi, 2015; Graham & Harvey, 2001; Khan, 2012; Khalaf, 2013; Lawal, Edwin, Monica, & Adisa, 2014; Mazur, 2007; Mwangi, & Birundu, 2015; Umar, Tanveer & Aslem, 2012; Shah & Khan, 2007; Tong & Green, 2005; Uwuigbe, & Olusanmi, 2012; Wellalage & Locke, 2014; Zakaria, & Purhannudin, 2014;). These potential drivers of capital structure mix have a ripple effect on the firm financial performance, thus a nexus between capital structure and firm financial performance. Capital Structure
Capital structure means the proportionate use of debt and equity in financing organization operation (Kennon, 2010). These sources of fund include equity and liabilities which are presented in the statement of financial position. Huang and Vu Thi (2003) classified these sources of fund into: retained earnings (internal equity); issuing new shares (external equity); and borrowing through debt instruments (debt capital). The proportion of each of these components has enormous impact on the success of the firm. The impact of this capital structure mix on firm financial performance can be evaluated on the basis of the benefits and cost associated with each component of fund. Premised on this, managers are often saddled with a daunting task of designing appropriate capital structure mix which will maximize the firm financial performance. According to Myer and Majluf (1984), management often takes into consideration all means of financing available having in mind the least expensive source. The relevance of an optimum capital mix was also emphasized by Chowdhury and Chowdhury (2010) when they opined that in order to maximize the firm value, profitability and shareholders

66
wealth, suitable mix between debt and equity financing cannot be undermined. The findings of empirical research on the impact of these capital structure components on firm financial performance have been mixed, however each of these findings have implication for policy formulation. Firm Financial Performance
A firm remains in operation because it is expected to make profit (financial performance). Thus, the excess of income generated over expenses incurred in a given period could be construed as financial performance (Banwo 1997, Sanni 2006) as cited in Aremu, Ekpo, Mustapha (2013). The fundamental requirement is that the income and expenses must occur during the same period of time (matching concept) and such income must be a direct consequence of the expenses. It is not immaterial whether or not the income has been received in cash nor is it compulsory that the expenses must have been paid in cash. For a profit-oriented organisation, profit is the ‘’soul’’ of a business. The importance of profitability therefore stems from its being the ‘’ralson d etre’’ (purpose) of business. According to Aremu et al (2013), Ongore & Kusa (2013), Alper and Anbar (2011), there are several indicators of profitability: return on asset (ROA), return on equity (ROE) and net interest margin (NIM) etc. However, there exist conflicting views among scholars on the acceptability of one indicator over the other as a good measure of profitability. For instance, Flamini, Mcdonald and Schumacher (2009) used only ROA while Sanni (2009) used Earnings per share (EPS). Ogunleye (1995) did not believe that one performance indicator constitute a good measure of profitability, therefore used ROA and ROE. According to Akinola (2008), profitability measures include profit before tax (PBT), profit after tax (PAT), ROE, rate of return on capital (ROC) and ROA. Having given a list of profit indicators by previous researcher, it becomes clear that their choice of profitability measures could be determined by several factors. For instance, ROA as defined by Golin (2001) cited in Ameur and Mhiri (2013) is the ratio of net profit to total assets and it measures the managerial ability of firms’ management to generate income by utilizing company assets at their disposal, i. e. it shows how efficiently the resources of the company are used to generate income. It reflects how efficient the management of a company in generating net income from all the resources of the institutions (Khrawish 2011) as cited in Ongore and Kusa (2013). Wen (2010) stated that a higher ROA shows that the company is more efficient in using its resources. However, many factors can influence ROA such as firm’s degree of capitalization. ROA favours highly capitalized institutions because it treats equity capital as free funds-there is no cost associated with them. Premised on this limitation, ROA could be combined with other measures of financial performance. Return on equity (ROE) is profit earned compared to the total value of shareholders equity (Ongore & Kusa, 2013). According to Ameur and Mhiri (2013), ROE is the ratio of net profit to total equity; it represents the rate of return earned on the funds invested in the firm by its shareholders. It reflects how effectively a firms’ management is using shareholders fund; it is what the shareholders look in return for their investment. A business that has a high return on equity is more likely to be one that is capable of generating cash internally. However, it should be noted that ROE is not flawless because a disproportionate amount of debt in a company’s capital structure would translate into a smaller equity base. Thus, a small amount of PAT could still produce a high ROE off a modest equity base. Due to its inherent defect, this profit measure should be used in combination with other profit measure. Having enumerated the various profitability measures used in previous studies as mentioned above, this study will adopt three measures of financial performance: ROA, ROE and Tobin Q. The choice of Tobin Q is that it is a forward looking market/hybrid measure of financial performance. The

67
justification for the combination of three proxies is to avoid the pitfalls associated with only one financial performance indicator. Leverage and firm financial performance
Financial leverage refers to the level operating assets are financed with debt versus equity (Penman, 2001). Debt financing has a mandatory call on firm’s cash by means of interest payment and principal repayment. The mandatory call on debt financing is represented by cost of borrowed fund which should be adequately covered by the firm earnings capacity. The greater a firm’s leverage, the greater the bankruptcy risk in down times thus the greater the profits in good time for equity provider. The findings of leverage on financial performance are mixed. Specifically, the study of Rehman (2013) indicated that as debt financing increases, there is a corresponding rise in fixed interest cost, thus undermining profit. In same vein, the study of Rajin (2012) corroborates the findings of both Rehman (2013) and Akhtar et al. (2012). Using shareholders return and market capitalization as performance indices, the study revealed that leverage and shareholders return exhibit positive relations while leverage and market capitalization had a negative relationship. Other studies that corroborate positive relationship between leverage and financial performance are: Hadlock and James (2002), Ghosh and Jain (2000), Berger and Bonaccorsi (2006). The reason adduced to this unexpected result is that as debt level increases due to the introduction of new capital by borrowings, firms are able to utilize these borrowed funds to the extent that the gains exceed the expected cost of such fund (Hutchinson, 1995). However, to Hadlock and James (2002), flexibility at which firms adjust its debt usage in down time also determines the impact it will have on earnings. For instance, when a capital structure is over burdened with long term borrowings, it may become difficult to adjust its debt usage within a relatively short time should there be decline in its earnings power, thus interest cost exhibiting a constrain on earnings. Conversely, if there is moderate debt mix over a relatively short period, decline in earnings power during down time will only short-lived because most of these firms will fully come to terms with the need to properly position by adjusting its debt usage, thus restoring the balance between cost of debt and earnings power. The study by Male and Mukra (2015) revealed that leveraged exhibits significant negative impact on both ROA and Tobin’s Q while insignificant negative impact of ROE. Other studies that affirms this association are: Vito and Badu (2012); Zeitun and Tian (2007).From the review, it is well observed that most studies have not examined if a firm financial performance can as well determines its capital structure mix (financial leverage). Equity and Firm Financial Performance
The effect of equity on financial performance could be likened to the effect of ownership structure on firm financial performance. Equity financing refers to share ownership which is atomistic in nature. It could be highly dispersed or concentrated i.e. in the former, there are many owners with few holding few unit of shares unlike the latter in which there are few shareholders with each having large unit of shareholdings (institutional shareholdings). Gursory and Aydojan (2002) also gave two dimensions to this type of ownership: ownership concentration which refers to the share of the largest owner and it is influenced by absolute risk and minority cost (Pederson & Thomsen, 1999); and ownership mix which refers to the identity of major shareholder’s. Irrespective of the nature of equity ownership, prior studies have linked firm financial performance to it though their findings seem not to be in tandem with one another. Studies such as Loderer and Martin (1997), Demsetz and Villalonga (2001), Bohren and Odegaard (2000), Cho (1998) have examined ownership structure and financial performance from bidirectional approach. Specifically, the study of Loderer and Martin (1997) address the causality between firm value and managerial ownership and the result from the two stage least square (2sls) regression

68
revealed no significant evidence of managerial ownership on performance, in contrast performance exhibits a negative effect on executive stockholdings. Demsetz and Villalonga (2001) also address this issue, financial performance and ownership relationship using the 2sls estimation technique. The result revealed no statistical association between managerial ownership and performance, on the other hand performance exhibit significant negative impact on managerial ownership. In same vein, Bohren and Odegaard (2000) lay claim to the findings of Loderer and Martin (1997) and Demsetz and Villalonga (2001). The study employed secondary data sourced from the Norwegian Stock Exchange. The 2SLS result reveals that financial performance drives ownership structure but not vice versa. Other studies of similar result were Fernandez and Gomez (2002), Firth, Fung and Rui (2002), Agrawal and Knoeber (1996).
Other studies such as Aburime (2010), Kiruri (2013), Raji (2012) appraised the link between equity ownership and financial performance from an exogenous perspective. For instance, Aburime (2010) investigated the impact ownership structure has on bank profitability in Nigeria. Data set of 478 observations consisting of 98 commercial and merchant banks spanning (1989-2000) were evaluated using the ordinary Least Square estimation technique. The finding revealed that the composition and spread of ownership has no significant impact on bank profitability in Nigeria. Kiruri (2013) study revealed that both ownership concentration and state ownership had significant negative impact on bank profitability while both foreign ownership and domestic ownership had positive and significant effect on bank profitability. Raji (2012) investigated the impact of ownership structure on the performance of listed companies on the Ghana Stock Exchange and results indicate that ownership concentration exhibits significant negative association with firm performance while insider ownership exhibits positive relationship on performance. 3. THEORETICAL FRAMEWORK
There are many theories that help explain the relationship between capital structure and financial performance such as the Modigliani-Miller (MM) proposition on capital structure in 1958, the trade-off theory by Myers (1984), the Pecking Order theory as first proposed by Donaldson (1961) and later modified by Myers and Majluf (1984). Arguments exist over the years as to the superiority of these theories; however, there is no universal theory of the debt-equity choice, and no reason to expect one reoriented research to the level of empirical analyses (Luigi & Sorin, 2009; Myers, 2001).
Modiglianni-Miller Theory
This theory holds that capital mix does not impact firm value under perfect capital market condition i.e. without taxes, transaction cost and information asymmetry (Modiglianni & Miller, 1958). However, to ignore these assumptions in reality is not flawless, hence with these assumptions, capital structure decision affect firm financial performance (Sheikh & Wang, 2010). According to Danso and Adomako (2014), these assumptions are only theoretical and do not hold in reality. Premised on the above, Miller and Modiglianni (1963) and Miller (1977) further addressed this issue when they opined that under some conditions such as preferential treatment of debt to equity, an ideal capital structure can be achieved, hence their new stand is called the realist theories of capital structure. This realist theory led to the trade-off, pecking order and market timing theories. The Trade-Off and Pecking Order Theories
To Trade-off theory, an optimal capital structure is attained when the present value of tax shields from debt usage is more than the present value of cost of financial distress associated with debt usage, hence firm value is improved. According to Shahar, Shahar, Bahari, Ahmad, Fistal, Rafdi (2015), firm value is given thus: V(firm)= V+PV(interest tax shields)-PV(cost of financial distress). This position is supported by Chen (2011) who upholds that firm with more tax shields will issue more debt to finance its business operation and that they tend to be trade-off between the benefit from tax shields and the financial distress risk resulting from debt usage.

69
The pecking order theory states that companies prioritize their sources of financing (from internal financing to equity) according to the principle of least effort, or of least resistance, preferring to raise equity as a financing means of last resort (Danso & Adomako, 2014; Sheikh & Wang, 2010). With this theory, firm first choose to employ internal finance like reserves and retained earnings, debt, equity and that company maximize their value by choosing to finance new investment with cheapest available sources of fund (Sheikh & Wang, 2010). To Myers and Majluf (1984), the choice of internal sources of financing is also to resolve the issue of information asymmetry. This position was supported by Mostafa and Boregowda (2014) that firm rely on internal sources because of likely absence of information asymmetry compared to debt and equity usage that has higher cost of information asymmetry. Model Specification
The models for this study are based on the study of Al Farooque, Zijl, Dunstan and Karim (2007). The models for this present study are specified below: Financial Performance Equation RETOA/RETOE/Tobin’s Q= f(financial leverage, equity, firm-size) (3.1) Financial leverage is further decomposed into debt to equity ratio and was captured in two forms in line with Tong and Green (2005): noncurrent debt liabilities (NCLEQ) and current debt liabilities (CULEQ) both expressed as a ratio to total equity. Equity was taken as a ratio of total equity ownership to total assets (EQTTA). RETOA/RETOE/Tobin’s Q= f(NCLEQ, CULEQ, EQTTA, FIRM-SIZE) (3.2) The pooled econometric form of the model is stated thus: RETOAit/ RETOEit /Tobin’s Qit = β1 + β2NCLEQit + β3CULEQit + β4EQTTAit + β5 FIRM-SIZEit + µit (3.3) Apriori signs: β2 >0; β3 >0; β4 >0; β5 >0. The justification for the apriori signs is based on the findings of prior empirics on capital structure and financial performance. Financial performance is proxy by RETOA, RETOE and Tobin’s Q while capital structure is proxy by financial leverage and equity ownership while firm size is a control variable. Hence, RETOA/RETOE/Tobin’s Q. RETOA means return on asset expressed as a ratio of net profit after tax to total asset while RETEO means return on shareholders’ expressed as a ratio of net profit after tax to equity ownership (Ameur & Mhiri,2010). Tobin’s Q’expressed as ratio of the sum of market value of equity, preference share and debt to total assets (Lindenberg & Ross,1981); β1 is mean value of the intercept of the entire cross sections; NCLEQ is noncurrent liability as a ratio of equity ownership; CULEQ is current liabilities as a ratio of equity ownership; EQTTA is equity ownership as a ratio of total assets (Ameen & Shahzadi, 2017); FIRM-SIZE is firm size proxy by total assets; ith is cross section; t is time; µit is error time considering both cross section and time dimension.
Capital Structure Equation
NCLEQ/CULEQ /EQTTA=f(RETOA,RETOE, Tobin’s Q, FIRM-SIZE) (3.4) The pooled econometric form of the model is stated thus: NCLEQit/ CULEQit /EQTTAit = β1 + β2RETOAit + β3RETOAit + β4 Tobin’s Qit + β4 FIRM-SIZEit + µit
(3.5) Apriori signs: β2 >0; β3 >0; β4 >0
Methodology of the Research The study made use of the panel research design. It is suitable for study of this nature because it has both cross section and time series research design properties. Secondary data spanning 5 years (2010-2014) for seventy five (75) sampled non-financial companies was sourced from the Nigerian Stock Exchange (NSE) as at December, 2014. The population consist of all one hundred and nine (109) nonfinancial quoted companies in the NSE as at December, 2014. A sample size of eighty five (85) was derived using the Yamane (1967) formula as cited in Israel (1992). However, the sample sizes of eight five (85) companies were reduced to seventy five (75)

70
companies due to accessibility annual report. The data set was analysed using two stage least square (2sls) estimation technique. The 2SLS is best suited for this study because of the structural equation nature of the model i.e. existence of feedback loops in the model which could lead to the dependent variable’s error term correlating with the independent variables making the OLS estimates biased. Premised on this, the 2sls is favoured ahead of the OLS estimation technique.
4. ESTIMATION RESULTS AND DISCUSSIONS Table 1 shows the descriptive statistics for variables. In financial performance equation, three proxy Tobin Q, RETOA and RETOE were all used as the dependent variables. The descriptive indicators for each is as follow: Tobin Q mean is 2.133889, STD is 3.833206 which shows weak dispersions of some observations from the mean and less considerable variations reflecting the heterogeneity of our sample cutting across industrial groupings with max and min value of 50.37000 and 0.340000 respectively.
RETOE mean is 9.925667, STD is 90.27259 which shows strong dispersions of most of the observations from the mean and a considerable variations reflecting the heterogeneity of the sample data cutting across industrial groupings with max and min value of 905.4200 and -981.3700 respectively; and RETOA mean is 4.629333, STD is 13.46295 which shows weak dispersions of some observations from the mean and less considerable variations reflecting the heterogeneity of the sample data cutting across industrial groupings with max and min value of 89.54000 and -101.4200 respectively. Table 1: Descriptive Statistics Variables TOBIN RETOE RETOA NCLEQ CULEQ EQTTA FISIZE
Mean 2.133889
9.925667
4.629333
49.95081
144.7880
42.50678
4.058000
Std. Dev 3.833206
90.27259
13.46295
108.6256
413.1178
29.35900
0.736622
Maximum 50.3700
0 905.420
0 89.5400
0 1021.30
0 3908.30
0 353.150
0 5.99000
0
Minimum 0.34000
0 -
981.3700 -
101.4200 -
542.0600 -
4024.570 -124.110 2.64000
Jarque-Bera 165865.
1 98325.0
7 5256.15
9 12626.4
5 58799.1
3 21096.3
2 10.4896
3
Probability 0.00000
0 0.00000
0 0.00000
0 0.00000
0 0.00000
0 0.00000
0 0.00527
5
Observations 360 360 360 360 360 360 360
Source: Authors’ Results from E-view 7 In capital structure equation, three proxy were used (NCLEQ, CULEQ and EQTTA), the descriptive measurements for each as presented above is explained thus: NCLEQ mean is 49.95081, STD is 108.6256 which shows strong dispersions of some observations from the mean and a considerable variations reflecting the heterogeneity of the sample data cutting across industrial groupings with max and min value of 1021.300 and -542.0600 respectively. CULEQ mean is 144.7880, STD is 413.1178 which shows strong dispersions of most of the observations from the mean and a considerable variations reflecting the heterogeneity of the sample

71
data cutting across industrial groupings with max and min value of 3908.300 and -4024.570 respectively; and EQTTA mean is 42.50678, STD is 29.35900 which shows weak dispersions of some observations from the mean and less considerable variations reflecting the heterogeneity of our sample data cutting across industrial groupings with max and min value of 353.1500 and -124.1100 respectively. Firm size (FISIZE) and the descriptive statistic shows: FISIZE mean is 4.058000; STD is 0.736622 which shows weak dispersions of some observations from the mean and less considerable variations reflecting the heterogeneity of our sample cutting across industrial groupings with max and min value of 5.990000 and 2.640000 respectively. The variables were normally distributed as reflected in the Jackque-Bera statistical probability values being less than 0.05. Table 2: Correlation Matrix Pearson Correlation t-Statistic TOBIN RETOE RETOA NCLEQ CULEQ EQTTA FISIZE
TOBIN 1.000000 -----
RETOE -0.057435 1.000000 -1.088521 -----
RETOA 0.042474 0.444990 1.000000 0.804376 9.401753 -----
NCLEQ -0.065550 -0.218214 -0.051507 1.000000 -1.242930 -4.230762 -0.975857 -----
CULEQ 0.008113 -0.583119 -0.054316 0.310000 1.000000 0.153512 -13.58111 -1.029218 6.169397 -----
EQTTA 0.028174 0.015515 0.498515 -0.219509 -0.148529 1.000000 0.533287 0.293595 10.88077 -4.257136 -2.841815 -----
FISIZE 0.080425 0.018733 0.139553 0.239680 0.073184 -0.116288 1.000000 1.526660 0.354509 2.666554 4.671120 1.388422 -2.215306 -----
Source: Authors’ResultsfromE-view7 Table 2 is the correlation matrix of the dependent and explanatory variables in the two equations. Included observations are 360 after adjustments with a balanced sample. In both equations, proxies correlate with each other as follows: NCLEQ (Tobin=-0.066; RETOE=-0.218; RETOA= -0.052); CULEQ (Tobin=0.008; RETOE= -0.583; RETOA=-0.054); and EQTTA (Tobin= 0.028; RETOE= 0.016; RETOA=0.499). However, the direction of correlation were not the same for all as some exhibit positive while others negative. A careful observation of the correlation among these set of proxy seems not to be high (less than 0.8) which implies that the problem of multicollinearity seems to be unlikely. The study now proceeds to estimate the 2sls regression. Analysis of Regression Result
Result of estimation from the 2sls for both financial performance equation and capital structure equation is presented below:

72
Table 3: Results of Financial Performance Equation
ROA Comment ROE Comment Tobin Q Comment
NCLEQ
-0.001836 (0.7633)
Absence of causality -0.043852
(0.2587)
Unidirectional causality
-0.001901 (0.3401)
Absence of
causality CULEQ
-0.00545* (0.0007)
Bidirectional causality
-0.114441* (0.0000)
Bidirectional causality
0.000401 (0.4334)
Absence of
causality
EQTTA
0.250633* (0.0000)
Bidirectional causality
-0.239855 (0.0672)
Unidirectional causality
0.008413 (0.2207)
Absence of
Causality R-squared 0.427142 0.356421 0.013831
Adjusted R-squared
0.418911 0.347175 0.228208
Durbin-Watson stat
2.146559 1.999317 1.784805
Instrument Rank
12 12 12
J-statistic
166.1625* (0.000000)
189.3257* (0.000000)
7.098632 (0.311822)
*sig at 5% level of significance Source: Authors’ Results from E-view 7 Table 3 above shows the result of financial performance equation. Specifically, it shows the impact of capital structure on firm financial performance. Three proxy of financial performance were used and the result revealed: the R-squared (RETOA= 0.43; RETOE=0.36; Tobin Q=0.014) which indicate the extent of variation in the dependent variable due to changes in the independent variable. However the Adjusted R-squared values differ slightly (RETOA=0.419; RETOE= 0.347; Tobin Q= 0.228). The Durbin-Watson statistic values indicate the presence or absence of autocorrelation in the model. According to Durbin and Watson (1951), DW statistic of approximately 2 indicate that the presence of autocorrelation in unlikely and result attest to this claim RETOA=2.14; RETOE=2.00; Tobin Q= 1.78). The instrument rank is 12 while the J-statistical probability values for both RETOA and RETOE indicate significant relationship between the dependent variable and the independent variable, however for Tobin Q, it appears insignificant. On the specific performance of the explanatory variables, NCLEQ is negatively related to all the performance indices and also insignificant at 5% level of significance (RETOA=0.7633>0.05; RETOE=0.2587>0.05; Tobin Q=0.3401>0.05). CULEQ is significantly related with RETOA and RETOE with negative relationship (RETOA=0.0007<0.05; RETOE=0.000<0.05) while it exhibit insignificant positive impact with Tobin Q (0.433>0.05). Finally, EQTTA a positive significant influence on RETOA (0.000<0.05) while insignificant impact with both RETOE and Tobin Q (RETOE=0.0672>0.05; Tobin Q=0.2207>0.05) with both negative and positive relationship respectively.

73
Table 4: Capital structure equation NCLEQ Comment CULEQ Comment EQTTA Comment
ROA
0.013831 (0.9761)
Absence of causality
5.088557* (0.0000)
Bidirectional causality
1.559392* (0.0000)
Bidirectional causality
ROE
-0.30036* (0.0000)
Unidirectional causality
-2.66409* (0.0000)
Bidirectional causality
-0.07525* (0.0000)
Unidirectional causality
Tobin Q
-2.113346 (0.1501)
Absence of causality
-2.004752 (0.6058)
Absence of causality
0.276040 (0.4158)
Absence of causality
R-squared 0.300883 0.643774 0.479990 Adjusted
R-squared 0.290692 0.638581 0.472582
Durbin-Watson
stat
1.990474 1.921410 2.095145
Instrument Rank
10 10 10
J-statistic 7.047576 (0.133395)
3.474470 (0.481771)
7.386848 (0.116804)
*sig at 5% level of significance Source: Authors’ Results from E-view 7 Table 4 above shows the result of capital structure equation. Specifically, it shows the impact of financial performance on firm capital structure decision. Three proxy of capital structure were used and the result revealed: the R-squared (NCLEQ= 0.301; CULEQ=0.644; EQTTA=0.480) which indicate the extent of variation in the dependent variable due to changes in the independent variable. However the Adjusted R-squared values differ slightly (NCLEQ=0.291; CULEQ= 0.639; EQTTA= 0.473). According to Durbin and Watson (1951), DW statistic of approximately 2 indicate that the presence of autocorrelation in unlikely and result attest to this claim NCLEQ=1.99; CULEQ=1.921; EQTTA= 2.095). The instrument rank is 10 while the J-statistical probability values for the three capital structure indices indicate absence of significant linear relationship between the dependent variable and the independent variables. On the specific performance of the explanatory variables, RETOA is significantly and positively related to both CULEQ and EQTTA (CULEQ= 0.000<0.05; EQTTA=0.000<0.05) while insignificantly related to NCLEQ (0.9761>0.05). RETOE is significantly and negatively related to NCLEEQ, CULEQ and EQTTA (0.000<0.05) in all the three cases. Finally, Tobin Q does not have significant impact on NCLEQ, CULEQ and EQTTA (0.1501>0.05; 0.6058>0.05; 0.4158>0.05) respectively with differing nature of relationship.
Hypotheses Testing and Discussion of Findings
Measuring financial leverage was measured by two proxy: noncurrent liabilities and current liabilities, the results in both table 3 and 4 were used for the hypotheses testing and discussion of findings. Specifically, giving that the RETOA results seems better in both cases of equation, it form the basis of the hypotheses testing and discussion of findings. On the impact of capital structure on financial performance (RETOA), there appears to be the absence of causality between NCLEQ and financial performance in both directions. This is evidenced by the significant statistic value of 0.7633 and 0.9761 being greater than 0.05 for both cases of NCLEQ on RETOA and RETOA on NCLEQ in table 3 and 4 respectively. This implies that noncurrent liabilities have no significant impact on RETOA likewise RETOA having no significant impact on noncurrent liability. Using the second proxy of capital structure (CULEQ), there appears to be bidirectional impact between CULEQ and RETOA. This is evidenced giving that

74
the significant statistic values of 0.0007 and 0.0000 being less than 0.05 for both cases of CULEQ on RETOA and RETOA on CULEQ in tables 3 and 4 respectively. In effect, that current liability has significant impact on RETOA likewise RETOA having significant impact on CULEQ. The result of the two proxy of financial leverage used in this study seems to be conflicting, however not unlikely. This could be explained against the backdrop that the flexibility of firms to adjust to its debt usage in downtime is very germane. For instance, a firm with high debt usage of noncurrent in nature will find it difficult to adjust in period of downtime thereby the interest fixed charge continues to exert pressure on the already deteriorating profit margin. However, in case of current liability, there is relative short period for the firm to adjust its debt usage in downtime period thereby restoring the shock associated with poor profit. In essence, the nature of the debt usage is germane for management to act in response to downtime period. This corroborates Hadlock and James (2002) who opined that the flexibility at which firms adjust its debt usage in down time also determines the impact it will have on earnings. Measuring equity ownership by the ratio of equity holdings to total assets and using EQTTA as proxy for capital structure, there is also the presence of bidirectional impact between equity ownership and financial performance. This is evidence by the significant statistic value of 0.000 and 0.000 being less than 0.05 for both cases of EQTTA on RETOA and RETOA on EQTTA on tables 3 and 4 respectively. This infers that equity ownership have significant impact on financial performance likewise financial performance having significant impact on EQTTA, thus the stated null hypothesis cannot be accepted. This study seems to be contrary to prior findings of Loderer and Martin (1997), Demsetz and Villalonga (2001), Bohren and Odegaard (2000) of unidirectional causality. These prior studies opined that performance determines equity ownership; on the contrary, equity ownership does not determine performance. The result of this study points otherwise and it is not unlikely because robust financial performance of firms can have impact on whether firms need to raise additional fund by subscription or not. A high profit margin of firms implies that there could be reasonable amount of internal source of fund (retained earnings) which could be used for any expansionary drive. This tends to mitigate the further charge on retained earnings if such funds were to be raise from new issues. In same vein, equity ownership drives performance because shareholders specifically, institutional shareholders may have invested in the investee for the sole purpose of growth and expansion and as such may not be interested in dividend payment. Similarly, a firm with reasonable number of insider ownership in the light of aligning the interest of shareholders and management may also crave for firm financial performance which could also account for the impact equity ownership has on performance as revealed by this study. In essence, the bidirectional impact between financial performance and equity ownership is not unlikely as opposed by findings of prior studies cited above. CONCLUSION AND RECOMMENDATIONS
The study evaluated the direction of causality between capital structure and financial performance in Nigeria using the 2 SLS. Financial leverage was proxy by ratio of noncurrent liability to overall assets (NCLEQ) and ratio of current liability to overall assets (CULEQ) while equity ownership was proxy as a ratio of equity shareholdings to total assets (EQTTA). Financial performance indices used in the study were RETOA, RETOA and Tobin Q. However, the study restricted its hypotheses testing to RETOA which appears better. The result revealed that NCLEQ seems not have causality with RETOA likewise RETOA not having causality with NCLEQ. Nevertheless, CULEQ exhibits causality with RETOA likewise RETOA having causal link with RETOA. In essence, there is simultaneous causal link between CULE and RETOA. EQTTA exhibits simultaneous causal link with RETOA, i.e. EQTTA determines RETOA and RETOA determine EQTTA. The reason for impact of CULEQ on RETOA hinge on the short time period for which firms can

75
adjust its debt usage to restore deteriorating profit during downtime. Result of EQTTA on RETOA reveals a simultaneous causal link between both. In the light of this, we recommend that firms should endeavour to have appropriate mixture of debt (noncurrent and current liabilities) usage in order not to have difficulty in adjusting during downtime period. In line with this, the study recommends that firms with high expansionary drive should have more of institutional shareholdings and insider shareholdings which further drive firm financial performance as opposed to heterogeneous equity ownership. Also, internal sources of fund from prior boom period should be plough back rather than holding them as idle fund which could eliminate the additional cost of new issues.
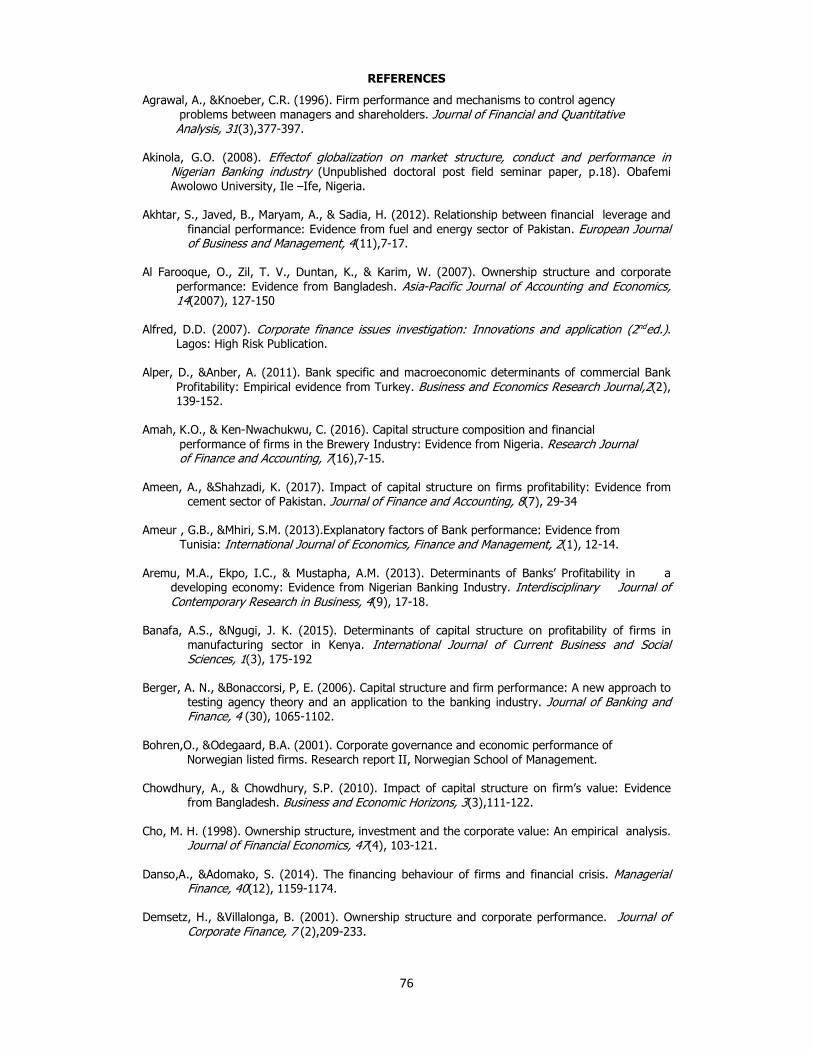
76
REFERENCES
Agrawal, A., &Knoeber, C.R. (1996). Firm performance and mechanisms to control agency problems between managers and shareholders. Journal of Financial and Quantitative Analysis, 31(3),377-397. Akinola, G.O. (2008). Effectof globalization on market structure, conduct and performance in
Nigerian Banking industry (Unpublished doctoral post field seminar paper, p.18). Obafemi Awolowo University, Ile –Ife, Nigeria.
Akhtar, S., Javed, B., Maryam, A., & Sadia, H. (2012). Relationship between financial leverage and
financial performance: Evidence from fuel and energy sector of Pakistan. European Journal of Business and Management, 4(11),7-17.
Al Farooque, O., Zil, T. V., Duntan, K., & Karim, W. (2007). Ownership structure and corporate
performance: Evidence from Bangladesh. Asia-Pacific Journal of Accounting and Economics, 14(2007), 127-150
Alfred, D.D. (2007). Corporate finance issues investigation: Innovations and application (2nded.).
Lagos: High Risk Publication. Alper, D., &Anber, A. (2011). Bank specific and macroeconomic determinants of commercial Bank
Profitability: Empirical evidence from Turkey. Business and Economics Research Journal,2(2), 139-152.
Amah, K.O., & Ken-Nwachukwu, C. (2016). Capital structure composition and financial performance of firms in the Brewery Industry: Evidence from Nigeria. Research Journal of Finance and Accounting, 7(16),7-15. Ameen, A., &Shahzadi, K. (2017). Impact of capital structure on firms profitability: Evidence from
cement sector of Pakistan. Journal of Finance and Accounting, 8(7), 29-34 Ameur , G.B., &Mhiri, S.M. (2013).Explanatory factors of Bank performance: Evidence from Tunisia: International Journal of Economics, Finance and Management, 2(1), 12-14. Aremu, M.A., Ekpo, I.C., & Mustapha, A.M. (2013). Determinants of Banks’ Profitability in a
developing economy: Evidence from Nigerian Banking Industry. Interdisciplinary Journal of Contemporary Research in Business, 4(9), 17-18.
Banafa, A.S., &Ngugi, J. K. (2015). Determinants of capital structure on profitability of firms in
manufacturing sector in Kenya. International Journal of Current Business and Social Sciences, 1(3), 175-192
Berger, A. N., &Bonaccorsi, P, E. (2006). Capital structure and firm performance: A new approach to
testing agency theory and an application to the banking industry. Journal of Banking and Finance, 4 (30), 1065-1102.
Bohren,O., &Odegaard, B.A. (2001). Corporate governance and economic performance of Norwegian listed firms. Research report II, Norwegian School of Management. Chowdhury, A., & Chowdhury, S.P. (2010). Impact of capital structure on firm’s value: Evidence
from Bangladesh. Business and Economic Horizons, 3(3),111-122. Cho, M. H. (1998). Ownership structure, investment and the corporate value: An empirical analysis.
Journal of Financial Economics, 47(4), 103-121. Danso,A., &Adomako, S. (2014). The financing behaviour of firms and financial crisis. Managerial
Finance, 40(12), 1159-1174. Demsetz, H., &Villalonga, B. (2001). Ownership structure and corporate performance. Journal of
Corporate Finance, 7 (2),209-233.

77
Fernandez, C., & Gomez, S. (2002). Does ownership structure affects firm performance? Evidence from a continental-type governance system, working paper.
Flamini, V., McDonald, C., & Schumacher, L. (2009). The determinants of Commercial Bank
Profitability in Sub-Saharan Africa. IMF Working paper series WP/09/15. Firth, M., Fung, P.M.Y., &Rui, O.M. (2002). Simultaneous relationship among ownership, corporate governance and financial performance. Working paper. Ghosh, A., & Jain, P.C. (2000). Financial leverage changes associated with corporate mergers. Journal of Corporate Finance, 6(3),377-402. Graham, J., & Harvey, C. (2001). The theory and practice of corporate finance: Evidence from the
field. Journal of Financial Economics, 50(3), 187-243. Hadlock, C., & James, C.C. (2002). Do banks provide financial slack? Journal of Finance, 57(4),1383-1419. Huang, H., & Vu Thi, T. (2003). The determinants of capital structure in shipping companies: Case
studies of Brotrom and Concordia. Unpublished Mastersthesis, University of Gothenburg, Gothenburg.
Hutchinson, R.W. (1995). The capital structure and investment decisions of the small owner- managed firm: Some exploratory issues. Small Business Economics, 7(3), 231-239 Kennon, J. (2010). An introduction of capital structure: Why capital structure matters to your investment. Retrieved from www.about.com Khan, A. G. (2012). The relationship of capital structure with firm performance of the engineering
sector of Pakistan. International Journal of Accounting and Financial Reporting, 2(1), 2162-3082.
Khalaf, T. (2013). The relationship between capital structure and firm performance: Evidence from
Jordan. Global Advance Research Journal of Management and Business Studies, 2 (11),542-546.
Kiruri, R.M. (2013). The effect of ownership structure on bank profitability in Kenya. European Journal of Management Sciences and Economics, 1(2),116-127. Lawal, B. A., Edwin, T.K. Kiyanjui, M.W., Adisa, M.K. (2014). The effect of capital structure on firms performance: Empirical study of manufacturing companies in Nigeria. Journal of Finance and Investment, 3(4), 39-57 Linderberg, E., & Ross, S. (1981)Tobin’s Q ratio and industrial organization. Journal of Business,
54(5),14-16. Loderer, C., & Martin, K. (1997). Executive stock ownership and performance: Tracking faint traces. Journal of Financial Economics, 45 (5), 223-255. Mazur, K. (2007). The determinant of capital structure choice. Evidence from Polish companies. Journal of International Economics, 13(2), 495-514. Male, R.K., & Mukras, M.S. (2015). Financial leverage and performance of listed firms in a frontier market: Panel evidence from Kenya. European Scientific Journal, 11(7), 534-550. Miller, M.H. (1977). Debt and Taxes. Journal of Finance, 32 (May), 261-276. Retrieved from cms.mngt.waikato.ac.nz Mostafa, H.T., &Boregowda, S. (2014). A brief review of capital structure theories. Research Journal of Recent Science, 3(10), 113-118

78
Modigliani, F. & Miller, M.H. (1958). The cost of capital : Corporation finance and the theory of investment. American Economic Review,(Jun), 261-297. Retrieved from cms.mngt.waikato.ac.nz
Modigliani, F., & Miller, M.H. (1963). Corporate income taxes and cost of capital. American Economic Review, (Jun), 433-433. Retrieved from cms.mngt.waikato.ac.nz. Myers, S. C. (2001). Capital Structure, The Journal of Economic Perspective, 15 (2), 81 -102. Myers, S., &Majluf, N. (1984). Corporate financing and investment decisions when firms have
information that investors do not have.Journal of Financial Economics, 2 (13), 187 – 221 Morck, R., Shleifer, A., &Vishny, R. (1998). Management ownership and market valuation: An empirical analysis. Journal of Financial Economics, 20 (2), 293-315. Mwangi, M., Birundu, E.M. (2015). The effect of capital structure on the financial performance of
small and medium enterprises in Thika-sub-county, Kenya. International Journal of Humanities and Social Science, 5(1),151-156.
Ogunleye, R.W. (1995, Decenber). Monetary Policy Influence on Banks Profitability. NDIC Quarterly,
5 (4), 12-17 Ongore, V.O., &Kusa, G.B. (2013). Determinants of financial performance of commercial banks in
Kenya. International Journal of Economics and Financial Issues, 3(1), 237-252. Pandey, I.M. (2008). Financial Management (9thed.). New Delhi: Vikas Publishing House PVT LTD. Pedersen, T., & Thomsen, S. (2003). Ownership structure and value of the largest European firms:
The importance of owner identity, Journal of Management and Governance, 7 (4), 27-55. Penman, S.H. (2001). Financial statement analysis and security valuation. New York: Mc Graw Hill Rajin, S. (2012). Impact of financial leverage on shareholders returns and market capitalization:
Empirical evidence of telecommunication sector companies. India International Journal of Research in IT, Mgt and Engineering, 2(12), 34-45.
Raji, I. (2012). Effects of ownership structure on the performance of listed companies on the Ghana
Stock Exchange. Unpublished thesis. Retrieved from chss.uonbi.ac.ke Relman, S.S.(2013). Relationship between financial leverage and financial performance: Empirical
evidence of listed sugar companies of Pakistan. Global Journal of Management and Business Research Finance, 13(8), 33-40
Sanni, M.R. (2009). The effects of the 2006 consolidation on profitability of Nigerian banks. Nigerian
Research Journal of Accountancy, 1(1),107-120. Shahar, W.S.S. Shahar, W. S. S, Bahari, N. F., Ahmad, N. W., Fisal, S., Rafdi, N. J. (2015). A review
of capital structure theories: Trade-off theory, Pecking Order theory and Marketing theory. Proceeding of the 2nd International Conference on Management and Muamalah 2015 (2ndICoMM) 16th -17th November 2015.
Shah, A., & Khan, S. (2007). Determinants of capital structure: Evidence from Pakistani panel
data. Retrieved from www.irbrp.com Sheikh, N.A. & Wang, Z. (2010). Financing behaviour of textile firms in Pakistan. International Journal of Innovation, Management and Technology, 1(2) 130-135. Tong, G., & Green, C.J. (2005). Pecking order or trade-off hypothesis? Evidence on the capital structure of Chinese companies. Applied Economics, 37(19), 2179-2189.

79
Umar, M.M Tanveer, Z., Aslam, S., Sajid, M. (2012). Impact of capital structure on firms financial performance: Evidence from Pakistan. Research Journal of Finance and Accounting, 3(9), 1-12.
Uwuigbe, U., Olusanmi, O. (2012). An empirical examination of the relationship between ownership
structure and the performance of firms in Nigeria. International Business Research, 5(1), 208-215.
Vitor, D. A., & Badu, J. (2012). Capital structure and performance of listed banks in Ghana. Global
Journal of Human Soc. Sc., 12(5),56-62. Wellalage, N.H., & Lock, S. (2014). Ownership structure and firm financial performance:
Evidencefrom panel data in Sri Lanka. Journal of Business Systems, Governance and Ethics, 7(1), 52-65.
Wen, W. (2010) Ownership Structure and Banking Performance: New Evidence in China.
UniversitatAutònoma de Barcelona Department D’economia de L’empresa, 2010. Israel, G.D. (1992). Sampling the evidence of extension program impact. Program evaluation and
organizational development, IFAS, Universsity of Florida.PEOD-5.October. Retrieved from https://edis.ifas.ufl.edu/pd006.
Zakaria, Z., Purhanudin, N. (2014). Ownership structure and firm financial performance: Evidence
from Malaysian Trading and Services Sector. European Journal of Business and Social Science, 3(2), 32-43.
Zeitun, R., & Tian, G. (2007). Capital structure and corporate performance: Evidence from Jordan.
Australian Accounting Business and Finance Journal, 1(3),40-53.

80
Impact of Audit Quality on Earnings Management of Listed Deposit Money Banks in Nigeria
Halima Abdullahi Baba Department of Social Sciences and Administration, School of Continue Education,
Bayero University Kano, Nigeria.
And
Dr. Ishaq Alhaji Samaila
Department of Accounting, Faculty of Social and Management Sciences, Bayero University Kano, Nigeria.
_____________________________________________________________________________
ABSTRACT
This paper investigates the relationship between audit quality (measured by audit fees, audit tenure and joint audit), and earnings management (measured by discretionary accruals) in the Nigerian deposit money banks using a sample of thirteen (13) listed deposit money banks for a period of ten (10) years (2006-2015). The study makes use of secondary data i.e data where extracted from the annual reports of banks. The study used the General Least Squares (GLS) regression technique of data analysis; the study found that audit quality has significant impact on the Earnings Management of listed deposit money banks in Nigeria during the period of the study. The study also found that audit fees (AF) has a negative and insignificant impact on earnings management, while audit tenure (AT) has a positively significant impact on earnings management of listed deposit money banks in Nigeria. Joint Audit (JA) has a negative and significant impact on earnings management of listed deposit money banks in Nigeria. The study recommended that listed deposit money banks in Nigeria should remunerate their external auditors adequately so as to carry out their audit functions optimally, also auditors should maintain the stipulated number of years of auditor-client relationship, they should not exceed such period, because a very long auditor-client relationship will increase earnings management. The study also recommends the use of joint auditor, especially two big fours to audit the accounts of listed deposit money banks in Nigeria, as this will reduce earnings manipulation. Key words: Audit Fees, Audit Tenure, Joint Audit, Audit Quality, Earnings Management. 1.0 INTRODUCTION
Accounting scandals experienced in the last few years in companies such as Spring Bank, Savanna Bank, Gulf Bank, Cadbury Plc, African Petroleum Plc, HealthSouth, Enron, Tyco, Arthur Andersen and WorldCom have affected the regulators trust of financial statements. This scandal and its subsequent results were a main reason for drawing attention towards the quality of financial statements. Moreover, the financial crisis which has affected most of the world in the recent years has pushed up the demand for high audit quality. This result may signal that auditors are being more watchful after such crisis and that they now tend to perform their work in a highly ethical manner to ensure high quality. Thus, audit quality is one of the main factors that affect the credibility of financial information. This can be a motivation for research.
Auditing is a control mechanism for quality assurance following the divorce between ownership and control in today’s modern corporate world. That is, auditors are expected to provide an independent assessment of financial statements prepared by management to detect accounting misstatements and then to express them in appropriate audit opinion Watts and Zimmerman (1986). Audit quality can be described as the ability of an auditor to provide an independent audit which results in a financial statement that is free from misstatement, error and fraud. Basiruddeen (2011) describes audit quality as the competence of the auditors to detect errors and the objectivity of the auditors in reporting such errors. A high quality audit increases the perception that the auditors are not less objective and have higher probability of reporting discovered errors, misstatements and earnings

81
management in the financial statement. Earnings management occurs when the managers use their judgement in preparing financial statements with the intention not to report the firm’s actual economic performance or in order to gain benefit from the adjusted figure (Healy and Wahlen, 1999).
The banking sector in Nigeria plays a crucial role in the economic development of the country. Banks as part of the Nigerian financial system channel scarce resources from surplus economic units to deficit units and they exert a lot of influence on the pattern and trend of economic development through their lending and deposit mobilization activities, (Nzotta, 2004). According to Samiu and Johnson (2012), existing literature shows that the size of audit fee is the most critical factor that erodes auditor quality and auditor independence. Some of the attributes of audit that could affect the audit quality positively and increase the chances of discovering and reporting material intentional error and misstatements in the financial statement include size of audit firm, audit tenure, experience of the auditors, audit fee and joint audit services. In Nigeria however, there are few researches in the banking sector particularly the deposit money banks that has addressed all of these issues. This therefore, constitutes the problem this research tries to investigate. In order to address these problems the study therefore raises the following questions; How does audit fees affect earnings management of deposit money banks in Nigeria? How does audit tenure affect earnings management of deposit money banks in Nigeria? How does joint audit affects earnings management of deposit money banks in Nigeria? Based on the stated problems of the study, the main objective of the study is to examine the impact of audit quality on earnings management of listed deposit money banks in Nigeria. The specific objectives of the study are to examine the impact of: i. Audit fees on earnings management of listed deposit money banks in Nigeria ii. Audit tenure on earnings management of listed deposit money banks in Nigeria iii. Joint audit on earnings management of listed deposit money banks in Nigeria This research is significant in examining the impact of audit quality on earnings management of listed deposit money banks in Nigeria. The study is therefore expected to be of great benefit to researchers, shareholders, auditors, creditors, depositors, regulatory authorities, professional bodies and management. The scope of the research is expected to cover a period of ten (10) years 2006-2015. This research is restricted to deposit money banks that are listed on the floor of the Nigerian Stock Exchange (NSE) as at 31st December, 2005. This paper therefore, examines the impact of audit quality (audit tenure, audit fees and joint audit) on earnings management of listed deposit money banks in Nigeria. To achieve this, the paper is divided into five sections namely; introduction, literature review, methodology, results and discussions and finally conclusion and recommendations.
2.0 LITERATURE REVIEW
This section reviews relevant empirical studies on the impact of audit quality (audit tenure, audit fees and joint audit). Then an extensive body of earnings management literatures has been developed. It also critically reviewed previous literatures about the impact of audit quality to earnings management. The review also covers empirical studies that were conducted on the impact of audit quality on earnings management and lastly a theoretical framework that underpins the research work was reviewed. 2.1 Earnings management
Earnings management is a purposeful intervention in the external financial reporting process, with the intent of obtaining some private gain, Schipper (1989). Healy and Wahlen (1999) claim that earnings management occurs when the managers use their judgement in preparing financial statements with the intention not to report the firm’s actual economic performance or in order to gain benefit from the adjusted figure. Bello (2010) refers to earnings management as any attempt to cook/doctor or tailor financial accounting to a given desired level. Aliyu, Musa and Zachariah (2015) refers to earnings management as intentional and unintentional actions that managers take

82
which affect reported earnings and mislead accounting information users. Consistent with these definitions and description of earnings, the present study views earnings management as an opportunistic behavior of management to influence financial statement. 2.2 Audit Quality
DeAngelo (1981) defines audit quality as the market assessed joint probability that a given auditor will both (a) discover a breach in the client’s accounting system and (b) report the breach. This definition signifies the ability of an auditor to detect accounting misstatements and then to express them in appropriate audit opinion. Palmrose (1988) describes audit quality in terms of levels of assurances. Higher levels of assurances (i.e. possibility that financial statements contain fewer errors or misstatements) are associated with a higher audit quality and vice-versa. This definition have been developed from audit failures (where an auditor has failed to detect a material error or misstatement) than can be traced in litigation cases. According to Francis (2004), audit failure can be classified as extremely low audit quality (end quality) that can result in several outcomes such as regulatory sanctions, litigation rates, business failure and earnings restatement. Hope and Langli (2007) sees audit qualities as an auditor carrying out his work in the highest degree of independence and objectivity. Duff (2004) suggests that audit quality is made up of both technical quality and service quality (the levels of clients‟ satisfaction and expectations). Technical quality consists of reputation capital, capability, expertise, experience and independence scales, while service quality is defined by responsiveness, empathy and the provision of NAS and client services. Aliyu et al (2015) defines audit quality as the ability of an auditor to detect a breach and the willingness to report the breach. Following various definition by various scholars, this study defines audit quality as the ability of auditors to show professionalism and their ability to detect errors and the objectivity in which such errors are reported. Several factors may influence the quality of an audit. Wooten (2003) claims that audit firms, audit teams and the professional judgement or auditor independence are the principal contributors to audit quality. A audit firm and audit team factors (e.g. human resources, audit processes, industry expertise, supervision, audit planning, and professionalism) directly contribute to the skill and competence of auditors in detecting errors and misstatements. The factors of audit tenure and audit fees not only directly impair auditor independence, but they also implicitly support auditor effectiveness. The measurement of audit quality is complex and problematic (Wooten, 2003; Niemi, 2004; Jensen and Payne, 2005). However, Bailey and Grambling (2005), Francis (2004) and PCOB (2008) have identified several potential measures for audit quality in both academic literature and in practice. These measures are perceived as factors, indicators, behaviors or perceptions that have a direct and an indirect link with audit quality. 2.3 Audit fees and earnings management
There seems to be inconclusive findings with respect to the relationship between audit quality and earnings management in prior literatures. Looking at audit fees as one of the proxies for audit quality, there are several arguments for the proposition of audit fees as proxy for audit quality. Several studies suggest that higher audit fees are associated with higher audit quality in order to compensate for the high-price of reputation capital which is (big-size), as well as for increased audit effort (Simunic, 1980). Craswell et al. (1995) argue that the reputation development of an auditor’s brand name consumes a higher cost and thus results in higher audit fees. Evidence suggests that audit clients are willing to pay a fee premium on these auditors’ reputations in order to get a better quality of service. The brand name auditors demonstrate the effect of a Big 4 premium that is justified for higher reputation capital, and thus they convey a higher quality differentiation compared to non-brand name auditors (Simunic, 1980).

83
According to Palmrose (1986), the Big size auditors charge higher audit fees for two reasons: they indicate (1) higher audit quality or (2) monopoly pricing. After substituting the audit fees variable for audit hours, her finding supports that the Big size auditors are consistent with higher audit quality providers. She indicates that “big size designation is a quality surrogate, in that increased hours by big size auditors would reflect greater productive activities (evidence acquisition) in providing higher levels of assurance (higher quality) to clients. In the work of Wolinsky (1983) he argued that the price may signal a differentiation in levels of quality. Although sellers are potentially capable of producing the preferred and various levels of quality, the higher quality products are more costly to produce. DeAngelo (1981) claims that larger sized auditors or auditors that earn higher fees have more resources to invest when compared with smaller size auditors. Hence, they contribute more to improving the quality of their work. In the works of Francis and Ke, (2003); Reynolds, and Francis (2004) they found that audit fees have a negative relationship with earnings management, and thus, this improves the quality of financial reporting of firms. This study defines audit fees as the total amount of audit and non-audit fees paid to the audit client. Based on the above discussion, our first hypothesis is formulated as follows: H01 Audit fees has no significant impact on the earnings management of listed deposit money
banks in Nigeria
2.4 Audit Tenure and Earnings Management
Empirical studies of audit tenure also reported a mixed result. This is because the question of whether audit quality is affected by the length of time that an auditor client has received great attention from researchers. The majority of recent studies seem to refute the assertion that a long auditor-client relationship negatively affects audit quality (Ghosh and Moon 2005; Myers et al. 2003; Geiger and Raghunandan 2002). Knapp (1991) established a connection between audit tenure and competence. As perceived by US audit committee members, the likelihood that the auditor will detect an anomaly increases in the first years of his mandate, and then decreases gradually, reaching its weakest level after 20 years of service. Hence, as a whole, a negative association is commonly assumed between auditor tenure and the quality of audit. Long auditor tenure may increase auditor competence as the auditor can base audit decisions on extensive client knowledge that has developed over time or it may undermine auditor independence as lengthy tenure fosters closeness between management and the auditor. Short audit tenure may undermine auditor competence since the auditor knows less about a company in the early years of an audit, but it may also undermine auditor independence since auditors will wish to retain a new client long enough to recoup the costs of the initial audit setup (Dye 1991). Auditor Tenure is defined in this study as the length of period in which an auditor-client relationship is established. Based on the above discussion, the following hypothesis is formulated as follows: H02 Audit tenure has no significant impact on the earnings management of listed deposit money banks in Nigeria
2.5 Joint Audit and Earnings Management
Empirical studies on joint audit also reported mixed results. Deangelo (1981) documented that recent literatures have encouraged joint auditors approach in ensuring objective financial reporting. That is the appointment of joint auditors to a firm will enhance its financial reports quality by minimizing earnings management. A study by Francis et al. (2009) analyzed the consequences of France’s joint audit requirement on earnings quality and find that Big 4 auditor-pairs are associated with lower levels of income-increasing abnormal accruals. They found that in France firms with one or two Big 4 auditors are less likely to have income increasing abnormal accruals than other firms. Firms audited by two Big 4 auditors were even less likely to have income-increasing accruals. Big 4 auditors paired with non-Big 4 auditors are also associated with lower levels of income increasing abnormal accruals however to a lesser extent and concluded that a pecking order explains this with regards to earnings quality and auditor-pair choice. Consistent with the above, it is of great benefits for banks to engage the services of joint auditors in auditing their firms, this is because it is believed that when two big 4 auditors pairs, the level of earnings manipulations is reduced.

84
2.6 Theoretical Framework
Three theories could be said to the theories that underpin this study, they are; the agency theory, stakeholders’ theory and opportunistic Earnings Management theory. From the agency theory point of view, agency relationship is seen as a contract under which one or more persons (the principle(s) engage another person (the agent) to perform services on their behalf which involves delegating some decision making authority to the agent. If both parties are utility maximizers, there is good reason to believe that the agent will not always act in the best interests of principal. The principal can limit divergences from his interest by establishing an appropriate incentive for the agent and by incurring monitoring costs designed to limit the aberrant activities of the agent (Jersen and Meckling, 1976). The opportunistic Earnings Management theory largely originated with Healy (1985) who concludes that managers use accruals to strategically manipulate bonus income. For instance, managers can defer income through accruals when earnings target for a bonus plan cannot be reached or when bonuses have already reached maximum levels, and can accelerate income in other periods (Marcia et al, 2006). Holthausen et al (1995) concludes that managers may use accruals to shift earnings overtime with goal of maximizing long term bonus income. 3.0 METHODOLOGY AND MODEL SPECIFICATION
The research design used for this study is correlation, because it describes the statistical relationship between two or more variables. Audit quality and earnings quality are the variables of the study. The audit quality is the independent variable which is proxied by audit tenure and joint audit, while the dependent variable is earnings management represented by the residuals from the modified Jones Model by Dechow et al. (1995). The population of this study consists of all the listed deposit money banks in Nigeria as at 31st December, 2015. Filter is used to eliminate some of the firms that do not have complete records of all the data needed for measuring the variables of the study within the period of 2006 to 2015. The sample of the study consists of thirteen firms that have complete records to be used for the study. The data was extracted from secondary source which was obtained from the annual reports accounts of the firms for the period under study. Multiple regression is used to examine the model of the study. Regression analysis is used in determining the earnings management of listed deposit money banks in Nigeria, by adopting the modified Dechow et al. (1995). The residuals of the model are given below:
3.1 Variables Measurement and Model Specification
The variables of the study consist of Dependent Variable which is Earnings Management measured by discretionary accruals using modified Jones model by Dechow et al. (1995). This was done by conducting the analysis in two stages- extracting the residuals from the modified Jones model first and then run the regression with the model of the study. The independent variables audit fees, audit tenure, joint audit and audit size. This is shown in Table 3.1, which contains each variable with their definitions
3.2 Table Showing Variables and their Measurement The measurements of the variable of the study are stated in table 1 below; S/N VARIABLES OPERATIONALIZATION
Dependent Variable
1. Earnings Management Discretionary Accruals (Modified Jones Model) Explanatory Variable 2. Audit Fees Log of audit remuneration paid by company to audit
firms 3. Audit Tenure Length of auditor-client relationship: ‘1’ if 2 yrs+ & ‘0’ if
otherwise. 4. Joint Audit Measured by dichotomous variable (‘1’ if a bank is
audited by more than one audit firm and ‘0’ if otherwise) Control Variable 5. Leverage LEV is measured as the ratio of debt to total asset Source: Generated by the author

85
Modified Jones Model by Dechow (1995) TAACit = NIit- CFFOit………………………………………………………..(1) Where TACC it= total accruals for firm 1 in year t, which is the difference between cash flows from operations and the net income before extra-ordinary item, interest and tax. NIit = net income for firm 1 in year t, CFFOit= operating cash flow for firm 1 in year t, The parameters for the calculation of non-discretionary accruals (NDA) are estimated by using the following equation: �� ������� = � � �
������ + �1 �∆���������� � + �2(�����
�����)+Ɛit………………………..2
Where, TACCit= total accruals for firm I year t, Ait-1 = total assets for firm 1 in year t-1, REVit= change in net revenue for firm I in year t, PPEit= property, plant and equipment for firm I in year t, ��1�2 = coefficient parameters ∈ it =error term for firm I in year t. The NDA are calculated using the estimated parameters obtained from equation (2): $%�
����� = � � ������� + �1 �∆������∆����
����� � + �2(����������)………………………..3
Where: ∆ARit= change in accounts receivable for firm I in year t, �1�1� = coefficient parameter estimates Changes in accounts receivable are not included in estimating the parameters but are included in calculating non-discretionary accruals. Similarly, in order to control heteroscedasticity, all the variables are lagged by Total asset (Teoh et al., 1998, Ashbaugh et al.,2003,Kam, 2006, Hutchinson et al. 2008, Gulzar et al. 2011, Gonzalez et al., 2012). Finally, DACit are calculated as the difference between TA and NDA
DCAit = �� &'��&'�� − )*�+it … … … … … … … … … … … 4
MODEL SPECIFICATION
The model used to empirically test the hypotheses formulated is as follows; EM= α0+ α1AFit + α2ATit + α3JAit + β1LEVit + eit
Where; AQ= f (AF, AT and JA) EMit= f(AFit, ATit and JAit)
Where; EM= Earning Management for Bank i in period t AF= Audit fees for Bank i in period t AT = Audit tenure for Bank i in period t JA = Joint Audit for Bank i in period t LEV= Leverage for Bank i in period t α0ii - intercept for bank i in period t e= an error term α1it – α3it = regression coefficient of Explanatory variables for bank i in period t β1it = regression coefficient of Control variables for bank i in period t Robustness test
The following robustness tests were conducted in order to improve the validity of statistical inferences. Multicolinearity Test: Since the study employs multiple regression model, the association between the predictor variables is unavoidable. Where the association is highly correlated, multi Colinearity exists. This is tested to see the possibility of its existence or otherwise. This is done using variance inflation factor (VIF) and tolerance value.

86
Heteroscedasticity test: The study deals with observations that constitute different sizes, some are in ratios while others in units, and that heteroscedasticity often occurs when there is a large difference among the sizes of the observations. For that, we have to run for Heteroscedasticity test, and thus the hausman test suggested fixed effect as appropriate. For that fixed effect was used in the interpretation of the results. 4.1 Results and Discussion
Table 4.1 Descriptive and Correlation Matrix of Dependent and independent Variables
Variable Obs Mean Stddev Min MAX EM AF AT JA LEV
EM 130 0.190 0.673 -4.922
1.916
1.0000
AF 130 8.105 0.409 7.301 9.414
-0.0408
1.0000
AT 130 0.9 0.301 0 1 0.1538 -0.0065
1.0000
JA 130 0.246 0.432 0 1 -0.1334
-0.0238
0.0119
1.0000
LEV 130 0.075 0.152 0 0.973
0.118 0.0796 -0.028
-0.0728
1.0000
Source: STATA Output, 2017 Table 4.1 shows that Earnings Management (EM), has an average value of 0.190 with standard deviation of 0.673, and minimum value of -0.4922 and 1.916 as the maximum value. The standard deviation of 0.673 implies that the data deviate from the mean value from both sides by 0.190, implying that the data is dispersed from the mean because the standard deviation is higher than the mean. Similarly, the table shows Audit Fees has a mean of 8.10 and a standard deviation of 0.40, the minimum audit fees is indicated by the min of 7.3 and a max of 9.4 as remuneration for audit assignment. The table also indicates that our measure of Auditor tenure (AT), has an average value of 0.9 with standard deviation of 0.301. While the minimum and maximum values which are dichotomous are 0 and 1 respectively. The result also shows that on average 24.6% of the sample banks employed the services of Joint Audit (JA) during the period of the study, from the mean value of 0.246 with standard deviation of 0.432. The minimum and maximum values of joint audit as measured by dichotomous variable are 0 and 1 respectively. From the correlation result on the table, audit fees is seen to be negative and weakly correlated with earnings management, audit tenure is positively but weakly correlated with earnings management of listed deposit money banks in Nigeria. Joint audit has a negative and weak relationship with earnings management of listed deposit money banks in Nigeria, while the control variable leverage has a positive relationship with earnings management of listed deposit money banks in Nigeria. The tolerance values and the variance inflation factor are good measures of evaluating multicollinearity between the independent variables of the study. The results shows that tolerance values were less than 1.00 and the variance inflation factor were less than 10 showing that serial correlation may not cause problem to the study. Table 4.2: Regression Result
EM COEF STD ERR T P>/T/ CONT 1.179247 1.217269 0.97 0.335 AF -.1554416 .1485304 -1.05 0.298 AT .3564895 .1927428 1.85 0.067*** JA -.3558594 .1974394 -1.80 0.074*** LEV .5029919 .4397246 1.14 0.255
Source: STATA Output, 2017 Table 2 above, shows the summary of the estimated regression model EM= 1.179 - 0.1554AF +0.3564AT -0.3558JA + 0.5029LEV

87
The model shows that audit fees has a negative and insignificant impact on earnings management of listed deposit money banks in Nigeria, this implies that an increase in audit fees will decrease the earnings management of listed deposit money banks in Nigeria. Based on this result, the first hypothesis which states that audit fees has no impact on earnings management of deposit money banks in Nigeria cannot be rejected. This is similar with the views of Francis and Ke, (2003); Reynolds, and Francis (2004) who also found that audit fees have a negative relationship with earnings management. Audit tenure has a positively significant impact on earnings management of listed deposit money banks in Nigeria at 10% level of significant. This means that for every 10% increase in the auditors tenure, earnings management will increase by 35%. The implication of this result is that, if banks make use of a particular auditor without changing them after the stipulated ten year period, then earnings management is bond to increase due to familiarity of the auditors to the firm concern. Consequently, the result produces a basis for rejecting the second null hypothesis formulated which states that audit tenure has no significant effect on earnings management of listed deposit money banks in Nigeria. This result is consistent with the result of Chi et al. (2011) and Cohen and Zarowin (2010) who found that auditor tenure is associated with earnings management, but it is in contrary with the findings of Simnett (2006) and Jackson et al. (2008) who found no relation between audit partner tenure and the absolute value of discretionary accruals. Similarly, Joint Audit (JA) has a negative and significant impact on earnings management at 10% level of significance. The implication of this is that, if banks employ the services of joint auditor by 10% then earnings management will reduce by 20%. This result produces a basis for rejecting the third null hypothesis formulated which states that joint audit has no significant effect on earnings management of listed deposit money banks in Nigeria. This is similar with the view of. The implication of this findings are that, when auditor are well paid or when their remuneration increase, they will carry out their function optimally, and may even engage the service of another auditor to carry out a joint audit, and by so doing will decrease the level of earnings management. Another implication is that if the regulatory authorities do not improve surveillance on auditor tenure in the deposit money banks in Nigeria, the problem of unethical accounting practices is likely to increase.
CONCLUSION AND RECOMMENDATION
This study investigates the impact of audit quality on earnings management of listed deposit money banks in Nigeria. Audit fees, audit tenure and joint audit were used as proxy for audit quality, while leverage was used as a control variable. The modified Jones Model by Dechow et al. (1995) was used to represent earnings management as the dependent variable of the study. This study concludes that, audit fees (AF) has a negative and insignificant impact on earnings management, while audit tenure (AT) has a positively significant impact on earnings management of listed deposit money banks in Nigeria. Joint Audit (JA) has a negative and significant impact on earnings management of listed deposit money banks in Nigeria. In line with the findings, the study recommended that listed deposit money banks in Nigeria should remunerate their external auditors adequately so as to carry out their audit function optimally, also auditors should maintain the stipulated number of years of auditor-client relationship, they should not exceed such period, because a very long auditor-client relationship will increase earnings management. The study also recommends the use of joint auditor, especially two big fours to audit the accounts of listed deposit money banks in Nigeria, as this will reduce earnings manipulation.

88
REFERENCES
Ashbaugh. H., LaFond, R., and Mayhew, B.W. (2003). Do Non-Audit Services Compromise Auditor
Independence? Further Evidence. The Accounting Review, 78 (3), 611-639.
Basiruddin, R. (2011). The Relationship Between Governance Practices, Audit Quality and Earnings
Management: UK Evidence, Durham Theses, Durham University. Available at Durham E-
Theses Online: http://etheses.dur.ac.uk/1382/
Becker, C. L., DeFond, M. L., Jiambalvo, J., and Subramanyam, K. R. (1998). The Effect of Audit
Quality on Earnings Management: Contemporary Accounting Research, Vol. 15, No. 1: 1-21.
Bello, A. (2011). Corporate Governance and Accounting Ethics in Nigeria. International Conference
on Management (ICM 2011) Proceeding (pp. 1591-1608). Retrieved from http://ssrn.
com/abstract=1963971.
Chi, W., Lisic, L. and Pevzner, M., (2011). Is Enhanced Audit Quality Associated with Greater Real
Earnings Management? Accounting Horizons, 25 (2), 315-335.
Cohen, D., and Zarowin, P., (2010). Accrual-Based and Real Earnings Management Activities Around
Seasoned Equity Offering: Journal of Accounting and Economics, Vol 50, 2-19.
DeAngelo, L. (1981). Auditor Size and Audit Quality: Journal of Accounting and Economics. Vol. 3,
No. 3, pp. 183-199.
Dechow, P.M, Sloan, R.G. and Sweeney, A.P. (1995). Detecting Earnings Management. The
Accounting Review. Vol. 70, No. 2, pp. 193-225.
Duff, A. (2004). Auditqual: Dimensions of Audit Quality, Institute of Chartered Accountants of
Scotland: Edinburgh.
Dye, R. (1991). Earnings Management in an Overlapping Generations Model: Journal of Accounting
research, 26, 195-235
Francis, J. R and Ke, D. (2003). The Joint Effect of Investor Protection and Big 4 Audits on Earnings
Quality Around the World. Contemporary Accounting Research, 25 (1), 157-191.
Francis, J. R. (2004). What do we know about Audit Quality? The British Accounting Review 36
(4):345-368.
Francis, J., Reichelt, K. and Wang, D., (2009). The Pricing of National and City-Specific Reputations
for Industry Expertise in the U.S. Audit Market: The Accounting Review. (January): 113-
136.
Geiger,M.A. and Raghunandan, K. (2002). Auditor Tenure and Audit Reporting Failures, Auditing: A
Journal of Practice and Theory, 21 (10, 67-78.
Ghosh, A., Marra, A., & Moon, D. (2010). Corporate Boards, Audit Committees, and Earnings
Management, Pre- and post-SOX evidence: Journal of Business Finance & Accounting, 37,
1145-1176.
Healy, P.M. (1985). The Impact of Bonus Schemes on the Selection of Accounting Principles. Journal
of Accounting and Economics. Vol. 7, pp. 85-107.
Healy, P. M., and Wahlen, J. (1999). A Review of the Earnings Management Literature and Its
Implications for Standard Setting: Accounting Horizons, Vol. 13, No. 4: 365-383.
Holthansen, C. et al. (1995). Industry Specialization by Auditors. Auditing: A Journal of Practice &
Theory 18 (1):1-17.

89
Hope, C. and Langhi, R. (2007). Study on the Economic Impact of Auditors Liability Regimes.
London, UK: Report Prepared for the European Commission: Directorate General for
Internal Market and Services, 332.
Jensen, M. C., and William H., Meckling (1976). Theory of the Firm: Managerial Behavior, Agency
Costs and Ownership Structure: Journal of Financial Economics 3 (October): 305-60.
Knapp M.C (1991). Factor that Audit Committee Members use as Surrogates for Audit Quality.
Auditing - J. Prac. Theory, 10 (1): 35-52.
Masoyi, D.A., Musa, A.U. and Zachariah, P. (2015). Impact of Audit Quality on Earnings
Management of Listed Deposit Money Banks in Nigeria: Journal of Accounting and Financial
Management, Vol 1 No. 8
Mercia, K., et al. (2006). Long-term Trends in Audit Fees. Auditing: A Journal of Practice & Theory
20 (1):115-136.
Myers, J.N., Myers, L.A., and Omer, T.C. (2003). Exploring the Term of the Auditor---Client
Relationship and the Quality of Earnings: A Case for Mandatory Auditor Rotation: The
Accounting Review 78 (3), 779-799
Nzotta, S.M. (2004). Money, Banking and Finance: Theory and Practice. Hudson-Jude Nigeria
Publishers, Owerri.
Palmrose, Z.V. (1988). An Analysis of Auditor Litigation and Audit Service Quality. The Accounting
Review. Vol. 63, pp. 55-73.
Semiu, B.A., and Johnson, K.O. (2012). Non Audit Services and Auditor Independence Investors’
Perspective in Nigeria: Business and Management Review Vol. 2(5):89-97
Schipper, H. (1989). The Reputational Penalty for Aggressive Accounting: Earnings Restatements
and Management Turnover. The Accounting Review, 81 (1), 83-112.
Teoh, S. H. and Wong, T. J., (1998). Perceived Auditor Quality and the Earnings Response
Coefficient: The Accounting Review. Vol. 68, No. 2: 346-366.
Watts, R. L. and Zimmerman, J. L., (1986). Positive Accounting Theory. Englewood Cliffs, N.J.:
Prentice-Hall, Inc.
Wooten, T.C. (2003). Research About Audit Quality. The CPA Journal. Available
athttp://www.nysscpa.org/cpajournal/2003/0103/dept/d014803.htm
Wolinsky, A. (1983). Prices as Signals of Product Quality. Review of Economic Studies, 50, (4), 647-
658.

90
APPENDIX 1
___ ____ ____ ____ ____ (R) /__ / ____/ / ____/ ___/ / /___/ / /___/ 13.0 Copyright 1985-2013 StataCorp LP Statistics/Data Analysis StataCorp 4905 Lakeway Drive MP - Parallel Edition College Station, Texas 77845 USA 800-STATA-PC http://www.stata.com 979-696-4600 [email protected] 979-696-4601 (fax) 3-user 8-core Stata network perpetual license: Serial number: 501306208483 Licensed to: Halima Muhammad Baba Bayero University Kano Notes: 1. (/v# option or -set maxvar-) 5000 maximum variables . *(18 variables, 130 observations pasted into data editor) . summarize em af at ja lev Variable | Obs Mean Std. Dev. Min Max -------------+-------------------------------------------------------- em | 130 .1903231 .6737334 -4.9229 1.916 af | 130 8.105731 .4092844 7.30103 9.414973 at | 130 .9 .3011605 0 1 ja | 130 .2461538 .4324357 0 1 lev | 130 .0751495 .1527187 0 .973839 . correlate em af at ja lev (obs=130) | em af at ja lev -------------+--------------------------------------------- em | 1.0000 af | -0.0408 1.0000 at | 0.1538 -0.0065 1.0000 ja | -0.1334 -0.0238 0.0119 1.0000 lev | 0.1118 0.0796 -0.0283 -0.0728 1.0000 . regress em af at ja lev Source | SS df MS Number of obs = 130 -------------+------------------------------ F( 4, 125) = 1.85 Model | 3.277181 4 .819295251 Prob > F = 0.1229 Residual | 55.2780641 125 .442224513 R-squared = 0.0560 -------------+------------------------------ Adj R-squared = 0.0258 Total | 58.5552451 129 .453916629 Root MSE = .665 ------------------------------------------------------------------------------ em | Coef. Std. Err. t P>|t| [95% Conf. Interval] -------------+---------------------------------------------------------------- af | -.0849953 .143535 -0.59 0.555 -.3690689 .1990783 at | .353773 .1945032 1.82 0.071 -.0311729 .738719 ja | -.200102 .1357843 -1.47 0.143 -.4688359 .0686319 lev | .4896958 .3857235 1.27 0.207 -.2736989 1.253091 _cons | .5733317 1.178021 0.49 0.627 -1.758118 2.904781 ------------------------------------------------------------------------------

91
. vif Variable | VIF 1/VIF -------------+---------------------- lev | 1.01 0.987907 af | 1.01 0.993315 ja | 1.01 0.994286 at | 1.00 0.999087 -------------+---------------------- Mean VIF | 1.01 . xtset c year, yearly panel variable: c (strongly balanced) time variable: year, 2006 to 2015 delta: 1 year . . xtreg em af at ja lev, re Random-effects GLS regression Number of obs = 130 Group variable: c Number of groups = 13 R-sq: within = 0.0715 Obs per group: min = 10 between = 0.0121 avg = 10.0 overall = 0.0555 max = 10 Wald chi2(4) = 8.10 corr(u_i, X) = 0 (assumed) Prob > chi2 = 0.0879 ------------------------------------------------------------------------------ em | Coef. Std. Err. z P>|z| [95% Conf. Interval] -------------+---------------------------------------------------------------- af | -.1111125 .1427905 -0.78 0.436 -.3909768 .1687518 at | .3557364 .1902411 1.87 0.061 -.0171294 .7286021 ja | -.2368464 .1498367 -1.58 0.114 -.530521 .0568282 lev | .4957451 .397233 1.25 0.212 -.2828172 1.274307 _cons | .7918542 1.171875 0.68 0.499 -1.504979 3.088688 -------------+---------------------------------------------------------------- sigma_u | .17024029 sigma_e | .65301573 rho | .06363864 (fraction of variance due to u_i) ------------------------------------------------------------------------------ . estimate store re . xtreg em af at ja lev, fe Fixed-effects (within) regression Number of obs = 130 Group variable: c Number of groups = 13 R-sq: within = 0.0739 Obs per group: min = 10 between = 0.0093 avg = 10.0 overall = 0.0518 max = 10 F(4,113) = 2.26 corr(u_i, Xb) = -0.2380 Prob > F = 0.0675

92
------------------------------------------------------------------------------ em | Coef. Std. Err. t P>|t| [95% Conf. Interval] -------------+---------------------------------------------------------------- af | -.1554416 .1485304 -1.05 0.298 -.449707 .1388239 at | .3564895 .1927428 1.85 0.067 -.0253688 .7383478 ja | -.3558594 .1974394 -1.80 0.074 -.7470225 .0353038 lev | .5029919 .4397246 1.14 0.255 -.3681819 1.374166 _cons | 1.179247 1.217269 0.97 0.335 -1.232382 3.590876 -------------+---------------------------------------------------------------- sigma_u | .25452462 sigma_e | .65301573 rho | .13188346 (fraction of variance due to u_i) ------------------------------------------------------------------------------ F test that all u_i=0: F(12, 113) = 1.39 Prob > F = 0.1828 . estimate store fixed . estimate store re . hausman fixed re Note: the rank of the differenced variance matrix (0) does not equal the number of coefficients being tested (4); be sure this is what you expect, or there may be problems computing the test. Examine the output of your estimators for anything unexpected and possibly consider scaling your variables so that the coefficients are on a similar scale. ---- Coefficients ---- | (b) (B) (b-B) sqrt(diag(V_b-V_B)) | fixed re Difference S.E. -------------+---------------------------------------------------------------- af | -.1554416 -.1554416 0 0 at | .3564895 .3564895 0 0 ja | -.3558594 -.3558594 0 0 lev | .5029919 .5029919 0 0 ------------------------------------------------------------------------------ b = consistent under Ho and Ha; obtained from xtreg B = inconsistent under Ha, efficient under Ho; obtained from xtreg Test: Ho: difference in coefficients not systematic chi2(0) = (b-B)'[(V_b-V_B)^(-1)](b-B) = 0.00 Prob>chi2 = . (V_b-V_B is not positive definite)

93
Impact of Exchange Rate on Stock Prices of Listed Deposit
Money Banks in Nigeria
Kabir Ibrahim
Department of Social Sciences & Administration, Bayero University, Kano _____________________________________________________________________________
Abstract
The study examines the relationship between exchange rate and stock prices of deposit money banks in Nigeria. The study uses secondary data which are elicited from the web site of the central bank of Nigeria and a database on stock prices on listed banks in Nigeria. The study data is of daily bases from January 5th 2015 to September 30th 2016 at the time of conducting the research. The study employs Johansen co-integration test to see if the data are co-integrated or not and the findings show no co-integration within the variables use. It further uses VAR model since there is no co-integration and the result reveals that there is no significant relationship between exchange rate and stock prices. While the stock price in the other hand has no significant impact on exchange rate of deposit money banks in Nigeria. The study concludes that policy makers should consider stock prices, inflation, interest rate, prime lending rate and currency in circulation as they jointly affect the exchange rate in Nigeria. Key words:
Exchange rate, Stock Price, Granger causality 1. INTRODUCTION
For the past decade, Nigeria has been leading in the whole of African economy. Being the hub and heart of the African continent in terms of viable economy, politics and security. With the current trend of economic backwardness which is affecting the Nigerian economy from the beginning of 2016, being term as recession. Company performance, dividends, stock prices of other countries, gross domestic product, exchange rates, interest rates, current account, money supply, employment, have an impact on daily stock prices (Kurihara, 2006). Especially, the continuing increases in the world trade and capital movements have made the exchange rates to be one of the main determinants of business profitability and equity prices (Kim, 2003).
The relationship between the stock prices and foreign exchange rate cannot be over emphasized. They both play important roles in influencing the development of a country’s economy. In the recent years, because of increasing international diversification, cross-market return correlations, gradual abolishment of capital inflow barriers and foreign exchange restrictions or the adoption of more flexible exchange rate arrangements in emerging and transition countries, markets have become interdependent. Especially, an economy that heavily relies on importation and a mono economy which depends heavily on crude for income.
Although, economic theory suggests that foreign exchange changes can have an important impact on the stock price by affecting cash flow, investment and profitability of firms, there is no compromise about these relationship and the empirical studies of the relationship are inconclusive (Joseph, 2002; Vygodina, 2006). However, the linkages between these financial variables can be established through the instruments of wealth, demand for money, interest rates etc. (Mishra, 2004). The relationship can be well understood if one goes through the existing theory that is the traditional approach which explains that, exchange rates direct stock prices. While on the other hand, portfolio balance approach states that exchange rates are directed by market mechanism. However, changes in stock prices might have impact on exchange rate movements. This approach states that stock price is expected to front exchange rate with a negative correlation since a decrease in stock prices reduces domestic wealth, which leads to lower domestic money demand and interest rates. As such, the decrease in domestic stock prices leads foreign investors to lower

94
demand for domestic assets and domestic currency. Finally the shifts in demand and supply of currencies cause capital outflows and the depreciation of domestic currency.
Furthermore, when stock prices rise, foreign investors become willing to invest in a country’s share securities. Invariably, they will get benefit from international diversification. As such, this will make capital inflows and currency to appreciate (Granger, Huang, & Yang, 2000; Caporale, & Pittis, 2002; Stavárek, 2005; Pan, Fok, & Liu, 2007). Exchange rate changes affect the competitiveness of firms through their impact on input and output price (Joseph, 2002).When the Exchange rate appreciates, since exporters will lose their competitiveness in international market, the sales and profits of exporters will shrink and the stock prices will decline. On the other hand, importers will increase their competitiveness in domestic markets. Therefore, their profit and stock prices will increase. The decline of exchange rate will make unfavorable effects on exporters and importers. Exporters will have advantage against other countries’ exporters and increase their sales and their stock prices will be higher (Yau and Nieh, 2006).That is, currency appreciation has both a negative and a positive effect on the domestic stock market for an export dominant and an import dominated country, respectively (Ma and Kao, 1990). Domestic firms can also be influenced by changes in exchange rates since they may import a part of their inputs and export their outputs. Thus, devaluation will make positive effect for export firms (Aggarwal, 1981) and increase the income of these firms, consequently, boosting the average level of stock prices (Wu, 2000).
The main objective of this paper is to examine the relationship between exchange rate and stock prices of Money deposit banks in Nigeria. This paper is divided into five sections, the introduction, literature, methodology, discussion of result and conclusion.
2. LITERATURE REVIEW
In the review of related literature, the study looks at the work of Fredrick, Muasya, and Kipyego (2014) examined the interaction between stock prices and exchange rates in Kenya from January 1st 2012 to December 31st 2013. Applying OLS regression to run the analysis, the findings had implications for investors, investment managers, regulators, listed companies, financial institutions and other market players. The economic theory points to the relationship between stock price and exchange rates but does not properly define the direction of the relationship. The study uses the Pearson product moment correlation coefficient method to determine the degree of correlation between stock prices and exchange rates. The results indicate that there is a positive relationship between exchange rates and share prices.
Haji and Jianguo (2014) investigated the relationship between the Dar es Salaam Stock Exchange All Shares Index, Exchange rate and Market capitalization using monthly data from July 2009 to December 2013 obtain from quarterly Updates and website of Dar es Salaam Stock Exchange. They used regression and correlation technique to establish the relationship. Using the Dar es Salaam Stock Exchange shares index as dependent variable while Exchange rate and Market capitalization, as independent variables for the regression. Their results showed that the Exchange rate and the Dar es Salaam Stock Exchange All Shares Index had positive regression coefficient, Market capitalization and Dar es Salaam Stock Exchange All Shares Index also had positive regression coefficient. However, the three variables were found to have positive correlation coefficients. As such they suggested that there was strong positive linear relationship between Market capitalization and Dar es Salaam Stock Exchange All Shares Index, and moderate positive relationship between Exchange rate and the Dar es Salaam Stock Exchange All Shares Index.
Mgammal (2012) investigated whether stock prices and exchange rates were related to each other or not. Both the short term and the long term association between these variables were discovered. The study applied monthly and quarterly data on two gulf countries which includes Kingdom Saudi Arabia (KSA) and United Arab Emirate (UAE) for the period January 2008 to December 2009. The results found that the short term exchange rate influence positively on the stock market price index for United Arab Emirate and there was no association between them for Kingdom Saudi Arabia. Moreover the study in the long term found that the exchange rate influenced negatively on stock

95
market price index for the United Arab Emirate, while no association between these variables in Kingdom Saudi Arabia. The study used OLS regression to see the relationship between the dependent and independent variable which was often used mostly for high frequency data. Kisaka and Mwasaru (2012) examined the causal relationship between foreign exchange rates and stock prices in Kenya from November 1993 to May 1999. The data set consist of monthly observations of the NSE stock price index and the nominal Kenya shillings per US dollar exchange rates. They aimed to establish the causal linkages between leading prices in the foreign exchange market and the Nairobi Securities Exchange (NSE). The results showed that foreign exchange rates and stock prices were non-stationary both in first differences and level forms, and the two variables were integrated of order one, in Kenya. Furthermore, they tested for co-integration between exchange rates and stock prices. The results showed that the two variables were co-integrated. Lastly, they employed error-correction models instead of the classical Granger-causality tests since the two variables were co-integrated. The empirical results indicated that exchange rates Granger-causes stock prices in Kenya.
Kutty (2010) examined the relationship between stock prices and exchange rates in Mexico. The Granger causality test showed that stock prices lead exchange rates in the short run, and there was no long run relationship between these two variables. The finding corroborates the results of Bahmani and Sohrabian’s (1992) conclusion where no long term relationship between stock prices and exchanges rates in the U.S.A. However, they reported a short term relationship between these two variables using Granger causality tests, but contradict the findings of other studies which reported a long term relationship between exchange rates and stock. Jorion (1990) pointed out that exchange rates were four times as volatile as interest rates and ten times as volatile as inflation rates. For the investor, changes in exchange rate poses a foreign exchange risk. High fluctuations in exchange rates can lead to big losses in an investor’s portfolio of investments due to uncertainty of return on investments. This was due to the fact that movements in foreign exchange rates affect the prices of goods on the international markets and this in turn affects the profit margin of exporting and importing companies. Exchange rates can affect stock prices not only for multinational and export oriented firms but also for domestic firms. For a multinational company, changes in exchange rates will result in both an immediate change in value of its foreign operations and a continuing change in the profitability of its foreign operations reflected in successive income statements. Therefore, the changes in economic value of firm’s foreign operations may influence stock prices.
From the forgoing review, one cannot precisely argue that the results from one economy to another economy will be same if employed here in Nigeria. Notwithstanding, the methodology adopt by the authors differ as some used Ordinary Least Square, Vector Error Correction Model, Posterior Predictive Model Checking method in identifying the correlation between variables.
3. RESEARCH METHODOLOGY
To examine the relationship between exchange rate and stock prices, a population of 15 listed Deposit Money Banks in the Nigerian stock exchange was used. The study covers the period from 2015 to 2016. The study used all banks listed in the Nigerian stock exchange. These banks include Access bank, Diamond bank, Eco bank, FCMB, Fidelity bank, First bank, Guaranty trust bank, Sterling bank, United bank for African, Union bank, Unity bank, Wema bank, Stanbic IBTC bank, Skye bank and Zenith bank. Exchange rate, interest rate, prime lending rate, currency in circulation, and inflation rate information were obtained from the Central Bank of Nigeria database while stock price variables were obtained from the capital asset database of sampled bank. As such, this makes the study to use purely secondary data for its analysis. Models Specification
Due to the nature of data used for this study, econometrics time series analysis was used which includes; testing for unit root of data, co-integration, and finally the regression.

96
Unit Root Test
The study used the Augmented Dickey Fuller Test ADF (1981) to test for unit roots. According to the general specification, the ADF test is based on the following formulation:
ΔSpt = α0 + (1 - λ1) spt-1 + y1t + ∑pi=1α1 Δspt-1 + ε1t ………………………………. (1)
ΔExrt = β0 + (1 - λ2) Exrt-1 + y2t + ∑pi=1β1 ΔExrt-1 + ε2t ………………….(2)
For the purpose of this study, SP is define to be the stock price index and EX to be the exchange rate.
Co-integration
Co-integration is a technique used in studying the existence of an equilibrium relationship between two variables. Two or more time series may be individually non- stationary, but some linear combination of the variables under consideration, share prices and exchange rates may have time invariant properties and hence may be co- integrated. According to Banerjee et al (1994) a series is said to be integrated if it accumulates past effects; such a series is non-stationary because its future path depends upon all such past influences, and is not tied to some mean to which it must eventually return. Following Engle and Granger (1987), the study ran the following regression: Spt = α0 + α1Ext + α2Iflt + n1t……………………. (3) Ext = β0 + β3Spt + β2Iflt + n2t…………………….. (4) The Vector Autoregressive model and causality tests In order to study the relationship between the three variables in this study, and also to examine whether changes in the stock prices cause exchange rates to change and vice versa. The study used VAR model to test the linear causality between stock prices and exchange rates. Equations 5 and 6 can be used if there is no co- integration between stock prices, exchange rates and inflation rate.
ΔSpt = β0 + ∑pi=1β1iΔSpt-1∑p
i=1β21ΔExt-1 + ∑pi=1β31ΔInft-1 + ∑p
i=1β41ΔIntt-1 + ∑pi=1β51ΔPlrt-1+
∑pi=1β61ΔCct-1 + εst ……………………………………………………. (5)
ΔExt = α0 + ∑p
i=1 α1iΔSpt-1∑pi=1 α21ΔExt-1 + ∑p
i=1 α31ΔIflt-1 + ∑pi=1α41ΔIntt-1 + ∑p
i=1α51ΔPlrt-1 + ∑pi=1
α61ΔCct-1 + εet……………..………………………….. (6) Where, ∆ is the First difference operator; ∆Spt = Spt - Spt-1; ∆Ext = Ext - Ext-1; β, and α are the constant term; εst ,εet and εft are white noise error terms. If the stock prices and exchange rates are co-integrated, then the vector auto regressive model would include an error correction term. 4. DISCUSSION OF RESULTS
Table 1: Descriptive Statistics
Variables Days Mean StdDev Min Max
Sp 430 7.1797 1.5124 4.95 10.43
Exr 430 5.2736 0.2040 5.12 5.78
Inf 430 11.4645 3.3679 8.20 17.85
Int 430 12.5661 0.9546 11.00 14.00
Plr 430 16.8336 0.3687 15.95 17.30
Cc 430 14.3366 0.0520 14.25 14.43 Source: Developed by the Author using stata
Table 1 shows the descriptive statistics of the variables used in this study. It shows that the stock price has a mean value of 7.1797 and a standard deviation of 1.5124 which implies that the dispersion of stock prices is not large as its minimum value is 4.95 and a maximum value is 10.43. Exchange rate has a mean value of 5.2736 and a standard deviation of 0.2040 with minimum and maximum values of 5.12 and 5.78. Inflation rate has minimum and maximum values of 8.2 and 17.85 and mean and standard deviation of 11.4645 and 3.3679 respectively. Interest rate has a mean value of 12.5661 and a standard deviation of 0.9546 which implies that the dispersion is a bit
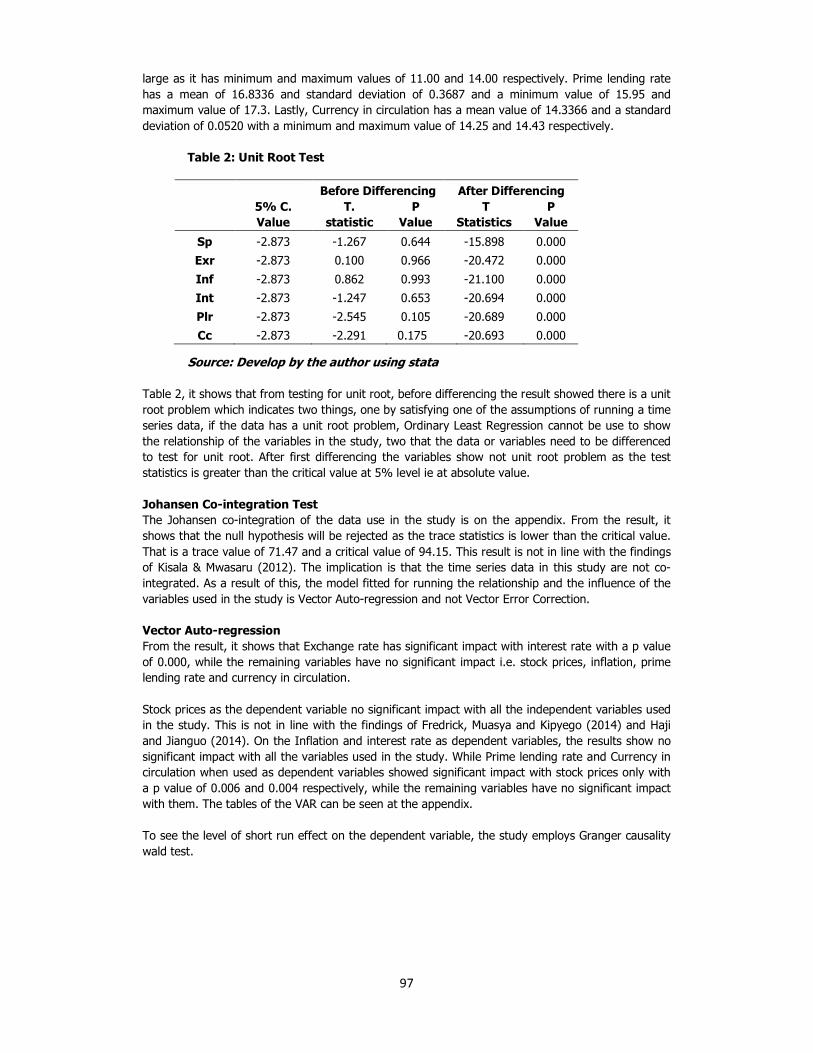
97
large as it has minimum and maximum values of 11.00 and 14.00 respectively. Prime lending rate has a mean of 16.8336 and standard deviation of 0.3687 and a minimum value of 15.95 and maximum value of 17.3. Lastly, Currency in circulation has a mean value of 14.3366 and a standard deviation of 0.0520 with a minimum and maximum value of 14.25 and 14.43 respectively.
Table 2: Unit Root Test
Source: Develop by the author using stata
Table 2, it shows that from testing for unit root, before differencing the result showed there is a unit root problem which indicates two things, one by satisfying one of the assumptions of running a time series data, if the data has a unit root problem, Ordinary Least Regression cannot be use to show the relationship of the variables in the study, two that the data or variables need to be differenced to test for unit root. After first differencing the variables show not unit root problem as the test statistics is greater than the critical value at 5% level ie at absolute value.
Johansen Co-integration Test
The Johansen co-integration of the data use in the study is on the appendix. From the result, it shows that the null hypothesis will be rejected as the trace statistics is lower than the critical value. That is a trace value of 71.47 and a critical value of 94.15. This result is not in line with the findings of Kisala & Mwasaru (2012). The implication is that the time series data in this study are not co-integrated. As a result of this, the model fitted for running the relationship and the influence of the variables used in the study is Vector Auto-regression and not Vector Error Correction.
Vector Auto-regression
From the result, it shows that Exchange rate has significant impact with interest rate with a p value of 0.000, while the remaining variables have no significant impact i.e. stock prices, inflation, prime lending rate and currency in circulation. Stock prices as the dependent variable no significant impact with all the independent variables used in the study. This is not in line with the findings of Fredrick, Muasya and Kipyego (2014) and Haji and Jianguo (2014). On the Inflation and interest rate as dependent variables, the results show no significant impact with all the variables used in the study. While Prime lending rate and Currency in circulation when used as dependent variables showed significant impact with stock prices only with a p value of 0.006 and 0.004 respectively, while the remaining variables have no significant impact with them. The tables of the VAR can be seen at the appendix. To see the level of short run effect on the dependent variable, the study employs Granger causality wald test.
Before Differencing After Differencing
5% C.
Value
T.
statistic
P
Value
T
Statistics
P
Value
Sp -2.873 -1.267 0.644 -15.898 0.000
Exr -2.873 0.100 0.966 -20.472 0.000
Inf -2.873 0.862 0.993 -21.100 0.000
Int -2.873 -1.247 0.653 -20.694 0.000
Plr -2.873 -2.545 0.105 -20.689 0.000
Cc -2.873 -2.291 0.175 -20.693 0.000

98
Table 3: Granger causality wald test
Variables Sp Exr Inf Int Plr Cc Overall
Sp - 1.726 0.051 0.110 4.962 4.501 12.402
Exr 0.657 - 1.759 35.369* 1.562 0.854 38.653*
Inf 0.947 0.147 - 0.003 0.021 0.057 1.118
Int 1.306 0.008 0.011 - 0.016 0.024 1.310
Plr 7.767* 0.029 0.001 0.001 - 0.051 7.767
Cc 8.649* 0.081 0.007 0.001 0.118 - 8.656 * significant at 5%
Source: Develop by the author using stata
Table 3 gives a combined effect of all the lags as a whole to see the impact of each value on another and the overall result. From the table, it can be seen that stock price has no significant impact with all variables used and as such the overall result shows no significant impact with stock prices in the short run which is not in line with work Kutty (2012) and Mgammal (2012). Exchange rate has significant impact on inflation and interest rate having a p value of 0.001 and 0.000 which are less than 5% while prime lending rate and currency I circulation have no significant impact with exchange rate which have p values of 0.291 and 0.493greater than 5%. Looking at the overall results, it shows that exchange rate has significant impact on all variables in the study. Furthermore, granger causality tests taking inflation as the dependent variable in the study. The result shows that stock prices, exchange rate, interest rate, prime lending rate and currency in circulation have no significant impact on inflation rate as they have p values of 0.354, 0.921,0.787, 0.452, 0.933and an overall total of 0.579. Interest rate also shows no significant relationship with all of the variables use in the study. Prime lending rate has significant impact on stock prices and Currency in circulation with p values 0.011 and 0.041 while exchange rate, inflation and interest rate have no significant relationship. The overall result of the study variables has 0.054 as a p value in relation to Prime lending rate. Lastly, Currency in circulation has significant impact with only stock prices with a p value of 0.004 while the remaining variables have no significant impact with currency in circulation.
5. CONCLUSION
The empirical evidence in this paper shows that there is short run relationship between stock prices and exchange rates in the vector auto-regression at the second lag. The Granger causality test reveals that exchange rate lead inflation rate in the short run, and there is a significant relation with all the variables used in the study. The implication of this study is that policy makers on Nigerian economy should be wary in implementing or taking exchange rate policy on stock market regulation/or policies since it has short term implication on the stock prices, inflation and interest rates, prime lending rate and currency in circulation. This paper also reveals that, since banking industry then to be the second largest sector in the Nigerian economy, the issues of interest rate on loan and savings need to be really studied as it has a reaction effect on the exchange rate in the short run. The interest rate has to be closely monitored. Another implication of this study is that foreign direct investment will be increased if inflation is at higher rate but will not encourage citizens to invest but with the FDI, there is the possibility of having employment, many investments but at a very low cost.

99
REFERENCES
Aggarwal, R. (1981). Exchange Rates and Stock Prices: A Study of the US Capital Markets under Floating Exchange Rates. 12 , 7-12.
Bahmani, O. M., & Sohrabian, A. (1992). Stock Prices and the Effective Exchange Rate of the Dollar.
Applied Economics Journal, 24 , 459–464 Banerjee, A., Dolado, J. J, Galbraith, J. W. and Hendry, D. F. (1993) Co-Integration, Error
Correction, and the Econometric Analysis of Non-Stationary Data, (Oxford University Press, Oxford), 136-137.
Caporale, G. M., & Pittis, N. (1997). Causality and forecasting in incomplete systems. Journal of
Forecasting, 16 , 425-437. Fredrick S. O., Muasya, R. & Kipyego, K. T. (2014). Effect of Foreign Exchange Rates on Price per
Share, Journal of Business Administration and Education 6(2), 34-56 Granger, C. W., Huang, B., & Yang, C. (2000). A Bivariate Causality between Stock Prices and
Exchange Rates: Evidence from Recent Asian Flu. Quarterly Review of Economics and Finance, 40 , 337-35
Haji, I. S. & Jianguo, W. (2014). The Relationship of the Stock Market Prices on Exchange Rate and
Market Capitalisation: the Case Dar es Salaam Stock Exchange in Tanzania. Research Journal of Finance and Accounting 5(10)
Jorion, P. (1990). The Exchange rate exposure of U.S. multinational. Journal of Business, 63(3),
331-345. Joseph, M. (2002). Modelling the impacts of interest rate and exchange rate changes on UK Stock
Returns. Derivatives Use, Trading & Regulation, 7 (4), 306-323. Kim, K. (2003). Dollar Exchange Rate and Stock Price: Evidence from Multivariate Cointegration and
Error. Review of Financial Economics, 12 , 301-313. Kisaka, S. E. & Mwasaru, A. (2012). The Causal relationship between Exchange rate and Stock
prices in Kenya. Research Journal of Finance and Accounting 3(7) Kurihara, Y. (2006). The Relationship between Exchange Rate and Stock Prices during the
Quantitative Easing policy in Japan. International Journal of Business, 11 (4), 375-386. Kutty, G. (2010). The Relationship Between Exchange Rates and Stock Prices: The Case Of Mexico,
North American Journal of Finance and Banking Research 4(4) Ma, C. K., & Kao, G. W. (1990). On Exchange Rate Changes and Stock Price Reactions. Journal of
Business Finance and Accounting, 17 (2), 441-449. Mishra, A. K., Swain, N., & Malhotra, D. (2007). Volatility Spillover between tock and Foreign
Exchange. International Journal of Business, 12 (3), 343-359. Mgammal, M. H. H. (2012) The Effect of Inflation, Interest Rates and Exchange Rates on Stock
Prices Comparative Study Among Two Gcc Countries, International Journal of Finance and Accounting, 1(6)
Pan, M. S., Fok, R. C., & Liu, Y. A. (2007). Dynamic Linkages between exchange rates and stock
prices: International Review of Economics and Finance,16 , 503-520. Stavárek, D. (2005). Stock Prices and Exchange Rates in the EU and the USA: Evidence of their
Mutual. Finance aúvûr – Czech. Journal of Economics and Finance, 55 , 141-161. Vygodina, A. V. (2006). Effects of size and international exposure of the US firms on the relationship
between. Global Finance Journal,17 , 214-223.
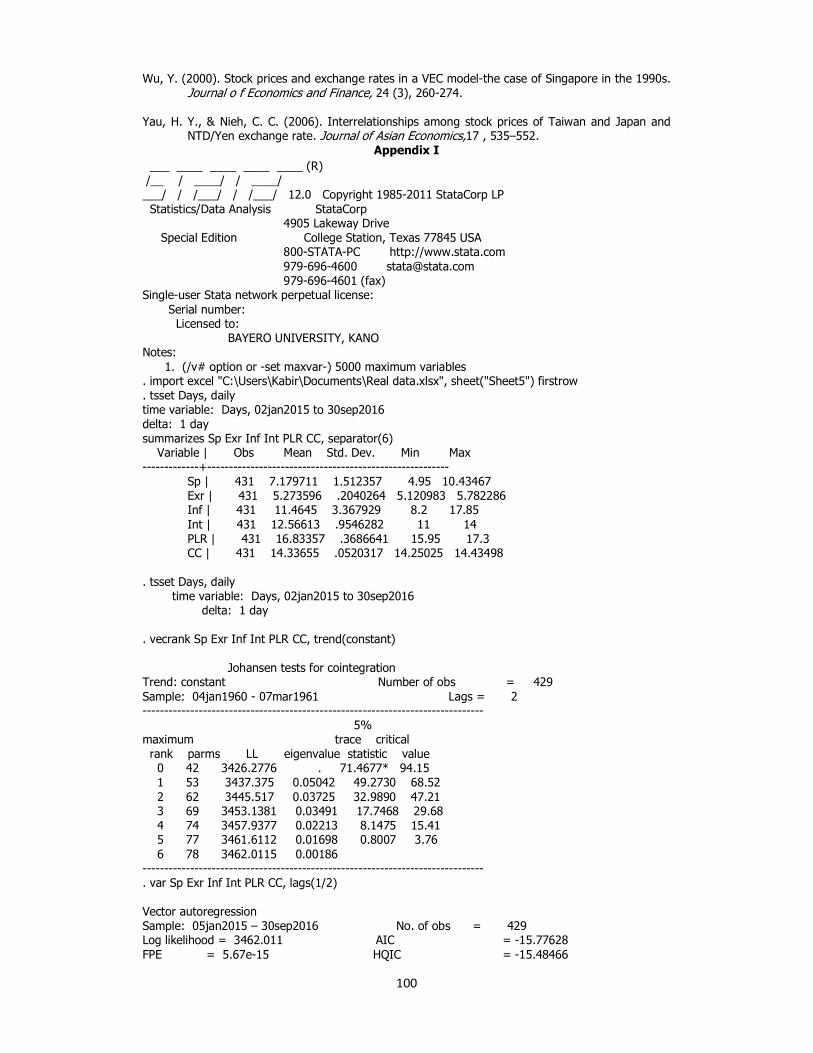
100
Wu, Y. (2000). Stock prices and exchange rates in a VEC model-the case of Singapore in the 1990s. Journal o f Economics and Finance, 24 (3), 260-274.
Yau, H. Y., & Nieh, C. C. (2006). Interrelationships among stock prices of Taiwan and Japan and
NTD/Yen exchange rate. Journal of Asian Economics,17 , 535–552. Appendix I
___ ____ ____ ____ ____ (R) /__ / ____/ / ____/ ___/ / /___/ / /___/ 12.0 Copyright 1985-2011 StataCorp LP Statistics/Data Analysis StataCorp 4905 Lakeway Drive Special Edition College Station, Texas 77845 USA 800-STATA-PC http://www.stata.com 979-696-4600 [email protected] 979-696-4601 (fax) Single-user Stata network perpetual license: Serial number: Licensed to: BAYERO UNIVERSITY, KANO Notes: 1. (/v# option or -set maxvar-) 5000 maximum variables . import excel "C:\Users\Kabir\Documents\Real data.xlsx", sheet("Sheet5") firstrow . tsset Days, daily time variable: Days, 02jan2015 to 30sep2016 delta: 1 day summarizes Sp Exr Inf Int PLR CC, separator(6) Variable | Obs Mean Std. Dev. Min Max -------------+--------------------------------------------------------
Sp | 431 7.179711 1.512357 4.95 10.43467 Exr | 431 5.273596 .2040264 5.120983 5.782286 Inf | 431 11.4645 3.367929 8.2 17.85 Int | 431 12.56613 .9546282 11 14 PLR | 431 16.83357 .3686641 15.95 17.3 CC | 431 14.33655 .0520317 14.25025 14.43498
. tsset Days, daily time variable: Days, 02jan2015 to 30sep2016 delta: 1 day . vecrank Sp Exr Inf Int PLR CC, trend(constant) Johansen tests for cointegration Trend: constant Number of obs = 429 Sample: 04jan1960 - 07mar1961 Lags = 2 ------------------------------------------------------------------------------- 5% maximum trace critical rank parms LL eigenvalue statistic value 0 42 3426.2776 . 71.4677* 94.15 1 53 3437.375 0.05042 49.2730 68.52 2 62 3445.517 0.03725 32.9890 47.21 3 69 3453.1381 0.03491 17.7468 29.68 4 74 3457.9377 0.02213 8.1475 15.41 5 77 3461.6112 0.01698 0.8007 3.76 6 78 3462.0115 0.00186 ------------------------------------------------------------------------------- . var Sp Exr Inf Int PLR CC, lags(1/2) Vector autoregression Sample: 05jan2015 – 30sep2016 No. of obs = 429 Log likelihood = 3462.011 AIC = -15.77628 FPE = 5.67e-15 HQIC = -15.48466

101
Det(Sigma_ml) = 3.94e-15 SBIC = -15.03783 Equation Parms RMSE R-sq chi2 P>chi2 ---------------------------------------------------------------- Sp 13 .153403 0.9900 42447.74 0.0000 Exr 13 .018488 0.9920 53432.27 0.0000 Inf 13 .160747 0.9978 193374.1 0.0000 Int 13 .145353 0.9775 18679.82 0.0000 PLR 13 .090582 0.9416 6916.155 0.0000 CC 13 .012073 0.9479 7804.541 0.0000 ------------------------------------------------------------------------------ | Coef. Std. Err. z P>|z| [95% Conf. Interval] -------------+---------------------------------------------------------------- Sp | Sp | L1. | 1.229869 .0469367 26.20 0.000 1.137874 1.321863 L2. | -.2527312 .0468913 -5.39 0.000 -.3446365 -.1608258 | Exr | L1. | .5741961 .3848371 1.49 0.136 -.1800707 1.328463 L2. | -.6787974 .384728 -1.76 0.078 -1.43285 .0752557 | Inf | L1. | -.0070913 .0475513 -0.15 0.881 -.10029 .0861075 L2. | .0048978 .0477923 0.10 0.918 -.0887734 .0985689 | Int | L1. | .0236689 .0530532 0.45 0.655 -.0803134 .1276512 L2. | .0061432 .0530621 0.12 0.908 -.0978567 .110143 | PLR | L1. | -.1107615 .0823853 -1.34 0.179 -.2722338 .0507108 L2. | .0839991 .0824435 1.02 0.308 -.0775872 .2455854 | CC | L1. | -.9109313 .6097931 -1.49 0.135 -2.106104 .2842412 L2. | 1.125089 .6119187 1.84 0.066 -.07425 2.324427 | _cons | -2.258396 2.737293 -0.83 0.409 -7.62339 3.106599 -------------+---------------------------------------------------------------- Exr | Sp | L1. | .0047185 .0056569 0.83 0.404 -.0063687 .0158058 L2. | -.0030182 .0056514 -0.53 0.593 -.0140947 .0080584 | Exr | L1. | .9804255 .046381 21.14 0.000 .8895205 1.07133 L2. | -.0016912 .0463678 -0.04 0.971 -.0925705 .089188 | Inf | L1. | .0075879 .0057309 1.32 0.185 -.0036445 .0188203 L2. | -.0053215 .00576 -0.92 0.356 -.0166108 .0059679 | Int | L1. | -.0394005 .006394 -6.16 0.000 -.0519325 -.0268684 L2. | .0367199 .0063951 5.74 0.000 .0241857 .0492541 | PLR | L1. | .011528 .0099292 1.16 0.246 -.0079328 .0309888 L2. | -.0076858 .0099362 -0.77 0.439 -.0271603 .0117888 | CC | L1. | .0699038 .0734929 0.95 0.342 -.0741396 .2139473

102
L2. | -.0825153 .0737491 -1.12 0.263 -.2270609 .0620302 | _cons | .22512 .3299013 0.68 0.495 -.4214747 .8717148 -------------+---------------------------------------------------------------- Inf | Sp | L1. | .0349977 .0491839 0.71 0.477 -.061401 .1313964 L2. | -.0457879 .0491364 -0.93 0.351 -.1420934 .0505176 | Exr | L1. | -.0755391 .403262 -0.19 0.851 -.8659182 .71484 L2. | .1049182 .4031478 0.26 0.795 -.685237 .8950734 Inf | L1. | .9607698 .0498279 19.28 0.000 .8631089 1.058431 L2. | .0382013 .0500805 0.76 0.446 -.0599546 .1363572 | Int | L1. | -.0006459 .0555932 -0.01 0.991 -.1096066 .1083149 L2. | -.0080557 .0556026 -0.14 0.885 -.1170348 .1009234 | PLR | L1. | -.0094335 .0863297 -0.11 0.913 -.1786367 .1597697 L2. | -.0248189 .0863907 -0.29 0.774 -.1941416 .1445037 | CC | L1. | -.1584165 .6389884 -0.25 0.804 -1.410811 1.093978 L2. | .0996335 .6412157 0.16 0.877 -1.157126 1.356393 | _cons | 1.486721 2.868347 0.52 0.604 -4.135136 7.108577 -------------+---------------------------------------------------------------- Int | Sp | L1. | -.0065131 .0444737 -0.15 0.884 -.0936801 .0806538 L2. | .0219314 .0444307 0.49 0.622 -.0651512 .109014 | Exr | L1. | -.090695 .3646429 -0.25 0.804 -.805382 .6239919 L2. | .190244 .3645396 0.52 0.602 -.5242405 .9047285 | Inf | L1. | -.0041694 .045056 -0.09 0.926 -.0924776 .0841388 L2. | .0078943 .0452844 0.17 0.862 -.0808615 .0966501 | Int | L1. | .978439 .0502692 19.46 0.000 .8799131 1.076965 L2. | -.0067043 .0502777 -0.13 0.894 -.1052468 .0918382 | PLR | L1. | -.0093853 .0780622 -0.12 0.904 -.1623844 .1436138 L2. | .0198968 .0781173 0.25 0.799 -.1332103 .1730039 | CC | L1. | -.0228194 .5777945 -0.04 0.968 -1.155276 1.109637 L2. | .0100178 .5798085 0.02 0.986 -1.126386 1.146422 | _cons | -.3139816 2.593654 -0.12 0.904 -5.397451 4.769487 -------------+---------------------------------------------------------------- PLR | Sp | L1. | -.0794371 .0277154 -2.87 0.004 -.1337583 -.0251159 L2. | .0828262 .0276886 2.99 0.003 .0285575 .1370948 | Exr |

103
L1. | -.0500853 .2272403 -0.22 0.826 -.4954682 .3952975 L2. | .0953751 .2271759 0.42 0.675 -.3498815 .5406318 | Inf | L1. | -.0016439 .0280783 -0.06 0.953 -.0566763 .0533885 L2. | .0031906 .0282206 0.11 0.910 -.0521208 .058502 | Int | L1. | -.0013874 .0313271 -0.04 0.965 -.0627874 .0600125 L2. | -.0038523 .0313324 -0.12 0.902 -.0652626 .057558 | PLR | L1. | .9418185 .0486473 19.36 0.000 .8464716 1.037165 L2. | .0111774 .0486816 0.23 0.818 -.0842368 .1065916 | CC | L1. | .0088105 .3600734 0.02 0.980 -.6969204 .7145413 L2. | -.2765614 .3613285 -0.77 0.444 -.9847523 .4316294 | _cons | 4.414937 1.616329 2.73 0.006 1.246991 7.582883 -------------+---------------------------------------------------------------- CC | Sp | L1. | .0108114 .0036941 2.93 0.003 .0035711 .0180516 L2. | -.0117329 .0036905 -3.18 0.001 -.0189661 -.0044997 | Exr | L1. | .0055056 .0302879 0.18 0.856 -.0538576 .0648687 L2. | .0050297 .0302793 0.17 0.868 -.0543167 .0643761 | Inf | L1. | -.0005267 .0037424 -0.14 0.888 -.0078617 .0068083 L2. | -.000016 .0037614 -0.00 0.997 -.0073883 .0073562 | Int | L1. | -.0001648 .0041755 -0.04 0.969 -.0083485 .008019 L2. | -.0001817 .0041762 -0.04 0.965 -.0083668 .0080034 | PLR | L1. | .0021229 .006484 0.33 0.743 -.0105854 .0148313 L2. | -.0029687 .0064886 -0.46 0.647 -.0156861 .0097486 | CC | L1. | .9640026 .0479927 20.09 0.000 .8699388 1.058067 L2. | -.009285 .0481599 -0.19 0.847 -.1036768 .0851068 | _cons | .6253157 .2154336 2.90 0.004 .2030735 1.047558 ------------------------------------------------------------------------------ . vargranger
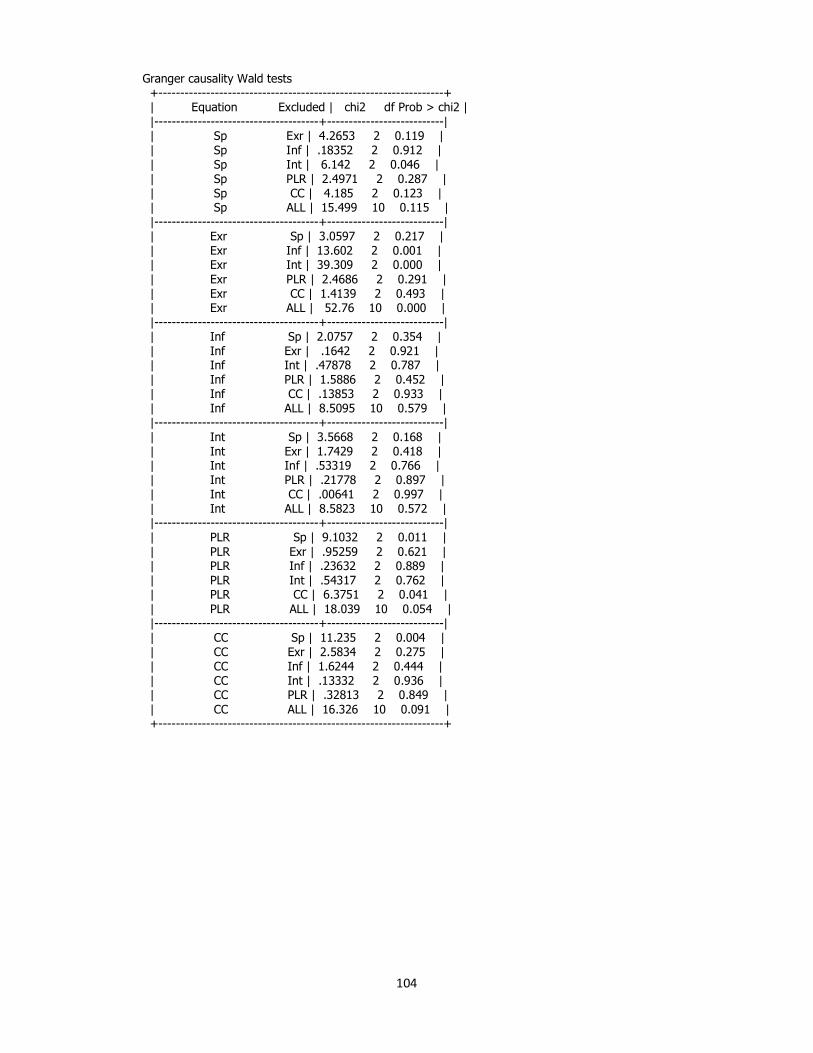
104
Granger causality Wald tests +------------------------------------------------------------------+ | Equation Excluded | chi2 df Prob > chi2 | |--------------------------------------+---------------------------| | Sp Exr | 4.2653 2 0.119 | | Sp Inf | .18352 2 0.912 | | Sp Int | 6.142 2 0.046 | | Sp PLR | 2.4971 2 0.287 | | Sp CC | 4.185 2 0.123 | | Sp ALL | 15.499 10 0.115 | |--------------------------------------+---------------------------| | Exr Sp | 3.0597 2 0.217 | | Exr Inf | 13.602 2 0.001 | | Exr Int | 39.309 2 0.000 | | Exr PLR | 2.4686 2 0.291 | | Exr CC | 1.4139 2 0.493 | | Exr ALL | 52.76 10 0.000 | |--------------------------------------+---------------------------| | Inf Sp | 2.0757 2 0.354 | | Inf Exr | .1642 2 0.921 | | Inf Int | .47878 2 0.787 | | Inf PLR | 1.5886 2 0.452 | | Inf CC | .13853 2 0.933 | | Inf ALL | 8.5095 10 0.579 | |--------------------------------------+---------------------------| | Int Sp | 3.5668 2 0.168 | | Int Exr | 1.7429 2 0.418 | | Int Inf | .53319 2 0.766 | | Int PLR | .21778 2 0.897 | | Int CC | .00641 2 0.997 | | Int ALL | 8.5823 10 0.572 | |--------------------------------------+---------------------------| | PLR Sp | 9.1032 2 0.011 | | PLR Exr | .95259 2 0.621 | | PLR Inf | .23632 2 0.889 | | PLR Int | .54317 2 0.762 | | PLR CC | 6.3751 2 0.041 | | PLR ALL | 18.039 10 0.054 | |--------------------------------------+---------------------------| | CC Sp | 11.235 2 0.004 | | CC Exr | 2.5834 2 0.275 | | CC Inf | 1.6244 2 0.444 | | CC Int | .13332 2 0.936 | | CC PLR | .32813 2 0.849 | | CC ALL | 16.326 10 0.091 | +------------------------------------------------------------------+

105
Assessing the Impact of Tax Reforms on Revenue Generation in Nigeria
Friday Osaru Ovenseri-Ogbomo (Ph.D)
And
Abraham Orobosa Ihensekhien (Ph.D)
Department of Economics, Banking & Finance, Benson Idahosa University __________________________________________________________________
Abstract
The Nigerian economy is predominantly an oil-driven economy. As a result, less attention has been given to other sources of income via the instrumentality of taxes and its attendant reforms. The principal objective of this paper is to empirically and comprehensively appraise the impact of tax reforms on revenue generation in the Nigerian economy. The study will rely on annual data sets from 1980 to 2016. Vector Autoregression (VAR) and Error Correction Mechanism (ECM) techniques will be applied as econometric tools. Augmented Dickey Fuller test will also be carried out to ascertain the stationarity of the data set. Partial Stock Adjustment Model (PSAM) will be used to gauge whether the different income taxes are statistically significant and if there is a positive relationship with income generated by the government. Tax reforms will be captured with the various income taxes. Key words:
Tax reforms, VAR, ECM, Revenue generation, Oil-Driven Economy (ODE) 1.0 INTRODUCTION
The diversification of revenue sources in Nigeria has been at the top burner of most economic discourse over the years. The issue has been highly episodic owing to the fact that the nation’s economy is obviously fueled by revenue mainly accruing from crude oil. This assertion is given more credence with the slogan that, “when the oil industry sneezes, the entire nation catches
cold”. Public expenditure at all levels is highly unsustainable whenever there is a quadrupling in the price of crude oil at the international oil market. The economic recession that occurred between 2015 and 2017 in Nigeria is an indication to this position. According to Oriakhi and Ahuru (2014), the United States of America and other advanced economies are periodically strategizing and designing new energy models that will enable them to effectively reduce their dependence on crude oil imports from Nigeria. With the current global wave of alternative sources of energy, such a clarion call portend a grave danger and challenge to oil-driven and oil-drunk economy like Nigeria. For example, France, United Kingdom, Belgium and some other countries in Europe are making efforts to phase out cars and engines powered by petrol between 2020 and 2050, and replacing them with electric-powered cars (the Guardian, 2017 & Ovenseri-Ogbomo, 2017). There is an urgent need for Nigeria to pragmatically address this on-coming trend by quickly diversifying the nation’s revenue base via the instrumentality of tax reforms mechanism and through a complete overhaul of the nation’s fiscal policy architecture. Attempts at diversifying the productive base of the economy is not new in Nigeria. This is because any policy thrust aimed at diversification of the economy is equally targeted at diversifying the revenue base. What is new is the political will to reform the nation’s tax policy. Diversifying revenue sources using tax reforms instrument can be a conscious and strategic policy action by any economy, especially when it helps to broaden the tax base and at the end enhance revenue base. This contributes in strengthening stability and flexibility in financial management, and thus achieving better fiscal performance (Bartle, Carol, & Dale 2003). Several attempts have been made towards diversification of revenue sources by various governments in Nigeria. According to Odusola (2006), the military government made some attempts at reforming the nation’s tax structure, especially between 1967 to 1979 and 1983 to 1999. Little or intangible economic evidence was derived from such exercise. The Structural Adjustment

106
Programme (SAP) introduced in 1986 was another step at diversifying the revenue base of the Nigerian economy. With the present democratic dispensation which began in 1999, the government has introduced one or two tax reforms with a view to enhancing the revenue base of the nation. The most laudable of these reforms is that of 2004, ably midwived by the then chairman of the Federal Inland Revenue Service (FIRS), Mrs. Ifueko Omoigui Okauru. The President Mohammadu Buhari’s administration is also making efforts at diversifying the revenue base of the nation through deliberate fiscal policies at the diversification of the Nigerian economy. The call on diversification of revenue sources is becoming increasingly expedient owing to increasing decline in Total Federally Collected Revenue (TFCR). As a result, most of the federating units or states could not meet up with their statutory financial obligations, thereby resorting to bail-out funds from the Federal government. It is against the above scenario that this paper is designed to principally gauge the impact of tax reforms captured by the various income taxes and Value Added Tax (VAT) on revenue generation in Nigeria. This paper is stratified into five sections. Following this section is section two which entails the literature review and theoretical foundations of tax reforms. Section three presents methodology of the study. While four and five consider analysis of results, recommendation and conclusions respectively.
2.0 THEORETICAL AND EMPIRICAL LITERATURES The issue of tax reforms as a precursor to diversification of revenue sources can be traceable to the Great Depression era when property values and property tax revenues nose-dived significantly (Ulbrich, 1991). As result of this, affected economies in Western Europe and other part of the World resorted to alternative sources income. The United Kingdom, one of the most hit economies, embarked on several fiscal policy reforms to shore up their revenue base. Among the tax structure visited were sales, income, custom and excise duties, as well as property tax (Fisher, 1997; Howe & Reeb, 1997). In the United States for example, the drive towards revenue diversification by leveraging on tax and other fiscal policy reforms took place between 1960 and 1970. This was a response to the fiscal and financial crises that ravaged most of the states in the U S within the period. According to Steurele (1992) and Bartle, Carol, and Dale (2003), the increase in government expenditures was one of the factors that provoked such drive for diversification of revenue sources among some sub-national governments. The severe pressure of ever-growing demand for public services resulted in the increase in property tax. Alternative sources of revenue were devised through the introduction of local sales tax, increased income taxes and user charges. However, this exercise was vehemently opposed. The tax reforms introduced by the different state governments brought about demographic and economic changes. It was this reforms that led to spontaneous reactions and revolts in some cities in the U S during the administration of President Nixon (Zhou, 2005). It was this action that led the Nixon administration into the devolution of certain fiscal responsibilities to the states and thus reduced federal assistance to state and local governments. With this action, the region and sub-regional governments were able to deploy constituted tax reforms to diversify their tax base which considerably led to increase revenue for the states (Bartle et al., 2003 & Carroll, 2005). In Nigeria, the call for diversification of revenue sources began in the 1970s when the country experienced her first oil burst. Expectedly, everyone wanted Nigeria to save greater proportion of her oil revenue during boom, this was not to be. With the discovery of oil in commercial quantities in the late 1950s, the government at all levels jettisoned agricultural production which was a principal source of revenue generation to the Nigerian government. According to the Central Bank of Nigeria (2010), Oriakhi and Ahuru (2014), import and export duties, excise tax which form the nucleus of the nation’s indirect tax structure was germane and relevant sources of revenue to the government, generating over 60 percent of total foreign exchange earnings before the advent of the petrol-dollar. The Revenue Switching Structure (RSS) of the Federal government was highly occasioned by the export of crude oil in ‘70s. This resulted in the neglect of agriculture which was a major source of revenue before this period. This entirely shifted the revenue base from agriculture

107
to crude oil [Iyoha, 2003; Odusola, 2006, Obadan, 2012; Oriakhi & Ahuru 2014]. Successive governments over the years have attempted to address this ugly trend through the vehicle of revenue diversification premised on the diversification of the productive base of the Nigerian economy. The continuous reliance of the Nigerian economy on crude oil export has successively made it more susceptible and vulnerable to severe external shocks. For example, the recent Global Economic and Financial Crisis (GEFC), which was birthed in the United States in 2009, exposed most oil-driven economy, breaking all their financial and economic insulators. This therefore, makes the call for diversification of revenue source highly imperative in Nigeria. Okonjo-Iweala (2005), x-rayed two negative Fiscal Transmission Channels (FTC) of crude oil price volatility on the Nigerian economy. According to her, firstly, oil price volatility plummet revenue accruing to the government, thereby reducing the quality and efficiency of public expenditure. Secondly, oil price volatility creates uncertainty in the investment environment, thereby causing a withdrawal of the investing public and their investments. Several economists have extensively studied the relationship between revenue generation and economic growth in different parts of the world. Some have also empirically examined the issue of equity and efficiency as it relates to tax administration. Evaluating the empirical nexus between tax diversification and government expenditure, Wagner (1976) found out that revenue diversification was able to boost public expenditures in ten states in the United States, using the Ordinary Least Square (OLS) method of analysis. Breeden and Hunter (1985) using thirty-seven cities in the U S and found a consistent and a corroborative results with what Wagner earlier had, using the same method of analysis. The empirical findings of Ladd and Weist (1987) in Netherlands was however not consistent with earlier results. Even within the competing view of fiscal illusion viz-a viz fiscal stress, no agreement could be reached. Misiolek and Harold (1988) revealed their findings some empirical results to support the argument between fiscal stress and fiscal illusion. Some other studies show that fiscal illusion causes some regional and sub-regional government to excessively expand their expenditure profile (Turnbull, 1993; 1998 & Carroll, 2007). Using a robust and a profound quantitative technique, Suyderhoud (1994) appraise how revenue diversification had a positive impact on revenue generation in the United States. Capturing tax reforms with Ad valorem Tax (AT), he found out that a robust tax reform has a positive relationship with total revenue generation in the U S between 1970 and 1990. He also discovered that revenue diversification positively impact on fiscal performance. Hendrick (2002) models the impact of revenue diversification on tax effort using budget study data from the Chicago metropolitan region. Her findings suggest that revenue diversification is highly correlated with lower tax effort. Adereti, Sanni and Adesina (2011), using OLS to examined the impact of Value Added Tax (VAT) on the Nigerian economic growth. The study proxies tax reform with VAT. The empirical result shows that over 95 percent of the systematic variation of the gross domestic product was explained by the independent variables, demonstrating a high explanatory power via the coefficient of determination. They relied on time series data from Central Bank of Nigeria (CBN) from 1980 to 2010. The empirical study of Ogbonna and Appah (2012) was centred on the impact of tax reform on economic growth in Nigeria using time series data of between 1980 and 2007. The result revealed that all the variables applied were not stationary at levels, hence the first difference using Dickey Fuller approach. The Partial Stock Adjustment Mechanism (PSAM) was applied in the estimation of Error Correction Model (ECM). The Engle Granger causality test conducted demonstrated that CIT, PIT, CED, VAT and PPT granger causes gross domestic product (GDP). The OLS result revealed that variations in income taxes are positively related to economic growth. To ascertain the degree of tax reforms on economic growth in Nigeria empirically, Okafor (2012) applied the Ordinary Least Square (OLS) technique to validate his findings. He captured tax reforms using Personal Income Tax (PIT), Company Income Tax (CIT), Petroleum Profit Tax (PPT), Custom and Excise Duties (CED) and Value Added Tax (VAT) within the period of 1980 and 2010. The result of the regression revealed that tax reform is positively related to economic growth in Nigeria. It also shows that over 56 percent of the systematic variations of economic growth were explain by the

108
independent variables. The research was consistent with the study earlier carried out by Adereti, Sanni & Adesina (2011).
2.1 The Issue of Tax Structure and Tax Reforms in Nigeria
The issue of tax structure addresses the question of how taxes are or should be composed. As a result of several structural defects associated with tax administration in Nigeria, it became imperative to carry out certain reforms that will enhance efficient, equitable, and fair tax administration. Over the years, various theoretical approaches to tax structure development have emerged. The least ambitious of these is that which split typical tax structures between early and later period and this is called the traditional approach (Anyanwu, 1997). The argument according to him is that the basic determinant of tax structure at the early period of development is the availability of feasible tax base. Also at the early period, because the economy is agrarian, import and export duties forms the major bulk of tax base (Anyanwu, 1993 & Anyanwu, 1997). The other approaches are the move from primitive to advanced societies, the historical-evolutionary and the empirical approaches. Considering the dwindling financial fortunes in the nation’s fiscal architecture, owing to the fall of crude oil price at the international oil market, consumption-based tax like Value-Added Tax (VAT) was introduced in 1993 through decree 102, replacing the orthodox sales tax. Before this period, high premium was on international trade activities, making the revenue base obviously unpredictable and the Nigerian economy vulnerable or susceptible to external shocks. It was based on these economic challenges that led the introduction of several structural reforms in Nigeria tax policy and administration, especially in the late 20th and 21st centuries. The basic objectives of the reforms in Nigeria’s tax structure according to Alli (2009) include: a) To structurally diversify the nation’ revenue base through the non-oil sector; b) To accelerate improved service delivery to the Nigerians; c) To reduce the complexity of tax system on the part of tax payers and administrators; d) To ensure the functionality of tax system administration; e) To review taxes and laws thereby reducing incidence of tax avoidance and evasion; and f) To bridge the gap between development needs and sources of funds. According to Odusola (2006), two study groups were inaugurated in 1991 to extensively appraise the direct and the indirect tax structure with a view drawing meaningful recommendations. One outstanding fall out of the group on indirect tax structure was shifting from import and export duties to consumption-based tax, which found its expression in Value Added Tax (VAT). It was introduced in 1993 and became operational in 1994. At inception in 1994, the proceeds from VAT was to be shared among the three tiers of governments (Federal, States and Local) in the ratio of 20, 50 and 30 percent respectively. The sharing procedure was reviewed in 1995 to 50, 30 and 20 respectively. After several years of agitation by the states, the VAT proceeds is now being shared in the ratio of 15, 50 25 percent. By 1998, another structural tax reform was introduced by the Joint Tax Board (JTB), through Decree 21. The tax reform was to pave way for harmonization of tax administration in Nigeria and above all to reduce the incidence of multiplicity and duplication of taxes at both the Federal and State levels.
3.0 METHODOLOGICAL ISSUES
To ascertain and effectively gauge the empirical relationship between tax reforms, proxy by the various incomes taxes, econometric analysis will be used to validate this relationship. A simple Ordinary Least Square (OLS) estimation method will be employed in this study. The empirical study will also built and depended on the earlier works by Okafor (2012),Oriakhi & Ahuru (2014). Time series data were obtained from Central Bank of Nigeria Statistical bulletin for the period between 1980 and 2016. Expectedly, time series data are obtained in their non-stationary form, necessitating the conversion into stationary from through the conduct of a unit root test Gujarati (2009) & Wooldridge (2009). All the variables (endogenous and exogenous) are to be stationary after first difference if not at levels. This can be achieved through Augmented Dickey Fuller (ADF) statistics. In determining and analyzing the long-run relationship between the endogenous and

109
exogenous variables, a co-integration test relying on the Autoregressive Distributed Lag (ARDL) will be carried out. This will also help us to verify if there is a common stochastic drift among the variables under consideration. To ascertain the short-run dynamics of the model being studied, we will employ the Error Correction Mechanism (ECM) via the Partial Stock Adjustment Model (PSAM) in our estimation.
3.1 Model Specification
The empirical model between the endogenous and the exogenous variables can be written in a linear form as follows:
=
+=n
i
ttt UERLTFCR1
----------------------------------------------------------------------------------- (3.1)
Where ER= Economic Reforms (captured by various income taxes),TFCR (Total Federally Collected Revenue), VAT (Value Added Tax), PIT (Personal Profit Tax), CIT (Company Income Tax), CED (Custom and Excise Duties), and PPT (Petroleum Profit Tax). We also introduced RGDP (Real Gross Domestic Product), all the variables are in log form. The equation above can be in more empirical manner as:
ttttttt LVATLRGDPLPPTLPITLCIDLCEDLTFCR 6543210 ηηηηηηη ++++++= ----------------
-- (3.2)
tU is expected to be Gaussian white noise. All the exogenous variables are expected to be positively
signed. 4.0 ANALYSIS AND PRESENTATION OF REGRESSION RESULTS 4.1 Descriptive Evidence
The table below shows analysis and summary of the descriptive statistics. Table 1: Descriptive Analysis
TFCR CED CIT PIT PPT RGDP VAT Mean 3294495. 364416.8 229187.4 30116.14 697847.9 631101.6 184611.3 Median 582811.1 76683.00 46211.00 20077.00 76667.00 310890.0 36868.00 Maximum 22316600 2811700. 981871.0 72908.00 2812300. 5275576. 723132.0 Minimum 10508.70 1616.000 403.0000 408.0000 3747.000 31547.00 0.000000 Std. Dev. 4578327. 641549.1 335033.1 29318.10 852612.6 881913.5 253230.2 Skewness 2.096758 2.512066 1.270087 0.240922 0.831832 4.156158 1.102855 Kurtosis 8.897129 9.181424 2.991639 1.264014 2.249274 22.08872 2.587965
Jarque-Bera 80.72430 97.82170 9.947682 5.003976 5.135861 668.2724 7.762178 Probability 0.000000 0.000000 0.006917 0.081922 0.076694 0.000000 0.020628
Sum 1.22E+08 13483421 8479935. 1114297. 25820372 23350759 6830618. Sum Sq. Dev. 7.55E+14 1.48E+13 4.04E+12 3.09E+10 2.62E+13 2.80E+13 2.31E+12 Observations 37 37 37 37 37 37 37 Source : Author’s Computation using E-views econometric software From the descriptive evidence above, the result shows that annual RGDP 631101.5 billion Naira over the 1980-2016 period. The average VAT for the period is 184611.3 billion naira. On the average, Petroleum Profit Tax (PPT) is 697847.9 billion naira. Personal Income Tax (PIT), Company Income Tax (CIT), and Custom and Excise Duties (CED) were averaged at 30116.14, 229187.4 and 364416.8 billion naira respectively. The descriptive evidence revealed that VAT had the lowest variability while RGDP and PPT had the highest judging from the standard deviations recorded over the period.

110
4.2 Pearson Correction Matrix Table 2: Correlation Matrix Correlation
Probability LTFCR LCED LCIT LPIT LPPT LVAT LRGDP
LTFCR 1.000000
-----
LCED 0.963300 1.000000
0.0000 -----
LCIT 0.956948 0.964796 1.000000
0.0000 0.0000 -----
LPIT 0.971890 0.943610 0.945721 1.000000
0.0000 0.0000 0.0000 -----
LPPT 0.979436 0.969649 0.957784 0.966884 1.000000
0.0000 0.0000 0.0000 0.0000 -----
LVAT 0.931631 0.922700 0.941263 0.930975 0.909470 1.000000
0.0000 0.0000 0.0000 0.0000 0.0000 -----
LRGDP 0.781289 0.801268 0.810629 0.778344 0.807458 0.734102 1.000000
0.0000 0.0000 0.0000 0.0000 0.0000 0.0000 ----- Source: Author’s Computation using E-view Econometric software
The correlation analysis above shows that all the exogenous variables are positively related to total federally collected revenue (TFCR). The correlations among the variables are understandably high due to their nature (tax related), suggesting the presence of auto-correlation and multi-collinearity among them. The correlation matrix also provides evidence on the magnitude and direction of the relationship among the variables. The correlation matrix was symmetric about the diagonal with values of 1.0000 indicating the perfect correlation of each variable with itself. The results revealed that all the variables are expected to boost the level of total federally collected revenue in Nigeria.
4.3 Stationarity Test Analysis: Augmented Dickey- Fuller
Table 3: Stationarity Test
Variables
ADF Levels 1st Difference Remarks
LTFCR -3.632900 -8.363931** I (1) LLCED -3.639407 -6.649547** I (1) LCIT -3.632900 -8.092100** I (1) LPIT -3.632900 -8.972103** I (1) LPPT -3.632900 -6.732809** I (1) LRGDP -3.632900 -10.03990** I(1) LVAT -3.632900 -8.363912** I (1) Source: Authors’ Computation
The above results reveal that the unit root test became stationary after first difference, they were however not stationary at levels. The variables are integrated at order one. From this integration criterion, we can test for cointegration to verify the existence of a common stochastic drift among the time series data.

111
4.4 Test for Cointegration : The Johansen cointegration test was deployed in this analysis. The Johansen cointegration test applied maximum lag order 1 along with constant trend specification. The test results are presented as follows: Table 4: Cointegration Test
The table above shows the detection of cointegration indicates that there is long-run relationship among the variables.
Unrestricted Cointegration Rank Test (Trace) Hypothesized Trace 0.05
No. of CE(s) Eigenvalue Statistic Critical Value Prob.** None * 0.811391 184.8906 125.6154 0.0000
At most 1 * 0.704362 126.5079 95.75366 0.0001 At most 2 * 0.625973 83.85622 69.81889 0.0025 At most 3 * 0.515446 49.43623 47.85613 0.0352 At most 4 0.389579 24.07779 29.79707 0.1972 At most 5 0.111703 6.801565 15.49471 0.6008 At most 6 0.073073 2.655833 3.841466 0.1032
Trace test indicates 4 cointegrating eqn(s) at the 0.05 level * denotes rejection of the hypothesis at the 0.05 level **MacKinnon-Haug-Michelis (1999) p-values
Unrestricted Cointegration Rank Test (Maximum Eigenvalue) Hypothesized Max-Eigen 0.05
No. of CE(s) Eigenvalue Statistic Critical Value Prob.** None * 0.811391 58.38272 46.23142 0.0017
At most 1 * 0.704362 42.65170 40.07757 0.0251 At most 2 * 0.625973 34.41999 33.87687 0.0431 At most 3 0.515446 25.35844 27.58434 0.0938 At most 4 0.389579 17.27622 21.13162 0.1594 At most 5 0.111703 4.145732 14.26460 0.8437 At most 6 0.073073 2.655833 3.841466 0.1032
Max-eigenvalue test indicates 3 cointegrating eqn(s) at the 0.05 level * denotes rejection of the hypothesis at the 0.05 level **MacKinnon-Haug-Michelis (1999) p-values

112
4.5 Long-Run/Static Analysis
Table 5: The Static Analysis Test
Variable Coefficient Std. Error t-Statistic Prob. C 2.833492 1.586244 1.786290 0.0842
LCIT 0.030753 0.136064 0.226022 0.8227 LPIT 0.347176 0.174926 1.984699 0.0564 LPPT 0.549905 0.184397 2.982189 0.0056 LCED 0.119352 0.155317 0.768437 0.4482 LVAT 0.049798 0.042957 1.159263 0.2555
LRGDP -0.100301 0.151490 -0.662099 0.5130 R-squared 0.973200 Mean dependent var 13.19110
Adjusted R-squared 0.967840 S.D. dependent var 2.548917 S.E. of regression 0.457104 Akaike info criterion 1.440845 Sum squared resid 6.268317 Schwarz criterion 1.745614 Log likelihood -19.65564 Hannan-Quinn criter. 1.548291 F-statistic 181.5663 Durbin-Watson stat 1.916105 Prob(F-statistic) 0.000000 Authors’ Computation
The result above indicates that all variables conformed with the a priori expectation except RGDP which was negatively signed. The test therefore reveals good performance. From the coefficient of determination measured by R-squared, it shows that over 90 percent of the systematic variations in TFCR are explained the exogenous variables. The Durbin-Watson statistics has a coefficient of 1.916105, indicating the absence of autocorrelation.
4.6 The Short-run Dynamic Relationships
Table 6: Dynamic Analysis Test
Authors’ computation
The result presented in the table above shows the estimated coefficients of the lagged error correction terms ECM (-1). From the result, it is observed that ECM is statistically significant and correctly signed. The coefficient of the parameter of the error correction term gives credence to cointegration and implies the existence of long-run steady-state equilibrium between TFCR and exogenous variables. The shocks generated by the explanatory variables can be corrected to restore equilibrium and the adjustment process indicates the dynamics existing between Total Federally Collected Revenue (TFCR) and the included exogenous or explanatory variables.
Variable Coefficient Std. Error t-Statistic Prob. C -0.006082 0.100835 -0.060316 0.9523
DLCIT -0.088165 0.223531 -0.394419 0.6963 DLPIT 0.386501 0.185054 2.088589 0.0460 DLPPT 0.603435 0.184355 3.273226 0.0028 DLCED 0.203800 0.150531 1.353875 0.1866 DLVAT 0.080516 0.077565 1.038047 0.3081
DLRGDP 0.022393 0.129309 0.173175 0.8638 ECM(-1) -0.894674 0.201099 -4.448912 0.0001
R-squared 0.600173 Mean dependent var 0.169853
Adjusted R-squared 0.500217 S.D. dependent var 0.680155 S.E. of regression 0.480838 Akaike info criterion 1.566557 Sum squared resid 6.473743 Schwarz criterion 1.918450 Log likelihood -20.19803 Hannan-Quinn criter. 1.689377 F-statistic 6.004337 Durbin-Watson stat 2.144772 Prob(F-statistic) 0.000246

113
4.7 Short-run ARDL Model and Analysis
Table7: SR ARDL Test
Variable Coefficient Std. Error t-Statistic Prob.* LTFCR(-1) -0.037930 0.162675 -0.233165 0.8173
LCIT 0.036603 0.139248 0.262863 0.7946 LPIT 0.319401 0.198460 1.609394 0.1187 LPPT 0.646500 0.197804 3.268381 0.0029 LCED 0.099059 0.165326 0.599171 0.5539 LVAT 0.054550 0.043249 1.261292 0.2176
LRGDP -0.236831 0.181890 -1.302057 0.2035 C 4.352593 1.942310 2.240936 0.0331 R-squared 0.973407 Mean dependent var 13.28999
Adjusted R-squared 0.966758 S.D. dependent var 2.512057 S.E. of regression 0.458007 Akaike info criterion 1.469265 Sum squared resid 5.873566 Schwarz criterion 1.821158 Log likelihood -18.44676 Hannan-Quinn criter. 1.592085 F-statistic 146.4129 Durbin-Watson stat 2.025082 Prob(F-statistic) 0.000000
*Note: p-values and any subsequent tests do not account for model
selection. Source: Authors’ Computation 4.8 Long run ARDL Model and Analysis (ARDL Model: 1,0,0,0,0,0) Table 8: LR ARDL Test
Cointegrating Form Variable Coefficient Std. Error t-Statistic Prob. D(LCIT) 0.036603 0.139248 0.262863 0.7946
D(LPIT) 0.319401 0.198460 1.609394 0.1187 D(LPPT) 0.646500 0.197804 3.268381 0.0029 D(LCED) 0.099059 0.165326 0.599171 0.5539 D(LVAT) 0.054550 0.043249 1.261292 0.2176
D(LRGDP) -0.236831 0.181890 -1.302057 0.2035 CointEq(-1) -1.037930 0.162675 -6.380384 0.0000
Cointeq = LTFCR - (0.0353*LCIT + 0.3077*LPIT + 0.6229*LPPT + 0.0954
*LCED + 0.0526*LVAT -0.2282*LRGDP + 4.1935 )
Long Run Coefficients Variable Coefficient Std. Error t-Statistic Prob. LCIT 0.035266 0.133145 0.264867 0.7931
LPIT 0.307729 0.175741 1.751039 0.0909 LPPT 0.622874 0.206284 3.019498 0.0054 LCED 0.095439 0.155369 0.614272 0.5440 LVAT 0.052556 0.041913 1.253925 0.2202
LRGDP -0.228176 0.177827 -1.283135 0.2100 C 4.193531 1.875709 2.235704 0.0335

114
4.9:Long-run Granger Causality (LRGC) Test: Table 9: Pairwise Granger Causality Test Null Hypothesis: Obs F-Statistic Prob.
LCED does not Granger Cause LTFCR 35 0.30068 0.7425
LTFCR does not Granger Cause LCED 6.19613 0.0056 LCIT does not Granger Cause LTFCR 35 1.61687 0.2153
LTFCR does not Granger Cause LCIT 3.22665 0.0538 LPIT does not Granger Cause LTFCR 35 1.61006 0.2167
LTFCR does not Granger Cause LPIT 3.22843 0.0537 LPPT does not Granger Cause LTFCR 35 2.83317 0.0746
LTFCR does not Granger Cause LPPT 1.95908 0.1586 LVAT does not Granger Cause LTFCR 35 0.95820 0.3950
LTFCR does not Granger Cause LVAT 2.96528 0.0668 LRGDP does not Granger Cause LTFCR 35 0.12040 0.8870
LTFCR does not Granger Cause LRGDP 3.23595 0.0534 LCIT does not Granger Cause LCED 35 5.82407 0.0073
LCED does not Granger Cause LCIT 2.69801 0.0837 LPIT does not Granger Cause LCED 35 3.57075 0.0406
LCED does not Granger Cause LPIT 1.00281 0.3788 LPPT does not Granger Cause LCED 35 5.63935 0.0083
LCED does not Granger Cause LPPT 0.41162 0.6663 LVAT does not Granger Cause LCED 35 2.24389 0.1235
LCED does not Granger Cause LVAT 1.48672 0.2423 LRGDP does not Granger Cause LCED 35 0.06435 0.9378
LCED does not Granger Cause LRGDP 4.79735 0.0156 LPIT does not Granger Cause LCIT 35 2.15637 0.1333
LCIT does not Granger Cause LPIT 15.1426 3.E-05 LPPT does not Granger Cause LCIT 35 4.02716 0.0282
LCIT does not Granger Cause LPPT 1.37524 0.2683 LVAT does not Granger Cause LCIT 35 11.5513 0.0002
LCIT does not Granger Cause LVAT 2.28282 0.1194 LRGDP does not Granger Cause LCIT 35 0.45623 0.6380
LCIT does not Granger Cause LRGDP 4.68097 0.0170 LPPT does not Granger Cause LPIT 35 0.51713 0.6015
LPIT does not Granger Cause LPPT 3.70506 0.0365 LVAT does not Granger Cause LPIT 35 3.59173 0.0400
LPIT does not Granger Cause LVAT 4.53774 0.0190 LRGDP does not Granger Cause LPIT 35 0.08964 0.9145
LPIT does not Granger Cause LRGDP 4.77551 0.0158 LVAT does not Granger Cause LPPT 35 1.62064 0.2146
LPPT does not Granger Cause LVAT 1.91630 0.1647 LRGDP does not Granger Cause LPPT 35 0.35078 0.7070
LPPT does not Granger Cause LRGDP 4.38841 0.0213 LRGDP does not Granger Cause LVAT 35 0.20136 0.8187
LVAT does not Granger Cause LRGDP 2.59732 0.0911

115
The long-run or Pairwise Granger Causality tests made use of the non-stationary level variables, which discountenances the possibility of cointegration among variables. Following the work of Dunne and Vougas (1999) revealed the misspecification that might arise from the exclusion of the error correction term and subsequent loss of long-run information which led to wrong inferences. Barring weaknesses above, the LRGC test result indicates that custom and excise duties, value added tax and real GDP are Granger causal of the level of total federally collected revenue while personal income tax, company income tax and petroleum profit tax does not (see table above).
5.0 RECOMMENDATIONS AND CONCLUSIONS
Having empirically analyzed and examined the relationship between total federally collected revenue and tax reforms (captured by the various income tax including VAT) in Nigeria, the following recommendations are hereby suggested: Firstly, the government should expand the dragnet of value-added tax (VAT) to include other items which are presently not captured in the exercise. Secondly, policy makers should also ensure that custom and excise duties contribute significantly to total federally collected revenue. This can be done through severe structural alignment by mirroring what is presently on ground to suit future expectations. Finally, property tax should be given serious consideration. If Nigeria is planning her economic and financial future with a clear departure from crude oil revenue, efforts must be placed at re-tooling the Nation’s tax revenue to reflect property tax. If Nigeria is to address her recurring financial burden whenever the price of crude oil quadruples at the international oil market, the nation’s tax base must re-appraised with to expanding it. Above, the current nation’s financial and fiscal architecture should be revisited so as to structurally diversify the revenue base of the Nigerian economy.

116
REFERENCES
Alli, B. D. (2009). Managing the Tax Process in Nigeria. Nigerian Journal, 42 (1), 45-51. Anyanwu, J. C. (1993). Monetary Economics: Theory, Policy and Institution. Hybrid Publishers
Nigeria Limited, Onitsha. Anyanwu, J. C. (1997). Nigerian Public Finance. JoanneEducational Publishers Nigeria LTD, Onitsha.
45(1), 24-38. Appah, E. (2004). Principles and Practice of Nigerian Taxation. Ezevin Mint Printers and Publishers,
Port Harcourt. Bartle, J. R.; Carol, E. & Dale, K. (2003). Beyond the Property Tax: Local Government Revenue
Diversification. Journal of Public Budgeting, Accounting & Financial Management, 5 (4), 622 Bird, R.M. (1991). Tax Administration and Tax Reforms: Reflections on Experience in Tax Policy in
Developing Countries. In: Khalilzadeh-Shirazi, J. & Shah, A.A (Eds.) World Bank Symposium, Washington, D.C. 4-124.
Breeden, C. H. & Hunter, W. J. (1985). Tax Revenue and Tax Structure. Public Finance Quarterly
Journal,13 (2), 218-224 Carroll, D. A. (2005). Are States Governments Prepared for Fiscal Crises? A look at Revenue
Diversification during the 1990s. Public Finance Review, 35 (5), 603-633. Carroll, D. A. (2007). Diversifying Municipal Revenue Structures: Fiscal Illusion or Instability? Paper
Presented at the 19th Annual Conference of Association for Budgeting and Financial Management.
Dunne, P. & Vougas, D. (1999). Military Spending and Economic Growth in South Africa: A causal
Analysis. The Journal of Conflict Resolution, 43 (4) 521-537. Federal Inland Revenue Service (FIRS) Hand book, 2012. Federal Inland Revenue Service (FIRS) Hand Book, 2014. Fisher, G. W. (1997). Some Lessons from the History of property Tax. Assessment Journal, 4 (3),40-
47. Iyoha, M.A. (2003). An Overview of Leading in the Structure and Development of the Nigerian
Economy since 1960. In: Iyoha, M.A. & Itsede, C.C. (Eds.), Structure of the Nigerian Economy, Midex Publishing, Benin City.
Greene, W.H. (2003). Econometric Analysis, Pearson Publishers, 5th edition (low price edition),
Singapore, 234-269. Hendrick, R. (2002). Revenue Diversification: Fiscal Illusion or Flexibility Financial Management,
Journal of Public Budgeting and Finance, 22 (4), 52-72. Howe, E. T. & Reeb, D. J. (1997). The Historical Evolution of State and Local Tax Systems. Social
Science Quarterly Journal, University of Texas Press, 78 (1), 109-121. Ladd, H. F. & Weist, D. R. (1987). States and Local Government Tax Systems: Balance among
Taxes Vs Balance among Policy Goals. In: Stocker, F. D. (Ed.), The Quest for Balance in State-Local Government Revenue Structure. Lincoln Institute of Land Policy, Tax Policy Roundtable, Property Tax Series, TPR-16, 36-69.

117
Misiolek, W. S. & Harold, W. E.(1988). Tax Structure and the Size of Government: An Empirical Analysis of the Fiscal Illusion and Fiscal Stress Arguments. Public Choice Journal, 57-89.
Obadan, M.I. (2012). Foreign Exchange Market and the Balance of Payments: Elements, Policies,
and Nigeria Experience. Goldmark Press Limited, Benin City. Odusola, A. (2006). Tax Policy Reforms in Nigeria. United Nations University World Institute for
Development Economic Research Unit, Research Paper No. 2006/03. Ogbonna, G.N.& Ebimobonee, A. (2012). Impact of Tax Reforms and Economic Growth of Nigeria: A
Time Series Analysis. Current Research Journalof Social Sciences 4 (1), 62-68. Okafor, R.G. (2012). Assessing the Impact of Tax Reforms on Economic Growth in Nigeria.
European Journal of Business and Management, 4 (19), 20-35. Oriakhi, D. E. & Ahuru, R. R. (2014). The Impact of Tax Reform on Federal Revenue Generation in
Nigeria. Journal of Policy and Development Studies,9 (1), 92-108. Ovenseri-Ogbomo, F. O. (2017). Deregulation of the Downstream Sector of the Nigerian Petroleum
Industry: Issues, Problems and Prospect. Unpublished Steurele, C. E. (1992). The Tax Decade: How Taxes came to dominate the Public Agenda.
Washington, D. C. World Bank Publication, The Urban Institute Press. Suyderhoud, J. P. (1994). State- Local Revenue Diversification, Balance and Fiscal Performance.
Public Finance Quarterly Journal, 22 (2), 168-194. Turnbull, G. K. (1993). Fiscal Illusion and the output Expansion Hypothesis, Public Finance Quarterly
Journal, 21 (3), 305-321. Turnbull, G. K. (1998). The Overspending and Flypaper effects of Fiscal Illusion: Theory and
Empirical Evidence. Journal of Urban Economics, 44 (2), 1-26. Ulbrich, H. H. (1991). Non-property Tax. In: Petersen, J. E. & Strachota, D. R. (Eds.), Local
Government Finance, Government Finance Officers Association, Chicago, 113-133. Wagner, R. E. (1976). Revenue Structure, Fiscal Illusion, and Budgetary Choice. Journal of Public
Choice, 25 (2), 45-69. Wooldridge, J. (2009). Introductory Econometrics: A Modern Approach (5th edition), South-Western
College Publishers, New York. Zhou, Z. (2005). Property Tax Relief, Addition, or Mimicking? The Adoption and Budgetary Effects of
the General-Purpose Local Option Sales Tax in Georgia Counties, the University of Georgia, Athens, G. A.

118
Earnings Management and Corporate Social Responsibility
Benjamin Uyagu Department of Accounting Veritas University Abuja
And
Alexander Olawumi Dabor (Ph.D)
Department of Accounting Veritas University Abuja ________________________________________________________________
ABSTRACT
This study lies at the heart of the issue of reliability of financial statements. Reliability is the accountant’s terminology for integrity of financial statements. This study focused on the impact of Corporate Social Responsibility on earnings management in the Nigerian manufacturing sectors. The study is motivated by the paucity of research on subject matter in the manufacturing sub-sector in Nigeria. The study employed the ordinary least square multivariate regression technique. A sample of fifty- two manufacturing firms was used. The result shows that there is a positive relationship between CSR and earnings management. This study recommended that statutory bodies should put a ceiling on the amount to be expended on CSR which must be exceeded by any firm.
Key words:
Earnings management, corporate social responsibility, Stakeholder
INTRODUCTION
Earnings management is the employment of accounting methods to prepare financial report in order to give an exaggeratedly affirmative view of a firm’s business activities and financial position. Earnings management is the termed used to describe management’s activities that reduce the quality of the financial statements (Kinney Jnr, Palmrose & Scholz 2004). Fields, Lys and Vincent (2001) explain that, earnings management takes place when the manager exercises choices over accounting numbers. Lev (2003) added that managers will only engage in earnings management if they believe that the users of accounting information (investors, government, managers) cannot completely adjust accounting numbers to remove the effect of earnings manipulations. Lev (2003) is of the opinion that earnings management lowers quality of earnings and reduces the predictive ability of future earnings and cash flows. Kaplan (2001) further stresses that when earnings are deliberately manipulated to mislead investors it is considered as an unscrupulous act. The financial crisis that led to the collapse of some blue chip companies placed earnings management in the accounting spotlight in recent times. This monument event made both foreign and indigenous researchers to embark on studies of inquiry in order to ascertain the factors responsible for this anomaly. Some of these studies revealed that manipulation of earnings is one of the major factors responsible for the financial crisis that made corporate giants like Enron (In Nigeria AGIP) to go under. The aforementioned also stirred the interest of stakeholders to find out the causes of earnings management. Some studies (Healy, 1985; McNichols & Wilson, 1988; Holthausen, Larcker, & Sloan, 1995; Gaver, Gaver, & Austin, 1995; Cheng & Warfield, 2005; Bergstresser & Philippon, 2006; Houmes & Skantz, 2010) investigate the determinants of earnings management and discovered that compensation schemes is one of the determinants of earnings management . Healy (1985) provides the earliest evidence of contractual motivation for manage earnings. The author argues that since managers have insider information, they have opportunities to manage net income to maximize their bonuses. Chung, Firth and Kim (2010) report that opportunity for earnings management is higher among companies with high surplus free cash flow. Gul,( 2001) further asserts that companies with high surplus free cash flow face agency problems majorly. Particularly when the free cash flow is high but investment opportunities are low. Some previous studies reported that sales of non-current

119
assets is used by managers to manipulate earnings (Ullmann, 1985; McGuire et al, 1988; Salama, 2005). Previous did not point out the used of corporate social responsibility expenses as a tool for manipulating earnings in the Nigerian context. Chih et al. (2008) report that with a greater due diligence to CSR, the occurrence of earnings smoothing is mitigated, earnings losses is reduced while earnings aggressiveness drastically increase. Prior et al. (2008) also argue that earnings management practices damages the collective interests of stakeholders hence managers who manipulate earnings can resort to CSR activities to distract stakeholders’ attention from monitoring their opportunistic behaviours and consequently safeguarding their jobs. Extant literature reports that to reduce the chances of being sacked and dimple of firm’s reputation in the perspective of manipulating earnings information, managers use CSR to soothing earnings. Chih et al. (2008) asserts that when a firm expands CSR, the financial performance could suffer, leading the firm to manage reported earnings upwards to obscure the weaker than expected results From the foregoing, the objective of this study is to ascertain the effects of CSR on earnings management. To the best of researcher’s knowledge this study the first indigenous work to investigate the effect of CSR on earnings management in the Nigerian context. Elongated period covered, sample size and sector studied make this study novel among prior studies.
LITERATURE REVIEW
Conceptual Framework
Corporate social responsibility
1.1 Definition of corporate social responsibility In literature, there is no worldwide acceptable definition of the term CSR but different scholars defined it based on their perceptions and understanding. The definition of CSR was developed from Bowen (1983) reports that it is the obligation of businessmen to include in their objectives the values of the society and to also ensure that the purse of their business activities is not at variance with societal norms Kenneth, Andrews and Steiner (1999) define Corporate Social Responsibilities (CSR) “as the intelligent and objective concern for the welfare of the society that restrains the individual and corporate behaviour from ultimately destructive activities, no matter how immediately profitable but leads it to the directions of positive construction of human betterment”. Black (1989) classifies CSR into four categories which are; enterprise: supporting and developing initiatives to nurture budding entrepreneurs and boost enterprise; education: helping to bring new horizons into the lives of young people; arts and culture: providing assistance to a range of artistic activities and bringing communities together; and environment: encouraging efforts to safeguard the environment and improve the quality of life. Bernstein (2000) argues that business should be responsible to stakeholders even if it requires firms to sacrifice some profits. Firms should deal with these conflicting interests and claims in an ethical manner by formulating stakeholders’ friendly policies. This is consistent with the assertion of Carroll and Buchholz (2011) which states that CSR includes economic, legal, ethical, and philanthropic expectations placed on businesses by the society. Kotler and Lee ( 2005) assert that CSR is a commitment to improve community well-being through discretionary business practices and contributions of corporate resources.
Earnings Management
Watts and Zimmerman (1978) define earnings management as managers exercising their discretion over the accounting numbers. Healy and Wahlen (1999) then develop the concept of earnings management. They state that earnings manipulation occurs when managers exercise discretion in financial reporting or in structuring transactions, aiming at altering financial reports to either mislead some stakeholders about the underlying economic performance of the company or to influence the contractual outcomes that depend on reported accounting numbers. Leuz et al. (2003) and Königsgruber (2009) suggest that earnings manipulation arises from the conflicts of interest between insiders and outsiders. In other words, the objectives of companies and stakeholders are

120
not necessarily harmonious with each other, so the company has the incentive to influence the communication process to encourage particular actions from its various stakeholders, such as inspire creditors to supply additional capital in the company’s favorable condition (Hong & Andersen, 2011). Information asymmetry and imperfect auditing assist irrational managers to manipulate earnings or convey false information about the firm’s financial performance (Leuz et al., 2003), thereby, reducing earnings quality (Jaggi & Tsui, 2007) and finally undermining the firm’s future performance in the long-run. Earnings management is described as management actions which reduce the quality of the financial statements (Kinney Jnr, Palmrose & Scholz 2004). As Fields, Lys and Vincent (2001) explain that earnings management occurs when the manager exercises discretion over the accounting numbers. Further, managers will only engage in earnings management if they believe that users of accounting information cannot completely adjust the accounting numbers to remove the effect of earnings management. As earnings management leads to lowered earnings quality, it reduces the predictive ability of future earnings and cash flows (Lev 2003). To the extent that earnings are managed to mislead investors, earnings management is generally considered to be unethical (Kaplan 2001).
Review of theories. 2.5.2 Stakeholder - agency theory From a traditional perspective, the separation of ownership and control in modern corporations, together with information asymmetry, give rise to the opportunistic actions of the manager (the agent), who may have different objectives from the owner (the principal). In this context, earnings management is the process through which managers seek their own benefits at the expense of the company and shareholders- it is regarded as an agency problem. As a consequence of the inaccurate financial information conveyed by managers, shareholders may make non–optimal financial and operational decisions, which represent the agency costs created or exacerbated by earnings manipulation. According to Clarkson (1994), stakeholders are the group that bears the risks for the reason of investing some form of human or financial capital or something of value in a firm. As managerial decisions directly impact all the stakeholders groups, managers can be viewed as not only the agents of shareholders but also the agents of other stakeholders (Jones, 1995). In this situation, one of the amplified agency problems between managers and other stakeholders is that managers enlarge their own gains in the decision-making process while stop stakeholders from maximizing their collective utility. A series of researches that understudied the stakeholder-agency costs of earnings management from different perspectives find long–term negative consequences of earning management to stakeholders and the company itself as well. Generally, firms with large discretionary accruals will subsequently experience significant negative abnormal returns (Sloan, 1996), while earnings management activities that are not optimal corporate responses to economic circumstances will ultimately jeopardize companies’ competitiveness (Roychowdhury, 2006). Specifically, once earnings manipulation is suspected by stakeholders, the firm will immediately lose value on the stock market (Dechow & Sweeney, 1996). 2.5.4 Stakeholder - legitimacy theory Legitimacy is a condition or status that exists when an entity’s value system is congruent with the value system of the larger social system of which the entity is part (Lindblom, 1994). Legitimacy is recognized as a resource that is necessary for organizational survival. When a disparity, actual or potential, exists between the two value systems, particularly, if the firm does not operate within the norms and expectations of the society, a threat to its legitimacy is eminent. Researches that explain firms’ motivations to engage in CSR practices often rely on legitimacy theory. Ullmann (1985) creatively linked legitimacy theory to powerful stakeholders. Through CSR activities, companies achieve the license to operate (Porter & Kramer, 2006) – that is to say, it is the governments, communities and others give companies the tacit or explicit permission to do business.

121
To be precise, engaging in socially responsible activities, the company will not only improve stakeholder satisfaction, but also benefits from the positive effects on its reputation and brand name among stakeholders. The disclosure of information about corporate behavior and outcomes in terms of social responsibility will help companies build a positive image among stakeholders (Orlitzky et al., 2003). This positive image will in turn assist firms to establish community ties and build reputation capital, therefore, gaining trust and support from diverse groups of stakeholders. CSR and earnings management
Rezayil and Hadizade (2012) carried out a study to examine the relationship between earnings management and corporate social responsibility using 90 firms quoted on the floor Tehran Stock Exchange within the period 2002 and 2011. They employed the ordinary least square regression technique. Their results show there is a positive association between CSR and earning management. Benson et al. (2011) perform a study in the US to ascertain the effects of CSR on earnings management employing multivariate regression technique. Their result show that there is a positive association between CSR and earnings management. Kim et al., (2012) investigate the relationship between earnings management and CSR using some selected quoted Chinese companies. The study employed ordinary least square regression technique. Their results show that CSR firms are less inclined to be involved in aggressive earnings management via discretionary accruals or manipulation of actual activities and they play important role in limiting earnings management. As Chih, Shen and Kang (2008) carried out a study to ascertain the relationship between earning management and CSR using selected Korean quoted firms. The result shows that there is a negative relationship between CSR and earning management. Cespa and Cestone (2007) carried out a study to find out the relationship between CSR and earnings management. The result shows that there is no significant relationship between CSR and earnings management. RESEARCH METHODOLOGY
3.0 Research design
The research design refers to the overall strategy that you choose to integrate the different components of the study in a coherent and logical way, thereby, ensuring you will effectively address the research problem; it constitutes the blueprint for the collection, measurement, and analysis of data. (De Vaus( 2006). Research design is like a footprint that shows the step by step procedure that will be taken in analyzing the data collected from field. There are various types of research design, but this research adopted the experimental and expo facto research design. Expo facto in the sense that, the data or information of the study was extracted from a stored data of past events, it is experimental because it tends to establish the relationship between two or more variables. In other words, it explains how the explanatory variables affect the independent variable. 3.1 Population This is the entirety of the subject of the study. Population can be seen as a group of units from which a sample is drawn. The population consists of all quoted manufacturing companies lmanage Nigerian Stock Exchange as at 31th December 2015. 3.2 Sampling and Sampling Technique
The simple random sampling technique based employed to give all members of the population equal opportunity to be selected and there after apply the Taro Yamane formula to calculate the sample. The technique is well suited for determining the sample as it provides an equal probability of selection and as such minimizes selection bias. Year 2001 was used as the base year. The sample size is 52 when the aforementioned formula was applied.

122
The Taro Yamani formula employed is as shown below:
n = ./ 0 .(1)2 3.1
where, n = Sample Size = ?
N = Population Size = 60 e = error margin = 5 % or 0.05 Therefore, the sample size,
n = 34/ 0 34(4.46)2
n = 34/ 0 34(4.4426)
n = 34/ 0 34(4.4426)
n = 34/ 0 4./644
n = 34/./644
n = 62. /78 ≈ 52 firms
3.5 Sources of Data
The data for this study was sourced from secondary sources. The data will cover audit-related – data extracted from the annual reports and accounts of the selected fifty-two (52) manufacturing companies in Nigeria covering a period of 15 years (2001 – 2015).
3.6 Method of data analysis
The model specification of this study is to look at the relationship between CSR and earnings management. The model used is the modified version of Erica Yip, Chris Van Staden, Steven Cahan or Erica Yip et al (model I) as written below: EM = β0 + β1CSR_DISC + β2LN_SIZE + β3LEV + β4ROA + β5GROWTH + ε ……. (1) Where: CSR_DISC = RPT, WEB, or ANY_DISC, LN_SIZE = natural log of total assets, LEV = long-term debt divided by total assets, ROA = return on assets which is total operating income divided by total assets, GROWTH = change in sales from 2005 to 2006. EM = β0 + β1CSR + β2FSIZE + β3LEV + β4ROA + ε ……… ……………………… (2) where: CSR= corporate social responsibility FSIZE = natural log of total assets, LEV = long-term debt divided by total assets, ROA = return on assets which is total operating income divided by total assets, EM = Earnings management.
Model definition
Variable Type Measurement Aproir expectation Earnings management Dependent Discretional accrual CSR Independent Amount expended on
CSR activity for the year.
Positive sign
Firm size Control variable Natural log of total assets
Positive sign
Leverage Control variable Long term debt divided by total assets
Positive sign
ROA Control variable PAT divided by total positive

123
assets Source: Researcher’s computation (2017)
3.7 Method of data
The study used ordinary least square regression and multivariate regression analysis to determine the relationship between the dependent and independent variable. The data was analyzed using the E-views analysis software. Some pre and post-test were also performed in other to determine the specification of the model.
ANALYSES AND INTERPRETATION OF DATA
Table 4.1 Descriptive Statistics
DAC CSR FSIZE ROA LEV
Mean -1.02E+09 15409659 10198.72 15.55353 0.725853
Maximum 1.20E+11 1.03E+08 191000.0 23.56000 16.57000
Minimum -3.15E+11 167890.0 160.0000 11.14000 -4.150000
Std. Dev. 1.58E+10 19541449 17398.32 2.116419 1.317805 Skewness -12.96053 2.303125 5.963502 0.664928 8.220947
Kurtosis 244.3901 8.594553 49.93017 3.764537 84.71289
Jarque-Bera 1900850. 1693.659 75616.39 75.88532 224051.5
Probability 0.000000 0.000000 0.000000 0.000000 0.000000 Source: Researcher’s computation (2017) Table 4.1 presents the results for the descriptive statistics for the variables. As observed, discretionary accrual (DAC) has a mean value of -1.02E while it has maximum and minimum values of 1.20E+1 and -3.15E0 respectively. The standard deviation reported relatively small values 1.58E shows that DAC is clustered around the mean. Since the mean is relatively greater than (to the right of) the median DAC is slightly skewed to the right. The kurtosis is a measurement of the ends of a distribution and is used to dictate the size of the tails of a data distribution. The coefficient value of kurtosis of 244 > 3 implies a fat tails and it is a leptokurtic distributions . The Jacque-Bera value of 1900850 and the associated p-value of 0.00 indicate that the data is normal (p>0) and that outliers or selection bias that the generalization from the study are unlikely. CSR has a mean value of 15409659 while it has maximum and minimum values of 1.03E and 1679890 respectively. The standard deviation reported relatively large values of 167890 implies that there is clustering around the mean. Since the mean (15409659>750000) is greater than the median it indicates CSR is skewed to the right. The coefficient value of kurtosis of 8.5> 3 implies a leptokurtic distribution with toped tail. The Jacque-Bera value of 1600.659 and the associated p-value of 0.00 indicate that the data is normal (p>0) and that outliers or selection bias that the generalization from the study are unlikely. Firm size has a mean value of 10198.72 while it has maximum and minimum values of 191000 and 160. The standard deviation reported relatively large values of 17398.3 shows that Firm is clustered around the mean. Since the mean is relatively greater than the median it indicates that it slightly skewed to the right. The variable is positively skewed and the positive value of the kurtosis signifies that the regression variable is peaked than the Gausian distribution. Kurtosis value greater than 3 implies a leptokurtic distribution .The Jarque –Bera value of 75616 and p- values (0.00) implies that is that the variable is l normally distributed. Firm size (FSIZE) has a mean value of 15.5 while it has maximum and minimum values of 23 and 11 respectively. The standard deviation reported relatively small values 2.2 shows that FSIZE is clustered around the mean. Since the mean is relatively greater than (15.5>15.2) the median it implies that it is slightly skewed to the right. The kurtosis is a measurement of the ends of a distribution and is used to dictate the size of the tails of a data distribution. The coefficient value of kurtosis of 3.7 > 3 implies a fat tails and FSIZE it is a leptokurtic distributions. The Jacque-Bera value of 80.0 and the associated p-value of 0.00 indicate that the data is normal (p>0) and that outliers or selection bias that the generalization from the study are unlikely

124
ROA has a mean value of 15.5 while it has a maximum and minimum values of 23.56 and 11.14 respectively. The standard deviation reported relatively small values 2.11 shows that there is dispersion away from the mean. The mean .is less than the median value relatively imply that it is slightly skewed to the right. The kurtosis is a measurement of the ends of a distribution and is used to dictate the size of the tails of a data distribution. The coefficient value of kurtosis of 3.7> 3 implies a flat slope and ROA it is a leptokurtic distributions. The Jacque-Bera value of 141.0 and the associated p-value of 0.00 indicate that the data is normal (p>0) and that outliers or selection bias that the generalization from the study are unlikely. LEV has a mean value of 0.72 while it has maximum and minimum values of 16.57 and -4.15. The standard deviation reported relatively small values 1.32 shows that there is cluster around the mean. The mean value of 0.72 relatively less than the median it indicates that it slightly skewed to the left. The variable is positively skewed and the positive value of the kurtosis signifies that the regression variable is peaked than the Gausian distribution. Kurtosis value greater than 3 implies leptokurtic distribution. The Jarque –Bera value of 57.5 and p- values (0.00) implies that the variable is normally distributed. Table 4.2 Pearson Correlation Result
DAC CSR FSIZE ROA LEV
DAC 1.000000
CSR 0.027222 1.000000
FSIZE 0.012799 -0.031302 1.000000
ROA -0.238320 -0.063715 0.494513 1.000000
LEV 0.018559 -0.009509 -0.023317 -0.218350 1.000000 Source: Researcher’s computation (2017) Table 4.2 presents the Pearson correlation coefficient results for the variables. It is observed that CSR appears to positively correlate with earnings management (DAC) as depicted by the correlation coefficient (0.027).It implies that manufacturing companies use CSR to manipulate earnings. The control variables FSIZE and LEV exhibit positive association with earnings (DAC) as depicted by correlation coefficient (0.0128) and (0.0186), while LEV exhibits positive association with earnings management (DAC). The correlation coefficient results show that none of the variables is very strongly correlated and this indicates that the problem of multicollinearity is unlikely and hence the variables are suitable for conducting regression analysis. 4.3 Diagnostic Test
Table 4.3 Variance Inflation Factor (VIF) result
uncentred centred
DAC 75.7 NA
CSR 1.6 1.0
FSIZE 1.79 1.33
ROA 77.5 1.41
LEV 1.38 1.06
Source: Researcher’s computation (2017), using E-views 7.0 To further strengthen the result of the absence multicollinearity, we carried out a residual diagnostic test of variance inflation factor. From the in table 4.3, it is observe that the variance inflation factor (VIF) which measures the level of collinearity between the variables show how much of the variance of a variable most likely the coefficient estimate of a regressors has been inflated due to collinearity

125
with the other variables or likely regressors. They can be calculated by simply diving variance of a coefficient estimated by the variance of that coefficient had other regressors not been included in the equation. The VIFs are inversely related to the tolerance with larger values indicating involvement in more severe relationships. Basically, VIFs above 10 are seen as a cause of concern (Landau & Everit, 2003). CSR reported a VIF of 1.0; CSR (1.0); FSIZE (1.33); ROA (1.41); and LEV (1.06). Inclusions, the VIFs of the variables are all less than 10 indicating the unlikelihood of multicollinearity amongst the variables and hence the variables satisfy a very important condition the multivariate regression analysis. Table 4.4.2 Heteroskedasticity
Heteroskedasticity Test: Breusch-Pagan-Godfrey
F-statistic 14.68416 Prob. F(4,769) 0.1100
Obs*R-squared 54.92344 Prob. Chi-Square(4) 0.3100
Scaled explained SS 5964.004 Prob. Chi-Square(4) 0.6400
The Breusch –Pagan –Godfrey test of heteroskedasticity was adopted .The result of the reported probability values of 0.31 and 0.492 which far exceeds the 0.05 bench mark; this implies the null hypothesis of hetroskedasticity residual is uniform across all observations.
Table regression result
4.5 Regression Results
From the Ordinary least squares multivariate regression result presented in table 4.5 it is observed that the estimates are presented on year by basis order to provide insight on the sensitivity checks for the outcomes. Beginning the relationship between CSR and earnings management (DAC) depicted by discretionary accruals is positive (5.356, p=0.029) at 5% significance level. Firm size (FSIZE) has a positive relationship with earnings management (β=125185,p=0.00) at 5% significance level The effect of profitability on earnings management as depicted by DAC appears to be negatively related with earnings management (β=-1.20E,p=0.00 ) at 5% significance level. Leverage (LEV) appears to be negatively related with earnings management (β=-5.36, p=0.01) at 5% level of significance
Variable Coefficient Std. Error t-Statistic Prob. C 1.74E+10 1.76E+09 9.868577 0.0000
CSR 5.354799 4.946028 2.082646 0.0293
FSIZE 125185.5 20220.13 6.191133 0.0000
ROA -1.20E+09 1.15E+08 -10.48301 0.0000
LEV -3.36E+08 1.31E+08 -2.566995 0.0105
Weighted Statistics
R-squared 0.521954 Mean dependent var -0.059390
Adjusted R-squared 0.517620 S.D. dependent var 0.837270
S.E. of regression 0.740061 Sum squared resid 393.2416
F-statistic 51.20629 Durbin-Watson stat 2.058553
Prob(F-statistic) 0.000000
R-squared 0.063086 Mean dependent var -1.07E+09

126
In evaluating the yearly performance of the model which relates CSR and earnings management, the R2 stood at 0.52 indicating that the model explains about 52% of systematic variations in earnings management. The F-stat of (F-stat= 52.0 and p=0.00) for the model is significant at 5% it implies that the hypotheses of a linear relationship cannot be rejected at 5%. The D.W stat of 2.0 suggest that stochastic dependence is unlikely between successive units of the error term.
Test of Hypotheses
Hypothesis One
Hoi: There is no significant relationship between CSR and earnings management in the Nigerian manufacturing sector.
The effect of CSR on earnings management as depicted by discretionary accruals appears to be positive with coefficients value (5.35) and p-value ( p=0.029). The impact is significant at 5% level of significant hence the null hypothesis is not retained.
4.7 Discussion of Results
This study was aimed at ascertaining the relationship between corporate social responsibility and earnings management of the Nigerian manufacturing companies. The result shows that there is a positive relationship between CSR and earnings management. This result is in line with Benson etal. (2011) find that a positive association between CSR and earnings management.-the consistency between CSR and financial reporting was an empirical behavior and at variance with Kim et al., (2012) that investigate whether earnings quality is associated with CSR or not? But find that CSR firms are less inclined to be involved in aggressive income management via discretionary accruals or manipulation of actual activities and they play important role in limiting earnings management..
CONCLUSION
This study lies at the heart of the issue of reliability of financial statements. Reliability is the accountant’s terminology for integrity of financial statements. Reliability is the cornerstone of credibility, which in turns determines investor confidence. The focus of this study is CSR and earnings management in the Nigerian manufacturing sectors. The study is motivated by the paucity of research on subject matter in manufacturing sub-sector in Nigeria. This study therefore uses the discretionary earnings management as proxy for earnings management. This study contributes to CSR literature by being the first to best of our knowledge in the Nigerian context to relate earnings management with corporate social responsibility. Besides, the model used in this study is unique to this study. The model was built based on a study of extant literature. The variables used show that there is a positive relationship between CSR and earnings management.
5.4 Recommendations
Policy recommendations
This study reveals that there is a positive relationship between earnings quality and CSR. Thus, the financial of information given by most manufacturing companies misleads both potential and existing investors, this study therefore recommended that statutory bodies should put a ceiling on the amount that expended on CSR this must be exceeded by any firm. Defaulters should be duly sanctioned
Recommendations for further studies
This study focused on specific discretionary accruals as a proxy for earning management. The first suggestion for further study is to repeat the study in other sectors like financial institutions. Thus discretionary accruals, as used in the models should be replaced with abnormal loan loss provision. This study deals with the manufacturing sector. An examination of these models for financial sector and other non-financial sectors of the economy is recommended for further studies.

127
REFERENCES
Aichie B. Carroll & Kareem M. Shabana. (2010) The Business Case for Corporate Social Responsibility: A Review of Concepts, Research and Practice. International Journal of Management Reviews, 12(2) 85-105.
Bowen, Howard R. (1953) Social Responsibilities of the Businessman, New York: Harper&Row Carroll, A.B. (1979) A Three-Dimensional Conceptual Model of Corporate Social Performance,
Academy of Management Review, 4, (5)497-505. Cespa, G., & Cestone, G. (2004) Corporate Social Responsibility and Managerial Entrenchment,
CEPR Discussion Paper No. 4648. Clarkson, M. (1995) A Stakeholder Framework for Analyzing and Evaluating Corporate Social
Performance, Academy of Management Review, 20(1), 92-117. Chih, H L, Shen, C H & Kang, F C, 2008, ’Corporate social responsibility, investor protection, and
earnings management: some international evidence’, Journal of Business Ethics, 79 (3),79-198.
Chung, R., Firth, M. & Kim, J.B. (2005) Earnings Management, Surplus Free Cash Flow,
and External Monitoring, Journal of Business Research, 58,(5) 766 –776. Dechow, P. & Sweeney, A. (1996) Causes and Consequences of Earnings Manipulation: An Analysis
of Firms Subject to Enforcement Actions by the SEC, Contemporary Accounting Research, 13(3), 1-36.
Fields, T D, Lys, T Z & Vincent, L, 2001, ‘Empirical research on accounting choice’, Journal of
Accounting and Economics, 31, (.1-3),255-307 Gaver, J.J., Gaver, K.M. & Austin, J.R. (1995) Additional Evidence on Bonus Plans and
Income Management, Journal of Accounting and Economics, 19,(2) 3 – 28.
Gul, F.A. (2001) Free Cash Flow, Debt Monitoring and Managers’ LIFO/FIFO Policy Choice, Journal of Corporate Finance, 13, 475 – 492.
Healy, P.M. & Wahlen, J.M. (1999) A Review of the Earnings Management Literature and Its
Implications for Standard Setting, Accounting Horizons, 13, 365-383. Holthausen, R., 1981, Evidence on the effect of Bond Covenants and management compensation
contracts on the choice of Accounting Techniques: The case of the Depreciation Switchback, Journal of Accounting and Economics (March), 73-109.
Jaggi, B., & Tsui, J. (2007) Insider trading, earnings management and corporate governance:
Empirical evidence based on Hong Kong firm, Journal of International Financial Management and Accounting, 18(1), 192–222.
Jones, J, (1991).Earnings management during import relief investigations. The Journal of
Accounting Research, .29(.2),193-228. Kaplan, S. E. (2001). Further evidence on the ethics of managing earnings: an examination of the
ethically related judgments of shareholders and non-shareholders’, Journal of Accounting and Public Policy,.20(3), 27-44.
Kim, Y., Park, M. & Wier, B. (2012). Is earnings quality associated with corporate social
responsibility? The Accounting Review, 87 (3): 761–796.

128
Kinney Jr, W R, Palmrose, Z, & Scholz, A, 2004, ‘Auditor independence, non-audit services, and restatements: was the U.S. government right?’, Journal of Accounting Research, 42(3),561-588.
Lev, B. (2003) Corporate earnings: facts and fiction. Journal of Economic Perspectives,.17, 3(2),27-
50 Lindblom, C K, 1993, ‘The implications of organizational legitimacy for corporate social performance
and disclosure’, paper presented at the Critical Perspectives on Accounting Conference, New York.
Rezayi1, & Hadizade (2014). The Relationship between Earnings Quality and
Corporate Social Responsibility with Emphasis on the Stability of their Performance. Iranian Journal of Business and Economics,1(3)1-7
McNichols, M., & P. Wilson, P. (1988). Evidence of earnings management from the provision for
bad debts. Journal Accounting Research,26 (3)1–3 McGuire, J.B., Sundgren, A. & Schneeweis, T. (1988) Corporate Social Responsibility and Firm
Financial Performance, Academy of Management Journal, 31(9), 854–872. Orlitzky, M., Schmidt, F.L. ,& Rynes, S.L. (2003) Corporate Social and Financial Performance: A
Meta-Analysis, Organization Studies, 24(2), 403-441 Porter, M. E. & Kramer, M. R. (2006) The link between competitive advantage and corporate
social responsibility, Harvard Business Review, 84(12): 78–92. Prior, D., Surroca, J & . Tribo J.(2008). Are Socially responsible managers really ethical? Exploring
the relationship between earnings management and corporate social responsibitiy Corproate Goverance 16(3), 160-177
Roychowdhury, S. (2006) Earnings management through real activities manipulation, Journal of
Accounting and Economics, 42(3): 335–370. Salama, A. (2005) A note on the impact of environmental performance on financial performance,
Structural Change and Economic Dynamics, 16: 413-421 Sloan, R. G. (1996) Do stock prices fully reflect information in accruals and cash flows about
future earnings? Accounting Review, 71 (3): 289–31 Ullmann, A.A. (1985) Data in search of a theory: a critical examination of the relationships among
social performance, social disclosure and economic performance of US firms, Academy of Management Review, 10 (3): 540-557.

129
APPENDIX
DAC CSR FSIZE ROA LEV Mean -1.02E+09 15409659 10198.72 15.55353 0.725853 Median -5962553. 7500000. 5225.000 15.29000 0.575000 Maximum 1.20E+11 1.03E+08 191000.0 23.56000 16.57000 Minimum -3.15E+11 167890.0 160.0000 11.14000 -4.150000 Std. Dev. 1.58E+10 19541449 17398.32 2.116419 1.317805 Skewness -12.96053 2.303125 5.963502 0.664928 8.220947 Kurtosis 244.3901 8.594553 49.93017 3.764537 84.71289
Jarque-Bera 1900850. 1693.659 75616.39 75.88532 224051.5 Probability 0.000000 0.000000 0.000000 0.000000 0.000000
Sum -7.91E+11 1.19E+10 7893811. 12038.43 561.8100 Sum Sq. Dev. 1.92E+23 2.95E+17 2.34E+11 3462.445 1342.399
Observations 774 774 774 774 774 DAC CSR FSIZE ROA LEV
DAC 1.000000 0.027222 0.012799 -0.238320 0.018559 CSR 0.027222 1.000000 -0.031302 -0.063715 -0.009509
FSIZE 0.012799 -0.031302 1.000000 0.494513 -0.023317 ROA -0.238320 -0.063715 0.494513 1.000000 -0.218350 LEV 0.018559 -0.009509 -0.023317 -0.218350 1.000000
Variance Inflation Factors Date: 07/22/17 Time: 21:33 Sample: 1 780 Included observations: 774
Coefficient Uncentered Centered
Variable Variance VIF VIF C 2.24E+19 75.76446 NA
CSR 780.0857 1.630204 1.004664 FSIZE 1.31E+09 1.797054 1.337031 ROA 9.32E+16 77.56053 1.408210 LEV 1.81E+17 1.383635 1.061251
Heteroskedasticity Test: Breusch-Pagan-Godfrey F-statistic 14.68416 Prob. F(4,769) 0.1100
Obs*R-squared 54.92344 Prob. Chi-Square(4) 0.3100 Scaled explained SS 5964.004 Prob. Chi-Square(4) 0.6400

130
Dependent Variable: DAC Method: Panel LS (Period SUR) Date: 07/22/17 Time: 07:05 Sample: 2002 2015 Periods included: 14 Cross-sections included: 52 Total panel (unbalanced) observations: 723 Linear estimation after one-step weighting matrix
Variable Coefficient Std. Error t-Statistic Prob. C 1.74E+10 1.76E+09 9.868577 0.0000
CSR 5.354799 4.946028 2.082646 0.0293 FSIZE 125185.5 20220.13 6.191133 0.0000 ROA -1.20E+09 1.15E+08 -10.48301 0.0000 LEV -3.36E+08 1.31E+08 -2.566995 0.0105
Weighted Statistics R-squared 0.521954 Mean dependent var -0.059390
Adjusted R-squared 0.517620 S.D. dependent var 0.837270 S.E. of regression 0.740061 Sum squared resid 393.2416 F-statistic 51.20629 Durbin-Watson stat 2.058553 Prob(F-statistic) 0.000000
Unweighted Statistics R-squared 0.063086 Mean dependent var -1.07E+09
Sum squared resid 1.80E+23 Durbin-Watson stat 1.023752
131
Impact of International Financial Reporting Standards (IFRS) Adoption on the Reporting Quality of Manufacturing Companies in Nigeria
Joy Omeghie OSEMWEGIE-ERO
[email protected] 08059325786; 09093304039
Department of Accounting, Benson Idahosa University, GRA, Benin.
And
Lovy Omotie-Ivie, ATARERE [email protected]
08033249177
Department of Business Education, Delta State College of Physical Education, Mosogar. PMB 4088
And
Felix Erhinyoja, ERHIRHIE [email protected]
08032354569
Tax Audit Department, Delta State Board of Internal Revenue _____________________________________________________________________________
ABSTRACT
The study examined the impact of adoption of International Financial Reporting Standards (IFRS) on the financial reporting quality of Nigerian manufacturing companies. Specifically, the study looked at how IFRS adoption influenced earnings predictability, earnings management and value relevance of financial information in a pre and post-IFRS adoption basis. A total of thirty (30) manufacturing companies listed in the Nigerian Stock Exchange (NSE) were sampled from 2008 to 2015 (8 financial years). Descriptive statistics and panel data technique was employed for the analyses with the aid of Eviews 9 computer software. The results show that earnings predictability and value relevance of financial statements of Nigerian manufacturing firms improved in the post-IFRS adoption periods. The study also found that earnings management declined to a lower degree for the sampled companies in the post-IFRS adoption period. Taken all together, the study concludes that IFRS adoption leads to an increase in financial reporting quality of manufacturing firms in Nigeria. The study recommends that, in order to reduce financial disclosure issues which could affect business decision making, government and regulatory bodies of emerging nations should encourage and sustain full implementation of IFRS standards in order to militate against information asymmetry between management and all stakeholders which can be affected by financial statement information.
Key Words:
Earnings; Financial reporting; IFRS adoption; Manufacturing
INTRODUCTION Between 2012 and 2014, Nigeria jettisoned the erstwhile SAS (Statement of Accounting Standards) for the new IFRS (International Financial Reporting Standards) to make companies in Nigeria more attractive for investment and to be abreast with global best practice. This became necessary as, according to Taiwo and Adejare (2014) the widespread adoption of the International Financial Reporting Standards (IFRS) is a necessary condition for effective participation in the global economic space today. Umobong and Akani (2015) assert that the European Union first insisted on member countries’ use of the IFRS to encourage trust on information presented in the financial reports of firms in the Union. Today, IFRS use has become a global standard for financial reporting. The International Organization for Securities Commission (IOSCO) opine that acceptable financial

132
reporting is a key ingredient of an efficient capital market, and therefore its preparation must be compatible with global standards (Stergios, Athanasios & Nikolaos, 2005). The increasing globalization of world trade means that companies can no longer rely solely on their local capital markets for the sourcing of debt and equity capital and so must seek funds globally. This is especially true of emerging economies, such as Nigeria, whose continued survival depend on increase in manufacturing activities. (We regard an emerging economy as one with very high risks and returns and with mostly inadequate market frameworks borne out of its fluid political structures that change constantly). A Manufacturing industry is one that is involved in the production or manufacture of products that bear their trade name. (Okoye, 2000). Such industries usually will have three type of inventory of materials they are: (i) Raw materials which are to be used for production (ii) Work-in-Progress which arc partially completed products at the end of a period and (iii) Finished goods which are the products completely manufactured but which are yet to be sold. Manufacturing industries in most emerging economies are usually unable to compete with the influx of imported goods from developed economies owing to lack of adequate capital and modern tools and infrastructure and so need massive infusion of capital. The use of a globalized system of accounting such as the IFRS is touted to bestow many advantages towards the improvement of financial reporting quality. Among these advantages, according to Aderin and Otakefe (2015), includes: reducing information asymmetry, decreasing earnings management, providing more value relevant financial information and enhancing investors’ ability to predict future performance outcomes of the companies in which they have investments worldwide. However, Ernst and Young, (2014) claim that though the IFRS adoption by emerging economies made popular by the European Union is ostensibly because of their quest to attract foreign capital, there appears to be an implied coercive pressure on them to converge since IFRS adoption is like a passport to acceptance into the global economic world. They argue that in such a situation, many of the emerging economies may not have been structurally ready for IFRS. They may not have the legal, institutional and cultural influence over the firms in their economies to guarantee effective compliance. Abata (2015), quoting Tendeloo and Vanstraelen (2005), assert that incomplete compliance with the requirements of IFRS would produce financial reports that can be unreliable, inconsistent and non-transparent; and if such is depended upon for decision-making, would accelerate business failures. Achim and Chiş (2014) opined that the value of a financial report is in its quality, relevance and usefulness; and according to Adekoya (2014), investors and lenders need such for their predictive and investment decision purposes. Though a flurry of empirical studies into the effect of adoption of IFRS on financial reporting quality have been undertaken in developed nations, their outcomes have been mixed and appear not to give a clear picture of post-adoption quality of financial reports; unfortunately not much of such empirical works have been done in the emerging economies. Hosftede and Hofstede (2010) in Umobong and Akani (2015) opined that the level of institutionalization of capital markets in emerging markets is at variance with those of the developed world and so hinders foreign direct investment (FDI) because it is difficult to compare their organizational performances, much less predict outcomes of investments. Nigeria embarked on the adoption of IFRS between 2012 and 2014, there is need therefore to ascertain whether there has been an improvement in the quality of the financial reports of manufacturing firms in the country; specifically, there is a very real need to ascertain if the goal of a more predictable performance, increased value relevance and higher quality of financial report has been realized with the adoption of IFRS.
Statement of the Research Problem
The preamble and objectives of the IASB expects the beneficial effects from IFRS adoption to include improved transparency and accounting quality as well as reduced cost of capital. Thus, the a priori expectation by developing countries at adoption of IFRS is that it would provoke a greatly improved quality of financial statements in their countries which would in turn improve investment from outside the shores of such adopting countries. Considering that IFRS implementation was touted to enhance financial and earnings quality by lowering earnings management, increasing the value relevance financial information as well as earnings predictability; it becomes imperative, for

133
the benefit of the stakeholders, to empirically ascertain the extent to which the adoption of the standards have fared in achieving these core objectives with regards to the three (3) aforementioned variables. In developed economies where the adoption has taken place, a handful of empirical studies have been undertaken in recent times (see Nulla, 2014; Mikova, 2014; Telmo, 2015; and Masoud & Ntim, 2017). However, their results were largely mixed and conflicting as to the effect of IFRS on financial reporting quality. For example, while the former (Nulla, 2014) found an increase in earnings quality and value relevance under IFRS regime in Canada, Mikova (2014) found out that IFRS do not increase reporting quality in European companies. On the other hand, while Telmo (2015) find that stock returns exhibit significant reduction in their predictive power about future earnings during IFRS regime; the recent study of Masoud & Ntim (2017) find significant improvements in post IFRS earnings predictability in Jordan. In developing economies such as Nigeria, very little research work exists in this regards especially in the post IFRS adoption era (e.g. Ironkwe & Oglekwu, 2016; Jinadu, Oluwafemi & Soyinka, 2016; Umobong, 2015; Ibiamke & Ateboh-Briggs, 2014; Zayyad, Ahmad & Mubaraq, 2014). The outcomes of these existing ones were equally conflicting just like in developed economies. For example, while Jinadu et al (2016) find that IFRS adoption enhanced credible and qualitative financial statements among Nigerian firms; Ironkwe & Oglekwu (2016), Umobong (2015), Zayyad et al (2014); and Ibiamke & Ateboh-Briggs (2014) did not find any relationship between IFRS adoption and earnings of Nigerian listed firms. It is on this premise that this study attempts to bridge the gap by examining how the adoption of IFRS has affected the quality of financial reports of manufacturing companies in Nigeria - using reporting quality measures such as earnings predictability, value relevance and earnings management. The study searches for answers to the following research questions: 1.) how does the adoption of IFRS enhances the earnings predictability of manufacturing companies? 2.) How does value relevance of financial reports amongst manufacturing companies in Nigeria improve after IFRS adoption? 3.) How does IFRS adoption impact on earnings management of manufacturing companies in Nigeria? The aim of this study is to assess the impact of the adoption of IFRS on the quality of financial reports in Nigeria. While the specifics include to: 1.) Determine if the adoption of IFRS enhances the earnings predictability of manufacturing companies in Nigeria. 2.) Ascertain if the value relevance of financial reports amongst manufacturing companies in Nigeria improved significantly as a result of IFRS adoption. 3.) Examine the impact of IFRS adoption on earnings management of manufacturing companies in Nigeria. The study limits itself to listed companies in the manufacturing sector from 2008 to 2015. It is expected that the results will be useful to provide the governments of emerging economies, their legal and professional institutes, and other policy makers with important information on the impact of compliance with international best practice. LITERATURE REVIEW
This section reviews the literature of IFRS adoption and accounting information reporting quality. It also presents the conceptual, empirical and theoretical underpinning of the study.
CONCEPTUAL REVIEW
International Financial Reporting Standards (IFRS)
The management of corporate organizations uses financial statements’ disclosures to attest to the accuracy and validity of reported financial information. They are, however, mandated to disclose certain information regarding the company in order to fulfil the requirements of regulatory bodies. In Nigeria, the information disclosure requirements under the previous NGAAP were adjudged to be grossly inadequate to effectively reconcile the information inequality between companies and the users of the financial statements, hence the need for IFRS.

134
International Financial Reporting Standards (IFRSs) are standards, interpretations and the framework issued by international accounting standards (IAS) guiding the preparation of accounting reports. They are a set of principles-based, high-quality, understandable standards for general purpose financial reporting; designed to encourage professional judgment and discourage over-reliance on detailed rules. Stergios, Athanasios and Nikolaos (2005) assert that the fight for a world-wide convergence of accounting practice which has been on since the early 1970s has been encouraged mainly by the believe that it would lead to the reduction of investment risks and cost of capital in the entire world, the lowering of costs from multiple reporting, the elimination of confusion arising from different accounting measures used in different countries which often necessitates translation of accounts into languages and formats understandable to would-be investors; and the encouragement of international investment and allocation of international profits more efficiently. The period of IFRS requires companies to make more disclosures in order to achieve the financial statements’ objective, which is to show a true and fair view of a company’s activities. It aims to achieve three main objectives: to help 1) standardize the diverse accounting policies and eliminate the incomparability of financial statements within an entity and across entities; 2) facilitate the presentation of high quality, transparent and comparable information in financial statements; and 3) reduce the accounting alternatives available and thereby eliminate the element of subjectivity in financial statements which is usually exploited for manipulated reports. For this to be possible, the financial report must have high accounting and reporting quality. It is therefore expected that the companies will disclose more of their financial information with the introduction, adoption and implementation of IFRS.
Financial Reporting Quality (FRQ)
The issue of what constitutes the quality of financial information has been on the front burner of research activities since the global adoption of IFRS. Nobes and Stadler (2014) explains this is so because, according to critics, for millennia, accounting was practiced without a perceived need for a conceptual framework that sets out relevant objectives, definitions and concepts of quality; this only became an important requirement for inclusion financial regulations with the formation of American Institute of Certified public Accountants in 1959 when the issue of quality was accorded its deserved place. Not surprising therefore, what constitutes quality of reports is still greatly user-dependent. Quality of an object depends on the characteristics of the object concerning its ability to satisfy established and prospective requirements; and for Biddle et al (2009) in Achim and Chis (2014) (one which the writer adopts), accounting quality refers to the precision with which the financial reports convey information to equity investors about the firm’s expected cash-flows, while reporting quality is the extent to which financial reports of a company communicate its underlying economic state and its performance during the period of measurement. Narrowing it down to the field of accounting, Ewert and Wagenhoper, (2005) in van Beest, Braam and Boelens (2009) opined that quality is the product of an accounting system that reflects an unobservable construct which inherently involves estimations and judgements and thus has the potential for unintentional errors and intentional bias; and which leads to the varied interpretations of quality and mixed results emanating from empirical search being undertaken. Barth, Landsman, and Lang (2008) assert that quality also links to the relevance of the information; that is, the ability of constituents of accounting measured to reflect the economic position and performance of a firm. Umobong and Akani (2015) citing Watts (2003) insist that the information would not be relevant to intended users if it is not reliable; that is, having an embedded ability capable of protecting investors and other stakeholders against opportunistic behaviour of management. Thus, Verleun, Georgakopoulos, Sotiropoulos and Vasileiou (2011) stated that there is an inherent problem in financial information quality as it has to be both reliable and relevant for the users in comparing and predicting future performance of the firms they are interested in. For similarity to occur in different reports therefore, they must be transparent in the sense of been reliable, relevant, timely, understandable, and so on. The Framework (IASB, 2010) asserts that quality is bestowed on a financial report by two sets of items - fundamental and enhancing characteristics which are made up of both financial and non-financial information concerning the activities of the reporting entity, useful for decision-making. Attributes of accounting quality, according to Verleun, Georgakopoulos, Sotiropoulos and Vasileiou (2011) are of two types - accounting-based and market-based. The accounting-based attributes are

135
those characteristics of accounting numbers (like understandability, relevance, reliability and comparability) which are influenced only by how the recognition and measurement principles are used; that is, how the book values of line items are incorporated into the financial statements. Where the accounting-based information is of high level, the numbers shown in the financial report would be highly reliable and would closely reflect the facts of the underlying phenomena they represent. The items that have to do with accounting–based attributes include accruals quality, persistence of earnings, and predictability of earnings etc. One function of earning is the allocation of cash flows into the various accounting periods using accruals. Verleun et al. (2011) insists that market values do not affect the measurement of the accounting-based elements; so the level of disclosures concerning them does not affect the quality of financial information reported. However another function of earning, which also depicts accounting quality (the reflection of economic income as represented by market returns), relating to the mode of measurement, affects the disclosure and quality of information put in financial reports. Market-based accounting quality relates the accounting numbers to the market numbers (such as returns and/or prices) and hence the value relevance of accounting numbers. These are the aspect of accounting quality, according to Verleun et al (2011) which is important to would-be investors when they are comparing financial reports and using them to predict future outcomes of their investments. Financial Reporting Quality constructs and measures
Several definitions have been used to describe financial reporting quality in literature. More often, high quality financial reports are assumed to be that which is of high value relevance and less earnings management which ultimately leads to more persistence and higher earnings quality. On the other hand, financial information that can be useful in predicting future earnings can also be viewed to be of high quality. In literature and prior researches (Defond and Jiambalvo 1994 in Umobong &Akani 2015; Dechow and Dichev 2001), three categories of financial reporting quality measures are widely used to assess the accounting quality of listed firms. These reporting quality measures include earnings management, predictability and value relevance. This study adopts three (3) of such measures to proxy financial reporting quality of quoted manufacturing companies sampled in the study. Figure 2.1 below shows the reporting quality proxies adopted in a conceptual framework.
Earnings Predictability and measurement
Predictability can be defined as the ability of current earnings to predict future earnings and cash flows from operations. Current and also previous earnings are the input to forecasting the future earnings/cash flows. Financial information that has high predictive value is one that is able to highlight the firm’s ability to generate future cash flows based on its current activities and outlined future plans. Predictive value is considered the most important indicator of relevance to investors of a financial report as increase in earnings from investment is the primary goal of investment. Indicators of the predictiveness of information (Beest et al, 2009) are: i) the extent to which annual reports provides forward-looking statements. ii) extent of disclosures of information on business opportunities and risks; and iii) the use of fair values in financial report by the company. Brown (2001) in Beest et al (2009) indicated that improvement in the precision of information is influenced by the length of usage of IFRS (learning effect), and the significant difference between
136
the local GAAP and the IFRS, (Byard et al, 2001, in Beest et al, 2009). Where market prices are found to follow earnings, such can be taken as the earning being able to predict the prices (i.e., changes in earnings will affect the market prices). The higher the explanatory power of the earnings, the more value relevant the earnings were. Nulla (2014) citing Penman (2007) stated that the quality of earnings was based on the earnings persistency, and predictive ability of the earnings. The view was that earnings were to be of high quality when the firm’s past earnings were strongly associated with its future earnings. The Framework (2010) asserts that information that is relevant to the user of the financial report help in the predictability of future earnings and the confirmation of past results. Such can only be the case of there if the information process is transparent. Relevancy of the information is its ability to make a difference to the decision of the investor. Such differences expected as a result of its predictability related to: a) Dividend earned by equity holders; b) Discretionary accruals levels; c) Book value of equity’s influence on the share price of equity in the market; d) Goodwill valuation; e) Research and development; and e) Assets and expenses revaluation. In terms of earnings predictability measurement, the adopted the method of Dechow et al. (2010) as cited in Hai (2014) where a simple model specification was used to capture earnings persistence: Earningsi,t + 1 = β0 + β1Earningsi,t + ei,t………………………….(1) Where: Earningsi,t (current earnings) is net income before extraordinary items of company i in year t scaled by total assets. A higher β1 (i.e. the coefficient value) indicates a more persistent earnings stream while values close to zero (lower values) reflect transitory earnings. Then, the adjusted R2 from the regression output is interpreted as earnings predictability. Large (small) values of predictability suggest more (less) predictable earnings and vice versa.
Value Relevance and measurement
The adoption of IFRS adoption was generally admonished owing to the seeming assurance that it promotes fair value accounting which inadvertently weakens the link between taxation and accounting rules. As such, it is anticipated that earnings and book value would automatically become more value relevant in the post-IFRS adoption regime. Value relevance can be determined by measuring the association between income variables such as earnings per share (EPS) and market price per share. Value relevance researches are aimed at measuring whether accounting numbers presented in financial reports has the ability to capture or summarize information that brought significant influence on market share price or stock returns (Beisland, 2009 in Mulenga, 2016). According to Lang (1991) in Warfield and Wild (1992), it is proven that the stock prices can be explained as a multiple of earnings. Thus, market prices follow earnings, i.e. changes in earnings will affect the market prices. The higher the explanatory power of the earnings, the more value relevant the earnings are. Since more value relevant earnings would describe the firm’s asset price more accurately, earnings and accounting information are judged to be of high quality when they are value relevant. Warfield and Wild (1992) suggests that the market returns should lead annual earnings and have a predictive power over the investors. If earnings have a greater predictive power under IFRS, they should be anticipated much more before the release of the annual report under IFRS than under the previous national GAAP. Another dimension to the value relevance construct is the incremental association studies which basically investigate usefulness of accounting information in influencing market values (market returns) given other specified variables (Mohamed & Lode, 2015 in Ironkwe & Oglekwu 2016). By using this category, the accounting variable is measured to be relevant by using estimated coefficient from the regression, if the estimated value of coefficient is found to be statistical significantly different from zero, the accounting variable would be considered to be more relevant. Conclusively, it can be said that several measures of value relevance exist. However, for the sake of this study, the method employed by Hai (2014) and Aderin and Otakefe (2015) was re-modified to suite the study. The study of Aderin and Otakefe (2015) investigated the association between IFRS adoption and reporting quality using market value as proxy for value relevance. Thus, our value relevance model is represented below: MVi,t = β0 + β1EPSi,t + β2BVEi,t + β3NOSHi,t + μi,t...............................(2)

137
where: stock price, MV, is a function of net income before extraordinary items per share, EPS; book value of equity, BVE, and number of outstanding shares, NOSH. The value relevance measure can thus be taken as the adjusted R2 value from the above equation. Higher value of the adjusted R2 indicates that earnings is more value relevant and vice versa. Earnings Management (Discretionary Accruals) and measurement
A recent definition of earnings management as formulated by Stolowy and Breton (2004) and cited in Verleun, Georgakopoulos, Sotiropoulos and Vasileiou (2011) described earnings management as the use of management’s discretion to make accounting choices or to design transactions so as to affect the possibilities of wealth transfer between the company and society, funds providers or managers. This implies that management can make accounting decisions or choices that can affect the quality of financial statement information either positively or negatively. However, the introduction of the IFRS is believed to have reduced the flexibility of accounting choices in the preparation of financial statements (Aderin & Otakefe, 2015). The more stringent measures in the application of IFRS therefore caused a wide assumption that the use of the standards would inadvertently lead to decreases in the propensity for earnings management. Most previous studies such as Athanasios, Antonios, Ioannis & Stergios (2013); Aderin & Otakefe (2015) have found evidence that IFRS implementation contributed significantly to lower earnings management than in previous local GAAP. In terms of measurement, the most widely used construct to measure earnings quality is through the discretionary accruals model otherwise known as the Jones (1991) model – where total accruals (measured as difference between net income before extraordinary items and cash flows from operations) are deducted from non-discretional accruals. A high level of discretionary accruals implies higher chance or degree of earnings management and consequently lower earnings quality and vice versa. However, for the sake of this study, the discretionary accrual model employed by Aderin and Otakefe (2015) was adapted where the adjusted R-squared of the discretionary accrual model is used as a benchmark: DACCRi,t = β0+ β1REVi,t + β2PPEi,t + β3WCi,t + β4EBITi,t + Ut.........................(3) Where discretionary accruals, DACCR< is a function of revenue, REV, property-plant-equipment, PPE, current asset less current liability, WC, and earnings before income and tax, EBIT. Lower values signify less earnings management and implicationally, higher reporting quality, and vice versa.
Empirical Review
Sanyaolu, Iyoha and Ojeka (2017) investigated the effect of IFRS adoption on the earning yield and earnings per share of quoted banks in Nigeria for a period of 6 years ranging from 2009 to 2014. The applied the panel ordinary least method of analysis and found a significant and positive relationship between IFRS adoption and the EY of quoted banks in Nigeria. Their result also finds a significant and positive relationship between IFRS adoption and EPS of quoted banks in Nigeria. Masoud and Ntim (2017) assessed the effect of the adoption of IFRS on the ability of financial analysts to forecast earnings accurately in Jordan listed companies during the period 2002–2013. They also used the panel data regression model to validate and test the hypotheses formulated in their study. Their findings show that mandatory IFRS adoption has caused significant improvements in earnings predictability (the ability of analysts to forecast earnings) among Jordan companies. Scholer (n.d.) in Sanyaolu, Iyoha and Ojeka (2017) investigated the comparability of companies’ IFRS-based presented financial information worldwide, using data for over 18,000 non-financial and non-insurance companies from the ORBIS-database who posted turnovers of over a US$100m from 124 countries. Results indicated comparability financial reports was very significantly affected key financial ratios in the different countries and geographic regions. The research concluded that irrespective of the accounting standards used, comparability would greatly depend on factors outside those anticipated by the Framework. Cascino and Gassen (2015) in Masoud, & Ntim (2017) investigated the effects of mandatory IFRS adoption on the comparability of financial accounting information among German and Italian firms. Proxies used related to firm, regional and country-related characteristics as well and the degree of

138
information transfer. Research was based on primary data sourced from sampled firms. Results indicated, amongst others, that only firms with high compliance incentives experienced substantial increases in comparability; indications were also that countries with strict enforcement mechanisms showed greater financial reporting comparability. Nulla (2014) undertook an empirical study of the comparative and predictive effect of mandatory IFRS adoption on pre and post adoption financial reports in Canada. The study used the quantitative research method and used earning as the proxy. It found that earnings quality improved and was more value relevant to shareholders post adoption; and cashflow was more predictable, just as reduced income smoothening activities was indicated. The book value post adoption was however less relevant.
Onalo, Lizam and Kaseri (2014) in Masoud & Ntim (2017) studied the adoption of IFRS in Nigerian banks to ascertain if it is associated with higher financial reporting quality. A total of twenty Nigeria banks were used and the study covered a six-year period. The study measured quality based on a change in earnings management, timeliness of loss recognition and value relevance. Results suggested that IFRS adoption is associated with minimal earnings management, timely recognition of losses, and a high value relevance of accounting information; thus concluding that IFRS adoption engendered higher quality of banks’ financial statement information compared with the regime of local Nigerian-GAAP and so recommended it for global adoption. Rathke, Santana, Lourenço and Dalmacio (2016) in Sanyaolu et al (2017) studied the level of earnings management in Latin America after the adoption of IFRS and the role of cross-listing in the United States. The results revealed that Latin American firms did not experience higher quality of accounting information as there was a higher level of earnings management post adoption, even when only global players with cross-listing in the United States were analyzed. The results indicated that countries-specific characteristics impact on quality of financial reports - be they prepared under local GAAP or IFRS.
Brochet, Jagolinzer and Riedl (2012) in Umobong (2015) examined the effect of mandatory adoption of IFRS for financial reporting on capital market and to ascertain if adoption has led to greater financial report comparability and better precision of firms’ information owing to changes in specific firm core information. They found a marked reduction in abnormal returns, indicating a reduction in the ability of insiders to exploit private information for personal gain and hence a better comparability and predictability of financial results. Based on the literature, the following null hypotheses guided the study: H01: IFRS has no significant impact on the earnings predictability of quoted manufacturing companies in Nigeria. H02: IFRS has no significant effect on the value relevance and book values of quoted manufacturing companies in Nigeria. H03: IFRS adoption has no significant impact on the earnings management of quoted manufacturing companies in Nigeria.
Theoretical Framework
The work is predicated on the economic theory of networks propounded by in Katz and Shapiro (1985) in Ramanna and Sletten (2009). The school of thought behind the theory is based on the assumption that individuals or corporate entities always make prudent and logical decisions that would guarantee greater benefit or satisfaction given the choices available. In that vein, the rationality concept explains that a company will not introduce an accounting standard if its introduction will make it worse off (Emeni, 2014).This suffices to mean that a company will introduce IFRS if its benefits will exceed the NG-GAAP. The rational choice theory implies that a company will determine the possible costs and benefits of any action before making decision of what to do (Scott, 2000). The rational choice theory analyses the actions and behaviour of an individual or a company as rational in order to maximize one's utility (Munch, 2002). Rational choice theory attempts to explain why people or companies introduce IFRS or make do with their domestic accounting standard. In relating the rational choice theory to economic benefits to be derived by a company on IFRS introduction, proponents of IFRS (Li, 2010; Barth, Landsman & Lang, 2008) argue

139
that the standards reduce information costs to an economy, as it will be cheaper for capital market participants to be familiar with one set of global standards.
METHODOLOGY
The study is descriptive and follows the cross sectional research technique due to the nature of the data. Secondary source of data was adopted for the purpose of empirical analysis. The manufacturing companies listed in the Nigerian Stock Exchange (NSE) formed the population of the study. A total of thirty (30) companies in that category were purposively selected as the sample size. The sole criterion for selection was based on data availability for the entire period studied. The data were extracted from the audited annual financial reports of the 30 manufacturing companies from 2008 to 2015 (i.e. 4yrs before IFRS adoption and 4yrs after). Consistent with most current post-IFRS adoption studies (see Sanyaolu et al 2017 and Masoud & Ntim, 2017) the researcher employed a balance panel data analysis approach in testing the hypothesized effect of IFRS adoption on financial reporting quality of Nigerian manufacturing companies. Descriptive statistics was used to analyze the sample characteristics on a pre and post IFRS adoption basis. The Eviews 9.5 econometrics software package was used for the analysis. The study used three (3) proxies (earnings predictability, discretionary accruals and value relevance) to capture reporting quality on a pre and post-IFRS basis. Consequently, three (3) mathematical equations modified from Aderin & Otakefe (2015) are utilized to capture the changes among the variables over the two (pre and post) periods. Model 1 captures the proxy for earnings predictability. Model 2 captures the value relevance proxy which was measured by the adjusted R2 of the firm value model. Model 3 captures the discretionary accrual proxy (i.e. earnings management). The models are specified in econometric form below: Model 1
(Pre-IFRS) Earningsi,t + 1 = β0 + β1Earningsi,t + ei,t………………………….(4) TA TA (Post-IFRS) Earningsi,t + 1 = β0 + β1Earningsi,t + ei,t………………………….(5) TA TA Model 2
(Pre-IFRS) MVi,t = ϒ0 + ϒ1EPSi,t + ϒ2BVEi,t + ϒ3NOSHi,t + μi,t...............................(6) (Post-IFRS) MVi,t = ϒ0 + ϒ1EPSi,t + ϒ2BVEi,t + ϒ3NOSHi,t + μi,t...............................(7) Model 3
(Pre-IFRS) DACCRi,t = α0+ α1∆REVi,t + α2PPEi,t + α3WCi,t + α4EBITi,t + Ui,t....................(8) (Post-IFRS) DACCRi,t = α0+ α1∆REVi,t + α2PPEi,t + α3WCi,t + α4EBITi,t + Ui,t...................(9) Where: β0, ϒ0, and α0 = Constants β1, and β2; ϒ1, - ϒ3; and α1 – α4 = Coefficients of the estimates Earningsi,t + 1 = Current earnings of company i in year t Earningsi,t = Previous earnings of company i in year t TA = Total Assets of company i in year t MVi,t = Market Value (proxied with share price) of company i in year t EPSi,t = Earnings per Share of company i in year t BVEi,t = Book Value of Equity of company i in year t NOSHi,t = Number of Ordinary Shares of company i in year t DACCRi,t = Discretionary Accruals of company i in year t ∆REVi,t = Change in Revenue of company i in year t PPEi,t = Property, Plant and Equipment of company i in year t WCi,t = Working Capital of company i in year t EBITi,t = Profit before Interest and Tax of company i in year t μi,t = error term
EMPIRICAL RESULTS AND DISCUSSIONS
This section presents the analysis of the secondary data used for the study as extracted from the audited annual financial reports of 30 listed manufacturing companies in Nigeria. Table 1 displays the descriptive statistics of the variables used in the analysis on a pre and post basis.

140
Table 1 Descriptive Statistics
Mean Max Min
Std.
Dev. Skewness
Jarque-
Bera Prob. Obs
DACCR Pre -3.506079 1.852436 -70.70171 7.188644 -7.433358 21149.53 0.000 120
Post -4.293775 4.684829 -192.7831 17.53092 -10.49582 62982.82 0.000 120
EBIT
Pre
6616879. 1.11E+08 -
12469073 14259003 4.188103 3292.000 0.000 120
Post
9512598. 2.06E+08 -
12466208 23808144 5.394490 7805.956 0.000 120
EPS Pre 129.6828 1216.000 -551 271.0650 1.240325 89.16832 0.000 120
Post 178.7917 995.0000 -5539 587.7635 -7.626805 27850.23 0.000 120
PAT
Pre
4588657. 1.10E+08 -
12795595 12053321 6.064944 12390.31 0.000 120
Post
9086583. 4.31E+08 -
12679305 40190932 9.775735 51670.51 0.000 120
PPE Pre 35722554 1.50E+09 3198.000 1.39E+08 9.981028 54832.61 0.000 120
Post 50127207 4.02E+08 6934.000 86083602 2.731683 400.3075 0.000 120
REV Pre 45213862 3.88E+08 -462919 64766796 2.429096 373.6297 0.000 120
Post 70106283 1.01E+09 2764.000 1.29E+08 4.154600 3032.828 0.000 120
SP Pre 761.0718 36855.00 2.140000 3471.718 9.621219 48261.17 0.000 120
Post 371.3450 2866.000 3.000000 417.4398 3.255718 1231.913 0.000 120
TA Pre 54768513 1.66E+09 9876.000 1.58E+08 8.850147 39018.60 0.000 120
Post 62659139 4.20E+08 8188.000 90926796 2.289807 216.2952 0.000 120
Source: Researchers Computation (2017) From table 1, the sample mean of discretionary accruals (DACCR) displayed a lower value in the post-IFRS era suggesting the degree of earnings management among the sampled companies were marginally higher before the standard adoption. The sample means of the variables of EBIT and EPS were both higher in the post adoption period within the period studied, even though the variability margin was not high owing to the minimum and maximum values. The average stock price of all the companies utilized stood at 761.07 and 371.35 in the pre and post periods respectively. This suggests that when pooled together, the average stock prices of the sampled firms did not increase in post IFRS era. However, the mean values of both periods were positively skewed showing that that stock market annual returns during the period are tailed to right side. Apart from the discretionary accrual variable, all the other variables utilised (PAT, PPE, REV, and TA) maintained positive averages and were all higher during the post-IFRS period (excluding stock price and discretionary accrual). Also, the Jarque-Bera values of the entire variables included in the 120 observations were all large suggesting normally distributed observations.
Analysis of Regression Results
Towards achieving the objectives of this study, the three hypotheses formulated and stated in the last section, are tested in this sub-section using the regression analysis technique. Considering the nature of the models, the three dependent variables (earnings, market value and discretionary accrual) were designed to capture predictability, value relevance and earnings management respectively. The other independent variable cumulatively defines the degree of variations in the reporting quality proxies within the period studies. The extent of these variations were explained or determined by the fluctuations in the forecasting power of the models, represented by the adjusted R-squared statistics.
Model One: Predictability (Pre & Post)
Dependent Variable: Earnings Method: Panel Least Squares Periods included: 4 each (i.e. 2008–2011=Pre; 2012-2015=Post)

141
Cross-sections included: 30 each Total panel (balanced) observations: 120 each Pre-IFRS Post-IFRS
Variabl
es
Coefficien
t
t-
Statistic
Prob. Variable
s
Coefficien
t
t-
Statistic
Prob.
C 0.169000 4.077170 0.0001 C 0.113743 0.971150 0.3335 EARNP 0.010620 0.555776 0.5794 EARNP 0.558548 4.243734 0.0000
R2
Adjusted R2
F-stat (p-value)
Durbin Watson
0.003 -0.006 0.31(0.58) 2.428
R2
Adjusted R2
F-stat (p-value)
Durbin Watson
0.132 0.125 18.0(0.000) 1.002
Source: Researcher’s Computation (2017)
H1: IFRS has no significant impact on the earnings predictability of quoted
manufacturing companies in Nigeria.
In analysing hypothesis one, the regression result for the model 1 in table 2 which shows the corresponding output for pre (2008-2011) and post (2012-2015) IFRS adoption periods was used. In line with the rule of the predictability model, the major focus here is the coefficient value (β1) and the adjusted R2 value. The former measures earnings persistence while the latter is used to capture earnings predictability. Based on the result, the β1 for the pre-IFRS model (0.01062) is lower than that of the post-IFRS period (0.5585) indicating a more persistent earnings stream during the post-IFRS period. Also, the F-statistic value for the pre-IFRS model stood at 0.31 while that for post-IFRS was 18.0. When compared with the overall critical p-value of 0.58 and 0.0001 of both models respectively, it shows that the result of the pre-IFRS model is not statistically significant at the 5% and 10% respectively while that of post-IFRS model is significant at 1% level of confidence. On predictability, it was found that there was significant increase in the adjusted R2 value in post-IFRS model (0.125) when compared with that of the pre-IFRS period (-0.006). Hence, the application of IFRS is associated with higher predictable earnings in the post-IFRS adoption periods. The empirical evidence appears to coincide with the recent study of Masoud & Ntim (2017) which investigated the effect of the mandatory adoption of International Financial Reporting Standards (IFRS) on the earnings predictability in Jordan within 2002–2013 and found evidence that after the mandatory IFRS adoption led to significant improvements in the ability of analysts to forecast future earnings in Jordan listed companies. The result also corroborates the findings of Nulla (2014) who found that IFRS implementation has increased increase in persistency and predictability in earnings of Canadian firms in the post adoption period.

142
Model Two: Value Relevance (Pre & Post)
Dependent Variable: Market Value Method: Panel Least Squares Periods included: 4 each (i.e. 2008–2011=Pre; 2012-2015=Post) Cross-sections included: 30 each Total panel (balanced) observations: 120 each Pre-IFRS Post-IFRS
Variabl
es
Coefficien
t
t-
Statistic
Prob. Variabl
es
Coefficient t-Statistic Prob.
C 410.3966 7.815728 0.0000 C 524.6107 1.216880 0.2261 EPS -0.009314 -0.136552 0.8916 EPS 4.312721 3.609887 0.0005 BVE -2.15E-07 -0.257254 0.7974 BVE -7.91E-06 -0.622138 0.5351
NOSH -9.07E-08 -1.419672 0.1584 NOSH -4.87E-07 -0.818409 0.4148 R2
Adjusted R2
F-stat (p-value)
Durbin Watson
0.018 -0.008 0.70(0.56) 1.416
R2
Adjusted R2
F-stat (p-value)
Durbin Watson
0.106 0.083 4.60(0.004) 2.45
Source: Researcher’s Computation (2017) H2: IFRS has no significant effect on the value relevance and book values of quoted
manufacturing companies in Nigeria.
The result of the model 2 (value relevance pre and post IFRS adoption) as presented in table 3 shows that the adjusted R- squared for pre-IFRS model is -0.008 and that of post-IFRS is 0.106. These values are quite low implying that only a little proportion of the variance in the dependent variable is explained by the model. The F- statistics values for the periods are 0.70 (pre) and 4.60 (post) respectively. The former is less than the 5 percent critical level while the latter (post) is greater than 5 percent. This means that the pre-adoption model has no good overall significance while the post-IFRS model was statistically significant in explaining the variation in value relevance proxy. More so, based on the adjusted R2 values where about 10.6% of the total systematic variations in the value relevance proxy was explained by a combination of EPS, BVE and NOSH taken together, while that of the pre-IFRS model (using same independent variables) showed a negative R2 value (suggesting a lack of explanatory power for the pre-IFRS model during the period); it means that value relevance in the post IFRS period improved significantly when compared with the pre adoption era. Thus, the alternate hypothesis cannot be rejected which implies that there is an increase in the value relevance of the financial statements prepared by the manufacturing firms after the implementation of IFRS. This empirical result is in line with the findings of Nulla (2014) who find that accounting information in the financial reports of Canadian firms became more value relevant after IFRS application. The result also supports Aderin and Otakefe (2015) and Jinadu et al (2016) who, using data from selected service companies in the Nigerian Stock Exchange, found that adoption of IFRS in Nigeria has led to significant improvements in the value relevance of financial information of listed companies. However, the result appears to contradict the prior studies of Garanina and Kormiltseva (2013) which find no evidence of increased value relevance of accounting information as a result of standard adoption. This may be attributed to geographical differences and timing which can cause variations in empirical findings.
Model Three: Earnings Management (Pre & Post)
Dependent Variable: Discretionary Accruals Method: Panel Least Squares Periods included: 4 each (i.e. 2008–2011=Pre; 2012-2015=Post) Cross-sections included: 30 each

143
Total panel (balanced) observations: 120 each Pre-IFRS Post-IFRS
Varia
bles
Coefficien
t
t-Statistic Prob. Variabl
es
Coefficien
t
t-
Statistic
Prob.
C -1.985927 -4.861714 0.0000 C -3.381487 -7.543442 0.0000 REV -1.37E-08 -1.960754 0.0523 REV -1.54E-09 -0.250855 0.8024 PPE 1.07E-08 1.202177 0.2318 PPE 4.27E-09 1.463108 0.1462 WC -2.74E-07 -49.38679 0.0000 WC -8.62E-08 -16.42851 0.0000 EBIT 6.86E-08 3.052490 0.0028 EBIT 2.82E-08 2.376921 0.0191
R2
Adjusted R2
F-stat (p-value)
Durbin Watson
0.955 0.954 611.(0.00) 1.461
R2
Adjusted R2
F-stat (p-value)
Durbin Watson
0.708 0.698 69.78(0.000) 1.754
Source: Researcher’s Computation (2017)
H3: IFRS adoption has no significant impact on the earnings management of quoted
manufacturing companies in Nigeria.
The test for hypothesis three is based on results from model 3 (earnings management models pre and post IFRS) as presented in table 4 above. The F-statistics of both model stood at 611.0 (pre) and 69.78 (post) which are both greater than 5 percent. The overall p-value was equally significant at 1% meaning that the independent variables are able to significantly explain the variance in the dependent variable (DACCR). On the other hand, the adjusted R2 statistics of the pre-IFRS model indicates that about 95.5% of the total systematic variations in the discretionary accrual levels (proxy for earnings management practices), of the manufacturing companies are explained by changes in REV, PPE, WC and EBIT. Using same independent variables, the adjusted R-squared decreased to 0.708 (70.8%) in the post-IFRS period (2012 – 2015). This shows that both models have high explanatory powers. However, the astronomical decrease in the R2 of the post-IFRS period model did not go unnoticed. This implies that the adoption of IFRS most likely led to a decrease in the level of earnings management practices by Nigerian manufacturing companies during the period studied, prompting the acceptance of the alternate hypothesis three as stated. The finding of most previous researchers such as Mikova (2014) and Aderin and Otakefe (2015), who found empirical evidence that earnings management did not decline after IFRS adoption, validates our result on hypothesis three.
Table 5 Summary of Hypotheses Testing
Measure of FRQ Pre-IFRS R2 Post-IFRS R2 Decision Impact on FRQ
Earnings Predictability -0.6% 12.5% Reject H0 Accept H1 Enhances FRQ
Value Relevance -0.8% 8.3% Reject H0
Accept H2 Enhances FRQ
Earnings Management 95.4% 69.8% Reject H0
Accept H3 Enhances FRQ Source: Researchers Computation (2017) Where: FRQ = Financial Reporting Quality
In line with the summary of results concerning each of the three hypotheses of the study, all the financial reporting quality proxies (earnings predictability, value relevance and earnings management) adopted are linked to an increased quality of financial reporting for the period covered.
CONCLUSION
This study was motivated by the need to unearth how effective and successful the adoption of IFRS has fared in achieving its basic tenets and objectives, especially as regards to improving the quality of financial reporting of adopters. To achieve this objective, the study sampled a total of thirty (30) manufacturing companies listed in the NSE during the period 2008 – 2015. The study used accounting numbers from the annual report of the sampled companies based on three comparisons

144
of financial reporting quality proxies - earnings predictability, value relevance and earnings management. In a three model-based regression analysis, designed on a pre and post IFRS adoption basis, it was found that producing financial statements under IFRS leads to increased earnings predictability and enhanced value relevance of financial information. The regression analyses also suggest that there is likelihood of less earnings management under the IFRS period, which is an indication of higher quality of financial report. Overall, the result supports the debate that IFRS implementation and the improvement of financial reporting quality moves in the same positive direction. Thus, IFRS impacts on the reporting quality of its adopters positively. Implicationally, the results show that IFRS impacts on the financial statement and its effect is positive therefore, the argument that IFRS adoption have no special shield that will protect financial information from being skewed cannot be disregarded.
Policy Recommendations
Based on the empirical findings, the study recommends that: a. IFRS adoption and full implementation should be encouraged by government and regulators
especially in emerging nations as it will militate against information asymmetry between management and all stakeholders which can be affected by financial statement information. This will go a long way in reducing the financial disclosure issues that could affect business decision making.
b. For Nigerian corporations to sustain the benefits of IFRS adoption on a long-run, there is need for an increased number of qualified and IFRS-certified Accountants and Auditors in the practice. The relevant accounting bodies should aggressively intensify its IFRS training and re-training of existing members and encourage new entrances.
Suggestion for Further Studies
a. Future research studies can examine include industry type (financial and non-financial) as a moderator variable to ascertain whether or not the effects of IFRS adoption on reporting quality may differ significantly as a result of industry type.
b. Further studies can also try out other measures and constructs of financial reporting quality not used in most previous studies to see if it could have effect on the outcome.
c. It is also suggested that future studies should incorporate more sectors and or increase the sample size in order to enhance the generalization possibilities.

145
REFERENCES
Abata, M. A. (2015). Impact of international financial reporting standards adoption on financial reporting practices in Nigerian Banking Sector. Journal of Policy and Development Studies, 9(2), 121-130.
Achim, A. M., & Chiş, A. O. (2014). Financial accounting quality and its defining characteristics. SEA
- Practical Application of Science, 2(5), 24-32. Adekoya, O. (2014). Optimizing the Benefits of International Financial Reporting Standards
Transition in Nigeria. [email protected]. Aderin, A., & Otakefe, J.P. (2015). International financial reporting standards and financial reporting
quality in Nigeria. Journal of Science and Technology, 35(3), 73-83. Athanasios, V., Antonios, S., Ioannis, S. & Stergios, A. (2013). The effect of the IFRS on
intercompany transactions: The case of the Greek food-beverage sector. Procedia Technology, 8(1), 360-370.
Barth, M., Landsman, W., & Lang, M. (2008). International accounting standards and accounting
quality. Journal of Accounting Research, 46(3), 467-498. Beest, F. V., Braam, G., & Boelens, S. (2009). Quality of financial reporting: Measuring qualitative
characteristics. NiCE Working Paper 09-108. April 2009. Nijmegen Center for Economics (NiCE); Institute for Management Research; Radboud University Nijmegen, Netherlands. http://www.ru.nl/nice/workingpapers.
Dechow, P. & Dichev, I. (2001). The quality of accruals and earnings: the role of accrual estimation
errors. The Accounting Review, 77(Supplement), 35-39. Emeni, F. K. (2014). Foreign direct investments and international financial reporting standards
adoption in Africa. Ushus Journal of Business Management, 13(3), 27- 41. Ernst & Young. (2014). IFRS: Observations on the implementation of IFRS. London, England:
https://www2.eycom.ch/publications/items/ifrs/single/200609_observations_on_ifrs/201409_EY_Observations_on_IFRS.pdf.
Garanina, T. A. & Kormiltseva, P. S. (2013). The effect of international financial reporting standards
(IFRS) adoption on the value relevance of financial reporting: A case of Russia. Research in Accounting in Emerging Economies, 13(1), 27-60.
Hai, Q.T. (2014). Effects of IFRS adoption on earnings quality: Evidence from Canada. A published
Ph.D dissertation of Drexel University. IASB (2010). The Conceptual Framework for Financial Reporting. London: International Accounting
Standards Board. Ibiamke, N.A., & Ateboh-Briggs, P.B. (2014). Financial Ratios Effect of International Financial
Reporting Standards (IFRS) Adoption in Nigeria. International Journal of Business and Management Invention, 3(3), 50-59.
Ironkwe, U.I., & Oglekwu, M. (2016). International Financial Reporting Standards (IFRSs) and
Corporate Performance of Listed Companies in Nigeria. IIARD International Journal of Banking and Finance Research, 2(3), 1-13.
Jinadu, O., Oluwafemi, S.M., & Soyinka, K.A. (2016). Mandatory IFRS introduction and financial
statements comparability: Evidence from Nigerian listed companies. International Journal of Research Science & Management, 3(3), 19-30.

146
Masoud, N., & Ntim, C.G. (2017). The effects of mandatory IFRS adoption on financial analysts’
forecast: Evidence from Jordan. Journal Cogent Business & Management, 4(1), 1-20. Mikova, T. (2014). Influence of IFRS on earnings manipulation: Evidence from the European union.
Journal of Accounting Research, 42(4), 3-18. Mulenga, M.J., (2016). International financial reporting standards’ adoption and value relevance of
accounting information: A brief literature review. International Journal of Economics, Commerce and Management, 4(6), 814-827.
Munch, S.B. (2002). Accounting for local physiological adaptation in bio-energetic models: Testing
hypotheses for growth rate evolution by virtual transplant experiments. Canada. Journal Fish.Aquat.Sci. 59, 393-403.
Nobes, C. W. & Stadler, C. (2014). The qualitative characteristics of financial information and
managers’ accounting decisions: Evidence from IFRS Policy Changes. Journal Accounting and Business Research, 45(5), 1-12.
Nulla, Y. M. (2014). Does International Financial Reporting Standards Adoption Influence Financial
Reporting? An Empirical Study on Financial Institutions. Journal of Business and Management, 20(1), 67-86.
Ramanna, K. & Sletten E. (2009). Why do countries adopt International Financial Reporting
Standards? Working Paper 09-102. Sanyaolu, O.A., Iyoha, F.O., & Ojeka, S.A. (2017). International Financial Reporting Standards
Adoption and Earnings of Quoted Banks in Nigeria. International Journal of Economics and Financial Issues, 7(1), 279-284.
Scott, J. (2000). Rational choice theory, in understanding contemporary society: Theories of the
present, in., G. Browning, H. Haleli and F. Webster (eds), London, Sage Publications. Stergios A., Athanasios V. & Nikolaos D. (2005). Financial statement effects of adopting international
accounting standards: The Case of Greece. Available at SSRN: https://ssrn.com/abstract=1829348
Stolowy, H., & Breton, G. (2004). Accounts manipulation: A literature review and proposed
conceptual framework. The Review of Accounting and Finance, 3(1), 5-66. Taiwo, F. H. & Adejare A. T. (2014). Empirical Analysis of the Effects of International Financial
Reporting Standards Adoption on accounting Practices in Nigeria. Archives of Business Research; Society for Science of Education, 2(2), 1-20.
Telmo, F.R.T. (2015). The impact of standards adoptions in earnings-returns relation: Evidence from
EU. A published Master Thesis of Faculty of Economics of the University of Porto. Tendeloo, B. & Vanstraelen, A. (2005). Earnings Management under German GAAP versus IFRS.
European Accounting Review, 14(1), 155-180. Umobong A. A. & Akani D. (2015). International financial reporting standards adoption and
accounting quality of quoted manufacturing firms in Nigeria: A Cross-Sectional Study of Breweries and Cement Manufacturing Firms. International Journal of Business and Management Review, 3(6), 61-77.
147
Umobong, A.A. (2015). IFRS adoption and firms performance: A comparative analysis of quoted food and beverage manufacturing firms in Nigeria. European Journal of Accounting Auditing and Finance Research, 3(8), 77-90.
Van Beest, F. V., Braam, G., & Boelens, S. (2009). Quality of Financial Reporting: Measuring
Qualitative Characteristics. Working Paper, Radboud University, Nijmegan, Netherlands, 1-41. Retrieved from http://www.ru.nl/nice/workingpapers
Verleun, M., Georgakopoulos, G., Sotiropoulos, I., & Vasileiou, K. Z. (2011). The Sarbanes-Oxley Act
and Accounting Quality: A Comprehensive Examination. International Journal of Economics and Finance, 3(5), 49-64.
Warfield, T. & Wild, J. (1992). Accounting recognition and the relevance of earnings as an
explanatory variable for returns. The Accounting Review, 67(4), 821-842. Zayyad, A.B., Ahmad, B.U., & Mubaraq, S. (2014). Financial ratios as performance measure: A
comparison of IFRS and Nigerian GAAP. Accounting and Management Information Systems, 13(1), 82–97.

148
Appendix
RESULTS
Descriptive (PRE)
DACCR EBIT EPS PAT PPE REV SP TA Mean -3.506079 6616879. 129.6828 4588657. 35722554 45213862 761.0718 54768513 Median -2.460607 1799227. 42.50000 1248425. 13805893 16504652 245.0000 14595173 Maximum 1.852436 1.11E+08 1216.000 1.10E+08 1.50E+09 3.88E+08 36855.00 1.66E+09 Minimum -70.70171 -12469073 -551.0000 -12795595 3198.000 -462919.0 2.140000 9876.000 Std. Dev. 7.188644 14259003 271.0650 12053321 1.39E+08 64766796 3471.718 1.58E+08 Skewness -7.433358 4.188103 1.240325 6.064944 9.981028 2.429096 9.621219 8.850147 Kurtosis 66.31577 27.25364 6.417607 51.27969 105.8010 10.15010 99.34294 89.54721 Jarque-Bera 21149.53 3292.000 89.16832 12390.31 54832.61 373.6297 48261.17 39018.60 Probability 0.000000 0.000000 0.000000 0.000000 0.000000 0.000000 0.000000 0.000000 Sum -420.7295 7.94E+08 15561.94 5.51E+08 4.29E+09 5.43E+09 91328.62 6.57E+09 Sum Sq. Dev. 6149.515 2.42E+16 8743670. 1.73E+16 2.29E+18 4.99E+17 1.43E+09 2.97E+18 Observations 120 120 120 120 120 120 120 120 Descriptive (POST)
DACCR EBIT EPS PAT PPE REV SP TA Mean -4.293775 9512598. 178.7917 9086583. 50127207 70106283 371.3450 62659139 Median -2.380859 2864817. 123.5000 2195108. 16664926 22978727 257.0000 26796989 Maximum 4.684829 2.06E+08 995.0000 4.31E+08 4.02E+08 1.01E+09 2866.000 4.20E+08 Minimum -192.7831 -12466208 -5539.000 -12679305 6934.000 2764.000 3.000000 8188.000 Std. Dev. 17.53092 23808144 587.7635 40190932 86083602 1.29E+08 417.4398 90926796 Skewness -10.49582 5.394490 -7.626805 9.775735 2.731683 4.154600 3.255718 2.289807 Kurtosis 113.2539 41.01038 76.05734 102.7589 10.08612 26.18454 17.28229 7.720823 Jarque-Bera 62982.82 7805.956 27850.23 51670.51 400.3075 3032.828 1231.913 216.2952 Probability 0.000000 0.000000 0.000000 0.000000 0.000000 0.000000 0.000000 0.000000 Sum -515.2530 1.14E+09 21455.00 1.09E+09 6.02E+09 8.41E+09 44561.40 7.52E+09 Sum Sq. Dev. 36572.66 6.75E+16 41110444 1.92E+17 8.82E+17 1.99E+18 20736465 9.84E+17 Observations 120 120 120 120 120 120 120 120

149
Model 1 (Pre-IFRS)
Dependent Variable: EARNC Method: Panel Least Squares Date: 03/20/17 Time: 20:43 Sample: 2008 2011 Periods included: 4 Cross-sections included: 30 Total panel (balanced) observations: 120
Variable Coefficient Std. Error t-Statistic Prob. C 0.169000 0.041450 4.077170 0.0001
EARNP 0.010620 0.019109 0.555776 0.5794 R-squared 0.002611 Mean dependent var 0.173685
Adjusted R-squared -0.005842 S.D. dependent var 0.443284 S.E. of regression 0.444576 Akaike info criterion 1.233136 Sum squared resid 23.32248 Schwarz criterion 1.279595 Log likelihood -71.98819 Hannan-Quinn criter. 1.252003 F-statistic 0.308887 Durbin-Watson stat 2.428175 Prob(F-statistic) 0.579416
Model 1 (Post-IFRS)
Dependent Variable: EARNC Method: Panel Least Squares Date: 03/20/17 Time: 20:39 Sample: 2012 2015 Periods included: 4 Cross-sections included: 119 Total panel (unbalanced) observations: 120
Variable Coefficient Std. Error t-Statistic Prob. C 0.113743 0.117122 0.971150 0.3335
EARNP 0.558548 0.131617 4.243734 0.0000 R-squared 0.132412 Mean dependent var 0.320821
Adjusted R-squared 0.125060 S.D. dependent var 1.246921 S.E. of regression 1.166348 Akaike info criterion 3.162158 Sum squared resid 160.5233 Schwarz criterion 3.208616 Log likelihood -187.7295 Hannan-Quinn criter. 3.181025 F-statistic 18.00927 Durbin-Watson stat 1.001532 Prob(F-statistic) 0.000044
Model 2 (Pre-IFRS)
Dependent Variable: MV Method: Panel Least Squares Date: 03/20/17 Time: 20:48 Sample: 2008 2011 Periods included: 4 Cross-sections included: 30 Total panel (balanced) observations: 120
Variable Coefficient Std. Error t-Statistic Prob. EPS -0.009314 0.068208 -0.136552 0.8916
BVE -2.15E-07 8.35E-07 -0.257254 0.7974

150
NOSH -9.07E-08 6.39E-08 -1.419672 0.1584 C 410.3966 52.50907 7.815728 0.0000 R-squared 0.017679 Mean dependent var 368.8450
Adjusted R-squared -0.007726 S.D. dependent var 419.1681 S.E. of regression 420.7842 Akaike info criterion 14.95488 Sum squared resid 20538885 Schwarz criterion 15.04780 Log likelihood -893.2929 Hannan-Quinn criter. 14.99262 F-statistic 0.695881 Durbin-Watson stat 1.415584 Prob(F-statistic) 0.556386
Model 2 (Post-IFRS)
Dependent Variable: MV Method: Panel Least Squares Date: 03/20/17 Time: 20:46 Sample: 2012 2015 Periods included: 4 Cross-sections included: 30 Total panel (balanced) observations: 120
Variable Coefficient Std. Error t-Statistic Prob. C 524.6107 431.1114 1.216880 0.2261
EPS 4.312721 1.194697 3.609887 0.0005 BVE -7.91E-06 1.27E-05 -0.622138 0.5351
NOSH -4.87E-07 5.96E-07 -0.818409 0.4148 R-squared 0.106329 Mean dependent var 781.0781
Adjusted R-squared 0.083217 S.D. dependent var 3474.352 S.E. of regression 3326.651 Akaike info criterion 19.09008 Sum squared resid 1.28E+09 Schwarz criterion 19.18300 Log likelihood -1141.405 Hannan-Quinn criter. 19.12782 F-statistic 4.600556 Durbin-Watson stat 2.455499 Prob(F-statistic) 0.004434
Model 3 (Pre-IFRS)
Dependent Variable: DACCR Method: Panel Least Squares Date: 03/20/17 Time: 20:52 Sample: 2008 2011 Periods included: 4 Cross-sections included: 30 Total panel (unbalanced) observations: 119
Variable Coefficient Std. Error t-Statistic Prob. C -1.985927 0.408483 -4.861714 0.0000
REV -1.37E-08 7.00E-09 -1.960754 0.0523 PPE 1.07E-08 8.90E-09 1.202177 0.2318 WC -2.74E-07 5.56E-09 -49.38679 0.0000 EBIT 6.86E-08 2.25E-08 3.052490 0.0028
R-squared 0.955451 Mean dependent var -4.310519
Adjusted R-squared 0.953887 S.D. dependent var 17.60409

151
S.E. of regression 3.780273 Akaike info criterion 5.538578 Sum squared resid 1629.113 Schwarz criterion 5.655348 Log likelihood -324.5454 Hannan-Quinn criter. 5.585995 F-statistic 611.2389 Durbin-Watson stat 1.461285 Prob(F-statistic) 0.000000
Model 3 (Post-IFRS)
Dependent Variable: DACCR Method: Panel Least Squares Date: 03/20/17 Time: 20:50 Sample: 2012 2015 Periods included: 4 Cross-sections included: 30 Total panel (balanced) observations: 120
Variable Coefficient Std. Error t-Statistic Prob. C -3.381487 0.448269 -7.543442 0.0000
REV -1.54E-09 6.15E-09 -0.250855 0.8024 PPE 4.27E-09 2.92E-09 1.463108 0.1462 WC -8.62E-08 5.25E-09 -16.42851 0.0000 EBIT 2.82E-08 1.19E-08 2.376921 0.0191
R-squared 0.708228 Mean dependent var -3.506079
Adjusted R-squared 0.698079 S.D. dependent var 7.188644 S.E. of regression 3.949968 Akaike info criterion 5.626065 Sum squared resid 1794.258 Schwarz criterion 5.742211 Log likelihood -332.5639 Hannan-Quinn criter. 5.673233 F-statistic 69.78575 Durbin-Watson stat 1.753562 Prob(F-statistic) 0.000000

152
Illicit Financial flows and the Role of the Nigerian Banks
OZIEGBE, D J
&
UAGBALE-EKATAH, R E Department of Accounting, Benson Idahosa University, Benin City
+2348132053698, +2348056751488 Email: [email protected]
_____________________________________________________________________________
ABSTRACT
This paper examines illicit financial flows in Nigeria and the role of the Nigerian banks. Some commercial banks in the country are not helping in the fight against IFFs. Instead, they are creating the platform for individuals, governments and corporate organisations to successfully transfer illicit funds out of the country. The paper also considered the three major forms of IFFs which are: money laundering, bribery and corruption and, tax evasion. The study recommends that developing countries should have the political will to execute appropriate sanctions on banks that fail to disclose any obvious transactions that lead to IFFs; government should provide incentives to banks that are willing to assist in disclosing cases of IFFs and its related activities to the appropriate authorities; the Financial Reporting Council of Nigeria and any other agencies so appointed by the government should issue annual reports on the compliance level of the various banks and expose individuals and institutions involved in IFFs and, finally the relevant regulatory bodies in Nigeria should wake up to their responsibilities and learn from the activities of developed countries on the prosecutions of big firms and banks that are involved in IFFs. Key words: Illicit financial flows, Money laundering, Tax evasion, Bribery and Corruption, Terrorism financing
1.0 Introduction
Africa as a continent looses between $50 billion and $80 billion yearly through illicit financial flows (IFF) as a result of money laundering, tax evasion, bribery and corruption and other forms of malfeasance. Africa has been bedevilled by underdevelopment despite her rich human and natural resources. The monies syphoned by African leaders from the economy is one of the reasons for her slow development. It has been estimated that nearly US$1 trillion of unrecorded money is moved from emerging markets and developing countries like Nigeria annually, thereby causing negative impact to the economies of nations across the globe (GFI, 2017). An increase in IFFs means a reduction in domestic expenditure, investment and economic growth. Its rippling effect would lead to decrease in schools, lack of good health facilities, poor police personnel, incapacitated military, and ultimately a failed economy. Nigeria and other African countries should outgrow the mentality of resting in the comfort of the maxim that Africa was underdeveloped by the Europeans and wake up to the reality that today’s Africa is underdeveloped by Africans as a result of the unethical and amoral behaviours of individuals, politicians and corporate organisations. Sustainable growth cannot be achieved when there is a constant illegal outflow of resources that are meant for economic development. The world can only be a better place if all and sundry do what is right. Sustainability can only be achieved where there is accountability, transparency and frugality in the utilization of all resources available to us as a nation.

153
The objective of this paper is to examine the ways and methods in which illicit transfers are being executed in Nigeria, the role of banks in IFFs and to suggest possible ways of curbing this menace that has crippled the growth and development of our country. This study tense embarked upon because of the paucity of literatures on IFFs and the role of the banking industry.
2.0 CONCEPTUALISATION
There are various definitions of illicit financial flows, but essentially they are generated by methods, practices and crimes aiming to transfer financial capital out of a country in contravention of national or international laws (OECD, 2013).
Baker (2005) sees illicit financial flows as dirty money, and dirty money as money that is illegally earned, illegally transferred, or illegally utilized. Similarly, it is referred to as the cross-border transfers of funds that are illegally earned, transferred, or utilized (GFI, 2013). Some authors have tried to distinguish illicit financial flows from illegal financial flows, though both may sound the same. Blankenburg and Khan (2012) explain that equating illegal and illicit financial flows implies the existence of a legal system that reflects an overall societal consensus and which is sufficiently developed to represent central social and economic interests. There are situations where what is illegal in one country could be legal in another, hence the generalisation of illegal financial flows of some activities may not be tenable. Individuals in businesses and corporations are aggressively looking for loopholes or lacunae in tax laws of other countries in other to use them for their own benefits. It will not be fair on them to refer to this practice as illegal except they contravene the tax laws of the host country. Therefore, they broadly defined IFFs as financial flows that have a direct or indirect impact on (long-term) economic growth in the country of origin (depending on the particular national development situation). The challenge with this definition is that IFFs is seen to be illegal only when it has a negative impact on the economic growth of a nation. Illicit Financial Flows (IFF) can be seen as an illegitimate transfer of money or assets from one country to another by corrupt individuals or institutions. The Global Financial Integrity (GFI) classifies the movement of money or capital as an illicit flow when the funds are illegally earned, transferred or utilized (GFI, 2014). Somewhere at its origin, movement, or use, the money broke laws and hence it is considered illicit (Nicholaou-Manias & Wu, 2016). Every year the developing world loses staggering amounts of its wealth to corruption, tax evasion and money laundering, which could help to fill the shortfall for funding sustainable development (Transparency International, 2015) IFFs is a topical issue that is still on the front-burner among academics and policy makers. There are various definitions of illicit financial flows, but essentially they are generated by methods, practices and crimes aiming to transfer financial capital out of a country in contravention of national or international laws (OECD, 2017). Most of the literatures on IFFs are centred on the following practices: tax invasion, money laundering, trade mispricing, bribery by international companies and government officials. Some of these practices would be discussed extensively during the course of this paper. Melvin and Folarin (2014) believe that there are two like antagonistic circles in the illicit flow process – a virtuous circle and a vicious circle – and that they are all entrenched in the same common factor, which are corruption and governance. Eme and Emmanuel (2015) see IFFs as one of the sources of revenue leakages in Nigeria. In their paper, addressing revenue leakages in Nigeria, they recommended that the Nigerian government should adopt best practices in open contracting, that this would reduce revenue leakages through government procurement processes and for stronger participation/collaboration between Africa and global players. The third International Conference on Financing for Development was organised in Addis Ababa, Ethopia- The Africa Progress panel, chaired by former Secretary-General of the United Nations, Kofi Anna, presented in his report ten (10) points required by African leaders, international partners and

154
the private sectors to act on; one of which focused on IFFs. They are: increase in tax revenues, African leader should build a credible tax systems; cut pro-rich subsidies, subsidies should be given to the poor and not the rich; remove tax concessions, the largesse given to foreign investors in form of tax breaks should be removed; reform energy utilities, energy entrepreneurs should allow national interest to override short-term gain; seize the low carbon opportunity, government should support investment and development in renewable energy; boost aid, Africa leaders should set aside a certain percentage of the Gross Domestic Product (GDP) as aid to boost energy access; phase out fossil fuel subsidiaries in G20 countries; and redouble efforts to combat illicit financial flow. He stated that in 2012, Africa as a continent lost US$69billion from IFFs and recommended that the G8 and G20 countries must strengthen tax disclosure requirements, avoid the creation of Shell companies and counteract money laundering; overhaul the climate finance architecture. He further pointed out that the current finance transfers have structural weaknesses and finally; unlock private finance. He advocated that there should be coordination between international financial institutions, development finance agencies and bilateral donors. Those guilty of IFFs do have numerous reasons why they move their stolen funds overseas, instead of spending it in their home country. It is a protective measure by them to ensure that the funds are not traceable by any individual or government who may wish to probe them. Funds moved to other countries of their choice gives them easy access to acquire luxurious goods that may not be available in their home country. Finally, some foreign leaders are willing to accept and invest these funds on behalf of the kleptocrat with a guarantee of asylum when the need arises. The former Secretary General of the United Nations, Ban Ki-moon, stressed that curbing illicit financial flows shows great promise as an additional and innovative revenue source to supplement official development assistance (ODA). He clearly recognized that such additional sources of revenue are among the most important necessities for future development and recommended that countries move quickly to implement policies to curtail illicit flows (Kar & LeBlanc, 2013). Electronic movement of cash is nearly impossible without the involvement of financial institutions, hence the need to probe the role of banks in IFF in developing countries. Most of these transfers would not have been possible without the expressed and unreserved support of commercial banks. Some banks in developed countries have been sanctioned in time past for engaging in financial malfeasance with corrupt individuals and institutions. The table below shows some of these banks and the sanctions that were melted on them. Recent AML related sanctions involving OECD-based financial institutions

155
Table 1: Recent Anti-Money Laundering (AML) related sanctions involving Organisation
for Economic Cooperation and Development (OECD)-based financial institutions
Bank HSBC In 2012, HSBC paid a record-fine of USD 1 921 million to avoid criminal
proceedings. US authorities investigated allegations that the bank laundered money originating from OFAC-sanctioned countries, including Cuba, Iran, Libya, Myanmar and Sudan. In addition, HSBC allegedly laundered proceeds of criminal activity in Mexico and Colombia. Additional fines by UK regulators. (Financial Times, 2012)
Standard Chartered
Following US investigations, Standard Chartered in 2012 paid a total of USD 677 million as civil penalty and under a deferred prosecution agreement to US authorities. The bank violated sanctions on Iran, Libya, Myanmar and Sudan. (BBC, 2012; New York Times, 2012)
ING In 2012, ING settled allegation by US regulators that it laundered money from OFAC-sanctioned countries Cuba and Iran. ING paid USD 619 million. (United States Department of the Treasury, 2012a, 2012b)
JP Morgan
In 2011, JP Morgan was fined USD 88.3 million by the US Treasury Department, for violating sanctions by the US Office of Foreign Asset Control (OFAC). JP Morgan conducted transactions with clients from Cuba, Iran, Sudan and Liberia. (United States Department of the Treasury, 2011; CNBC, 2011; Wall Street Journal, 2011a)
Barclays
In 2010, Barclays paid USD 298 million in financial penalties as part of a deferred prosecution agreement to settle criminal charges by the US Department of Justice, which alleged that Barclays had conducted transactions with sanctioned countries Cuba, Iran, Myanmar and Sudan. (The Guardian, 2010; Telegraph, 2010a; United States Department of Justice, 2010a)
RBS (ABN AMRO)
In 2010, RBS paid a USD 500 million penalty as part of a deferred prosecution agreement with US authorities. ABN AMRO, which was acquired by RBS, had illegally processed transactions from clients in Iran and Libya. (United States Department of Justice, 2010b; Telegraph, 2010b; Wall Street Journal, 2011b)
Credit Suisse
In 2009, Credit Suisse paid a USD 538 million penalty for hiding transactions made by clients from Cuba, Iran, Libya, Myanmar and Sudan, as part of a deferred prosecution agreement with the US Justice Department. (Bloomberg, 2009; United States Department of the Treasury, 2009a)
Lloyds Banking Group
In 2009, Lloyds Banking Group agreed to a deferred prosecution arrangement with US prosecutors. The bank avoided prosecution for its dealings with clients in Iran, Libya and Sudan by paying USD 350 million. (Financial Times, 2009; United States Department of the Treasury, 2009b)
Riggs Bank
In 2004, Riggs Bank plead guilty to money laundering charges and paid a USD 16 million penalty. The bank failed to report suspicious activity by clients in Equatorial Guinea and Chile. Accounts were held, among others, by former dictator Augusto Pinochet. (Washington Post, 2005)
Source: OECD (2013) Measuring OECD Responses to Illicit Financial Flows from Developing Countries From the above table, it can be observed that foreign banks are under serious scrutiny and their transactions are x-rayed to sieve those that are illicit. Since, there is commitment on the part of the developed community to discourage acceptance of stolen funds, it is now the responsibility of developing countries to put measures in place to ensure that these funds does not leave their shores. The above sanctions normally serve as deterrent to other banks that may want to consider the possibility of laundering funds for corrupt individuals. These measures may not be able to totally

156
eliminate these malign practices, but it sure mitigates them. Developing countries should take a cue from the developed countries by introducing rules and regulations that would guide the operations of banks and necessary sanctions should be melted on those who flout them without any fear or favour. Every dollar that leaves one country must end up in another (GFI, 2014). Therefore, most of the financial resources that are transferred from Nigeria as IFFs always end up in the banks of places like Switzerland, Cayman Island, the British Virgin Island, Singapore, Malaysian and so on. Developing countries are disadvantaged when comparism is made on the inflow and outflow of illegally earned funds between the developed and developing countries. In Nigeria, the Economic and Financial Crimes Commission (EFCC) is saddled with the responsibility of investigating fraudulent activities and to prosecute anyone found culpable. Over the years, some high profiled cases have been handled by the Commission but they (the Commission) complained about the undue influence of cabals and high ranking politicians in the execution of their duties. Notwithstanding, they have been able to arrest and prosecute some individuals who were involved in money laundering and embezzlement of public funds. 3.0 FORMS OF ILLICIT FINANCIAL FLOWS
There are various forms of illicit financial flows. They include: money laundering, trade mispricing, bribery by international companies – including government officials- and tax evasion. 3.1 Money Laundering and IFFs
Money laundering is seen as the concealment of the origins of illegally obtained money, typically by means of transfers involving foreign banks or legitimate businesses. The Money Laundering Act of Nigeria has established measures to deter individuals and corporate bodies from using shell businesses to launder money. These measures cover both physical and electronic movement of cash. It also provides for sanctions to those who fail to comply with the rules and regulations. According to the OECD (2013), money laundering involves the following steps: (a) Placement of funds: This has to do with a situation where funds are introduced into the
financial system. (b) Layering: This is the concealment of the original source or ownership of the criminal funds
through a series of transactions, for example, simple international bank transfer, fake purchases and sale of goods and property, investment instrument etc.
(c) Integration: The criminal funds now seen to be “legit” enters the legitimate economy and re-invested into single or multiple kinds of ways. This could be through establishment of a hotel, purchasing of investment instruments, building of a casino, purchasing of a real estate and other forms of investments.
The Central of Bank of Nigeria (CBN) through its Prudential Guidelines (hereafter called “the Guideline”) has put in place measures to monitor and control the fraudulent movement of cash through banks by money launders. Some of the guidelines put in place for banks are: - Know Your Customers (KYC): All banks are required to carry out a due diligence review on
their customers. They are required to comply with the principles and procedures of Know Your Customers.
- Anti-money Laundering Measures: Financial institutions are required by the Guideline to comply with the Anti-money Laundering Act and relevant circulars as issued by the CBN from time to time.
- Record Retention: The Guideline requires that banks should maintain records of transactions in a systematic manner with exactness of period. It provides that records of transactions should be kept for a minimum period of five years (5 years) except for transactions that involves litigation or are required by court of law or by any other competent authority that could be kept for a longer period.
- Correspondence Banking: The Guideline requires that banks should understand fully the nature of the business of their correspondent banks. Information such as; Know your customers policy (KYC), management ownership, major business activities, their location,

157
money laundering prevention and detection measures, the purpose of the account, the identity of any third party that will use the correspondent banking services and; condition of the banking regulation and supervision in the correspondent’s country should be of utmost priority.
- Suspicious Transaction: Banks are expected to pay special concern to all complex, unusually large transactions, and all unusual patterns of transactions, which have no apparent economic or visible lawful purpose (CBN, 2010).
To further eliminate or mitigate the chances of money laundering, banks are to report to the appropriate authorities (the Economic and Financial Crimes Commission, EFCC; The Securities and Exchange Commission, SEC; the Central Bank of Nigeria, CBN and other relevant authorities) any transaction that exceeds N1,000,000 for an individual, and N10,000,000 for corporate body. Despite all these measures put in place the spread of IFFs in Nigeria is still on the record-high. It is a popular belief that the problem of Nigeria as a nation is not the inadequacy of policies but the political will-power to implement and execute policies. 3.2 Bribery, corruption and illicit financial flows
The term bribery and corruption goes hand in hand. According to the Oxford Advanced Learner’s Dictionary (2010), to give bribe means to try to make someone do something for you by giving them money, presents or something else that they want, while corruption is the dishonest or illegal behaviour, especially of people in authority. Corruption is a complex set of process involving human behaviour and many other variables, some of which are difficult to recognize or measure (Asaolu, 2012). Developing countries are plagued with massive cases of bribery and corruption. Like a fish, which is said to rot from the head, the corrosive effects of grand corruption create grievous collateral damages. The costs of illicit financial flows are not just the plundered monies lost to foreign jurisdictions, but also include the lost opportunities to use these funds for local development as well as the impact on governance (Ayogu & Gbadebo-Smith, 2014). An estimated USD 1 trillion is paid each year in bribes, and bribery in the developing world may amount to the equivalent of 15-30% of all official development assistance (OECD, 2013). The natural resources of Nigeria is so enormous that we are yet to tap into some of them, but the abundance of resources does not reflect in the life of the average Nigerian. The revenue from oil is enough to position the country as one of the most developed economies in the world but the clog of corruption has constantly retarded the wheels of economic growth. Instead of the revenue to be invested in provision of health facilities, schools, infrastructures, technology and so on, they are shared by few persons who in most cases spend their loot overseas. There is no doubt that bribery and corruption is directly proportional to underdevelopment. Hence, the need for developing nations to stand against this cancerous habit that has eaten deep into the nucleus of our country. Pecuniary selfish benefits should rise above the lust for bribery and corruption. The kleptocratic tendencies in some of our citizenry should be sacrificed on the altar of collective national development. Over the years, Politically Exposed Persons (PEPs) – individual who is or has, at any time been trusted with public office- have been accused of stealing public funds running into millions of naira and transferring these monies to foreign accounts for safe keeping. These transfers would not have been possible without the explicit or implicit support from banks who may wish not to probe into the source of such outrageous transfers by a public servant whose salary is not commensurate with the amount of funds deposited and transferred to foreign banks. According to Asaolu (2012), corruption can be characterised in terms of their origin, motive, magnitude, pervasiveness, usage of resources, and direction.

158
Corruption based on origin: This can be classified into three: foreign-sponsored, institutionalised and administrative malfeasance. Foreign-sponsored corruption has its main actors as public officials, politicians, representatives of donor and recipient countries. For instance, the government of a developed country may influence a developing country through aids to make sure that a company from the developed country is awarded a project, even if it is not the best option. Institutionalised corruption comes into play when bureaucratic elites, politicians, businessmen and white-collar workers provide the platform and support for corruption to thrive; while administrative malfeasance is where petty officials and interested individuals play major role in the corruption process. Corruption based on motive: This can be categorised into three: collusive, coercive and non-conjunctive. Under collusive corruption, the corrupters are willing and are active participants in the process and use corruption as an instrument for inducing a wrong action or inaction on the part of the authorities, deriving greater benefit than the costs of corruption on their part; coercive corruption, involves the use of force upon the corrupter by those in the position of power and authority; under non-conjunctive corruption, benefits are obtained at someone else’s cost and victims are unaware of their victimisation. Corruption based on magnitude: This can be categorised into petty corruption, grand corruption, and state capture/influence peddling. Petty corruption involves tips, commissions, or kickbacks that are usually demanded by junior officers in the public sector from the public in exchange for official services to be rendered; Grand corruption is the behaviour of elected officials, including politicians, taking bribe to award contracts, paying bribes to influence elections, and using their position to provide patronage; and State capture corruption is the collusion between private agents and public officials, a situation where the private sector captures the state apparatus (i.e., the judiciary, executive, and legislative). Corruption based on pervasiveness: This can be divided into incidental, institutional, and systemic (societal). Incidental (Individual) corruption involves instances of malfeasance on the part of individual politicians or public officials. Institutional corruption pervades particular institutions or sectors of activity, for example, the Nigerian police force, the judicial system, the Nigerian custom service and so on; and systemic (Societal) corruption pervades the entire society and in the process becomes routinised and accepted as a means of conducting everyday transactions.
3.3 Reasons for corrupt practices in Nigeria
Some of the reasons why bribery and corruption thrive in Nigeria are: weak institutions, cash-based economy, culture, favouritism and nepotism, weak judicial system and lack of transparency and accountability in governance. These reasons are briefly explained below:
Weak institutions
The rate of inefficiencies in our public institutions is on the record high. It is liken to fixing a square peg in a round hole. Though some believe that the problem of Nigeria is not that of weak institutions but strong men that exploit the institutions. On the contrary, some of the administrative processes and red tape in our institutions make room for corrupt practices. When competent persons are made to head governmental institutions, there would be great reduction in corrupt practices. When incompetent persons are employed into a system, they will do everything possible to retain their position, even if it involves giving kick-backs to their “oga at the top”, in order to retain their jobs and they in return, would have to collect bribes from others to recoup their expense. Cash-based economic system
Some transactions in Nigeria are still predominately executed with cash. These transactions are not easily traceably, hence making it possible for the movement of corrupt funds from one party to another. Until, the cashless policy of the Central Bank of Nigeria (CBN) is fully implemented, there are bound to be illegal transactions that would go unnoticed.

159
Culture
Culture is seen as the way of life, especially the general customs and beliefs of a particular group of people at a particular time. Unfortunately, Nigeria’s culture has been diluted with corruption tendencies. An average Nigerian celebrates the “rich” without minding the source of their wealth. In events, the rich are given prominent positions to sit - even in place of worship, not minding the source of their wealth. Parents are willing to send their children abroad lacking the requisite skills and education to work, in order to send dollars to them. Indirectly telling them to do all that it takes to get rich. Except there is a change in our way of thinking and lifestyle, there is little or nothing we can do to fight corruption in Nigeria. The change mantra of the President Mohammadu Buhari’s administration has its slogan that “change begins with you!.” Favouritism and nepotism
The Nigeria business environment is shrouded under the blanket of favouritism and nepotism. This is another form of corruption and it makes men to be treated unfairly by a system that is supposed to be just and fair. Due to this constraint, individuals and corporations are willing to pay whatever is required of them to benefit from the unfair system.
Weak Judicial system The Nigeria judicial system still has a bureaucratic red tape that calls for questioning. The duration it takes for the outcome of a case to be known is so long that it creates doubts in the minds of the people on the credibility of the system. Recently, based on the arrest of some judges on corruption charges, the integrity of the judicial system in Nigeria is in great doubt. Prosecutions of corrupt persons: the prosecutions of corruption cases over the years in Nigeria have been perceived to be a sham. They are seen as government way of fighting their political opponents and not actually a fight against corruption. The Economic and Financial Crimes Commission (EFCC) established in 2002, charged with the power to investigate, prevent, and prosecute offenders who engage in: money laundering, embezzlement, bribery and other related crimes have over years handled a lot of corruption cases but only few persons have been convicted for such crimes. Some persons have escaped jail terms through plea-bargain and other forms of negotiations with the government. This does not send the right signal to Nigerians and the international community that we are willing to fight corruption to a standstill. Lack of accountability and transparency in governance
Accountability and transparency are part of the panacea for corruption in a country. Until the government becomes accountable and transparent in its business of governance at the legislative, executive and judicial arms of government, we still have a long way to go. The government has to be transparent in its budgetary process, procurement process, awarding of contracts and allocation of resources, and they must be accountable to the citizenry who have elected them into a position of trust. 4.3 Tax evasion and illicit financial flow
In most developed countries, taxation is a veritable tool in the hands of government for revenue generation, but the reverse is the case in developing countries like Nigeria. Since the discovery of oil, Nigeria as a nation has shifted her focus from taxes and agricultural produce as a major source of income to oil revenue. Today, oil and gas are no longer generating the expected revenue to sustain the economy due to the down-turn in oil prices. It is required that taxation as a tool for economic development should be looked into and effectively managed. The tax collection mechanism used by tax officials must be free from corruption and embezzlement (Afuberoh & Okoye, 2014). Revenue from taxation is not fully utilized because of lack of adequate technical capacity and political will to actively executive the various tax laws. One of the major challenges is tax evasion. Tax evasion involves all illegal means of not paying tax. Unlike tax avoidance, which is legal and recognised by the tax law, tax evasion is illegal.

160
Tax evasion is one of the IFFs that is crippling the nation’s economy. Banks in collaboration with other partners – both national and international partners- to a large extent have a role to play in the fight against international Tax evasion. Banks should assist in the provision of useful information to the appropriate authorities that would help in the investigation of suspected case of tax evasion. Also, Nigeria should collaborate with other countries, organisations or institutions that may to assist in the exchange of Information (EOI) on individuals or body corporate that may have engaged in tax evasion. According to IMF, OECD, UN and World Bank (2011) tax systems in developing countries perform poorly due to weak capacity, corruption and the lack of any reciprocal link between tax and public and social expenditure. IFFs from domestic tax evasion is lesser when compared with international tax evasion. Domestic tax evasion has to do with funds from tax evasion that stay, spend or invest in the domestic country, while international tax evasion are tax evaded funds that are transferred cross-boarders, they are normally executed by multinational companies (MNCs). According to OECD (2013) … as capital becomes more mobile, developing countries are dealing with new international challenges, such as taxing multinational enterprises effectively, building effective transfer pricing regimes, establishing and using information sharing arrangements to obtain tax information about their payers from other countries. This is an enormous challenge for developing countries, because of inadequate human and technological capacity to catch up with new technologies, and it is obvious that the banks are one of the most technologically inclined institutions in Nigeria. This means they can collaborate with government with the use of their technologies to eliminate or mitigate tax evasions. The G20 nations are making appreciable efforts towards reducing global international tax evasions among member countries by agreeing to access and exchange relevant information about individuals’ and companies’ activities, assets or incomes in foreign jurisdictions. One of the tools the OECD and G20 are using to combat international tax evasion is the Global Forum on Transparency and Exchange of information for Tax Purposes. The ten essential elements of the global Forum standard of exchange of information on request are grouped based on three broad components: availability of information, access to information and exchange of information. They are further explained as stated below. Availability of information
1. Ownership and identity information: jurisdictions should ensure that ownership and identity information for all relevant entities and arrangements are available to the competent authorities.
2. Accounting information: jurisdictions should ensure that reliable accounting records are kept for all relevant entities and arrangements.
3. Bank information: banking information should be available for all account holders. Access to information
4. Powers to access information: competent authorities should have the power to obtain and provide information that is the subject of a request under an exchange of information agreement from any person within their territorial jurisdiction who is in possession or control of such information.
Rights and safeguards
5. The rights and safeguards that apply to persons in the requested jurisdiction should be compatible with effective exchange of information.
Exchanging information
6. Effective exchange: exchange of information mechanisms should provide for effective exchange of information.

161
7. Network of agreements: the jurisdictions’ network of information exchange mechanisms should cover all relevant partners.
8. Confidentiality: jurisdictions’ mechanisms for exchange of information should have adequate provisions to ensure the confidentiality of information received.
9. Rights and safeguards: exchange of information mechanisms should respect the rights and safeguards of taxpayers and third parties.
10. Timely exchange: the jurisdiction should provide information under its network of agreements in a timely manner.
Developing countries, especially those in the African continent, should take a cue from this initiative of developed countries by formulating policies that would foster resistance against international tax evasion. Information is a key weapon required to fight against international tax evasion, hence the need for collaboration between countries and the financial institutions. Cross-border assistance in the collection of taxes is a very germane in recouping monies lost through international tax evasion. There are taxpayers who own assets and receive income from different parts of the globe, but the tax authorities of developing countries may not have the technical competence to track their incomes. Tax authorities usually cannot go beyond their borders to collect taxes due (OECD, 2007). This challenge can be eliminated by entering into multilateral or bilateral agreements with countries so that foreign tax authorities can help in the recovering of taxes from other countries. Between 2007 and 2012, the OECD countries and developing countries have signed about 222 treaties, in which 20 treaties focused on assistance in tax collection (between 11 developing and 13 OECD countries) (OECD, 2013). 5.0 ROLES FOR BANKS IN COMBATING ILLICIT FINANCIAL FLOWS IN NIGERIA
Most of the IFFs highlighted above are achieved through the machination of the banks. As highlighted earlier in this paper, the challenge of Nigeria as a country is policy implementation and execution and not policy formulation. There are already existing policies and laws that should be strictly adhered to by the relevant stakeholders to nip this menace in the bud. Banks should adhere strictly to these policies and assist the government in combating IFFs in the following ways: 1. Due diligence review on existing customers and potential customer: Banks should
understand that they cannot operate in a failed economy. Hence, the need for them to compliment governments efforts in combating IFFs. The confidentiality of their customers should be compromise when there is information that suggests that they are involved in money laundering, tax evasion or terrorism financing.
The era of flouting rules and regulations by compromising and willing to pay fines, because of the huge fiduciary benefits they derive from such transactions. They should go the extra mile in evaluating their customers, and possibly grade them in order of this scale: suspicious, less suspicious, most suspicious and not-suspicious. Transactions that look suspicious should be reported to the appropriate authorities without any delay. 2. Creating awareness: Banks should join the government and its anti-corruption agencies in
creating awareness on the dangers of IFFs. Currently, there are no sufficient campaign to suggest that they have joined in the campaign against IFFs. Instead, some of them are found at the gates and offices of public servant/politicians seeking for deposits and other forms of favour.
3. Act as whistle-blowers: Banks should see themselves as potential whistle-blower. Special
attention should be given to all complex, usually large transactions, and all unusual patterns of transactions, which have no apparent economic or visible lawful purpose. Money laundering, tax evasion and terrorism financing all have a negative rippling effect on the economy. Banks who allow illegal funds to flow through their systems would be affected negatively directly or indirectly, by such action.

162
When a bank allows the free flow of funds intended for terrorism go through their system, they are most likely going to be affected by such attacks, directly or indirectly. Consider the case of ISIS, any bank who has aided or abetted the movement of funds for the purchase of arms and ammunitions for this deadly group, will definitely be affected when they unleash their attack; especially when they (the bank) have branches and investment in that region. 4. Provision of records: The CBN Prudential Guideline provides that banks can keep records of
their transaction for a minimum period of five years (5 years), while transaction that involves litigation could be kept for a longer period of time. In addition, banks should be willing to submit to the appropriate authorities records that are suspicious especially when it is pointing towards terrorist financing.
5. Comprehensive documentation and verification: It is easier to combat IFFs using banks as a
medium: from the initial stage of account opening, banks should ensure that adequate documentations and verification of individuals and corporations are carried out at the point of account opening with the Securities and Exchange Commission (SEC), Nigerian Stock Exchange (NSE), Corporate Affairs Commission (CAC) and other necessary regulatory bodies, this would help to unveil the true identity of the owner(s).
CONCLUSION AND RECOMMENDATIONS
Developing countries in Africa lack the committed efforts in tackling the issue of IFFs. It is believed that the problem of most Africa countries is leadership and the will power to implement and executive policies. Africa should grow above selfish interest and individualistic mentality that have bedevilled the continent for so long. They should wake up to their responsibilities and face the reality of today’s world, which is fast developing. The era of political leaders siphoning tax payers’ money to nurture their lust should cease. All hands must be on deck- both leaders and the led, to build a formidable Africa that the world will be proud of. In order not to digress from the focus of this paper, which is centred on the roles of banks in combating IFFs. The following recommendations are: i. like the developed nations, appropriate sanctions should be melted on banks who fail to
disclose any obvious transactions that leads to IFFs. These sanctions could be in form of fines, suspension of licence or indefinite closure.
ii. Incentive should be given to those banks who assist in disclosing IFFs and its related
activities to the appropriate authorities. iii. A report should be issued from time to time by the Financial Reporting Council of Nigeria
(FRC) or any other relevant agencies so appointed by the government that will issue report on the compliance level to policies and rules guiding against IFFs by banks. This report should be published an annual basis.
iv. The relevant regulatory authorities in Nigeria should wakeup to their responsibilities and
learn from the developed economies on their policies and programme in stemming IFFs and the prosecution of offenders.
v. Any individual or corporate body suspected to be involved in money laundering or terrorism
financing should be investigated along with their bankers. They should not be excluded from the prosecution process, except all evidences points to the fact that they did all that was required by law.
vi. Customer due diligence (CDD) also known as Know your customer/client (KYC) should be
carried out on a routine basis to enable them sieve out IFFs transactions.

163
vii. Politically Exposed Persons (PEP) – an individual who is or has, at any time in the preceding year, been entrusted with prominent public office/functions, should be critically assess before certain transactions are approved for them. PEP status may also include an immediate family member of a known close associate of such a person. At the point of account opening, individuals should be asked of their PEP status, so that enhanced CDD would be carried out when dealing with them. Banks may not have the resources to verify who is PEP or not, but the government can assist in this area by providing the database for them to verify at the point of account opening.
vi. Finally, further quantitative research should be carried out on IFFs in Nigeria, that is
quantitative in nature. At the moment, there are paucity of quantitative research to assist policy makers fully understand the impact on IFFs on the economy.

164
REFERENCES
Afuberoh, D. & Okoye, E. (2014). The impact of taxation on revenue generation in Nigeria: a study of Federal Capital Territory and selected states. International Journal of Public Administration and Management Research, 2(2)
Asaolu (2012). Cash policy as a panacea for stemming corruption in Nigeria: The accountant’s
perspective. A paper presented in ICAN conference. Ayogu, M. D. & Gbadebo, S. F. (2014). Governance and illicit financial flows. Political Economy
Research Institute, University of Massachuseets Amherst, working paper series, number 366 Baker, R. W. (2005). Capitalism’s Achilles Heel: Dirty Money and How to Renew the Free-Market
System. Hoboken, New Jersey: John Wiley & Sons, Inc. Blankenburg, S. & Khan, M. (2012) ‘Governance and Illicit Flows’ in Reuter, P. (ed.) Draining
development? Controlling flows of illicit funds from developing countries (Washington, D.C.: World Bank), pp. 21-68.
CBN (2010). Prudential guidelines for deposit money banks in Nigeria. Kar, D. & LeBlanc, B. (2013). Illicit financial flows from developing countries: 2002-2011. Global
Financial Integrity. Eme, O. I. & Emmanuel, N. I. (2015). Addressing revenue leakages in Nigeria. Arabian Journal of
Business and Management Review (OMAN Chapter). 5(4) Global Financial Integrity (2017). Retrieved on July 7, 2017 from http://www.gfintegrity.org/issue
/illicit-financial-flows/ IMF, OECD, UN & World Bank (2011), supporting the development of more effective tax systems, a
report of the G20 Developing working group, OECD, Paris, www.oecd/ctp/48993634.pdf Melvin, D. A. & Folarin, G. (2014). Governance and illicit financial flows. Working paper series.
Political Economy Research Institute, University of Massachusetts Amherst. OECD (2007), Manual on the Implementation of Assistance in Tax Collection, OECD, Paris,
www.oecd.org/tax/exchangeofinformation/oecdmanualonassistanceinthecollectionoftaxes.htm.
Nicolaou-Manias, K. & Wu, Y. (2016). Illicit financial flows: estimating trade mispricing and trade-
based money laundering for five African countries. Global Economic Governance, discussion paper.
OECD (2013). Measuring OECD responses to illicit financial flows from developing countries, OECD
publishing Robb, C. K. (2015).10 ways to finance Africa’s energy opportunity, writes Caroline Kende-Robb in
the Huffington Post, retrieved on July 8, 2017 from http://www.africaprogresspanel.org/action-after-addis-10-ways-to-finance-africas-energy-opportunity/?gclid=EAIaIQobChMI6uuo89X51AIV2KntCh2_IAj-EAAYASAAEgJwWvD_BwE
Transparency International, Curbing Illicit Financial Flows to Unlock a Sustainable Future, Working
Paper, 1, 2015.

165
Corporate Governance Research Opportunities in Nigeria:
A National Development Issue
ROSEMARY O. OBASI (Ph.D)
Department of Accounting, Faculty of Social and Management Sciences, Benson Idahosa University.
[email protected]/[email protected] ______________________________________________________________________ ABSTRACT
This paper presents a number of research opportunities in corporate governance in Nigeria. Corporate governance has come along with changes in Nigeria regulatory framework for financial reporting and corporate governance code during the recent years. In doing so, the researcher raised a number of key research questions that remain unanswered today. At the same time, new opportunities arise in the changed corporate governance code landscape. The researcher identified some important areas where research can help advance our knowledge and provide relevant information for policy makers. These research areas include audit firm governance, corporate level of compliance on corporate governance; Public sector code of governance; adoption of Not-for-profit governance code by such organisations in Nigeria. The research questions that were raised are of global interest, but the Nigeria environment provides some distinctive natural experimental settings to address these questions. Key words:
Corporate governance, compliance, National code, audit firm governance, Nigeria 1.1 INTRODUCTION
Corporate governance is balancing of the multiple interests of an entity’s stakeholders, such as, shareholders, management, customers, employees, government, financiers, suppliers, etc. (Okolo,2017). Other researchers defined it as how investors get the managers to give them back their money (Shleifer & Vishny, 1997). Corporate governance has been identified as a crucial element in ensuring that companies thrive even in the face of economic recession. Regressions lead to greater advocacy for transparency or greater accountability in corporate governance, with activists challenging decisions of Board of Directors and putting greater pressure on management for performance. Also, strengthening of corporate governance leads to enhanced resource utilization across private and public sectors (Alayande, 2017). Alayande further buttressed that good corporate governance practice in times of recession would enhance efficiency in, and ultimately greater resource allocation across the economy, thus leading to a faster route out of the economic recession. Studies have shown that recession or financial crisis can be to an important extent attributed to failure and weaknesses in corporate governance arrangements. Thus, there is inverse relationship between performance of corporate governance and economic growth, indicating that most of the advances witnessed in the field of corporate governance have been at the cusp of economic recessions (OECD, 2007; Alayande, 2017). Masouros (2014) in his study reviewed Japan’s corporate governance patterns as responsible for the country’s export success and for the decline of United State manufacturing from1960s onwards. His study finds that corporate governance patterns carry a typical characteristic of a spatial fix in Japan sense, that is, it can switch a crisis to another country or defer the crisis to the future. The current recession suggests a need for the study to raise questions that will enable researchers to re-examine the adequacy of corporate governance principles in the key areas in order to judge whether additional guidance and or clarification is needed. Thus, the purpose of this article is to present a number of research opportunities in corporate governance that come along with the changes in Nigeria regulatory framework landscape.

166
Despite the fact that the issues addressed in this article are of global interest, the Nigerian environment has some unique features that allow studying these questions. As a starting point, this paper makes use of the insights of the Demaki (2011) in the article ‘proliferation of codes of corporate governance in Nigeria and economic development’. In particular, Demaki (2011) provided background information about the proliferation of corporate governance codes among industries regulators that influence the corporate governance environment and business risk; giving an overview of corporate governance issues in Nigeria; illustrated the issues of proliferation of corporate governance codes, the disparities in the different codes; and concluded with suggestions for harmonized corporate governance code for companies, government ministries, departments and agencies for the economic growth and development of Nigeria. Also, this study builds on the works of Akinkoye and Olasanmi (2014). In their study, they evaluated corporate governance practices among selected non-financial quoted firms across industries. They analysed the level of compliance with 2003 code of best practices in Nigeria by providing an overview of the major changes that have occurred in Nigeria between 2003 and 2010. Thus, this study however reviewed their studies by providing an overview of the major changes that have occurred in Nigeria since their study was published and outlines how the changes have shaped current and future discussions about governance, accounting and auditing, and the resulting implications and opportunities for corporate governance research. Our main conclusions are the following: Firstly, Demaki (2011) strongly emphasized the proliferation of corporate governance code in Nigeria. At that time there was no Nation-wide regulatory framework for the Nigerian heterogeneous capital market. Currently, there is such a central regulatory framework, which has resulted in the de facto development of an integrated national code. Secondly, since 2003, we have witnessed an increasing globalization of capital markets. This has resulted in an increasing demand for global accountability and governance standards. The question is whether the different codes are sufficient to ensure high quality financial reporting and good governance if the underlying institutional structures are still mainly determined by national forces. This seems doubtful because, in addition to national stability, the primary institutional features of financial reporting and auditing relate to governance and internal control, enforcement, the legal system, and regulatory agencies such as securities regulators and public oversight bodies such as Financial Reporting Council of Nigeria (FRCN). Thirdly, the new Nigeria scenery is characterized by increasing code. Natural questions that follow are: How effective are these codes? What are the alternative forms of regulation, and under what circumstance will they work? Why will they work under these circumstances? DO the benefits outweigh the costs? What are, if any, the unintended consequences of different codes? Research can play important role in addressing these questions. Fourthly, this study makes a call for more interaction among academics, practitioners, and regulators. In specific words to urge practitioners and academics to now more than before, partner to push on the course of good corporate governance mechanism, identifying governance gaps in practice and linking the academics through collaborative efforts to ensure stakeholders confidence in the reports and operations of the entities. Schilder (1996) had pointed to the merit of cooperation between researchers and practitioners, when he writes that researchers may benefit from the strong networks that larger firms have in place ... Accounting firms … may gain a better understanding of what audit research can contribute, and learn from its analysis. Also, while some researchers have reported that academic researchers have had limited impact on regulations or the policy-making process (Francis, 2004; Francis, 2011), there is the prospect for this to change in the future. Finally, some important areas where research can help advance our knowledge and that are relevant for policy makers include: audit firm governance, corporate level of compliance on corporate governance code, public sector code of governance, the challenges in the adoption of not-for-profit governance code by such organizations in Nigeria, the challenges of whistle blowers and whistle blowing.

167
The remainder of this article is organized as follows. The second section discusses some important changes in the Nigerian corporate governance framework for entities. The third section discusses some key questions on the corporate governance practices. From these questions, the study derives a number of research opportunities tailored to the Nigerian setting but with global interest. The fourth section contains concluding observations.
2.1 CHANGES IN THE NIGERIA CORPORATE GOVERNANCE LANDSCAPE
In order to appreciate this section of the paper, the changes are grouped into five distinct eras.
2.1.1 Pre -1990 Era
Before 1990, the principal company law statute in Nigeria was company Act of 1968. It contains elaborate provisions regarding the running of companies in relation to the roles of the Board of Directors and the members in general meeting. Based on stakeholders’ criticisms the law was amended in 1990 with little modifications. 2.1.2 1990 – 2002 Era
This era saw the wake of the Companies and Allied Matters Act (CAMA). CAMA 1990 was product of a rigorous process championed by the Nigeria law reform commission. It contains a lot of innovative provisions such as provisions on greater and more effective participation in, and control of the affairs of a company through improved provisions in respect of meetings. It made provisions for greater accountability by directors. As at this time, the concept of corporate governance had not emerged as a distinct concept. However, some corporate challenges around the world during this era, brought the concept of corporate governance practices to the fore. This resulted in countries issuing corporate governance codes to address issues neither specifically nor sufficiently addressed by their respective company legislation.
2.1.3 2003 -2010 Era
In August 2003, the Bankers Executives Committee developed the corporate governance code for banks. This was the first corporate governance code in Nigeria. The major weakness in the 2003 Bankers’ Committee’s code was that it was not issued by a regulator having been issued by a voluntary association of the chief executives of the banks in Nigeria. Thus, not much is known about the code. The code was predicated on eleven principles. In October, 2003 the Securities and Exchange Commission (SEC) issued the code of best practices in corporate governance in Nigeria known as 2003 SEC Code. It was the first corporate governance code to be issued by any regulator in Nigeria. Secondly, it was applicable to all public companies registered in Nigeria. In 2006, the Central Bank of Nigeria (CBN) issued its code of corporate governance for Banks in Nigeria post-consolidation (2006 CBN Code). Compliance with the provisions of this code is mandatory for all banks operating in Nigeria. In 2008, following the reforms in the pension sector which gave rise to greater private sector involvement in Pension fund management, the National Pension Commission (PENCOM) issued the code of corporate governance for licensed pension operators (2008 PENCOM Code).The code covered pension fund administrators and custodians. In 2009, the National Insurance Commission (NAICOM) issued the code of business ethic and principles on corporate governance for the insurance industry (2009 NAICOM Code). The code brought in some basic principles of good governance such as: proactive, responsible, responsive, accountable and committed Board/management; definite management succession plan; culture of compliance with rules and regulations; good knowledge about business and insurance matters with requisite experience; disclosure and transparency; and effective exercise of shareholders’ rights. The 2006, 2008 and 2009 industry-specific corporate governance codes, addressed corporate governance issues, peculiar to the respective sectors at the time of their issuance, which the 2003 SEC Code did not address. Furthermore, the 2003 SEC Code, lacked adequate provisions on other contemporary corporate governance issues. These include: independent directors, critical Board committee in relation to corporate governance, director’s appointment, tenure, remuneration and

168
evaluation, ensuring the independence of the external auditors, whistle blowing procedures, sustainability issues, general disclosure and transparency issues.
2.1.4 2011 – 2014 Era
Based on these gaps, it was quite obvious that there was a need to update the 2003 SEC Code. Therefore, on 1st of April 2011, the SEC issued the code of corporate governance in Nigeria which replaced the 2003 SEC Code. During this period, four regulators were active in the corporate governance scene. The code was expected to be the minimum standards expected of public companies in Nigeria. But, in that year, the Financial Reporting Council of Nigeria (FRCN) Act was enacted by the Federal government. This statute has far-reaching provisions regarding the operation of companies in Nigeria. The FRCN was given express jurisdiction over corporate governance. In 2014, the CBN reviewed its 2006 code to include: • Submission by financial institutions of quarterly report of compliance with the CBN Code
within a specified deadline. • Prescription of a minimum of five board members for discount houses, no two members of
the same extended family shall occupy the positions of chairman and MD/CEO or Ex-director of a bank’s subsidiary at the same time.
• CBN’s approval must be granted before certain acts are done e.g increase in shareholding above 5% approval of Board committees’ charter, notification of review of whistle-blowing policy after 3 years, appointment or removal of Chief Compliance Officer or head of internal audit of financial institutions among others.
The discrepancies in the standards prescribed by the aforementioned corporate governance codes led corporate governance experts to recommend a harmonisation of the corporate governance codes which could be applicable in different sectors (Demaki, 2011).
2.1.5 2015 till date
Based on the identified gap from the above era, the harmonized code called the National Code of Corporate Governance ( 2016 National Code cited in Komolafe, 2016) which was expected to be operational in the 1st quarter of 2015 was released on October 17, 2016. The code comes in 3 parts, which are; code of corporate governance for private sector, code of governance for not-for-profit entities and code of governance for the public sector. Section 23(g) and 45 provide for the establishment of a Directorate of corporate governance for the FRCN. Section 50 and 51 stipulate the objectives and functions of the Directorate of corporate governance which include: To develop principles and practices of corporate governance. Promote the highest standards of corporate governance. Promote public awareness about corporate governance principles and practices. Act as national coordinating body responsible for all matters pertaining to corporate
governance. Promote sound financial reporting and accountability based on true and fair financial
statement duly audited by competent independent auditors. Encourage sound systems of internal control to safeguard stakeholders’ investment and
assets of public interest entities. Ensure that audit committees of public interest entities keep under review the scope of the
audit. Its cost effectiveness, the independence and objectivity of the auditors. Issue corporate governance code and guidelines. Provide assistance and guidance in respect of the adoption or institution of the code in
order to fulfil its objectives. Establish links with the regional and international institutions engaged in promoting
corporate governance.
The corporate governance code for the private sector is mandatory while that of the not-for-profit entities will be operated on the ‘‘comply or Justify non-compliance’’ basis in a manner similar to United Kingdom’s code.

169
In terms of substance, the National code is similar in some respect with the other codes. However, in terms of control, management responsibilities, unified code, enforcement power and coverage the National code is innovative. The new code although suspended has the following concerns: 1. One set of Nigeria corporate governance code for all private entities; 2. The introduction of independent oversight and enforcement of corporate governance
compliance; 3. Arrangements regarding oversight and enforcement responsibilities across the various
entities (ie Private, public and not-for-profit) and the creation of FRCN committees to coordinate oversight and enforcement activities; and
4. The supremacy of the National code of corporate governance. Each of these four areas will be discussed below, and the implications for research are included in the third section.
One set of Nigeria corporate governance code for all private entities
Section 23(g) and 45 of the Act that established the FRCN provide for the establishment of a Directorate of corporate governance. This action brought about the harmonized code of corporate governance in 2016. This would have had a major impact, as before this date, each sector or industry applied its corporate governance code. Upon release of the code, its provisions especially as it relates to the management of an entity were a deviation from other enabling laws like Companies and Allied Matters Act. The code was perceived as being capable of disrupting the management of companies and with the potential of increasing the cost of doing business in Nigeria (Akinkumi, 2016). Hence, it was suspended three weeks after its enactment. The Introduction of Independent Oversight and Enforcement of Corporate Governance
Compliance
Nigeria entities have no history of independent oversight and enforcement body. Both the accounting and audit scandals at the beginning of this century and the objective of developing an integrated Nigerian capital market were important forces leading to the introduction of oversight and enforcement. Oversight of financial reporting in Nigeria is conducted by securities regulators and professional bodies, while in the auditing area there is no clear cut. In general, there is still a high degree of variation regarding oversight models. For example, one source of variation concerns the powers and sanctions of oversight bodies and to what extent the profession and practitioners have a role in inspections.
Arrangements Regarding Oversight And Enforcement Responsibilities Across The
Various Entities (Private, Public And Not-For-Profit) And The Creation Of FRCN
Committees To Coordinate Oversight And Enforcement Activities
The variation in format, powers, and sanctions of oversight across the three types of entities result in coordination problems for companies and audit firms that are active in more than one entity type. The dominant principle to solve these coordination problems is described by researchers as a ‘National Code’. This principle implies that the regulator in Nigeria entities or audit firm has in principle the mandate to oversee that all entities or audit firm, and other regulators needed to rely on those oversight activities. However, there are information exchange arrangements that give FRCN possibilities to receive information on industry oversight activities. To facilitate the coordination and consistency of oversight activities, FRCN should liaise with other regulators internal and external in executing it oversight and enforcement functions. Supremacy of the National Code of Corporate Governance
The National Code stipulates that its provision supersede all other sectoral codes (section 38.2). The Code in section 38.3, further stipulates that regulators may issue supplementary guildeline on sector specific matters relating to corporate governance. However, where those sectoral codes conflict with the code, the provision of the code will prevail (section 38.4). There are many agitations on the above subsections of the Code. Some of these agitations are that the code suggests that the Council is a superior agency of government with supervisory duties over the other agencies like the Central Bank of Nigeria, the National Insurance Commission, National Pension Commission, and the

170
Securities and Exchange Commission. They claimed that, these agencies were established by an Act of the National Assembly and that they have the statutory powers to make rules, guidelines for the smooth operation of the sector they regulate (Akinkunmi, 2016). These and a lot of other debates of the supremacy of the FRCN and the defunct Nation Code seem to be an interesting ground for research.
3.1 CONTEMPORARY ISSUES AND RESEARCH OPPORTUNITIES IN CORPORATE
GOVERNANCE A review of thirty papers stored in google search engine, showed that studies have been conducted in corporate governance in Nigeria but they majorly centered on: 1. Corporate performance and corporate governance: there are avalange of studies on
the impact of corporate governance on firm performance, especially banks (Obu, 2012; Onakoya, Ofoegbu & Fasanya, 2010, Oghojafora, Olayemia, Okonjia, & Okolie, 2010; Akingunola, Adekunle, & Adedipe, 2013; Dauda & Hawa, 2016; Okoi, Stephen & Sani, 2014).
2. Corporate governance and compliance level: some researchers focused on assessing the level of compliance by firms (Akinkoye & Olasanmi, 2014; Adegbite,2012; Kunle & Adejugbe, 2010; Demaki, 2011; Marshall, 2015).
3. Earnings management and corporate governance: There is this assertion that corporate governance can be used to manipulate earnings of an organization. Thus, studies were conducted on the effect of corporate governance on earnings management (Uadiale, 2013; Muhammed, 2014).
4. Assessment of corporate governance quality: some researchers deemed it necessary to assess the quality of corporate governance using the various codes (Adewole, Mangi, Ayeni, Otubor & Kairo, 2015; Odiaka & Olagbegi-Oloba, 2016).
5. Others: other researchers studied the issues and challenges of corporate governance (Garuba & Otomewe, 2015; Ejuvbekpokpo & Esuike, 2013). Abiola (2012) and Okolie (2014) studied corporate governance and auditing while Akindele (2012) looked at risk and corporate governance. Omankhanlen & Mukoro (2012) studied the capital market and corporate governance.
The consequences of the enactment and suspension of the National code of corporate governance code in Nigeria, one of the key issues is to improve corporate confidence and the strength and stability of the FRCN through a better research feedback approach to corporate governance. This leads to a number of questions that are and will continue to be pertinent in current and future discussions among academics, practitioners, regulators, and investors, not only in Nigeria but also in the rest of the world. This study formulates some of these questions using these in juxtaposition with the changes in the Nigerian setting referred to in the second section, to present some research opportunities tailored to the Nigerian environment. Unified Code of corporate governance
We have entered an era of more government intervention in the regulation of corporate governance. The governance of an entity is a technical venture and the establishment of code of corporate governance is, therefore, mainly an industrial or sectoral activity with an important role for the body in charged with governance. However, it was observed that pressure for a unified code of corporate governance has been raised by researchers. For example, there have been researches on the need to unify the different codes of corporate governance by a regulatory body (Demaki, 2011 & Marshall, 2015). Based on the fact that proliferations of regulations are not a product of competitive market force, there is the need to address questions such as the following: how effective are these codes? Do the differences between the entities demand for different codes? What effect will these have on investors’ perception? Having SEC code for listed companies and having CBN, NAICOM, and PENCOM codes, which one will the various entities comply with? What are the costs and benefits of enacting different codes? How can the differences between the different codes be checked? In Nigeria, a growing number of papers (Demaki, 2011 & Marshall, 2015) addressed the need for
171
unified code of governance. However, there is the need to ascertain whether specific industry code or general code is required. This has not been researched yet. The recent Etisalat Nigeria saga, where the huge indebtedness to some Nigerian banks gives practical expression to the above call for industrial specific code and especially for private entities not quoted on the flow of the Nigerian Stock Exchange (NSE). Okolo (2017) observed that, since Etisalat was taken over in June 15, 2017, over $1.72billion (ie about N541.8billon) debt impasse by a consortium of Nigerian banks, not a few people have questioned the place of corporate governance in the manner the firm conducted its business. This experience left this study to adopt one of the questions raised by Okolo (2017) which states: What is the attitude of Nigerian banks (majority if not all in this case are public quoted entities and are ironically governed by strong corporate governance codes by different regulatory authorities) to the observance of corporate governance by the companies they extend credit facilities to?
Independent oversight and enforcement
Research in the field of public oversight is emerging (e.g., Hilary & Lennox 2005; Lennox & Pittman 2010; DeFond 2009) but is mainly focused on the US. However, in Nigeria, there is no direct oversight function by regulators. There are no regulators reports on the level of compliance of corporate governance code except for those of individual researchers. In a study by Ogbechie and Koufopoulos (2010), titled ‘corporate governance and Board practices in the Nigeria banking industry’, they reported that Nigerian banks have high degree of compliance with the Central Bank of Nigeria code of corporate governance. Conversely, Onakoya, Ofoegbu and Fasanya (2012) showed a low compliance rate by the banks listed on Nigerian Stock Exchange. They evaluated the compliance rate over five years covering 2005 to 2009. In the area of compliance research, researchers have not yet assessed entities compliance level using the new code like (Ogbechie & Koufopoulos,2010; Onakoya, Ofoegbu,& Fasanya (2012; Akinkoye & Olasanmi, 2014; Kunle & Adejugbe,2015) did with the other codes. There is still the need to conduct further studies in this area and also to assess the compliance level of other sectors in relation to their codes. Studies should check whether regulatory authorities exert their oversight functions on the companies and whether the penalties meted for non-compliance are commensurate with the offences committed. Consequent on the supremacy polemics, the need for research to help address the questions is more relevant now than ever: does the requirement of FRCN in sections 38(2-4) amount to superiority? What is wrong with the enactment of a body to oversee the duties of other sectoral regulators? What are the challenges and prospects of having an oversight and enforcement body over other regulatory bodies? Does Nigeria truly need a National code of corporate governance? What obtains in other parts of the world in this regard? Audit firm Code of Corporate Governance
Auditors are essential to the governance chain of any entity. Only, three of the code stipulated external auditors concern in its code (ie, CBN,SEC and NAICOM Codes); but the codes where not in synch with the various requirements concerning external auditors. They tried to provide for rotation of auditors, appointment, how auditors should deal with clients, rendering of non-audit services to audit clients, employment restrictions, audit firm tenure, involvement of audit committee, other supervisor powers of regulators, and evaluation of audit partners. Based on the above, it is obvious that the code did not specify how and who should determine external auditor remuneration and also, at what point should the remuneration be determined?. These requirements and more are well defined by international best practices but, they are not clearly treated in these codes and where they exist, they are not explicit. Researcher can conduct studies to compare our requirements of these codes and those of international standards. Also, studies have not been done to check whether audit firms comply with these minimum standards; how and who should perform annual review of the performance of the external auditor because, the review should serve as a basis for deciding to retain the external auditor or otherwise. The audit firm itself needs to institute its governance code to coordinate its own corporate governance issues. The lack or none existence of such could be cited as a reason for the recent scandal involving KPMG in South African. Hence, empirical studies could address questions such as

172
how corporate governance code affects auditor incentives and behaviour, the extent to which it affects audit quality, instituting the code of corporate governance for audit firms, and the effectiveness and credibility of the corporate governance code regulatory body. Further research can help in assessing the most efficient and effective governance structure at the engagement level, on the one hand, and governance at the firm level and the governance of firm-wide procedures on the other hand. No much research in this area except for Abiola (2012) who studied the importance of internal auditors in ensuring dependable performance in Nigeria banking industry through effective corporate governance system and Okolie (2014) whose study evaluated whether corporate governance principles affect audit committee functions by ensuring that financial statements reflect the true financial position of companies. Public sector code and compliance level
This will be an interesting area for further research because presently, the public sector does not have corporate governance code. This made the pronouncement of the National code a laudable one when it was initially released before it met its waterloo. However, the usual lack of willpower in the public sector was also experienced in that suspended National code; where it states that the public sector code will not be applicable immediately until an executive directive is secured from the Federal Government of Nigeria (Thisday, 2016). Researchers have a benchmark to work with (The National Code,2016); to ascertain the merit and demerit of this section of the code, the strength and weakness of the code, the need for such a code in the public sector and the likely benefits. There is need to check the oversight capacity of the public sector and the need to have a body to assess the overblown powers of government in order to satisfy the interest of its stakeholders as well. Adoption of Not-for-profit governance code by such organisations in Nigeria
There have been some insinuations here and there that some of our NGOs are reckless. They lacked any coordination. The code for this sector is really a welcome development. Unfortunately, the code is nowhere. Researchers have key role to play in any nation’s development and their role here, is to conduct research in this area to show or justify the need for Corporate Govenance Code for not-for-profit entities. However, the uniqueness of this sector should not also be overlooked. Studies can be conducted to help streamline the defunct code. 4.1 CONCLUSION
In this paper, the researcher calls for studies in corporate governance in Nigeria. The researcher used the change in the Nigeria scenery to identify a number of research questions with National and global interest where Nigeria provides some unique natural experimental settings to address these questions. After the historical background, the proliferation of code of corporate governance in Nigeria was discussed. Since 2003, the different regulators generated their industry specific codes and studies have been calling for a National code. The dream was brought to reality in 2016 but for a short time. This short- lived reality still plays an important role in driving research. The study concludes that some important areas where research can help advance our knowledge and can be informative for public policy debates include: the need for unified code of corporate governance; the need for independent oversight and enforcement; instituting the code of corporate governance for audit firms, how public oversight affects auditor incentives and behaviour, the extent to which it affects audit quality, and the effectiveness and credibility of the corporate governance code regulatory body; the need for public sector code of governance; the need for code of conduct for not-for-profit entities; and compliance rate by the different entities. This study hopes that this paper will propel researchers’ interest in these areas.

173
REFERENCES
Abiola, J. (2012). Corporate governance in Nigerian banking sector and relevance of internal auditors.
Akinkoye, E.Y. & Olasanmi, O.O. (2014). Corporate governance practice and level of compliance among firms in Nigeria: Industry analysis. Journal of Business and Retail Management Research, 9(1). Available at www.jbrmr,com
Akinkumi, A. (2016). Is the National code of corporate governance for private sectors far reaching (1)? Available at https://www.googleweblight,com, Retrieved on 29 october, 2017
Central Bank of Nigeria code (2006). Code of corporate governance for Banks in Nigeria post-consolidation. Available at, www.ecgi.org>cg_code_nigeria_2006_en
DeFond, M. (2009). How should the auditors be audited? Comparing the PCAOB inspections with the AICPA peer reviews. Journal of Accounting and Economics 49(1-2), 104-108
Demaki, G.O. (2011). Proliferation of codes of corporate governance in Nigeria and economic development. Business and Management review 1(6)1-7. Available at, www.businessjournalz.org>bmr
Francis, J. (2004). What do we know about audit quality? The British Accounting Review, 36, 345-368
Francis, J. (2011). A framework for understanding and researching audit quality. Auditing: A Journal of Practice & Theory, 30(2), 125-152
Hilary, G., & Lennox, C. (2005). The credibility of self-regulation: Evidence from the accounting profession’s peer review program. Journal of Accounting and Economics, 40(1-3), 211-229
Komolafe, B. (2016). National corporate governance code to be operational in 2016-FRC. Available vanguardngr.com, retrieved on 29 october, 2017.
Kunle, A., & Adejugbe, B. (2010). A review of corporate governance codes and best practices in Nigeria. Available at www.iiste.org>JLPG>article>download
Lennox, C., & Pittman, J. (2010). Auditing the auditors: Evidence on the recent reforms to the
external monitoring of audit firms. Journal of Accounting and Economics, 49(1-2), 84-103 Marshall, J.B. (2015). Corporate governance practices: An overview of the evolution of corporate
governance codes in Nigeria. International Journal of Business and Law Research, 3(3), 49-65 NAICOM, (2009). National insurance Commission Code of good corporate governance for the
insurance industry in Nigeria. Available at https://www.naicom.gov.ng
Ogbechie, C., & Koufopoulos, D.N. (2010). Corporate governance and board practices in the Nigerian Banking industry. Available at www.ibs.edu.ng
Okolie, J.U. (2014). Corporate governance and audit committee in Nigeria. Journal of Policy and Development Studies, 9(1), 226-233
Okolo, E. (2017). Corporate governance in Nigeria: Myths and realities.available at www.allnewsandreports.com>corporate-governance-in-nigeria.
Onakoya, A., Ofoegbu, D. & Fasanya, I. (2012). Corporate governance and bank performance: a pooled study of selected banks in Nigeria. Available at https://eujournal.org>esj>article>view
PENCOM, (2008). Code of corporate governance for licensed Pension operators-PENCOM. Available
at www.pencom.gov.ng>CodeCorporate
Schilder, A. (1996). Research opportunities in auditing in the European union. Accounting Horizons, 10(4), 98- 108
SEC, (2011). Code of corporate governance for public companies. Available at www.sec.gov.ng>files>CODE OF CORPORATE GOVERNANCE FOR PUBLIC.
shleifer & Vishny, (1997). A survey of corporate governance. Journal of Finance 52 (2) 738.
Thisdayonline (2016).finally FRC unveils National code of corporate governance, october18, 2016. Available online at https://www.thisdaylive.com, retrieved on 29 october,2017.

174
An Exploration of Indigenous Accounting Practices by Non-Educated Local
Market Traders in Benin City, Edo State
E P Ebhomielen
Department of Accounting, Benson Idahosa University, Benin City. +234 802 360 0652
[email protected] _____________________________________________________________________________
ABSTRACT
This paper examined accounting practices by illiterate market traders in Benin City. The objective is to explore the types of practices by local market traders, and to define the practices in terms of indigenous or standard practices. This could define their needs for accounting guidelines adapted from International Financial Reporting Standards (IFRSs) for Small and Medium Enterprises (SMEs); as a micro and individual version suitable for them. They operate in a global environment, and like everyone else, are affected, but their needs are yet to be addressed in any form of guidelines. They need access to vital financial empowerment to grow, improve living standard, and reduce poverty. They lack access to empowerment benefits now because they are not considered accountable. A stratified random sample of 50 uneducated respondents with five-year experience in trading were randomly selected, one each from ten strata of different product groups, in five markets in Benin City. The 50 respondents were interviewed in vernacular language using a questionnaire designed with three choice answers. The data were analysed into two levels: identifying the isolated practices as indigenous practices, and the more enlightened practices as standard practices. It was found that 73% of the sample evolved indigenous accounting practices, while 27% were associated with standard practices. The research outcome alluded to evidence of indigenous accounting evolution driven by human needs. The paper recommends extension of lower version of IFRS for SMEs adapted to micro and individual level as guidelines to improve their practices. This could open them up for financial empowerment and poverty reduction in line with prevailing global United Nations Sustainable Development Goals, (UNO, SDGs, 2015). Key words:
Indigenous, Market, Traders, Accounting, Practices
INTRODUCTION
The global effort to standardize accounting practices by business and non-business organizations has yielded quite remarkable progress in developing requisite quality of accounting practices globally. One key factor driving fast development is the setting, promotion and implementation of global standards. This stride implies wholesale global convergence of different frameworks and practices to `assure the whole spectrum of accounting process value chain. However, the absence of accounting standard for micro and individual practices is a sore point in the whole endeavour; considering that in every jurisdiction, this group generates over 50% of employment in both rural and urban communities. Their empowerment is thus central to poverty reduction, a vital goal of the current regime of United Nations Sustainable Development Goals (SDGs). Standard setting is central to the effort of International Federation of Accountants (IFAC) and its Associates and Affiliates. Collaborating with affiliates, with financial support from the World Bank, and sponsoring countries like Canada, New Zealand and others, IFAC group has done a lot by issuing standards and pronouncements to date for global accounting practices. The driving force of global standards is the phenomena globalization trend which has opened up and exposed countries to the global operating environment. Thus, countries that traditionally relied on their domestic economies, have now become substantially exposed to economic influence outside their national borders. The effect of globalization does not discriminate on the basis of sizes, type and nature of organizations. All forms of organizations; large multinationals, mega corporations, medium and small enterprises; and micro, sole proprietorship and individual traders are all affected one way or another by the effect of globalization, since they operate in the same global environment.

175
Standard setters do recognize certain peculiarities and distinctions on the basis of large, medium and small enterprises. IFRSs makes such distinction and provides for IFRS for SMEs. The attempts is to recognize the compliance capacity and limitations of SMEs. Unfortunately, there are no efforts yet to address the accounting needs of micro, and individual businesses though they account for more than 50% of employment of labour in many countries. The Financial Reporting Council Act 2011, recognizes extant international standards in Accounting and Financial Reporting and adopts IFRSs and IPSASs for both private and public sectors respectively. By implication, the road map for compliance with IFRSs and IPSASs also recognized IFRS for SMEs. NASB (2010:21) on SMEs states:
“The scope of application of IFRS with respect to the size of entities, as well as defining clearly whether IFRS will apply only on the preparation of consolidated financial statements are issues to be addressed. There is an international standard for small and medium size entities (IFRS for SMES), which jurisdictions are also expected to consider for adoption.”
It is clear that NASB (2010:23), not only indicated adoption of SMEs but also scheduled the Roadmap for implementation of IFRS for SMEs for 2014. The implication is that SMEs would report Financial Statements based on IFRS for SMEs as at 31 December, 2014. However, SMEs that do not meet the IFRS for SMEs criteria can report using “Small and Medium–Sized Entities Guidelines on Accounting” (SMEGA) Level 3 issued by the United Nations Conference on Trade and Development (UNTAD). Whereas, IFRS for SMEs issued by International Accounting Standards Board (IASB) and SMEGA issued by UNTAD address small and medium enterprises, both of them, including The Institute of Chartered Accountants of Nigeria (ICAN), have not set guidelines for micro and individual businesses. Though the latter sector like the large and SMEs are all affected by the same global operating environment; and they offer great prospects of mass employment generation; the accounting profession globally, has neither addressed nor even recognized the accounting needs of these significant micro and individual employers of labour. The government has not considered the plight of these neglected groups, even though they are pursued vigorously to pay tax. Without accounting framework for micro and individual accounting and financial reports guidelines, how are the taxes assessed? That poser remains the million dollar question begging for answers. By 2017, three years after the deadline for implementation of IFRS for SMEs in Nigeria, the time to find out what is happening at the micro and individuals levels has come, and feedbacks on how they are accounting becomes imperative. It could then be possible to define what they need as a prelude to setting some guidelines, which could eventually lead to future standards.
Objective of the Paper
The main objective of the paper is to empirically asses the type of accounting practices associated with illiterate traders in the local markets in Benin City. Subsidiary objectives are to explore some form of micro and individual practices and relate them with standard accounting practices. Such association could help to define the gap between traders’ accounting practices and standard practices. What they require could thus be derived from the observed differences between individual practices and extant standards. The outcome could foster the effort to set guidelines.
LITERATURE REVIEW
The Neglected Accounting Sector
Accounting has been associated with man from creation. It actually has been a natural science practised by everyone involved with generating, expending or accounting for resources; whether personal or entrusted. The individual accounting skill develops differently in persons depending on how closely one is involved with handling money or other resources. The sources of individual accounting skills that stand out clearly include: (a) The knowledge of number or numeral system of the local languages. (b) Mental arithmetic skills acquired on exposure to the job. (c) Informal training in accounting under apprenticeship’ scheme provided by parents, guardian or other masters. (d) Formal elementary education using vernacular or second language as a youth. (e) Preliminary exposure to accounting function either as producer or market trader. (f) Intense exposure to accounting function by function of office, either as secretary or treasurer or chairman of

176
thrift association. (g) Accounting exposure as trader or producer of goods and services. (h) Formal accounting training in educational institution or correspondence course. Individual Accounting Practices gain public attention when public interest or; entrusted resources are involved, or the business gains significance in terms of size or volume of business. Thus, micro and individual accounting practices may grow to the level that demands some form of guidelines, but none has been developed so far. They are thus in the neglected accounting sector
Characteristics of the Neglected Accounting Sector
A number of factors may account for not recognizing micro and individual accounting practices for standards setting: a. The entity may be perceived as not having public accountability obligations b. Their capital or debt instruments are not publicity traded. c. They issue no instrument for trading in public stock exchange market d. They hold no assets in fiduciary capacity for outsiders. e. Their turnover is usually small relatively to that specified by regulations f. Their assets value is usually small relative to that specialized by regulation. g. No foreigner is involved in the business either as director or member. h. No nominee of government or its agency is involved in the entity. i. The directors hold not less than 51% of paid capital. Although the foregoing conditions may define the restrictive interest of micro and individual enterprise accounting character they cannot justify the absence of some guidelines for the accounting practices for the sector. Public interest alone does not define the character of Accounting. Public interest may inform the utilitarian quality but not the quality characteristics. After all, accounting information utilisation is based on individual environment specifications rather than expectations of specific user group.
The Root of Individual and Micro Enterprise Accounting Practices
Conventional accounting history accepts that Luca Pa Cioli, the Italian monk, invented the double entry book keeping system. He may have recognised and documented double entry system, for which he remains unique, but this research study does not confirm exclusive origin of accounting from Italy. Ordinary illiterate traders without any form of exposure to accounting education have been shown to developed some form of indigenous accounting practices to meet their needs, without realising that what they are doing have a bearing in modern accounting practices. Accounting could thus be said to evolve with man to meet needs. Responding to felt needs is the mother of innovation and invention! Accounting complies with that age long maxim. This however does not contradict the reality of imported accounting system and indeed the relevance of IFRSs that underlie the root of globalisation. It takes accountants to define indigenous practices, identify, and classify them in contexts of accounting. In medical sciences and indeed many other branches of knowledge, the root of any discipline attracts research interests. This has not been so with accounting. Accountants generally focus on utilitarian issues based on already developed systems derived from their country’s former colonial masters. They recognise typical differences between one colonial master’s system of accounting and those of others. If differences manifest and are recognised at the macro level of countries, could accounting researchers not explore micro and individual level manifestations. Could such differences exist as between language communities or cultural jurisdictions? Could there not be some values in finding out why for example, the ancient Benin Empire had zero public sector corruption tolerance index in the execution of public projects? How did accounting practices inform such financial probity in the Empire? Could modern society like Nigeria not learn from the benefit of lesson of ancient practices? Nigeria appears fighting a losing battle with corruption, while the malaise is elusively permeating the nooks and crannies of the country. Do we have same level of corrupt practices at micro and individual practices level as we can see in conventional practices? These are questions raising issues with continuing with extant practices

177
without seeking improved innovative paradigm. Attempt at setting some guidelines for micro and individual accounting practices should gain some momentum at this stage.
Statement of Membership Obligations
IFAC Constitution (Para.2.3b) requires members to comply with statements of membership obligations. Each statement of membership obligation (SMO) has a framework with which to mandatorily comply in the process of implementation. IFAC however recognises that its members operate under different national, legal, regulatory, economic and political systems and frameworks. The members are professionals working in different sectors of the accounting profession. SMO outlines applicable framework requiring members to use their best endeavours to comply with specific requirements. A member will be considered to have used his best endeavour if it could not reasonably do more to meet requirements. He may make efforts evidently of self-assessment in compliance. He may assess the standard in place compared with extent international standards. He could develop, execute and update action plans towards compliance. He may assess ability to increase further compliance level and monitor progress towards compliance. Adapting this model to developing guidelines for micro and individual accounting practices could lead to impacting the neglected areas positively. The beginning point however is to empirically develop the key micro and individual accounting parameters from field research. Attempt to document indigenous practices, note observations on gaps, and key findings. The significance hinges on the fact that accountants involved in micro and individual financial statements owe SMO obligations on compliance. That obligation will be absurd if no form of standards or guidelines exists. The IFAC mission to serve public interest by developing high quality international standards and promoting the global implementation of same is implicitly relevant to the micro and individual accounting practices sector. We must speak out if no one else does on this neglected area in public interest and recognise this fertile ground where accounting expertise is most relevant.
THEORETICAL FRAMEWORK
Entity Theory
Accounting is perceived from the entity concept. The entity may be a human or legal person, or a fund. It is the basis for accounting, and owes the duty to account, rather than the accountant compiling the data and reports. The entity owns the accounting information and the reporting is done on its behalf. The significance of this theory is that the obligation to account is imperative and has no vacuum or exceptions. The micro and individual entity has same obligation to account as any other irrespective of size. (Companies and Allied Matters Act,(CAMA), 1990, Section 331) Agency Theory
Globalization implies spatial distance between owners, those entrusted with the resources of the entity; and the entity itself. Those charged with governance are in agency position and owe a duty to account to owners as their principals. Corporate governance obligations require to so manage the entity to the satisfaction of owners and mindful of owner interest in decisions and management of the entity and its resources by those charged with governance. Owners by law are officers of the entity when it comes to the duty to account. (CAMA), 1990, Section 245 (3). Stewardship Theory
It is obligation for those entrusted with resources to account for same to those who entrusted them. Accounting in this context goes beyond mere financial reports but includes non-financial account for other non-financial resources entrusted. It is a divine mandate. (Holy Bible, Luke 19:11-27) Characteristics of Financial Reports
The accounts offered in the stewardship accountability process must conform to set quality characteristics irrespective of whether the reporting entity involved is individual, micro, SMEs, large company or other organisations. Whether the entity is governed by specific applicable standards or not, the involvement of an accountant in the preparations or auditing of the accounts of the entity imposes an obligation to comply with quality characteristics. The Key quality characteristics include the following a) to z), which accounts must bear relevance to in order to be qualitative: a. Reliability; b. Prudence; c. Substance over form; d. Conservation; e. Understandable; f. Timeliness; g. Faithful representativeness; h. Freedom from Bias; i. Neutrality; j. Reality; k. Complete and fullness; l. Relevance; m. Materiality; n. Objectivity; o.

178
Verifiability; p. Integrity; q. Presentation economy; r. Comparability; s. Consistency; t. Identifiable; u. Informative; v. Usefulness; w. Functionality; x. Uniformity; y. True and fair; z. Compliant with Standards. These characteristics are derived from several study groups globally: i. Corporate Report, 1975 UK ii. Robert Trueblood Report, 1973 USA iii. Francis .Sandiland Report, 1970 UK iv. NASB, SAS 1, 1982 Nigeria v. IFRSs, Extant, US & UK Imperativeness of Micro and Individual Accounting Guidelines
The obligation owed by accountants for the quality of financial statements implies that they have to use their professional judgement to decide which approved standards could be adapted in the preparation of micro and individual entity’s accounts. Due to absence of established guidelines, there is no framework for assessing the compliance or otherwise of what the accountant may have done in the circumstance. Different accountants could possibly adopt different sets of practices as appeal to their perception in making judgement. The result is differential practices manifesting in spite of prevailing effort at global unified standards regime. To reasonably solve this problem, there should be some guidelines generally agreed by the accounting profession applicable to micro and individual financial statements, as has been done for IFRS for SMEs. Such development could bring some order to the unacceptable confusion that could range in that neglected sector!
METHODOLOGY
Research Design
This research involves a survey of random sample of uneducated traders in five markets in Benin City, using questionnaire translation to determine the accounting practices usually associated with them in their normal businesses. The responses are analysed and related to accounting practices, in attempt to define, the type and nature of accounting done by them. What they do but in crude form could then be identified to determine what they need. Any educated person or those who are knowledgably about the accounting discipline are eliminated from the survey. Emphasis is on illiterate traders who lack formal knowledge of accounting. Thus indigenous accounting tradition could be identified from their answers to the questions. Population for the Study
The total population of traders in a local market may not be relevant to the design of the research, as only illiterate traders qualify for selection. Involving others could bias the study. Thus limiting the population to a stratified sample covering ten different product groups in five different markets in Benin City. Sample Those that qualify are adult traders without any form of education; involved in trading for not less than 5 years, but no gender discrimination. However, it was considered that a stratified random sample of traders by type of goods traded will give reasonable unbiased indication of what they practice in terms of indigenous accounting. The stratification was done on the basis of ten traded products as follows: a) Yams; b) Garri; c) Rice; d) Palm oil; e) Meat; f) Fish & crayfish; g) Soup & stew ingredients; h) Fruits; i) Cooked food; j) Clothes. These products are staple items in common general demand, imposing daily routines that tend to create proficiency or expertise. Ten traders, one from each product group, were randomly selected in each of the five markets for the survey, in total 50 respondents in stratified random sample. The five markets surveyed are namely: a) Oba Market, Ring Road, Benin City; b) New Benin Market, New Lagos Road, Benin City; c) Uselu Market, Uselu-Lagos Road, Benin City; d) New Ogiso Market, 1st East Circular Road, Benin City; e) Santana Market, Sapele Road, Benin City. The stratification into ten product groups eliminates incidence of group dominance effect that could bias the sample result. The spread to five city markets, gives broad representativeness of rural and urban characteristics which typifies pragmatic accounting environment. Restricting the sample to illiterate traders shields the study from the influence of modern accounting knowledge on the micro

179
and individual practices. Thus isolating the source of such practices as deriving from indigenous evolution.
Method of Data Gathering A structured questionnaire was used to obtain respondent explanations by personal interview; and explanations of the questions were done through the research assistant who is a native of Edo State and speaks the local language fluently. The answers were similarly translated to complete the questionnaire. Clarifications were obtained where responses were unclear. Respondents are expected to choose from the three multiple choice options. The option (a) reflects the nearest answers to the level expected of the least sophisticated respondent. Option (b) is a bit more sophisticated than option (a) but not quite as good as option c); while option (c) is the most sophisticated option reflecting the nearest to standards of modern practices. The questions are simple and straight forward to ease understanding. Respondent are simply required to choose the option nearest to their actual practices. The questions and multiple choice options are translated to the local language and explained by the research assistant while respondents indicate clear understanding before they choose option which the research assistant confirms with them before marking the confirmed option. Measurement and Quantification
The three option are assigned value of 1 for every respondent score for each option. The total score for each option depends on the number of respondents using such method. The preponderance of users of an option thus determines the commonness of such practice and its representativeness of common practices among the group and the community. The scores from the respondents are analysed and quantified, using these values accordingly as quantifiers. The preponderance of respondent in particular group reflect the state of the micro and individual accounting practices among that group. The group with the highest score typifies the dominant practice among the population surveyed. The disparity in score between the indigenous practice and the standard practice, indicates the gap in development which suggests the expected gap which the indigenous practice should be upgraded. This gap demands the setting of standards or guidelines to bridge the disparity in the practices. Analysis of Data
The data obtained from the survey is shown in Appendix TWO. The relative score of micro and individual practices for the five markets surveyed are shown in Column 1 of Table One as against standard practice as shown in Column 3 of Table One below: Table One: Analysis of Relative Scores
1 2 3 Oba Market 109 54 37 200 New Benin 107 50 43 200 Uselu 108 52 40 200 Ogiso 107 53 40 200 Santana 110 51 39 200 Total 541 260 199 1,000
Source: Author’s Analysis of Field Data (2017) The extreme scores manifest in columns 1 and 3 with scores of 541 as against 199. The micro and individual practices are indicated by column 1 with total score of 541 while the near standard scores for column 3 scored 199, representing enlighten practices. The significant scores for the micro and individual practices and enlightened practices among the sample surveyed can be refined. The use of simple percentages to analyse the scores clearly illustrates the relative status of differential practices among indigenous traders’ involvement in accounting practices as shown in Table 2 below:

180
Table Two: Percentage Analysis of Relative Scores
Micro/Individual Enlightened
Scores % Scores % Total
Oba 109 74.6 37 25.4 146 New Benin 107 71.3 43 28.7 150 Uselu 108 73. 40 25. 148 Ogiso 107 72.8 40 27.2 147 Santana 110 73.8 39 26.2 149 541 73% 199 27% 740
Source: Author’s Analysis of Field Data (2017) From the Table Two above 73% of traders in the five markets sampled are involved in micro and individual accounting practices while only 27% appear to practice enlightened accounting system though informally on the job practices. Though it is not clear where those minority traders practising standard accounting got access to such knowledge, it is clear that the 73% majority had no access to accounting knowledge. It can thus be strongly argued that they evolved their practices from indigenous sources. Derivation of Types of Accounting Practices by Traders
The nature of accounting practices that traders are involved in can be interpreted from their responses to the questionnaires. The interpretation of functional accounting practices and description of implied type of accounting are as follows: Table Three: Interpretation of Indigenous Practices in terms of Standard Practices
S/N Functional Practices Implied Types of Accounting Work
1. Cost per unit - Simple costing 2. Selling price - Cost accounting 3. Profit per unit - Financial/Accounting 4. Stock records - Stock accounting 5. Total cost - Cost and management accounting 6. Expenses recognition - Budgeting 7. Bank accounts - Internal control 8. Debt recognition - Accrual accounting 9. Creditors recognition - Accrual accounting 10. Safe-keeping of cash - Internal controls 11. Languages - Indigenous accounting 12. Numerals - Derivatives indigenous accounting 13. Profit for period - Financial accounting and reporting 14. Sources of accounting training - Indigenous accounting derivatives 15. Tools of accounting - Mental skills
- Indigenous accounting - Derivatives
16. Capital source - Financial management 17. Entrepreneurship development - Micro-scale station indication 18. Employee supervision - Management function 19. Expense and cost determination - Planning and budgeting 20. Stock drawing - Accounting adjustments Source: Author’s Analysis, (2017)
Empirical Evidence of Indigenous Accounting Practices
From the analysis in the Tables One and Two above, it is clear that though in some crude form, traders are actually trying their hands in the following accounting practices summarised from Table Three. 1. Cost accounting; 2. Financial accounting; 3. Stock accounting; 4. Budgeting and planning; 5. Internal controls; 6. Cash based accounting/system; 7. Financial management; 8. Management functions; 9. Financial reporting.

181
Accounting Practices Alien to Micro and Individual Practices From the analysis of responses, traders are not involved in the following accounting processes: a. No vouchers with authentic supporting documents; b. No accounting books and records are maintained; c. No accounting tools are maintained to facilitate the accounting practices; d. No accounting training is obtained by formal and informal on the job skills acquisition; e. Access to finance is severely restricted, with little or no positive impact from banks; f. Inclination to increase capacity is low; g. Internal control hinges substantially on personal supervision and monitoring; h. No annual financial statement prepared and no external audit involvement; i. No impact of trained accounting personnel on their business; j. Businesses are subsistence level and very risky for Bank financial assistance; k. Control over stock is maintain physical controls, no effective internal control not much of stocking can be afforded. So batch purchases is the over; l. Lot of persuasive strategies required to create a change in their operational paradigm.
Indigenous Accounting Practices Vocationally Evolved by Traders
From analysis of responses and Table Three, it is clear that some elements of accounting practices by traders are indigenous, never copied from anywhere else. These elements include the following: I .The application of Edo language of Accounting; ii. The application of Edo numeral system in accounting; iii. The sources of accounting knowledge and practices were not traced to anywhere else. This could leads to the conclusion that accounting is a natural science that can be developed indigenously as a necessity by the local users to meet their needs. Iv. The tools of accounting clearly exhibited by traders are outstanding; Internal skills development; v. The development of mental arithmetic skills by trades is incredible through they never had any mathematics education; vi. Use of Edo language vii Use of Edo numeral system; viii. Deployment of entrepreneurial skills evolved as the business grew; ix. Some elementary skills in planning budgeting are evident; x. They exhibited some element of the principles of business management though not clearly comparable to traditional management theories; xi. Preparation of financial accounting though not in writing. Edo traders did not demonstrate evidence of written reports.
Some Discussion on Findings
It is observed that the traders’ mental arithmetic skill is outstanding and the speed with which they use it is incredible. They have evolved indigenous accounting which can be identifiable to what is available in the professional accounting functions. Though crude because of lack of tools such as writing skill and aid to mathematical calculations the traces of what they do can be interpreted in today’s professional accounting language. Much of the accounting done by traders is utilitarian and no form of accounting philosophy or theories could be identified. There are no known Edo publication in accounting. They do not adopt annual financial report to measure performance, though reporting could be done by mental calculation on batch basis. A new batch starts a new accounting period. They are not involved in auditing. No auditing function could be traced from their practices. They attempt to do their checking themselves. They practice cash based accounting and not much of accounting adjustments and measurements are apparent. No traditional formal accounting education was developed by traders. Training is by mentoring system integrated with apprenticeship under parents, or masters or guardian.
CONCLUSION
The body of evidence in this research invariably leads to the conclusion that accounting as a natural science evolves indigenously by people to meet their needs; using whatever relevant tools they could minister. The research outcome shows clearly that Edo traders who never had any contact with western civilization, and foreign accounting systems are indeed involved in some form of indigenous accounting practices, in their own language and with their own numeral system, to meet their needs. Though, they lack knowledge and skills of writing, much of their accounting is done mentally. Accounting as a body of professional knowledge and skills can be developed and grow at the pace of development of the indigenous people. That explains why accounting has today globalised and assumed the language of business in line with the contemporary globalization trend. Just as

182
indigenous people can benefit from the impact of more advance technologies accounting has thus revolutionized global practices from the crude practices of indigenous people. Accounting education should therefore permeate the nooks and crannies of every society and reach out to every community just like the plain language of global communication. Accounting should thus assume the global lingua franca of business and of every community!!!
Recommendations
The dearth of accounting impact at the community level is a major setback for what IFAC public interest obligation portends. The accounting profession may well modify some accounting standards or guidelines suitable for the micro and individual entrepreneur. This could create incentive for financial empowerment to enable them create jobs and affect the economy positively. Much of the funds for micro credits sector are not getting to the micro and individual entrepreneurs because of the precarious dearth of accounting impact. They are not attractive to banks because of poor accountability culture. The need to ameliorate this problem, is rife, and calls for some programme of re-orientation. It is much better to empower micro and individual entrepreneurs than to embark on multi-million Dollars white or black elephant project, which impact may never be felt, (World Bank Report, 2004). This programme of local training could foster the successful implementations of SDGs poverty reduction programmes. The most effective social impact on citizens is to train them in accounting skills, to enable them benefit from financial empowerment programme. This could raise their standard of living and create social satisfaction. ICAN could extend the mandatory professional education training to the community levels, supplemented by government funding.
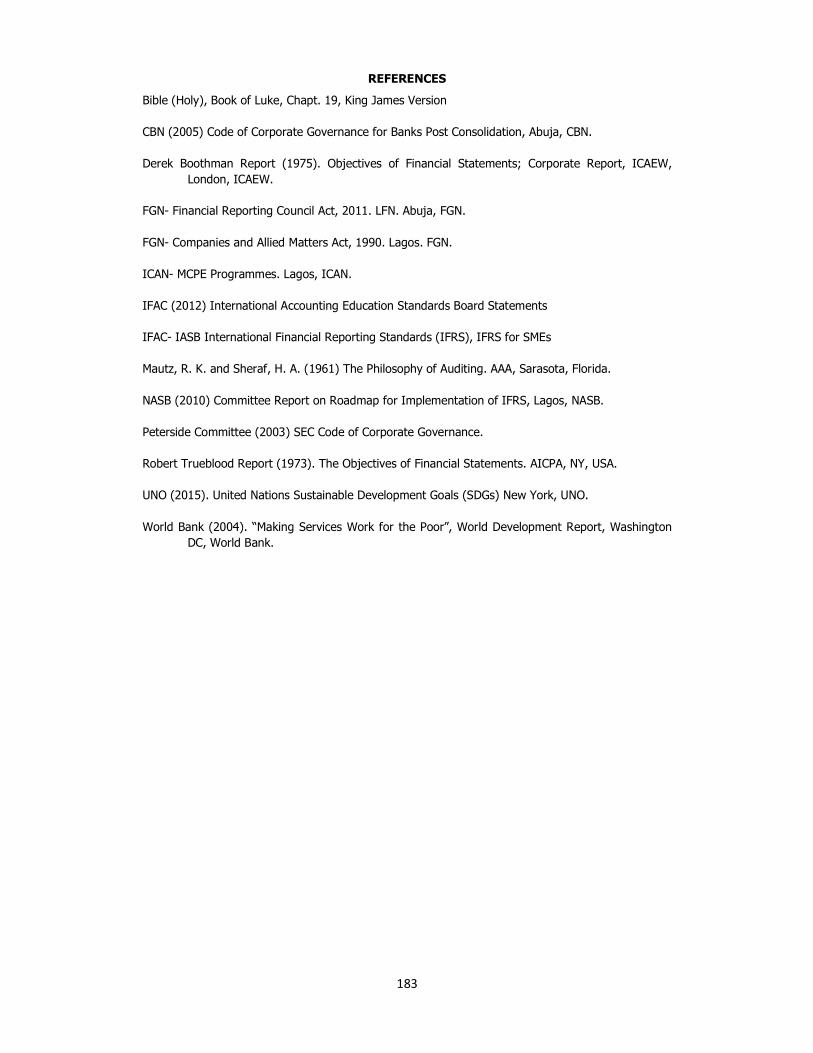
183
REFERENCES
Bible (Holy), Book of Luke, Chapt. 19, King James Version
CBN (2005) Code of Corporate Governance for Banks Post Consolidation, Abuja, CBN. Derek Boothman Report (1975). Objectives of Financial Statements; Corporate Report, ICAEW,
London, ICAEW. FGN- Financial Reporting Council Act, 2011. LFN. Abuja, FGN. FGN- Companies and Allied Matters Act, 1990. Lagos. FGN. ICAN- MCPE Programmes. Lagos, ICAN. IFAC (2012) International Accounting Education Standards Board Statements IFAC- IASB International Financial Reporting Standards (IFRS), IFRS for SMEs
Mautz, R. K. and Sheraf, H. A. (1961) The Philosophy of Auditing. AAA, Sarasota, Florida. NASB (2010) Committee Report on Roadmap for Implementation of IFRS, Lagos, NASB. Peterside Committee (2003) SEC Code of Corporate Governance. Robert Trueblood Report (1973). The Objectives of Financial Statements. AICPA, NY, USA. UNO (2015). United Nations Sustainable Development Goals (SDGs) New York, UNO. World Bank (2004). “Making Services Work for the Poor”, World Development Report, Washington
DC, World Bank.

184
APPENDIX ONE
QUESTIONNAIRE
1) How do you arrive at the cost per unit?
a) Add cost of purchase and transport b) Add cost of purchase, transport, and cost of goods taken by to the union chairman c) Add ‘a’ and ‘b’ above, plus my trading expense.
2) How do you arrive at the price offered?
a) Adopted the prevailing market price b) Add all my costs and divided it by the number of unit of goods for sale c) Both options ‘a’ and ‘b’ above, plus my trade expenses
3) How do you arrive at the profit per unit?
a) Subtract the cost of the goods sold from the sales made b) Subtract the total cost of the goods from the total sales, divide by units sold c) Add the cost of goods plus all expenses deducted from sales, divide by units sold
4) How do you keep your stock record?
a) Deduct units sold from total units purchased b) Count the unsold stock items c) Deduct units sold and /or withdrawn from units purchased
5) What make up total cost of purchases?
a) Add up all expenses incurred for purchases b) Add up all expenses and trade debts for purchases c) Add all paid and unpaid trade expenses of purchases
6) What are your expenses?
a) Cost of the goods plus expenses incurred for the business b) Cost and expenses of the business plus personal business expenses c) Cost and expenses of trade, personal expenses and borrowing cost for trade
7) Which bank do you have account with?
a) I have no Bank Account b) I have Account with a Bank c) I use the Bank and Daily Savers and borrowed money from them
8) What debts are people owing you?
a) Nobody is owing me any debt b) Few costumers owe me c) Those owing me are Costumers and distributors
9) What amount are you owing others?
a) I do not owe anybody b) I owe my supply customers c) I owe my major suppliers and depositors
10) How do you keep your money safe?
a) I hide money away from everyone b) I put some in bank and some to the daily collectors c) I bank all my money
11) What language do you speak?
a) I use Edo Language b) I use Edo Language and seek interpreter for pidgin English c) I speak Edo and English Languages
12) What numeral system do you use in your business?
a) I use Edo numeral system b) I use Edo numeral and reckoner and calculator c) I use Edo and English Numerals and calculator
13) How do you calculate your profit for a period?
a) Add all purchases and expenses and deduct it from sales for a period b) Add all purchases and expenses, paid and unpaid, and deduct from sales for a period c) Add all purchases; expenses paid or unpaid, and my expenses, deducted from sales.
14) How did you learn the accounting you practise in your trade?
a) On the job training

185
b) On the job training and period of apprenticeship c) Apprenticeship training and personal experience
15) What do you use to calculate values in your trade?
a) Mental arithmetic skills b) Mental arithmetic plus reckoner c) Mental arithmetic and calculator
16) How did you obtain money to start your business?
a) Personal savings b) Personal savings and help from relatives c) Personal Savings; family and friends help plus bank facilities
17) Do you pay staff remuneration in your business?
a) I do not pay remuneration to anyone b) I pay myself and my children and relations c) I pay myself and other employee
18) What work do persons you pay do and how do you monitor them?
a) Business assignment and general duty supervised personally b) Supervises for me when I am away c) He runs my branch office
19) How did you derive the expense amount?
a) Expenses are negotiated by me b) I calculate all expenses on that item c) I calculate the cost and associated expenses
20) When goods are withdrawn, how do you treat it in business practice?
a) Goods withdrawn are not associated with expense or income b) Goods withdrawn are deducted from goods purchased for sale
The value of goods withdrawn is added to sales, and deducted from profits.

- 186 -
APPENDIX TWO Data Obtained from the Survey
Oba Market New Benin Market Uselu Market Ogiso Market Santana Market Total
1 2 3 1 2 3 1 2 3 1 2 3 1 2 3 1 2 3
1. 5 3 2 4 3 3 5 3 2 4 3 3 4 3 3 22 15 13 2. 5 2 3 5 3 2 5 2 3 5 3 2 5 3 2 25 13 12 3. 5 4 1 5 3 2 5 2 3 5 2 3 5 3 2 25 14 11 4. 4 3 3 4 3 3 4 3 3 4 3 3 4 3 3 20 15 15 5. 4 4 2 4 4 2 4 4 2 4 4 2 4 4 2 20 20 10 6. 5 3 2 5 3 2 5 2 3 5 2 3 6 2 2 26 12 12 7. 4 4 2 4 4 2 4 4 2 4 4 2 4 4 2 20 20 10 8. 2 4 4 2 4 4 2 4 4 2 4 4 4 2 4 12 18 20 9. 2 4 4 2 4 4 2 4 4 2 4 4 2 4 4 10 20 20 10. 2 4 4 2 4 4 2 4 4 2 4 4 2 4 4 10 20 20 11. 8 0 2 7 0 3 7 0 3 7 0 3 7 0 3 36 0 14 12. 6 2 2 6 2 2 6 2 2 6 2 2 6 2 2 30 10 10 13. 6 2 2 5 3 2 5 3 2 5 3 2 5 3 2 26 14 10 14. 7 3 0 7 1 2 7 1 2 7 1 2 7 1 2 35 7 8 15. 9 1 0 9 0 1 9 1 0 9 1 0 9 0 1 45 3 2 16. 4 4 2 4 4 2 4 5 1 4 5 1 4 5 1 20 23 7 17. 8 1 1 9 0 1 9 1 0 9 1 0 9 1 0 44 4 2 18. 9 1 0 9 0 1 9 1 0 9 1 0 9 1 0 45 4 1 19. 6 3 1 6 3 1 6 4 0 6 4 0 6 4 0 30 18 2 20. 8 2 0 8 2 0 8 2 0 8 2 0 8 2 0 40 10 -
109 54 39 107 51 43 108 52 40 107 53 40 110 51 39 541 260 199

187
Effects of Firm Characteristics on Timeliness of Financial Reporting of
Listed Agriculture Firms in Nigeria
Ismaila Olotu Abdullahi1, Abdullahi Musa Abdullahi2 ,
Sani AbdulRahman Bala3
1Department of Accounting, Nasarawa State University, Keffi,
[email protected] +2348030645100 2Department of Accounting, Nasarawa State University, Keffi,
[email protected] +2348034255663 3Department of Accounting, Usmanu Danfodio University, Sokoto,
[email protected] +2348034363250 _________________________________________________________________
ABSTRACT A policy thrust of the current administration in Nigeria is development of the agricultural sector. Timeliness is a vital characteristic of accounting and it is an important element of the relevance of financial reporting information. The purpose of this paper is to examine empirically the effect of corporate characteristics on timeliness of financial reports of listed agriculture firms in Nigeria. Firm characteristics used include firm size, profitability, growth, liquidity, leverage, and auditor type. The period for the study is 2006-2015. The data were analyzed using panel regression analysis. The study found that there is variability in the timeliness of financial reporting by agriculture companies and, companies in this industry delay reports beyond the regulatory threshold. In addition, it was found that firm growth has a positive and statistically significant effect on timeliness. The relationship between firm size, profitability, liquidity, leverage and auditor type on timeliness is not statistically significant. It is recommended, that efforts should be made by companies to avail annual reports timely.
Keywords:
Timeliness, Firm Size, Growth, Liquidity, Profitability, Leverage,
INTRODUCTION
The primary objective of financial reporting is to provide high-quality financial reporting information concerning economic entities. The information is basically financial in nature and useful for economic decision making. The usefulness of published financial reports depends on their accuracy and their timeliness. The timeliness means presenting the financial accounting information for its users when they need it. This is because the information losses its benefit, if it is not available when it is needed. Timeliness of accounting information is essential for the financial report’s users because they require current information to make predictions and laudable decisions (Zeghal, 1984). The quality of financial reports depends in part, upon the frequency and timeliness of reporting (Miller & Bahnson, 1999). Timely disclosure and presentation of information improve the image of corporate bodies because they reflect managerial efficiency and effectiveness (Joshi, 2005). The importance of timeliness is further supported by the research of Abdulla (1996), who suggested that a shorter time between the financial year-end and publication date is more beneficial to users. Furthermore, Leventis, Weetman, & Caramanis (2005) asserted that in emerging market economies, timeliness in reporting of otherwise non-publicly available financial statement information remains, for the most part, the only means by which outside shareholders and investors keep themselves informed of the firms’ performance. In the present economic scenario, this concern for timely reporting becomes more acute as emerging market economies face greater uncertainties as they combat the ongoing global financial crisis. Therefore, as noted by Jaggi and Tsui (1999), it will be beneficial to both international and domestic investors understanding the causes of delays in the release of audit reports in the context of an emerging economy. The need for high quality and timely financial information has become particularly imperative due to the increasing exposure of Nigerian business organizations to international capital markets. Thus, the business organizations

188
are obliged to satisfy the information demands of foreign investors and to provide them with more timely information in annual financial reports. Recognizing the importance of timely release of financial information, regulatory agencies and laws in Nigeria have set statutory maximum time limits within which listed companies are required to issue audited financial statements to stakeholders and also file such reports with relevant regulatory bodies. It is required that financial statements comply with the Statement of Accounting Standards (SAS) issued by the Nigerian Accounting Standards Board (NASB) (now referred to as the Financial Reporting Council of Nigeria, FRCN) and that the submission of audited financial statements to the Corporate Affairs Commission (CAC) within 42 days of the annual general meeting (Adebayo & Adebisi, 2016) and publication of audited financial statements by all public limited liability companies in at least one national daily newspaper. The policy drive of the current administration in Nigeria is towards agriculture. This is likely to attract investment in the sector. A study on the factors that explain timeliness of reporting by firms in this sector is therefore necessary. Although there are studies that have examined the effect of firm characteristics on financial reporting timeliness, most of these studies are not industry specific (eg Modugu, Eragbhe & Ikhatua, 2012; Iyoha , 2012; Ibadin, Izedonmi & Ibadin, 2012) while others which are industry specific (eg Adebayo & Adebiyi, 2016) focused on the financial sector. Hence very little is empirically documented on the determinants of timeliness of financial reporting in the agriculture industry. The aim of this study therefore is to examine the effect of firm characteristics on timeliness of reporting by listed agriculture firms in Nigeria. EMPIRICAL REVIEW
Khasharmeh and Aljiri (2010) examined the determinants of audit delay in two developing countries, the UAE and Bahrain. The study utilized a sample of 83 firms listed in either the UAE or Bahraini Stock Markets for the period 2004. Cross-sectional regression analysis was employed to test the hypotheses of the study. The results of this study show that four variables (profitability, debt ratio, sector type, and dividend payout ratio) examined in Bahrain appear to have a strong influence on the timeliness of annual reports (audit delay). However, audit type, firm size, and price earnings ratio are found to have a weak effect on the audit delay. In the UAE, the study found debt ratio and audit type to have a strong influence on audit delay, while the other variables were found not to have a significant effect on it. Oladipupo (2011) investigated the extent of audit lag in Nigeria. Forty companies were selected. Both univariate and multivariate analyses were performed on the data collected. The study observed that; audit delay ranged from 16 to 284 days; Nigeria listed companies take approximately four months on the average beyond their balance sheet date before they are finally ready for the presentation of the audited accounts to the shareholders; that profitability, total assets, total debt to total equity, audit fees and industry type have no significant impact on audit delay. Modugu, Eragbhe and Ikhatua (2012) examined the relationship between audit delay and several company characteristics in Nigeria. The study selected a sample of 20 quoted companies covering the period, 2009 to 2011. Company characteristics used include leverage, firm size, auditor type and profitability. The study used pooled ordinary least square regression to analyse the data. The study found that multinationality connections of companies, company size and audit fees paid to auditors have positive and statistically significant effect on audit delay. On the other hand, profitability, leverage and audit firm size have no significant effect on audit delay. Iyoha (2012) examined the impact of company attributes on the timeliness of financial reports in Nigeria. Using a sample of 61 companies’ reports for the years 1999 – 2008 and analyzed using Ordinary Least Squares (OLS) and complemented with panel data estimation technique. The results showed that the age of the company is the major determinant of timeliness in Nigeria. It was also discovered that there is a significant difference in the timeliness of financial reporting among industrial sectors of the economy and, that the banking sector is timely in financial reporting.

189
Ibadin, Izedonmi and Ibadin (2012) investigated the relationship between corporate governance variables, corporate attributes variables and timeliness in a developing country, Nigeria. Using a sample of 118 listed companies on the Nigerian Stock Exchange (NSE). The study depended on the use of descriptive statistics and the Ordinary Least Square (OLS) regression analysis. The study found that corporate attributes (profitability, leverage, firm size and audit firm size) have no significant effect on timeliness of corporate reporting. Alkhatib and Marji (2012) investigated the factors that affect the timeliness of audit report in Jordan. The study sampled 137 firms listed on the Jordanian Stock Exchange. Variables used include auditor type, leverage, profitability, firm size and a dummy variable for industry type. The findings revealed that for the services sector profitability, type of audit firm, and company size have negative but statistically not significant effect on audit timeliness, while leverage has positive and statistically significant effect on timeliness. Comparatively, the results for the industrial sector showed that profitability ratio, type of audit firm, company size and leverage also have negative effects on timeliness but this is not statistically significant. Al-tahat (2015) examined the timeliness of annual financial reports published by companies listed on the Amman Stock Exchange (ASE). Firm attributes used include firm size, profitability, growth, age, leverage, and audit firm size. The study used logistic regression to analyse the data. This is because timeliness was measured using dummy variable (1 if company reported within the required period, 0 otherwise). The study found that there is a significant relationship between profitability, growth, and audit firm size and timeliness. No significant relationship was found between the timeliness and size, age and leverage of company. Ayemere and Elijah (2015) examined the effects Audit fees, Audit firm type, Leverage, Return on equity, Firm size, subsidiaries and Year-end on audit reporting lag. The panel research design was used for the study. The data was sourced from the annual reports of all financial companies quoted on the floor of the Nigerian stock exchange. The method of data analysis utilized in the study was the panel data estimation techniques (pooled, fixed and random effects regression). The study found that company size has no significant positive impact on audit delay, firm’s financial performance has a significant impact on Audit delay, Audit firm type (big 4 and non-big 4) has a significant impact on Audit delay, Leverage has no significant impact on Audit delay, Number of subsidiaries has a significant impact on Audit delay and Financial year end has no significant impact on Audit delay. Adebayor and Adebiyi (2016) investigated the effect of firm characteristics on timeliness of corporate financial reporting among the Deposit Money Banks in Nigeria. The study selected a sample of 15 Deposit Money Banks between 2005 and 2013. Firm characteristics used included bank size, leverage, profitability and audit firm size. The data were analysed using ordinary least square regression. The findings indicated that auditor type has positive and statistically significant relationship with timeliness of reporting while profitability and bank size have negative and statistically significant relationship with timeliness of reporting. The relationship between leverage and timeliness of reporting is positive but statistically not significant.
Methodology and Model Specification
The study used the ex-post facto research design. The period of this study is 2010-2015. The population of the study consists of all the 5 agriculture companies listed on the first-tier securities market of the Nigerian Stock Exchange as at December 2015. All the companies were used in the study. Panel data was used hence the study used panel regression to analyse the data. The application of panel regression requires that both fixed effect and random effects models test be conducted and Hausman specification test be used to choose which of these two is appropriate. TMLNESS jt =β0+β1FSIZEjt+β2PRFTjt+β3GRWTjt + β4LIQjt + β5LEVjt + β6LIQjt + εjt TMLNESSjt= Timeliness of Financial Reports of firm j at time t measured as the number of days
between accounting year end and date of audit report FSIZEjt = Firm Size of firm j at time t, measured as natural log of total assets. PRFTBLTYjt= Profitability of firm j at time t, Measured as the return on total asset. GRWTjt= Growth of firm j at time t, measured as change in sales

190
LIQjt= Liquidity of firm j at time t, measured as ratio of current asset to current liabilities LEVjt= Leverage of firm j at time t, measured as ratio of debt to equity AUDSIZEjt= Size of Audit firm of firm j at time t, measured as 1 if Big4 and 0 otherwise β0 = Intercept β1- β6= Coefficients of independent variables εjt = Error term
Results and Discussion
Table 1.0 Descriptive Statistics
Descriptive Statistics
Source: STATA 13 Output Table 1.0 indicates that the maximum time lag is 135 days, while the minimum is 74 days. It takes an average of 92 days delay in reporting by listed agricultural firms in Nigeria. A standard deviation of 12. 56 clearly shows that there is variability in the timeliness of reporting. Firm size has a maximum of 8.97, a minimum of 5.51 and a mean value of 6.75. The standard deviation is 1.03 indicating that the firms are not too different in size. Similarly, the maximum, minimum, mean and standard deviation values of profitability are 2.97, -1.98, 1.05 and 1.03 respectively. On the other hand, the growth of these firms vary significantly as the standard deviation is 143. The maximum liquidity is 2.87 and the minimum is 0.29. A standard deviation of 0.577 shows that the variations in liquidity of these firms are not high. The average leverage of the firms is 40.97 and the standard deviation is 10.46. The results on auditor type indicates that the firms used both local and international-affiliated audit firm.
Table2. Summary of Regression Results (Random Effect Model)
Variable Coefficient t-statistics p-value VIF
C 89.4148 5.76 0.000
FSIZE 1.226278 0.72 0.472 1.06 PRFT -2.416573 -1.40 0.161 1.14 GRWT 0.0321741 2.51 0.012 1.22 LIQ 2.712731 0.84 0.400 1.25 LEV -0.2166315 -1.24 0.216 1.22 AUDTYPE 4.600113 1.31 0.190 1.14 R-squared 0.2465 Adjusted R-squared 0.1932 F-statistic 14.07 Prob(F-statistic) 0.0289 Breusch-Pagan/Cook-Weisberg Test for Heteroskedasticity
0.1673
Hausman Test 0.8810 Source: Authors’ Computation using STATA 13
Table 2 indicates that there is no multicollinearity problem with the predictors (independent variables) of the study. This is because the Variance Inflation Factor (VIF) values are consistently less than 10. Similarly, the table also indicates that the p-value of the Breusch-Pagan/Cook-Weisberg Test for Heteroskedasticity is 0.1673. This is higher than 0.05 hence the there is no heteroskedasticity problem.

191
The results of the Hausman Specification test shows a p-value of 0.8810. This is statistically not significant hence we accept the null hypothesis that random effect is appropriate. Thus, random effect model is adopted and reported. The results in Table 2 indicate that about 25% percent of the variability in timeliness of financial reporting by listed agriculture companies in Nigeria is explained by the firm characteristics used in this study while the remaining 75% is explained by other variables not captured. The probability of F-statistics is 0.0289. This is less than 0.05 thus confirming the fitness of the model. The result on the effect of firm size, liquidity and auditor type on timeliness of financial reporting is positive but not statistically significant. A positive relationship indicates that these variables are likely to increase the number of days in publishing audited reports. The result is however not statistically significant. This finding is consistent with the findings in Oladipupo (2011), Ibadin, Izedonmi and Ibadin (2012), Modugu, Eragbhe and Ikhatua (2012). The relationship between profitability, leverage and timeliness is negative but not statistically significant. A negative relationship means that profitability and leverage reduce the number of days it takes to make reports available to the public. This result is however not statistically significant. This supports the finding in Iyoha (2012) which found a negative but statistically not significant effect of profitability on timeliness. On the other hand, firm growth has a positive and statistically significant effect on timeliness of reporting. A positive relationship indicates that as the firms grow, the time they spend to make reports available increases. In simple terms, older firms are likely delay in releasing reports to the public.
Conclusion
This study examined the effects of firm characteristics on timeliness of financial reporting of quoted agriculture companies in Nigeria. On the basis of findings, it is concluded that growth of agriculture firm increases timeliness of corporate financial reporting of listed agriculture firms in Nigeria. The minimum days for audited financial reports to be available for decision making is 74 days. This is outside regulatory threshold. There is need for improvement as timeliness of information is important for decision making.

192
References
Abdulla, J.M.A. (1996): Timeliness of Bahraini annual reports, In Doupnik T.S. and Salter, S.B. (Eds.), Advances in International Accounting, 9, 73-88.
Adbayo, P.A. & Adebiyi, W.K. (2016): Effect of firm characteristics on timeliness of corporate
financial reporting: Evidence from Nigeria Deposit Money Banks. International Journal of Economics , Commerce and Management. 9(3), 369-381.
Alkhatib, K. & Marji, Q. (2012). Audit report timeliness: Evidence for Jordan. Procedia-Social and
Behavioural Sciences. 62, 1342-1349 Al-tahat, S.S.Y. (2015). Timeliness of audited financial reports of Jordanian listed companies. IPASJ
International Journal of Management. 3(2),39-47 Ayemere, I.L. & Elijah, .A. (2015). Corporate attributes and audit delay in emerging markets:
empirical evidence from Nigeria. The International Journal of Business and Social Research, 5(3):1 – 10
Ibadin, I. M.; Izedonmi, F. I. O. & Ibadin, P. O. (2012). The association between selected corporate
attributes, company attributes and timeliness of financial reporting in Nigeria. Research Journal of Finance and Accounting. 3, (9).
Iyoha, F.O. (2012) Company attributes and the timeliness of financial reporting in Nigeria. Business
Intelligence Journal Vol.5 No.1,41-49 Jaggi, B., & Tsui, J. (1999). Determinants of audit report lag: Further evidence from Hong Kong.
Accounting and Business Research, 30:1, 17-28. Joshi, A. (2005). Timeliness in corporate reporting of Indian public financial institution (IPFI). Udyog
Pragati, 29(2), 1-11. Khasharmeh & H Aljifri, K.(2010). The Timeliness of Annual reports in Bahrain and United Arab
Emirates: An Empirical Comparative Study. The International Journal of Business and Finance Research 4(1): 51-71.
Leventis, S., Weetman, P., & Caramanis, C. (2005). Determinants of audit report lag: Some
evidence from the Athens Stock Exchange. International Journal of Auditing, 9(1), 45–58
Miller, P. B. and Bahnson, P. R. (1999). Quality financial reporting: Why you need it and how to
implement it. The Journal of Corporate Accounting and Finance, 11(1), 83-101. Modugu, K. Eragbe E. & Ikhatua G (2012): Determinants of audit delay: empirical evidence from
Nigeria. The International Journal of Business and Finance Research, 8(2):21 – 28 Oladipupo, A. O. (2011). Impact of corporate international linkage on the incidence of audit delay in
Nigeria. JORIND (9)1 Zeghal, D. (1984). Timeliness of accounting reports and their informational content on the capital
market. Journal of Business Finance & Accounting, 11(3), 367-380.

193
Appendix A: List of Firms Used in the Study
1. Ellah Lakes Plc 2. FTN Cocao Processors Plc 3. Livestock Feeds Plc 4. Okonmu Oil Plc 5. Presco Oil Plc
Appendix B: Descriptive Statistics
Appendix C: Multicollinearity Test
Appendix D: Heteroskedasticity Test

194
Appendix E: Fixed Effect Model Results
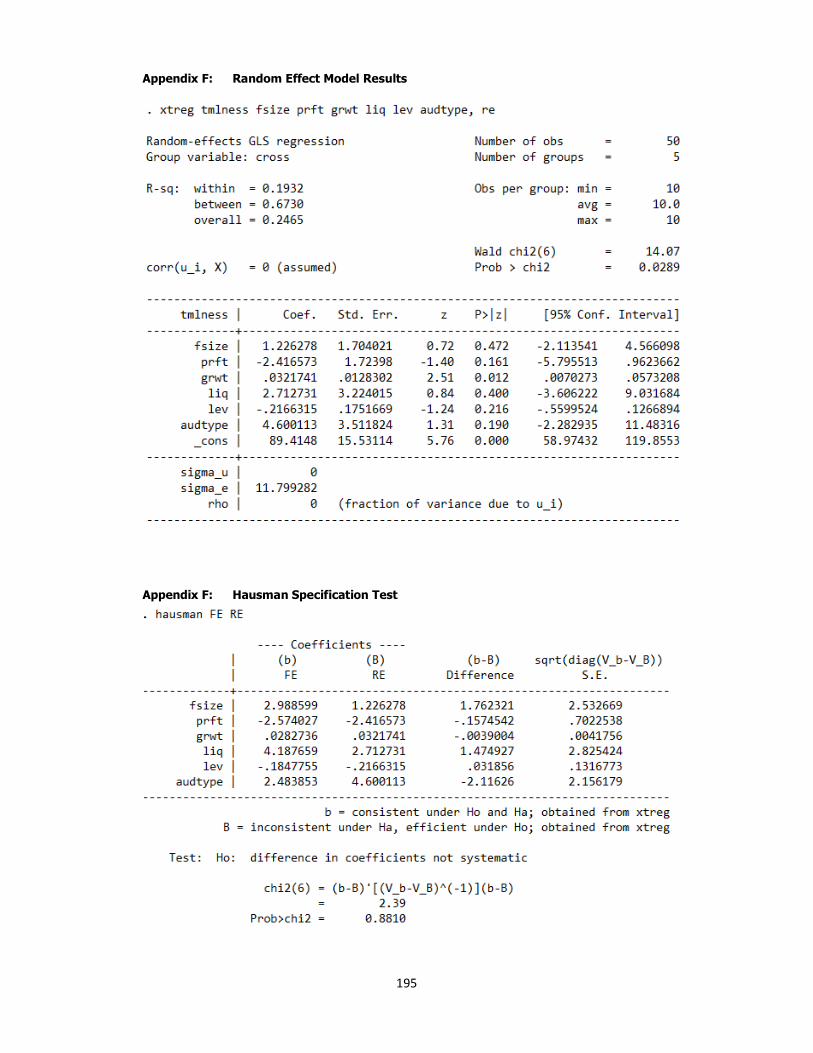
195
Appendix F: Random Effect Model Results
Appendix F: Hausman Specification Test

196
Determinants of Corporate Failure: A Way of Ensuring a Country Sustainable
Development
BY
1 R. O. Obasi (Ph.D) & 2Mamidu A. I. 1Department of Accounting, Faculty of Social and Management Sciences, Benson
Idahosa University, Benin City, Edo State, Nigeria
2Department of Accounting, College of Social and Management Sciences, Achievers University, Owo, Ondo State, Nigeria
_____________________________________________________________________________
Abstract
This study examines the relationship between Corporate Failure (CF) and Account Receivables (AR), Corporate Debt (DR) and Corporate Sales Growth (SG) in Nigeria. The study adopted a longitudinal research design. The population of the study consist of delisted manufacturing companies on the Nigeria Stock Exchange. The study spans over a period of 15 years from 2002 to 2016. The study made use of ordinary least square statistical method to test the relationship between CF, AR, DR and SG. Augmented dickey-fuller statistical tool was employed to test for unit root in order to determine the stationary of time trend in the study. The results of the study show that AR and SG have significant positive relationship with CF while DR has a positive but not significant relationship with CF. We therefore recommend that apart from controlling ineffective working capital management that could lead to illiquidity/overtrading, the management should focus on adequate financial planning and budgetary control, fraud prevention, and put in place adequate corporate governance.
Key words: Corporate Failures, leverage, Receivable, Altiman’s Z and Corporate, Sales Growth, Nigeria 1. Introduction The survival of any Nation is dependent on the sustainability of companies existing in it. This is because these companies provide employment to the citizens of the country, and revenue to government. It is on record that during economic recessions, companies usually collapse. The disastrous and social effects of corporate failure makes it imperative for shareholders, creditors, government, etc. to continually monitor the operations of a corporate entity in order to avoid possible failure (David & Eyo, 2013). The failure may have both unfavourable economic and adverse financial effects (Edward, 1998). At times of recession, account receivables are usually on the high side and the volume of account receivables indicate firm’s supply of trade credit and receivables stimulates sales because it allows customers to get access to products before paying but inability to collect these receivables will be risky to the firm. Business fails not just because it could not make sales but, because collecting the credit sold as at when due is usually problematic. Hence, their cash flow would be deficient. According to Falope and Ayilore, (2009), they stated that account receivables represent the average days that a firm takes to collect payments from its customers. So a higher level of account receivable will present difficulties in the smooth running of the firms (Van Horne & Wachowtics, 2004). The management of account receivables is mainly influenced by the credit policy and collection policy of firms. Account receivable is a part of any company’s financial statement that they should be carefully maintained, monitored and collected. High level of uncertainties in corporate affairs and how well a business should perform had led many Nigeria companies to go out of business. The economy has also not been favourable to various corporations especially those in the manufacturing business. To guarantee sustainable growth, it is very important to control the amount of companies that fail (Warner, 1977). The abnormal behaviour of firms should serve an important indicator of unhealthy performances and as

197
a result, detection of corporate distress has become a great interest to researchers. Using ratios to determine corporate distress has been widely used by various academics. Corporate failure is not only an issue for company owners and creditors but also the wider economy, it has continued to dominate the entire corporate environment throughout the world and Nigeria is not an exception. The blame of corporate failure has always been shifted to corporate management resulting from their failure to tackle and use available resources in the most effective and efficient manner to achieve good corporate objective (Pandey, 2008). Manufacturing firms in Nigeria have always been facing serious challenges leading to their unsatisfactory performance (Ibikunle, 2014). According to the National Bureau of Statistics, (2014) in Nigeria the manufacturing industry is broken down into different sectors. They are: oil refining; cement; food, beverage and tobacco; textile, apparel and footwear; pulp, paper and paper product; chemical and pharmaceutical products and non-metallic products. The food beverage and tobacco sector has been seen as the most dominant manufacturing sector. In Nigeria, the level of growth in the manufacturing sector has been negatively affected due to their high level of lending rate (National Bureau of Statistics, 2014). It is against this background that this study aims to examine the effect of receivables, sales growth and debt on corporate failure of delisted manufacturing companies in Nigeria. The first part of this study deals with the introduction of the study which forms the background of study for this research. The second part is the literature review which comprises of conceptual framework, theoretical review and empirical literature. The third part is the research method where method of data collection, research design and statistical tools is discussed. The fourth and fifth parts deal with data analysis and summary, conclusion and recommendations respectively.
2. LITERATURE REVIEW AND HYPOTHESES JUSTICATION
Corporate failure has been defined by different writers. David and Eyo (2013) explained corporate failure as an entity that continuously exhibit low or negative returns or when an entity is unable to meet its liabilities as at when due. According to Weston and Brigham (1977), in an economic sense, corporate failure means when a firm's revenue does not cover their costs. That is when their actual returns have fallen below their expected returns. They went further to explain financial failure as either technical insolvency or insolvency in bankruptcy. The technical insolvency is when a firm cannot meet its debt obligations. The lack of cash to meet accounts payable, wages, taxes, interest, and debt retirement though its total assets may exceed its total liability as a result of the firm not having enough liquid assets and not having enough cash flow. Osaze and Anao (1990) in their study also identified the following reasons for corporate failure: poor managerial skill, under capitalisation, general economic recessions, fraud, bad management regulations and poor marketing and sales strategies. They were of the opinion that most of the cases of corporate failure in Africa and Nigeria in particular resulted from lack of managerial skill to deal with ever dynamic business environment. Osaze and Anao (1990) explained that under capitalization affected companies in Africa, such that when they experience liquidity problems arising from inadequate cash flow the companies tend to have little equity or capital to fall back on. They also explain in terms of poor marketing strategies that the company's inability to convince customers that their products were different from other products in the market, made them bound to fail. This study is based on Catastrophe Theory. Catastrophe Theory is a mathematical innovation developed by the French mathematician, Rene Thom in 1972. It makes available an insight into the dynamical behaviour of systems as they approach areas where instability may occur. Catastrophe Theory provides a framework for an examination of sudden changes in corporate credit worthiness following the publication of accounting information. In recent years, a number of statistical studies have attempted to analyse companies into potential failures and potential non-failures. Catastrophe Theory offers empirical implications and is also a method for describing the evolution of forms in nature some of which can help to explain the findings of previous studies of corporate failure. The theory explains that gradual changing forces would finally produce sudden effects on corporate organizations (Joel, 2013).

198
Receivable and corporate performance
Few studies exist in the literature on receivable and corporate failure. Researchers have studied factors of receivables; receivables and profitability. García-Teruel and Martínez-Solano (2010) tested whether the accounts receivable decisions followed a model of partial adjustment, and found that, in Spain, firm size, sales growth, capacity to generate internal funds and short term financing affected the accounts receivable. Bougheas, Mateut, and Mizen (2009), focused his research on the reaction of trade receivables to changes in risk, inventory cost, liquidity and profitability. Other authors survey the effect of optimal debtors’ management, i.e. the best way of managing trade receivables that result to maximization of a firm’s profit. Deloof (2003) studied 1009 large Belgian non-financial companies for the time 1992-1996 and found a significantly negative relationship between accounts receivables turnover and profitability. Conversely, Gill, Biger and Atnur (2010) studied the association between profitability and working capital management (WCM) of eighty eight companies listed on the New York Securities Exchange. The study was conducted for the period 2005-2007. The author found no statistically significant association between profitability and Average Creditor Days. They also found a negative relationship between ACP and profitability. This indirectly means there may be a positive relationship if compared with corporate failure. Akoto et al (2013), and Madishettin and Kibona (2013) found negative relationship between AR and profitability. However, the result is not consistent with Deloof (2003), Wanguu, & Kipkirui (2015) and Ksenija (2013) where they found that there was a positive relationship between account receivable and corporate failure. Therefore, we hypothesized that; if there is a significant negative relationship between receivables and profitability, then, receivable will be directly related to corporate failure.
Leverage and corporate failure
Several empirical researches have tried to explain the effect of leverage or on financial performance but not directly on corporate failure. Tih (1998) empirically examined the financial distress and firm performance from the Asian financial crisis. The findings of the result revealed a negative relationship between leverage and firm performance (ROA). Explaining that firm with low leverage out-performs those of high leverage, while high leverage firms experience worse performance during crisis. Tanveer and Safdar (2013) empirically investigated the determinants of leverage of automobile firms listed on the Karachi stock exchange. The study used panel data of 132 firms and OLS regression for analysis from 2005 to 2010. The result shows that leverage is negatively correlated with profitability but not significant. Vural, Sokmen and Cetenak (2012) and Mahmoudi (2014) report negative relationship with profit by inference, the reverse would be the case for corporate failure. However, Vijayakumar and Karunaiathal (2014) and Wanguu and Kipkirui (2015) report positive relationship that was significant with profitability. Thus, it is preferable to say that since the result shows a non-significant negative correlation, then leverage will be positively correlated with corporate failure but may not necessarily significant. Based on the foregoing, this study hypothesized that: leverage has positive and significant impact on corporate failure. Sales growth and corporate failure
Sales figures are relatively easy to obtain and reflect both short term and long-term changes in the firm. In addition, as Barkham, Gudgin, Hart, and Harvey (1996) points out, it is also the indicator favoured by entrepreneurs themselves. Other arguments for using sales growth are based on the growth process being driven by demand for the firm’s products and services (Jason, Paul & Evans, 2005). Increasing sales will allow growth along other dimensions such as employees and assets. They suggested that Sales though, may not always the best measure of corporate performance but can be used to measure performance. Thomas, Philip and Margaretha (2000) in their study proved this statement to be true, by indicating a positive relationship between sales growth and corporate performance. Chandler and Baucus (1996) noted that when using sales growth as a measure of performance, researchers often assume that faster growth is desirable. But the notion that faster growth indicates better performance than slower growth may not be universally true. Fast growing firms have excessive strains on resources which can lead to underperformance and in some cases

199
bankruptcy. This reflects the work of Marris (1997), who considered the concept of maximizing sustainable growth as being the goal of management. The relationship between performance measures such as sales growth and profitability over time is therefore an important area of investigation as it may indicate that the firm is going through distress. Marris (1997) considered the relationship between these measures and suggests that there is an identifiable growth profit trade-off, where in order to finance growth, the firm must forego profits. Cowling (2004) investigated this relationship between growth and profitability and found little evidence of the growth versus profit trade-off. Cowling and Fitzsimmons, Steffens, and Douglas (2005) suggest that there is potential for a cumulative type effect whereby profits generate growth and growth generate future profit that allows some firms to continually face increasing returns. From Cowlings (2004) suggestion, the study asserts that: If there is no profit there is no growth and there will not be future profit and as such the firms will continue to face declining returns.
3. METHODS AND DATA
The longitudinal research design was adopted in this study. This is because the nature of the data used for this study has both time series and cross section features. The population comprised of all the delisted companies (thirty one) on the Nigerian Stock Exchange from 2002-2016. We concentrated on delisted manufacturing companies under the periods considered to enable the study use the Z-score model. Only five out of the thirty one manufacturing companies had their annual report for one to six years before they were delisted from the Nigeria Stock Exchange at head office in Lagos, Nigeria. Secondary source of data were elicited from the financial statements of the companies. Model specification: This study relied on Altman’s Z model. Stergios (2015) pointed out that ratios measuring profitability, liquidity, and solvency are the most significant ratios. The multiple discriminant analysis and simple linear regression model was used for data analysis and are presented as follows: Z = X0 + X₁ + X₂ + X₃ + ɛi……………………………………………………………………………………....….…1 Where: X0= β₀= slope/constant: X₁= β₁; X₂ = β2; X₃= β3 Therefore; Z score = Corporate Failure; overall index (dependent variable). After determining the CF, the model for the study is thus: CF = f(SG, DR, AR)…….…………………………………………………………….…..2 CFt = β₀ + β₁SGi,t + β₂DRi,t + β₃ARi,t + ɛi,t……………………………………………………………….…...3 Where: CF = Corporate failure measured using the Altman’s model Z-score; SG = Sales growth; DR = Debt ratio; AR = Account Receivables proxy with Receivables Turnover Ratio; ɛ = Error terms i = Number of firms; t = Time period (15 years) Table 1 shows the operationalization of variables.

200
Table 1: Measurement of Variables
VARIABLES MEASUREMENT
APRORI
EXPECTATION SOURCE
DEPENDENT VARIABLE Corporate Failure/Collapse Altman's 5 variable model Stergios (2015)
working capital/total assets Retained earnings/total assets
earnings before interest and tax/total assets
Market value equity/total liabilities
Sales/total assets INDEPENDENT VARIABLE:
Receivables Turnover Ratio Credit sales/average receivables + Duru, Ekwe & Okpe (2014)
Leverage Ratio: Debt Ratio Total debts/total assets + Duru, Ekwe & Okpe (2014)
Sales Growth Sales 1-sales 0/sales 0 +/- Duru, Ekwe & Okpe (2014)
Source: The study
4.0 RESULT AND DISCUSSION OF FINDINGS
In order to run an OLS test, some assumptions relating to the OLS model was conducted. The first was the test for normality of the data using the Jacque-Bera (JB). The JB test has a null hypothesis of normality of distribution as against the alternative hypothesis of non-normality of distribution. The result shows that, debt ratio, and sales growth were not normally distributed at 5% but are at 10% level of significance, while corporate failure and receivables turnover ratio were normally distributed at 5% level of significance. Secondly, we tested for multicollinearity. The tests were carried out using correlation matrix. From the result in appendix A, it showed that problem of Multicollinearity do not exit, because visually all the variables are significant and the standard error term(s) of the variables were small except for sales growth. Finally, the OLS was conducted as shown in table 2.
Table 2: Computation of Ordinary Least Square (OLS) Result. INTERCEPT AR DR SG coeff 0.8866 0.0029 0.2312 4.0333 Stardard error 0.1694 0.0013 0.1612 3.3666 T-statistics (Prob.)
0.5233 (0.6111)
2.1232 (0.0573)*
1.4343 (0.1793)
12.0051 (0.0000)*
R2(R2 Adj) 0.9309 (0.9121)
F-Stat (prob) 49.4244 (0.000)* Source: The study Model estimation there:
FC = 0.88661 + 4.03SG + 0.0.231DR + 0.0028AR + Ԑt S.e (0.16) (3.36) (0.16) (0.001) T-Stat {0.5233} {12.005} {1.4342} {2.123} The intercept value showing 0.88661 means that, whether these variables exist or not, a firm has 0.88661 units of corporate failure. Sales growth (SG) shows that 1 unit increase in sales growth will result to 2.499907 increases in Corporate Failure (CF) and this is significant because t-critical value is lesser than t-calculated 1.761< 12.00508, thus can be used for policy making, and does goes in line with a-priori expectation which is positively related. The findings on the positive relationship between corporate failure and sales growth was in line with Cowlings (2004) and Fitzsimmons,

201
Steffens, and Douglas (2005) conclude that if there is no profit there is no growth in corporate entities. This finding of positive relationship was in line with the a-priori.
Debt ratio (DR) shows that 1 unit increase in debt ratio will bring 0.231188 increases in Corporate Failure (CF) and it is not statistically significant using rule of thumb. This cannot be used for policy making because it is insignificant. This result is consistent with the apirior expectations. However, going by extant literatures which were based on profitability, Vural, Sokmen and Cetenak (2012), Tanveer and Safdar (2013) and Mahmoudi (2014) report negative relationship with profit by inference, the reverse would be the case for corporate failure. However, Vijayakumar and Karunaiathal (2014), Wanguu and Kipkirui (2015) report positive relationship that was significant with profitability. Based on inference, the opposite would not be consistent with the finding of this study. Account Receivables (AR) shows that 1 unit increase in value Receivables turnover ratio as a result of increment will bring 0.002861increase in corporate failure (CF) and this is significant because t-critical value is less than t-calculated 1.761< 2.123195, thus it can be used it for policy making, and go in line with a-priori expectation which is negative relationship. This finding is consistent with the findings of Akoto et al (2013), and Madishettin and Kibona (2013) where they found negative relationship between AR and profitability. This study’s result is said to be consistent with theirs because the opposite is expected of corporate failure from profit. However, the result is not consistent with Deloof (2003), Wanguu, & Kipkirui (2015) and Ksenija (2013) where they found that there was a positive relationship between account receivable and corporate failure. The coefficient of determination (R2) was 0.930939 (93.09%) mean, 93.09% of change in endogenous variable that can be explained by exogenous variables While, the adjusted R2 which mean the explanatory power of independent variables on dependent variable is (0.91210101) 91.21%, which mean the explanatory variables has 91.21% capacity to determine changes in corporate failure (FC). F-statistics value shows that F(3,11)= 49.42438 is much more greater than F-critical value at both 1% and 5% level of significance which means the entire model has goodness of fit and can be used for policy making.
5. CONCLUSIONS AND RECOMMENDATIONS This study examined the relationship between account receivables, debt ratio, sales growth and corporate failure. The study is apt and in tune with the theme of the conference because, the strength of a nation depends on the productivity of its producing capacity. If the manufacturing companies are performing and functioning adequately, this will help to reduce the rate of unemployment, increase government revenue and boost other businesses in the country. Thus, help to ensure economic resurgence in the country. The result of this study therefore has shown that receivables and sales growth have significant positive relationship with corporate failure. To this end, we therefore recommend that: Firstly, At all times and most especially at times of recession, there should be proper receivable management in manufacturing firms in Nigeria. Management must pay more attention to receivable to ensure that it is reduced at all times. This is because, the lower the receivables, the lower the incident of failure. Secondly, Management must watch sales trend very carefully. Based on the findings of this study, it shows that just relying on sales growth might be misleading. Management must assess sales profile to monitor credit sales by providing adequate and motivating policies to help reduce average collection period.

202
REFERENCES
Akoto, R.K., Awunyo, V.D., & Angemo, P.L. (2013). Working capital management and profitability:
Evidence from Ghanaian listed manufacturing firms. Journal of economics and international Finance, 5(9), 373 -379.
Bougheas, S., Mateut, S. & Mizen, P. (2009). Corporate trade credit and inventories: New evidence
of a trade from accounts payable and receivable. Journal of Banking and Finance, 33, 300-307.
Chandler, G. N., Baucus, D.A. (1996). Gauging performance in emerging businesses: longitudinal
evidence and growth pattern analysis. Frontiers of Entrepreneurship Research, 491-504. Cowling, M. (2004).The growth –profit nexus. Small Business Economics, 22, 1-9. David, O. M. & Eyo, I. E. (2013). Corporate failure: Causes and remedies. Business and
Management Research 2(4), 19-24. Deloof. (2003). Does Working Capital Management Affects Profitability of Belgian Firms? Journal of
Business, Finance and Accounting, 30(3-4), 351–644. Duru, A. N., Ekwe, M. C. & Okpe, I. I. (2014). Accounts receivable management and corporate
performance of companies in the food & beverage industry: Evidence from Nigeria. European Journal of Accounting Auditing and Finance Research, 2(10)34–47.
Edwards, F. R. (1977). Managerial objectives in regulated industries. Journal of Political Economy,
85(1), 147-161. Falope, O. I. & Ajilore, O. T. (2009). Working capital management and corporate profitability
evidence from panel data analysis of selected quoted companies in Nigeria. Research journal of business management, 3, 73 – 84.
Fitzsimmons, J.R., Steffens, P., & Douglas, E.J. (2005). Growth and profitabilitu in small and
medium sized Australian firms. AGSE Entrepreneurship Exchange, Melbourne, February, 2005.
García, T, P, J., & Martínez, S. P. (2010). A dynamic approach to accounts receivable: A study of
Spanish SME. European Financial Management 16(3), 400-421. Gill, A., Biger, N. & Atnur, I. (2010). The relationship between working capital, management and
profitability Evidence from the United states. Business and Economic Journal, 10, 1-9. Ibikunle, A. (2014). Problems cripping manufacturing in Nigeria. Retrieved from vanguardngr.com
on 7th Nov. 2017. Madishetti, S., & Kibona, D. (2013). Impact of receivables and payables management on the
profitability of SMEs in Tanzania. Journal of Economics and Management, 2(3), 9 -21 Mahmoudi, S. (2014). The effect of leverage on cement industry profitability.Reef resources
assessment and management technical paper, 40(1), 673 -676. Morris, R. (1997). Early warning indicators of corporate failure: A critical review of previous
research and further empirical evidence. Aldershot: Ashgate Publishing Ltd. National Bureau of Statistics, (2014, 14th October). Nigerian Manufacturing Sector Summary Report:
2010-2012 (4- 6).

203
Obeidat, M.I., & Jawabri, A. (2016). The impact of working capital management on the profitability of construction equipment firms: Evidence from listed construction equipment firms in Abu Dhabi. Journal of Accounting and Finance, 16(8), 136 -147
Osaze, B. C. & Anao, A. R. (1990). Managerial finance. Benin city: Uniben press. Pandey, I. (2004). Financial management. New Delhi: Vikas publishing house Pvt. Ltd. Owolabi, S.A. & Alu, C.N. (2012). Effective working capital management and profitability: A study of
selected quoted manufacturing companies in Nigeria. Economics and Finance Review, 2(6), 55- 67.
Stergios, Z. M. (2015). Bankruptcy prediction models: An empirical analysis of Altman’s Z- score
model in forty Greek companies in the period of economic recession. (Unpublished M.Sc. Dissertation) University of Macedonia. https://dspace.lib.uom.gr/bitstream/2159/18618/6/MantziarisZapheirisStergiosMsc2015.pdf. Retrieved 7th November, 2017
Tanveer, A. & Safdar, R. (2013). Determinant of leverage of automobile sector firms listed in karachi
stock exchange by Testing Pecking Order Theory. Journal of Business Studies Quarterly 4(3), 73-83.
Tih, K. (1998). Financial distress and firm performance: Evidence from the Asian financial crisis. Journal of Finance and Accountancy 11, 36.
Van Horne, J. C. & Wachowicz J. M.(2004). Fundamentals of financial management. (12th ed). New
Jersey: Prentice Hall. Vijayakumar, A. & Karunaiathal A. (2014). Impact of corporate leverage on profitability-Evidence
from India paper industry. India Journal of Applied Research, 4(11), 136 - 141. Vural, G., Sokmen, A. G., &Cetenak, E. H. (2012). Effects of working capital management on firm’s
performance: Evidence from Turkey. International Journal of Economics and Financial Issues, 2(4), 488 -495.
Wanguu, K.C. & Kipkirui, S.E. (2015). The effect of working capital management on profitability of cement manufacturing companies in Kenya. IOSR Journal of Economics and Finance, 6(6), 53 -61.

204
Appendix
ZC SG SER01 DR Mean 0.763333 1564798. 7.877006 0.857413 Median 0.470000 841413.0 12.43791 0.732009 Maximum 2.450000 5431010. 56.60674 1.689358 Minimum 0.200000 340157.0 -121.6751 0.552758 Std. Dev. 0.686915 1688649. 40.59522 0.350390 Skewness 1.577324 1.390519 -2.248545 1.327343 Kurtosis 4.097417 3.339540 8.184501 3.598717
Jarque-Bera 6.972583 4.905915 29.43929 4.628637 Probability 0.030614 0.086039 0.000000 0.098834
Sum 11.45000 23471972 118.1551 12.86120 Sum Sq. Dev. 6.605933 3.99E+13 23071.61 1.718820
Observations 15 15 15 15
-1,000,000
0
1,000,000
2,000,000
3,000,000
4,000,000
5,000,000
6,000,000
99 00 01 02 03 04 05 06 07 08 09 10 11 12 13
ZC SG AR DR

205
Null Hypothesis: D(ZC) has a unit root Exogenous: Constant, Linear Trend Lag Length: 2 (Automatic - based on SIC, maxlag=2)
t-Statistic Prob.* Augmented Dickey-Fuller test statistic -3.367357 0.1077
Test critical values: 1% level -5.124875 5% level -3.933364 10% level -3.420030 *MacKinnon (1996) one-sided p-values.
Warning: Probabilities and critical values calculated for 20 observations and may not be accurate for a sample size of 11 Augmented Dickey-Fuller Test Equation Dependent Variable: D(ZC,2) Method: Least Squares Date: 06/13/17 Time: 10:04 Sample (adjusted): 2003 2013 Included observations: 11 after adjustments
Variable Coefficient Std. Error t-Statistic Prob. D(ZC(-1)) -4.392200 1.304346 -3.367357 0.0151
D(ZC(-1),2) 3.567660 1.176839 3.031562 0.0231 D(ZC(-2),2) 1.851923 0.915771 2.022257 0.0896
C -1.206336 0.742152 -1.625457 0.1552 @TREND("1999") 0.195058 0.097880 1.992818 0.0934
R-squared 0.806471 Mean dependent var 0.000909
Adjusted R-squared 0.677451 S.D. dependent var 0.905632 S.E. of regression 0.514339 Akaike info criterion 1.811086 Sum squared resid 1.587267 Schwarz criterion 1.991948 Log likelihood -4.960974 Hannan-Quinn criter. 1.697078 F-statistic 6.250768 Durbin-Watson stat 2.661088 Prob(F-statistic) 0.024785
Null Hypothesis: D(SG) has a unit root
Exogenous: Constant, Linear Trend Lag Length: 3 (Automatic - based on SIC, maxlag=3)
t-Statistic Prob.* Augmented Dickey-Fuller test statistic -5.708805 0.0826
Test critical values: 1% level -5.295384 5% level -4.008157 10% level -3.460791 *MacKinnon (1996) one-sided p-values.
Warning: Probabilities and critical values calculated for 20 observations and may not be accurate for a sample size of 10

206
Augmented Dickey-Fuller Test Equation Dependent Variable: D(SG,2) Method: Least Squares Date: 06/13/17 Time: 10:14 Sample (adjusted): 2004 2013 Included observations: 10 after adjustments
Variable Coefficient Std. Error t-Statistic Prob. D(SG(-1)) -5.072444 1.402708 -3.616180 0.0224
D(SG(-1),2) 4.100246 1.123734 3.648771 0.0218 D(SG(-2),2) 2.928656 1.062018 2.757632 0.0510 D(SG(-3),2) 1.215288 0.868619 1.399104 0.2343
C -2736781. 1083483. -2.525910 0.0649 @TREND("1999") 485038.7 154340.8 3.142648 0.0348
R-squared 0.950840 Mean dependent var -18457.80
Adjusted R-squared 0.889390 S.D. dependent var 1767594. S.E. of regression 587867.4 Akaike info criterion 29.69010 Sum squared resid 1.38E+12 Schwarz criterion 29.87165 Log likelihood -142.4505 Hannan-Quinn criter. 29.49094 F-statistic 15.47341 Durbin-Watson stat 2.199912 Prob(F-statistic) 0.010058
Null Hypothesis: D(DR) has a unit root Exogenous: Constant, Linear Trend Lag Length: 0 (Automatic - based on SIC, maxlag=3)
t-Statistic Prob.* Augmented Dickey-Fuller test statistic -3.429171 0.1564
Test critical values: 1% level -4.886426 5% level -3.233200 10% level -3.162984 *MacKinnon (1996) one-sided p-values.
Warning: Probabilities and critical values calculated for 20 observations and may not be accurate for a sample size of 13
Augmented Dickey-Fuller Test Equation Dependent Variable: D(DR,2) Method: Least Squares Date: 06/13/17 Time: 10:21 Sample (adjusted): 2001 2013 Included observations: 13 after adjustments
Variable Coefficient Std. Error t-Statistic Prob. D(DR(-1)) -0.935092 0.306153 -3.054327 0.0122 C -0.098141 0.226601 -0.433098 0.6741
@TREND("1999") 0.007265 0.025665 0.283057 0.7829 R-squared 0.483374 Mean dependent var -0.042948
Adjusted R-squared 0.380049 S.D. dependent var 0.439409 S.E. of regression 0.345977 Akaike info criterion 0.914285 Sum squared resid 1.197001 Schwarz criterion 1.044658
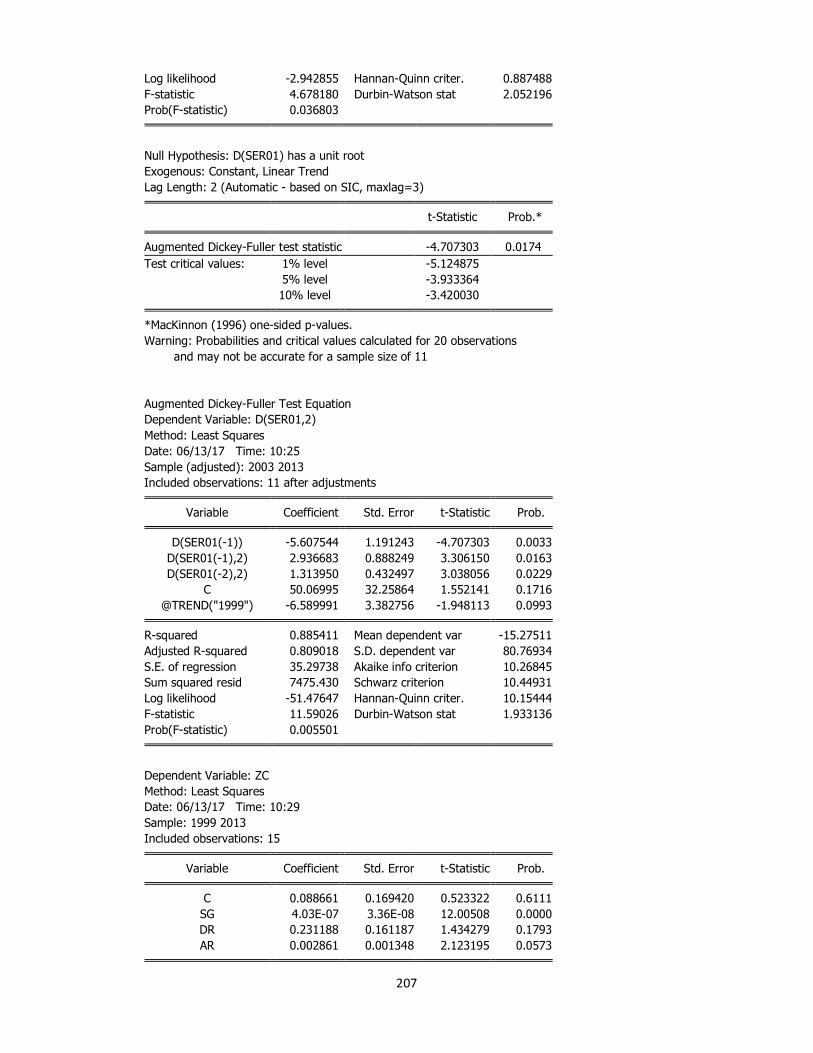
207
Log likelihood -2.942855 Hannan-Quinn criter. 0.887488 F-statistic 4.678180 Durbin-Watson stat 2.052196 Prob(F-statistic) 0.036803
Null Hypothesis: D(SER01) has a unit root Exogenous: Constant, Linear Trend Lag Length: 2 (Automatic - based on SIC, maxlag=3)
t-Statistic Prob.* Augmented Dickey-Fuller test statistic -4.707303 0.0174
Test critical values: 1% level -5.124875 5% level -3.933364 10% level -3.420030 *MacKinnon (1996) one-sided p-values.
Warning: Probabilities and critical values calculated for 20 observations and may not be accurate for a sample size of 11
Augmented Dickey-Fuller Test Equation Dependent Variable: D(SER01,2) Method: Least Squares Date: 06/13/17 Time: 10:25 Sample (adjusted): 2003 2013 Included observations: 11 after adjustments
Variable Coefficient Std. Error t-Statistic Prob. D(SER01(-1)) -5.607544 1.191243 -4.707303 0.0033
D(SER01(-1),2) 2.936683 0.888249 3.306150 0.0163 D(SER01(-2),2) 1.313950 0.432497 3.038056 0.0229
C 50.06995 32.25864 1.552141 0.1716 @TREND("1999") -6.589991 3.382756 -1.948113 0.0993
R-squared 0.885411 Mean dependent var -15.27511
Adjusted R-squared 0.809018 S.D. dependent var 80.76934 S.E. of regression 35.29738 Akaike info criterion 10.26845 Sum squared resid 7475.430 Schwarz criterion 10.44931 Log likelihood -51.47647 Hannan-Quinn criter. 10.15444 F-statistic 11.59026 Durbin-Watson stat 1.933136 Prob(F-statistic) 0.005501
Dependent Variable: ZC Method: Least Squares Date: 06/13/17 Time: 10:29 Sample: 1999 2013 Included observations: 15
Variable Coefficient Std. Error t-Statistic Prob. C 0.088661 0.169420 0.523322 0.6111
SG 4.03E-07 3.36E-08 12.00508 0.0000 DR 0.231188 0.161187 1.434279 0.1793 AR 0.002861 0.001348 2.123195 0.0573

208
R-squared 0.930936 Mean dependent var 0.763333 Adjusted R-squared 0.912101 S.D. dependent var 0.686915 S.E. of regression 0.203655 Akaike info criterion -0.121597 Sum squared resid 0.456231 Schwarz criterion 0.067217 Log likelihood 4.911976 Hannan-Quinn criter. -0.123608 F-statistic 49.42438 Durbin-Watson stat 1.993319 Prob(F-statistic) 0.000001
Heteroskedasticity Test: ARCH F-statistic 0.053075 Prob. F(1,12) 0.8217
Obs*R-squared 0.061648 Prob. Chi-Square(1) 0.8039
Test Equation: Dependent Variable: RESID^2 Method: Least Squares Date: 06/13/17 Time: 12:10 Sample (adjusted): 2000 2013 Included observations: 14 after adjustments
Variable Coefficient Std. Error t-Statistic Prob. C 0.026176 0.015619 1.675964 0.1196
RESID^2(-1) -0.059537 0.258429 -0.230379 0.8217 R-squared 0.004403 Mean dependent var 0.024241
Adjusted R-squared -0.078563 S.D. dependent var 0.047439 S.E. of regression 0.049267 Akaike info criterion -3.051561 Sum squared resid 0.029127 Schwarz criterion -2.960267 Log likelihood 23.36093 Hannan-Quinn criter. -3.060012 F-statistic 0.053075 Durbin-Watson stat 1.863327 Prob(F-statistic) 0.821678
Table 4.2, ADF Test for Unit Root at first diff with intercept and trend
Variables ADF Test
Stat
95% Critical Level Order of Integration Remarks
CF -3.367357 -3.333364 I(1) Stationary
SG -5.708805 -3.759743 I(I) Stationary DR -3.429171 -3.233200 I(I) Stationary AR -4.707303 -3.933364 I(I) Stationary
Source: Author’s computation using Eview 8.0
209
The Impact of Institutional Quality on Nigerian Capital Market:
An ARDL Analysis
Nwala Maurie Nneka Ph.D
Department of Banking and Finance, Nasarawa State University Keffi [email protected], [email protected]
07031567777 _____________________________________________________________________________
ABSTRACT
This study investigated the relationship between Institution quality and Capital Market Development in Nigeria and to empirically ascertain if Institution quality significantly impacts Capital Market Development in Nigeria. This study used Bounds testing approach to Co-integration employed within the framework of Autoregressive Distributed Lag model (ARDL) developed by Pesaran and Shin, (1999). The findings revealed a strong long run relationship between the Institutional quality variables and capital market development in Nigeria and the following variables government effectiveness, regulatory quality, political stability and corruption significantly impacts on Capital Market Development in Nigeria. The study recommends that the anti-corruption agencies should be applauded for the work done thus far and wind should be given to their sails, while the regulatory agencies should work in sync to develop consistent and co-ordinated policies for growth and development.
Key words:
Autoregressive Distributed Lag, Capital Market Development, Institutional quality, Nigeria.
INTRODUCTION
The recognition of the role that financial sector development plays in economic growth has been documented in literature as far back as 1873 when Bagehot (1873) came up with the proposition that England was able to effectively channel resources towards productive investment because of the well organized capital markets. Before the ground breaking seminal studies of McKinnon (1973) and Shaw (1973) which brought the subject to limelight, three other notable scholars Schumpeter (1911), Goldsmith (1969) and Hicks (1969) also observed that a developed financial sector plays a critical role in the development of an economy. Accordingly, the general conclusion in the literature is that financial development exerts a strong positive effect on economic growth (see King and Levine (1993), Demetriades and Hussein (1996), Levine (1997), Demetrides and Andrianova (2004)). Theoretically, the argument that supports the relationship between capital market and growth is hinged on the fact that developed financial system performs numerous key functions to enhance the efficiency of intermediation by reducing information, transaction, and monitoring costs. Ferguson (2006) takes this argument further by establishing that there is a relationship between institutional quality and financial development, that this may explain the variations observed in financial development and by implication economic growth in the long run. In Nigeria there are a plethora of institutions like the Securities and Exchange Commission (SEC), the Central Bank of Nigeria (CBN), the Pension commission (PenCom), the Debt Management Office (DMO), the National Insurance Commission (NAICOM), and Economic and Financial Crime Commission (EFCC) that ensure and assure that the Capital market is fair and adequately protects the investor. These institutions are there to ensure transparency, guide and regulate the market to prevent or minimize the impact of market failure. This implies that a successful and developed capital market depends to a large extent on the quality of these institutions. In a bid to strengthen these institutions, several reforms have been carried out since the inception of the Lagos Stock exchange in 1960. Notable among these reforms is the expansion of the functions of the Securities and Exchange Commission in 1988; the introduction of the Central Clearing System in (1992), the formal deregulation of the Capital Market in (1993), the incorporation of a second bourse in 1998, the enactment of the EFCC act in 2002 among other reforms (Osaze, 2007).

210
Despite these submissions above, the Capital market is seen as shallow and has been on a downward trend since 2014. It becomes pertinent to ask, do these institutions impact on the development of the capital market? Is there a relationship between these institutions and the development of the Nigerian Capital Market? Are these reforms carried out so far effective enough? This study seeks to investigate if there is a relationship between Institution quality and Capital Market in Nigeria and if Institution quality significantly impacts Capital Market in Nigeria.
INSTITUTIONAL QUALITY AND CAPITAL MARKET
Generally speaking, institutions might have a profound impact on the supply side of financial development. The level of institutional development in a country to some extent determines the sophistication of the financial system. Kumhof and Tanner (2005) argued that in developing countries where legal and institutional infrastructures are not strong enough, banks hold government debt among their assets with a share more than developed countries. It is noted that, in the developing countries government debt is a safe asset compared to credit to private sector; therefore banks prefer to hold government debt in high amounts instead of supplying credit to private sector. Roe and Siegel (2009) stressed the role of political stability to financial market development. They used fixed effect and instrumental variables to analyse data from 57 developed countries and 35 developing countries. They found that political instability have a negative and highly significant association with Capital Market Development for both developing and developed countries. They linked political stability to economic growth and Capital Market development, which is similar to the proposition of Rajan and Zingales (2003) exposition on political economy as a factor affecting financial markets. Law and Azman-Saini (2008) used Generalized Method of Moments to examine the impact of institutional quality on financial sector development for 63 countries using data sets spanning from 1996 to 2004. The study employed i) the private-sector credit of the banking sector, and ii) the stock market capitalization of the stock market was used expressed as a ratio of GDP. The results indicated that none of the institutional quality variables affects Capital market development however; the effect of institutional quality is statistically significant for banking sector development. Anayiotos and Toroyan (2009) used Data Envelopment Analysis to study the institutional quality policy affecting capital Market Development for 37 countries in Sub-Saharan Africa (SSA). They empirically established that institutional quality influences capital market development strongly in some SSA countries than others. Unlike the study of Law and Azman-Saini (2008) they concluded that institutional quality does matter and that each country should determine which variables are critical for its capital Market Development. Gries and Meierrieksy (2010) also investigated the effect of institutional quality on financial development in SSA from 1984 to 2007 for 19 countries using dynamic panel model. They found that political instability (weak institutions) impedes financial development supporting the proposition of Roe and Siegel (2009). However they noted that there is a weak link between corruption, bureaucratic efficiency, the rule of law or democratic accountability and financial development. Using a Panel econometric technique, Cherif and Dreger (2014) explored the institutional quality variables that affect capital market for 15 countries in the Middle East and North African (MENA) region using Annual data spanning from 1990-2007. Two proxy for capital market (liquid liabilities and organized trade of domestic equities as ratios of GDP). They are of the view that Corruption and law and order is very significant for Capital Market development similar to the findings of Anayiotos and Toroyan (2009).
METHODOLOGY This study adopted a time series experimental research design. This research work made use of secondary data. The secondary data were collated for 20 years from 1998-2016. The Institutional quality variables measures were obtained from Worldwide Governance Indicators (WGI). WGI data is constructed from aggregate indicators of six broad dimensions of governance. The six aggregate

211
indicators are based on 31 underlying data sources reporting the perceptions of governance of a large number of survey respondents and expert assessments worldwide. For data source see WGI methodology paper: Daniel & Massimo, (2010); (see Full interactive access to the aggregate indicators, and the underlying source data, in www.govindicators.org). Table1:
The process by which governments are selected, monitored, and replaced Political Stability and Absence of Violence/Terrorism
Captured the perception of the likelihood that the government will be destabilized or overthrown by unconstitutional or violent means, including politically‐motivated violence and terrorism.
Voice and Accountability
Captured the perception of the extent to which a country's citizens are able to participate in selecting their government, as well as freedom of expression, freedom of association, and a free media.
The capacity of the government to effectively formulate and implement sound policies Government Effectiveness
Captured the perception of the quality of public services, the quality of the civil service and the degree of its independence from political pressures, the quality of policy formulation and implementation, and the credibility of the government's commitment to such policies.
Regulatory Quality Captured the perception of the ability of the government to formulate and implement sound policies and regulations that permit and promote private sector development.
The respect of citizens and the state for the institutions that govern economic and social interactions among them Control of Corruption Captures the perceptions of the extent to which public power is exercised
for private gain, including both petty and grand forms of corruption, as well as "capture" of the state by elites and private interests
Source: Daniel & Massimo (2010) Details on the underlying data sources, the aggregation method, and the interpretation of the indicators, can be found in the WGI methodology paper: Daniel & Massimo, (2010). Popular test of stationarity that was used for the study was the Augmented Dickey-Fuller (ADF) unit root test derived from Dickey & Fuller (1979, 1981) The ADF test consists of estimating the following equation:
1 2 1
1
m
t t i t i t
i
Y t Y Yβ β δ α ε− −
=
∆ = + + + ∆ +
where: iε is a pure white noise error term; t is time trend; Yt is the variable of interest; 1β , 2β , δ
and iα are parameters to be estimated; and ∆ is difference operator. In the ADF approach, we
test whether δ = 0. {In the ADF test, the null hypothesis is that the variable in question has a unit root (i.e. is not stationary)}. This study used Bounds testing approach to Co-integration employed within the framework of Autoregressive Distributed Lag model (ARDL) developed by Pesaran and Shin, (1999) as it can be applied without considering the same order of integration of all variables, that is, the data can either be integrated of order I(0), I(1) or of mixed order. The augmented ARDL model provided by Pesaran and Pesaran (1997); Pesaran and Shin (1999) is given as:
0 1 1 2 1 1 2
1 1
k k
t t t i t i i t i t
i i
Y Y X Y Xα α α β β ε− − − −− −
∆ = + + + ∆ + ∆ +
The bounds test approach used was proposed and enhanced by Pesaran, Shin, and Smith, (2001) is based on unrestricted ECM. Compared to other cointegration procedures such as Engle and Granger (1987) and Johansen and Juselius (1990).

212
0 1 2 3 4
1 0 0 0
5 6 1
0 0
pk l o
t i t j t j t l
i j k l
q r
t m t n t t
m n
TMC TMC CPTN VOACC GOVEFF
POLSTA REGQUAL ECT
φ φ φ φ φ
φ φ λ ε
− − − −= = = =
− − −= =
∆ = + ∆ + ∆ + ∆ + ∆ +
∆ + ∆ + +
Where: ∆TMC = describes the financial depth in financial market, Total market capitalization (CAPITAL) is selected since it comprises the value of all companies which are listed in the Capital market. Its ratio to GDP points to the ability to raise capital and provide risk diversification for the market participants (see Rajan & Zingales, 1998). ECT-1 = the error correction term and the coefficient represents the speed of adjustment back to long-run equilibrium after a shock or disturbance. The significance of the long run causal effect is indicated by the t-statistics on the coefficient of the error correction term. ∆CPTNt = Control of Corruption ∆VOACCt = Voice and Accountability. ∆GOVEFFt = Government Effectiveness. ∆POLSTAt = Political Stability and Absence of Violence/Terrorism. ∆REGQUALt = Regulatory Quality.
Descriptive Statistics
As shown in table 2, only CPTN was found to have grown on a positive average of 1.75% between 1986 and 2016. However, the mean values of GOVEFF, POLSTA, REGQUAL and VOACC all recorded negative mean rates with values captured as: -1.029%, -1.77%, -0.86% and -0.82% respectively. As regards to the level and direction of skewness, CPTN, GOVEFF, REGQUAL and VOACC were found to be negatively skewed to the left of the normal distribution curve; while only POLSTA was found to be positively skewed as also shown in table 2. POLSTA and REGQUAL were found to be normally distributed at 5% level of significant as captured by the probability values of the Jarque-Bera statistics. However, all the other variables were found not to be normally distributed.
Table 2: Descriptive Statistics of Institutional Quality Variables
CPTN GOVEFF POLSTA REGQUAL VOACC TMC_GDP
Mean 1.755 -1.029 -1.7717 -0.8688 -0.8228 0.267112
Median 1.83 -1.001 -1.9043 -0.7986 -0.754 0.275256
Maximum 2.7 -0.883 -0.6886 -0.6694 -0.5822 0.638112
Minimum 0.63 -1.201 -2.1936 -1.3228 -1.6632 0.065824
Std. Dev. 0.64136 0.0965 0.39123 0.20938 0.26566 0.166459
Skewness -0.3416 -0.466 1.48915 -1.2136 -2.2754 0.566522
Kurtosis 2.04085 2.1333 4.79162 3.06286 7.55843 2.600741
Jarque-Bera 0.92447 1.081 8.05347 3.92992 27.6598 0.962131
Probability 0.62987 0.5824 0.01783 0.14016 1E-06 0.618124
Sum 28.08 -16.47 -28.348 -13.901 -13.165 4.273794
Sum Sq.Dev. 6.1702 0.1398 2.2959 0.65762 1.0586 0.415631
Observations 17 17 17 17 17 17 Source: Authors Computation (2017)
Unit Root Test
Thus, the study used or adopted Augmented Dickey-Fuller (ADF) Techniques to test and verify the unit root property of the series and stationarity of the model. The test of the stationarity of the

213
variables adopted was Augmented Dickey Fuller (ADF) test. The variables tested are TMC_GDP, GOVEFF, POLSTA, REGQUAL and VOACC are presented in table 3
Table 3: Summary of Unit Root Test Results
Variables ADF Test Statistic ADF Critical Order of
Integration
TMC_GDP -5.684145 -4.333930* I(1)
GOVEFF -8.534125 -6.292057* I(1)
POLSTA -6.936470 -5.521860** I(1)
REGQUAL -5.597353 -4.450425** I(1)
VOACC -3.246954 -3.101534*** I(1)
CPTN -5.318048 -4.339330* I(0)
Source: Authors Computation, 2017 (Eview-9.0) Note: MacKinnon critical values for the rejection of hypothesis of unit root are in parenthesis in Columns 3 and the tests include intercept with trend; * significant at 1%; ** significant at 5%;*** significant at 10; Mackinnon critical Table 3, showed that TMC_GDP, POLSTA, GOVEFF, VOACC and REGQUAL were found stationary at first difference, that is, at order I(1). The ADF test statistics were found greater than their respective tabulated values. Since the variables were found stationary at different orders (mixed orders), the ARDL approach to co-integration was applied to examine the long run relationship among the variables.
Model Estimation
A. Estimated Long Run Model
This model is used to analyse the relationship between institutional quality variables and Capital
Market Development. It is estimated using ARDL model and the result is presented in the table 4. All
the explanatory variables except first period lag of total market capitalization and voice and
accountability are significant at 5%.
The coefficient of determination (R2) shows that 99% of the variations in the capital market is
explained by the explanatory variables which is above 50% and even after taking into consideration
the degree of freedom, the adjusted coefficient of determination (adjusted R2) still shows that, 98%
variation in the Capital Market is explained by the explanatory variables. The F-statistic 221.6883
(0.000000) confirmed the fitness of the coefficient of determination and shows an overall significant
level of the explanatory variables jointly in explaining the capital market.

214
Table 4: Estimated Long Run Coefficients Using the ARDL Approach
Estimated Long Run Coefficients Using the ARDL Approach ARDL (2,2,1,2,1,2)
Selected based on Akaike info criterion (AIC)
Dependent variable is TMC_GDP
Regressor Coefficient Std. Error t-Statistic Prob.*
TMC_GDP(-1) 0.034875 0.057858 0.602776 0.5589 TMC_GDP(-2) 0.307864 0.078555 3.919096 0.0024*
CPTN 0.057760 0.019065 3.029636 0.0115* CPTN(-1) 0.255768 0.021908 11.67483 0.0000* CPTN(-2) 0.099518 0.018949 5.252001 0.0003* VOACC 0.016079 0.034404 0.467353 0.6494*
VOACC(-1) 0.040713 0.023408 1.739265 0.1099 GOVEFF 0.311127 0.029035 10.71560 0.0000*
GOVEFF(-1) 0.517946 0.038314 13.51841 0.0000* GOVEFF(-2) 0.275948 0.028044 9.839729 0.0000*
POLSTA -0.273848 0.104321 -2.625050 0.0236* POLSTA(-1) 0.247490 0.093031 2.660303 0.0222* REGQUAL 0.460180 0.046140 9.973503 0.0000*
REGQUAL(-1) 0.404161 0.059581 6.783372 0.0000* REGQUAL(-2) 0.763114 0.044161 17.28021 0.0000*
Constant 3.585073 0.284794 12.58831 0.0000* R Squared 0.996703 Adjusted R-Squared 0.982207 S.E. of Regression 0.014678 F-statistic (Prob.) 221.6883 (0.000000) Diagnostic Tests
Test Statistics LM Version
A. Serial Correlation Х2 auto = 0.764609 (0.4935)
B. Functional Form (Ramsey Reset) Х2 RESET = 2.238267 (0.1491)
C. Normality Х2 Norm = 4.651256 (0.097722)
D. Heteroscedasticity Х2 Het = 0.376845 (0.9594)
Source: Author’s computation Obtained from E-views 9 Note: ** and * indicate significance at 1% and 5% level of significances. Figures in parenthesis are probability values. A is Breusch-Godfrey Serial Correlation LM Test, B is Ramsey’s RESET test, C is Normality Test, D is Heteroscedasticity test. Also, the outcome of this result can be tested using some diagnostic tests such as Breusch-Godfrey Serial Correlation LM Test, Ramsey’s RESET test, Normality Test and Heteroscedasticity test. The result of these tests as presented in table 3 shows that, the model passes all the diagnostic tests. The diagnostic tests applied to the model point out that there is no evidence of serial correlation and heteroscedasticity. Besides, the RESET test implies the correctly specified ARDL model and the skewness and kurtosis of residuals based on normality test shows that the residuals are normally distributed. The stability of the regression coefficients is tested using the cumulative sum (CUSUM) and the cumulative sum of square (CUSUMSQ) of the recursive residual test for structural stability. Plots of the CUSUM and CUSUMSQ as shown in figure 1 and 2 shows that the regression equation seems stable given that neither the CUSUM nor the CUSUMSQ test statistics go beyond the bounds of the 5% level of significance.

215
Figure 1: Stability (CUSUM) Tests
-12
-8
-4
0
4
8
12
03 04 05 06 07 08 09 10 11 12 13 14
CUSUM 5% Significance Source: Authors Computation, 2017 (Eview-9.0) Figure 2: Stability (CUSUM of Squares) Tests
-0.4
0.0
0.4
0.8
1.2
1.6
03 04 05 06 07 08 09 10 11 12 13 14
CUSUM of Squares 5% Significance
Source: Authors Computation, 2017 (Eview-9.0)
B. ARDL Bound Test Approach to Co-integration
Table 5: ARDL Bounds Test Result
Null Hypothesis: No long-run relationships exist Test Statistic Value K F-statistic 146.6447 5 Critical Value Bounds Significance I0 Bound I1 Bound 10% 2.26 3.35 5% 2.62 3.79 2.5% 2.96 4.18 1% 3.41 4.68 Source: Author’s computation Obtained from E-views 9
The bound test approach to co-integration seeks to confirm if there is long run relationship among the variables in the model. This is done by testing if the coefficients of the variables are equal to zero in our estimated model or not. The F-Statistic value from the bound test and the critical value

216
bounds is presented in the table 5. The result confirms the presence of a long run relationship. This is because the calculated F statistic 146.6447 is greater than upper critical values at 5% and 10% significance level, and thus, deducing that there exists a co-integrating relationship among the time series in the level form, without considering whether they are I(0) or I(1).
C. Short Run Dynamics and Error Correction Representation of ARDL Co-integrating
Table 6: Estimated Short Run Dynamics and Error Correction
Estimated Short Run Dynamics Error Correction Representation of ARDL
(2,2,1,2,1,2) Selected based on Akaike info criterion (AIC)
Dependent variable is FSD
Regressor Coefficient Std. Error t-Statistic Prob.*
D(TMC_GDP(-1)) 0.307864 0.078555 3.919096 0.0024* D(CPTN) 0.057760 0.019065 3.029636 0.0115*
D(CPTN(-1)) 0.099518 0.018949 5.252001 0.0003* D(VOACC) 0.016079 0.034404 0.467353 0.6494 D(GOVEFF) 0.311127 0.029035 10.715602 0.0000**
D(GOVEFF(-1)) 0.275948 0.028044 9.839729 0.0000** D(POLSTA) 0.273848 0.104321 2.625050 0.0236*
D(REGQUAL) 0.460180 0.046140 9.973503 0.0000** D(REGQUAL(-1)) 0.763114 0.044161 17.280210 0.0000**
CointEq(-1) -0.342739 0.063720 -21.072561 0.0000** Diagnostic Tests
Test Statistics LM Version
A. Serial Correlation Х2 auto = 1.539132 (0.2793)
B. Functional Form (Ramsey Reset) Х2 RESET = 1.558759 (0.2471)
C. Normality Х2 Norm = 0.822196 (0.662922)
D. Heteroscedasticity Х2 Het x = 0.598373 (0.7916)
Source: Author’s computation Obtained from E-views 9 Note: ** and * indicate significance at 1% and 5% level of significances. Figures in parenthesis are probability values. A is Breusch-Godfrey Serial Correlation LM Test, B is Ramsey’s RESET test, C is Normality Test, D is Heteroscedasticity test. After confirming the existence of a long-run relationship it becomes imperative to estimate both the error correction mechanism form of the model together with its long run form. Error correction model was first used by Sargan (1964) and after this popularized by Engle and Granger (1987). Also, the diagnostic tests were examined from the unrestricted error correction (bounds test) model. These include Lagrange multiplier test of residual serial correlation, Ramsey's RESET test using the square of the fitted values for correct functional form (no mis-specification), Jarque-Bera normality test based on the skewness and kurtosis measures of the residuals and Breusch-Godfrey heteroscedasticity test based on the regression of squared residuals on the original regressors of the model. The results were presented as shown in table 6. The results presented in table 6 suggested that the sign of the coefficient associated with each variable did not differ in the long and in the short-run, when the same was statistically significant. It showed that control of corruption, government effectiveness, political stability and absence of violence/terrorism and regulatory quality all had significant relationship with Capital Market Development in Nigeria. The diagnostic tests applied to the model pointed out that there was no evidence of serial correlation and heteroscedasticity. Besides, the RESET test implied the correctly specified ARDL model and the skewness and kurtosis of residuals based on normality test showed that the residuals are normally distributed.

217
Considering specifically the short run dynamics, it is shown that FSD was positively influenced by the previous year’s development and the estimated coefficient of the error correction term is highly significant, thus confirming the previous results that there was a long-run relationship between the variables. Furthermore, the magnitude of the estimated coefficient of the error correction term suggested a relatively high speed of adjustment to any disequilibrium in the short run. In other words, the estimated ECMt-1 is equal to 0.34 which states that the departure from the equilibrium is adjusted by 34% per year.
D. Estimated Long Run Coefficients
Hence, the co-integrating equation and long run coefficients are specified as here below: Cointeg = TMC_GDP + (0.3076*CPTN + 0.0423*VOACC + 0.8230*GOVEFF – 0.0196*POLSTA + 1.21120*REGQUAL + 2.6700).
Table 7: Long run coefficients Long Run Coefficients
Variable Coefficient Std. Error t-Statistic Prob.
CPTN 0.307614 0.031787 9.677264 0.0000 VOACC 0.042295 0.024079 1.756538 0.1068 GOVEFF 0.822961 0.069164 11.898665 0.0000 POLSTA 0.019630 0.074349 0.264024 0.7966
REGQUAL 1.212041 0.095914 12.636781 0.0000 C 2.669970 0.273479 9.762992 0.0000
Source: Author’s computation Obtained from E-views 9
The result revealed that, all the explanatory variables except voice and accountability have significant relationship with Capital Market at 5% level of significance. This is in line with the findings of Anayiotos and Toroyan (2009) and Gries and Meierrieksy (2010) for sub-Saharan Africa and Cherif and Dreger (2014) for Middle East and North African (MENA) region. However this findings contradicts that of Law and Azman-Saini (2008) whose results indicated that none of the institutional quality variables is a statistically significant determinant of Capital Market because all the variables except voice and accountability are statistically significant with TMC/GDP and have both long and short run relationships signifying that control of corruption, government effectiveness, regulatory quality and political stability affect Capital Market in Nigeria significantly. Also, ARDL bounds F test result confirms the presence of a long run relationship. In other words, the Null hypothesis of no co-integration can be rejected at the 1%, 5% and 10% significance levels because F test statistic is greater than the critical upper bounds value I(1). While the error correction term is highly significant, thus confirming the previous results that there is a long-run relationship between the variables. Furthermore, the magnitude of the estimated coefficient of the error correction term suggests a relatively high speed of adjustment to any disequilibrium in the short run. In other words, the estimated ECMt-1 is equal to 0.34 which states that the departure from the equilibrium is adjusted by 34% per year. The hypothesis formulated is tested using the F-statistics. The F-statistics is a test of the overall significance of the entire variables used in the regression model; it is used to denote whether the joint impact of the explanatory (exogenous/ independent variables) actually have a significant influence on the dependent variable. Hence, the coefficient of determination (R2) estimated for this model shows that 99% of the variations in the financial sector development is explained by the explanatory variables which is above 50% and even after taking into consideration the degree of freedom, the adjusted coefficient of determination (adjusted R2) still shows that, 98% of the variation in the dependent variable is explained by the explanatory variables. The F-statistic 221.6883 with a probability 0.000000 confirmed the fitness of the coefficient of determination and shows an overall significant level of the explanatory variables jointly in explaining Capital Market development in Nigeria. Therefore, the null hypothesis that there is no significant relationship between the Institutional quality variables and Capital Market development in Nigeria can be rejected and we accept the alternative hypothesis, the finding of this hypothesis supports the

218
interest group theory as proposed by Rajan and Zingales (2003) who asserted that political institutions that impose more accountability on policy makers achieve higher levels of financial development.
CONCLUSION AND RECOMMENDATION
This study investigated the relationship between Institution quality and Capital Market Development in Nigeria and to empirically ascertain if Institution quality significantly impacts Capital Market Development in Nigeria. It was noted that there is a long run relationship between the Institutional quality variables and capital market development in Nigeria and the following variables government effectiveness, regulatory quality, political stability and corruption significantly impacts on Capital Market Development in Nigeria. In line with the findings of the study the following are recommended: 1. Concerted and conscious effort should be made by the regulatory institutions to ensure that
they are in sync with each other. The capital market will thrive with co-ordinated and consistent policies.
2. The anticorruption agencies are vital to the development of the Capital Market in Nigeria they should be recognized for their contribution thus far they should be equipped with adequate and motivated manpower and technology.
3. Political stability leads to growth and the development of the Nigerian Capital Market. Our democracy should be protected and nurtured; transition from one elected government to another should be perceived as free and fair by all parties

219
REFERENCES
Anayiotos, G. C., & Toroyan H. (2009). Institutional Factors and Financial Sector Development; Evidence from Sub-Sahara Africa. International Monetary Fund Working Paper. No 258.
Bob-Osaze, E. (2007). Capital Markets – African & Global. The Book House Company – ISBN 9789780-801922; pages 55- 63 (Chapter 4).
Cherif M., & Dreger C. (2014). Institutional Determinants of Financial Development in MENA Countries. Deutsches Institut für Wirtschaftsforschung. Discussion Paper 1422. http://ideas.repec.org/s/diw/diwwpp.html
Daniel K. A., & Massimo, M. (2010). The Worldwide Governance Indicators: A Summary of Methodology, Data and Analytical Issues. World Bank Policy Research Working Paper No. 5430 http://papers.ssrn.com/sol3/papers.cfm?abstract_id=1682130
Demetriades, P. O. & Hussein, K.A. (1996). Does Financial Development Cause Economic Growth? Time-series Evidence from 16 Countries. Journal of Development Economics, 51, 387-411.
Engle, R. F., & Granger, C. W. J. (1987). Co-integration and error correction: Representation, estimation and testing. Econometrics, 55,251-276.
Goldsmith, R. (1969). Financial Structure and development. New Haven, Yale University Press
Gries T. & Meierrieksy (2010). Institutional Quality and Financial Development in Sub-Saharan Africa. University of Paderborn, Department of Economics,
Johansen, S. and Juselius, K., (1990). Maximum Likelihood Estimation and Inference on Cointegration–with Applications to the Demand for Money. Oxford Bulletin of Economics and Statistics, 52(2),169–210
King, R. G., & Levine, R. (1993). Finance and Growth: Schumpeter Might Be Right. Quarterly Journal of Economics, CVIII, 717-37.
Kumhof, M. & Tanner, E. (2005). Government Debt: A Key Role in Financial Intermediation. International Monetary Fund Working Paper, WP/05/57
La Porta, R., Lopez-de-Silances, F., Shleifer, A., & Vishny, R. (1997). Legal Determinants of External Finance. Journal of Finance, 52,1131-1150.
La Porta, R., Lopez-de-Silances, F., Shleifer, A., & Vishny, R. (1998). Law and Finance. Journal of Political Economy, 106,1113-1155.
Law S. H., & Azman-Saini, W. N. W. (2008). The Quality of Institutions and Financial Development. Munich Personal RePEc Archive. Paper No. 12107. Online at http://mpra.ub.uni-muenchen.de/12107/
Levine, R. (1997). Financial development and economic growth: views and agenda. Journal of Economic Literature, 35,688-726.
Mckinnon, R. I. (1973). Money and Capital in Economic Development. Washington D.C: The Brookings Institution.
Pesaran, M. H., & Shin, Y. (1999). An autoregressive distributed lag modelling approach to cointegration analysis. Chapter 11 in S. Strom (ed.), Econometrics and Economic Theory in the 20th Century: The Ragnar Frisch Centennial Symposium. Cambridge University Press, Cambridge.
Pesaran, M. H., Shin, Y. & Smith, R. J. (2001). Bounds testing approaches to the analysis of level relationships. Journal of Applied Econometrics, 16,289–326.
Rajan, R.G. & Zingales, L. (2003).Saving Capitalism from Capitalists. New York: Random House. Rajan, R. G., & Zingales, L. (2003). The Great Reversals: The Politics of Financial Development inthe
20th Century. Journal of Finance and Economics, 69,5–50.
Roe, M., & Siegel, J. (2009). Political Instability: Its Effects on Financial Development, Its Roots in the Severity of Economic Inequality. available at SSRN: http://ssrn.com/abstract=963214.
Shaw, E.S. (1973). Financial Deepening in Economic Development. New York: Oxford University Press.

220
External Stakeholders of Corporate Social Responsibility and Corporate Reputation of Nigeria Deposit Money Banks
A.E. Akhidime (Ph.D)
Department of Accounting, Benson Idahosa University, Benin City, Nigeria [email protected]
And
E.O. Agbagbara Department of Accounting, Chukwuemeka Odumegwu Ojukwu University, Igbariam,
Nigeria [email protected]
_____________________________________________________________________________ ABSTRACT
This study examined the link between external stakeholders of Corporate Social Responsibility (hereafter, CSR) and the corporate reputation of Nigeria Deposit Money Banks (hereafter, NDMBs). This is in view of the devastating effect of economic recession on NDMBs, which plays a pivotal role in the continued sustenance of growth and development of Nigeria. Two independent variables; customers CSR and shareholders CSR were used to test the hypotheses of the study. This study relied on primary data obtained from 326 bank customers through self-administered 5-point Likert scale questionnaire in 2017 (the year of study). Purposive sampling technique was used to identify respondents. Responses were analyzed using descriptive and correlation analyses. Multiple regression was used to test the hypotheses at 5% level of significance. The findings indicate that CSR positively influences corporate reputation. It is recommended that if NDMBs continue to build their CSR strategy, it will keep them in business even during an economic recession. Key words: Corporate social responsibility; corporate reputation; Reputation quotient; External stakeholders INTRODUCTION
Discussions on Nigeria’s economic recession have become common place as it connotes a weak confidence in the economy by both consumers and businesses. The overall attitude of businesses, as a consequence of economic recession is to terminate non-essential spending like CSR because it is perceived to be an economic burden. The World Business Council advocates that irrespective of the economic circumstances bedeviling businesses, companies are obligated to add value to the economy by improving the quality of life of employees, their families, the local community and the society. Thus, the conceptualization of the relationship between business and society is symbiotic in nature. Many economists have acknowledged that banks are usually the first to take a hit during periods of economic decline. One significant reason for this is that since banks act as financial intermediaries towards the expansion of the frontiers of economic development and growth opportunities, whatever goes wrong with the economy is bound to transmit a loss of confidence in banks. At such periods, banks are faced with the problems of reduce lending and toxic assets. The question of banks maintaining public relevance during economic decline creates the impetus for this study. Two specific research objectives are established. The objectives are to ascertain whether the corporate reputation of banks can be positively influenced by their commitment to two external stakeholder dimensions; (i) customers related CSR, and (ii) shareholders focused CSR. These objectives arise from the heterogeneous nature of CSR construct (Ŝontaite-Petkevičiene, 2015) and are examined from the perspectives of customers. This study proceeds with the review of related literature and hypotheses development, methodology, estimation of results, discussion of findings, conclusion and recommendations.

221
LITERATURE REVIEW AND HYPOTHESES DEVELOPMENT
Conceptual framework and empirical review
Literature classifies stakeholder groups into primary stakeholders and secondary stakeholders. Primary stakeholders are parties directly involved in or are economically affected by business transactions and decisions or corporations. These include employees, customers, suppliers, shareholders and business partners. Secondary stakeholders are parties who do not have direct economic dealings with corporations, yet are influenced by corporate actions. They include competitors, the media, non-profit organizations, professional bodies, community, government, regulatory authorities and the environment. These two groups can be further categorized into internal and external stakeholders. The conceptual model for this study clarifies the relationship between CSR focused activities and their corporate reputation. Firstly, the model presupposes that there is no significant difference in the practice of CSR by NDMBs. Secondly, external stakeholders (customers) perceive that there is a positive relationship between CSR focused activities on customers and shareholders and corporate reputation (Branco & Rodrigues, 2006). Academic scholars like Davis, (1973), Bernstein, Zellner & Coy (2000) and Deegan (2002) have separately advocated reasons for CSR by banks. First, CSR enables banks to take actions in the present in anticipation of long-term viability. Second, the banking sector is able to police itself with self-regulatory standards that ward-off future government intervention and penalties. Third, since banks have a plethora of manpower, financial and material resources, they can help to solve societal problems by harnessing these resources. Fourth, the public expects banks to make things better for employees, investors, customers, communities and the environment because they do not operate in isolation. With corporate reputation as an intangible asset, it is a concept held in the minds of stakeholders and it encapsulates other constructs such as corporate identity, corporate image and reputation capital. Barnett, Jermier and Lafferty (2006) explain corporate reputation to mean the perception held by stakeholders with regard to a corporation’s financial, social and environmental impacts that are credited to that entity over time. In this context, Ŝontaite-Petkevičiene (2015) opines that CSR is capable of influencing the perceptions of stakeholders thereby contributing to the actualization of corporate reputation. Placier (2011) studied the impact of recession on the implementation of corporate social responsibility in companies using a comparative case study of three companies in Czech Republic. The study concluded that CSR is something to rely on in times of recession because it transmits reputation. Empirical studies of Branco & Rodrigues (2006), Husted & Allen (2007), Castaldo, Perrini, Misani & Tencati (2009), Bayoud & Kavanagh (2012) allude to the fact that company’s consistent involvement in CSR improves relations with stakeholders and positively correlates with corporate reputation.
Customers CSR and corporate reputation
Customer CSR are corporate responsibilities to customers that are targeted at fostering their customers concerns. CSR is capable of creating diverse forms of value for customers and it is the perception of this value that mediates the relationship between CSR and corporate reputation. Customers have economic power which can be exercised by moving businesses to other more friendly and socially oriented banks. NDMBs need to have a more corporate social outlook. As far as banks’ customers are concerned, they need secured and ethical products, appropriate feedback channels and policies on customers’ privacy and right to information. Khan, Majid, Yasir and Arshad (2013) in their study of cement industry in Pakistan elicited responses from 68 stakeholders concerning the relationship between customers’ oriented responsibilities and corporate reputation. The study revealed that there are strong positive correlations between customers oriented responsibilities and corporate reputation. Based on the above discussions, the first null hypothesis is stated as: H01: NDMBs favourable corporate responsibility towards customers has no significant impact
on corporate reputation.
Shareholders CSR and corporate reputation
Shareholder CSR are the responsibilities carried out by management towards ensuring and guaranteeing shareholders’ relevance. These are the providers of capital and they possess financial power. Ha and Krishnan (2011) submit that shareholders relationship can be hinged on some CSR related activities such as interactions with investees about environmental and social threats,

222
providing safety for shareholders by maintaining quality of published financial reports, encouraging shareholders rights to information through timely annual reports, advancing AGMs and the distribution of economic value generated. Orlitzky, Schmidt and Rynes (2003) and Kusemererwa (2010) in their studies found that improved relationships with shareholders may be transformed to financial benefits because business entities’ CSR behaviour seems to be a factor that sways the judgment of investment. They concluded that when companies actively engage in CSR, shareholders are led to believe that their companies support social courses and, so stay with the companies during periods of temporary economic setbacks rather than sell their shares. Based on the above discussions, the second null hypothesis is stated as: H02: NDMBs favourable corporate responsibility towards shareholders has no significant
impact on corporate reputation.
METHODOLOGY
Theoretical framework
The study relies on stakeholder theory. Stakeholder theory is a harmonizing rather than a contradictory body of literature which is considered as a necessary process in operationalizing CSR (Matten, Crane & Chapple, 2003). The theory asserts that businesses can be understood as a set of relationships among groups which have a stake in the activities of those business (Visser, Matten, Pohl & Tolhurst (2007). Functionally, stakeholder theory’s influence on CSR, according to studies of Pirsch, Gupta & Grau (2007) and Jamali (2008), can be classified according to three main assumptions. (1) normative assumption – a multi-dimentional CSR program that conveys equal treatment to corporate stakeholders, (2) instrumental stakeholder assumption – a CSR program that emphasizes the economic performance and benefits of shareholders and (3) descriptive stakeholder assumption – a CSR program that lays emphasis on upholding stakeholder interests, corporate image and corporate behaviour. These assumptions tend to link CSR programmes with shared stakeholders expectations. However, where a stakeholder group has significant power and influence over the organization, the organization may be forced to align its CSR programme with the wish and aspiration of that particular group. An inference from this position is that stakeholder theory offers a supposedly realistic, useful agenda for studying and appraising CSR. Just like Pirsch et al., (2007), Jamali (2008) and Ferrary (2009) who applied the stakeholder approach in various empirical studies, this study adopts stakeholder theory with specific focus on bank customers.
Model specification In view of the above backdrop, we express a functional relationship between customers focused CSR, shareholders focused CSR and corporate reputation as: CR=f (CusCSR, ShCSR) . . . . . . . . . . . . . . . . . . . . . . . . . . . . . . . equation 1 Equation 1 can be transformed into econometric model as: CR=B0+B1CusCSR+B2ShCSR+ε . . . . . . . . . . . . . . . . . . . . . . . . .equation 2 Where: CR = corporate reputation CusCSR = customers focused CSR activities ShCSR = shareholders focused CSR activities B0 = intercept of the regression line B1& B2 = slope coefficient ε = error term. Priori expectation is B0,B1,B2>0
Research design
This study applies the survey research design.

223
Population and sample size
The study population is bank customers. This population is infinite thus Cochran (1977) sampling formula is used to estimate a sample size of 384 respondents. n0 = Z2pq = 1.962[0.50x(1-0.50)] e2 0.052 = 384 Where n0 is sample size, Z is the area under a normal curve at a desired confidence level, p is the degree of variability that is present in the population, q is 1-p and e is the sampling error. The following are assumed: 95% confidence level, sampling error at ±5% with 50/50 estimated degree of variability. Purposive sampling technique was used to identify respondents and copies of questionnaire were distributed over a three-month period in 2017 (the year of the study). Questionnaire Self-administered questionnaire approach is used on the premise that it diminishes interview bias and ensures a high level of response rate since questions are easily clarified on the spot for survey participants. The questionnaire is in three sections – section A consists of questions on the demographic characteristics of respondents, section B consists of questions on the dependent variable, while section C consists of questions on the independent variables. The research variables in sections B & C are placed on a 5-point Likert scale in form of a statement where 1 is ‘Strongly Disagree(SD)’, 2 is ‘Disagree(D)’, 3 is ‘Neutral(N)’, 4 is ‘Agree(A)’ & 5 is ‘Strongly Agree(SA)’. The operationalization of the dependent and independent variables are set out in Tables 1 & 2. Operationalisation of dependent & independent variables
Dependent variable - corporate reputation
Reputation quotient developed by Harris-Fombrun was used to develop the corporate reputation construct. The RQ operationalises the variable of reputation into six constructs (Fombrun & Van, 1997 cited in Katamba, 2010). These are emotional appeal, products and services, vision and leadership, workplace environment, financial performance and social responsibility. The social responsibility construct was eliminated so as to avoid the possibility of co-linearity with CSR operationalized variables. The items formulated to operationalise this construct are shown in Table 1. Table 1: Operationalisation of corporate reputation variable
Emotional appeal - I have a good feeling about Nigeria banks - I respect and admire Nigeria banks - I trust Nigeria banks Products and services - Banks offer high quality products and services - Banks develop innovative products and services - Users of banks products/services are certain of banks commitment to the products/services Vision and leadership - Banks recognize and take advantage of market opportunities - Banks have clear vision for their future prospects - Banks have excellent leadership Workplace environment - Banks are well managed - Banks attract good employees - Banks are good financial institutions to work for Financial performance - Banks have strong records of profitability - Banks have strong prospects for future growth - Banks are a low-risk investment Source: Researchers’ Compilation, 2017
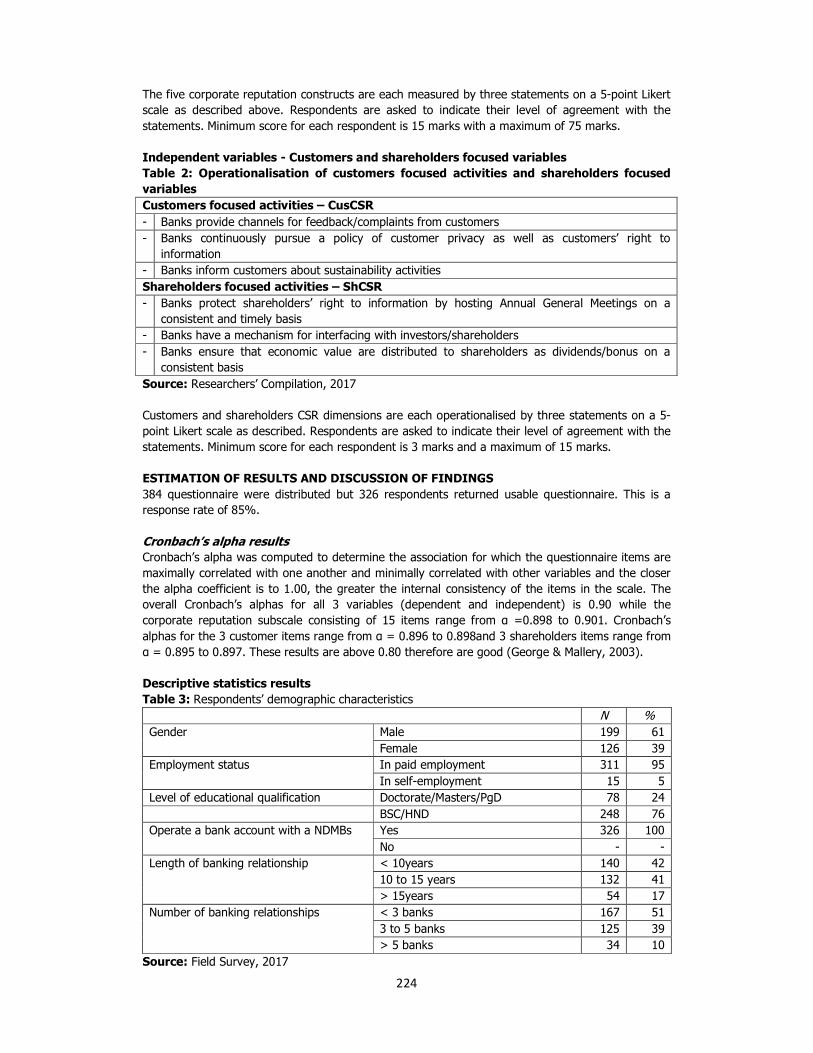
224
The five corporate reputation constructs are each measured by three statements on a 5-point Likert scale as described above. Respondents are asked to indicate their level of agreement with the statements. Minimum score for each respondent is 15 marks with a maximum of 75 marks. Independent variables - Customers and shareholders focused variables
Table 2: Operationalisation of customers focused activities and shareholders focused
variables
Customers focused activities – CusCSR
- Banks provide channels for feedback/complaints from customers - Banks continuously pursue a policy of customer privacy as well as customers’ right to
information - Banks inform customers about sustainability activities Shareholders focused activities – ShCSR
- Banks protect shareholders’ right to information by hosting Annual General Meetings on a consistent and timely basis
- Banks have a mechanism for interfacing with investors/shareholders - Banks ensure that economic value are distributed to shareholders as dividends/bonus on a
consistent basis Source: Researchers’ Compilation, 2017 Customers and shareholders CSR dimensions are each operationalised by three statements on a 5-point Likert scale as described. Respondents are asked to indicate their level of agreement with the statements. Minimum score for each respondent is 3 marks and a maximum of 15 marks. ESTIMATION OF RESULTS AND DISCUSSION OF FINDINGS
384 questionnaire were distributed but 326 respondents returned usable questionnaire. This is a response rate of 85%. Cronbach’s alpha results
Cronbach’s alpha was computed to determine the association for which the questionnaire items are maximally correlated with one another and minimally correlated with other variables and the closer the alpha coefficient is to 1.00, the greater the internal consistency of the items in the scale. The overall Cronbach’s alphas for all 3 variables (dependent and independent) is 0.90 while the corporate reputation subscale consisting of 15 items range from α =0.898 to 0.901. Cronbach’s alphas for the 3 customer items range from α = 0.896 to 0.898and 3 shareholders items range from α = 0.895 to 0.897. These results are above 0.80 therefore are good (George & Mallery, 2003). Descriptive statistics results
Table 3: Respondents’ demographic characteristics
N % Gender Male 199 61
Female 126 39 Employment status In paid employment 311 95
In self-employment 15 5 Level of educational qualification Doctorate/Masters/PgD 78 24 BSC/HND 248 76 Operate a bank account with a NDMBs Yes 326 100
No - - Length of banking relationship < 10years 140 42
10 to 15 years 132 41 > 15years 54 17
Number of banking relationships < 3 banks 167 51 3 to 5 banks 125 39 > 5 banks 34 10
Source: Field Survey, 2017

225
According to Table 3, survey respondents were 61% male and 39% female. 95% are in paid employment while 5% are self-employed. 24% hold post-graduate degrees while 76% hold 1st degree. 100% of the respondents operate a bank account. 42% have maintained banking relationship for less than 10 years, 41% are between 10 to 15 years and 17% are for over 15 years. 51% bank with at least 3 banks, 39% with at least 3 to 5 banks and 10% with more than 5 banks. Table 4: Statements regarding corporate reputation Statement Mean Std. Dev. Emotional appeal I have a good feeling about Nigeria banks 3.883 .837 I respect and admire Nigeria banks 3.785 .896 I trust Nigeria banks 3.629 1.093 Products and services Banks offer high quality products and services 3.828 .984 Banks develop innovative products and services 3.966 .902 Banks stand behind products/services 3.798 .962 Vision and leadership Banks recognize and take advantage of market opportunities 4.261 .813 Banks have clear vision for their future prospects 4.110 .870 Banks have excellent leadership 3.761 1.031 Workplace environment Banks are well managed 3.877 .953 Banks attract good employees 3.828 .961 Banks are good financial institutions to work for 3.767 1.087 Financial performance Banks have strong records of profitability 4.001 .847 Banks have strong prospects for future growth 4.071 .876 Banks are a low-risk investment 3.951 .966 Source: Field Survey, 2017
Table 5: Statements regarding CusCSR Statement Mean Std. Dev. Banks provide channels for feedback/complaints from customers 4.233 .820 Banks continuously pursue a policy of customer privacy as well as customers’ right to information
4.153 .871
Banks inform customers about sustainability activities 3.966 .892 Source: Field Survey, 2017
Table 6: Statements regarding ShCSR Statement Mean Std. Dev. Banks protect shareholders’ right to information by hosting Annual General Meetings on a consistent and timely basis
4.095 .915
Banks have a mechanism for interfacing with investors/shareholders 4.018 .834 Banks ensure that economic values are distributed to shareholders as dividends/bonus on a consistent basis
3.979 .952
Source: Field Survey, 2017 Tables 4-6 provide descriptive statistics for the research variables. Mean scores are over the mid-point on the one to five scale.
Hypotheses testing and results
The hypotheses developed for this study are tested using multiple regression technique at 5% level of significance. Based on the results of the analysis the null hypotheses were either accepted or rejected and a justification for the decision was given.

226
Regression results
Table 7: Results of regression model
R R2 Adjusted R2
F-Value Unstandardized B
t- Value
Sig VIF
.556 .309 .305 72.382 0.000 Intercept 1.626 8.419 CusCSR .261 5.458 0.000 1.308 ShCSR .299 6.727 0.000 1.308 Source: Researchers’ Computation, 2017 According to Table 7, the correlation coefficient R=0.556 indicates that there is a positive correlation between CSR and corporate reputation. This proves that the dependent variable and independent variables change in the same direction. R2=0.309 indicates the amount of variations in corporate reputation that is accounted by the fitted model. It is noticed that the value of the adjusted R2=0.305 is close to the value of R2=0.309. The implication is that if the whole population participates in the study and the model is fitted, then there will be 0.4% (0.309 - 0.305) reduction in the variance of the outcome-ratio=72.382 is significant at 5% level with p=0.000. The null hypotheses are rejected and the alternate hypotheses are accepted indicating that there is a statistically significant relationship between CSR and corporate reputation. Furthermore the dimensions of CSR make positive statistical significant contribution to the model as deduced from the positive beta values with corresponding p-values<0.05 (i.e. CusCSR: B1=0.261, p=0.000; ShCSR: B2=0.299, p=0.000) with t-values=5.458 and 6.727 respectively. CSR towards shareholders made the largest contribution to the regression equation with B2=0.299 which indicates that it is a strong predictor of corporate reputation. The priori expectations, B0,B1,B2>0 are confirmed by the results.
CONCLUSION AND RECOMMENDATIONS
Our aim in this study is to investigate whether there is a link between the external stakeholder dimensions of CSR (namely customers related CSR and shareholders focused CSR) and corporate reputation of NDMBs. The results have helped us to reject the hypotheses H01 and H02 and show that CSR positively influences corporate reputation. This is consistent with the studies of Orlitzky et al., (2003), Branco & Rodrigues (2006), Husted & Allen (2007), Castaldo et al., (2009), Kusemererwa (2010), Bayoud & Kavanagh (2012) and Khan et al., (2013). From the findings, the study recommends that if NDMBs continue to build their CSR strategy, it will keep them in business even during economic recession. Overall, this study adds to the extant literature on CSR in Nigeria. Further studies with larger sample size and more numbers of variables are recommended.

227
REFERENCES
Barnett, M.L., Jermier, J.M., & Lafferty, B.A. (2006). Corporate reputation: The definitional
landscape. Corporate Reputation Review, 9(1), 26-38. Bayoud & Kavanagh (2012). Corporate social responsibility disclosure: evidence from Libyan
managers. Global Journal of Business Research, 6, 73-83. Bernstein, A., Zellner, W., & Coy, P. (2000). Too much corporate power? Business Week, 3698,
144-144. Bichta, C. (2003). Corporate social responsibility: a role in government policy and regulation?
University of Bath School of Management Branco, M.C., & Rodrigues, L.L. (2006). Corporate social responsibility and resource based
perspectives. Journal of Business Ethics, 69(2), 111-132. Castaldo, S., Perrini, F., Misani, N., & Tencati, A. (2009). The missing link between corporate
social responsibility and consumer trust: the case of fair trade products. Journal of Business Ethics, 84, 1-15.
Cochran, W. G. (1977). Sampling techniques (3rd ed.). New York: John Wiley & Sons. Davis, K. (1973). The case for and against business assumption of social responsibilities.
Academy of Management Journal, 16(2), 312-322. Deegan, C. (2002). Introduction: The legitimising effect of social and environmental disclosures-a
theoretical foundation. Accounting, Auditing & Accountability Journal, 15(3), 282-311. Egri, C., & Ralston, D.A. (2008). Corporate responsibility: A review of international management
research from 1998 to 2007. Journal of International Management, 14(4), 319-339. Ferrary, M. (2009). A stakeholder’s perspective on human resource management. Journal of
Business Ethics, 87(1), 31-43. Fombrun, C., & Shanley, M. (1990). What's in a name? Reputation building and corporate
strategy. Academy of Management Journal, 33(2),233-258. Fombrun, C.J., & Van-Riel, C. (1997). The reputational landscape. Corporate Reputation
Review, 1(1), 5-13. George, D., & Mallery, P. (2003). SPSS for windows step by step: A simple guide and reference
(4th ed.). Boston: Allyn & Bacon. González-Benito, J., & González-Benito, Ó. (2005). Environmental proactivity and business
performance: an empirical analysis. Omega, 33(1), 1-15. Ha, C., & Krishnan, P. (2011). CSR Compliance and Disclosure in BRICS: An intra-and inter-
country comparison(Unpublished seminar paper, Lund University). Retrieved from http://lup.lub.lu.se/luur/download?func=downloadFile&recordOId=1976749&fileOId=2436107
Husted, B.W., & Allen, D.B. (2007). Strategic corporate social responsibility and value creation
among large firms: lessons from the Spanish experience. Long Range Planning, 40, 594-610.
Jamali, D. (2008). A stakeholder approach to corporate social responsibility: A fresh perspective

228
into theory and practice. Journal of Business Ethics, 82(4), 213-231. Katamba, D. (2010). Corporate social responsibility, organizational culture, ethical citizenship
and reputation of financial institutions in Uganda (Unpublished Master thesis, Makerere University, Uganda). Retrieved from http://mak.ac.ug/documents/Makfiles/theses/katamba%20david.pdf
Khan, M., Majid, A., Yasir, M., & Arshad, M. (2013). Corporate social responsibility and
corporate reputation: A case of cement industry in Pakistan. Interdisciplinary Journal of Contemporary Research in Business, 5(1), 843-858.
Kusemererwa, C. (2010) Organisation social capital, corporate social responsibility and
financial performance of commercial banks (Unpublished MBA thesis, Makerere University, Uganda). http://www.mubs.ac.ug/docs/masters/mba/Organisation%20social%20capital,%20corporate%20social%20responsibility%20and%20financial%20performance%20of%20commercial%20banks.pdf
Matten, D., Crane, A., & Chapple, W. (2003). Behind the mask: Revealing the true face of
corporate citizenship. Journal of Business Ethics, 45(1/2), 109-120. Orlitzky, M., Schmidt, F.L., & Rynes, S.L. (2003). Corporate social financial performance: a
meta-analysis. Organization studies, 24(3), 403-441. Pirsch, J., Gupta, A., & Grau, S.L. (2007). A framework for understanding corporate social
responsibility programs as a continuum: An exploratory study. Journal of Business Ethics, 70(2), 125-140.
Placier, K. (2011). The impact of recession on the implementation of corporate social
responsibility in companies. Journal of Competitiveness, 3(2), 83-98. Šontaitė-Petkevičienė, M. (2015). CSR reasons, practices and impact to corporate reputation.
Procedia-Social and Behavioral Sciences, 213, 503-508. Visser, W., Matten, D., Pohl, M., & Tolhurst, N. (Eds) (2007). The A to Z of corporate social
responsibility: A complete reference guide to concepts, codes and organisations. London: Wiley.

229
APPENDIX Cronbach’s alpha reliability statistics Cronbach’s alpha
Cronbach’s alpha based on standardized items
No of items
0.900 0.901 21 Cronbach’s alpha item statistics
Statement Cronbach’s alpha if item deleted
Emotional appeal I have a good feeling about Nigeria banks 0.895 I respect and admire Nigeria banks 0.894 I trust Nigeria banks 0.893 Products and services Banks offer high quality products and services 0.892 Banks develop innovative products and services 0.893 Users of banks products/servicesare certain of banks commitment to the products/services
0.894
Vision and leadership Banks recognize and take advantage of market opportunities 0.896 Banks have clear vision for their future prospects 0.893 Banks have excellent leadership 0.893 Workplace environment Banks are well managed 0.894 Banks attract good employee 0.895 Banks are good financial institutions to work for 0.898 Financial performance Banks have strong records of profitability 0.896 Banks have strong prospects for future growth 0.895 Banks are a low-risk investment 0.901 Customers CSR Banks provide channels for feedback/complaints from customers 0.897 Banks continuously pursue a policy of customer privacy as well as customers’ right to information
0.896
Banks inform customers about sustainability activities 0.898 Shareholders CSR Banks protect shareholders’ right to information by hosting Annual General Meetings on a consistent and timely basis
0.895
Banks have a mechanism for interfacing with investors/shareholders 0.896 Banks ensure that economic value are distributed to shareholders as dividends/bonus on a consistent basis
0.897
Model summaryb R R square Adjusted R square Std. error of the estimate
.556a .309 .305 .48333 a. Predictors: (Constant), CusCSR, ShCSR b. Dependent variable: CR ANOVAa
Model Sum of squares df Mean square F Sig. Regression 33.818 2 16.909 72.382 .000b Residual 75.456 323 .234 Total 109.275 325 a. Dependent variable: CR b. Predictors: (Constant), CusCSR, ShCSR Coefficientsa
Model Unstandardized coefficients
Standardized coefficients
T Sig. Collinearity statistics
B Std. error Beta Tolerance VIF (Constant) 1.626 .193 8.419 .000 CusCSR .261 .048 .289 5.458 .000 .765 1.308 ShCSR .299 .044 .356 6.727 .000 .765 1.308 a. Dependent variable: CR

230
Pearson’s correlation coefficient CR CusCSR ShCSR
CR Pearson correlation 1.000 .461** .496** Sig. (2-tailed) .000 .000 N 326 326 326 CusCSR Pearson correlation 1.000 .485** Sig. (2-tailed) .000 N 326 326 ShCSR Pearson correlation 1.000 Sig. (2-tailed) N 326 ** correlation is significant at the 0.01 level (2-tailed)
The Relationship between Strategic Decision Making and Firm Financial Performance:
Evidence from the Listed Nigerian Companies
Yakubu Yahaya
Department of Business Administration, School of Management Studies, Abubakar Tafari Ali Polytechnic, P M B 009, Bauchi State
[email protected] _____________________________________________________________________________
ABSTRACT
The Relationship between Strategic Decision Making and Firm Financial Performance was investigated in this paper. Specifically, the study investigated whether there is a statistically significant relationship between growth decision, financing decision, marketing decision and cost control decision and return on capital employed by the 30 companies randomly selected from the 74 manufacturing companies listed on the Nigeria stock exchange. The study used both primary and secondary data to determine the relationship. The data analysis was done by use of descriptive statistics and inferential statistics. These measures were calculated using Statistical Package for Social Sciences (SPSS 20) software. The result reveals that a significant relationship exists between strategic decision making and the financial performance of the listed manufacturing companies in Nigeria. 1. INTRODUCTION
The continuous deterioration in the performance of public companies in recent times has opened up a debate on the need to review some of the existing policies in public companies in order to raise the economic efficiency of those companies. Ansoff (2011) notes that the business environment is constantly changing, and so makes it imperative for organizations to continuously adapt their activities in order to succeed. In other word, to survive in this very dynamic environment, organizations need strategies to focus on their customers’ satisfaction and to also deal with the other emerging challenges so as to improve the efficiency of the organization and also to guarantee acceptable rate of return to the shareholders. Similarly, O’Regan & Ghobadian, (2005) posit that strategic management provides overall direction to the enterprise. Therefore, firms that pursue sustainable strategic management base the formulation, implementation, and evaluation of their strategies on an analysis of the market issues they face, the values they hold that support sustainability, and the economic interests of their stakeholders. Strategic decision has been defined by Wagner (2006) as an on-going process that evaluates and controls the business and the industries in which the company is involved; assesses its competitors and sets goals and strategies to meet all existing and potential competitors; and then reassesses each strategy regularly to determine how it has been implemented and whether it has succeeded or needs replacement by a new strategy to meet changed circumstances, new technology, new competitors, a new economic environment., or a new social, financial, or political environment. Often times, strategic decision introduces changes that sometimes encounter organizational resistance. Thus, Thompson and Strickland (1989) added that galvanizing organization-wide commitment to the chosen strategic decision is critical to effective performance.

231
A large body of evidence exists in literature supporting the view that higher quality strategic decisions, which is primarily the responsibility of the board, influence the performance of the firm. However, the direction of this influence is yet to be ascertained. For instance, Miller, Burke and Glick, 1998) observed a significant relationship between strategic decision and firm performance while a negative relationship was reported by Wanjohi (2003). For this reason, this study seeks to investigate the level of commitment of board of directors to strategic decision making and its effect on firm’s financial performance, since such study is still limited in the literature especially in the Nigerian context. Four aspects of strategic decision were considered in this study. They are growth decision, financing decision, marketing decision and cost control decision. Each of this strategy was used in formulating the study objectives. Thus, the study investigates whether there is a significant relationship between growth decision and the financial performance of the listed companies in Nigeria. The study also investigates whether there is significant relationship between financing decision and financial performance as well as whether a significant relationship exists between marketing decision and financial performance. The fourth specific objective is to determine if a significant relationship can be found between cost control strategy and firm financial performance. Although, a broad body of literature exists on the relationship between strategic decision and financial performance, this study however differs from them in several ways. First, most of the previous studies focused on the financial institution (Aldehayyat & Twaissi, 2011; Gică & Negrusa, 2011; O’Regan, Sims & Gallear, 2008; Efendioglu & Karabulut, 2010) ignoring the fact that the strategies that favours a highly regulated sector such as financial institution may be at variance with other sectors such as manufacturing companies. This study therefore drew its sample from the listed manufacturing companies in Nigeria. Out of the 74 companies listed as manufacturing companies in Nigeria, this study randomly selected 30 companies where data were drawn for analysis. Also, a large body of evidence exists supporting the view that higher quality decisions regarding product specification, customer prioritization, extensive marketing results in better performance (Dalton, Daily, Ellstrand, & Johnson, 1998; Miller, Burke, & Glick, 1998). Other variables such as marketing decision etc were neglected. For firms operating in complex competitive environments, the most effective decision processes are those that draw upon a diversity of frames of reference to identify important factors such as market share, availability of new market opportunities, operational best practices, competitive interactions, and cost control strategy. Thus, this study differs from the existing literature by incorporating variables such as growth decision, financing decision, marketing decision and cost control strategy. 2. STRATEGIC DECISION MAKING AND FINANCIAL PERFORMANCE: AN EMPIRICAL
REVIEW
Aldehayyat and Al-Khattab, (2013) conducted a study which examined whether strategic planning will assist business firms to uplift its performance. They reported that the literature suggests some dimensions of strategic planning to be tested, namely: formality, tools of strategic planning, employee participation, strategic implementation, time horizon and control. The study adopted descriptive research design and reported that strategic planning have important contributions in order to achieve a better organizations performance. The study also tested the relationship of each dimensions of strategic planning in order to determine their impact on performance of the organization. The findings from their study revealed that the formality of the planning as well as the tools of the planning have significant influence on financial performance. Byrson (1989) argues that strategic planning assists in providing direction so organization members know where the organization is heading to and where to expend their major efforts. It guides in defining the business the firm is in, the ends it seeks and the means it will use to accomplish those ends. The process of strategic planning shapes a company’s strategy choice through the use of a systematic, logical and rational approach. It reveals and clarifies future opportunities and threats and provides a framework for decision making. Strategic planning looks ahead towards desired

232
goals. Strategic plan defines performance to be measured, while performance measurement provides feedback against the planed target (Dusenbury, 2000). Strategic planning applies a system approach by looking at a company as a system composed of subsystems. It permits managers to look at the organization as a whole and the interrelationships of the parts. It provides a framework for coordination and control of organization’s activities, decision-making throughout the company and forces the setting of objectives, which provide a basis for measuring performance (Arasa and K’Obonyo, 2012). Kotter (1996) argues that the strategic planning process can be used as a means of repository and transforming the organization. Strickland and Gamble (2007) postulate that the essence of good strategy making is to build a strong enough market position and an organization capable of producing successful performance despite unforeseeable events, potent competitive and internal difficulties. 3. METHODOLOGY
In this study, survey research design was adopted. According to Cooper and Schindler (2003), a survey research design is concerned with finding out the what, where and how of a phenomenon. Survey research design was chosen because it enables the researcher to generalize the findings of a study to a larger population. Also, survey design method provided quantitative data from a cross section of the chosen population. The survey research collects data in order to answer questions concerning the current status of the subject under study (Mugenda & Mugenda, 2003). The survey was conducted on a total of thirty listed manufacturing companies in Nigeria. Actually, the population for this study is seventy four, which is the total number of listed manufacturing companies in Nigeria. Furthermore, purposive sampling technique was adopted in the selection of respondents required for this research. This technique was considered suitable because of the emphasis on the knowledge of how strategic decision is made in organization. However, the organizations used for the research were randomly selected from the seventy four manufacturing companies listed on the Nigeria stock exchange that formed the study population. Two respondents were selected from each company to avoid opinions gathered from being skewed. The two respondents were the chief executive officer and the chief financial officer of the selected companies. A total of sixty respondents made up the sample size. Both primary and secondary data were extensively relied upon in the performance of this research. Strategic decision making which is the independent variable for the study was measured with primary data while financial performance (dependent variable) was measured with secondary data. Questionnaires were used to gather the primary data. The research instruments were administered personally which enabled the study to record high response rate. The secondary data on the other hand was extracted from the audited financial statements of the companies selected for the study. The data analysis was done by use of descriptive statistics and inferential statistics. These measures were calculated using Statistical Package for the Social Sciences (SPSS 20) software. SPSS tool (Statistical Package for the Social Sciences) was used to organize and analyze data. This is because it is user-friendly and, gives all the possible analysis. The results were presented in the form of tables, pie charts, column and bar graphs. The relationships in the research questions were determined using the Ordinary Least Squares (OLS) regression model prescribed by Faraway (2002), Cohen et al. (2003). The use of ordinary Least Squares Regression is preferred due to its ability to show whether there is a positive or a negative relationship between independent and dependent variables (Castillo, 2009). In addition, OLS is useful in showing linear elasticity/sensitivity between independent and dependent variables (Cohen et al., 2003). For instance, the current study would like to determine the percentage by which financial performance increases or decreases when coefficient of strategic decision making change by 1 percent. Furthermore, OLS is useful in showing whether the identified linear relationship is significant or not. The study therefore formulates the study model as: ROCEt= a1 + β0+ β1GDECt + β2FDECt + β3MDECt + β4CCDECt + εt

233
In the model a1 = the constant term while the coefficient βi, i= 1 - 4 was used to measure the sensitivity of the dependent variables (ROCE) to unit change in the explanatory variable (growth decision, financing decision, marketing decision and cost control decision ); ε is the error term which captures the unexplained variations in the model. 4. RESULTS AND DISCUSSION
4.1 Descriptive Statistics
The study sought to find out the performance of listed manufacturing companies in Nigeria with reference to the strategic decision making. Results as presented in table 1 revealed that 72% of the respondents agreed that the company’s profitability has increased over the last five years, 99% agreed that there was an increased number of investors over the last five years and 63% agreed that the company had witnessed a significant increase in capital base in the last five years. Also, 71% percent of the respondents agreed that the company have increased number of employees over the last five years and 77% agreed that the company has experienced a significant increase in market shares over the last five years. The mean score for this section was 3.99 which indicate that listed companies performance has increased during the period under consideration. The findings agree with those of Adeleru (2006) who reported a significant relationship between strategic decision and financial performance. Table 1 Response on Financial performance
Statements SD D UND A SA Mean Std
Dev
The company’s profitability has increased over the last five years
7.3% 16.6% 0.0 11.14%
61% 3.96 1.12
There is increased number of investors over the last three years
0.0% 0.6% 0.0 77.2% 22.1% 4.77 0.42
The company has experienced a significant increase in capital base
4.8% 22.6% 9.7% 25.8% 37.1% 3.68 1.31
The company has increased number of employees over the last five years
1.6% 12.9% 14.5% 27.4% 43.5% 3.81 1.05
The company has a large market share over the last five years
0.0% 9.7% 12.9% 14.5% 62.9% 3.96 0.94
The company has been consistent with payment of dividend in the past five years
1.6% 25.1% 9.27% 26.2% 37.9% 3.74 0.96
Mean 3.99 The study sought to investigate the effect of growth decision on the financial performance of listed manufacturing companies in Nigeria. The results as presented in table 2 revealed that about 85% of the respondents agreed that the company’s annual sales have increased over the last five years. Also, 96% agreed that there is an increase in the number of branches over the last five years, 87% agreed that the company has experienced a significant increase in market share and about 73% agreed that the company has increased number of suppliers in the last five years. Table 2 Response on Growth Decision
Statements SD D UND A SA Mean Std Dev
The company’s annual sales has increased over the last five years
3.2% 3.2% 8.1% 46.8% 38.7% 4.15 0.39
There is increased number of branches over the last five years
1.4% 2.8% - 30.6% 66.1% 4.26 0.51
The company has experienced a significant increase in market share
1.6% 3.2% 8.1% 12.9% 74.2% 3.94 0.68
The company has increased number of suppliers in the last five years
5.6% 8.9% 12.5% 28.4% 44.5% 3.88 1.05

234
The study sought to investigate the effect of financing decision on the financial performance of listed manufacturing companies in Nigeria. The results as presented in table 3 revealed that about 75% of the respondents were in agreement with the statement that their company used both equity and debt in financing its operation. Similarly, about 79% of the respondents agreed that the listed manufacturing companies relied more on equity capital for its financing, about 69 & agreed that the offer of shares for subscription is done whenever the company is expanding its operation; about 65% agreed that the listed manufacturing companies have increased their market capitalization in the last five years. Table 3: Response on Financing Decision
Statements SD D UND A SA Mean Std
Dev
The company used both equity and debt in financing its operation
21.2%
1.6% 1.6% 49.8% 25.8% 3.97 0.82
The company relied more on equity capital for its financing
3.2% 4.8% 12.9 24.2% 54.8% 4.09 0.89
The offer of share for subscription is done whenever the company is expanding its operation
9.7% 8.1% 12.7% 42.4% 27.1% 3.71 1.26
The company has increased its market capitalization in the last five years
14.3%
5.4% 15.2% 49.3% 15.7% 3.88 0.99
The study sought to investigate the effect of marketing decision on the financial performance of listed manufacturing companies in Nigeria. The results as presented in table 4 revealed that about 93% of the respondents agreed that the company’s market share has increased over the last five years. Again, about 73% of the respondents agreed that their companies have done rebranding of the product over the last five years; about 87% agreed that the company employs customer satisfaction as one of its marketing strategies, about 84% agreed that their company opened new sales outlet over the last five years. Table 4: Response on Marketing Decision
Statements SD D UND A SA Mean Std
Dev
The company’s market share has increased over the last five years
- 2.14% 4.40% 55.2% 38.3% 4.32 0.49
The company has done rebranding of its product over the last five years
3.2% 16.1% 8.3% 61.4% 11.2% 3.79 0.86
The company employs customer satisfaction as one of its marketing strategy
9.7% 1.6% 1.6% 58.1% 29% 4.13 0.71
The company opened new sales outlet over the last five years
1.1% 3.8% 10.8% 58.1% 26.3% 4.05 0.74
The study sought to investigate the effect of cost reduction decision on the financial performance of listed manufacturing companies in Nigeria. The results as presented in table 5 revealed that about 90% of the respondents were in agreement with the statement that their company adopts the use of contract staff as a cost reduction strategy. Similarly, about 81% of the respondents agreed that the listed manufacturing companies do review of contract and vendors annually, about 66% agreed that company review tax saving strategies periodically as a cost reduction strategy; about 90% agreed that the listed manufacturing companies practiced the recycling of stationeries as a cost reduction strategy in the last five years.

235
Table 5: Response on Cost Control Decision
Statements SD D UND A SA Mean Std
Dev
The company’s adopts the use of contract staff as a cost reduction strategy
1.67 2.36% 7.40% 70.2% 20.3% 4.29 0.52
The company does review of contract and vendors annually
4.2% 6.1% 9.3% 61.7% 19.2% 3.84 0.76
The company review tax saving strategies periodically as a cost reduction strategy
14.7%
12.6% 8.6% 40.1% 25% 3.13 1.33
The company practices recycling of stationeries as a cost reduction strategy
3.8% 1.1% 4.8% 62.1% 28.3% 4.12 0.69
4.2 Inferential Statistics
To investigate the nature of relationship between strategic decision making and financial performance, the study employed an ordinary least square regression analysis. According to Kothari (2014), regression is the determination of a statistical relationship between two or more variables. In simple regression, there are two variables, one variable (defined as independent) is the cause of the behavior of another one (defined as dependent variable). The R-square also known as coefficient of determination is 0.615, suggesting that the variables considered in this study accounted for about 62% of the variation in financial performance of the listed manufacturing companies in Nigeria while the remaining 38% can be attributed to the other variables not captured by this study model. The overall probability is positive and significant at 1% level of significance. The regression results in table 6 reveals that the beta coefficient for growth decision was 1.449. The t- statistics and p-value were 2.485 and 0.006 respectively. From these results, it can be inferred that there is a significant relationship between growth decision making and financial performance of the listed manufacturing companies in Nigeria. The result supports that of Fama Aldehayyat and Al-Khattab, (2013) who conducted a study which examined whether strategic planning will assist business firms to uplift its performance. The findings from their study revealed that the formality of the planning, firm growth decision as well as the tools of the planning have significant influence on financial performance. Board independence has a statistically significant and positive relationship with the return on capital employed and thus, leading to the rejection of the null hypothesis which states that board independence has no significant relationship with financial performance. The positive and significant relationship between board independence and financial performance suggests the presence of efficient directors on the board of the listed banks in Nigeria whose monitoring activities positively impacted the financial performance. The findings of this study contradict that of Bhagat and Black (2002) who reported that firms that hired a higher proportion of outside directors showed significantly lower financial performance, after evaluating their Return on Equity (ROE) over a period of ten years covered by his study. The results however support that of Ararat, Orbay and Yurtoglu (2010) and Pang (2004) where positive relationships were reported. Furthermore, the relationship between disclosure and return on capital employed produce a t-statistics of 0.715 and p-value of 0.288 which indicates a positive but insignificant relationship between the variables. This result suggests that the disclosure of significant accounting information does not have much influence on the level of financial performance in the Nigerian listed banks. The results contradict several existing literatures such as Ferrarini & Recine; 2006, Moloney, 2007; Chiu, 2007; Jackson, 2009; Posner & Véron, 2010). It also implies that the code of corporate governance by OECD (2014) and SEC (2011) compelling the management of corporate entities to provide more information in the annual report cannot be defended by this study.

236
To examine more rigorously the relationship that seems to exist between the dependent variable and independent variables, regression analysis was conducted using another financial performance indicator (Earnings per Share). As a matter of facts both statistical analyses provided almost identical results. The main difference is that R-square is greater for earnings per share which indicates that the overall model is more compact for earnings per share. It is therefore straightforward to state that increasing the level of board independence increases the financial performance for listed banks in Nigeria and vice versa. It is also clear that variables like ownership concentration and disclosure do not have explanatory power on the financial performance. Table 6: Regression Results
R R2
0.784 0.615
SS DF MS F Sig.
Regression 1439.457 3 228.344 76.115 0.000 Residual 2017.225 206 11.023 Total 3456.682 209
Beta Std. Err. T Sig.
Growth Decision 1.449 0.583 2.485 .006 Financing Decision 0.308 0.081 3.802 .000 Marketing Decision 0.153 0.214 0.715 .288 Cost Reduction Decision 2.464 1.092 2.257 .000 Dependent Variable: Financial Performance
237
5. CONCLUSION AND RECOMMENDATIONS
The relationship between strategic decision making and financial performance was investigated in this study. Specifically, the study investigates whether there is a significant relationship between growth decision and financial performance of the listed companies in Nigeria. The study also investigates whether there is significant relationship between financing decision and financial performance as well as whether a significant relationship exists between marketing decision and financial performance. The fourth specific objective is to determine if a significant relationship can be found between cost control strategy and firm financial performance. The study adopted a survey research design. The data analysis was done with the use of descriptive statistics and inferential statistics. These measures were calculated using Statistical Package for the Social Sciences (SPSS 20) software. From the results of the inferential analysis, the R-square also known as coefficient of determination is 0.615 suggesting that the variables considered in this study accounted for about 62% of the variation in financial performance of the listed manufacturing companies in Nigeria while the remaining 38% can be attributed to the other variables not captured by this study model. The overall probability is positive and significant at 1% level of significance. The results also show that the beta coefficient for growth decision, financing decision and cost reduction decision were significant which implies that these three variables have significant influence on financial performance.

238
BIBLIOGRAPHY
Adams, R., & Ferreira, D. (2009). Women in the Boardroom and Their Impact on Governance and Performance. Journal of Financial Economics, (94), pp.291{309.
Agrawal, A. &. Knoeber, C.R (1996). Firm value and mechanisms to control agency problems
between managers and shareholders, Journal of Financial and Quantitative Analysis 31, 377–397.
Ahern, K. R., & Dittmar, A. K. (2012). The changing of the boards: The impact on firm valuation of
mandated female board representation. Quarterly Journal of Economics, 127(1), 137-197. Ahern, K. & Dittman, A. (2012). The Changing of the Boards: The Impact on Firm Valuation of
Mandated Board Representation,” Quarterly Journal of Economics, Vol. 129 No. 1, pp. 137–197.
Bøhren, Ø., & Staubo, S. (2014). Does mandatory gender balance work? Changing organizational form to avoid board upheaval. Journal of Corporate Finance, 28, 152-168.
Bøhren, Ø., & Strøm, R. Ø. (2010). Governance and politics: Regulating independence and diversity
in the board room. Journal of Business Finance & Accounting, 37(9‐10), 1281-1308. Campbell, K. & Vera, A. (2010). Gender Diversity in the Boardroom and Firm Financial Performance.
Journal of Business Ethics,(83), pp. 435-451. Carter, D. A., Simkins, B. J., & Simpson, W. G. (2003). Corporate governance, board diversity, and
firm value. Financial Review, 38(1), 33-53. Carter, D. D'Souza, F. Simkins.B & Simpson, G. (2010). The Gender and Ethnic Diversity of US
Boards and Board Committees and Firm Financial Performance. Corporate Governance: An International Review, pp. 396-414.
Conyon, M.J. (2006). Executive compensation and incentives”, Academy of Management
Perspectives, vol. 20(1): 25-44 Dezso, C. L., &. Ross, D.G, (2012). Does Female Representation in Top Management Improve Firm
Performance? A Panel Data Investigation,” Strategic Management Journal, Vol. 33, pp. 1072–1089.
Erhardt, N. Werbel, J. and Shrader, C. (2003). Board of Director Diversity and Firm Financial Performance. Corporate Governance: An International Review. Volume 11, No. 2, pp. 102-09.
Francoeur, C. R. (2007). Gender Diversity in Corporate Governance and Top Management. Journal
of Business Ethics, Vol 81, pp.83-95. Lone, C. Huidan, L. Joana, P. Petia and Rima (2016). Gender Diversity in Senior Positions and Firm
Performance: Evidence from Europe, IMF working paper, 16(50) Oyerogba, E.O. Memba, F. &Riro, G.K (2016) “Impact of board size and firm’s characteristics on the
profitability of listed companies”, Research Journal of Finance and Accounting, vol. 7 (4): 143-151
Robinson, G. & Dechant, K, (1997). Building a business case for diversity, Academy of Management
Executive 11, 21–30. Shrader, C.B., & Blackburn, V.B & Iles, P. (1997). Women in Management and Firm Financial
Performance: An Explorative Study", Journal of Managerial Issues, 9, 355-372. SEC (2011). Code of corporate governance for public companies retrieved on 28th August, 2013
from http://www.sec.gov.ng/

239
Singh, V., & Vinnicombe S. (2004), "Why so FewWomen Directors in Top UK Boardrooms: Evidence and Theoretical Explanations", Corporate Governance: An International Review, 12, 479-488.
Smith, N., V. Smith, & Verner, M (2005). Do Women in Top Management affect Firm Performance?
A Panel study of 2500 Danish Firms,” Discussion Paper August (Bonn: Institute for the Study of Labor).
Schwartz-Ziv, M., (2013). Does the Gender of the Directors Matter?” Working Paper No. 8, Edmond
J. Safra Center for Ethics Working Paper Series, Harvard. Terjesen, S., B. Couto, F. & Francisco, P.M (2015). Does the Presence of Independent and Female
Directors Impact Firm Performance? A Multi-Country Study of Board Diversity,” Journal of Management & Governance, DOI:10.1007/s10997-014-9307-8, pp. 1–37.

240
Firm Characteristics, Corporate Social Responsibility and Firm Value of
Quoted Nigeria Companies.
Dr S. N. Ugbogbo
Department of Accounting, Benson Idahosa University, Benin City
And
Dr L. N. Aisien
Department of Economics, Banking and Finance, Benson Idahosa University, Benin City _____________________________________________________________________________
ABSTRACT
The study empirically investigates firm characteristics, corporate social responsibility and firm value of quoted Nigeria companies. This study employed a longitudinal research design which involves quoted firms on the Nigerian Stock Exchange. The longitudinal study covers a time frame of five (5) years that is 2011-2015. A total of hundred and eighty six (186) quoted firms on the Nigerian Stock Exchange constituted the population of the study. It is upon the population size that a total of sixty four (64) firms form the sample size. The sample size was arrived at by use of number estimation formula by Taro Yamane (1967). While, purposive sampling technique was used in selecting each of the company to form the sample size which annual reports are publicly available. The statistical tool employed in the study was the panel Least Square (PLS) regression, while data collected and collated are estimated using E-views 8.0. The study findings therefore revealed that firm size, company growth and industry type has significant effect on firm value. On the other hand leverage has no significant influence on firm value. Hence, the study concluded that disclosure on corporate social responsibility (CSR) activities is necessary due to the fact that a firm owes a duty to the society or has a social contract in reporting to communicate with its stakeholders. As such, the study recommends that firms quoted on the Nigeria stock exchange whether large or small size should engage in corporate social responsibility that addresses social and environmental concerns.
Keywords:
Corporate social responsibility, firm size, industry type, company growth, leverage and firm value
1. INTRODUCTION
In recent years managers have increased their interest in corporate social responsibility (CSR), which is shown by the increased attention and resources for responsible activities (UN Global Compact-Accenture, 2010). This increased attention is likely because of the interest different stakeholders are paying to a corporations’ behavior in today’s society and to the fact that corporations want to create and maintain a good reputation by the public. A number of scandals related to global firms have indicated that irresponsible behavior can have massive consequences for a firm’s reputation. However, recent illustrations of responsible behavior have shown that doing good actually can in fact bring benefits for corporations as well (Bruns, 2017). In favor of these reasons, shareholders and stakeholders have been expecting an increase in accountability related to this area. Several researches related to the social aspect of a company have been done, especially in the context of the financial aspect and the firm value. The various results may be obtained from different research methodology (Margolis & Walsh, 2001). It can also be caused by lack of understanding about which factors that make the corporate social responsibility affects the firm value (Servaes & Tamayo, 2013). Some researches show positive relationship between the CSR and the Firm Value (Aggarwal, 2013; Bidhari, Salim, & Aisjah, 2013; Barnet & Salomon, 2011). The other results reveal that there is no relationship between the CSR and the firm value because of lack of understanding in their complex relationship (Singh, 2014; Tyagi, 2012; Tjia & Setiawati, 2012; Nyirenda, 2013). There are also results that show inconclusive relationship (Panwar, Paul, Nybakk, Hansen & Thompson, 2014). Freeman (1984) suggests that corporate decisions involve a trade-off between shareholder value and other stakeholder benefits. As a result, Nyirenda, (2013) believe

241
CSR initiatives deplete shareholder value due to the decrease in profits. While, Bagnoli and Watts (2003) believe CSR initiatives increase financial performance. The inconclusive results found by previous researchers in international markets may be puzzling to Nigeria researchers and investors, as no real consensus has been reached regarding CSR and financial performance. This study on the corporation social responsibility (CSR) will help to determine the impact on capital market performance of firms’ entrance into and exit from the Nigeria Stock Exchange index whether firms are penalized, rewarded or remain neutral to such announcements – in terms of market-based indicators. As a result, one can gain insight into the impact of CSR on shareholder value as well as investor preferences (Becchetti, Ciciretti, Hasan & Kobeissi, 2012). In view of this, the study aims at examining firm characteristics, corporate social responsibility and firm value of quoted Nigeria companies. To facilitate the investigation the following hypotheses have been formulated. H01: firm sizes as a determinant of corporate social responsibility have no significant effect on
firm value in the Nigeria quoted firm. H02: Industry type as a determinant of corporate social responsibility has no significant impact
on firm value in the Nigeria quoted firm. H03: Company growths as a determinant of corporate social responsibility have no significant
effect on firm value in the Nigeria quoted firm. H04: leverage as a determinant of corporate social responsibility has no significant influence on
firm value in the Nigeria quoted firm. H05: Disclosures of employees, environmental and customer and supplier activities are not
significantly related to firm value in the Nigeria quoted firm. 2. LITERATURE REVIEW
Firm Value
Haryono and Iskandar (2015) revealed that firm value is the perception of the investor to the success of a company. It is reflected in the share price of the company. The increase of the share price shows the trust of the investors to the company, so they are willing to pay more with aiming for higher return. The value of a company is the total assets owned. It consists of the market value of share and liabilities. Bhabra (2007) believes that firm value is the price paid by the wealthy buyer when a company is sold, and he also sees firm value as the objective value from the public and the orientation of company’s survival. Modigliani (1980) points out that the value of a firm is the sum of its debt and equity and this depends only on the income stream generated by its assets. The value of the firm’s is the discounted value of its shareholders earnings called net income. That is, the net income divided by the equity capitalization rate or expected rate of return on equity. The net income is obtained by subtracting interest on debt from net operating income. Moreover, firm value is typically indicated by price to book value (PBV). When the PBV is high, it, therefore, means that the principle of going concern is operational which translates into shareholders’ wealth. The measurement of a company firm value can be done through many indicators, e.g. Tobin’s Q, Price Earning Ratio (PER), Price to Book Value (PBV), Profitability: Return on Assets (ROA), Return on Equity (ROE) (Damodaran, 2002).
Concept of Corporate Social Responsibility
Defining corporate social responsibility (CSR) is not as straightforward as it looks like beforehand, this is due to the fact that socially responsible behavior may mean different things in different places to different people and at different times (Campbell, 2007; Frynas & Stephens, 2015). And because of this, the increasing body of literature related to CSR is facing a problem of definition. However multiple definitions have been provided, finding one universal definition is considered difficult (Campbell, 2007; Matten & Moon, 2008; Aguinis & Glavas, 2012; Frynas & Stephens, 2015). According to Davis (1973), CSR refers to the firm’s consideration of, and response to, issues beyond the narrow economic, technical, and legal requirements of the firm. Davis (1973) argues that it is the firm’s obligation to evaluate its decision-making process in such way that the effects of its decisions on the external social system will accomplish social benefits along with the traditional economic gains which the firm seeks. Furthermore, he argues that social responsibility begins where the law ends. A firm is not being socially responsible if it merely complies with the minimum requirements of the law, because this is what any good citizen would do. In popular Carroll’s definition, explains business practice as a pyramid of responsibilities with economic responsibilities at the bottom, followed by legal, then ethical, and with philanthropic responsibilities at the top

242
(Carol, 1979). He argues that CSR is about taking responsibility for the pyramid's top parts, as well as the economics and legal responsibilities of the firm. While significantly pointing out that CSR includes philanthropic contributions, however is not limited to it. Carrol (1999) developed this reasoning and explains that these responsibilities are less important than the other three categories. This is because firms are not seen as irresponsible if they do not fulfill these responsibilities. To fulfill all responsibilities firms should be profitable, while operating within the boundaries of the law, be ethical, and be a good corporate citizen (Carrol, 1979). McWilliams and Siegel (2001) describe CSR as ‘actions that appear to further some social good, beyond the interests of the firm and that which is required by law. Campbell (2007) defined corporate social responsibility in a way if they do two things. First, they must not knowingly do anything that could harm their stakeholders, notably, their investors, employees, customers, suppliers, or the local community within which they operate. Second, if corporations do cause harm to their stakeholders, they must then rectify it whenever the harm is discovered and brought to their attention. However, Campbell (2007) believes that firms are considered to be social responsible as long as they do no harm to the world. To measure Corporate Social Responsibility disclosures, contents of publicly annual reports were used with quantity of disclosures being based on the number of words in annual reports. Measurement via word count is more detailed than number of pages because word count ignores grammar style, picture, font size (Milne & Adler, 1999), or page size (Hackston & Milne, 1996). Three areas or dimensions of Corporate Social Responsibility contents – employees, environmental and customer and supplier practices – were analyzed.
Determinants of Corporate Social Responsibility
Firm Size
Firm size is seen in different perspectives. It refers to numbers of employees, total turnover or natural logarithm of total assets. Small and medium-sized firms form 90% of the worldwide population of businesses. According to extant studies, a determinant that seems to have a significant effect on a firm’s level of CSR engagement is a firms’ size (Reverte, 2009; Padgett & Galan, 2010; Marano & Kostova, 2016). Over the years, multiple studies have investigated the effect that firm size has on CSR and came to the conclusion that company size is closely related to CSR activities. Following legitimacy theory, it is argued that larger corporations are more likely to invest in CSR initiatives because of the greater public scrutiny over their behavior (Brammer & Millington, 2008; Dam & Scholtens, 2013; Marano & Kostova, 2016). The larger the company seems to be, the more it engages in CSR activities to ensure that the public sees the organization as legitimate (Reverte, 2009; Padgett & Galan, 2010). A number of empirical studies have verified that the size of the firm and CSR reporting are positively related (Cowen, Ferreri & Parker, 2007; Patten, 2001; Hackston & Milne, 2006).
Industry Type
Industry type refers to a group or sector the firm belongs. It is one of the corporate attributes that can affect the level of firm value. Industry type, in which a company is active, seems to have a significant effect on a company’s level of CSR engagement (Reverte, 2009; Marano & Kostova, 2016). That is, firms that is active in more environmentally sensitive industries, such as the mining, oil and energy generation industries, tend to engage more in CSR activities than firms that are not active in environmental sensitive industries.
Company Growth
The existence of company growth is generally associated with an information asymmetry and with higher agency costs (Smith & Watts, 1992; Gaver & Gaver, 1993). Therefore, companies that are experiencing good company growth should be associated with more corporate social responsibility disclosure quality which intent to reduce the existing information asymmetry between the company and external investors. According to Ng and Koh (1994) more profitable firms use more self-regulating mechanisms to ensure to the public that the organization is legitimate. Following this reasoning profitability is considered a determinant of CSR. Empirical studies have found mixed results on the relationship between profitability and CSR reporting. The Studies of Hackston and Milne (2006) failed to find any significant association between the level of profitability and corporate social reporting. Although, the study of Lau (2004) found that higher- profit companies have higher incidences of reporting in their annual report as compare to lower-profit companies.

243
Leverage
Leverage refers to use of debt in financing the business. In this study leverage is proxy by the debt-to-total asset ratio. Shareholders may want more leverage because it will increase the expectation of profit (Brigham & Houston, 2001). Companies that have high financial leverage should have higher degrees of transparency because creditors require them to disclose more information (Khanna, Palepu & Srinivasan 2004). Leverage is a potential determinant of CSR (Reverte, 2009; Purushothaman, Tower, Hancock & Taplin, 2000). Following a stakeholder theoretical perspective it is believed that the level of debt in the company’s capital structure influences the importance of is creditor, stakeholder group, and as a result, management are more likely to address their financial claims than the claims of other stakeholder groups for instance stakeholder groups that want the firm to engage more in CSR activities. Therefore leverage is seen as a possible determinant that affects a company’s level of CSR engagement.
Theoretical Framework
Legitimacy Theory
Legitimacy theory relies on the notion that there is a social contract between a company and the society in which it operates (Deegan, 2002). It is derived from the concept of organizational legitimacy, which has been first defined by Dowling and Pfeffer (1975) as a condition or status, which exists when an entity’s value system is congruent with the value system of the larger social system of which the entity is a part. When a disparity, actual or potential, exists between the two value systems, there is a threat to the entity’s legitimacy. Legitimacy theory posits that organizations continually seek to ensure that they operate within the bounds and norms of their respective societies (Dowling & Pfeffer, 1975; Deegan, 2002; and Frynas & Yamahaki, 2016). Within the legitimacy theory there are two main perspectives, which are: strategic and institutional (Chan, Watson & Woodliff, 2014; Panwar et al., 2014; and Frynas & Yamahaki, 2016). Strategic legitimacy assumes a degree of managerial control over the legitimation process (Suchman, 1995). It is assumed that managers can adopt strategies to demonstrate to society that the organization is attempting to comply with society’s expectations. Under this perspective, legitimacy is considered a resource that is conferred by groups outside the organization (Chan et al., 2014; Panwar et al., 2014). In contrast to the strategic perspective, the institutional perspective assumes that legitimacy is acquired by factors other than a company’s qualities or actions (Chan et al., 2014). Under this perspective, organizations have a limited potential to really manage legitimacy, since legitimacy judgments also come from culture and the ideology of evaluators (Chan et al., 2014).
3. METHODOLOGY
This study employed a longitudinal research design which involves quoted firms on the Nigerian Stock Exchange. The longitudinal study covers a time frame of five (5) years that is 2011-2015. The ideas for this study is to know the determinants of corporate social responsible on firm value based on firms characteristics. A total of hundred and eighty six (186) quoted firms on the Nigerian Stock Exchange constituted the population of the study. It is upon the population size that a total of sixty four (64) firms form the sample size. The sample size was arrived at by use of number estimation formular by Taro Yamane (1967). While, purposive sampling technique was used in selecting each of the company to form the sample size which annual reports are publicly available. The statistical tool employed in the study was the ordinary Least Square (OLS) regression, while data collected and collated are estimated using E-views 8.0. Model Specification
Multiple regressions are used in analyzing the study. Furthermore, our model is stated in econometric form as well as the functional form. TOBINQ=f(LEV, FSIZE, INDTYPE, GRWTH, EMP, ENV CUS)………………………….(1) Expressing equation (1) in econometric form, we have TOBINQi,t=β0+β1LEVi,t+β2FSIZEi,t+β3INDTYPEi,t+β4GRWTHi,t+β5EMPi,t+β6ENVi, +β7CUSi,t+U…………………………………………………………………………………...(2) Where TOBINQ = Firm Value β0 = Intercept of the regression line β1, β2, β3, and β7 = Coefficient

244
LEV= Leverage FSIZE= Firm Size INDTYPE= Industry Type GRWTH= Growth Opportunity EMP= disclosures related to employees ENV= disclosures related to environment CUM= disclosures related to customers and suppliers i, t = indices for companies and time, respectively
Operationalization of Variables Variable Description Measurement Aprori
sign Source
TOBINQ Firm Value Firm value is measured as the ratio of the market value of the firm to book value of assets at year end
-nil- Damodaran, (2002)
Independent Variables
FSIZE Firm size Firm size is measured as natural logarithm of total assets of the firm
+ Brammer and Millington, (2008)
LEV Leverage Financial leverage is measured using ratio of total debts to total assets
-
GRWTH Growth Opportunity Growth Opportunities is measured by an average growth rates of sales over the past 5 years
+ Ng and Koh (1994)
INDTYPE Industry Type If the firm is non-financial 1, otherwise 0
+ Marano and Kostova, (2016)
EMP
Disclosures related to employees
contents of publicly annual reports were used with quantity of disclosures being based on the number of words in annual reports
- Pham (2010)
ENV Disclosures related to environment
contents of publicly annual reports were used with quantity of disclosures being based on the number of words in annual reports
- Pham (2010)
CUM Disclosures related to customers and suppliers
contents of publicly annual reports were used with quantity of disclosures being based on the number of words in annual reports
+ Pham (2010)
Source: Researchers Compilation, (2017)
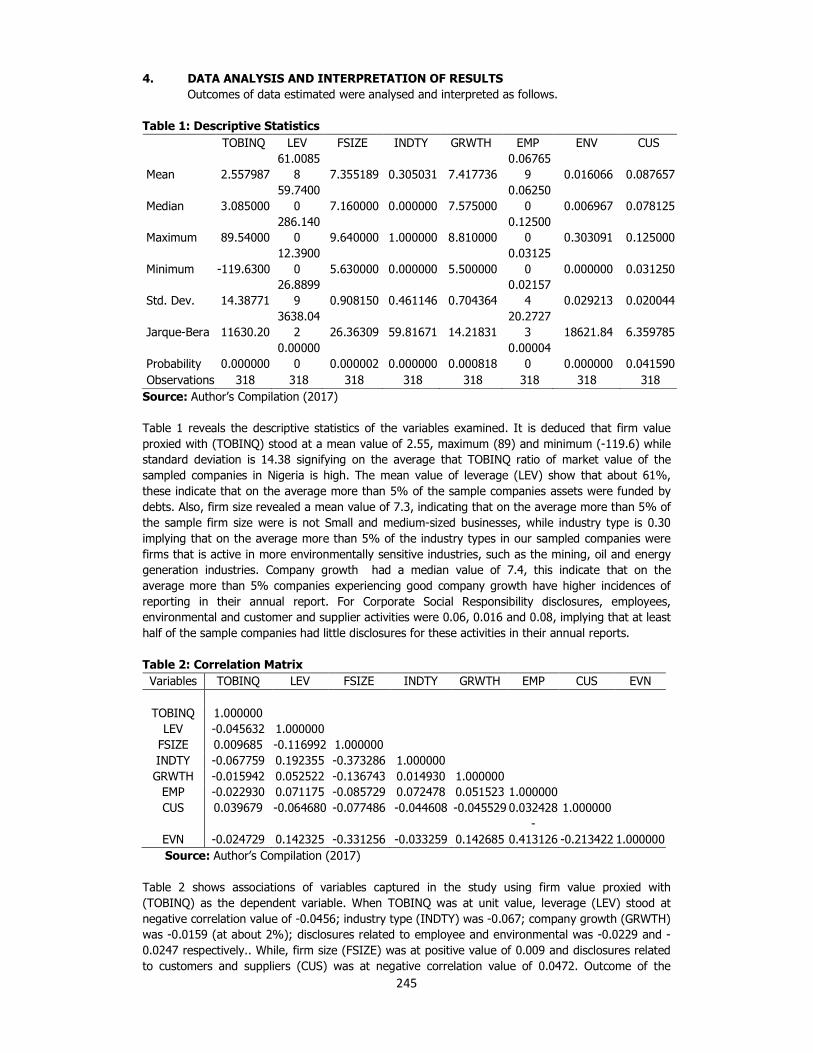
245
4. DATA ANALYSIS AND INTERPRETATION OF RESULTS
Outcomes of data estimated were analysed and interpreted as follows.
Table 1: Descriptive Statistics
TOBINQ LEV FSIZE INDTY GRWTH EMP ENV CUS
Mean 2.557987 61.0085
8 7.355189 0.305031 7.417736 0.06765
9 0.016066 0.087657
Median 3.085000 59.7400
0 7.160000 0.000000 7.575000 0.06250
0 0.006967 0.078125
Maximum 89.54000 286.140
0 9.640000 1.000000 8.810000 0.12500
0 0.303091 0.125000
Minimum -119.6300 12.3900
0 5.630000 0.000000 5.500000 0.03125
0 0.000000 0.031250
Std. Dev. 14.38771 26.8899
9 0.908150 0.461146 0.704364 0.02157
4 0.029213 0.020044
Jarque-Bera 11630.20 3638.04
2 26.36309 59.81671 14.21831 20.2727
3 18621.84 6.359785
Probability 0.000000 0.00000
0 0.000002 0.000000 0.000818 0.00004
0 0.000000 0.041590 Observations 318 318 318 318 318 318 318 318 Source: Author’s Compilation (2017) Table 1 reveals the descriptive statistics of the variables examined. It is deduced that firm value proxied with (TOBINQ) stood at a mean value of 2.55, maximum (89) and minimum (-119.6) while standard deviation is 14.38 signifying on the average that TOBINQ ratio of market value of the sampled companies in Nigeria is high. The mean value of leverage (LEV) show that about 61%, these indicate that on the average more than 5% of the sample companies assets were funded by debts. Also, firm size revealed a mean value of 7.3, indicating that on the average more than 5% of the sample firm size were is not Small and medium-sized businesses, while industry type is 0.30 implying that on the average more than 5% of the industry types in our sampled companies were firms that is active in more environmentally sensitive industries, such as the mining, oil and energy generation industries. Company growth had a median value of 7.4, this indicate that on the average more than 5% companies experiencing good company growth have higher incidences of reporting in their annual report. For Corporate Social Responsibility disclosures, employees, environmental and customer and supplier activities were 0.06, 0.016 and 0.08, implying that at least half of the sample companies had little disclosures for these activities in their annual reports. Table 2: Correlation Matrix
Variables TOBINQ LEV FSIZE INDTY GRWTH EMP CUS EVN
TOBINQ 1.000000 LEV -0.045632 1.000000
FSIZE 0.009685 -0.116992 1.000000 INDTY -0.067759 0.192355 -0.373286 1.000000 GRWTH -0.015942 0.052522 -0.136743 0.014930 1.000000
EMP -0.022930 0.071175 -0.085729 0.072478 0.051523 1.000000 CUS 0.039679 -0.064680 -0.077486 -0.044608 -0.045529 0.032428 1.000000
EVN -0.024729 0.142325 -0.331256 -0.033259 0.142685 -
0.413126 -0.213422 1.000000 Source: Author’s Compilation (2017)
Table 2 shows associations of variables captured in the study using firm value proxied with (TOBINQ) as the dependent variable. When TOBINQ was at unit value, leverage (LEV) stood at negative correlation value of -0.0456; industry type (INDTY) was -0.067; company growth (GRWTH) was -0.0159 (at about 2%); disclosures related to employee and environmental was -0.0229 and -0.0247 respectively.. While, firm size (FSIZE) was at positive value of 0.009 and disclosures related to customers and suppliers (CUS) was at negative correlation value of 0.0472. Outcome of the

246
correlation matrix indicates that there is absent of the presence of multicollinearity since none of the correlation values exceeded 0.90 as stated by Dwivedi, Kiang, Williams and Lal,( 2008) for case of multicollinearity.
Table 3: The results for Hausman test for the model
Correlated Random Effects - Hausman Test
Equation: Untitled
Test cross-section random effects
Test Summary Chi-Sq. Statistic Chi-Sq. d.f. Prob.
Cross-section random 8.404511 6 0.2099
To employ panel data regression analysis for the model, the Hausman test was employed to test appropriateness of fixed effects model (FEM) and random effects model (REM). Table shows that p-values of cross section random for the model were greater than 0.05, hence null hypothesis that random effects model estimators are more efficient was accepted, implying that random effects model was preferred to fixed effects model (REM). Therefore, random effects model was used in analyzing this study’s panel data.
Table 4: Regression Result
Method: Panel Least Squares Included observations: 64
Variable Coefficient t-Statistic Prob. C 4.378990 0.300484 0.3130
LEV -0.028092 -0.846334 0.3980 FSIZE 2.877645 2.043958 0.0047
INDTYP -0.569408 -0.263176 0.7926 GRWTH 3.204541 2.178807 0.0024
EMP 29.68643 0.579645 0.5626 ENV -2.084563 -0.861167 0.3891 CUS -2.076353 -0.042404 0.0537
R-squared 0.653032 Adjusted R-squared 0.626015 S.E. of regression 0.091737 Sum squared resid 1.221706 Log likelihood 231.5512 F-statistic 1.913702 Durbin-Watson stat 1.921736
Source: Author’s Compilation (2017)
Table 4 revealed outcome of the panel least square regression result using random effect. The coefficient of determination R2 which stood at a value of 0.653 with firm value which was proxied with (TOBINQ) suggests that about 65% of the systematic variations in the dependent variable were accounted for by the independent variables while the remaining 35% were unaccounted for hence captured by the error term. Similarly, after adjusting the degree of freedom, adjusted
coefficient of determination, (the adjusted R-square) 2 stood at 0.626 with firm value, implying that about 63% of the changes in the dependent variable were explained while 37% of the variations were unexplained. The overall F-statistic otherwise known as goodness-of- fit measure stood at significant value of 1.914, compared with the standard error of regression which stood at minimal value of 0.091, suggesting that the results are capable for prediction. However, the Durbin Watson (DW) statistics also stood at impressive value of 1.92, indicating absence of autocorrelation in the results. Therefore, the entire results prove impressive for policy implementation.

247
4.2 Discussion of Findings
The findings are discussed as follows First, it was found that financial leverage is statistically insignificant, indicating that it is a weak determinant, but it positively related to corporate social responsibility disclosure on firm value. Although, Khanna, Palepu and Srinivasan (2004) argues that companies that have high financial leverage should have higher degrees of transparency because creditors require them to disclose more information. Second, it is observed that firm size is statistically significant indicating that firm size is a strong determinant of corporate social responsibility disclosure on firm value. The positive coefficient value suggested that the firm size result is consistent with the apriori expectation, which further indicated that increase in firm size lead to increase in corporate social responsibility disclosure. The finding supports the view of Hackston and Milne (2006) who stated that the size of the firm has effect to the firm’s value. It can be seen from the significance of CSR is 2.043 (P-value > 0.004). Third, industry type was found to be statistically significant and positively related to corporate social responsibility disclosure. This suggested that industry type has significant effect with corporate social responsibility disclosure on firm value. The finding is consistent with Marano & Kostova, (2016) who stated that industry, in which a company is active, seems to have a significant effect on a corporation’s level of CSR engagement. Company growths were found to be statistically significant and positively influence corporate social responsibility disclosure on firm value. This finding is in line with Lau (2004) who found that higher- profit companies have higher incidences of reporting in their annual report as compare to lower-profit companies. Among three dimensions of Corporate Social Responsibility disclosures, only information on customers and suppliers practices was found to be statistically significant with firm values. The result suggests that firms provided more information regarding to their responsibility with customers and suppliers. 5. CONCLUSION AND RECOMMENDATIONS
Corporate disclosures provide a firm the opportunity to spread value information mainly to financial stakeholders such as stock analysts, capital markets and institutional investors. Despite the necessity for disclosures on social and environmental issues, there has been a variety of factors, which may affect either positively or negatively firms to provide these reports. Firm’s size and the characteristics of industry seem to play the most important role in the disclosure of social and environmental issues, according to many studies (Da Silva Monteiro & Aibar-Guzmán, 2009; Brammer & Pavelin, 2008; Magness, 2006). Following the various reviews and outcome of analysis and interpretation, it is concluded that size of the firm, company growth, the extent to which the firm is financed with debt and type of industry have influence on corporate social responsibility disclosure. Hence, this study recommended as follows. (1) Firms quoted on the stock exchange whether large or small size should engage actively on
corporate social responsibility. (2) Firms with prospect for growth should increase voluntary corporate social responsibility
disclosure issues in their annual reports for the interest of stakeholders and intended investors.
(3) Firms that are being financed with debt should adequately disclose corporate social responsibility issues for the interest of their creditors.
(4) The type of industry a firm belongs especially those in sensitive areas should voluntarily disclose corporate social responsibility activities for the interest of stakeholders.

248
REFERENCES
Aguinis, H., & Glavas, A. (2012). What we know and don’t know about corporate social responsibility
a review and research agenda. Journal of Management, 38(4), 932-968. Bagnoli, M., & Watts, S. G. (2003). Selling to socially responsible consumers: competition and the
private provision of public goods. Journal of Economics & Management Strategy, 12 (3), 419–445
Becchetti, L., Ciciretti, R., Hasan, I., & Kobeissi, N. (2012). Corporate social responsibility and
shareholder’s value. Journal of Business Research, 65 (11), 1628–1635. Brammer, S., & Millington, A. (2008).Does it pay to be different? Ananalysis of the relationship
between corporate social and financial performance. Strategic Management Journal, 29(12), 1324-1343.
Brammer, S., & Pavelin, S. (2008).Factors influencing the quality of corporate environmental disclosure. Business Strategy and the Environment,17(2), 120-136.
Bruns, A.S (2017). The determinants of corporate social responsibility: empirical evidence from the Netherlands. University of Twente Business Administrations Track: Financial Management
Campbell, J. L. (2007). Why would corporations behave in socially responsible ways? An institutional
theory of corporate social responsibility. Academy of Management Review, 32(3), 946-967. Carrol, A.B. (1979) A Three-Dimensional Conceptual Model of Corporate Performance. The Academy
of Management Review, 4(4), 497-505. Chan, M. C., Watson, J., & Woodliff, D. (2014). Corporate governance quality and CSR disclosures.
Journal of Business Ethics, 125(1), 59-73. Cowen S .S., Ferreri LB., & Parker, L.D. (2007). The impact of corporate characteristics on social
responsibility reporting: A typology and frequency-based analysis. Accounting, Organisation of Social, 12(2), 111 - 122.
Da Silva Monteiro, S.M., & Aibar-Guzmán, B. (2009). Determinants of environmental disclosure in
the annual reports of large companies operating in Portugal. Corporate Social Responsibility and Environmental Management,17(4), 185-204.
Damodaran, A. (2002). Investment valuation (2nd ed.).New York: John Wiley & Sons, Inc. Davis, K. (1973). The case for and against business assumption of social responsibilities. Academy
of Management Journal, 16(2), 312-322. Deegan, C. (2002). Introduction: the legitimising effect of social and environmental disclosures-a
theoretical foundation. Accounting, Auditing & Accountability Journal, 15(3), 282-311. Dowling, J., & Pfeffer, J. (1975). Organizational legitimacy: Social values and organizational
behavior. Pacific Sociological Review, 122-136. Fiori, G., Di Donato, F., & Izzo, M. F.(2009). Corporate social responsibility and firms performance.
An analysis on Italian listed companies. Paper presented at the performance measurement association conference (PMA), 14 April-17April, Dunedin, New Zealand, available at: http://www.pma.otago.ac.nz/pmacd/papers/1034.pdf (accessed 22 October 2010).
Freeman, R. E. (1984). Strategic Management: A Stakeholder Approach. Boston, MA: Pitman. Frynas, J. G., & Stephens, S. (2015). Political corporate social responsibility: Reviewing theories and
setting new agendas. International Journal of Management Reviews, 17(4), 483-509.

249
Frynas, J. G., & Yamahaki, C. (2016). Corporate social responsibility: review and roadmap of
theoretical perspectives. Business Ethics: A European Review, 25(3), 258-285. Gaver, J., & Gaver, K. (1993). Additional evidence on the association between investment
opportunity set and corporate financing, dividend, and compensation policies. Journal of Accounting and Economics, 16 (1), 185–209.
Hackston D., & Milne, M.J. (2006). Some determinants of social and environmental reporting in New
Zealand companies. Accounting, Audit Accounting Journal, 9(1), 77-108. Haryono, U., & Iskandar, R. (2015). Corporate social performance and firm value. International
Journal of Business and Management Invention, 4 (11), 69-75. Marano, V., & Kostova, T. (2016). Unpacking the institutional complexity in adoption of CSR
practices in multinational enterprises. Journal of Management Studies, 53(1), 28-54. Margolis, J. D., & Walsh, J. P. (2003). Misery loves companies: Rethinking social initiatives by
business. Administrative Science Quarterly, 48(2), 268-305. Matten, D., & Moon, J. (2008). Implicit and explicit CSR: a conceptual framework for a comparative
understanding of corporate social responsibility. Academy of Management Review, 33(2), 404-424.
McWilliams, A., & Siegel, D. (2001). Corporate social responsibility: A theory of the firm perspective.
Academy of Management Review, 26(1), 117-127 Ng, E. J., & Koh, H. C. (1994). An agency theory and probit analytic approach to corporate non-
mandatory disclosure compliance. Asia-Pacific Journal of Accounting, 1(1), 29-44. Padgett, R. C., & Galan, J. I. (2010). The effect of R&D intensity on corporate social responsibility.
Journal of Business Ethics, 93(3), 407-418. Panwar, R., Paul, K., Nybakk, E., Hansen, E., & Thompson, D. (2014). The legitimacy of CSR actions
of publicly traded companies versus family-owned companies. Journal of Business Ethics, 125(3), 481-496.
Purushothaman, M. A. Y. A., Tower, G., Hancock, R., & Taplin, R. (2000). Determinants of corporate
social reporting practices of listed Singapore companies. Pacific Accounting Review, 12(2), 101-133.
Reverte, C. (2009). Determinants of corporate social responsibility disclosure ratings by Spanish
listed firms. Journal of Business Ethics, 88(2), 351-366. Tjia, O. & Setiawati, L.(2012). Effect of CSR disclosure to value of the firm: Study for banking
industry in Indonesia. World Journal of Social Sciences, 2(6) 169 – 178 World Business Council for Sustainable Development (1999).Corporate social responsibility: Meeting
changing expectations (World Business Council for Sustainable Development, Geneva).

250
Ownership Structure, Agency Cost and Corporate Financial
Performance in Nigeria
Ruth Osaretin Urhoghide (Ph.D) Department of Accounting, Benson Idahosa University
And
Ofe Ighiwiyisi Inua (Ph.D) Department of financial studies, National Open University of Nigeria
[email protected] _____________________________________________________________________________
ABSTRACT This study examined the impact of ownership structure and agency cost on financial performance in Nigeria. The study employed a longitudinal research design with the use of secondary data generated from annual reports. The sample for the study is sixty (60) non-financial firms selected from across the following non-financial sectors: Services, industrial, health care and consumer goods. For the period 2010-2016. Panel regression analysis using the generalized least square technique was used for the study. The results revealed that foreign ownership has no significant effect on financial performance; managerial ownership has a negative impact while institutional ownership has a positive impact on corporate financial performance. For Agency cost, the positive and significant coefficient of AUR and OPEX suggest agency conflicts have a significant effect on corporate financial performance. The finding suggests that in the context of rising agency cost, the financial performance is positively affected though this is at variance with theoretical expectation. The moderating regression results revealed that ownership structure can indeed mitigate agency cost resulting in improved financial performance. The study concluded that firms must make significant efforts at reducing agency cost and adopting an appropriate ownership mix that can be helpful in this regards while also ensuring enhancement in financial performance.
Key words:
Ownership structure, agency cost, corporate financial performance
1. INTRODUCTION
There are several variables that influence the corporate financial performance of corporate entities. These factors come in different forms either from within or outside the firm and in some cases may not necessarily be under the locus of the firm’s control. In this study, we focus on the role of two key factors; ownership structure, agency conflict and then the initeraction between both factors. Firms face two types of agency problems: vertical agency problems that exist between owners and managers (Jensen & Meckling, 1976), and horizontal agency problems that exist between controlling (majority) shareholders and minority owners (Gilson & Gordon, 2003). Two important problems arise from agency issues which constrain financial performance. First is the challenge of inefficient investment choices, which could include the redirection of resources for personal consumption, and second is the inefficient or insufficient effort being expended by managers. On the other hand, ownership structure of the firm is relatively varied across countries (Chen & Yu, 2012). Corporate ownership in most Nigerian firms like most developing economies are largely characterized as concentrated shareholding compared with the ownership structure in western countries (Claessens et al., 2002). Ownership structure in most cases in Nigerian often falls within a mix of managerial ownership, institutional ownership, foreign ownership and then government ownership. Whatever the mix, the concentration of ownership around any of them signals different perspectives on the implications for firm performance and this empirical evidence on this continues till date with varying findings across an eclectic range of researches. Studies (Ang, Cole, & Lin 2000; Nagar, Petroni, & Wolfenzon 2010) have also identified a moderating/interaction relationship between agency cost and ownership structure. Agency costs should vary inversely with the manager’s fractional ownership of the firm; and be highest among firms that are managed by managers without any

251
ownership stake suggest that large non-management owners can reduce agency costs because they have powerful incentives to monitor managers and this tends to improve financial performance of firms. Ang, Cole, and Lin (2000) find that the share of the firm held by the principal owner is negatively associated with the firm’s agency costs, while the number of shareholders is positively associated with agency costs. In the Nigerian environment, studies on the effect of ownership structure have received considerate attention. However, the role of agency conflict on firm performance has not received any significant attention. The history of agency issues have a long standing theoretically beginning from Jensen and Meckling (1987), however, the empirical testing of its effects on performance is lagging in most studies addressing the issue for Nigerian companies. As discussed earlier in the introductory section, Tirole (1986) underscores two important manifestations of agency costs: first, inefficient investment choices; and second, inefficient or insufficient effort expended by managers. In addition, the moderating role of agency cost on the effect of the various ownership derivatives has not been adequately examined to the best of the researcher’s knowledge and this study addresses these gaps.
1.2. Objective of the Study
The objectives of the study are specified below; i.. Examine the effect of ownership structure on corporate financial performance ii. Examine the effect of Agency cost on corporate financial performance
2. LITERATURE AND HYPOTHESIS DEVELOPMENT
2.1. Institutional Ownership and Firm performance
Pirzada, Mustapha and Wickramasmghe (2015) in a study examined the significant relationship amongst institutional stockholdings and firms’ performance as measured by Return on Asset, Return on Equity, Profit Earnings ratio, Earnings per share and Capital structure as measured by long term debt to capital of companies listed on the Main Board of Bursa Malaysia. The results from the study however showed that there is a significant relationship between the institutional stockholdings on the firms’ performance measured by Earnings Per Share and Profit Earning Ratio of firms listed on the main board of BURSA. Abbasazadeh, and Shadani (2013) carried out a study to analyze the relationship between active and passive institutional ownership variables and return on the firm's operating cash. Operational cash return on assets was used to measure performance. The sample consisted of 108 companies listed in Tehran Stock Exchange during the period of 6 years (2006 to 2011).. Overall, the results showed no relationship (either positive or negative) between the level of active and passive institutional ownership and return on the firm's operating cash. AL-Najjar (2015) carried out a study to examine whether institutional ownership affects the firm’s performance for one of the emerging markets; Jordan. Firm’s performance is measured through applying two accounting measures Return on Assets (ROA) and Return on Equity (ROE). The sample consisted of 82 non-financial Jordanian firms listed at Amman Stock Exchange (ASE) for the period of 2005-2013, by applying panel data regression analysis. from the result, there is no strong evidence that there is a relationship between both institutional ownership and firm performance for Jordanian listed firms. Masry (2016) in a study investigated the relationship between institutional ownership and company performance of listed companies in Egypt. The study used multiple regressions and a sample data of Eight years panel data of 73 Egyptian companies listed in the Egyptian Stock Market were examined. The results showed that institutional ownership had positive and significant relationship with firm performance. Mao (2015) carried out a study to examine the impacts of state ownership and institutional ownership on firm performance in China, using a large sample for the period of 2008 to 2014. The study performs the Ordinary Least Squares (OLS) regression to test the relationship between institutional ownership and firm performance. Findings from the study revealed that institutional

252
ownership is positively related to firm performance; the institutional investors have more incentives and financial competencies to monitor management therefore enhancing good firm performance. H1: Institutional Ownership has no significant impact on corporate financial
performance
2.2. Managerial Ownership and Firm performance
Abdolkani and Jalali (2013) in a study investigated the relationship between corporate governance and firm return and value which are two measures of firm performance. Their sample consisted of non-financial firms listed on Tehran Stock Exchange between 2007 and 2009. Their findings however indicated that managerial ownership concentration has a negative and significant relationship with firm's value. Hu and Zhou (2016) studied the managerial ownership-performance relationship by examining a unique sample of non-listed Chinese firms. A sample of 1,500 Chinese firms was drawn from five cities and all ten industries for the period of 1998-2000. Their results indicate a strong and robust positive effect of managerial ownership on company performance. Hayam (2014) in another study examined the effect of managerial ownership on the relationship between debt and firm performance. By employing a sample of Egyptian listed firms, the generalized least squares method, as a panel data technique, was used to examine the joint effect of debt and managerial ownership on various measures of firm performance (i.e., Tobin’s q and ROA). The results reveal that managerial ownership moderates the relationship between debt and firm performance, with the relationship being negative (positive) in presence (absence) of managerial ownership concentration. Gugong, Arugu and Dandago (2014) carries out a study that examines the impact of ownership structure on the financial performance of listed insurance firms in Nigeria. The study used panel data for seventeen (17) firms for the period 2001-2010. Findings from the study revealed that there is a positive significant relationship between managerial shareholding and firm performance as measured by ROA and ROE, as the probability value is less than 0.05. H2: Managerial Ownership has no significant impact on corporate financial
performance.
2.3. Foreign Ownership and Firm Performance
Ngánga’, Namusonye and Sakwa (2016) in a study investigated the impact of foreign ownership on firm’s financial performance of listed firms in Nairobi Securities Exchange in Kenya. The study employed correlation research and cross-sectional study designs. In accordance to Nairobi Stock Exchange (NSE) Handbook on profiles and performance of listed companies (2010-2014) 61 firms had compiled their financial reports for the relevant period of study and this made the dataset for the study. The study findings indicated a positive relationship between foreign ownership and financial performance. Bilyk (2009) carried out a study on the effects of foreign ownership on performance of Ukrainian manufacturing companies in 2002-2006. The datasets utilized for the study covered about 13,000 of Ukrainian companies of two types, open and closed joint stock companies.The univariate analysis provides some evidence on the differences in performance and operational efficiency of companies with different owners which may be due to foreign ownership. Ongore (2011) in another study examine the effects of ownership structure on performance of listed companies in Kenya using agency theory as an analytical framework. Using Pearson’s product moment correlation and logistic regression, the study found that foreign ownership have significant positive relationship with firm performance. H3: Foreign Ownership has no significant impact on corporate financial performance.
2.4. Agency Cost and Firm Performance
Nobane, Ellili and Abraham (2017) in a study examines the association between the equity concentration and agency costs as well as the impact of agency costs on performance of non-

253
financial firms listed on the Saudi Stock Exchange (Tadawul). These relations were examined by using dynamic panel data and a two-step robust system estimation for the period 2010–2013. The results show that the equity concentration has no significant impact on agency costs, and the agency costs have no significant impact on firms’ performance. Xiao (2015) carried out a study to examine the effects of the agency costs on firm value in 156 Chinese publicly listed companies with individual ultimate owners between 2002 and 2007. The ultimate owners’ agency costs, as measured by the divergence between control rights and cash flow rights, are shown to negatively and significantly affect firm value, as measured by the market-to-book ratio of assets (an approximation of Tobin’s Q). As the agency costs grow, the stock returns decrease around the connected party transaction announcements, and firms are more likely to engage in value-destroying connected party transactions. Khidmat and Rehman (2014) carried out a study on the impact of free cash flows and agency costs on firm performance in KSE listed companies of Pakistan. A sample of 123 companies listed on KSE representing eight different sectors has been analyzed to determine the association of free cash flows, agency costs and firm performance with each other. For the purpose of analysis, secondary data of selected companies for the period 2003–2009 were used. The study also shows a significantly negative impact of agency cost on firm performance with exception to total asset turnover (TATO) ratio which has a positive impact. Salim (2014) carried out a study on the relationship between agency costs and financial performance of firms listed at the Nairobi Securities Exchange. Descriptive study was applied; the target population was all the companies in the NSE that traded continuously within the period of 5years for the year 2008 to 2012. 52 companies were analyzed since the rest were suspended from trading at the NSE. The results of the study indicated that there is a positive relationship between agency costs and financial performance. H4: Agency cost has no significant impact on corporate financial performance.
3. METHODOLOGY
This study employed a longitudinal research design. The justification for the use of this design is that it affords the researcher the benefits to detect developments or changes in the variables of interest. The population of this study covers all non-financial companies listed on the Nigerian Stock Exchange as at the study period. The sample for the study is sixty(60) non-financial firms selected from across the following non-financial sectors: services, industrial, health care and consumer goods. The period covered is 2010-2016 and panel regression analysis using the generalized least square technique was used for the regression. The method of sampling was done using the simple random sampling technique. Secondary data was used for this study. The data was retrieved from corporate annual reports of the sampled companies for 2010-2016 financial years. The panel regression analysis method was used for estimating the models. Model Specification The model for this study examines the effect of ownership structure and agency cost on firm performance. The model is presented below; FPit = f(β1OWNSTit, AGCit )---------------------------------------------------------------------------- (1)
Specifying the models in their econometric form and including the error term, we have; FPit = βi + β1FOWNit + β2 IOWNit + β3MOWNit + β4 AURit + β2 OPEXit + µit -------------------- (2)
Where FP= Financial Performance measured as Profit after tax, FOWN= Foreign ownership measured as ratio of foreign ownership to total ownership, IOWN= Institutional ownership measured as ratio of institutional ownership to total ownership, MOWN= Managerial ownership measured as ratio of managerial ownership to total ownership, AUR= Asset utilization ratio used as proxy for agency cost, OPEX= Discretionary operating expense used as proxy for agency cost µI = error term i= firm i t= time period

254
4. PRESENTATION AND ANALYSIS OF RESULTS
Table 4.1: Descriptive statistics
Mean Median Max Min Std. Dev. J.B Prob
IOWN 44.92665 51 91 0 26.57681 30.27321 0.00
MOWN 11.89229 1.63 120.02 0 18.60055 990.6882 0.00
FOWN 29.29376 16 87.95 0 29.90071 49.66514 0.00
AUR 1.01747 0.89 5.43 0.01 0.691151 1348.193 0.00
OPEX 6910032 1612803 2.78E+08 60919 17702760 309562.2 0.00
PAT 2063901 260702 43080349 -1.79E+08 11166227 494072.3 0.00
Source: Researcher’s compilation (2017)
The descriptive statistics of the data is presented in table 1. As observed, the average managerial holding is about 11.89% with maximum and minimum values of 120.02% and 0% respectively with a standard deviation of 18.600. The average foreign holding is about 29.29% with maximum and minimum values of 87% and 0% respectively with a standard deviation of 29.9007. The average AUR is about 1.017 with a maximum value of 5.43 and minimum value of 0.01 respectively. The standard deviation showing the dispersion of the data about the mean is quite low at 0.69. The average OPEX is about 6910032mn with maximum and minimum values of 2.78e+08 and 60919 respectively with a standard deviation of 17702760. The mean value for PAT stood at 2063901 with maximum and minimum values of 43080349 and -1.79e+08 respectively. The Jacque-bera statistics for all the variables reveals that the series are normally distributed given that the J.B values are all less than 0.05. This implies the absence of significant outliers in the data.
Table 4.2: Pearson Correlation Matrix AUR OPEX PAT INOWC DOWN FOWC
AUR 1
DOEX 0.029 1
PAT 0.0908 -0.342 1
IOWC 0.2581 0.067 0.1647 1
MOWN -0.089 -0.166 -0.102 -0.331 1
FOWN 0.0745 0.1204 0.154 0.6535 -0.309 1
Source: Researcher’s compilation (2017) From table 4.2 above, the correlation coefficients of the variables are examined. However of particular interest to the study is the correlation between the PAT and the independent variables. As observed, a positive correlation exists between PAT and the following variables; AUR (r=0.098), OPEX (r=-0.342), IOWC(r= 0.1647), FOWN (r=0.154) and MOWN (r=-0.102).
Table 4.3: Multicollinearity Test
Variable VIF
C NA
IOWN 2.070027
MOWN 1.199036
FOWN 1.949846
AUR 1.157826
OPEX 2.730881
Source: Researcher’s compilation (2017)

255
The variance inflation factor (VIF) explains how much of the variance of a coefficient estimate of a regressor has been inflated, as a result of collinearity with the other regressors. Essentially, VIFs above 10 are seen as a cause of concern as observed, none of the variables have VIF’s values more than 10 and hence none gave serious indication of multicollinearity.
Table 4.4: Regression Result
Panel A Panel B C 12.7283*
(0.4276) {0.000}
-0.01278* (0.8981) {0.000}
MOWN
FOWN
-0.0071* (0.6851) {0.0143} 0.0062
(0.0044) {0.1590}
IOWN
OPEX
AUR
0.01325* (0.006)
{0.0310}
0.8980* (0.0116) {0.000} 0.3567
(0.0954) {0.000}
R2 0.970 0.9804
Adj R2 0.963 0.9761 F-Stat
P(f-stat) D.W
147.495 0.0000
1.8
227.33 0.0000 1.83
Hausman B-G for serial corr. 0.893 B-P-G for Hetero. 0.554 Ramsey Test 0.421
Source: Researcher’s compilation (2017) Table 4.4 shows the regression results of fixed effects (FE) models. To determine which model is better, this research conducted an F-test for the FE model, the Breusch-Pagan LM test for the RE model and the Hausman test for choosing the FE model versus the RE model. Specifically, the Hausman test statistic (Prob > Chi2 = 0.152) indicates that the FE method may give bias and inconsistent estimators when compared to RE model. As shown in the results, the R2 for the FE model is 0.970 which implies that the model explains about 97% of the systematic variations in the dependent variable. The F-stat is 147.495 (p-value = 0.00) is significant at 5% and suggest that the hypothesis of a significant linear relationship between the dependent and independent variables cannot be rejected. It is also indicative of the joint statistical significance of the model. The analysis of coefficients reveals that IOWN has a positive beta (0.01325) and significant (p=0.0310) at 5% and thus Institutional ownership is a significant factor influencing financial performance of companies. Hence we reject the null hypothesis (H1). The finding is in tandem with Pirzada, Mustapha and Wickramasmghe (2015), Mao (2015) Masry (2016) and Fung and Tsai (2012), though in contrast with Abbasazadeh and Shadani (2013) AL-Najjar (2015). MOWN has a negative beta (-0.0071) and significant (p=0.0143) at 5% and hence we reject the null hypothesis (H2). Agency theory (e.g., Jensen & Meckling, 1976) and signaling theory (Stiglitz, 1974) indicate a positive relation between the manager-owner’s share of the firm and the firm’s financial performance. However, authors such as Stulz (1988) and Morck, Shleifer and Vishny (1988) conclude that after a

256
point, the value of the firm declines because of the negative impact of management entrenchment on firm value. Other studies, however, argue that the positive relation between managerial ownership and firm performance predicted by agency and signaling theories may break down at high levels of ownership which enables managers to entrench themselves and protects managers from the discipline of the market for corporate control. These studies conclude that firm value is negatively related to managerial ownership as managerial ownership becomes too large. Our finding is in tandem with Abdolkani and Jalali (2013) and Hayam (2014) though in contrast with Hu and Zhou (2016) , Simoneti and Gregoric (2014), Gugong, Arugu and Dandago (2014). FOWN has a positive beta (0.0062) though not significant (p=0.1590) at 5% and thus Foreign ownership has no significant effect on financial performance and hence we accept the null hypothesis (H3).
In examining Agency cost as a variable in the determination of corporate financial performance and in line with prior studies, we employ the asset utilisation ratio (AUR) and the Discretionary and operating expense (OPEX) as proxies for agency conflict. The AUR has a positive beta (0.3567) and significant (p=0.000) at 5% while the OPEX has also has a positive beta (0.8980) and significant (p=0.1639). The positive and significant coefficient of AUR and OPEX suggests agency conflicts have a significant effect on corporate financial performance. The finding suggests that in the context of rising agency cost, the financial performance is positively affected though this is at variance with theoretical expectation. A similar outcome has been found by very recent studies such as Achjen and Chokri (2017), Salim (2014) and Gregory and Chang (2005). A probable reason for this is the measure of agency cost used. The of R&D ratio and operating income volatility may be better alternative measures for agency cost given that AUR and OPEX proxy variables appear to generate theoretically inconsistent results. Nevertheless, the null hypothesis (H4) is rejected. Table 4.5: Moderating Regression Result
Panel C Panel D Panel E C 12.7654*
(0.1748) {0.000}
13.559* (0.0352) {0.000}
11.7455 (0.3407) {0.000}
AUR*FOWN
OPEX*FOWN
OPEX*MOWN
0.0021* (0.0011) {0.0697} 0.0013* (0.000) {0.000}
0.00178 (0.0031) {0.000}
AUR* MOWN
AUR*IOWN
OPEX*IOWN
0.01507* (0.0021) {0.000}
0.0022** (0.0004) {0.000}
0.0036* (0.001) {0.000}
Model Parameters
R2 0. 968 0.8300 0.967 Adj R2 0.960 0.7948 0.960 F-Stat
P(f-stat) D.W
137.4134 0.000 1.74
23.5952 0.0000 1.97
134.705 0.000 1.9
Hausman 0.290 B-G for serial corr. 0.893 B-P-G for Hetero. 0.554
Ramsey Test 0.421 Source: Researchers compilation (2017), ( ) are standard errors; { } are p-values, * sig at 5%

257
In this analysis, we consider the moderating effect of ownership structure and agency cost on financial performance. Theoretically, ownership structure has been identified as been able to moderate agency conflicts and thus its effect on corporate financial performance. Studies (Ang, Cole, and Lin 2000; Nagar, Petroni, and Wolfenzon 2010) have also identified a moderating/interaction relationship between agency cost and ownership structure. Ang, Cole, and Lin (2000) find that the share of the firm held by the principal owner is negatively associated with the firm’s agency costs and hence resulting in positive financial performance while the number of shareholders is positively associated with agency costs. Nagar, Petroni, and Wolfenzon (2010) argue that agency costs of firms with diluted control are lower than those of firms with one controlling shareholder and other minority shareholders. In moderating regressions, a moderator variable specifies when or under what conditions a predictor variable influences a dependent variable (Baron & Kenny, 1986; Holmbeck, 1997). A moderator variable may reduce or enhance the direction of the relationship between a predictor variable and a dependent variable, or it may even change the direction of the relationship between the two variables from positive to negative or visa versa (Lindley &Walker, 1993). The moderating effect is typically expressed as an interaction between predictor and moderator variable (Aldwin, 1994; Baron & Kenny, 1986; Holmbeck, 1997).
Table 4.5 shows the moderating regression results. The interaction between foreign ownership and agency cost (AUR, OPEX) shown in panel C, has a positive (0.0021 and 0.0013) and significant impact @ 5% level on financial performance. This result is theoretically expected as we expect foreign institutional investors to be associated with improved investment efficiency since they help mitigate information asymmetry and agency problems. Using the monitoring channel, institutional investors are expected to implement strong corporate governance to safeguard their investments which will decline agency conflicts and thus improve firm performance. Extant research suggests that foreign investors play a more important role in improving firm-level governance (Ferreira & Matos, 2008; Aggarwal et al., 2011), which promotes investment efficiency. The interaction between managrial ownership and agency cost (AUR, OPEX) shown in panel D, has a positive (0.01570 and 0.00178) and significant impact @ 5% level on financial performance. The results are also theoretically expected because if the equity held in the firm is a high proportion of the manager’s total wealth, the manager-owner may expropriate a lower fraction of the firm’s value because expropriation may weaken important financial attributes of the firm and jeopardize a large portion of the manager-owner’s wealth. This effect has been found to reduce the creditor-owner agency conflict (Anderson, Mansi, & Reeb, 2003) and enhance financial performance. This finding is consistent with Ang, Cole, and Lin’s (2000) finding that agency costs decrease as the manager’s equity ownership in the firm increases and hence firm value is enhanced. The interaction between institutional ownership and agency cost (AUR, OPEX) shown in panel E, has a positive (0.0022 and 0.0036) and significant impact @ 5% level on financial performance. The results are also theoretically expected because institutions mitigate agency problems by improving corporate governance and financial transparency. An extensive literature on institutions suggests that they play a larger role than local investors in improving corporate governance around the world (e.g., Gillan & Starks, 2003; Ferreira & Matos, 2008; Aggarwal et al., 2011) the relation is even stronger and investment efficiency is stronger in firms operating in countries with weak country-level governance institutions, consistent with prior evidence that institutions play a more important role in countries with weaker institutions (Aggarwal et al., 2011).

258
5. CONCLUSION AND RECOMMENDATIONS
Ensuring favorable financial performance stands out as an important goal for management and shareholders alike. All activities of most corporate are more often than not geared towards how financial performance can be sustained and even improved. Management is continually on the edge as the exit doors of corporations stir them on the face when shareholders become intolerant of dismal financial performance. The focus of the study is to examine the impact of ownership structure and agency cost on financial performance. The analysis of results reveals that foreign ownership has no significant effect on financial performance, managerial ownership has a negative impact while institutional ownership has a positive impact on corporate financial performance. For Agency cost, the positive and significant coefficient of AUR and OPEX suggests agency conflicts have a significant effect on corporate financial performance. The finding suggests that in the context of rising agency cost, the financial performance is positively affected though this is at variance with theoretical expectation. The moderating regression results revealed that ownership structure can indeed mitigate agency cost resulting in improved financial performance. The study concludes that firms must make significant efforts at reducing agency cost and adopting an appropriate ownership mix can be helpful in this regards while also ensuring enhancement in financial performance.

259
REFERENCES
Abbasazadeh, M. R., Shoorvarzy, M. R., &Shadani, M. R. (2015). Institutional ownership, active and passive institutional ownership with return on the firm’s operating cash. Interdisciplinary Journal of Contemporary Research in Business, 5(7), 139-150.
Abdolkani, H., &Jalahi, R. (2013). Effect of managerial ownership concentrated on firm return and
value: Evidence from Iran stock market. International Journal of Academic Research in Accounting, Finance and Management Sciences, 3(11), 46-51.
Abdullah, F., Shah, A., & Khan, S. U. (2012). Firm performance and the nature of agency problems
in insiders-controlled firms: Evidence from Pakistan. Working Paper, Institute pf Management Sciences, Peshawar and Kohat University of Sciences and Technology.
Alfaraih, M., Alanezi, F., & Almujamed, H. (2012). The influence of institutional and government
ownership on firm performance: Evidence from Kuwait. International Business Research, 5(10), 192-200.
Al-Najjar, D. (2015). The effect of institutional ownership on firm performance: Evidence from
Jordanian listed firms. International Journal of Economics and Finance, 7(12), 97-105. Bilyk, O. (2009). Foreign ownership and firm performance: A closer look at offshore –owned
companies in Ukraine. Unpublished thesis submitted to Kyiv School of Economics. Chaganti, R., & Damanpour, F. (1991). Institutional ownership, capital structure, and firm
performance. Corporate Governance; 10(1), 176-190. Charfeddine, L., & Elmarzougui, A. (2011). Institutional ownership and firm performance: Evidence
from France. Research Gate, Retrieved from http://www.researchgate.net/publication/228293240.
Cornett, M. M., Marcus, A., Tehranian, H., & Saunders, A. (2007). The impact of institutional
ownership on corporate operating performance. Journal of Banking & Finance, 31(1), 1771-1794.
Davis, E. P. (2002). Institutional investors, corporate governance and the performance of the
corporate sector. Economic Systems, 26(1), 203–229 Ebrahimi, k., Moradi, M., &Hoda, S. (2010). The impact of institutional ownership on the
performance of listed companies in Tehran Stock Exchange. Journal of Accounting Research, 8(1).
Fauzi, F., & Locke, S. (2012). Board structure, ownership structure and firm performance: A case
study of New Zealand listed firms. Asian Academy Management Journal of Accounting and Finance, 8(2), 43-67.
Fazlzadeh, A., Hendi, A., & Mahboubi, K. (2011). The examination of the effect of ownership
structure on firm performance in listed firms of Tehran Stock Exchange based on the industry. International Journal of Business and Management, 6(3), 249-266.
Fung, S., & Tsai, S. C. (2012). Institutional ownership and corporate investment performance.
Canadian Journal of Administrative Sciences, 29(4), 348-365. Gugong, B. K., Arugu, L. O., &Dandago, K. (2014). The impact of ownership structure on the
financial performance of listed insurance firms in Nigeria. International Journal of Academic Research in Accounting Finance and Management Sciences, 4(1), 409-416.
Hayam, V. (2014). Capital structure, managerial ownership and firm performance: Evidences from
Egypt. Journal of Management and Governance, 18(4), 1041-1061. Hu, Y., & Zhou, X. (2016). Managerial ownership matters for firm performance: Evidence from
China. Working Paper, Hong Kong Institute of Economics and Business Strategy, School of Business and Economics, .University of Hong Kong.

260
Khidmat, W. B., &Rehman, M. U. (2014). The impact of free cash flows and agency costs on firm
performance: An empirical analysis of KSE listed companies of Pakistan. Journal of Financial Engineering, 1(3), 27-42.
Kumar, J. (2012). Agency theory and firm value. Indira Gamdhi Institute of Development Research. Mao, L. (2015). State ownership, institutional ownership and relationship with firm performance:
Evidence from Chinese Public listed firms. IBA Bachelor Thesis Conference, Enschede, The Netherlands.
Masry, M. (2016). The impact of institutional ownership on the performance of companies listed in
the Egyptian stock market. IOSR Journal of Economics and Finance, 7(1), 5-15. McConnell, J., &Servaes, H. (1990). Additional evidence on equity ownership and corporate value,
Journal of Financial Economics, 27(1), 595–612. Namazi, M., &Kermani, E. (2008). The impact of ownership structure on the performance of listed
companies in Tehran Stock Exchange. Accounting and Auditing Review, 53(1), 100-183. Ngánga’, P. N., Namusonge, G. S., & Sakwa, M. M. (2016). Effect of foreign ownership on financial
performance of listed firms in Nairobi securities exchange in Kenya. Journal of Business Management, 2(8), 27-45.
Nikbakht, M. R.,&Rahmani, J. (2010). The effect of institutional ownership on the performance of
listed companies on the Stock Exchange. Stock Exchange Quarterly, 9(1), 60-43. Nobane, H., Ellili, N. D., & Abraham, J. (2017). Equity concentration, agency costs and firm
performance of non-financial firms listed on the Saudi Stock Exchange. Sage Journals, 1 (1).
Ongore, V. O. (2011). The relationship between ownership structure and firm performance: An
empirical analysis of listed companies in Kenya. African Journal of Business Management, 5(8), 2120-2128.
Pirzada, K., & Mustapha, M. Z. B., & Wickramasinghe, D. (2015). Firm performance, institutional
ownership and capital structure: a case of Malaysia. Procedia-Social and Behavioral Sciences, 211(1), 170-176.
Salim, M. A. (2014). The relationship between agency costs and financial performance of firms
listed in Nairobi securities exchange. Unpublished thesis submitted to Department of Business Administration, University of Nairobi.
Simoneti, M., & Gregoric, A. (2014). Managerial ownership and corporate performance in Slovenian
post-privatisation period. The European Journal of Comparative Economics, 1(2), 211-241. Tsai, H., &Gu Z. (2007). The relationship between institutional ownership and casino firm
performance. Hospitality Management, 26(1), 517–530. Viet, P. H. (2012). Foreign ownership and performance of listed firms: Evidence from an emerging
economy. Review of International Economics, 9(4), 285-310. Xiao, S. (2009). How do agency costs affect firm value? Working Paper, Furman University,
Greenville, USA.

261
The Accountant and Economic Recession in Nigeria: Evidence from Bayelsa State
Cletus O. Akenbor (Ph.D)
Department of Accounting, Federal University, Otuoke, Bayelsa State, Nigeria
And
Loveday A. Nwanyanwu (Ph.D)
Department of Accountancy, Rivers State University, Port Harcourt, Nigeria _____________________________________________________________________________
ABSTRACT
The purpose of this study is to investigate the relationship between the accountant and economic recession in Nigeria. To achieve this purpose, a review of the extant literature was made and it was hypothesized that the accountant has no significant relationship with economic recession in Nigeria. The population of this study consisted of two thousand, three hundred (2300) trading businesses and individuals in government employment in Bayelsa State of Nigeria. The data for this study were generated through the administration of questionnaire designed in 5-point Likert scale. Findings indicate that Nigeria is still in economic recession and accountants are not effective in their role expectations. In addition, a significant relationship exists between the accountant and economic recession in Nigeria. As a result, effectiveness in accountant role expectations can lead the country out of recession. Accountants must therefore be more committed to their function with high levels of competence, integrity, transparency, and probity. Keywords: Accountant, Economic Recession, Nigeria.
INTRODUCTION Recession is not a new phenomenon. In the time of old, many countries and territories experienced recession or even depression. In the Bible, it is on record that Egypt was at a time in a recession as it is written in the Book of Genesis 41:47- 49 and 53-56: “During the seven years of abundance the land produced outstanding harvests. Joseph gathered all the excess food in the land of Egypt during the seven years and placed it in the cities. He placed the food on every city from the field around it. So Joseph stored up grain in such abundance like the sand of the sea that he stopped measuring it because it was beyond measure. Then the seven years of abundance in the land of Egypt came to an end and the seven years of famine began, just as Joseph said. There was famine in every country, but throughout the land of Egypt there was food. Extreme hunger came to all the land of Egypt, and the people cried out to Pharaoh for food. Pharaoh told all the Egyptians go to Joseph and do whatever he tells you. Because the famine has spread across the whole country, Joseph opened up all the storehouses and sold grain to the Egyptians, for the famine was severe in the land of Egypt”. There is no nation of the world that has not experienced economic recession but what is important is the ability to survive the economic stress. A substantial number of nations (Izzo, 2010) were in recession as early as 2009. The United States (US) experienced a recession at the end of 2007 and 2008 and others, such as China and Canada followed suit. The US recession of 2007 ended in June 2009 as the nation entered economic recovery. The United Kingdom was in recession in 2000. In the United Kingdom, economic recession is defined as a negative economic growth for two consecutive quarters (Shiskin, 1974). In other words, a recession is a state of the economy where production, trading, and consumption activities are temporarily at low ebb. According to Krugman (2009), the indicator of these low economic activities is a drop in real GDP, income, employment, manufacturing and retail sales or drop in consumption, investment, government spending and net export. During recession, macroeconomic indicators such as GDP, investment spending, capacity utilization, household income, business profits and inflation fall, while bankruptcies and unemployment rate rise.

262
The 2016 reports of the National Bureau of Statistics show that Nigeria is in economic recession. The Governor of Ogun State, Mr. Ibikunle Amosun and his Gombe State counterpart Ibrahim Dankwambo, and many others have tasked professional accountants, during ICAN’s 46th Conference held on the 10th - 14th October, 2016 at the International Conference Centre, Abuja to lead the country out of recession because they have what it takes to do so. This clarion call on the accountants to lead the country out of recession is the motivation for this study. The question therefore is, “can the accountant actually lead the country out of recession”? According to Perks (1993), an accountant is a practitioner of accounting or accountancy, which is the measurement, disclosure or provision of assurance about financial information that helps managers, investors, tax authorities and other stakeholders to make decisions about allocating resource(s). In today's increasingly competitive and uncertain business environment, organisations fighting for customers face a number of factors and issues which they may not be able to control and which affect performance; governments complain of little resources available for the provision of social benefits to the people. Professional accountants have a vital role to play in commercial success and good governance by using their increasingly valuable knowledge in a way which gives their organisations or clients a competitive advantage. In view of the above, any study that tends to establish a link between the accountant and economic recession in Nigeria is worthwhile. There appears to be dearth of prior empirical evidence in Nigeria on the relationship between the accountant and economic recession. A few available ones are foreign based and therefore lack local content. It is against this backdrop that this study is consummated to establish the relationship between the accountant and economic recession in Nigeria with the hypothesis that the accountant has no significant relationship with economic recession in Nigeria. LITERATURE REVIEW
What is Economic Recession?
Before we examine what an economic recession is, it is important that we explain the meaning of an economy because a recession is a state of an economy. An economy refers to all activities related to production, distribution or trade and consumption of goods and services by individuals, businesses and governments in a defined area (country). According to Samuelson (2010), there are different states of an economic-boom, recession, depression, and recovery. Boom is a period of significant output or growth in Gross Domestic Product (GDP) within a population. It is marked by productivity increases, wage increases and rising demand. Recession is a period of temporary economic decline during which trade and industrial activities are reduced, generally identified by a fall in GDP in at least two successive quarters or six months. Depression is a sustained, long-term downturn in economic activities. It is a state of the economy resulting from an extended period of negative economic activity. Recovery is a state of gradual restoration of economic activities after a period of recession and or depression. The National Bureau of Economic Research (2007) defined a recession as “a significant decline in economic activities spread across the economy and lasting for more than few months, visible through the wholesale-retail sales, industrial production, employment, real income and gross domestic product.” In general, the economic recession is defined by a long-lasting increase of unemployment, drop in the stock market, negative growth of GDP and decline of the housing market. In a nutshell, an economic recession is a period when a country is to have a retrospect of her activities and re-strategized. A recession is destructive. It creates wide-spread unemployment at a very high percent. That is when it affects most people. This is exactly the case we are experiencing presently in Nigeria where most workers particularly in the banking and oil sectors are being laid-off. As the unemployment rate rises, consumer purchases fall even more. Businesses go bankrupt. In many recessions, people lose their homes when they cannot afford their rent payments. Young people cannot get a good job after school. That throws off their entire career. Even if the recession is short, its impact can be long-lasting (Estrella & Mishkin, 1995). One good thing about a recession is that it cures inflation. The monetary authority of a state must always balance between slowing the economy enough

263
to prevent inflation without triggering a recession. Governments usually respond to recessions by adopting expansionary macroeconomic policies, such as increasing money supply, increasing government spending and decreasing taxation (Koo, 2009). Causes of Recession There are many events that are responsible for economic recession. Shiskin (1974) identified the following: High Interest Rate: The rate at which the surplus units lend to the deficit units could cause economic recession if the rate is too high. If the rate is too high, it limits liquidity or the amount of money available for investment. High Rate of Inflation: This refers to a general rise in the prices of goods and services over a period of time. As inflation increases, the percentage of goods and services that can be purchased with the same amount of money decreases. Reduced Consumer Confidence: Consumer confidence is the perception held by the consumer about the economic conditions of the state. Reduced consumer confidence is another factor that could cause a recession. If consumers believe that the economy is bad, they are less likely to spend money. The term “animal spirits” has been used to describe the psychological factors underlying economic activity. According to Shiller (2011), animal spirits refer to the sense of trust we have in each other, our sense of fairness in economic dealings and our sense of the extent of corruption and bad faith. When animal spirits are high, consumers do not want to spend and businesses do not want to make capital expenditures or hire people. Consumer confidence is psychological but can have a real impact on any economy. Reduced Real Wages: Real wages refer to the rewards for labour that have been adjusted for inflation. Falling real wages means that a worker's pay is not keeping up with inflation. The worker might be making the same amount of money, but his purchasing power has been reduced. Fall in Consumer Demand: Consumer demand is the consumer’s willingness and ability to purchase goods and or services offered to the market. A fall-off in consumer demand is normally the culprit behind slowing growth. As sales drop off, businesses stop expanding. Soon afterward, they stop hiring new workers. Imbalanced Relationship: According to Koo (2010), economist Richard C. Koo wrote that under ideal conditions, a country's economy should have the household sector as net savers and the corporate sector as net borrowers, with the government budget nearly balanced and net exports near zero. When these relationships become imbalanced, recession can develop within the country or create pressure for recession in another country. Paradoxes of Thrift: Behavior that may be optimal for an individual (e.g., saving more during adverse economic conditions) can be detrimental if too many individuals pursue the same behaviour, as ultimately one person's consumption is another person's income. Too many consumers attempting to save (or pay down debt) simultaneously is called the paradox of thrift and can cause or deepen a recession. Other events that may trigger a recession include financial crisis, an external trade shock, an adverse supply shock or the bursting of an economic bubble (Koo, 2009). High levels of indebtedness or the bursting of a real estate or financial asset price bubble can cause what is called a "balance sheet recession" as coined by Paul Krugman in 2010. This is when large numbers of consumers or corporations pay down debt (i.e., save) rather than spend or invest, which slows the economy. The term balance sheet derives from an accounting identity which holds that assets must equal the sum of liabilities and equity. If asset prices fall below the value of the debt incurred to purchase them, then the equity must be negative, meaning the consumer or corporation is insolvent. Economist Paul Krugman wrote in 2014 that "the best working hypothesis seems to be that the financial crisis was only one manifestation of a broader problem of excessive debt--that it was a so-called "balance sheet recession." In Krugman's view, such crises require debt reduction strategies combined with higher government spending to offset declines from the private sector as it pays down its debt (Krugman, 2014). For example, economist Richard Koo wrote that Japan's "Great Recession" that began in 1990 was a "balance sheet recession." It was triggered by a collapse in land and stock prices, which caused Japanese firms to have negative equity, meaning their assets were worth less than their liabilities. Despite zero interest rates and expansion of the money supply to encourage borrowing, Japanese

264
corporations in aggregate opted to pay down their debts from their own business earnings rather than borrow to invest as firms typically do. Corporate investment, a key demand component of GDP, fell enormously to 22% of GDP between 1990 and its peak decline in 2003 (Koo, 2009; Koo, 2010; White, 2010; Koo, 2011). According to the National Bureau of Statistics as reported by Temitayo (2017), Nigeria is in economic recession and causes of the recession include: government’s inability to save; over-dependence on foreign products; poor economic policies of government; the delay and controversies of the 2016 budget; the activities of militants and pipeline vandals as well as the activities of the Boko Haram insurgency. Another cause of economic recession in Nigeria as revealed in literature is the ban on essential agricultural products with no gestation period. The products, like tomatoes, rice, beans, and pepper were banned for import as Nigeria decided to fill the demand by itself. Nevertheless, additional removal of fuel subsidy and the banning of these products only sponsored the speculation in the stock market (Temitayo, 2017). The implementation of the Treasury Single Account (TSA) policy is yet another cause of recession in Nigeria. Akenbor (2017) posits that the idea of TSA was created by the Government to stop corruption and consolidate all funds of the Federal Government, but real results were devastating. The imminent withdrawal of deposits from banks did give them the ability to guarantee the loans programmes to the customers. Any bank lends parts of deposits to customers, but the balance of demands and depositors should be in the balance. Governments’ deposits were a reliable source of deposits for commercial banks, and their withdrawal was extreme damage to the banks. The degree or level of the following macroeconomic variables determines whether a country is in a recession or not.
Income: Staff (2012), defined income as money that an individual, business or government receives in exchange for providing a good or service or through investing capital. Income is consumed to fuel day-to-day expenditures. Most people receive the majority of their income from salaries or wages earned from a job. The flow of cash or cash-equivalents received from work (wage or salary), capital (interest or profit), or land (rent). It is the excess of revenue over expenses for an accounting period. It is also called earnings or an amount by which total assets increase in an accounting period. Income is the consumption and savings opportunity gained by an entity within a specified time frame, which is generally expressed in monetary terms. However, for households and individuals, "income is the sum of all the wages, salaries, profits, interest payments, rents, and other forms of earnings received in a given period of time (Barr, 2004). Income and not the GDP is the engine that drives an economy because only it can create demand.
Unemployment: Unemployment is a phenomenon that occurs when a person who is actively searching for employment is unable to find work. Unemployment is often used as a measure of the health of the economy (Anyadike-Danes & Godley 1989).
Unemployment as defined by the Bureau of Labor Statistics (BLS) and cited by Amadeo (2017) refers to people who do not have a job, have actively looked for work in the past four weeks and are currently available for work. Also, people who were temporarily laid off and were waiting to be called back to that job are included in the unemployment statistics. The unemployment rate is a measure of the prevalence of unemployment and it is calculated as a percentage by dividing the number of unemployed individuals by all individuals currently in the labour force. During periods of recession, an economy usually experiences a relatively high unemployment rate. According to International Labour Organization (ILO) report, more than 200 million people globally or 6% of the world's workforce were without a job in 2012 (Global Employment Trends, 2013). There remains considerable theoretical debate regarding the causes, consequences and solutions for unemployment. Classical economics, new classical economics and the Austrian School of Economics argue that market mechanisms are reliable means of resolving unemployment. These theories argue

265
against interventions imposed on the labour market from the outside such as unionization, bureaucratic work rules, minimum wage laws, taxes and other regulations that, they claim, discourage the hiring of workers. John Maynard Keynes, believed that the root cause of unemployment is the desire of investors to receive more money rather than produce more products, which is not possible without public bodies producing new money (Amadeo, 2017). The unemployment rate is expressed as a percentage of unemployed workers and total labour force of a country.
Production: Production is the creation of goods and services in order to satisfy the needs of individuals, businesses and governments. For production to take place, certain resources are required such as land, labour, capital and entrepreneur. Resources are the inputs used in the production process to produce output—that is, finished goods and services (Parkin & Gerardo, 1999). According to O’ Sullivan & Sheffrin (2003), there are two types of factors: primary and secondary. The primary factors facilitate production but neither become part of the production nor become significantly transformed by the production process. The primary factors include land, labour, capital and entrepreneur. Land is a fixed but free gift of nature required for production. It includes not only the site of production but natural resources above or below the earth surface such as water, forest, mineral resources, etc. Its reward is rent. Labour is the physical and mental efforts of man directed to production. Its reward is wages and salaries. Capital is the wealth reserved for the production of further wealth. It is the financial resources needed to carry out production. Its reward is interest. Entrepreneur is the managerial skills needed to co-ordinate other factors and put them into effective use for the realisation of organisational goal. Its reward is profit. The secondary factors form part of the production and are significantly transformed by the production process. Examples are materials and machines. Materials are considered secondary factors because they are obtained from land, while machines, equipment and tools are man-made. Recent usage has distinguished human capital (the stock of knowledge in the labour force) from labour (Samuelson & William, 2004). Sometimes the overall state of technology is described as a factor of production (O’ Sullivan & Sheffrin, 2003). In a production process, a decision must be made by the entrepreneur as to what to produce, how to produce, when to produce, where to produce and for whom to produce (Akenbor, 2017). Trading: The term trading simply means exchanging one item for another. It involves the buying and selling of goods and services, with compensation paid by a buyer to a seller, or the exchange of goods or services between parties. The most common medium of exchange for these transactions is money. Samuelson (1939) claimed that trade exists due to the specialization and division of labour, in which most people concentrate on a small aspect of production, but use that output in trades for other products and needs. Trade exists between regions because different regions may have a comparative advantage (perceived or real) in the production of some trade-able commodity—including production of natural resources scarce or limited elsewhere, or because different regions' sizes may encourage mass production. As such, trade at market prices between locations can benefit both locations. Retail trade (Parkin and Gerardo, 1999) consists of the sale of goods or merchandise from a very fixed location, such as a department store, boutique or kiosk, online or by mail, in small or individual lots for direct consumption or use by the purchaser. Wholesale trade is defined as the sale of goods that are sold as merchandise to retailers, or industrial, commercial, institutional, or other professional business users, or to other wholesalers and related subordinated services. Dollar and Kraay (2004), assert that international trade is the exchange of goods and services across national borders. In most countries, it represents a significant part of GDP. While international trade has been present throughout much of history, its economic, social, and political importance have increased in recent centuries, mainly because of industrialization, advanced transportation, globalisation, multinational corporations and outsourcing. In financial markets, trading refers to the buying and selling of securities, such as the purchase of stock on the floor of the Nigerian Stock Exchange (NSE). It is the same principle with trading of goods and services.

266
Consumption: The process in which the substance of a thing is completely destroyed, used up, or incorporated or transformed into something else is called consumption. It is the use of a product or service until it has no remaining value. Consumption of goods and services is the amount of them used in a particular time period. Consumption is typically defined as final purchases by an individual that are not investments of some sort (Deaton, 1992). In other words when you buy food, clothes, flight or bus tickets, a car, insurance, have your hair cut, etc., that is consumption.
Most purchases are viewed as consumption or investment. If someone buys a house to live in, that should be defined as consumption. But if he buys a house to rent it out to someone else, that should be defined as an investment. Similarly, if one buys a car to drive, that is consumption. But if he buys a car to use as a taxi for a business, that could be construed as an investment. In short, the reason for the purchase determines whether it is viewed as an investment or as consumption. According to Samuelson & William (2004) the total consumer spending in an economy is generally calculated using the consumption function, a metric devised by John Maynard Keynes, which simply expresses consumption as a function of the aggregate disposable income. This metric essentially defines consumption as the part of disposable income that does not go into saving. The consumption function is a mathematical function that expresses consumer spending in terms of its determinants, such as income and accumulated wealth. The Keynesian consumption function is also known as the absolute income hypothesis, as it only bases consumption on current income and ignores potential future income (or lack of). Criticism of this assumption led to the development of Milton Friedman's permanent income hypothesis and Franco Modigliani's life cycle hypothesis. More recent theoretical approaches are based on behavioural economics and suggest that a number of behavioural principles can be taken as microeconomic foundations for a behaviourally-based aggregate consumption function (Mackay, 1997).
Investment: According to Watson (2005), investment is the purchase of goods that are not consumed today but are used in the future to create wealth. In finance, an investment is a monetary asset purchased with the idea that the asset will provide income in the future or will be sold at a higher price for a profit. It is the act of committing money or capital to an endeavour with the expectation of obtaining an additional income or profit.
To invest is to allocate money (or sometimes another resource, such as time) in the expectation of some benefit in the future. In finance, the benefit from investment is called a return. The return may consist of capital gain or investment income, including dividends, interest, rental income etc., or a combination of the two. The projected economic return is the appropriately discounted value of the future returns. The historic return comprises the actual capital gain (or loss) or income (or both) over a period of time (Robert & Vittorio, 1994). Investment generally results in acquiring an asset. If the asset is available at a price worth investing, it is normally expected either to generate income, or to appreciate in value, so that it can be sold at a higher price (or both). Investment may be real assets investment or financial assets investment. Real assets investment is the investment in physical assets, such as properties while financial assets investment is the investment in securities (Mackay, 1997). Graham & Dodd (2002), claimed that investors generally expect higher returns from riskier investments. Financial assets range from low-risk, low-return investments, such as high-grade government bonds, to those with higher risk and higher expected commensurate reward, such as emerging markets stock investments. Investors are often advised to adopt an investment strategy and diversify their portfolio. Diversification has the statistical effect of reducing overall risk. Government Spending: Government spending or expenditure includes all government consumption, investment, and transfer payments. According to Bishop (2012), in national income accounting the acquisition of goods and services by governments for current use, to directly satisfy the individual or collective needs of the community, is classed as government final consumption expenditure. Government acquisition of goods and services intended to create future benefits, such as infrastructure investment or research spending, is classed as government investment (government gross capital formation). These two types of government spending on final

267
consumption and on gross capital formation, together constitute one of the major components of gross domestic product. Lequiller & Blades (2006) posit that government spending can be financed by government borrowing, taxes, and other sources of revenue. A change in government spending is a major component of fiscal policy used to stabilize the macroeconomic business cycle. For fiscal policy, increases in government spending are expansionary, while decreases are contractionary. John Maynard Keynes was one of the first economists to advocate government deficit spending (increased government spending financed by borrowing) as part of the fiscal policy response to an economic contraction. According to Keynesian economics, increased government spending, raises aggregate demand and increases consumption, which leads to increased production and faster recovery from recessions. Classical economists, on the other hand, believe that increased government spending exacerbates an economic contraction by shifting resources from the private sector, which they consider productive, to the public sector, which they consider unproductive. According to Robert & Vittorio (1994) government spending can take different forms: final consumption expenditure, gross capital formation, and transfer payments. Final consumption expenditure is government acquisition of goods and services for current use to directly satisfy individual or collective needs of the members of the community is called government final consumption expenditure (GFCE.) It is a purchase from the national accounts "use of income account" for goods and services directly satisfying of individual needs (individual consumption) or collective needs of members of the community (collective consumption). GFCE consists of the value of the goods and services produced by the government itself other than own-account capital formation and sales and of purchases by the government of goods and services produced by market producers that are supplied to households – without any transformation – as "social transfers" in kind (Lequiller & Blades, 2006). Government acquisition intended to create future benefits, such as infrastructure investment or research spending, is called gross fixed capital formation, or government investment, which usually is the largest part of the government (Robert & Vittorio, 1994). Acquisition of goods and services is made through production by the government (using the government's labour force, fixed assets and purchased goods and services for intermediate consumption) or through purchases of goods and services from market producers. In economic theory or in macroeconomics, investment is the amount purchased per unit of time of goods which are not consumed but are to be used for future production (i.e. capital). Examples include railroad or factory construction. Gross fixed capital formation in infrastructure spending is considered government investment because it will usually save money in the long run, and thereby reduce the net present value of government liabilities (Case & Fair, 2007). Government expenditures that are not acquisition of goods and services, and which represent transfers of money such as social security payments, are called transfer payments. They are payments made without any good or service being received in return. These payments are considered to be exhaustive because they do not directly absorb resources or create output. In other words, transfers are made without an exchange of goods or services (Bishop, 2012). Examples of transfer payments include financial aid, social security, pension and government subsidies and incentives. Private-sector transfers include charitable donations and prizes to lottery winners (Bishop, 2012). According to the 2014 Index of Economic Freedom by the Heritage Foundation and the Wall Street Journal, government spending in Nigeria stood at 29 percent of Gross Domestic Product (GDP). The Accountant
An accountant is a qualified person who is trained in bookkeeping and in preparation, auditing and analysis of accounts. He prepares annual reports and financial statements for planning and decision making and advise on tax laws and investment opportunities. According to Perks (1993), an accountant is a practitioner of accounting or accountancy, which is the measurement, disclosure or provision of assurance about financial information that helps managers, investors, tax authorities

268
and others make decisions about allocating resource(s). In a nutshell an accountant is a practitioner of accountancy. There are different categories of accountants. Accountants in large firms generally fall into three categories (Perks, 1993). Financial accountants manage, update, correct, and report the firm's accounts to parties
outside the firm. The financial accountant, therefore, is literally "keeper of the accounts," hence the name of the profession.
Management accountants provide accounting information to those within the firm. Management accountants typically participate in budgeting, forecasting and analysis of financial problems.
Internal auditors monitor the firm's internal controls and check for fraud, waste and financial mismanagement.
Government accountants, these are accountant in public sector organizations. They do exactly what financial accountants and management accountants in private sector do.
External auditors are independent accounting consultants working either for themselves or an independent accounting firm. External auditors are outside consultants, hired by private and public organizations to review their accounting practices and accounting reports. External auditors issue formal opinions on whether or not a firm's accounting practices and financial reports conform to Generally Accepted Accounting Principles (GAAP).
Government auditors are public sector employees who review and monitor agencies and other government organizations. Government auditors also monitor private businesses that are subject to government regulation. In addition, they also monitor private firms that are subject to government regulation (e.g., banks) and taxation (almost all private businesses).
According to Marty (2017), in many jurisdictions, professional accounting bodies maintain standards of practice and evaluations for professionals. Accountants who have demonstrated competency through their professional associations' certification examinations are certified to use titles such as Chartered Accountant, Chartered Certified Accountant, certified accountant or Certified Public Accountant. Such professionals are granted certain responsibilities by statute, such as the ability to certify an organization's financial statements, and may be held liable for professional misconduct. Non-qualified accountants may be employed by a qualified accountant, or may work independently without statutory privileges and obligations. Perks (1993) maintains that an accountant performs financial functions related to the collection, accuracy, recording, analysis and presentation of a business, organization or government's financial operations. The accountant usually has a variety of administrative roles within an organization's operations. In small organizations, an accountant's role may consist of primarily financial data collection, entry and report generation. Middle to larger sized organisations may utilize an accountant as an adviser and financial interpreter, who may present the company's financial data to people within and outside of the organization. Generally, the accountant can also deal with third parties, such as vendors, customers and financial institutions. Specifically, the roles of an accountant such that individuals, businesses, and governments can survive the period of economic recession include the following:
Increased Accountability: Accountability refers to transparency and integrity in the discharge of an accountant job. Accountant is the eyes and ears of the organization, be it business or government. He is expected to be more transparent and show integrity in the discharge of his job particularly during recession. The Governor of Ogun State, Mr. Ibikunle Amosu and his Gombe State counterpart Ibrahim Dankwambo, have tasked professional accountants, during ICAN’s 46th Conference held on the 10th
- 14th October, 2016 at the international conference centre, Abuja to lead the country out of recession because they have what it takes to do so. Transparency in accounting records can unveil any form of fraudulent acts penetrated by employees, management and or third parties, which have mounted financial stress on the organization.

269
Ethical Responsibility: Professional accountants have an obligation to the public, their profession, the organization they serve and themselves to maintain the highest standards of ethical conduct. They must be professionally competent, confidential in their reports and records, and objective in disclosing any relevant information. Recession is the period when these ethical conducts of the accountant must not be compromised (Adekanlola, 2010).
According to Vickers (2016), there are two major strategies available to a professional accountant in achieving profitability objective of an organization and promoting good governance in public sector. These are revenue maximization and cost minimization. Cost minimization appears to be the commonly used strategy by accountants. Therefore during economic recession, the accountant must cut costs to reduce the financial stress on the organization. The cost minimization strategies may include: Constant Review of Expenses: The accountant is expected to implement best practices for tracking and managing operational costs, and quickly eliminate non-essential expenses. Implementing best practices for human resources is crucial. For example, for many organizations compensation and benefits are typically the largest expense items on the income statement. During a recession, the accountant is expected to advise management to keep compensation and benefits flat, and postpone salary increases until business improves. But for the accountant in public sector, recession is the time to advise the government to increase money supply and increase spending through workers salary increment. He is expected to compile a list of actions that could save the organization money. Okoye (2015) suggest that management should consider hiring part-time instead of full-time employees, establish alternative communication methods to eliminate unnecessary meetings that consume valuable executive time and review travel policies to eliminate non-essential travel expenses by taking advantage of free web conferencing whenever possible. Use technology to make operation more efficient.
Effective Working Capital Management: The accountant must carefully measure the amount of liquid assets the organization can generate and how much it needs. Again, best practices for accounting are essential so that management is always aware of the organization’s cash position and can take advantage of any opportunity to expand and improve operations. In recession, organizations have to become more aggressive in collecting receivables, including calling significant customers before payment is due to ensure there are no delays in payment, and using collection agents in collecting outstanding receivables after detailed examination of cost benefit analysis (Oluwaseyi, 2017). Businesses have been taught to pay off debt as quickly as possible so as to minimize the interest amount, but under recession, this is not advisable. Once you pay off your line of credit or credit card, you may quickly find the bank closes your account and makes the credit unavailable. Aggressive Tax Planning: Taxes constitute a major cost of doing business. Tax planning is the act of identifying loop-holes in tax laws and taking advantage of them to reduce the tax liability of a business. The accountant is expected to display strategic tax behavior during recession. He must constantly review the tax laws to the advantage of the organization. Tax administrators are also expected to advise the government to reduce tax rate for businesses during recession in order to provide safe landing for businesses, thereby preventing bankruptcies (Okoye, 2015).
Budgeting and Forecasting. The accountants are to implement best practices in preparing and managing the budget, and for forecasting future revenues. During economic boom, accountants easily lose focus on the need for accurate and predictable budgeting. Similarly, forecasting revenue during recession becomes increasingly difficult as sales cycles lengthen and workforce reductions are often necessitated. Accounting operations must be streamlined and focused, and best practices need to be put in place so that senior management can make sure the business has enough cash on hand while avoiding operational surprises (Vicker, 2016). Strategic Investment Behaviour: Recession is a period to plow excess cash back into the business to drive growth. An economic downturn can be a great time to invest in sales and

270
marketing, but only if one is confident of the cash flows. Investing in capturing greater market share over time is a shrewd move during a recession — because most of the competitors cannot afford to do so. As difficult as a recession can be, they typically last from six-to-eighteen months. Things will indeed get better; it is only a matter of when the economy will improve. An investment in building distribution channel during a recession will prepare the business and government to capitalize on the inevitable economic recovery (Hensaw & Bennet, 2015). Pricing Analysis and Decisions: The period of recession is usually not a good time to increase the price of products and service, so understanding the organization cost structure is essential to drive down costs and optimize profits. If the cost analysis shows that the current price is not enough to cover costs and provide a reasonable profit, the organization have to find ways to be more efficient rather than increasing prices. Through customer relationship, the organization can understand the pains the customers are facing, and the organization should only consider raising prices during a recession if it is certain the organization is operationally efficient and have built strong relationships with customers who can understand and accept the reasons for the price increase. More so, discounting pricing during recession is capable of putting the organization at a severe disadvantage to the competition when the economy turns, because organization will have trouble getting the price back to where it should be and profit margins will suffer (Oluwaseyi, 2017). Methodology
The population of the study consists of one thousand two hundred (1200) selected trading businesses and one thousand one hundred (1100) individuals in government employment, resident in Yenagoa, the capital of Bayelsa State. On the whole, two thousand three hundred (2300) respondents were considered for this study. The instrument for data collection in this study is the questionnaire, which was designed in 5-point Likert scale of strongly agree (5), agree (4), indifferent (3), disagree (2), and strongly disagree (1). Role expectations were used as constructs for the accountant and a number of variables were used as measures for economic recession as indicated in the questionnaire. Prior to its administration, the questionnaire was tested for validity and reliability, and the result was quite satisfactory. The statistical methods of data analysis adopted in this study are both descriptive and inferential. While the descriptive statistics (mean) was used in ascertaining the strengths of the accountant considering its dimensions, the inferential statistics (ordinary least squares - OLS regression) was used in testing the stated hypothesis. These were computed with the aid of the Statistical Package for Social Science Research (SPSS) version 22. Model Specifications and Estimation
Economic recession is measured by income, employment, production, trading, consumption, investment, and government spending while the dimensions used for the accountant are his role expectations, which include increased accountability, ethical responsibility, constant review of expenses, aggressive tax planning, working capital management, budgeting and forecasting, strategic investment behaviour, and pricing analysis and decisions. As recommended by Phillip & Hodgson (1994), in order to eliminate the presence of heteroscedasticity and abnormal distribution of data in the regression model, a logarithm transformation of the variables was conducted and the regression model is designed as shown below: LogECR= f[∝olog+β1LogACC+β2logER+β3logCRE+β4LogATP+β5logWCM+β6logBAF+β7logSIB+β8logPAD +-µi] Where: ECR = Economic Recession; ACC = Accountability; ER = Ethical Responsibility; CRE = Constant Review of Expenses; ATP = Aggressive Tax Planning; WCM = Working Capital Management; BAF = Budgeting and Forecasting; SIB = Strategic Investment Behaviour; PAD = Pricing Analysis and Decisions; ∝ = Regression Constant; β1-β8 = Regression Co-efficient; Log = Logarithm Transformation; µI = Error Term.

271
The model is based on the assumption that effectiveness in the accountant role expectations will bring the economy out of recession. Empirical Analysis
Although two thousand three hundred (2300) copies of the questionnaire were administered, we could not retrieved two hundred and thirteen (213) copies. This however represents about 90.74% response rate, which is highly satisfactory. The respondents were asked to indicate their degree of agreement with measures of economic recession and their responses are presented in Table 1.0 below. Table 1.0: Degree of agreement with measures of economic recession
S/N Economic Recession SA
(5)
A(4) I(3) D(2) SD(1) Total Mean
1. Income level and per capita income of the people of Bayelsa is low
180 (900)
910 (3640)
15 (15)
890 (1780)
92 (92)
2087 (6427)
3.07
2. Job creation and the rate of employment in the State is not encouraging
500 (2500)
1034 (4136)
0 (0)
866 (1732)
313 (313)
2087 (8681)
4.16
3. Production activity is at low ebb in the State
960 (4800)
210 (840)
0 (0)
617 (1234)
300 (300)
2087 (7174)
3.44
4. There is a drastic drop in trading activity and distribution of goods and services in the State
823 (4115)
360 (1440)
0 (0)
600 (1200)
304 (304)
2087 (7059)
3.38
5. The rate of consumption of goods and services in the State is on the decline
149 (745)
880 (3520)
6 (18)
952 (1904)
100 (100)
2087 (6287)
3.00
6. Physical assets investment and the rate of investment in the capital markets in the State has reduced
750 (3750)
418 (1672)
3 (9)
400 (800)
516 (516)
2087 (6747)
3.23
7. Government spending on final consumption, gross capital formation, and transfer payments in the State is not commendable
621 (3105)
1002 (4008)
9 (27)
714 (1428)
259 (259)
2087 (8827)
4.23
Average Total 3.50
Source: Field Work (2017) Note: The figures in bracket are weighted frequencies. As shown in Table 1.0 above, the mean score of the various measures of economic recession, which is above the average of 3.0 on a 5 point Likert scale indicates that the level of income is low; job creation and the rate of employment in the State is not encouraging; production activity is at low ebb; there is a drastic drop in trading activity and distribution of goods and services; physical assets investment and the rate of investment in the capital markets has reduced; and government spending on final consumption, gross capital formation, and transfer payments is not commendable. However, we could not establish a clear-cut position on whether the rate of consumption of goods and services is on the decline because the mean score obtained on this measure of economic recession (3.0) is equal to the average of 3.0 on a five- point Likert scale. In summary, since the average total of the measures of economic recession (3.50) is greater than the average of 3.0 on a five point Likert scale, it is concluded that there is economic recession in Nigeria.
The respondents were asked to indicate their degree of agreement with the accountant role expectations and their responses are presented in Table 2.0 below.

272
Table 2.0: Degree of agreement with the accountant role expectations
S/N The Accountant SA
(5)
A(4) I(3) D(2) SD(1) Total Mean
1. Accountants have increased accountability to unveil fraudulent acts perpetrated by employees, management, government officials and politicians during this period of recession
310 (1550)
19 (76)
0 (0)
1018 (2036)
740 (740)
2087 (4402)
2.11
2. Ethical responsibility of the accountant has greatly increased during this recession period
162 (810)
99 (396)
18 (54)
1008 (2016)
800 (800)
2087 (4076)
1.95
3. Accountants constantly review expenses and eliminate non-essential costs during this period of recession
38 (190)
412 (1648)
2 (6)
1280 (2560)
355 (355)
2087 (4759)
2.28
4. Accountants carefully measure the amount of liquid assets available to the organization for effective working capital management in time of recession
200 (1000)
904 (3616)
0 (0)
948 (1896)
35 (35)
2087 (6547)
3.14
5. Accountants engagement in aggressive tax planning for the organization’s benefits is quite encouraging in this period of recession
218 (1090)
944 (3776)
2 (6)
890 (1780)
33 (33)
2087 (6685)
3.20
6. Budgeting and forecasting of costs and revenues have become a routine activity of the accountant during recession period
150 (750)
910 (3640)
10 (30)
1000 (2000)
23 (23)
2087 (6443)
3.09
7. Accountants demonstrate strategic investment behavior and advise managers and government to take advantage of profitable investment opportunities in recession period
418 (2090)
155 (620)
0 (0)
1000 (2000)
514 (514)
2087 (5224)
2.50
8. Accountants usually analyze products and services prices thereby optimizing profits and achieving efficiency in the period of recession
45 (225)
300 (1200)
14 (42)
810 (1620)
918 (918)
2087 (4005)
1.92
Average Total 2.52
Source: Field Work (2017) Note: The figures in bracket are weighted frequencies. As shown in Table 2.0 above, the mean score of the various dimensions of the accountant, which is below the average of 3.0 on a 5 point Likert scale indicate that there is no increased accountability by the accountants to unveil fraudulent acts perpetrated by employees, management, government officials and politicians during this period of recession; ethical responsibility of the accountant has not greatly increased during this recession period; there is no constant review of expenses by the accountants so as to eliminate non-essential costs during this period of recession; accountants are not demonstrating strategic investment behavior and advise managers and government to take advantage of profitable investment opportunities in period of recession; and accountants are not

273
analysing products and services prices to optimize profits and achieve efficiency in this time of recession. Further analysis however shows that accountants carefully measure the amount of liquid assets available to the organization for effective working capital management in period of recession; accountants engagement in aggressive tax planning for the organization’s benefits is quite encouraging in this period of recession; and budgeting and forecasting of costs and revenues has become a routine activity of the accountant in this recession period, since the mean score of theses dimensions are above the average of 3.0 on a 5 point Likert scale. In summary, since the average total on the accountant role expectations (2.52) is less than the average of 3.0 on a five point Likert scale, the accountants’ role expectations in this economic recession in said to below. In testing the stated hypothesis in this study, data generated on economic recession were regressed with data on the accountant’s role expectations, and the result obtained is presented in Table 3.0 below. Table 3.0: Relationship between the accountant and economic recession in Nigeria Model
Unstandardized Coefficients Standardized coefficient
t
Sig. B Std. Error Beta
1 (constant) ACC ER CRE ATP WCM BAF SIB PAD
-3.146 0.724 1.215 0.050 0.389 0.335 2.516 2.304 2.010
0.634 0.083 0.454 0.062 0.074 0.073 0.632 0.612 1.023
0.611 0.546 0.054 0.368 0.347 0.291 0.279 0.101
3.859 8.743 2.088 0.801 5.252 4.607 1.901 1.932 1.965
0.000 0.000 0.025 0.424 0.000 0.000 0.050 0.051 0.051
a. Dependent Variable: ECR As shown in Table 3, a significant relationship exists between economic recession (ECR) and accountant role expectations of increased accountability (ACC), ethical responsibility (ER), aggressive tax planning (ATP), effective working capital management (WCM) and budgeting and forecasting (BAF). However no significant relationship seems to exist between economic recession (ECR) and accountant role expectations of constant review of expenses (CRE), strategic investment behaviour (SIB) and price analysis and decisions (PAD). In assessing the holistic impact of the accountant on economic recession, a multiple regression analysis was conducted, and the result obtained is presented in Table 4.0 below.
Table 4.0: Multiple Regression Analysis
Model R R SQUARE ADJUSTED R SQUARE
F Sig.
1 .811 .658 .639 74.643 .000 Source; SPSS Version 22 Window Output Table 3.0 above shows a multiple correlation coefficient of 0.811, which is high. This suggests that there is a strong relationship between the accountant and economic recession in Bayelsa State of Nigeria. The multiple co-efficient of determination (R2) of 0.658, indicates that about 65.8% of the change in economic recession is attributed to the effectiveness of the accountant role expectations. In other words, only about 34.2% change in economic recession is due to other variables other than the accountant role expectations; hence the model is a good fit and nicely fitted. The p-value (0.000), which is less than 0.05 level of significance, and the f-ratio of 74.643, suggest a significant

274
relationship. This implies that accountant has a significant relationship with economic recession in Nigeria. Having estimated the model and computed the coefficients, as presented in Table 3.0 above, the resultant model is as shown below: ECR = f (-3.146 + 0.611ACC + 0.546ER + 0.054CRE + 0.368ATP + 0.347WCM +
0.291BAF + 0.279 + 0.101)
The model implies that at a given level of accountant’s role expectations, economic recession will decline, since the regression constant in the model is negative.
Discussion of Findings
The results of our analysis have shown that the accountant has a significant relationship with economic recession in Nigeria. The accountant role expectations of increased accountability, ethical responsibility, aggressive tax planning, effective working capital management, and budgeting and forecasting have a significant impact on economic recession. But other role expectations such as constant review of expenses, strategic investment behavior, and price analysis and decisions equally have a relationship with economic recession though insignificant. These findings are in consonance with the findings of Adekanlola (2010) and Vicker (2016) who concluded in their separate works that increased accountability and other role expectations are anti-weapon of economic recession. More so, this research work agrees with the comments of the Ogun State Governor and his Gombe State counterparts that accountants can lead the country out of recession. Conclusion and Recommendations
Recession is a temporary downturn in economic activity. During recession, there is a drop in production, distribution, and consumption of goods and services by individuals, businesses and governments. For the past few months, the Nigerian economy has been in a recession. Many individuals and households find it difficult to afford one square meal a day. Business activities are on the decline. Most businesses cannot afford the purchase of raw materials for production, neither are they able to maintain their payroll. State governments are unable to pay salaries and settle overhead expenses. Even the Federal Government is struggling with the payment of salaries. When an economy is at recession, almost everything falls apart and survival by individuals, businesses, and government becomes difficult. However, if the accountant becomes more effective in his role expectations, economic recession will be a thing of the past. Considering the findings of this study, and the conclusion drawn wherefrom, the following recommendations are made to keep the economy out of recession: (i) individuals, businesses and governments must reduce the rate of consumption. Part of what would have been consumed has to be saved and invested (ii) accountants must become more committed to their work with high level of competency and professionalism (iii) accountants must be adequately compensated for their work by their employers so as to mitigate the possibility of fraudulent practices (iv) accountants must as a matter of fact report without delay any form of unwholesome and sharp practices that may result to financial stress in the organizations or MDAs and (v) there should be tight internal control system and other internal audit functions to promote accountability, transparency, integrity, and probity.

275
REFERENCES
Adekanlola, J.A. (2010). Accounting for economic planning and national development. International Journal of Development Studies, 4(6); 322-331.
Akenbor, C.O. (2017). Sustainability under economic recession: The Accountant Perspective.
Paper Presented during the 4th Annual General Meeting of the Association of National Accountants of Nigeria (ANAN) Bayelsa State, Held on the 10th of June, 2017 at ANAN House, Yenegoa.
Amadeo, K. (2017). What is the definition of unemployment? Not everyone who is jobless is
unemployed. https://www.thebalance.com/what-is-unemployment. Retrieved on 10 January,2017.
Anyadike-Danes, M; Godley, W. (1989). Real wages and employment: A skeptical view of
some recent empirical work. The Manchester School. 62 (2): 172–187. Barr, N. (2004). Problems and definition of measurement. In Economics of the welfare state.
New York: Oxford University Press. Bishop, M. (2012). Economics AZ– terms beginning with T;transfer. The Economist. 11 July. Case, K. & Fair, R. (2007). Principles of Economics. Upper Saddle River, NJ: Pearson Education. Deaton, A. (1992). Understanding Consumption. Oxford University Press. Dollar, D; & Kraay, A (2004). Trade, Growth, and Poverty. The Economic Journal. 114 (493) Estrella, A. & Mishkin, F.S (1995). Predicting U.S. recessions: Financial Variables as Leading
Indicators. MIT Press. Fuchs, D. & Lorek, S. (2005). Sustainable consumption governance: A History of Promises and
Failures. Journal of Consumer Policy, 28; 261–288.
Global Employment Trends (2013) . International Labour Organization. 21 January 2013. Graham, B.; & Dodd, D. (2002). Security Analysis: London, McGraw-Hill Education. Henshaw, S. & Benneth, A. R.(2010). Accountant in private sector. Asia, John Wiley and Sons. Izzo, P. (2010). Recession is over in June 2009. The Wall Street Journal, January 12. Koo, R. (2009). The holy grail of macroeconomics: Lessons from Japan's Great Recession.
John Wiley & Sons (Asia) Pte. Ltd Koo, R. (2010). The world in balance sheet recession. Real World Economics Review, Issue 56,
December, 46-51. Koo, R. (2011). The world in balance sheet recession: causes, cure, and politics". Real- World
Economics Review, Issue 58;19–37. Konczal, M.(2012). How mortgage debt is holding back the economy. Roosevelt Institute, July
3. Krugman, Paul (2009). The return of depression economics and the crisis of 2008. W.W. Norton
Company Limited. Krugman, P. (2014). Does he pass the test? New York Times, July 10. Lequiller, F. & Blades, D. (2006). Understanding National Accounts, Paris: OECD 2006; 127–
30

276
Lorek, S. & Fuchs, D. (2013). Strong sustainable consumption governance. precondition for a Degrowth Path? Journal of Cleaner Production. 38; 36–43.
Lowell Center for Sustainable Production (1990). The world economy bad or worse. Economist.com. Retrieved on 18th May, 2016.
Mackay,J.(1997). What the accountant do. http://www.business-casen analysis.com/accountant. Retreived on 5th February, 2017.
Mackay, H. (1997). Consumption and everyday life (culture, media and identities series)
(Paperback). Thousand Oaks, Calif: SAGE Publications. Marty, S. (2017). Accountant and accounting. https://www.business-case-analysis.com/accountant.
Retrieved on 11th March, 2017.
National Bureau of Economic Research (2007). Business cycle expansions and contractions. http//www.chron.com. Retrieved 19 November 2016.
Norwegian Ministry of the Environment (1994) Oslo roundtable on sustainable production
and consumption.
Okoye, E. E. (2015). Accountant for the future. New York, Mcraw Hill.
Oluwaseyi, A.(2017). The role of accountant in national development. http//www.infoguidenigeria.com. Retrieved on 13th January 2017.
Oluwole, B.C (2014) Treasury single account: How it will be. www.business.com; Retrived on 15th September 2015.
O'Sullivan, A. & Sheffrin, S. M. (2003). Economics: Principles in Action. Upper Saddle River, New Jersey 07458: Pearson Prentice Hall.
Perks, R.W.(1993). Accounting and society. Chapman & Hall; London.
Parkin, M. & Gerardo, E. (1999). Macroeconomia in Spanish. Mexico; Addison Wesley. Robert B. & Vittorio G. (1994), European macroeconomics, Ch. 15–16. Macmillan. Samuelson, R.J. (2010). Our economy of confidence. The Washington Post, January, 2016.
Samuelson, P.A & William, D. (2004). Economics: Factors of production, capital, human capital, and land" under glossary of terms, New York, McGraw Hill.
Samuelson, P (1939). The gains from international trade. The Canadian Journal of Economics and
Political Science. 5 (2): 195–205. Schulte, C. (1999). Logistik. München: Verlag Vahlen; 371–414. Shiller, R. J. (2009). Animal spirit depends on trust. The Wall Street Journal, January 27. Shiskin, J. (1974). The changing business cycle. New York Times; 222.
Staff, R. (2012). Factor income. BusinessDictionary.com. WebFinance, Inc. Retrieved 20 June 2012. Temitayo, O. (2017). Causes of recession in Nigeria. http//www.nigeriamonitor.com. Retrieved on
10 April, 2017.
Vicker, A.M. (2016). Why accounting is even more important during recession. Journal of Pattern Recognition Research, 3 (1); 91-100.
Watson, J. (2005). Introduction to investment. http://www.investorwords.com. Retrieved on 10th March, 2017.
White, G. (2010). Presentation by Richard Koo: The Age of Balance Sheet Recessions.
Businessinsider.com. Retrieved 29 January 2017. Young, W. (2010). Sustainable consumption: Green Consumer Behaviour when Purchasing
Products. Sustainable Development, (18); 20–31.

277
Company Characteristics and Non-Financial Disclosures in Nigeria
Bilikis Modupeola Bello Department of Accounting, Benson Idahosa University
And
Ruth Osaretin Urhoghide. (Ph.D) Department of Accounting, Benson Idahosa University
[email protected] ______________________________________________________________________
ABSTRACT
This study examined the effect of company characteristics on non-financial disclosures in Nigeria. Unlike in prior studies where corporate social and environmental (CSER) dominated the sphere of non-financial disclosures. This study addressed these limitations by incorporating more comprehensive and composite basis for evaluating corporate non-financial disclosures. The longitudinal research design was adopted in this study and a sample of sixty five (65) companies quoted in the floor of the Nigerian Stock Exchange and that have fulfilled their obligation of preparing annual reports covering 2009-2015 was used for the study. Secondary data retrieved from the annual report and accounts was also used for the analysis. The method of data analysis employed in this study is the Ordinary Least Squares (OLS) Regression. Overall, company characteristics exert some significant influence on non-financial disclosures, specifically, firm size, financial performance and industry of operation all turned out to be very significant factors in influencing the extent of non-financial disclosures in Nigeria. The study recommended that companies should adopt a more robust reporting model that focuses considerable attention in the disclosure of to non-financial information.
Key words:
Firm size, Profitability, Industry of operation, Non-financial disclosures
1.0. INTRODUCTION
The need for companies to disclose non-financial information to improve the information environment of the firm and reduce information asymmetry is growing. In the last decade, several perspectives have been brought forward, as to how companies can improve the reporting model and top most in these perspectives, is the need for more detailed disclosures of non-financial information that enhances the stakeholders understanding of the environment of the entity. There are several dimensions relating to non-financial information that is of dire interest to stakeholders. Non-financial information covers issues of managerial effectiveness and efficiency, (Street & Shaughnessey, 1998). In the academic literature, a variety of terms have been used in order to define non-financial disclosure and these include: social and environmental, corporate social responsibility, sustainability and ethical triple-bottom-line. These seemingly overlapping terms tend to reflect the expanded accountability efforts of the firm which is generally voluntary in principle but geared largely towards its stakeholders and the society as a whole. According to Eccles, Krzus, and Serafeim (2011), there is now the preponderance of Environmental, Social and Governance (ESG) information/scores which are now garnering attention in both corporate and academic circles. However, the authors argues that in developed environments such as in the United States, at the aggregate market level, interest in Environmental and Governance information is greater than interest in Social information. Higher interest in environmental data relative to social data could be attributed to the fact that environmental implications are easier to quantify and integrate into valuation models compared to social data. A long and significant stream of literature and research findings on the implications of governance for firm performance and riskiness (Becht, Bolton, & Roell, 2003) could be the cause of the higher interest in governance data (Eccles et al, 2013). The changing needs of shareholders have enhanced the importance of non-financial information disclosure. However, for most developing countries especially those with few multinational

278
companies that integrate reporting model of the parent firm, the focus on non-financial disclosures is less comprehensive and structured and it has not assumed a significant part of investors decision making model. However, non-financial disclosures still appear to be voluntary. This suggests that companies have the absolute discretion in the decision to report. Thus aside from the nature of the reporting environment, their own internal structure variables such as firm characteristics are very instrumental to their disposition towards non-financial disclosures. The focus of the study therefore is to examine the effects of company characteristics on non-financial disclosure in corporate reports in Nigeria.
1.2. The Objective of the Study
The objective of the study is to investigate the effect of firm-level characteristics on the extent of non-financial disclosure in corporate reports.
2.0 LITERATURE REVIEW AND HYPOTHESES
2.1 Non- Financial Disclosures
Though no framework for non-financial reporting has risen to the level of International Financial Reporting Standards (IFRS), an increasing number of companies have been experimenting with more robust disclosure of non-financial information. Non-financial disclosure has been defined as a valuable legitimation instrument which can mitigate social concerns and with a mediating effect in convincing societal members (i.e. stakeholders) that the organization is fulfilling their expectations (Uwalomwa & Ben-Caleb, 2012). Recent evidence shows that companies tend to utilize non-financial disclosure and to actively engage in such communication channels in order to reduce or prevent accountability deficits and/ or potential legitimacy ‘gaps’ (Mia & Al Mamun, 2011). Non-financial disclosure is considered as the primary importance of disclosure. For the purpose of this research, non-financial disclosure is understood as the non-financial information through annual reports over and above the mandatory requirements, either with regard to the Nigerian company laws, professional accounting standards or any other relevant regulatory requirements.
2.2. Company Characteristics and Non-Financial Disclosure
2.2.1 Firm Size and non-financial disclosures
In the corporate disclosure literature, firm size is one of the main corporate characteristics that have been found to affect a firm’s extent of disclosure (Eng & Mak, 2003). Generally, large firms disclose more information than small ones because of their characteristics such as lower information production costs, higher complexity in business operation, wider ownership base, greater liability to agency costs, and more susceptibility to political costs. The information economics literature also suggests that firm size has an impact on the information set available to outsiders. Large firms tend to be more diversified, more complex, and have larger information set than small firms in terms of their market development, sales sustainability, and business risks (Cheng & Shiu, 2007). Firm size often helps in explaining disclosure behaviour. As larger firms are likely to face higher public demands for information (Waluyo 2017). Larger firms are able to incur more costs for information production and distribution. Hence, larger firms are likely to be more informative and pay more attention to improving the quality of this disclosure compared to smaller firms because of their financial resources that enable them expand the disclosure. Larger firms may have the ability to afford the costs resulting from competitive harms that can result from the expansion of the disclosure compared to smaller firms (Nasir & Abdullah, 2004). According to political costs theory, the expansion of disclosure is a means of reducing political focus (Helbok & Wagner, 2006). Larger firms may also be more susceptible to the increased problems relating to information asymmetry and agency costs compared to smaller ones. This may justify its moving towards providing more information about the quality of risk in an attempt to alleviate these problems (Oorschot, 2009). A recent study by Waluyo (2017) examined the effect of firm size on non-financial disclosures in the annual report of the company. The study used 30 companies from property and real estate sector. All the companies are listed in Indonesia Stock Exchange in the period 2012 - 2016. The researcher used multiple linear regression analysis. The result shows that firm size, have significant effects on non-financial disclosures. Similarly, Bani-Khalid, Kouhy and Hassan (2017) examined how corporate characteristics could influence the amount of Corporate

279
Social and Environmental Disclosure (CSED) in the manufacturing sector in Jordan. The results indicated that the firm size is significantly associated with the amount of CSED. Consequently, the hypothesis is stated as follows: H1: Firm Size has a significant effect on non-financial disclosures.
2.2.2 Firm Profitability Level More profitable firms may expand the disclosure and provide high quality information for the public to acquire a positive impression about their performance (Wang, Sewen & Claiborne 2008). According to the Signaling Theory, more profitable firms may have a motivation to differentiate itself from less profitable, and thus are likely to adopt a good disclosure policy for risks earlier than less profitable firms (Helbok & Wagner, 2006) in order to provide a signal to stakeholders that increases their confidence in the business. Also the most profitable firms may have sufficient resources available to invest in systems to assess and manage such risks, which support its orientation towards a high quality risk disclosure policy. (Neri, 2010). According to political costs theory, it is expected that the most profitable firms are interested in improving the quality of disclosure of risks to reduce the political costs they may face. (Oorschot, 2009). On the contrary, some authors believe that the management of firms with poor performance may face a pressure to disclose extensive and comprehensive disclosure of the risks. This stems from the need for disclosure about performance engines and risks. The expanded disclosure may reflect enhancement of the management understanding of the value creation process at the firm level. (Neri, 2010, Horing & Grundl, 2011). Even so, the empirical results varied regarding the relationship between the profitability of the business and the quality of non-financial disclosure in general. Francis, Nanda and Olsson (2007) conclude that there is a significant positive correlation between the quality of disclosure, and the performance of the business. A positive relation between social disclosure policy and profitability was hypothesised in prior research (Ismail & Chandler, 2005). Ismail & Chandler, (2005) argue that the underlying cause of a positive relation between social disclosure policy and profitability is management’s knowledge. They argue that managers that have the knowledge to make their companies profitable also have the knowledge and understanding of social responsibility. This might explain the higher levels of CSR disclosure by profitable companies. Horing & Grundl, (2011) argue that managers of profitable companies are more likely to provide more voluntary non-financial disclosure in the annual reports to support their own; their continuation of their current positions and to boost the levels of current and future compensation. Al-Tuwaijri, Christensen and Hughes. (2004) also found a positive association between environmental performance and environmental disclosure. On the other hand, Tufail, Kamran, Ahmad and Anwar (2017) examine importance of non-financial disclosure especially those relating to corporate social disclosures in Pakistan. In data collection procedure, annual reports of the one hundred and thirty eight firms of consumer products industries and forty eight Plantation companies listed in Pakistan were used. The results revealed that there is an insignificant relationship between firm profitability calculated by ROA and CSR disclosure level. The finding is also similar to that of Wuttichindanon (2017) which was conducted for firms listed on the Stock Exchange of Thailand (SET). The results revealed that economic performance was not related to the CSR disclosure. In the same vein Bani-Khalid, Kouhy and Hassan (2017) examined how corporate characteristics could influence the amount of Corporate Social and Environmental Disclosure (CSED) in the manufacturing sector in Jordan. The results indicated that the firm profitability are not related to the practices of CSED. Consequently, the hypothesis is stated as follows: H2: Profitability has a significant effect on non-financial disclosures.
2.2.3 Industry Type and non-financial disclosures.
Companies in different types of industry may face different degrees of costs and competition pressure which may lead to different degrees of disclosure demand by users of information. Also, companies which operate in different industries are expected to experience different kinds of risks and exposures and subject to special regulations (Hassan, 2009). The business models influence significantly the risk profile of companies. The association between risk disclosure and industry type can be explained by political costs. Linsley and Shrives (2000) state that companies’ directors may

280
be disclosing information in order to reduce the chance of more detailed and more costly requirements being introduced by law, accounting standards or stock exchange requirements. Therefore, it is indicated that there is a positive association between political costs and risk disclosure In the grounds of signalling theory, Lopes and Rodrigues (2007) argue that signalling theory provides a line for non-financial disclosure and industry type association, in the sense that companies in the same industry are interested in having the same level of disclosure in order to avoid negative appreciation by the market. Hassan (2009) states that corporations may adopt certain or unnecessary disclosure practices in order to signal to stakeholders that they are adopting state-of-the-art disclosure practices similar to other corporations in the same industry which may lead to variation in disclosure in accordance with the industry type. Dyduch and Krasodomska (2017) examined whether a number of elements influence the levels of non-financial disclosures with respect to corporate social responsibility (CSR) in the annual reports of Polish companies using a tobit regression analysis on a sample of 60 reports from Polish companies listed on the Warsaw Stock Exchange. The results show that industry has a significant influence on CSR disclosures. This is also similar to that of Hassan (2009) using a sample of 41 UAE listed companies. The results show that there is a positive and significant association between risk disclosure and Industry type (financial and non-financial). Consequently, the hypothesis is stated as follows: H3: Industry of operation has a significant effect on non-financial disclosures.
3. METHODOLOGY
The longitudinal research design was adopted in this study and this is because the study involves studying several entities repeatedly over time. Based on the practical challenges involved in assessing the population resulting from several factors, a sample of sixty five (65) companies quoted in the floor of the Nigerian stock exchange and that have fulfilled their obligation of preparing annual reports covering 2009-2015 was used for the study. In selecting the sample, it is important that a sample selection technique is adopted that is able to provide an objective and unbiased basis for selection. For the purpose of this study, the simple random sampling was employed. Secondary data retrieved from the annual report and accounts was used for the analysis. In this study, the researcher used descriptive statistical methods which include numerical techniques such as the means, standard deviation, range, frequency distribution. These tools aid in the summarization of the data. The method of data analysis that was employed in this study is the Ordinary Least Squares (OLS) Regression.
3.1 Model Specification
The model for this study examined the effect of company characteristics on non-financial disclosure. The model for the study is thus presented below: TNFDit= ∂1 + ∂2 FSIZE it + ∂3 PATit + ∂3 INDUS it + µit --------------- (1) Where; TNFDISC= Total Non- financial disclosures, FSIZE= Firm size PAT= Profit after tax IND = Industry of operation ut = Stochastic term. i = number of sampled cross-sectional firms, t = time period of the sampled companies.

281
3.2 Description and Measure of Variables
Table 3.2: Gives the description and measurement of the variables used in this
study
Variable Description Measurement Source Aprori expectation
TNFD Total Non-financial disclosures.
TNFD score is measured as the total of forward looking and historical non-financial information. A value of 1 is assigned if firms disclose forward looking or back disclosure in areas such as risk, strategy and management, forecast, Social/environmental information and operating environment and 0 if otherwise.
Robb, Single & Zarzeskic (2001)
FSIZE Firm size Log of total assets Eng and Mak, (2003).
+
PAT Profitability Profit after tax Oorschot, (2009,)
+
IND Industry type Dummy value of “1” for financial and “0” for non-financial
Thinggaard and Kiertzner, (2008)
+
Source: Researchers Compilation (2017)
4. DATA PRESENTATION AND ANALYSIS
Table 4.1: Descriptive Statistics
TNFDISC FSIZE IND PAT
Mean 9.5923 139960. 0.46 5221.9
Median 10 9685.5 0 449
Maximum 16 21103 1 54286
Minimum 6 75 0 -11254
Std. Dev. 2.2789 109289 0.49 31375.
JB 54.941 196748 65.0 84180
Prob 0 0 0 0
Obs 390 390 390 390
Source: Researchers Compilation (2017) Where: TNFDISC= Total Non-financial disclosure score FSIZE= Firm size IND= Industry type PAT= Profit after tax Table 4.1 shows the descriptive statistics for the variables. As observed, the average TNFDISC score is about 9.59 with a standard deviation (STD) of 2.278 which indicates the extent to which TNFDISC for the distribution exhibits considerable clustering around the average. For Company characteristics, we observed that for FSIZE, Mean= 139960.0, STD=0.109289, Max= 211033 and Min = 75. For IND, Mean= 0.465 and STD=0.4992 and for PAT, the Mean= 5221.9, STD=31375, Max=542868 and Min = -11.254.

282
Table 4.2: Pearson Correlation Result
TNFDISC FSIZE IND PAT
TDISC 1
FSIZE 0.0201 1
IND 0.0076 0.012 1
PAT -0.0164 0.888 0.0193 1 Source: Researchers Compilation (2017) From Table 4.2 above, the correlation coefficients of the variables are examined. However of particular interest to the study are the correlation between the dependent variables (TNFDISC,) and the explanatory variables. As observed the correlation between company characteristics and TNFDISC reveals that FSIZE and IND appear to be positively correlated as depicted by the correlation coefficients 0.020 and 0.008 respectively while PAT is negatively correlated (r=-0.016). The Inter-correlations between the explanatory variables do not seem to indicate the presence of multicollineraity threats.
Table 4.3: Regression Result
C 9.349 {0.086} (0.000)
FSIZE 5.397 {1.6507} (0.001)
PAT 2.5105 {5.6906} (0.000)
IND 0.649 {0.179} (0.000)
R2 0.453 Adjusted R2 0.339
D.W 1.91 Mean of Dep. Var 11.177 S.E of Regression 1.967
F-stat P(F-stat) Hetero
Serial corr. Ramsey Reset
3.981 (0.00) 0.201 0.343 0.115
Source: Researchers Compilation (2017) {} are standard errors, ( ) are p-values. Table 4.3 shows the regression result conducted to examine the effect of company characteristics on disclosure of non-financial information. The set of explanatory variables are regressed on Total non-financial disclosure (TNFDICL). The Hausman test statistics suggest the preference of the fixed effects estimations and this was utilized in conducting the estimations. Examining the effect of company characteristics on TNFDISCL, the R2 shows a value of 0.453 which indicates that the model explains about 45.3% of the systematic variations TNFDISCL with adjusted value of 33.9% after controlling or degrees of freedom. The F-stat is 3.981 (p-value = 0.00) which is significant at 5% and suggest that the hypothesis of a significant linear relationship between the dependent and independent variables cannot be rejected. It is also indicative of the joint statistical significance of the model. The D. W statistics of 1.91 indicates the presence of serial correlation in the residuals is unlikely. Commenting on the performance of the company characteristics variables, we observe that FSIZE is positive (5.397) and significant (p=0.001) impact on the extent of non-financial disclosures, PAT has a positive (2.5106) and significant effect (p=0.000) and IND also has a positive (0.649) and
283
significant (p=0.000) impact on the extent of non-financial disclosures. The ARCH test for heteroskedasticity was performed on the residuals as a precaution. The results showed probabilities in excess of 0.05, which leads us to reject the presence of heteroskedasticity in the residuals. The Lagrange Multiplier (LM) test for higher order autocorrelation reveals that the hypotheses of zero autocorrelation in the residuals were not rejected. This was because the probabilities (Prob. F, Prob. Chi-Square) were greater than 0.05. The LM test did not therefore reveal serial correlation problems for the model. The performance of the Ramsey RESET test showed high probability values that were greater than 0.05, meaning that there was no significant evidence of miss-specification.
4.3. DISCUSSION OF RESULT Examining the effect of company characteristics on TNFDISCL, we observe that FSIZE has a positive (5.3907) and significant (p=0.001) effect on the extent of non-financial disclosures. Hence we accept the hypothesis (H1) that firm size has a significant effect on non-financial disclosures. In the corporate disclosure literature, firm size is one of the main corporate characteristics that have been found to affect a firm’s extent of disclosure (Eng & Mak, 2003). Generally, large firms disclose more information than small ones because of their characteristics such as lower information production costs, higher complexity in business operation, wider ownership base, greater liability to agency costs, and more susceptibility to political costs (Jensen & Meckling, 1976; Watts & Zimmerman, 1986). The finding is in tandem with Cheng & Shiu, (2007) Ahmed & Courtis, (1999), Nasir & Abdullah, 2004, Oorschot, (2009) and Helbok & Wagner, (2006). Profitability is positive (2.5106) and significant (p=0.000). Hence we accept the hypothesis (H2) that profitability has a significant effect on non-financial disclosures. More profitable firms may expand the disclosure and provide high quality information for the public to acquire a positive impression about their performance (Wang, Sewen & Claiborne 2008). According to the Signaling Theory, more profitable firms may have a motivation to differentiate itself from less profitable, and thus are likely to adopt a good disclosure policy for risks earlier than less profitable firms (Helbok & Wagner, 2006). The finding is in tandem with Neri, (2010), Oorschot, (2009), Francis, Nanda and Olsson (2007), Al-Tuwaijri, Christensen and Hughes. (2004) Eng and Mak (2003), Meek, Roberts, and Gray, (1995), Rajan and Zingales, (1995), Cheng and Shiu, (2007) have all found evidence confirming that firm size is one of the main corporate characteristics that have been found to affect a firm’s extent of disclosure. However, studies such as Berger and Gleibner (2006), Brammer and Pavelin, (2008) and Garcıa-Ayuso and Larrinaga, (2003) found contrary results regarding the influence of profitability. Berger and Gleibner (2006) in their study did not support the significant correlation between the quality of the disclosure of the risks, and the profitability of the business. In the same direction, Oorschot (2009) found that there is a positive relationship, but not significant between the level of profitability and the risk disclosure quality. Finally, Industry of operation has a positive (0.649) and significant (p=0.000) effect on non-financial disclosure. Hence we accept the hypothesis (H3) that industry of operation has a significant effect on non-financial disclosures. Companies in different types of industry may face different degrees of costs and competition pressure which may lead to different degrees of disclosure demand by users of information. Also, companies which operate in different industries are expected to experience different kinds of risks and exposures and subject to special regulations (Hassan, 2009). The finding is in tandem with Lopes and Rodrigues (2007), Hassan (2009), Verrecchia, (2009).
5. CONCLUSION AND RECOMMENDATION
Company characteristics appear to be a significant driver of non-financial disclosures in annual reports. This suggest that corporates are often involved in a cost-benefit analysis relating to how disclosures will either aid or jeopardize their corporate concerns. The significance effect of company characteristics is expected especially when the choice to reports appears to be discretionary. The study revealed that company characteristics have a significant influence on the extent of non-financial disclosure in corporate reports in Nigeria. The study recommends that rather than leave this area of corporate reporting to firms discretion, some level of regulation or minimum reporting bench mark can be introduced.

284
REFERENCES
Ahmed, K. & Courtis, J. (1999). Associations between corporate characteristics and disclosure levels in annual reports: A meta-analysis. The Britch Accounting Review, 31(1), 35-61.
Al-Tuwaijri, A. S., Christensen, E. T., & Hughes, E. K. (2004). The relations among environmental
disclosure, environmental performance and economic performance: A simultaneous equations approach. Accounting, Organizations and Society, 29(5/6), 447-471.
Bani-Khalid, T., Kouhy, R & Hassan, A. (2017). The impact of corporate characteristics on social and environmental disclosure (CSED): The Case of Jordan Journal of Accounting and Auditing: Research & Practice 4(2)12-30.
Becht, Marco; Bolton, Patrick & Roell, Ailsa. (2003). Corporate governance and control, in G.M.
Constantinides & M. Harris & R. M. Stulz (ed.), Handbook of the Economics of Finance, edition 1, volume 1, chapter 1, pages 1‐109 Elsevier
Berger, T., & GleinBner, W. (2006). Risk reporting and risks reported: A study on German HDAG-
listed companies 2000 to 2005, paper presented at the 5th international conference on money, investment & risk, Nottingham, 1-3 November 2006.
Brammer, S., & Pavelin, S. (2008). Factors influencing the quality of corporate environmental
disclosure. Business Strategy and the Environment, 17(2), 120–136. Cheng, S. R., & Shiu, C. Y. (2007). Investor protection and capital structure: international evidence.
Journal of Multinational Financial Management, 17(1), 30-44. Dyduch, J., & Krasodomska, J. (2017). Determinants of Corporate Social Responsibility Disclosure:
An Empirical Study of Polish Listed Companies. Sustainability 9(2)19-34 D Eccles, G., Krzus, P., & G. Serafeim (2013). Market Interest in Nonfinancial Information. Retrieved
from www.ssrn.com. 10th march, 2017. Eng, L. L., & Mak, Y. T. (2003). Corporate governance and voluntary disclosure. Journal of
Accounting and Public Policy, 22(4), 325-345. Francis, J., Nanda, D., & Olsson, P. (2007). Voluntary disclosure, earnings quality, and cost of
equity, Working Paper. Garcia-Ayuso, M., & Larrinaga, C. (2003). Environmental disclosure in Spain: corporate
characteristics and media exposure. Spanish Journal of Finance and Accounting, 115, 184-214
Hassan, M. K. (2009). UAE corporations-specific characteristics and level of risk disclosure.
Managerial Auditing Journal, 24(7), 668-687. Helbok, G. & Wagner, C. (2006). Determinants of operational risk reporting in the Banking industry,
Working paper, Retrieved from http://www.papers.ssrn.com/ Horing, D., & Grundl, H. (2011). Investigating risk reporting practices in the European industry.
Retrieved from http://www.papers.ssrn.com/ Ismail, K. N., & Chandler, R. (2005). Disclosure in the quarterly reports of Malaysian companies.
Financial Reporting, Regulation and Governance, 4(1), 1-26. Jensen, M. C., & Meckling, W. H. (1976). Theory of the firm: managerial behaviour, agency costs
and ownership structure. Journal of Financial Economics, 3, 305-360. Linsley, P. M., & Shrives, P. J. (2000). Risk management and reporting risk in the UK. Journal of
Risk, 3(1), 115-129. Lopes, P. T., & Rodrigues, L. L. (2007). Accounting for financial instruments: An analysis of the
determinants of disclosure in the Portuguese stock exchange. The International Journal of Accounting, 42(1), 25-56.
285
Mia, P. & Al-Mamun, A. (2011). Corporate social disclosure during the global financialcrisis.
International Journal of Economics and Finance, 3, 174-187. Meek, G. K., Roberts, C. B., & Gray, S. J. (1995). Factors influencing voluntary annual report
disclosure by U.S., U.K. and Continental European multinational corporations. Journal of International Business Studies, 26(3), 555-572.
Nasir, N. M. & Abdullah, S. N. (2004). Voluntary disclosure and corporate governance among
financially distressed firms in Malaysia. Financial Reporting, Regulation and Governance, 3(1).
Neri, L. (2010). The informative capacity of risk disclosure: Evidence from Italian Stock market,
Retrieved from http://www.ssrn.com/ Oorschot, L. V. (2009). Risk reporting: An analysis of the German banking industry, Unpublished
Master thesis Erasmus University Rotterdam. Rajan, R. G., & Zingales, L. (1995). What do we know about capital structure? Some evidence from
international data. Journal of Finance, 50(5), 1421-1460. Robb, S. W. G., Single, L. E., & Zarzeski, M. T. (2001). Nonfinancial disclosures across Anglo-
American countries. Journal of International Accounting, Auditing and Taxation, 10(2), 71-83.
Street, D. L., & Shaughnessy, K. A. (1998). The quest for international accounting harmonization: A
review of the standard setting agendas of the IASC, US, UK, Canada, and Australia, 1973–1997. The International Journal of Accounting, 33(2), 179-209.
Thinggaard, F., & Kiertzner, L. (2008). Determinants of audit fees: evidence from a small capital
market with a joint audit requirement. International Journal of Auditing 12(2), 141-158. Tufail, U., Kamran, S., Ahmad, N., and S, Anwar (2017). Corporate social responsibility disclosure in
plantation & consumer products industry in Pakistan. International Journal of Academic Research in Business and Social Sciences 7(2).
Uwalomwa, U. & Ben-Caleb, E. (2012). Corporate social responsibility disclosure in Nigeria: A study
of listed financial and non-financial firms. Journal of Management and sustainability.2(1).www.ccsenet.org/jms
Verrecchia, R. (2009). Discretionary disclosure. Journal of Accounting and Economics, 5 179-194. Waluyo W. (2017). Firm size, firm age, and firm growth on corporate social responsibility in
Indonesia: The case of real estate companies. European Research Studies Journal 20(4) 360 - 369
Wang, K., Sewon, O., & Claiborne, M. C. (2008). Determinants and consequences of voluntary
disclosure in an emerging market: Evidence from China. Journal of International Accounting, Auditing and Taxation, 17, 14-30.
Watts, R. L. & Zimmerman, J. L. (1986). Positive accounting theory: A ten year Perspective.
The Accounting Review, 65(1), 131-156. Wuttichindanon, S (2017).Corporate social responsibility disclosure choices of report and its
determinants: Empirical evidence from firms listed on the Stock Exchange of Thailand. Kasetsart Journal of Social Sciences 38 (2) 156-162

286
Emerging issues in the Implementation of IPSAS in Nigeria
Barnabas Aboko Achaka [email protected]
And
Rosemary Edememen Uagbale-Ekatah
Department of Accounting, Benson Idahosa University, Benin City. _____________________________________________________________________________
Abstract
This study examined the emerging issues in the implementation of International Public Sector Accounting Standards (IPSAS) in Nigeria. The objective of this study is to determine the impact of the implementation of IPSAS on the Level of Accountability and Transparency in the Public Sector of Nigeria and to assess the accounting system post- independence; the roadmap; migration Time-line; milestone achievement and issues in the implementation processes. The study employs the use of data from secondary sources. The findings establish difficulties in the effective implementation of IPSAS’s framework due to absence of critical components as robust integrated ICT framework; quality assurance; amendments to key legislations that may impede implementation; harmonization of Financial Regulation and the recognition and valuation of assets and liabilities in the financial statements. Implementation will eventually facilitate comparability and increase the level of accountability and transparency in the public sector of Nigeria, enhanced meaningful information for decision-making, and improved the quality of the financial reporting system of public sector entities in Nigeria. This will also improve the comparability of financial information reported by agencies of government in Nigeria and around the world. Thus, the study concludes that the implementation of IPSAS in Nigeria would have an effect on the operating procedures, and reporting practices of government. This will strengthen good governance. Key words:
IPSAS, Accountability and transparency, implementation, Public Sector, Financial Reporting 1.0 INTRODUCTION
Until recently, where the need for convergence of standards became prominent, many countries of the world have over the years defined and set standards for its financial reporting in their respective territories. The current globalization has brought about windows of increased collaboration, international trade and commerce amongst countries and continents of the world and this has necessitated the need for uniformity in standards that guides financial statements to become comprehensible and convey uniform information to users across the world. Thus, the need to develop a unified accounting standard to sustain such yearnings has been the primary driver of International Public Sector Accounting Standards for public sector financial reporting.
While commercial entities across the world embraced the International Financial Reporting Standards (IFRS) for reporting financial transactions in the private sector, governments harmonized their operations in favour of International Public sector Accounting Standards (IPSAS) FGN (2010). This standard governs accounting processes of public sector entities with the exception of Government Business Enterprises. The yearnings of the electorates for greater government financial accountability and transparency led to the global revolution on government accounting, Heald, D. (2003). O’niel, (2002) sees ‘boundaries as becoming increasingly irrelevant as they are merging by Technology’. Welch and Wong (2001) opined that ‘in this era of globalisation, government accountability is not only important in the relationship at domestic level but also at international level’. The Public sector comprises entities or organizations that implement public policy through the provision of services and the redistribution of income and wealth, with both activities supported mainly by compulsory tax or levies on other sectors. The public policy is executed by governments, publicly owned, controlled, and or publicly funded agencies, enterprises, and other entities of government that deliver public programs, goods, or services, Kara, E. (2012).

287
Public sector accounting is a system or process, which gathers, records, classifies and summarizes as reports by way of financial statements and interprets it for accountability and financial transparency of public institutions. Obazee, (2009), observed that for accountability to be meaningful, citizens must have access to information which can judge the performance of their government. Public Sector is that part of economic and administrative life that deals with the delivery of goods and services by and for the government. The increasing concern about Corruption has brought high demand for audit reports for performance assessment of those entrusted with public sector resources. The public service reforms within the service are in compliant with best practice ideals for effective delivery of services. The authority levels and the structure of the civil service is a critical driving force for effective delivery purposes. Accounting basis of the public sector is rooted in the Constitution, relevant laws, and regulations and is interested in the receipts, custody, disbursement, and rendering of stewardship of public funds entrusted ICA-Ghana, (2010), Section 80 – 82 of Federal Constitution, FR (2009) and OAGF Instant Laws. Ahmed, (2005) opined that:
‘the reform in the service was in line with key action in the service of global efforts aimed at improving governance through a mix of country – specific interventions inspired by global best practices to achieve greater results with less resources attain quality result in service delivery, promote public private partnership, foster transparency and accountability, strengthen intra-government partnership and modify function of the state to service provider of enabling environment for job and wealth creation”.
Nigeria, a leading African nation with a population of over 170 million people and a member of the foremost Organization of Petroleum Exporting Countries (OPEC) and a public sector dominated economy, has identified, and considered the value proposition of IPSAS, for implementation in order to remain relevant.
The adoption of IPSAS is to institute a uniform reporting framework imperative for quality and comparability of financial information to be reported by public sector entities. An increased disclosure of information requirements of these reports facilitates transparency in the financial dealings of public institution and the result is stronger governance procedures, improved consistency in preparation and reporting. It will also improve accountability, ease of audits of public institutions, and thus provide better interpretation of financial reports in the right context and better decision-making process.
Government intervention following the global financial crisis in the private sector has increased many governments’ exposures and debt levels. Hence, decision-making is getting harder, especially if the view of what is “sustainable” is difficult to see. It is not out of context to argue that the knowledge of weak public sector accounting, auditing and financial management can, and likely will, lead to economic crises. The approach is not new especially to those working in the private sector of most developing nations.
The focus on the private sector when failure occurs can be enormous and accounting, audit, and reporting standards are highly maintained and its enforcement pursued rigorously. It is a fact that governments, the world over, are in the business of issuing financial instruments that strictly operates within the confine of the private sector. Their obligation is to protect would-be investors and step-up the quality of reporting in order to gain the needed confidence of investors when they offer their stocks. A timely, clear, and open annual financial statements can play a significant role in the accountability project of governments to citizens and their elected representatives. Financial statements were previously prepared on cash basis or some variations until the recent adoption and implementation of accrual basis of accounting in 2016. However, most of these financial statements were not prepared on a consistent or comparable basis in most developing countries until the advent of the implementation of International Public sector accounting standards. The benefits of achieving consistent and comparable financial information across jurisdictions is important and can be found in the standards established by the IPSAS Board, Stephen Emau, Mercy Nyangulu and Andy Wynne (Harare, 2012).
288
The Public Sector Accounting System in Nigeria Since 1960 – 2012 were prepared on modified cash basis for agencies, and cash basis for the three-tiers of government. The roadmap to conversion to IPSAS by all Public Sector entities was from 2012 – 2013. Between 2014 -2015, IPSAS, cash accounting used for the tiers of government while agencies continued with modified cash/accrual basis. The year 2016, is the commencement period for IPSAS accrual accounting for all Public Sector entities and respective tiers of governments. Earlier on, a gap analysis conducted across the 36 states led to the emergence of a national chart of accounts and a user manual. An enlightenment campaigns carried out targeted key players of the three tiers of governments after which, circulars and extant laws for implementation issued for compliance. The immediate gains are the use of same chart of accounts for all Public Sector entities in the three tiers of governments that facilitates comparability.
Guidelines for first time adoption of IPSAS accrual had earlier issued apparently ahead of commencement. The strong political will of the government, especially the presidential directive on the scope of the Treasury Single Account (TSA) and ensuring the deployment of Government Integrated Financial Management Information System (GIFMIS) aimed at ending financial management recklessness acted as a strong signal. The components in this process are budget preparation, execution, accounting and reporting. IPSAS 33 – First Time Adoption allows first time adopters three years relief period (exemption) to recognize specific elements of financial statements in order to give public sector entities time to develop reliable models for recognition and measurement during transition period. To achieve the desired implementation expectation and to consolidate on the gains thereof, some corrective actions are necessary such as:
i. Repealing the current Finance (control and management) Act; ii. Harmonizing the Financial Regulations and the Treasury Manual of the Federal Government
and of the State and Local Government into one PFM regulation; iii. Process for recognition and valuation of assets and liabilities; and iv. To conduct a monitoring and evaluation exercise on IPSAS implementation.
Many factors influence government accounting. Profit is not the focus, unlike the private sector that has profit as the prime focus and determines the profit of the business over a given period. Government is operations in different fields: armed forces, health, education, and the policies sets are achieve its aspirations and goals. Thus, government accounting is interested in information gathering that will facilitate the preparation of Receipts and Payments accounts, Omolehinwa, (2012).ICA-Ghana, (2010), opined that government budget size and the contribution of public expenditure to Gross Domestic Product are very great especially in developing economies. There is a thin line between the public sector and private sector accounting when looking at concepts and techniques employed. Further, the emerging need and use of information technology by both the public and private sectors has made the issue of public sector accounting a pertinent part of accounting studies in the world. Speaking on the effect of level of corruption in Nigeria, the need for an improved and increased recognition, measurement, presentation, and disclosure requirements in relation transactions and events in general purpose financial statement has led to the adoption of International Public Sector Accounting Standards (IPSAS). Over the years, government accounting was prepared on cash basis of accounting while private sector accounting predicates on accrual basis. Accrual basis of accounting has been working well in the private sector. However, the continued application of the cash basis in the public sector appears to have thrown up a number of challenges relating to under-utilization of scarce resources, high degree of vulnerability, manipulation, lack of proper accountability and transparency, inadequate disclosure requirement due to the fact that the cash basis of accounting does not offer a realistic view of financial transaction. Sequel to Nigeria’s decision to adopt cash IPSAS in the year 2014, this study aims at the emerging issues in implementation of IPSAS in Nigeria.

289
2.0 REVIEW OF RELATED LITERATURE
Federal Executive Council of Nigeria in July 2010 approved the adoption of the International Financial Reporting Standards (IFRS) and International Public Sector Accounting Standards (IPSAS)for the private and public sectors. The adoption aimed at improving the country’s accounting and financial reporting system in consonance with global standards. Consequently, the Federation Account Allocation Committee, (FAAC), in June 2011 set up a sub-committee to work out a roadmap for the adoption of IPSAS in the three tiers of government.
IPSAS adoption is a good development towards achieving international best practice embraced in most developed countries. There is nothing wrong with Nigeria taking queue in making sure that public entities in the country fully adopt IPSAS. The practice of government sector accounting evolved over the years with focus on cash receipts and disbursements on the cash accounting basis or modified cash accounting basis. Hence, government revenue is recorded and accounted when cash is received, and expenditure is incurred only when cash is paid, irrespective of the accounting period in which the benefit is received or the services are rendered. It, therefore, means that the amounts incurred by the government in purchasing fixed assets are treated in the same way as expenses. Thus, expenses are written-off as part of expenditures for the period the costs occurred, Oecon, N. M. (2010).
History of Convergence
IPSAS are based on the international Financial Reporting Standard (IFRS), formerly known as IAS. IFRS are issued by the International Accounting Standard Board (IASB). IPSASB adapts IFRS to a public sector context when appropriate. In undertaking that process, the IPSASB attempts, wherever possible, to maintain the accounting treatment and original text of the IFRS unless there is a significant public sector which warrant a departure.
IFAC and IPSASB
The IPSASB follows a very structured and public due process in the development of all International Public Sector Accounting Standards (IPSASs). This process provides the opportunity for all those interested in financial reporting in the public sector to make their views known to the IPSASB, and ensure that their views are considered in the standard – setting development process.
IFAC
International Federation of Accountants (IFAC) is the global organization for the accountancy profession, dedicated to serving the public interest by strengthening the profession and contributing to the development of strong international economies. It comprised of 164 members and associates in 125 countries and jurisdictions, representing approximately 2.5million accountants in the public practice, education, government service, industry and commerce.
The Nature of IPSAS
The financial and sovereign debt crises have brought to light, as never before, the need for better financial reporting by governments worldwide, and the need for improvements in the management of public sector resources. Citizens are affected by a government’s finanacial management decisions. Strong and transparent financial reporting has the potential to improve public sector decision making and make governments more accountable to their constituents. The failure of governments to manage their finances has in the past, and could again in the future, have dramatic consequences such as loss of democratic control, social unrest, and the failure of governments to meet their commitments today and in the future. The scope of IPSAS is for application by national, states and local governments, IPSAS are widely used by intergovernmental organizations.
Political and Economic benefit
Political Benefits; According to Otunla, (2014) it includes; • Accountability: increased disclosure in accounting reports; • Transparency: Full disclosure of government financial transactions;

290
• Decision making: Provide the executive and legislature with bases for their decisions on the allocation of resources;
• Basis for efficient and effective public sector management;
Improved Credibility/Integrity: Standards independently set and known world-wide;
International Best Practice & Comparability: IPSAS seeks to ensure that financial statements are comparable across jurisdictions;
• Enables Stakeholders to assess how well their resources have been utilised.
• Enhanced Implementation of the Freedom of Information (FOI) Act 2011: The accountability and transparency requirements of IPSAS are consistent with and supports the provisions of the Nigerian FOI Act 2011 which seeks to promote access to government information
Economic Benefits
• Aggregate Reporting: Adoption of IPSAS will ensure a holistic reporting of government financial transactions and positions;
• Improved Service Delivery: Greater accountability and transparency, will improve Value for Money (VFM) spending;
• Enhance Public-Private Partnership arrangements: collaborative efforts between the public and private sectors are deepened due to use of similar standards;
• Comparability: IPSAS and IFRS are similar and this common basis makes for convergence in accounting of both sectors on comparable matters
• Building confidence in Donor Agencies and Lenders: increases the country’s access to international aids /loans and other development assistance;
• Competitiveness in the global market place
• Increased Cross-border Investment and Foreign Direct Investment: increases the propensity to generate more cross border and foreign direct investments through greater transparency and a lower cost of capital for potential investors
Issues and Challenges
• Seamless consolidation of the Fiscal Reports of the three tiers of Government with uniform reporting format of having the same Chart of Accounts.
• Need for the right staffing skills and levels • Relevant enabling legislations need to be changed in line with reality of the requirements of
IPSAS. • IT Hardware and Software development to automate the process. • Relevant Accounting manuals be reviewed and rewritten. • Training and retraining of accounting personnel. • Central guidance is critical • Automation of the Business Process is very critical. • Change Management • Accounting curricula need to systematically convey IPSAS to students of Accountancy. • Continuing Professional Education on Ethics and Professional Responsibility • The profession needs to make commitment to producing IPSAS specialist. Such experts will
be available as resource persons in cases where IPSAS is in use. IPSAS specialist should be knowledgeable about available resources that can help answer professional responsibility question. An IPSAS specialist should work to maintain an environment that stresses the importance of IPSAS adoption and implementation
Key Success Factors
Sustained Political will-Approval of FEC and FAAC Ownership Technical capacity- training, re-training and personnel development Public Orientation and Enlightenment Automated Information Systems-GIFMIS Platform Adequate Finance Modular implementation-NCAO, Budget reform

291
Legal Framework etc.
3.0 IMPLEMENTATION OF IPSAS
Government efforts at reforming public financial management systems dates back to 1984 when a committee was constituted and charged with the mandate to harmonize the reporting formats of governments’ financial statements. Committees for further harmonization were inaugurated in 1998, 1999 and 2001 subsequently without results. In 2004, there was increased need to meet global best practices standards in reporting because of cross-border trading. Thus, reports of previous committees on the subject were revisited, the outcome of which, was the reduction of existing financial statements format to four statements- Cash Flow Statement; Statement of Assets & Liabilities; Statement of consolidated Revenue Fund and Statement of Consolidated Capital Development Fund. These statements had Statements of performance and statistical reports and accounting policies as supporting data. This scenario existed despite its insufficiency in providing users with the necessary information for decision-making until the adoption of IPSAS.
Nigeria at some points realized that Public Sector entities of developed world have embraced adaptation of IPSAS and, are moving towards Accrual-based accounting system. A draft publication circulated in 2010 enabled actors in the Public Sector to converge and review the gabs exiting the reporting system that and this led to the adoption of the year of commencement i.e. 2013.
The federal government in the process of adopting best practices for financial management had encouraged accountants in MDAs to offer themselves with technical and operational skills for a hitch-free adoption of IPSAS and the implementation of IFRS. This was to be in phases with quoted companies in 2012, other public interest entities in 2013 and small and medium scale enterprises in 2014.
Thus, the adoption of IPSAS in Nigeria was scheduled to be implemented in two phases: a) Cash Basis IPSAS – effective 1st January 2014; and b) Accrual Based IPSAS effective 1st January 2016.
Cash basis IPSAS prescribes the manner in which the General-Purpose Financial Statements (GPFS)should be prepared and information about cash receipts; payments and balances of entities is necessary for accountability purposes. This basic information provides the required inputs useful to assess the ability of an entity to generate cash in the future and the likely sources and uses of cash. For evaluating decisions about allocation of resources and sustainability, users require understanding of the timing and certainty of cash receipts and payments.
Accrual basis of accounting is recognizing transactions and other events in the accounts when they occur (and not only when cash or its equivalent received or paid). Thus, high quality, robust, and effective accrual based, financial reporting system such based on IPSAS, are integral to enhancing accountability and transparency in government financial reporting. Governments’ financial management decisions affects citizens and so strong and transparent financial reporting has the potential to improve Public Sector decision-making and make government more accountable to their constituents.
Road Map for IPSAS
To ensure strict adherence to the implementation programme, Federal Accounts & Allocation Committee comprising stakeholders from revenue generating agencies and representatives of states, set up a Technical Sub Committee to drive the processes in 2011. In 2012, recommendation for the implementation of IPSAS was approve, together with a framework- development for execution in 2013. The year 2014 – 2015 were used for the implementation of cash basis IPSAS and a migration schedule to accrual basis IPSAS in 2016. Within this period, the IPSAS Sub – Committee recorded milestones achievement: i. Conducted a gap analysis of IPSAS in the Federal government, 36 States, Federal Capital
Territory (FCTA) and Local Government Councils (LGCs’) ii. Develop a National Chart of Accounts for use by the three tiers of government with
peculiarities taken into account. iii. Training operators on National Chart of Accounts (NCOA), user’s manual of the NCOA;

292
iv. Enlightenment and sensitization of political leaders in the three tiers on the benefits of implementation of IPSAS;
v. Exposure of IPSAS to stakeholders in the three tiers and conducting sensitization of stakeholders in the six geo – political zones and training of desk officers – accountants and auditors and the distribution of IPSAS explained books;
vi. Developed a format of the General Purpose Financial Statements (GPFS) IPSAS and Cash Accruals including statutory statistical reports, performance reports and accountability policies.
vii. Developed IPSAS complement Budget Templates; viii. Publication of ‘Adoption of IPSAS – what you need to know’ specifically, a National Treasury
Circular approved by FAAC for all PSE’s in the three tiers of government was issued detailing that: a. Adoption, implementation and application of IPSAS was to be effective on 13th May, 2013
in Nigeria; b. Adoption of uniform financial year end by all Public Sector entities in three tiers of
government on 30th December, 2013; c. Steps towards successful implementation of IPSAS Accrual Basis in Nigeria by 2016 on
23rd October, 2013 d. Commencement of implementation of IPSAS Accrual Basis by all Public Sector entities in
Nigeria, 1st January, 2016 on 21st October 2015 ix. A draft bill on Public Finance Management Law for the federal government and states; x. IPSAS Complaint Accrual Accounting manual was prepared; xi. A publication on guidelines for first-time adoption of IPSAS was distributed. Stakeholders
publicly lunched a quarterly journal ‘IPSAS Nigeria’ for use. The array of milestone achievement provides benefits to all PSE in Nigeria such as using the same chart of accounts in budgeting, accounting, and reporting. The Nigeria Public Service has a unified accounting system and all PSE’s are either ready or have converted to IPSAS. Full compliance with accrual basis IPSASs is when an entity complied with the requirements of applicable IPSAS and report in full in accordance will all accrual based IPSASs. Emerging Issues
i. IPSAS 3:19: it states that ‘a change from one basis of accounting to another basis of accounting is a change in accounting policy’. IPSAS 3:20 states that ‘a change in the accounting treatment, recognition; or measurement of a transaction, event, or condition within basis of accounting, is regarded as a change in accounting policy’.
ii. IPSAS 3 – Accounting Policies, changes in accounting estimates and errors applies to a transition from (modified) cash to IPSAS Accrual as well as a transition from (modified) Non-IPSAS Accrual to IPSAS Accrual.
iii. Repeal of the Finance (Control and Management) Act and enactment of Public Finance Management Act-Draft Bill ready for forwarding to FEC and State Executive Council.
iv. Harmonisation of the Financial Regulations and the Treasury Manual of the FGN, Financial Instructions of States and Financial Memoranda of LGC into one Public Financial Management (PFM) Regulations. A draft copy has been vetted andis ready for printing and distribution.
v. Conduct a continuous monitoring and evaluation on IPSAS implementation; and vi. Process for recognition and valuation of Assets and liabilities inherited or acquired in the
financial statements.
CONCLUSION
This study examined the emerging issues in the implementation of International Public Sector Accounting Standards (IPSAS) in Nigeria. Nigeria adopted the Cash Basis of International Public Sector Accounting Standards in 2014. The adoption and subsequent implementation of the standard triggered emerging issues and the subject of this study. From the findings, the study observed that the adoption of IPSAS has increased the level of accountability and transparency in the public sector of Nigeria and has enhanced comparability and international best practices. The adoption has provided broader financial information for decision makers and, improves the quality of financial

293
reporting system. It has also improved comparability of financial information reported by public sector entities in Nigeria and around the world. Hence, we conclude that the adoption and implementation of IPSAS in Nigeria has influenced operating procedures, reporting practices and strengthened good governance. The subsequent conclusion of assurance services by government auditors and the Parliament will galvanize existing relations of government with the governed. Furthermore, it is to provide useful information for better management and decision, and expose the government and finance officers to greater public scrutiny, making them more accountable for the efficiency and effectiveness of their services. The existing gap in the implementation of IPSAS is surmountable, as three states of the Federation and its third tier have already prepared their financial statements on accrual basis. Achua, J.K. (2009) observed that ‘there appears to be improvement in some African Countries and other developing countries lately, albeit slowly, in terms of early publication of accounting reports. However, Nigeria is lagging behind comparatively’. Despite the result, many more public sector entities and governments are responding so fast and at concluding stages of their financial statements report preparation. Therefore, expectations are that very soon, the season of comparability of financial reports will no doubt serve as the foundation for financial reporting system in Nigeria. This will build trust between the government and the citizens. In essence, from the result and findings of the present study, we recommend that government should further intensify effort in resolving aspects needed to conclude the implementation process. Challenges of availability of electricity and internet services especially in the rural areas hosting majority of local governments may have affected efficiency within such localities including weak work force. Disaster control and recovery architecture is required immediately to safeguard information at separate locations. Finally, identifying emerging issues in the implementation process of IPSAS has narrowed the gap of uncertainty and those areas needing attention can easily be attended to and the researchers recommends headlong approach to the concluding aspects of implementation of International Public Sector Accounting Standards in Nigeria.

294
REFERENCES
Achua, J.K. (2009). Reinventing Governmental Accounting for Accountability Assurance in Nigeria. Nigeria Research Journal of Accountancy, (NRJA)
Adegite, E. O. (2010). Accounting, Accountability and National Development. Nigerian Accountant,
43(1): pp 56-64. Ahmed, Y. M. (2005). Self-Realisation and the process of change in the Civil Service: The Role of
Permanent Secretaries, The Vision and Challenges, Bureau of Public Service Reforms (BPSR)
Bushman, R. M., & Smith, A. J. (2001). Financial Accounting information and Corporate Governance:
Journal of Accounting and Economics, 32(1-3) December: 237-333. Journal of Investment and Management 2014, 3(1): pp 21-29
Chan, I. J. (2008). International Public Sector Accounting Standards: Conceptual and Institutional
Issues. Retrieved July 2, 2010 fromhttp://jameslchan.com/papers/ChanCagSem5.pdf. FGN (1999). The Constitution of the Federal Republic of Nigeria, Government Printers, Lagos. FGN (2009). Financial Regulations, Official Gazette, Government Notice No.291, VOL.96 No.72,
January, 2009 FGN Printer, Abuja Nigeria FGP.97/112009/5,000 (OL 67). FMF (2006). Federal Treasury Accounting Manual: Policy and Procedure pp 19 FGN (1958). Finance (Control & Management) Control FGN (2002). Federal Accounts Allocation Committee FGN (2010). Nigeria Public Sector Accounting and Auditing: Comparison with International Public
Sector Accounting and Auditing Standards, Country Report (6) Heald, D. (2003). The Global Revolution in Government Accounting. Public Money and Management
(January 2003), pp 11-12 http://www.google.com.gh/#gs_rn=17&gs_ri=psyab&pq=what%20is%20government%20sector%2
0accounting&cp=41&gs_id=8p&xhr=t&q=Government%20Sector%20Accounting%20articles%20pdf&es_nrs=true&pf=p&sclient=psyab&oq=Government+Sector+Accounting+articles+pdf&gs_l=&pbx=1&bav=on.2.
Institute of Chartered Accountants-Ghana (ICA-Ghana). (2010). Public Sector Accounting. ICAG,
Ghana. IFAC, (2011). www.ifac.org/publicsector/Committee Members.php IPSASB (2011). www.ipsasb.org Kara, E. (2012). Financial Analysis in Public Sector Accounting. An Example of EU, Greece and
Turkey. Eur. J. Sci. Res., 69(1): pp 81–89. Nweze, A. U. (2013). Using IPSAS to drive public sector accounting. ICAN Journal. O’Neil, Robert, J. (2002) ‘Governments’ Change-Management Challenge: Key questions to which
Government Leader should find answers as they embark on System Wide Report”. The Public Manager 31, pp 15
Obazze, Juin Osayande, (2006). Development in Public Sector Accounting and Reporting. A paper
presented at a workshop organised by the Institute of Chartered Accountant of Nigeria on Public Sector Accounting, held at Sharaton Ultimate Hotel, Abuja on June, 14-15

295
Oecon, N. M. (2010). Public Sector Accounting: Democratic control of public money by using
administrative cameralistics. Omolehinwa, E. O., & Naiyeju, J. K. (2012). An Overview of Accounting in the Nigerian Public
Sector. Int. J. Gov. Fin. Manage., 12(1): pp 10-20. Otunla, J.O (2014). A Presentation at Annual Conference of the Institute of Chartered Accountants
of Nigeria. The Implementation of the International Public Sector Accounting Standards (IPSAS) In Nigeria: The Journey So Far
Premchand, A. (1999). “Public Financial Accountability” in Schviavo-Campo, S. (ed). “Governance,
Corruption and Public Financial Management”. Asian Development Bank. Manila, Philippines. www.adb.org
Emau, S., Nyangulu, M. & Wynne, A. in Annual Financial Reporting by Governments – existing and
practices in sub-Saharan Africa, African Capacity Building Foundation. (Harare, 2012) www.scribd.com/
Welch, E. W., & Wong, W. (2001). Global Information Technology Pressure and Government
Accountability: The Mediating Effect of Domestic on Websites Openess Journal of Public Administration and Research Theory, 11 (4) pp 509