effect of fluid rheology and sandstone permeability on ... · 1 effect of fluid rheology and...
TRANSCRIPT

1
Effect of Fluid Rheology and Sandstone Permeability on Enhanced Oil Recovery in a Microfluidic
Sandstone Device
Michael A. Nilsson1 and Jonathan P. Rothstein
1,2
ABSTRACT
Maximizing oil recovery from current reserves is becoming more important as global usage
continues to rise. In this paper, we present the development of two microfluidic sandstone devices of
high complexity and differing permeability capable of quickly and inexpensively testing the oil recovery
performance of fluids with different rheological properties. Our initial baseline experiments were
performed by displacing oil with water over a wide range of flow rates. Next, a commercially available
fluid thickener, Flopaam 3630, was tested. Flopaam is both shear thinning and viscoelastic and was
found, due primarily to its large viscosity, to recover more oil than the water and increase the oil recovery
substantially in both the larger and smaller permeability microfluidic sandstone devices. Finally, a shear-
thickening nanoparticle solution was studied. The shear-thickening solution was designed to thicken at a
shear rate of about 10s-1, a typical shear rate in the oil reservoirs. These shear-thickening fluids were
found to be an excellent enhanced oil recovery fluid, especially when the shear rates within the
microfluidic sandstone devices closely matched the shear rates associated with the shear-thickening
regime. For the high permeability sandstone devices tested, when the appropriate choice of shear-rate-
dependent viscosity was used to define a capillary number, the oil recovery obtained from both the
Newtonian and non-Newtonian fluids were found to collapse quite well onto a single master curve. This,
however, was not the case for the lowest permeability sandstone devices where the increased complexity
was found to negatively affect the performance of the viscoelastic fluid when compared to either the
Newtonian or the shear-thickening fluid. Finally, it was shown that these oil recovery results are
insensitive to whether a single-stage recovery process or a more complex two-stage recovery process that
starts with an initial water flood followed by a flood with a secondary fluid were used.
1 Department of Mechanical and Industrial Engineering, University of Massachusetts - Amherst, 160 Governors Drive, Amherst, MA 01003-2210, USA
2 Corresponding Author: [email protected]

2
1. INTRODUCTION
The recovery of oil from a well generally takes place in three stages: primary, secondary, and
tertiary or enhanced oil recovery (EOR) [1]. In the primary stage, approximately 10% of the total oil in
the well is recovered using the internal pressures within the well. In the secondary stage of oil recovery, a
driving or pumping fluid, typically water, is used to displace an additional 20-40% of the oil in the
reservoir. As a result, between 50-70% of the original oil still remain in the oil field after the secondary
recovery [1]. Even so, an oil well is often considered exhausted at this point because enhanced oil
recovery techniques can be too expensive to justify their use. However, as the global oil supply decreases
and the expense of oil increases, the developing of EOR fluids and methods to efficiently and
inexpensively access and recover all of the remaining oil trapped within a well are becoming increasingly
more important.
The methods of enhanced oil recovery can be categorized into three main approaches: thermal,
gas, and chemical [1-7]. All three approaches have been used for decades and aim to ease the recovery of
the oil, either by changing the properties of the oil, the imbibing fluids, or the material properties of the
sandstone itself. Here we will focus on chemical methods. Chemical methods increase the effectiveness
of water floods by modifying the water used to displace the oil. These methods can include reducing the
interfacial tension between the imbibing fluid and the oil with the use of surfactants, increasing the
viscosity of the imbibing fluid through the addition of polymer or wormlike micelle additives, and using
additives to modify the wettability of the oil fields substrate to make it lyophobic [1, 2, 4]. One of the
greatest challenges with chemical methods is the variability in the properties of the oil and the rock
between reservoirs or even within a given reservoir. As a result, to maximize oil recovery the chemistry
and properties of the EOR fluid must be tailored specifically for each reservoir [2, 7, 8]. In this paper, we
will investigate the role of the rheology of EOR fluids on oil recovery using a series of microfluidic
sandstone devices with different porosity and permeability.
Testing methods vary over the wide range of oil fields. It is impractical to perform in situ
measurements. Instead, experiments are generally performed with core samples of the actual oil field
extracted from the field. These samples can be filled with oil directly from the field, or similar refined
oils. Core samples are then be used to test the ability of penetrating fluids to displace the oil [5].
Unfortunately, this method is prohibitively expensive and does not allow for fine inspection of the
processes at the level of individual pores and capillaries. Instead, only a bulk percent oil recovery can be
calculated. As a result, a number of researchers have been working towards the development of low cost
and more informative alternatives. These tests often use idealized representations of flow through porous

3
media like two-dimensional arrays of posts or cylinders or three-dimensional beds of packed spheres [5,
9]. This allows for dimensions to be specified for precise control of particular fluid flow properties and
examine dynamics at the micro- and nano-scales [5, 9]. This method does not account for the
inhomogeneous nature of field conditions or the true geometric flow constraints that exist in the field.
Other researchers have used more complex micromodels to study multiphase flow in porous media
composed of a network of channels etched into glass or fabricated in polymers [10-13]. These
micromodels have proven to be extremely useful in studying a variety of enhanced oil processes because
they provide direct visualization of a complex flow environment that can be easily modified to affect
wettability, porosity or permeability. A nice literature survey on this topic can be found in Kamari et al.
[12].
In this paper, we build off of the work of Nilsson et al. [13] where they developed a microfluidic
sandstone device to characterize the ability of various rheologically interesting fluid to recover oil over a
range of flow rates. In their experiments, a microfluidic sandstone device was developed using standard
soft-lithography techniques to produce an idealized two-dimensional porous media. Images taken from
sandstone were used to create a device with a variety of pore sizes and an average capillary width of 200
micron. In Nilsson et al [13], it was demonstrated that at a given flow rate, a customized shear-thickening
fluid can recover more oil than a high viscosity Newtonian fluid or current commercial viscoelastic EOR
fluids. Their experiments demonstrated that shear-thickening fluids can be utilized to recover nearly 90%
of the oil from this idealized microfluidic sandstone device. This observation was shown to be a direct
result of the shear thickening transition of the nanoparticle dispersion. If the appropriate shear rate
dependent viscosity is used to calculate the capillary number, Nilsson et al. [13] showed that the oil
recovery data collapsed onto a single master curve as a function of capillary number. There are still some
open questions from their work. Given the scale and high permeability of their devices, one might ask
about the applicability of their results to core floods or at the very least, more complex and less permeable
microfluidic sandstone devices. In this paper, we re-examine the same non-Newtonian fluids used
previously; however we examine their ability to recover oil from two significantly larger and more
complex devices with varying permeability. These experiments are the logical extension of the work of
Nilsson et al. [13] required for the eventual development of a quick and easy diagnostic tool set for EOR
fluid testing. These large-area devices were fabricated to closely mimic the cross-section of an actual
sandstone core sample taken from the field and provided by our collaborators at BASF, in order to capture
the complexity of the sandstone sample. Additionally, these experiments will facilitate future
comparisons to traditional core-flood measurements using the same EOR fluids.

4
2. EXPERIMENTAL DESIGN
The sandstone-mimetic microfluidic devices used in this study are shown in Figure 1. The mask
was created from an actual cross-sectional image of sandstone which was used as a template for a
microfluidic device that approximates flow through a sandstone core. A few modifications to the original
sandstone image were made. First, any “dead ends” were removed, and replaced with narrow capillaries.
Second, two masks were created: an original scale image of the sandstone (with no dead ends), and a
modified image where every pore and capillary was enlarged, resulting in a device with lower
permeability. The microfluidic devices were fabricated using PDMS and standard soft-lithography
techniques [14-20]. In microfluidics, photolithography is used to transfer a pattern onto a silicon wafer
using a photoresist such as SU-8 [21]. Once developed, the two-dimensional pattern in the photoresist is
used as a master from which multiple daughters can be cast in (poly)dimethyl-siloxane (PDMS) or other
cross-linking polymers, containing negatives of the pattern on the master [15, 22, 23]. This soft
lithography technique has been used for more than a decade to generate microfluidic devices containing
features as small as 10μm [23, 24]. The resulting microfluidic sandstone devices were designed to be 100
microns deep for the higher permeability device, and 80 microns deep for the lower permeability device.
The capillaries in the higher permeability device were 200 microns wide on average. The lower
permeability device has capillary widths of 40 microns. The design process used to create both the higher
and the lower permeability microfluidic sandstone device capture the essential physics of flow through
porous media and results in an easy-to-fabricate, and extremely flexible two-dimensional, experimental
test bed.
Pressure taps were installed upstream and downstream of the sandstone geometry in the
microfluidic device to measure the pressure drop across the sandstone geometry. The pressure ports were
plumbed with blunt needle tips connected to polyethylene tubing. This tubing was connected though
adapters to a differential pressure transducer (Honeywell TruStability™) with a range of ±1 psi. The
pressure drop measurements were used to determine the permeability, /U x P , of each device.
Here U is the superficial velocity, is the viscosity which can be a function of shear rate, x is the
distance across the sandstone geometry, and P is the pressure drop across the sandstone geometry.
Common oilfields have permeability values of 0.1 10.0D D .[25] The pressure drop measured
across the higher permeability device using water as the driving fluid resulted in a permeability value of
73 2.5D D , and the lower permeability device had a permeability of 42 1.5D D . In the rest of
this paper, these two devices will be designated SMD-73D and SMD-42D for the sandstone mimetic
device (SMD) with permeability of 73 2.5D D and 42 1.5D D respectively. The device in

5
Nilsson et al. [13] had a permeability of 60D , but had a much smaller footprint with a much less complex
sandstone structure. The range in permeability of the devices presented in this work will compliment the
results of Nilsson et al. [13] and allow for examination of any complexity effects on oil recovery and
permeability effect on oil recovery. The porosity of the higher permeability device is 0.47 , which is
similar to the porosity of the device of Nilsson et al. [13]. The lower permeability device had a porosity
of 0.35 . While these values are slightly above the range of most oilfields [25], it is realistic in its
structure, and its complexities allow for valuable insights in testing the ability of rheologically complex
fluids to displace oil from sandstone.
In order to determine the amount of oil recovered by a flood, images of the initial conditions were
taken when the microfluidic device was fully filled with light mineral oil. After flooding the oil-filled
device at a prescribed flowrate, the initial condition images were then compared to images after the flood
once the flow had reached steady-state and no additional oil was displaced with continued flooding.
Representative images of the oil-filled SMD-73D and SMD-42D devices prior to flooding are shown in
Figure 1. In these experiments, a syringe pump (kd Scientific, model 100) was used to impose a
prescribed flow rate on the driving fluid. The experiment was terminated after it was determined that is
had reached steady state. Steady state was defined as when no more oil was visibly being removed
through the transparent exit tubing. The images were taken with a Nikon D70 camera outfitted with a
macro lens (micro-NIKKOR 105mm). Backlighting was provided by a commercial flood light. The
images were then made grayscale and imported into a homegrown Matlab™ code. The code first applied
a threshold to each image, causing any oil-filled area to appear completely black and any non-oil-filled
area white. The images were inspected to insure that the threshold value accurately represented the oil-
filled condition. The program then counted black pixels and reported the percentage of the image that
was oil. Comparing between the percent of oil from the before and after the fluid flood allowed us to
determine the percentage of oil removed during the flooding process.
The baseline fluid used to displace oil from both the large and small permeability microfluidic
sandstone devices was deionized water. The oil used to initially fill the microfluidic devices was light
mineral oil (Fisher Scientific). To increase contrast with the PDMS, the oil phase was dyed with Sudan
Blue (Sigma Aldrich). The interfacial tension between water and mineral oil light was measured to be
20 mN m while the contact angle between water and mineral oil-wetted PDMS was found to be
155 /138A R . Two rheologically complex fluids were also used: a shear-thickening nanoparticle
solution and a viscoelastic shear-thinning fluid.

6
Modifying the rheology of the driving fluid was achieved through the addition of nanoparticles
and/or high molecular weight polymer additives to the water phase. In this study, we were interested in
investigating the impact of two different rheological characteristics on enhanced oil recovery: shear
thinning and viscoelasticity. The shear thickening fluid was created by adding a small amount (0.4 wt %)
of a moderately high molecular weight polyethylene oxide (PEO) (Mw = 600,000 g/mol, Aldrich) to a
aqueous dispersion of 4.0 wt% hydrophilic silica nanoparticles (12 nm size, Degussa AEROSIL® 200)
[26]. The resulting fluid was found to shear-thicken by a factor of about five.[26] As seen in Figure 2, at
low shear rates the nanoparticle dispersion initially shear thins. At a shear rate of 17s , the shear
viscosity thickens by a factor of approximately forty from approximately 0.05 Pa·s to 2.0 Pa·s. The fluid
maintains this high viscosity until a shear rate of about 120s beyond which it begins to shear thin
again. This shear thickening is induced by the interaction of nanoparticles enhanced by the presence of
the polymer which can absorb to and bridge between nanoparticles to produce long-range interactions and
a percolated network structure under flow [26]. In the absence of polymers, the nanoparticle suspensions
at this concentration show no shear thickening and a significantly reduced viscosity [27]. Linear
viscoelasticity measurements of this nanoparticle dispersion do not reveal any elasticity over the range of
shear rates that could be probed. The interfacial energy of the nanoparticle/polymer solution was found to
be 20mN m and the contact angles with PDMS in light mineral oil were measured to be
140 104A R .
A commercially available viscoelastic fluid, Flopaam 3630 (SNF Floerger®) was mixed with
deionized water at a concentration of 0.1 wt%. Flopaam 3630 is a proprietary EOR additive comprised of
a very high molecular weight co-polymers of polyacrylamide and polyacrylate. As seen in Figure 2a, at a
concentration of 0.1 wt% Flopaam 3630, the solution was found to shear thin over the entire range of
shear rates probed. The concentration of Flopaam was chosen such that it had roughly the same baseline
viscosity at low shear rates as the shear-thickening nanoparticle suspension so that effects of shear-
thickening and viscoelasticity could be separated more easily. As seen in Figure 2a, the viscosity of the
0.1 wt% Flopaam 3630 solution shear thins at roughly the same rate as the shear thickening nanoparticle
suspension. There are two major differences between these fluids. First, the Flopaam does not shear
thicken. Second, as seen in Figure 2b, the linear viscoelastic spectrum of Flopaam shows the fluid to be
viscoelastic with a relaxation time of approximately 0.1s . As a result, an elastic response can be
expected from this solution for flows where the Weissenberg number, 1Wi , or equivalently for
flows where the shear rate is greater than 110s .
3. RESULTS AND DISCUSSION

7
The first fluid used in this device was water. This was to establish a baseline using the most
common fluid used in oil recovery. The flowrates used for driving the fluids through both microfluidic
sandstone devices ranged between 1.5 ml/hr to 175.5 ml/hr. This corresponds to front speeds between
0.16mm/s 14mm/sU and shear rates in the sandstone features between 1 14.6s 408s for SMD-
73D, and front speeds of 0.20mm/s 23mm/sU and shear rates of 1 17.3s 857s for the smaller
permeability device, SMD-42D. For flow through a rectangular channel, the shear rate depends on aspect
ratio [28]. The average front speed is calculated as, /U Q HL , where Q is the volume flow rate, L is
the overall width of the device, H is the channel height and is the porosity of the sandstone. It has been
shown that for flow through a two to one aspect ratio channel that the wall shear rate becomes
approximately 6 /w U W [28, 29] where W is the channel width. The shear rate across the channel,
however, is not constant so the average shear rate in the square channel, 3 /U W , was chosen as a
characteristic shear rate in the sandstone device in order to evaluate the viscosity of the shear thickening
fluid [29]. For SMD-73D, these shear rates correspond to capillary numbers for water between
6 43.9 10 / 3.5 10Ca U and 6 39.9 10 1.2 10 Ca for SMD-42D. For the case of the
shear thickening and viscoelastic fluids, the viscosity ( ) used to define the capillary number is
dependent on the shear rate, ( ) /Ca U .
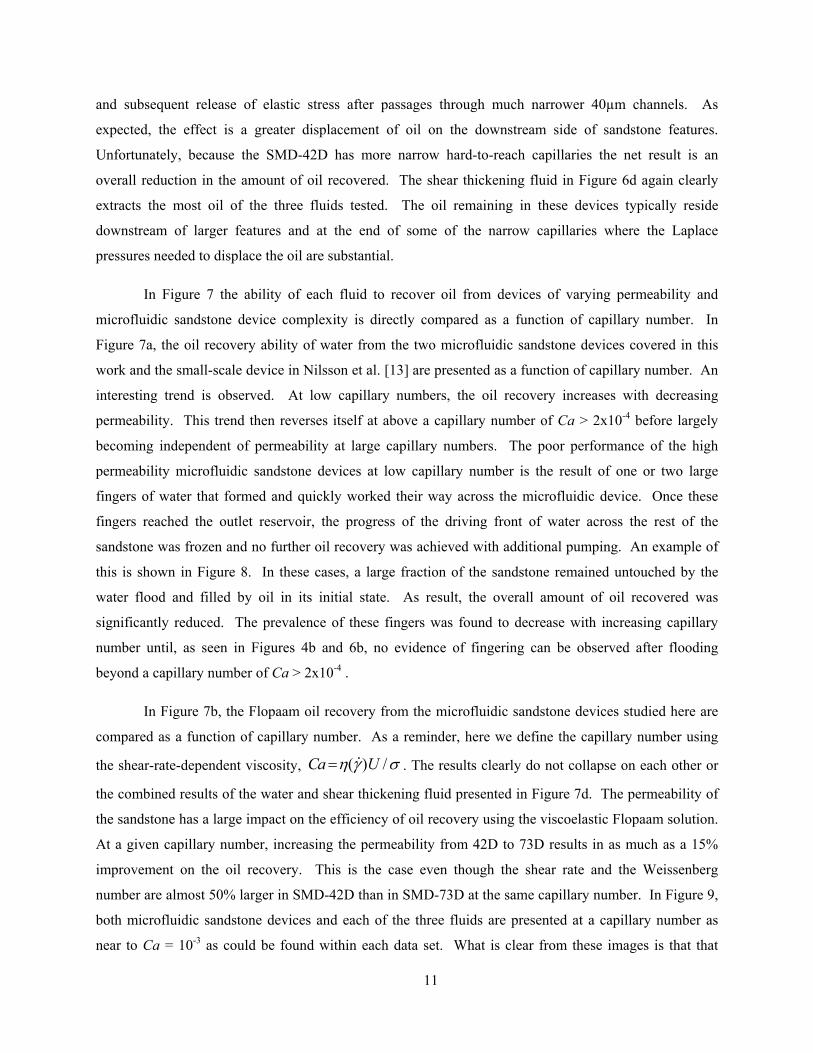
The results for water and the other driving fluids in the high permeability microfluidic sandstone
device, SMD-73D, are presented in Figure 3. The percentage of oil remaining after water flooding was
calculated after the flow had reached steady state. This result is presented as a function of the shear rate
of the driving fluid which will allow for a more direct discussion of the physics and benefits of the shear-
thickening fluid. At the lowest flowrates tested, approximately 75% of the oil remained after flooding
with water at 1.5 ml/hr in the high permeability microfluidic device. With increasing flowrate, additional
oil was recovered approaching an asymptotic value of roughly 45% residual oil at the largest flowrates
tested. Similar trends were observed previously for Newtonian fluids with increasing flow rate in a
variety of model porous medias [5, 7, 9, 13, 30, 31].
Next, the shear-thickening nanoparticle dispersion was tested in SMD-73D. The shear-thickening
nanoparticle/PEO fluid greatly outperformed the water in recovering oil over all the flowrates tested.
This is expected, however, because the shear thickening fluid has a much larger viscosity than water even
at lowest shear rates tested here. As a result, even though we are initially comparing the data at a fixed
shear rate to emphasize the impact of shear thickening at a critical shear rate, it is important to note that
the data presented for different fluids at a given shear rate in Figure 3 are at very different capillary

8
numbers. For a Newtonian fluid in a given microfluidic device, the oil recover data is expected to
collapse to a single master curve when the data is recast in terms of capillary number [13]. We will
discuss the importance of the capillary number in detail when analyzing the oil recovery data as a
function of the permeability of the microfluidic sandstone devices later in this section.
At the lowest flowrate tested, the shear-thickening fluid left 37% of the original oil behind in the
sandstone device. As the flowrate was increased, the oil recovery was found to dramatically improve,
reaching as little as 12% residual oil at a shear rate of 45s-1 and maintains this impressive oil recovery at
the highest shear rates examined. These trends are qualitatively similar to the improved oil recovery
reported by Nilsson et al. [13] for a smaller, less complex PDMS microfluidic sandstone devices. This
suggests that the previous observations were qualitatively independent of device complexity and capillary
size. Figure 3 shows a sharp transition in oil recovery beginning at or below a shear rate of 111.6s .
This shear rate is very closely tied to the shear rates at which shear-thickening of the viscosity of the
nanoparticle dispersion was found to occur in Figure 2. The direct correlation to the shear-thickening
transition suggests that the rise in pressure drop associated with shear-thickening is sufficient to allow the
nanoparticle dispersion to access previously trapped oil by overcoming the Laplace pressure supporting
water-oil interfaces in the small capillaries and side branches. Once the fluid permeates these capillaries,
a larger fraction of the sandstone device is accessed and the resulting local shear rate is reduced. In some
cases, the reduced shear rate can drive the viscosity back below the shear thickening transition. While the
oil recovery increases with the onset of the shear thickening, the peak oil recovery was found to exist over
a range of average shear rates larger than the shear thickening range of the fluid. This likely arises from
the complexity of the device and variations of the local shear rates across the device for any given
flowrate.
As seen in Figure 3, the viscoelastic Flopaam 3630 mixture was found to recover more oil than
the water at all flow rates tested within SMD-73D. It was, however, only found to recover more oil than
the shear-thickening nanoparticle dispersion at the very lowest shear rates tested in the high permeability
sandstone device. In both cases, this is the result the shear-rate-dependent nature of the viscosity of the
viscoelastic and shear thickening fluids and the effect it has on the resulting capillary number. The
viscosity of the viscoelastic fluid is considerably larger than water for all the shear rates tested and
slightly larger than the shear thickening fluid up until the nanoparticle suspension begins to shear thicken
at a shear rate of about 110s . Beyond that shear rate, the viscosity and thus the capillary number of
the shear thickening fluid exceeds that of the viscoelastic fluid and the result is a sizable increase in the
amount of oil recovered from the microfluidic sandstone device. Unlike the shear-thickening fluid, the

9
viscoelastic Flopaam solution was found to follow a more Newtonian-like recovery profile over the
flowrates tested, with a gradual improvement in oil recovery as the flowrate was increased. This may in
part be due to the fact that the viscosity of the Flopaam solution was found to slowly thin over the entire
range of shear rates tested with no dramatic changes like those observed for the shear thickening fluid.
These observations reinforced the conclusions of Nilsson et al. who found that a fluid designed to thicken
at a specific shear rate can exceed the oil recovery of existing enhanced oil recovery fluids like Flopaam
[13]. To understand these results in detail, it is useful to interrogate the images taken before and after
flooding with each of these driving fluids.
By examining the images used for determining the oil recovery, it is possible to qualitatively
assess regions where one particular fluid outperforms others in accessing and mobilizing the trapped oil.
Figure 4 compares before and after images of oil recovery experiments performed at a flowrate of
62.4ml/hr and shear rate of 145s-1 in SMD-73D. The initial oil-filled device is shown in Figure 4a. The
steady state result for water is shown in Figure 4b. The water tends to form preferential pathways through
the sandstone structure. Once a pathway was formed through the entire sandstone structure, the water
was not observed to permeate laterally through the device instead choosing to follow the path of least
resistance. At the flowrate presented in Figure 4, multiple channels formed through the sandstone device
by the water. Figure 4c shows the results after the Flopaam 3630 flood of SMD-73D. At this flowrate,
the Flopaam recovers significantly more oil than the water, but less overall oil than the flood of the shear-
thickening fluid as seen in Figure 4d. One observation from Figure 4 is that the Flopaam solution is not
as efficient as the shear-thickening fluid at removing oil downstream of large obstructions, although it
exceeds the shear thickening fluid at stripping oil away upstream of and beside smaller obstructions. The
pockets of oil remaining downstream of larger obstructions and in lateral pores account for the increased
remaining oil when compared to the shear thickening fluid. These observations differ from those
previously observed in a less complex microfluidic sandstone device by Nilsson et al. [13]. In their
device, it was observed that an identical Flopaam solution would flood into small 'dead-end' pores or
unswept volumes and recover a significant amount of oil. This effect was attributed to the observed
viscoelastic nature of the Flopaam solution. As the Flopaam solution would pass through a narrow throat,
an extensional flow would be produced followed by a strong shear flow in the narrow passage resulting in
the deformation of the high molecular weight polymer chains in the flow direction and the buildup of
elastic normal stresses [32]. After exiting a narrow passage, this elastic stress is partially released and
polymer will partially recover back towards its equilibrium configuration and expand radially outward
downstream of an expansion. This is similar to a die swell that occurs as a result of extrusion of
polymeric fluids [33, 34]. In SMD-73D, the extent of this effect is reduced, as the pores and capillaries

10
are larger on average and more uniform in dimension by design. By contrast, the small microfluidic
sandstone device used by Nilsson et al. [13] had much more variation in channel dimensions from
hundreds down to tens of microns. Therefore the extensional flows and subsequent shear flows in SMD-
73D would be weaker through the capillaries between pores, with the result being less effective oil
recovery in 'dead-end' pores and behind larger features. Finally, we note from Figure 4d, that the shear-
thickening solution was in general much more effective at clearing oil from the whole SMD-73D,
however, the majority of the remaining oil was found within unswept volumes which is consistent with
the previous observations of Nilsson et al. [13].
Figure 5 shows the remaining oil left in the SMD-42D after pumping the driving fluids through
over a range of different flowrates. The trends in this device agree qualitatively to those of SMD-73D.
At the lowest flowrate, roughly 62% of the original oil remained after the pumped water had reached
steady state. With increasing flowrate oil recovery improved to an asymptotic value of roughly 40% oil
remaining. The Flopaam solution again recovers more oil than the water at all flowrates, ranging from
49% oil remaining at the lowest flowrate tested, and improving to 27% oil remaining at the highest
flowrate tested. The response of the shear-thickening solution in SMD-42D is slightly better than the oil
recovery of the Flopaam solution at low shear rates. As the shear rate increases into the range of the
shear-thickening, 111s , the oil recovery sharply improves, with only 11% of oil remaining at the
highest shear rates examined. The presence of a critical shear rate for the onset of significant oil recovery
for the shear-thickening fluids is consistent with both the higher permeability devices, SMD-73D, as well
as the smaller, less complicated devices developed and tested by Nilsson et al. [13].
Figure 6 allows for more qualitative observations of the oil recovery. The initial oil-filled SMD-
42D is shown in Figure 6a. The flow rate in these images was 62.4ml/hr, corresponding to a shear rate of
304s-1. In Figure 6b, water appears to do a more thorough job in removing oil from SMD-42D compared
to the SMD-73D in Figure 4b. This, however, is simply an optical illusion as the starting volume of oil is
these lower permeability and lower porosity devices is smaller. Roughly the same fraction of fluid is
displaced by the water in both of these microfluidic sandstone devices. One observes that there are still
large pockets of oil that remain in both larger pores and smaller capillaries. As seen in Figures 4c and 6c,
the Flopaam solution recovered less oil in SMD-42D than in the SMD-73D at the same flowrates. This
observation is intriguing because the shear rates present in SMD-42D for the same flowrates are higher
than those in the SMD-73D. Thus the viscoelastic fluid recovers less fluid in the less permeable
microfluidic sandstone device even though the shear rate, the capillary number and the Weissenberg
number are all larger in SMD-42D than in SMD-73D at the same flow rates. Additionally, SMD-42D has
larger variation in size between the pores and the capillaries which should results in a stronger build up
11
and subsequent release of elastic stress after passages through much narrower 40µm channels. As
expected, the effect is a greater displacement of oil on the downstream side of sandstone features.
Unfortunately, because the SMD-42D has more narrow hard-to-reach capillaries the net result is an
overall reduction in the amount of oil recovered. The shear thickening fluid in Figure 6d again clearly
extracts the most oil of the three fluids tested. The oil remaining in these devices typically reside
downstream of larger features and at the end of some of the narrow capillaries where the Laplace
pressures needed to displace the oil are substantial.
In Figure 7 the ability of each fluid to recover oil from devices of varying permeability and
microfluidic sandstone device complexity is directly compared as a function of capillary number. In
Figure 7a, the oil recovery ability of water from the two microfluidic sandstone devices covered in this
work and the small-scale device in Nilsson et al. [13] are presented as a function of capillary number. An
interesting trend is observed. At low capillary numbers, the oil recovery increases with decreasing
permeability. This trend then reverses itself at above a capillary number of Ca > 2x10⁻⁴ before largely
becoming independent of permeability at large capillary numbers. The poor performance of the high
permeability microfluidic sandstone devices at low capillary number is the result of one or two large
fingers of water that formed and quickly worked their way across the microfluidic device. Once these
fingers reached the outlet reservoir, the progress of the driving front of water across the rest of the
sandstone was frozen and no further oil recovery was achieved with additional pumping. An example of
this is shown in Figure 8. In these cases, a large fraction of the sandstone remained untouched by the
water flood and filled by oil in its initial state. As result, the overall amount of oil recovered was
significantly reduced. The prevalence of these fingers was found to decrease with increasing capillary
number until, as seen in Figures 4b and 6b, no evidence of fingering can be observed after flooding
beyond a capillary number of Ca > 2x10⁻⁴ .
In Figure 7b, the Flopaam oil recovery from the microfluidic sandstone devices studied here are
compared as a function of capillary number. As a reminder, here we define the capillary number using
the shear-rate-dependent viscosity, ( ) /Ca U . The results clearly do not collapse on each other or
the combined results of the water and shear thickening fluid presented in Figure 7d. The permeability of
the sandstone has a large impact on the efficiency of oil recovery using the viscoelastic Flopaam solution.
At a given capillary number, increasing the permeability from 42D to 73D results in as much as a 15%
improvement on the oil recovery. This is the case even though the shear rate and the Weissenberg
number are almost 50% larger in SMD-42D than in SMD-73D at the same capillary number. In Figure 9,
both microfluidic sandstone devices and each of the three fluids are presented at a capillary number as
near to Ca = 10-3 as could be found within each data set. What is clear from these images is that that

12
unlike the water or the shear thickening solution, the viscoelastic Flopaam solution leaves behind large
isolated pockets of oil in the low permeability sandstone device. These pockets of oil are the reason for
the decrease in oil recovery, but the physics behind their formation and the role of viscoelasticity in the
reduction in oil recovery are not easily inferred from the sandstone images or videos.
In Figure 7c, the oil recovery from the shear-thickening fluid is presented across the microfluidic
sandstone devices. Here we present the data as a function of shear rate again to emphasize the importance
of the shear thickening transition. The data is plotted with the water and viscoelastic data as a function of
capillary number in Figure 7d. As seen in Figure 7c, the oil recovery for all three devices appears to
collapse onto a single master curve over all the shear rates tested. This observation is most dramatic at
-110s , the shear rate that corresponds to the shear-thickening fluid behavior, where the oil remaining
in all three microfluidic sandstone devices collapse to approximately 15%. Very little variation with
permeability is observed for the shear thickening fluids. When they are recast as a function of capillary
number, as seen in Figure 7d, the oil recovery for the shear thickening fluids is found to match the
measurements made for water and the viscoelastic Flopaam solution in the high permeability sandstone
device.
Finally, an important aspect of an enhanced oil recovery fluid is the ability to recover additional
oil from a field that had been previously flooded with water. This two stage flooding is straightforward to
perform in the microfluidic sandstone devices. The results for sequential flooding with water followed by
Flopaam and water followed by the shear thickening fluid in the SMD-73D are shown in Figure 10. At a
flowrate of 62.4 ml/hr corresponding to a shear rate of 145s-1, an initial water flood was performed,
resulting in an identical amount of residual oil when compared against the results in Figure 3. This data is
represented by an open square overlayed on the data in Figure 10a. In Figure 10b, the results are shown
for the subsequent flooding with the Flopaam mixture at the same flowrate (62.4 ml/hr) until steady state
was obtained. Interestingly, the secondary fluid managed to recover exactly the same amount of oil
(Figure 10a, open star) as was obtained by the single flood with the Flopaam. This reinforces the results
from Nilsson et al. [13] that an initial flood of water does not affect the overall recovery from a sandstone
microfluidic devices in a two stage flood [13]. Similar to the previous work, the Flopaam solution flood
did not show a preferential flow through passages previously flooded by water during the first stage. In
Figure 10c, the result of the two-stage water and shear-thickening flooding process to the result of a single
stage shear-thickening flood at a flowrate of 62.4 ml/hr are compared. Similar to the two-stage Flopaam
solution results, the results from two-stage shear-thickening flood (Figure 10a, open circle) agreed
extremely well with the single stage shear-thickening flood.

13
CONCLUSIONS
The field of Enhanced Oil Recovery is becoming a more important and necessary field. In this
work we present efforts towards developing a microfluidic platform for quickly testing the ability of EOR
fluids with different rheological properties for the recovery of oil from hydrophobic sandstone of various
permeabilities. Water was tested in the microfluidic sandstone device as a baseline for oil recovery
comparison in both devices. Additionally, a commercially available viscoelastic fluid thickener and a
shear-thickening fluid were both examined for their ability to increase oil recovery. Two microfluidic
sandstone devices were developed with different permeability and complexity and compared to a much
simpler device published previously in Nilsson et al. [13]. In all three microfluidic sandstone devices, at a
given flow rate, the viscoelastic Flopaam solution outperformed the water, but was in turn out performed
by the shear thickening fluid. This observation is a direct result of the large viscosity of the viscoelastic
fluid and the shear thickening transition observed for the nanoparticle suspension. If the data is
renormalized as a function of the capillary number using the appropriate shear-rate-dependent viscosity,
nearly all the data collapse onto a single master curve independent of fluid and the permeability of the
sandstone device. The lone exception was the case of the viscoelastic Flopaam solution. For these fluids,
decreasing the microfluidic sandstone permeability resulted in a 15% reduction in the amount of oil
recovered. Finally, it was demonstrated that a two-stage recovery process using water and a secondary
fluid can recover as much oil as a single stage recovery with the secondary fluid in this larger, more
complicated device. These measurements demonstrate that microfluidic sandstone devices can serve as a
quick diagnostic tool to investigate the ability of enhanced oil recovery fluids to recover oil. They
represent a viable, cost effective alternative to core floods for determining the effectiveness EOR fluids.
ACKNOLEDGEMENTS
The authors would like to acknowledge BASF for their financial support of this work, as well as
Jack Tinsley, Christian Kunkelmann, Sebastian Weisse, Ravindra Aglave, and Björn Heinz for their
assistance and enlightening discussions. The authors would also like to thank Sunil Khandavalli for
performing some rheological measurements.

14
REFERENCES
[1] U.S. Department of Energy: Enhanced Oil Recovery/CO2 Injection, U.S. Department of Energy, Washington D.C. 2011.
[2] Alvarado V, Manrique E: Enhanced Oil Recovery: An Update Review, Energies 3 (2010) 1529‐1575.
[3] Brandt AR, Unnasch S: Energy Intensity and Greenhouse Gas Emissions from Thermal Enhanced Oil Recovery, Energy & Fuels 24 (2010) 4581‐4589.
[4] Fathi SJ, Austad T, Strand S: Water‐Based Enhanced Oil Recovery (EOR) by "Smart Water": Optimal Ionic Composition for EOR in Carbonates, Energy & Fuels 25 (2011) 5173‐5179.
[5] Jamaloei BY, Kharrat R, Asghari K: Pore‐scale events in drainage process through porous media under high‐ and low‐interfacial tension flow conditions, Journal of Petroleum Science and Engineering 75 (2010) 223‐233.
[6] Needham RB, Doe PH: Polymer Flooding Review, Journal of Petroleum Technology 39 (1987) 1503‐1507.
[7] Thomas S: Enhanced oil recovery ‐ An overview, Oil & Gas Science and Technology‐Revue De L Institut Francais Du Petrole 63 (2008) 9‐19.
[8] Wever DAZ, Picchioni F, Broekhuis AA: Polymers for enhanced oil recovery: A paradigm for structure‐property relationship in aqueous solution, Progress in Polymer Science 36 (2011) 1558‐1628.
[9] Chhabra RP: Bubbles, Drops and Particles in Non‐Newtonian Fluids, CRC Press, Boca Raton, 2007.
[10] Sayegh SG, Fisher DB: Enhanced Oil Recovery by CO2 Flooding in Homogeneous and Heterogeneous 2D Micromodels J. Canadian Petroleum Tech. 48 (2009) 30‐36.
[11] McKellar M, Warelaw NC: A method of making two‐dimensional glass micromodels of pore systems, J. Canadian Petroleum Tech. 21 (1982) 39‐41.
[12] Kamari E, Rashtchian D, Shadizadeh SR: Immiscible Displacement of a Wetting Fluid by a Non‐wetting One at High Capillary Number in a Micro‐model Containing a Single Fracture, Transp. Porous Med. 94 (2012) 289‐301.
[13] Nilsson MA, Kulkarni R, Gerberich L, Hammond R, Singh R, Baumhoff E, Rothstein JP: The effect of fluid rheology on enhanced oil recovery using a microfluidic sandstone device, J. Non‐Newtonian Fluid Mech. 202 (2013) 112‐119.
[14] Atencia J, Beebe DJ: Controlled microfluidic interfaces, Nature 437 (2005) 648‐655. [15] Duffy DC, McDonald JC, Schueller OJA, Whitesides GM: Rapid prototyping of microfluidic
systems in poly(dimethylsiloxane), Analytical Chemistry 70 (1998) 4974‐4984. [16] Gao L, McCarthy TJ: "Artificial lotus leaf" prepared using a 1945 patent and a commercial textile,
Langmuir 22 (2006) 5998‐6000. [17] Nie ZH, Seo MS, Xu SQ, Lewis PC, Mok M, Kumacheva E, Whitesides GM, Garstecki P, Stone HA:
Emulsification in a microfluidic flow‐focusing device: effect of the viscosities of the liquids, Microfluidics and Nanofluidics 5 (2008) 585‐594.
[18] Petersen KE: Silicon as a Mechanical Material, Proceedings of the Ieee 70 (1982) 420‐457. [19] Stone HA, Stroock AD, Ajdari A: Engineering flows in small devices: Microfluidics towards a lab‐
on‐a‐chip, Annu. Rev. Fluid Mech. 36 (2004) 381‐411. [20] Whitesides GM: The origins and the future of microfluidics, Nature 442 (2006) 368‐373. [21] Madou MJ: Fundamentals of microfabrication : the science of miniaturization, CRC Press, Boca
Raton, Fla., 2002. [22] McDonald JC, Duffy DC, Anderson JR, Chiu DT, Wu HK, Schueller OJA, Whitesides GM:
Fabrication of microfluidic systems in poly(dimethylsiloxane), Electrophoresis 21 (2000) 27‐40.

15
[23] McDonald JC, Whitesides GM: Poly(dimethylsiloxane) as a material for fabricating microfluidic devices, Accounts of Chemical Research 35 (2002) 491‐499.
[24] Makamba H, Kim JH, Lim K, Park N, Hahn JH: Surface modification of poly(dimethylsiloxane) microchannels, Electrophoresis 24 (2003) 3607‐3619.
[25] Han D, Nur A, Morgan D: Effects of Porosity and Clay Content on Wave Velocities in Sandstones, Geophysics 51 (1986) 2093‐2107.
[26] Kamibayashi M, Ogura H, Otsubo Y: Shear‐thickening flow of nanoparticle suspensions flocculated by polymer bridging J. Colloid and Interface Sci. 321 (2008) 294‐301.
[27] Khandavalli S, Rothstein JP: Extensional rheology of shear‐thickening fumed silica nanoparticles dispersed in an aqueous polyethylene oxide solution, J. Rheol. 58 (2014) 411‐431.
[28] White FM: Viscous Fluid Flow, McGraw‐Hill, New York, 1991. [29] Son Y: Determination of shear viscosity and shear rate from pressure drop and flow rate
relationship in a rectangular channel, Polymer 48 (2007) 632‐637. [30] Cottin C, Bodiguel H, Colin A: Drainage in two‐dimensional porous media: From capillary
fingering to viscous flow, Physical Review E 82 (2010). [31] Taber JJ: Research on Enhanced Oil‐Recovery ‐ Past, Present and Future, Pure and Applied
Chemistry 52 (1980) 1323‐1347. [32] Rothstein JP, McKinley GH: The axisymmetric contraction‐expansion: The role of extensional
rheology on vortex growth dynamics and the enhanced pressure drop, J. Non‐Newtonian Fluid Mech. 98 (2001) 33‐63.
[33] Larson RG: Instabilities in Viscoelastic Flows, Rheol. Acta 31 (1992) 213‐263. [34] Petrie CJS, Denn MM: Instabilites in Polymer Processing, AIChE J. 22 (1976) 209‐236.

16
Figure 1: Images of the section of the mask pattern containing the sandstone geometry for the a.) SMD-73D and b.) the SMD-42D used in these experiments. Flow in these images would flow from top to bottom. Each device comprises of 3 sandstone tile units arranged in a row. The left and right edges are modified to represent impermeable sandstone. The smallest capillary size for the a.) SMD-73D is 200 µm and for the b.) SMD-42D is 40 µm.

17
0.1 1 10 1000.01
0.1
1
Vis
cosi
ty [
Pa
s]
Shear Rate [s-1]
a)
0.1 1 10 1000.01
0.1
1
G' [
Pa]
, G"
[Pa]
Angular Frequency [rad/s]
b)
Figure 2: a.) Viscosity as a function of shear rate for 0.1 wt% Flopaam 3630 and the shear-thickening 4.0 wt% silica nanoparticles 0.4 wt% PEO. b.) The storage (G’,) and loss (G’’, ) modulus as a function of angular frequency for the 0.1 wt% Flopaam 3630. The cross-over point is at 10 rad/s, corresponding to a relaxation time of 0.1s .
18
0 100 200 300 400 5000
10
20
30
40
50
60
70
80
90
Per
cent
age
of O
il R
emai
ning
[%
]
Shear Rate, [s-1].
Figure 3: The percent oil remaining in SMD-73D after flooding with various fluids as a function of shear rate through the large permeability sandstone microfluidic device. The driving fluids include: ■ water, ● shear thickening fluid consisting of 4.0 wt% silica nanoparticle 0.4wt% PEO in water, and 0.1 wt% Flopaam 3630 in water.

19
Figure 4: a.) The initial SMD-73D geometry filled with Mineral oil dyed with Sudan blue. The oil-filled microfluidic sandstone device is shown after reaching steady-state by single-stage flooding at 62.4 ml/hr hr and shear rate of 145s-1 with b.) water, c.) 0.1 wt% Flopaam 3630 in water, and d.) shear-thickening fluid consisting of 4.0 wt% silica nanoparticle 0.4wt% PEO in water. In all cases, the flow is from top to bottom.

20
0 100 200 300 400 500 600 700 800 9000
10
20
30
40
50
60
70
Per
cent
age
of O
il R
emai
ning
[%
]
Shear Rate, [s-1].
Figure 5: The percent oil remaining in SMD-42D after flooding with various fluids as a function of shear rate through the small permeability sandstone microfluidic device. The driving fluids include: ■ water, ● shear thickening fluid consisting of 4.0 wt% silica nanoparticle 0.4wt% PEO in water, and 0.1 wt% Flopaam 3630 in water.

21
Figure 6: a.) The initial SMD-42D sandstone geometry filled with Mineral oil dyed with Sudan blue. The oil-filled SMD-42D is shown after reaching steady-state by single-stage flooding at 62.4 ml/hr and a shear rate of 304s-1 with b.) water, c.) 0.1 wt% Flopaam 3630 in water, and d.) shear-thickening fluid consisting of 4.0 wt% silica nanoparticle 0.4wt% PEO in water. In all cases, the flow is from top to bottom.

22
0.0000 0.0005 0.001020
30
40
50
60
70
80P
erce
ntag
e of
Oil
Rem
aini
ng [
%]
Capillary Number
a)
0.000 0.005 0.010 0.015 0.020 0.02510
20
30
40
50
b)
Per
cent
age
of O
il R
emai
ning
[%
]
Capillary Number
0 10 20 30 40 50 600
10
20
30
40
50
60
70
Per
cent
age
of O
il R
emai
ning
[%
]
Shear Rate [s-1]
c)
1E-6 1E-5 1E-4 1E-3 0.01 0.1 10
10
20
30
40
50
60
70
80
Per
cent
age
of O
il R
emai
ning
[%
]
Capillary Number, Ca=()U /
d)
.
Figure 7: a.) The residual oil cast as a function of capillary number after flooding with water in the SMD-42D (solid squares), the results from the device in Nilsson et al. (hatched squares), and the SMD-73D (open squares). b.) The residual oil cast as a function of capillary number after flooding with Flopaam in the SMD-42D (solid stars), the results from the device in Nilsson et al. (hatched stars), and the SMD-73D (open stars). c.) The residual oil cast as a function of a shear rate that uses the hydraulic diameter as the characteristic length scale after flooding with the shear-thickening fluid in the SMD-42D (solid circles), the results from the device in Nilsson et al. (hatched circles), and the SMD-73D (open circles). d) The residual oil as a function of capillary number for both SMD-73D and SMD42D with the symbols the same as in a) through c).

23
a)
b)
Figure 8: a) The oil-filled SMD-73D showing the presence of fingers after being flooding with water at 2.0 ml/hr and a shear rate of 4.7s-1 and b) The oil-filled SMD-42D showing the sandstone device after being flooding with water at 1.5 ml/hr and a shear rate of 7.3s-1.

24
Figure 9: A comparison of the effectiveness of the three fluids and two microfluidic sandstone devices at a similar capillary number. In a), b) and c), the oil-filled SMD-42D is shown after reaching steady-state after flooding with a) water at a capillary number of Ca = 1.2x10⁻³, b) 0.1 wt% Flopaam 3630 in water at Ca = 1.1x10⁻³ and c) shear-thickening fluid consisting of 4.0 wt% silica nanoparticle 0.4wt% PEO in water at a Ca = 8.1x10⁻⁴. In d), e) and f), the oil-filled SMD-73D is shown after reaching steady-state after flooding with a) water at a capillary number of Ca = 3.5x10⁻⁴ , b) 0.1 wt% Flopaam 3630 in water at Ca = 6.5x10⁻⁴ and c) shear-thickening fluid consisting of 4.0 wt% silica nanoparticle 0.4wt% PEO in water at a Ca = 5.2x10⁻⁴. In all cases, the flow is from top to bottom. Additionally, for direct comparison, all images are cropped from the same region in the full image of the flooded sandstone devices.

25
0 50 100 150 200 250 300 350 400 4500
20
40
60
80
Per
cent
age
of O
il R
emai
ning
[%
]
Shear Rate, [s-1].
a)
Figure 10: a.) The percent oil remaining as a function of flowrate for ■ water, shear-thickening solution, and Flopaam 3630 for the SMD-73D. The octagons indicate two stage recovery residual oil, starting with a water flood in each case and followed by either a secondary shear-thickening solution or a secondary Flopaam flood. b.) The initial oil filled SMD-73D geometry (i) and comparing the steady-state results after flooding with only the Flopaam 3630 solution (1f) against flooding first with water (2w) and a secondary flood with the Flopaam solution (2f). c.) The initial oil filled large SMD-73D geometry (i) and comparing the steady-state results after flooding with only the shear-thickening nanoparticle solution (1st) against flooding first with water (2w) and a secondary flood with the shear-thickening solution (2st).